Embed Size (px)
Citation preview

Oil Spi l l in Bombay High
Marine Impacts
National Insti tute of OceanographyDona Paula, Goa
July 1993

C O N T E N T S
Page
EXECUTIVE SUMMARY i
INTRODUCTION 1
PART - I
BACKGROUND 4
OIL ON THE SEA 5
PREDICTIONS OF MOVEMENT OF A HYPOTHETICAL 7
SPILL IN THE BOMBAY HIGH
WORK PLAN 8
METHODOLOGY 8
RESULTS 9
PART - II
BACKGROUND 1
OBJECTIVES 1
STUDIES UNDERTAKEN 2
FATE OF PETROLEUM CRUDE IN MARINE ENVIRONMENT 9
EFFECTS OF PETROLEUM CRUDE ON MARINE BIOTA 17
MARINE ENVIRONMENTAL QUALITY AT MURUD 26
CONCLUSIONS 1
RECOMMENDATIONS 3

EXECUTIVE SUMMARY
a) Rupture of feeder pipeline in Bombay High on 17th May,
1993 resulted in spillage of crude oil variably
eatimated between 3000 and 6000 tonnes into the sea. The
Contingency plan for combatting oil pollution was
pressed into action and the vessels belonging to TCG and
ONGC fought the spill by skimming as well by spraying
chemical dispersants.
b) As a follow-up of the decisions taken at various
Governmental levels, ORV Sagar Kanya, with an expert
group of acientiats on hoard cruised the spill area
between 21st and 23rd May 1993. Another expert
scientific group monitored the coastal zone of Murud
between 27th May and 1st June, 1993 where the weathered
spilled oil was expected to be drifting under the
prevailing premonsoon environmental conditions.
c) The oil slick had broken into several patches of varying
sizes and many of them were already in the "chocolate-
mousse" state when ORV Sagar Kanya arrived on the scene.
These oil patches were scattered over a large area and
the general trend of drift was in the south easterly
direction as predicted on the basis of movement of a
hypothetical spi11 in Bombay High. It was expected that
more toxic volatile components of spilled crude would
i
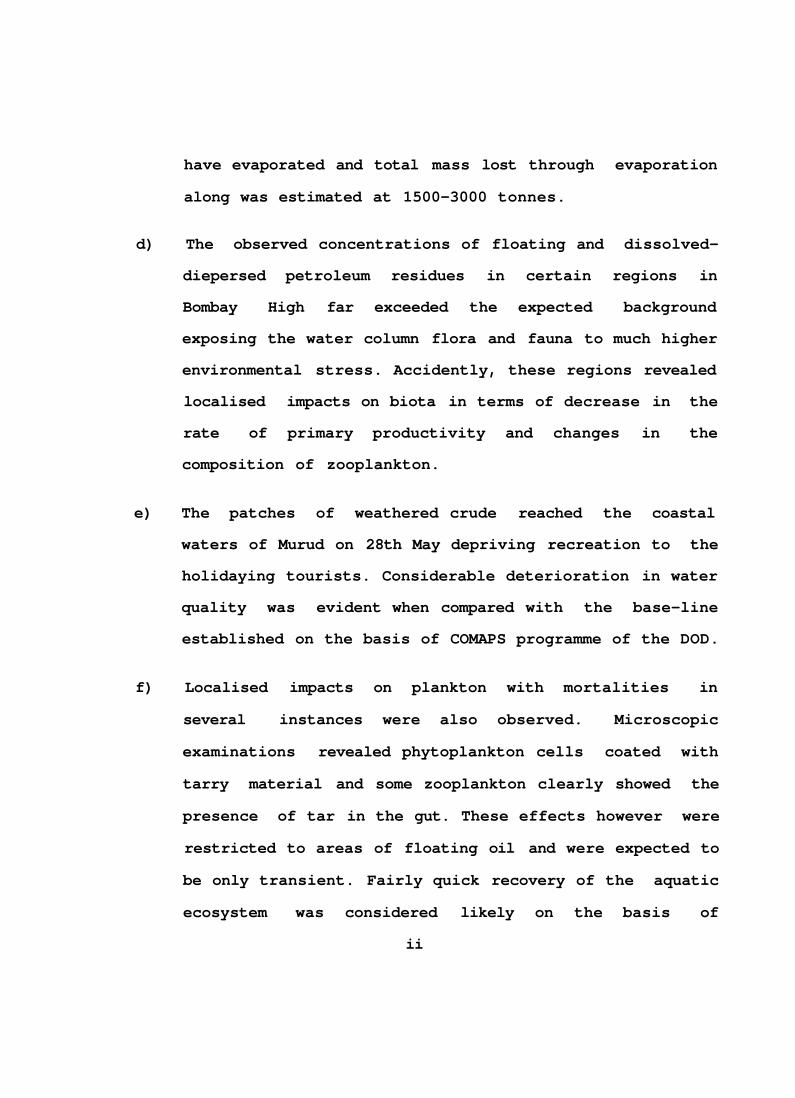
have evaporated and total mass lost through evaporation
along was estimated at 1500-3000 tonnes.
d) The observed concentrations of floating and dissolved-
diepersed petroleum residues in certain regions in
Bombay High far exceeded the expected background
exposing the water column flora and fauna to much higher
environmental stress. Accidently, these regions revealed
localised impacts on biota in terms of decrease in the
rate of primary productivity and changes in the
composition of zooplankton.
e) The patches of weathered crude reached the coastal
waters of Murud on 28th May depriving recreation to the
holidaying tourists. Considerable deterioration in water
quality was evident when compared with the base-line
established on the basis of COMAPS programme of the DOD.
f) Localised impacts on plankton with mortalities in
several instances were also observed. Microscopic
examinations revealed phytoplankton cells coated with
tarry material and some zooplankton clearly showed the
presence of tar in the gut. These effects however were
restricted to areas of floating oil and were expected to
be only transient. Fairly quick recovery of the aquatic
ecosystem was considered likely on the basis of
ii
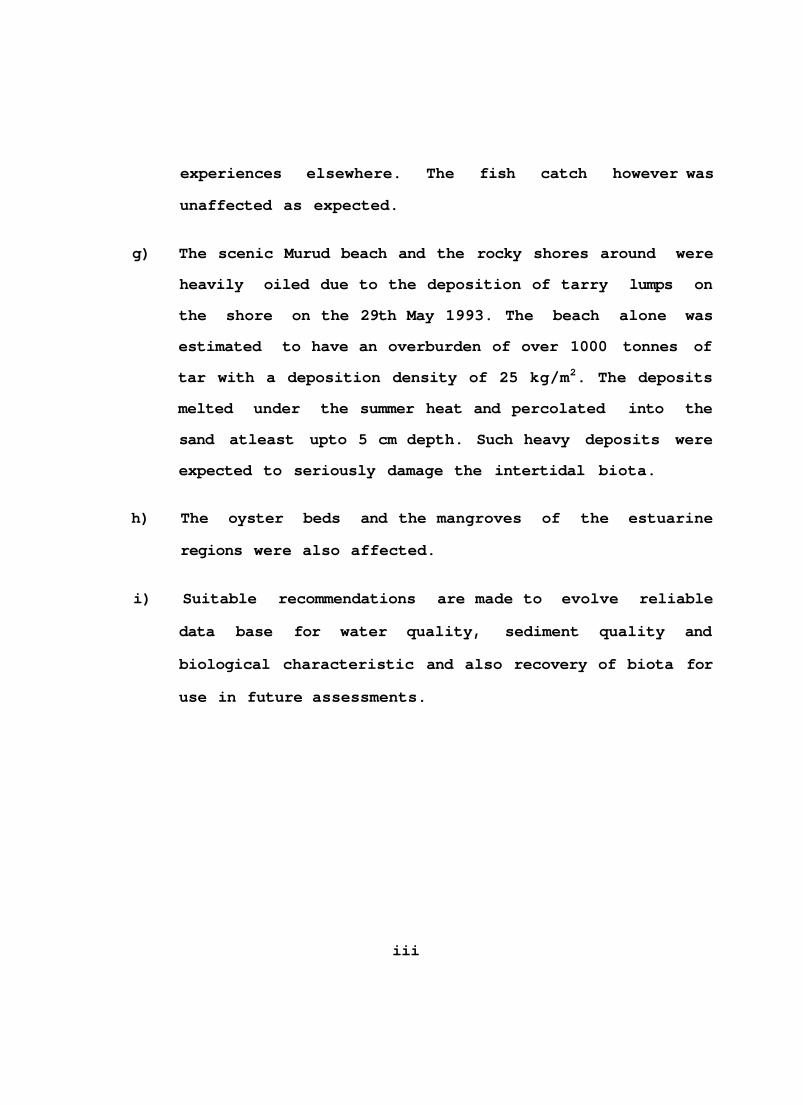
experiences elsewhere. The fish catch however was
unaffected as expected.
g) The scenic Murud beach and the rocky shores around were
heavily oiled due to the deposition of tarry lumps on
the shore on the 29th May 1993. The beach alone was
estimated to have an overburden of over 1000 tonnes of
tar with a deposition density of 25 kg/m2. The deposits
melted under the summer heat and percolated into the
sand atleast upto 5 cm depth. Such heavy deposits were
expected to seriously damage the intertidal biota.
h) The oyster beds and the mangroves of the estuarine
regions were also affected.
i) Suitable recommendations are made to evolve reliable
data base for water quality, sediment quality and
biological characteristic and also recovery of biota for
use in future assessments.
iii

INTRODUCTION
A rupture in a feeder 'riser' pipeline from Bombay High-
North Platform (BHN) resulted in spilling of large quantities
of crude oil into the sea on 17th May 1993 about 80 NM from
the shoreline north of Bombay. Although exact quantity of
crude spilled into the sea was not known, it is variously
estimated between 3000 to 6000 tonnes. Several vessels
belonging to the Indian Coast Guard (ICG) and the Oil &
Natural Gas Commission (ONGC) were pressed into service for
clean-up operations by skimming as well as by spraying
dispersants. Under the prevailing environmental conditions
and with the use of dispersants, the spill was reported to
have broken down into several patches of varying sizes
scattered in the region.
At this juncture, it was necessary to establish the
extent of contamination and to assess in gross terms, the
probable damage to the marine ecology due to oil pollution.
As a follow-up of the decision of the Government, research
vessel Sagar Kanya with a team of scientists proceeded to the
spill area on 20th May 1993.
Subsequently a joint aerial survey by a team drawn from
NIO and ONGC was conducted on 23rd May 1993. The team
observed large number of brownish patches of degraded crude
scattered throughout the Bombay High region. In addition a
1

large patch, dark gray in colour, was sighted drifting in the
southerly direction at 135º, The size of the patch was
roughly estimated at 20 x 1 km. Although it was late May,
premonsoon conditions of strong winds and rough sea had not
developed. At the mean wind speed of 20 km/h then
prevailing, it was considered that the floating oil would
reach the Konkan coast within, 3 to 5 days with the shore of
Murud as the most likely landfall area.
During joint discussion among Director, NIO;
Chairman, Central Pollution Control Board; Member Secretary,
Maharashtra Pollution Control Board (MPCB); Dy. G.M. ONGC and
other officials on 25th May 1993 prior to the visit of the
Minister of state, Department of Environment and Forests and
Wild Life (DOEn) it was considered prudent to send a team of
scientists drawn from NIO and MPCB to Murud immediately. The
team was to camp at Murud for 2 to 3 days to assess the
marine environmental quality in view of the probable
contamination of the coastal zone by oil. Accordingly a team
consisting of scientific personnel (five from NIO and two
from MPCB) visited Murud and sampled the nearshore and
intertidal coastal zone between 27th May and 30th May 1993.
This report which includes findings of the aftermath of
oil spill is divided into two parts. Part I, includes the
findings of the team on ORV Sagar Kanya and Part II deals
with the survey results of the team stationed at Murud.
2

P Λ R T - I
3
1. BACKGROUND
On 17 May, 1993, a major oil slick about 10 miles long
and 2 miles wide was formed about 80 nautical miles (NM)
north off Bombay (latitude 19º32'N and Longitude 71o18'E)
after the Bombay High-Uran pipeline ruptured. The accident
occurred around 0800 hrs, thus spilling roughly 3000-6000
tonnes of oil into the sea. Oil continued to leak out of the
pipeline at the rate of around three barrels per minute.
Steps were immediately taken to depressurise the line by
closing all the wells and stopping operation of the pipeline.
The Coast Guard was alerted about the oil spill at about
0930 hr on the same day and by 1350 hr, it had commenced
spraying of chemical dispersants on the slick. The spread of
oil was limited to some extent with the help of the
rubberised booms and the oil was partly recovered with the
help of the skimmers. Coast Guard vessels Vajra, Vijay, Vivek
and Ahilyabai were involved in the containment operation
along with two ONGC vessels Samudra Suraksha and Nand
Shamik.
Under the action of weather and chemical dispersants
sprayed on the oil-slick, the spill had broken into seven or
eight prominent patches scattered along the periphery of the
20 square nautical miles. The largest of these, was a patch
of around 400 m long and 100 m wide and was located 75 NM
away from the coast on 18 May, 1993.4

ORV Sagar Kanya with four scientists on board proceeded
to Bombay High on 20 May 1993 with the task to estimate the
magnitude of the oil spill and to assess the marine
environmental impact particularly to the living resources.
After successful completion of the survey and covering about
350 line NM, the ship returned to Bombay on 23 May.
2. OIL ON THE SEA
Weathering Process:
Immediately after a spill, the lighter fractions of oil
evaporate. In the warm waters of the equatorial and tropical
oceans, it has been observed that this evaporation will
remove as much as 40% of the spill during the first 24 hr.
Oil will also be oxidised by dissolved oxygen at the rate of
1 mg of oil per 3 mg of oxygen consumption. Microbial
degradation will account for 2g of oil per square meter per
day. Around 1% of the spilled oil will be dissolved or
dispersed in water. In addition, photo-oxidation by solar
radiation will also degrade a part of the oil. Thus, it can
be expected that around 45-50% of any oil spill will be
removed during the first 24 hr in the warm zone of the ocean.
The heavier fractions of the spill will form drifting patches
being split up by the prevailing winds and currents. These
patches will ultimately end up as floating tar particles
5
which finally, will either sink to the bottom or be washed
ashore on beaches.
Chemical Dispersion:
Clearly oil does not remain permanently on the sea
surface. It may disperse into the water column either
completely or partially under the action of natural forces
and/or it may come shore. Dispersants are simply a means of
increasing the natural dispersion rate so that sufficient
dispersion will have occurred to remove the oil from the sea
surface before it reaches the shore.
Dispersants are mixtures which include surface active
agents to reduce the interfacial tension between oil and sea
water. This makes it possible for an oil-slick to break into
very fine droplets (less than 100 microns in diameter) which
are rapidly distributed throughout the water volume because
of the natural water movement. With normal mixing energies,
the oil concentration in the water column rapidly decreases
to background levels. The droplets may rise slowly to the
surface water but special components in the dispersants
(stabilizer) inhibit reagglomeration or coalescence. The
dispersion action is enhanced by mixing energy derived from
wave action, propeller wash, etc.
Several dispersants are likely to be toxic to marine
life and thus direct application may prove harmful to many6
marine organisms. Hence, the dispersants to be used, must be
carefully chosen with particular reference to their toxicity
and should be applied with caution.
3. PREDICTIONS OF MOVEMENT OF A HYPOTHETICAL SPILL
IN THE BOMBAY HIGH
Movements of oil slicks and spills are regulated by
movements of water at the surface. If the speed and
direction of surface currents over a long period of time at a
given place are known, a meaningful forecast of such
movements can be made. Using this concept, National
Institute of Oceanography, Goa, carried out the studies for
the prediction of movement of a hypothetical oil spill in
Bombay High region.
Fig. 1 shows the trajectories of oil spills expected in
different months whereas the time required for the spilled
oil to reach the coastline is given in Table 1. The drift
trajectories in Fig.1 are constructed for environmental
conditions expected at the beginning of each month. It can
be seen from Fig.l that the tracks for the spills occurring
later in the month lie between the tracks for consecutive
months. In general, it is evident that from May to September
i.e. during south-west monsoon, the central west coast of
India remains vulnerably exposed to oil spills in Bombay High
7

whereas during the remaining part of the year, the spilled
oil is expected to move away from the coast.
4. WORK PLAN
On reaching the designated spill area, the contact was
established with the vessel Vajra of ICG. Three parallel
transects, with 4 stations on each were planned (Fig. 2).
The distances between the transects and the stations were
roughly put as 15 NM. Transect I was along the direction of
the drifting oil-slick whereas transects II and III were on
the either side and parallel to the transect I. The total
survey area covered was around 1563 nm2 .
The northern and southern limits were at 19º38' and
18º49'N latitudes and the eastern and western limits were at
72º16' and 71º19'E longitudes. The station 8 (19º24'N -
71º32'E) was about 16 NM from the spill area (19º32'Ν -
71º18'E) whereas the nearest station 12 (19º10'N - 72º16'E)
from the Bombay coast was around 32 NM).
5. METHODOLOGY
At every station, two Neuston nets having a mouth area2
of 450 cm each rigged in a catamaran arrangement, were towed
at the surface for 15 min with the ship steaming at 2 knots.
The near surface strata at levels 0 - 1 5 cm and 20 - 30 cm
8

were sampled to collect floating tar balls and other debris.
Water samples were collected at depths of 0,10, and 25 m
for dissolved-dispersed petroleum hydrocarbon residues (DPH)
using Niskin water samplers. All the water samples were
analysed for their DPH by spectrofluorometry after
preconcentration by hexane extraction. Samples obtained upto
a depth of 40 m were also analysed for chlorophyll,
phaeophytin and primary productivity.
Plankton samples, freed from tar and other debris were
examined for their biomass and preserved for further detailed
examination.
6. RESULTS
The results discussed below pertain to the period 21-23
May 1993 and the first observation was after 4 days of the
spil1·
Oil sightings:
Observations for oil sightings were negative with no
signs of oil patches-either treated or untreated, in the
reported spill location at latitude 19º32'N and longitude
71º18'E (where the incident occurred). As the spillage took
place in the month of May- the beginning of the south-west
monsoon, the spill could have already drifted as a whole or
9

in patches in south-easterly direction towards the Bombay
coast as predicted on the basis of hypothetical spill
movement discussed under section 3. Several small isolated
patches of treated oil (oil + dispersant) were sighted
drifting in the south easterly direction between stations 1
and 3 along the track I. The sizes of oil patches were
estimated to vary between 1 x 0·5 m to 10 x 2m. Only one
patch of untreated oil (about 100 x 2 m) was observed at
station 3. No oil patches either treated or untreated, were
observed along the transects II and III throughout the
survey. Aerial survey carried out on 25 May however showed
severl oil patches of varying sizes drifting towards the
coast of Murud-Zanzira, south of Bombay.
Tar balls:
Tar could be collected at 7 of the 12 stations. In
general, tar concentrations ranged between 0 - 95.82 mg/m2 ,
with a mean value of 8.52 mg/m2 (Table 2). Maximum
concentrations of tar were observed along the transect I at
stations 1,2 and 8 (1.38 - 95.82 mg/m2 ). This was the
transect, where maximum oil patches were also observed
drifting in the south-easterly direction. The observed
concentrations were markedly on the higher side of the range
(0-6 mg/m2 ) observed for the Arabian Sea (Table 3). With
the then prevailing sea state, high temperature and wind
speed, it was expected that the water-in-oil mousse would10
have formed after environmental exposure of oil for more than
24 hr. Such emulsions would soon be adsorbed on to the
surfaces of suspended particles eventually to form tar
balls. Such tar balls either sink to the seabed or get
suspended due to the buoyancy of its size in an intermediate
water mass and drift along the current directions. Depending
on the coastal circulation these tar balls would ultimately,
be washed ashore on the nearby coast. The spill occurred in
a period (May - September) of south-west monsoon when the
alongshore surface currents would develop a strong easterly
shoreward component, there was every possibility that these
tar balls would be deposited on the shores of the central
west coast of India between Bombay and Goa.
Dissolved-dispersed petroleum hydrocarbons (DPH):
DPH concentrations ranged between 0.19 and 3.65 mg/1,
with a mean value of 0.89 mg/1 (Table 2). The highest
concentration (3.65 mg/1) was obtained at the surface
(station 1) whereas the lowest concentration of 0.19 mg/1 was
noted 25m depth (station 12). The high concentrations were
obtained at the stations along track I (0.53 - 3.65 mg/1) as
compared to those obtained along tracks II (0.37 - 3.23 mg/1)
and III (0.19 - 0.70 mg/1). The higher concentrations along
the track I showed the similarity with that of oil patches
and tar balls which were also maximum along the same track.
In general, the DPH concentration showed a decreasing11

gradient with depth. The observed levels which varied
between 0.19 and 3.65 mg/1 were higher by about 3 orders of
magnitude or around 1000 times, as compared to the background
levels in Bombay High region (1 - 30.8 Μg/1) and in the
Arabian Sea ( 3 - 2 2 Μg/1) as compiled in Table 3.
Chlorophyll a, Phaeophytin and Primary productivity :
Table 4 shows that in the region of oil patch, the mean
value of extinction coefficient (i.e. light penetration
index) was 0.14. Chlorophyll a (Chl a) and phaeophytin
(phaeo) values in the surface waters ranged from 0 24 to 1.78
mg/m3 and from 1.37 to 8.32 mg/m
3, respectively. The mean
primary productivity (pp) in the surface waters was 9.3 mgC/
m3 /day. In the vertical, mean values of chl a, phaeo and pp
were 14.2 mg/m2, 77.9 mg/m
2 and 0.19 gC/m
2 / day,
respectively. Mean zooplankton biomass was 49.3 ml/100 m3.
As seen from Table 5, the total zooplankton counts ranged
from 2438 to 8038 nos/l00 m3.
The high mean extinction coefficient of 0.36 was
perhaps due to the water turbidity as a result of agitated
bottom sediments. Chl a, phaeo and pp in surface waters
ranged from 0.27 to 3.18 mg/m3, 1.39 to 12.4 mg/m
3 and 0.74
to 4.36 mgC/m3 /day, respectively in this region. In the
water column, the mean values of chl a, phaeo and pp were
30.9 mg/m2, 15.26 mg/m
2 and 0.25 gC/m
2 /day. The mean
12

zooplankton biomass was 23.2 ml/100 m3. The total
zooplankton counts as shown in Table 5 ranged from 1123 to
2000 nos/100 m3. Visual observations indicated that some
portion of oil slick was associated with Trichodesmium
bloom. Organisms such as medusae were found floating and
entangled in the oil slick and small crabs crawled on the oil
mass.
As compared to chl a the concentration of phaeo were
high in the area surveyed. Also the rate of photosynthetic
production was low in the oil patch region as compared to the
region free of oil patches. This indicated an adverse effect
of oil on basic photosynthetic processes. Copepods which
generally dominate the zooplankton organisms, showed very low
counts (stations 4 and 5) of less than 32% and 18%
respectively (Table 5). Also hydromadusae group dominated at
station 5. These results indicate poor quality of water
perhaps due to the adverse effects of environmental
contamination on the basic biological processes and life in
the area affected by oil spill.
13
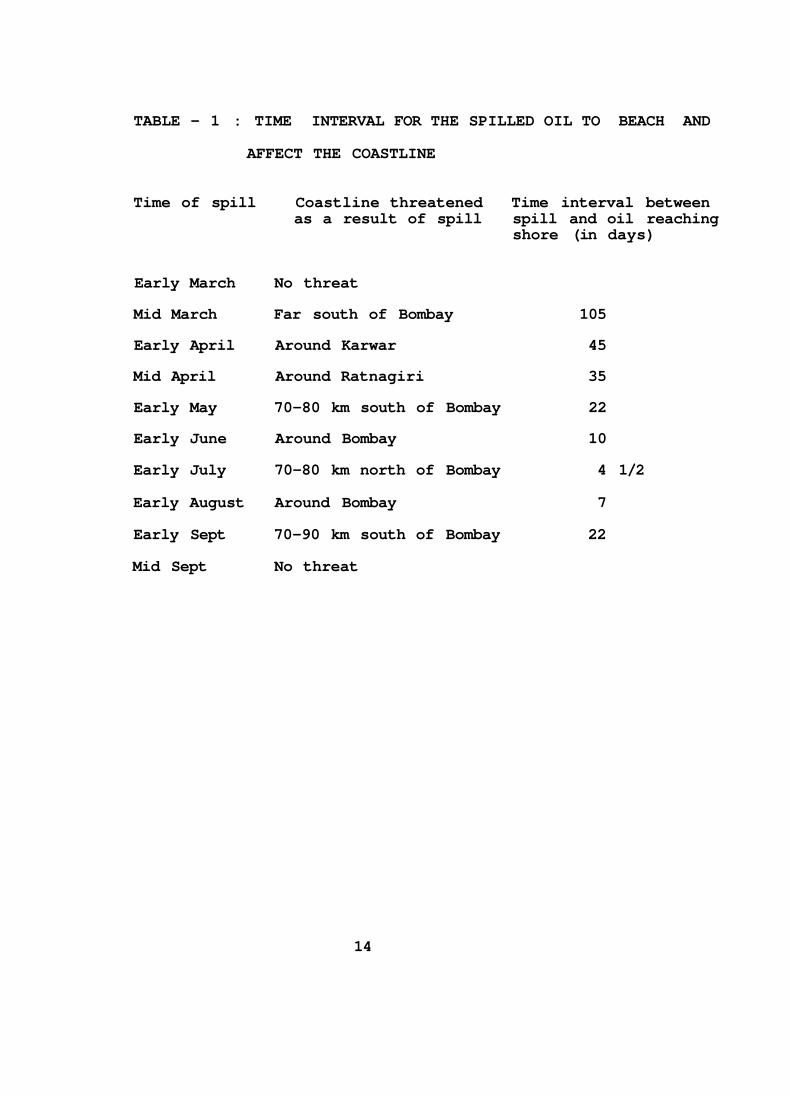
TABLE - 1 : TIME INTERVAL FOR THE SPILLED OIL TO BEACH AND
AFFECT THE COASTLINE
Time of spill Coastline threatened Time interval betweenas a result of spill spill and oil reaching
shore (in days)
Early March No threat
Mid March Far south of Bombay 105
Early April Around Karwar 45
Mid April Around Ratnagiri 35
Early May 70-80 km south of Bombay 22
Early June Around Bombay 10
Early July 70-80 km north of Bombay 4 1/2
Early August Around Bombay 7
Early Sept 70-90 km south of Bombay 22
Mid Sept No threat
14

15
DPH - Dissolved-dispersed petroleum hydrocarbonsA - AbsencePI - Presence indicated.
TABLE 2 : Data on oil-sightings, tar balls and DPH in oil-spill area
1
2
3
4
5
6
7
θ
9
10
11
12
21.05.93
-do-
-do-
-do-
22.05.93
-do-
-do-
-do-
-do-
-do-
23.05.93
-do-
19°16.3'
19°06.4'
19°01.3'
18°49.4'
18°57.3'
19°04.9'
19°13.4'
19°24.5'
19°38.3'
19°27.4'
19°17.8'
19°10.3'
71°47.9'
71°55.2'
72°09.5'
72°01.1'
71°46.0'
71°34.3'
71°19.6'
71°32.2'
71°45.3'
71°56.9'
72°09.1'
72°16.8'
Station Date
Nos.
Lat °N Long °E Oil sightings Tar balls DPH mg/1
mg/m2
0m 10m 25m
Treated oil patch
-do-
Untreated oil pat
A
A
A
A
A
A
A
A
A
95.82
4.36
ch A
0.21
A
A
A
1.38
A
0.48
0.05
PI
3.65
1.35
1.62
3.23
0.56
0.63
0.50
3.03
0.49
0.38
0.54
0.70
2.86
1.07
0.91
0.61
0.44
0.63
0.60
0.61
0.52
0.43
0.37
0.51
0.74
0.81
0.82
0.58
0.37
0.64
0.52
0.53
0.34
0.39
0.22
0.19

16
TABLE 3 - Comparison of the data on floating tar balls andDPH concentrations.
Variables
Spill areaBombayHigh region
Normal values
Bombay High Arabianregion Sea
Remarks
Floating tar balls
DPH
(0 - 25m)
0 - 95.82
mg/m2
0.19 -3.65
mg/1
1 - 30.8
Μg/l
0 - 6 mg/m2
3 - 2 2
Μg/l
Increase
Increase

TABLE 4: Data on chlorophyll a, phaeophytin and primaryproductivity in the oil spill area.
Variables Oil patch region Oil free region
Min Max Mean SD Min Max Mean SD
Extinction coeff. 0.12 0.15 0.14 0.01 0.09 0.95 0.36 0.33
Surface waters
Chlorophyll a,
mg/m3 0.24 1.78 0.64 0.07 0.27 3.18 1.21 1.10
Phaeophytin
mg/m3 1.37 8.32 3.2 3 1.39 12.4 5.44 4.20
Primary productivity
mg C/m3/day - - 9.3 - 0.79 4.36 2.58
Zooplankton biomass
ml/100 m 13.1 100 19.4 32 4 .8 65.5 23.2 20.4
Vertical water column
Chlorophyll a
mg/m2 3.9 37.4 14.2 13.6 10.4 85.0 30.9 24
Phaeophytin
mg/m2 2.1 190 77.9 66 53.7 407 152.6 112
Primary productivity
gC/m2/day - - 0.19 - 0.2 0.29 0.25
17

TABLE 5 - Zooplankton texa in the spill area
S t a t i o n s
Groups (Nos/100m3) 1 2 3 4 5 6 7 8 9 10 11 12
18
HYDROMEDOSAE 2 6 . 0 1 0 0 . 0 4 6 . 4 3 8 . 0 8609.5 - 57 38 38 1276 57
SIPHONOPHORA 1 5 2 . 1 416 .6 6 1 . 9 704.7 419 .0 266.6 57 1809 57 666 95 19
SALPS AND DOLIOLIDS 323 .8 2 3 2 . 1 6 6 . 6 95 .2 - 38 .0 - - - - - -
CLADOCERA - 2 3 . 8 - - - - - - 7 6
LUCCIFER S P . - - 94.0 228.5 - _ _ _ _ _ _ _
OSTRACODS - 19.0 - 914.2
AMPHIPODA - 60.7 - 1180.9 38.0 - - 95
COPEPODA 1333.3 4095 .2 2563 .0 2571.4 2095 .2 2000.0 800 .0 6095 12190 34666 18666 13142
ISOPODA - 2 3 . 8 - - - - - - - _ - -
DECAPODA - 8 3 . 3 2 8 . 5 1 7 5 2 . 3 1 1 4 . 2 5 7 . 1 133 38 38 1 9 2 3 57 38
CHAETOGNATHA 9 5 . 2 6 5 . 4 3 9 . 2 4 1 9 . 0 3 8 . 0 3 8 . 0 - 9 95 3 4 2 8 395 114
APPENDICULARTA 1 5 2 . 3 1 1 . 9 - - 7 6 . 1 - 57 57
PTEROPODA - - - - 3 8 . 0 - 3 8 5 7 - -
GASTROPODA - 1 5 . 4 5 3 . 5 - 38.0 95.2 - - - - 190
LAMELLEBRANCH LARVA - - - 7 6 . 1 5 7 . 1
ECHINODERM LARVA - - 228.5 114.2 -
FISH EGGS 304 .7 32.1 178 .5 - 57 .1 266.6 - 95
FISH LARVA - 9 .5 8 . 3 57.1 19.0 57 .1 - - - - 38 19
OTHERS 3 8 . 0 1 3 . 0 23.8 - - 1 9 . 0 38 38 - - - 19
TOTAL 2438.0 5202.3 3164.2 8038.0 11752.3 3028 1123 8247 12476 42059 20000 13428

TRAJECTORIES OF OIL SPILLS OCCURRING IN DIFFERENTMONTHS OF THE YEAR (1-12 REPRESENT THE CALENDER
MONTHS, JANUARY TO DECEMBER )
FlG. 1
19


PART Il

BACKGROUND
Λ joint serial survey by a team drown from NIO and ONGC was
conducted on 23rd May 1993. The team observed large number
of brownish patches of degraded crude scattered throughout
the Bombay High region. In addition, a large patch, dark
gray in colour was sighted drifting in the southerly
direction at 135º, The size of the patch was roughly
estimated at 2 0 x 1 km. Although it was late May, premonsoon
conditions of strong winds and rough sea had not developed,
At the moon wind speed of 20 km/h then prevailing, it was
considered that the flooting oil would. reach the Konkan
coast within 3 to 5 days with the shores of Murud as the
most likely landfall area.
The findings of NIO team are discussed in this report along
with the relevant literature information on the behaviour of
crude oil in the marine environment and its ecological
significance
2 OBJECTIVES
To identify immediate changes if any in marine environmental
quality of Murud in the event of pollution by petroleum
hydrocarbon residues (PHC),
1
3 STUDIES UNDERTAKEN,
3.1 Approach strategy
An objective marine enviromental impact assessment
following pollutant contamination requires reliable baseline
against which the measured environmental quality can be
compared. Fortunately, the coastal waters of Murud are
being periodically monitored under the Coastal Ocean
Monitoring and Prediction System (COMAPS) programme of the
Department of Ocean Development (DOD) since 1989, Under
COMAPS, the nearshore area upto a distance of 25 km from the
shoreline is monitored for water quality, sediment quality
and biological characteristics at four stations at distances
of 0, 3 to 5, 10 to 15 and 20 to 25 km from the shoreline.
The adjacent Rajapuri crook is also monitored over a tidal
cycle to evaluate tide induced changes. Hence, a fairly
good baseline is available for the region for April-May as
given in Tables 3.1 to 3.5. This baseline is used for
comparisons in the present report. Unfortunately, as beach
charactoristics, beach quality and intertidal biota are not
studies under COMAPS, the baseline for the intertidal
region is not available.
The field party reached Murud on 27th May 1993 and undertook
sampling from 27th to 30th May 1993. The water and sediment
2

environment was monitored at more or less same locations
operated under COMAPS, However, due to prevailing rough
weather conditions, extensive sampling was not possible. The
locations of campling are given in Figure 3.1.
The Murud beach was also sampled particularly for PHC. The
procedure recommended by United Nations Environment
Programme (UNEP) was modified to suit local requirements.
3.2 Sampling and methods of analyses
Sampling procedure
All-plastic Niskin sampler with a closing mechanism at a
desired depth was used for collecting sub-surface water
samples. Sampling at the surface was done using aclean
polyethylene bucket.
Oblique hauls for zooplankton were made using a Heron
Tranter Net (Mesh sizes 0.33 mm, mouth area 0.25 m2) with an
attached calibrated TSK flow meter. All collections were of
6 min. duration. Samples were preserved in formalin.
Sediment samples were collected using a Van-Veen grab of
0.04 m2 area.
3
Representative beach areas (1 x 1 m ) around the high water
mark were compled for PHC by hand picking. The PHC collected
was transferred to alluminium foil for further
investigations in the laboratory at Bombay.
The water camples wore analysed in the shore laboratory
temporarily established at Murud, Colorimetric measurements
were made on a Spectronic (Bausch and Lomb)
spectrophotometer.
Methods of analysis
(a) Salinity and chloride content
Λ suitable volume of the sample was titrated against silver
nitrate (20 g/) with potassium chromate as an indicater. The
salinity was calculated using Standard Tables.
(b) Suspended solids
Known quantity of water was filtered through a preweighed
0.45 Ou Millipore membrane filter paper, dried and weighed
again.
(c) pH
pH was measured on a ECIL pH meter. The instrument was
calibrated with standard buffers just before use.
4
(d) DO and BOD
DO was determined by Winklor method. For the determination
of BOD, direct unseeded method was employed. The sample was
filled in to BOD bottle in the field and was
incubated in the laboratory for 5 days after which DO was
again determined.
( e ) Nitrite
Nitrite in the sample was allowed to react with
sulphanilamide in acid solution. The resulting diazo
compound was reacted with N-(1-Napthyl)-ethylenodiamino-
dihydrochloride to form a highly coloured ozo-dye. The light
absorption was measured at 543 nm.
(f) Nitrate
Nitrate was determined as nitrite as above after its
reduction by passing the sample through a column packed with
amalgamated cadmium.
(g) Ammonium
Ammonium compounds (NH3
+, NH
4
+) in water give a blue colour
of indophenol when reacted with phenol in presence of
hypochlοrite. The absorbance was measured at 630 nm.
5
(h) Phosphate
Acidified molybdate to reagent was added to the sample to yield
a phosphomo1ybdate complex which was then reduced with
ascorbic acid to a highly coloured b1ue compound which was
measured at 882 nm.
(i) PHC
Water sample (2.5 1) was extracted with hexone and the
organic layer was separated, dried over anhydrous sodium
sulphate and reduced to 10 ml at 30º C under low pressure.
The fluorescence of the extract was measured at 360 nm
(excitation at 310 nm) with crude oil residue as a standard.
(j) Phytoplankton pigments
A Κnown volume of water was filtered through 0.45 Ou
Sartorious membrane filter paper and the pigments retained
on the paper were extracted in 90% acetone, The extinction
of the acetone extract was measured at 665 and 750 nm before
and after treatment with dilute acid for the estimation of
chlorophyll a and phaeahytin.
8
(k) Zooplankton
Volume (biomass) was obtained by disp1acement method, A
portion of the sample (25-50%) was analiysed under a
microscope for faunal composition and population count.
(l) Benthos
The sediment was sieved through a 0.5 nm mesh sieve and
animals retained were preserved in 5% buffered formalin.
Total population was estimated as number of animals in 1 m2
area and biomss on wet weight basis.
(m) Fishery
The boat used for sampling did not have adequate facilities
for trawling. Hence, trawl data was obtained from other
local fishing vassals operating in the region during the
period of survey.
(n) Sediment grain size
The sample was split into sand and silt-clay fractions on a
62 Ou sieve. The silt and clay content in silt-clay fraction
was estimated by standard procedure of pipette analysis.
7
(ο) Sediment organic matter
The percentage of organic carbon in sediment was determined
by oxidising the organic matter in the sample by the chromic
acid and estimating the excess chromic acid by titration
against forrous ammonium sulphate. Per cent organic carbon
was multiplied by 1.73 to obtain per cent organic matter.
(p) PHC in sediments
The sediments after refluxing with KOH-methenol mixture was
extracted with hexane. After removal of excess hexane, the
residue was subjected to clean-up procedure by silica gel
column chromatography. The hydrocarbon content was then
estimated by measuring the fluorescence as describe under
(i).
(q) Trace metals in sediments
The sediment was brought into solution by treatment with
concentrated HF-HC104 -HNO
3 and the metals were estimated by
flame AAS on a Spectra 3OA (Varian) atomic absorption
spectroρhotοmeter.
(r) PHC on Murud beach
The hand picked material was carefully separated from sand
and other debris and the PHC estimated gravimetrica11y.
8

4 FATE OF PETROLEUM CRUDE IN MARINE ENVIRONMENT
The major spills of crude oil and its products in the sea
occur during their transport by oil tankers, loading and
unloading operations, blowouts, etc. When introduced in the
marine environment the oil goes through a variety of
transformation involving physical, chemical and biological
processes. Physical and chemical processes begin to operate
soon after petroleum is spilled on the sea. These include
evaporation, spreading, emu1sification, dissolution, sea-air
exchange and sedimentation. Chemical oxidation of some of
the components of petroleum is also induced in the presence
of sunlight. The degraded products of these processes
include floating tar lumps, dissolved and particulate
hydrocarbon materials in the water column and materials
deposited on the bed.
Biological processes though slow also act simultaneously
with physical and chemical processes. The important
biological processes include degradation by microorganisms
to carbon dioxide or organic material in intermediate
oxidation stages, uptake by large organisms and subsequent
metabolism, storage and discharge.
9
Crude oil and its products are highly complex mixtures.
Since the fate of petroleum in the marine environment
depends on the composition, a preliminary knowledge of major
components and types is necessary for understanding the fate
of petroleum when spilled on water.
Crude oils of different geologic and geographic sources vary
widely in composition. Thousands of individual compounds,
mostly hydrocarbons in varying proportion, are present in
crude oil which determine the physical as well as chemical
properties of petroleum. The approximate composition of an
average crude oil is considered as :
Normal Type
Gasoline (C5 - C10 ) 30%; kerosene (C10 -C12 ), 10%; light
distillate oil (C12 - C 2 0 ) , 15%; heavy distillate oil (C20
C 4 0), 25% residium oil ( >C40), 20%,
By molecular type
Paraffins (alkanes), 30%; naphthenes (cycloalkanes), 50%
aromatics, 15% nitrogen, sulphur and oxygen containing
compounds (NSO) 5%.
10

4.1 Spreading
Spreading of crude oil on water is probably the most
important process following a spill. Apart from chemical
nature of oil, the extent of spreading is affected by wind,
waves and currents. Under the influence of hydrostatic and
surface forces, the oil spreads quickly attaining average
thickness of less than 0.03 mm within 24 h. Once a spill has
thinned to the point that surface forces begin to play an
important role, the oil layer is no longer continuous and
uniform but becomes fragmented by wind and waves into
islands and windraws where thicker layers of oil are in
equilibrium with thinner films rich in surface active
compounds.
In addition, surface currents driven by wind, waves and
convectional cells determine the shape and direction of
movement of the spill; the wind being the most influential
external factor.
The occurence of NSO compounds in petroleum crude play an
important role in the fate of oil released in the marine
environment. The high surface activity of many of these
compounds facilitates spreading and emu1sifiability of
petro1eum.
11

4.2 Evaporation
Evaporation and dissolution are the major processes
degrading petroleum crude when spilled on water. The
composition of oil, its surface area and physical
properties, wind velocity, air and sea temperatures,
turbulence and intensity of solar radiation, all affect
evaporation rotes of hydrocarbons. Hydrocarbons containing
less than about C15 (boiling point < 250 C) are volatilized
from the ocean's surface within 10 days. It is those
components that represent the most toxic constituents of the
oil. Hydrocarbons in the C15 -C25 range (boiling point 230
- 400 C) show limited volatility and will be retained for
the most part of the life of the oil slick, Above C25
(boiling point > 400 C) there is very little loss. Thus
evaporation alone will remove about 50% of hydrocarbons in
an "average" crude oil on the ocean's surface.
Loss of volatile hydrocarbons increases the density and the
kinematic viscosity of oil. As more volatile hydrocarbons
are lost, the viscosity of the resulting oil increases and
this results in breakup of slick into smaller patches.
Agitation of these patches enhances incorporation of water
due to increased surface area.
12

4.3 Photooxidation
The natural sunlight in the presence of oxygen can transform
several petroleum hydrocarbons into hydroxy compounds such
as aldehydes and ketones and ultimately to low molecular
weight carboxylic acids, As the products are hydrophilic,
they change the solubility behaviour of the spill,
Photooxidation which is inversely proportional to the film
thickness, is a slow process and may take days to weeks to
obtain significant results. Such reactions preferentially
occur in branched alkanes and aromatics,
4.5 Dispersion
Dispersion is οil-in-water emulsion resulting from the
incorporation of small globules of oil into water column.
Oil begins dispersing immediately on contact with water and
is most significant during the first ten hours or so.
Although, such oil in water emulsions are not stable in the
natural aquatic environment, they are considerably
stabilised by suspended particles, natural or added
emulsifies or dispersants.
13
Unstabilized oil particles tend to resurface and again, form
into a slick. The turbulence generally plays a major role in
controlling the dispersion of particle formation and
suspension. Water-in-oil emulsions formed particularly from
heavy asphaltic crudes or residual oils tend to be more
coherent semisolid lumps referred to as "Chocolate Mousse".
Experimental and limited field studies have shown that these
persistent emulsions contain approximately SO percent water
and that bacteria, or solid particulate matter do not seem to
be required for their formation.
The fate of οil-in-water emulsions appear to be dissolution
in the water column or association with solid particulate
matter or detritus and eventual biodegradation asincorporation in bottom sediments.
4.6 Dissolution
Dissolution is another physical process in which the low
molecular weight hydrocarbons as well as polar
nonhydrocarbon compounds are partially lost from the oil to
the water column. Rates of dissolution for the various
constituents of oil depend on several factors such as the
properties of oil (molecular structure of compounds and
their relative abundances) and the physico-chemical
14
characteristics of the environment (salinity, tomperature,
turbulance). The water solubility of hydrocarbons drop
drastically as one goes to higher carbon numbers. For
example, of the normal paraffins, n-C5 has distilled water
solubility of about 40 ppm; n-C6 about 10 ppm; n-C7 about 3
ppm; n-C8 about 1 ppm. For aromatic hydrocarbons, C6
(benzene) has a distilled water solubility of about 1780
ppm; C7 toluence about 515 ppm; C8 (xylenes) about 175 ppm;
C9 (alkylbenzenes) about 50 ppm; C14 (anthracene) about
0.075 ppm and C18 (chrysene) about 0.002 ppm. Hydrocarbon
solubility is probably 12-30% less in seawater as compared
to distilled water.
Branched alkanes demonstrate greater solubilities for a
given carbon number than their straight chain counterparts.
Ring formation also enhances solubility for a given carbon
number or molar volume. The degree of saturation is
inversely proportional to solubility for both chain and ring
structures. The addition of a second or third double bond
increases solubility proportionately and the presence of a
triple bond. increases solubility to a greater proportion
than presence of two double bonds. Therefore, the most water
soluble hydrocarbons will be those with the lowest molar
volume and greatest aromatic/orofinic of character. Dissolved
15
organic matter present in natural waters also enhances
solubility due to its surface active nature,
4.7 Degradation
Biodegradative processes influencing fate of petroleum in
aquatic environment include microbial degradation, ingestion
by zooplankton, uptake by aquatic invertebrates and
vertebrates as well as bioturbation.
Microorganisms capable of oxidising petroleum hydrocarbons
and related compounds are widespread in nature. The rate of
microbial degradation vary with the chemical complexity of
the crude, the microbial populations and many of the
environmental conditions. Because of the complexity, it is
impossible to predict the rate of microbial oil removal.
Environmental stress such as temperature and salinity
changes, turbulence and sunlight not only directly affect
the growth and metabolism of the microorganisms but also
alter the physical and chemical states of the hydrocarbons.
The degration by naturally occuring bacteria in the aquatic
environment is generally slow and their impact on the oil
spill may be noticeable after some duration.
16

5 EFFECTS OF PETROLEUM CRUDE ON MARINE BIOTA
The biological effects of oil include the possibility of
(a) hazards to man through eating contaminated seafoods
(b) decrease of fisheries resources or damage to wild life such
as sea birds and marine mammals,
(c) decrease of aesthetic values due to unsighty slicks or oiled
beaches,
(d) modification of marine ecosystems by elimination of species
with an initial decrease in diversity and productivity and
(e) modification of habitats, delaying or preventing
recolonization.
When an oil spill occurs, many factors determine whether the
spill will cause heavy, long lasting biological damage,
comparatively little or no damage or some intermediate
degree of damage. Thus for instance, if a spill occurs in a
small confined area so that the oil is unable to escape,
damage will be greater for a given volume and type of oil
spilled than if the same volume was released in a relatively
open area.
17
In the open sea the possible impact on biota can be on
phytoplankton, zooplankton, benthos, fishery, birds,
mammals, etc. whereas in coastal waters the impacts will
also be on intertidal fauna, aquaculture, seaweeds and
mangroves as listed Tables (4.1 and 4.2).
5.1 Phytop1ankton
Biological effects from oil spills vary so widely that it is
difficult to generalize on any specific topic such as
phytoplankton. The sensitivity varies among major groups and
sometimes within species, Green algae are more sensitive to
hydrocarbons than diatoms, blue green algae and flagellates.
Hence bloom of flagellates may appear as a result of relaxed
grazing pressure and slow sinking of diatoms allowing them
to dominate. Phytop1ankton appear to absorb hydrocarbons but
there is no transfer inside the cell.
5.2 Zooplankton
Zooplankton and especially the neuston (fish eggs, fish
larvae, Lucifer sp) in the surface layer of the sea can be
at risk because of exposure to higher concentrations of
water soluble constitutents leaching from floating oil. In
general, the eggs and planktonic larval stages of pelagic as
well as benthic organisms are sensitive to low oil
18

concontrations (10-100 Μg/1). However, significant
detrimental impact on plankton has never been demonstrated
in the open sea. It is suggested that the dose and duration
of oil exposure during spills will never reach the threshold
in the open sea. Oil spill in enclosed or semienclosed
areas can however lead to decrease in plankton populations
but overall effects are expected to be minor. Moreover,
these organisms can reproduce rapidly and any population
reductions can be soon restored. Larval forms of fish,
crustaceans and molluscs may be on the contrary, severely
affected and recovery may be delayed for long periods.
Zooplankton can accumulate oil and can concentrate both
aliphatic and aromatic hydrocarbons which may subsequently
be depurated to a large extent. But the metabolites are
highly resistant to depuration. Their retention may pose
long term consequences by their transfer through food chain.
The sublethal effects of petroleum encountered in
zooplankton vary widely and include alterations in feeding,
growth, reproduction and fecundity, reduction in larval life
span, reduction in mean brood size and number of young ones
produced, inhibition of molting in larval crustaceans,
inhibition of yolk utilization, the occurence of abnormal
19

intermediate larval stages, morphogenic abnormalities and
alterations in swimming activity and food perception.
5.3 Benthos
The most severe impact of oil spills in shallow waters is
seen on benthos as part of the oil sinks to the bottom and
since many benthic animals are essentially immobile or slow
moving cannot get away from pollution. Although the water
column gets relatively free of oil shortly after oil spill
freeing pelagic organisms from contamination, the benthos
has to often face an oily environment for years. Oil in
solution or as dispersed droplets can damage benthos with
effects ranging from detrimental behaviour to mortality. Oil
carried to the sea bed can affect the eggs of the bottom-
spawning fish. Temporary tainting of several benthic
organisms like shellfish can also result. Massive
destruction of benthic populations have been reported due to
accidental oil spill and recovery was not complete even
after a decade.
The meiofauna is considered to be more sensitive to oil
pollution than macrofauna. Significant reduction in the
populations of certain meiofaunal groups like harpacticoid
copepods, turbe1larians, and ostracods is observed when
20
exposed to oil. In heavily contaminated areas meifauna may
be totally absent while nematodes may dominate in moderately
polluted regions. Oil concentration of 110 Μg/1 (dry
sediment) even for longer time (5 months) however may not
affect species diversity of macrobenthos but may result in
decrease in faunal density. Macrofaunal polychaetes are
relatively less sensitive than amphipods, to oil pollution.
Sediment containing 5000-7000 ppm oil do not inhibit
recruitment of selective bivalves and polychaetes.
Various sub lethal effects of oil on benthos such as changes
in population structure, alterations in physiological,
cellular and biochemical responses, changes in reproductive
cycles and changes in respiratory activity and bahavioural
responses can occur at an oil concentration in water between
50 to 1000 Μg/1.
Benthic animals like polychaetes, sipunculids, crustaceans
including crabs, shrimps and lobsters and molluscs such as
gastropods, mussels, cockles and oysters rapidly accummulate
petroleum hydrocarbons from contaminated sediment, water and
food. The selected compounds are however rapidly depurated.
21

5.4 Fish
Fish often shows avoidance reaction even at low
concentration of oil in water. Moreover, the fish possesses
an enzyme system which can deal with petroleum hydrocarbons
in its tissues. Hence, fish kills due to oil pollution are
rare and when occur, the numbers involved are not usually
significant. No conspicuous decline in the fisheries of
accidental oil spill areas are observed though some changes
in the composition of catch and often fish populations, are
reported. Large spills in enclosed areas can make the
habitat unsuitable for fishing and render the fish
commercially unacceptable because of taint which occurs when
certain components of oil are present in the flesh even at
low concentrations. The levels as low as 1 mg/1 of dissolved
petroleum can result in tainting. But the contamination is
temporary and the levels reduce considerably when the
ambient hydrocarbon concentrations return to normal.
Although the body burden of petroleum hydrocarbons is
considerably reduced through metabolism and excretion, the
metabolites such as polyaromatic carcinogenic and mutagenic
compounds may be retained for longer period which may be of
concern to human health.
22

The greatest threats of oil pollution are to benthic fish,
spawning and breeding grounds of fish, their eggs and larvae
and shellfish grounds. The larval stages of finfish and
shellfish are much more sensitive to oil pollution.
Concentrations of 1 mg/1 of petroleum in water can cause
lethal effects on fish eggs and larvae. Such concentrations
are unlikely to occur or persist in the marine environment
except immediately after the spill.
Sublethal exposure of oil to fish can result in structural
changes from gross anomalies to subtle subcellular defects
which are of considerable importance concerning population
and community stability. The sublethal effects which can
widely vary are, biochemical alterations, cellular and
subcellular changes, morpho1ogica1 alterations in eye, skin
and kidney, physiological alterations, developmental
abnormalities of eggs and early life history stages and
behavioural alterations.
5.5 Birds
Aquatic birds are particularly vulnerable to oil spills
because the oil soaks their plumage and destroys its water-
proofing, buoyancy and insulating properties, so that the
birds are chilled and may die of exposure or by sinking or
23

drowning. Often they attempt to clean themselves of oil,
thereby ingesting it, causing internal damage. Large spills
usually cause bird mortalities but the extent depends on the
location of the spill, the season of the year and the
species involved. Since, birds are relatively long living
and have low reproductive rates, losses are not easily
recouped and the recovery is a slow process. It is generally
believed that often the oil spill causes more damage to sea
birds populations than to any other form of marine life
(Table 4.2).
Indirect effects of oil pollution on reproduction appear to
be much less important than the direct mortality of adult
birds.
5.6 Intertidal habitats
Intertidal organisms are much hardier than the subtidal
forms living in a more constant environment.
Oil trapped in tide pools on falling tides can saturate
small volumes of water with dissolved organics for periods
ranging to several hours. Oil deposits on the attached
epifauna and flora may cause damage when the stranded oil
contacts tissues directly.
24
Oil stranded on beaches on falling tides tends to percolate
into the sediments, which provides an opportunity for
intimate contact with the fauna. Sedimentary transport
processes can move the oily particles away from the region
of initial contact, then extending them along the shore as
well as to sutatidal waters. Stranded oil is not readily
removed from low-energy sedimentary beaches, and if still
liquid, drains down into substratum. Oil can be transported
into estuaries and inlets where it becomes incorporated in
sediments. In addition to the immediate damage to the fauna,
the persistence of toxicity prevents the start of recovery
processes.
Salt marshes and mangroves swamps are like intertidal mud
banks, low energy areas, trapping oil. The plants which form
the basis for these ecosystems suffer accordingly. The
effect of oil pollution on plants living in a salt marsh
depends on the season. If the plants are in bud stage,
flowering is inhibited, if the flowers are oiled they rarely
produce seeds, if the seeds are oiled, germination is
impaired. Experience of isolated oil spills suggests that
oil pollution of this kind is less damaging to salt marshes
than efforts to clean up the oil.
25

Mangroves present a rather different problem. They live in
anoxic muds and have extensive air spaces carrying oxygen to
the submerged part of the tree. Lenticles, by which the air
is taken up, occur on the aerial roots of Avicennia or
proproots of Rhizophora and if the lenticles are clogged
with the oil, the oxygen level in the root air spaces fall.
Although, mangroves have certainly suffered damage by oil
spills, there are a number of cases where heavy oilings have
not killed the plants.
5.7 Hunan health
The major concerns of oil pollution for man are the
degradation of aesthetic quality mainly caused by tar
residues on beaches and shorelines and the probable health
hazard through consumption of contaminated seafood.
The bioacummulation and retention of carcinogenic compounds
like benzopyrene is of serious concern to human health.
However, on the global scale, oil is an insignificant source
of such carcinogens as compared to other sources.
6 MARINE ENVIRONMENTAL QUALITY AT MURUD
The coastal area of Murud consisting of broad and gently
sloping 3 km long beach bordered on the north by a rocky
26
cliff and Rajapuri creek to the south with an imposing
historical fort in the forefront is a famed scenic spot and
attraction for many tourists who flock the area during
April-May. The Rajapuri creek forms the entrance to the
important fishing port of Agadanda and harbours mangroves in
the interior marsh.
The baseline marine environmental quality parameters evolved
on the basis of COMAPS programme are given in Table 3.1 to
3.5. These data collected ever 1989-93 represent premonsoon
conditions and each value is a mean of several individual
determinations. The caostal waters including the creeks and
bays around Murud are under negligible enνironnmental stress
in the absence of industrialisation and urbanisation and the
variabilities evident in Tables 3.1 to 3.5 on natural
occurence inherent to any nearshore water body. Hence,
assessment of environment quality should be made
keeping these variations in view.
6.1 Water quality
During the field survey and sample collections on 27th May
1993, the seawater as well as the beach was relatively clean
and there was no evidence of high concentration of PHC in
the water column (Table 6.1). Several patches of floating
27
PHC were however noticed on the sea surface upto 15 km from
the shoreline on 28th May. The whole area was also strewn
with tarry lums of varying sizes. Evidently the PHC in the
water column varied widely and levels upto 3348 Μg/l were
observed. It must be noted that sampling for PHC in the
water column was undertaken at 1 m depth from surface as per
standard practice and the observed concentrations could be
considered as abnormally high. The advantage of sampling
below the water surface is that the results are not
adversely biassed due to patchiness of water insoluble PHC
floating on the surface. The decrease in DO to 1.5 ml/1 at
some locations and. its high variability was associated with
the enhanced BOD of the PHC in the water column, The water
quality however improved on the following day (29th May) and
the levels of PHC decreased considerably in the offshore as
the patches moved to nearshore areas. One such patch
floating off Murud is shown in Plate l(b).
Although due to operational reasons and hostile sea
conditions the area of surveillance was restricted to region
around Murud, floating patches of PHC were reported by the
local fishermen at least upto Shrivardhan 25 km south of
Murud. Deposition of PHC on the shore several km south of
Murud was reported during Hellicopter surveillance by the
28
joint team on 30th May 1993. On 29th and 30th May 1993, the
nearshore water particularly in the vicinity of the beach
was severely contaminated with PHC keeping the holidaying
tourists away from swimming.
The oil patches entered Rajapuri creek on 29th May 1993 and
oscillated within the creek under the tidal influence and
eventually oiled the shores and some mangroves.
6.2 Shore quality
The beach was relatively clean and unaffected on 27th May
except for a few tar balls scattered around the high water
mark. On 28th May several tarballs mixed with sand were
observed around the high water mark, density of which
varied between 50 to 200 g/m2 This type of tarball
deposition is often observed along the beaches of the
central west coast of India and has been attributed to
tanker traffic and offshore oil exploitation activities.
The rocky shore north of the beach, at the mouth of Rajapuri
creek and around the fort also did not give any indication
of major PHC contamination on 27th-28th May 1993.
The high tide of 28th night dramatically changed the
scenario. Large quantities of tarry material were brought to
the shore by the rising tide and with the ebb, the whole
29
beach which was relatively clean (Plate l(a)) was covered
under a mat of offensive tarry material (Plate 2(b)). The
beach campling undertaken on 29th and 30th May 1993 (Plate
3(a)) indicated deposition density varying between (5 to 35
kg/m2) in a width of 15-20 m on the beach. Considering
average deposit of 25 kg/m2, the beach was estimated to have
1000 tonnes of overburden of PHC, By afternoon, under the
blazing summer heat, the PHC deposited on the beach melted
(Plate 3(b)) and trickled into the nearshore water. Part of
the liquid also penetrated the sand upto a depth of about 3
tο 5 cm.
The rocky shores were also covered with PHC and pools of
water formed in between the rocks during low tide trapped
the thick oily mass (Plates 4 and 5), The fish landing jetty
and open spaces around often used for sorting of fish etc.,
were covered with PHC.
Although the PHC had entered the creek (Plate 2(a)), the
mangrove swamps were not seriously affected though the
oyster bods at the entrance of Rajapuri creek were coated
with PHC in patches.
30
6.3 Impacts on biota
Whenever we consider assessment of oil pollution
implications, we must be aware of the fact that, despite
many changes it may cause in the physico-chemical properties
of seawater and the sea bottom, the ultimate consequences
are inevitably of a biological nature. Therefore, the
biological investigations of ecosystems and particularly, of
their communities constitute an important part of impact
assessment study.
Biological production potential and impact of oil on biota
was evaluated on the basic of the following ;
(i) Phytoplankton pigments, cell counts and composition as a
measure of primary productivity,
(ii) Zooplankton biomass and population to estimate secondary
productivity,
(iii) Biomass and population of macrobenthos to Quantify benthic
productiνity.
(iv) Fish catch as a measure of fishery potential,
(v) lntertidal fauna and mangroves.
31
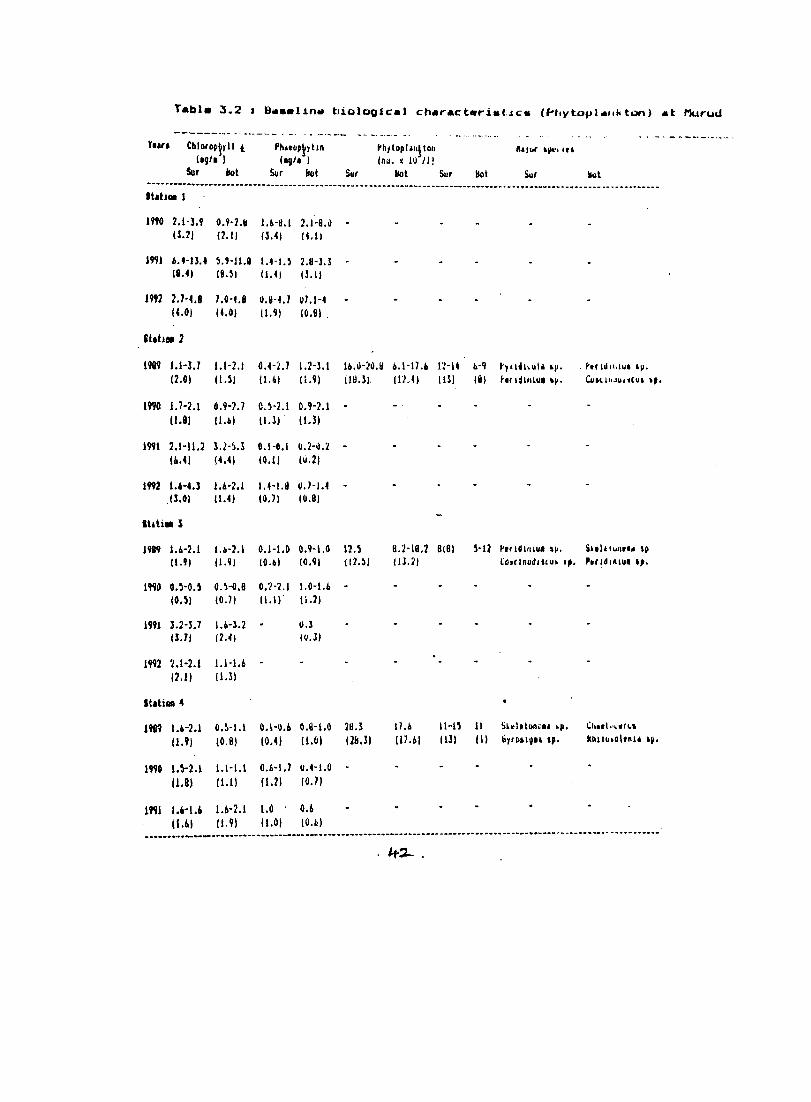
(a) Phytoplankton
The level of chlorophyll a. varied in 0.5 - 5.3 mg/l range
during 27th-30th May (Table 6.2) which fell within the range
set for the baseline (Table 3.2). Incidently highest and
lowest values of chlorophyll a were observed on 29th May
(Day of high contamination by PHC). Such significantly large
random variations are often normal occurrences in the
coastal waters and are perhaps due to the patchiness and
uneven distribution of phytoplankton.
Phaeophytin also varied widely and was unevenly distributed.
The concentration frequently exceeded those chlorophyll a
indicating environmental stress perhaps due to PHC
contamination. The water supported fairly high chlorophyll
and cell count of phytoplankton,
Large number of species of phytoplankton (67 No.) belonging
to 6 different classes were identified in the collections,
In the order of dominance, Bacillariophyceae was followed by
Cyanophyceae, Desmophyceae, Dinphyceae, Chlorophyceae and
Eugleanophyceae. Tha cell count which varied widely between
7.7 χ 10 and 280 χ 10 counts/1 was generally high in the
surface water. Highest cell count (280 x 10 counts/1) was
recorded at station 3 on 29 May where the diatom Dtylum
32

brightwelli and Asterionella japonica were predominant.
Diatoms were the dominant forms and were represented mainly
by Nitzschia. sp, N.pungsus, Navicula sp and Rhizosolgnia sp,
Phytoplankton species diversity was generally higher at
stations 2 and 3 as compared to station 1.
Microscopic examination of cells indicated that a few
specimen particularly of Nitzchia were damaged with a
coatings of black layer presumably of PHC, around the cell.
Some species of Ditylum brightwelli, Trichodesmium sp,
Rhizosolenia sp, Saurirolla sp, Chaetoceros sp, Nitzschia
cloestarium and Biddulphia sinensis from collections at
station 3 were also damaged. The maximum damage to
phytoplankton cells were noticed, at station 2 and 3, Rest of
the species ware healthy and their distrilution was normal.
From the extensive literature reports some of which are
discussed under section 5, it is unlikely that weathered oil
residue from a small spill like the one under discussion, in
the open ocean would cause any measurable and long term
damage to phytoplankton, It is expected that whatever
marginal damage caused by the impact, will be quickly
recovered.
33

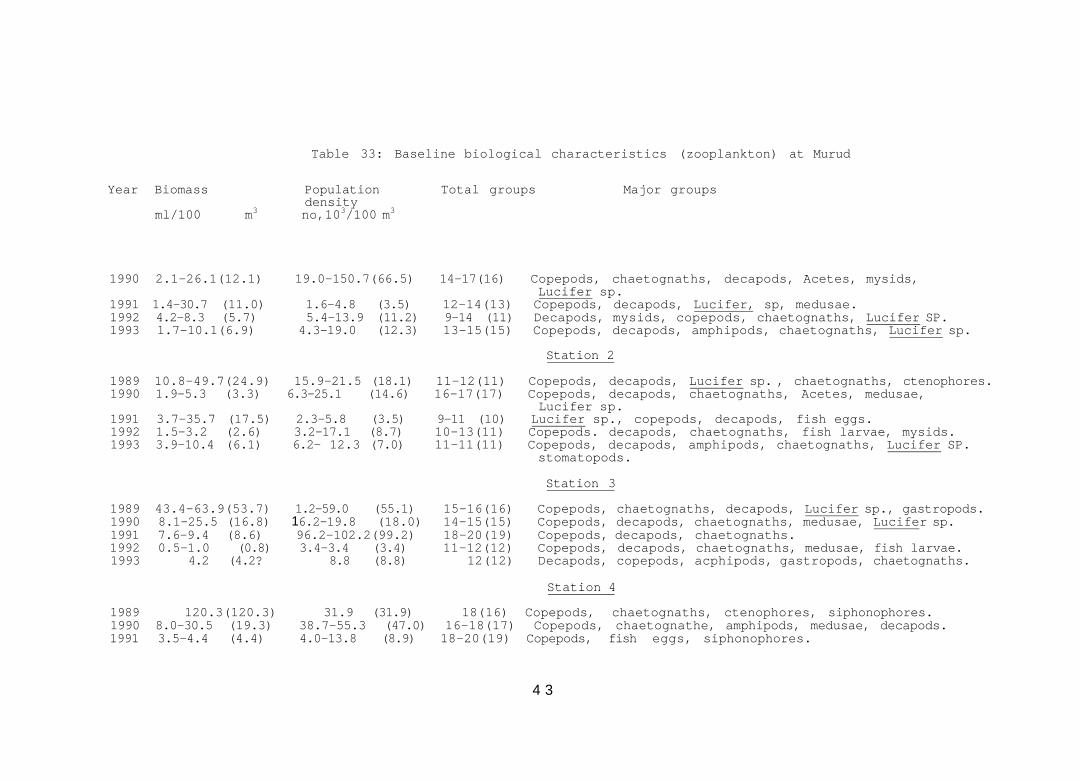
(b) Zooplankton
The zooplankton biomass, total population, total groups and
faunal consumption are given in Table 6.3 which agreed well
with the baseline (Table 3.3). The highest biomass recorded
at station I was due to the predominance of Lucifer sp
(27.2%), mysids (8.6%) and cterophores (3.4%). The average
zooplankton biomass decreased in the order - station 1 (38.2
ml/100 m3) > station 2 (8.4 ml/100 m3) > station 3 (5.6
ml/100 m3) > station 4 (4.7 ml/100 m 3). The total population
at station 1 which was maximum among all the stations was
represented by eleven groups. The most dominant group was
copepods (41.9%). The minimum population which was observed
at station 2 also consisted of eleven group with the
dominance of copepods (46.7%). Lucifer sp (21.9%),
gastropods (14.6H) and decapods (9.7%). Thus, copepods were
the most dominant group contributing over 70% of the total
population, Copepods were followed by Lucifer sp (8.2%),
decapods (5.9%), ctenophores (2.6%) and chaetognaths (1.5%),
The other groups in the collection were siphonophores,
medusae, fish eggs, lamellibranchiates, mysids, gastropods,
polychaetes, isopods, Acetes sp, appendicularians,
stomatopod larvae and cephalopods.
34

The faunal diversity varied between 9 to 16 with the highest
diversity of 16 at sitation 2 on 27th May before the oil
spill reached Murud. The zooplonkton sampled after 28 May
showed considerable veriations in biomass, population.
Faunal composition and decrease in founal divercity (Table
6.3). A number of damaged and dead species of chaetognaths
copepods, Lucifer sp, Acetes sp and fish larvae were noticed
in collections made between 28th and 30th May at stations 2,
3 and 4.
Microscopic examination of animals revealed black residue
presumably of PHC in the body of some species of
chaetognaths and copepods.
Copepods were mostly dominated by Acartia spinicauda,
Acartia sp, Acrocalanus gracilus, Acrocalanus sp,
L. pectinata, Tortanus sp and Centrophages sp. However, PHC
was noticed only in few species of Labidocera pectinata,
Canthoca1anus pauper and Acartia sp.
The impact of PHC on zooplankton of coastal waters of Murud
was only marginal and damages were noticed generally in
samples collected from areas having floating oil patches.
The sea areas free from floating PHC did not reveal any
visual damage. As noticed in crude oil spills, such damages
35

are only transient and normal populations are restored
quickly as plankton in general have high replacement
capacity.
(c) Benthos
Subtidal macrofaunal standing stock in terms of biomass
(0.1-52.9 g/m3 wet wt) and population (713-11500/m3) varied
widely in the area. The earlier studies (Table 3.4)
indicated average macrofauna1 biomass and population at
stations 1, 2, 3 and 4 as 26.4, 1.3, 1.7 and 9.5 g/m3 and
2810, 776, 2820 and 3330/m respectively. The faunal group
diversity was the highest (av 8) at station 4 whereas it was
least (av 3) at station 3. Thus, the earlier studies
accounted for a better biomass and population density at
stations 1 and 4, respectively. During the present
investigation it was observed that faunal group diversity
and composition were comparable to the baseline (Table 3.4)
within the general variability inherent to the benthos. The
higher benthic productivity of (3 to 7 times more) numerical
abundance and biomass (2 to 15 times more) observed during
the present study could probably be due to seasonal
variability in the fauna abundance.
36
These studies did not reveal any gross adverse impact on
benthic organism. This was expected since the collactions
were made during the period when FHC was floating/dispersed
in the water column and had not deposited on the sediment.
(d) Intertidal fauna
The field team had no opportunity to study the intertidal
fauna as the shores were heavily contaminated by PHC on 28th
May. Moreover baseline for intertidal fauna is not available
for comparison. Under the heavy deposition of PHC on the
shores and subsequent relocation in the sediment it is
expected that the intertidal fauna will be severely
affected. Literature reports indicate that intertidal fauna
of heavily oiled shores is severely damaged and recovery is
often slow. It is necessary that long term studies of
recovery of intertidal fauna of sandy beaches and rocky
shores should be undertaken forthwith. In this respect the
study of commercially important oyster populations at the
mouth of Rajapuri creek will prove useful for future
reference.
A large number of dead organisms belonging to Porfita sp,
were washed ashore and strewn on the beach. It is therefore
necessary to investigate the post spill biological effects
37

on some selected marine cοmmunities to ascertain their
recovery.
(e) Mangroves
The inner intertidal regions of Rajapuri creek have dense
mangroves spread over large areas which have been declared
as environmentally sensitive zone by DOEn. Such areas are
known to be spawning and nursing zones for a variety of
commercially important fish and shell-fish. Although till
31st May PHC deposition in those areas was not serious, but
tarry oil had already entered the creek.
Subsequent local inquiries indicate that some of the
mangrove areas are affected. Further detailed study is
therefore necessary to delineate the impacts on the mangrove
ecology and in the trends their recovery.
(f) Fishery
The trawl catch of commercially operating fishing trawler
was examined on 28th May. There was neither any evidence of
damage to the fish caught nor there were tar lumps, in the
catch. The haul examined was dominated by eleven species of
fishes and 4 species of prawns (Table 6.5). The catch
composition was comparable to the baseline (Table 3.5).
38

Table 3.1 : Baseline water quality at Murud (1990-1992)
Parameters Year Station 1 Station 2 Station 3 Station 4 Station 5
Temp 90 25.2 25.0 25.7 25.3 25.4
(0C) 91 30.2 30.0 29.8 29.1 25.8
92 28.1 28.0 27.4
Mean 26.2 27.7 27.6 27.2 27.1
Salinity 90 36.2 36.1 35.2 35.1 35.1
x 10-3 91 36.1 35.6 35.2 35.1 35.1
92 36.8 36.1 36.2
Mean 36.4 35.9 35.5 35.1 35.1
pH 90 8.1 8.1 8.2 8.3 6.4
91 7.6 7.9 7.9 7.9 7.9
92 7.8 7.8 7.9 - -
Mean 7.8 7.9 8.0 8.1 8.2
Suspended 90 193 112 69 18 14
solids 91 76 36 1 19 15
(mg/1) 92 137 84 73
Mean 135 77 53 19 15
39

Dissolved
oxygen
(mg/l)
BOD
(mg/1)
NO3--N
(μg/1)
NO2 -N
(μg/1)
40
90 4.5 4.6 4.4 4.6
91 4.2 4.0 4.1 3.8
92 4.4 3.5 4.1
Mean 4.4 4.0 4.2 4.2
90 1.0 2.2 1.4 1.0
91 3.0 0.9 1.0 1.2
92 1.3 0.5 2.0
Mean 1.8 1.2 1.5 1.1
90 23.5
91 67
92 238
Mean 180
90 17
91 17
92 7
Mean 14
192 280 91
59 35 17
328 123
193 146 54
10 15 13
13 2 1
6 2
10 6 7.0
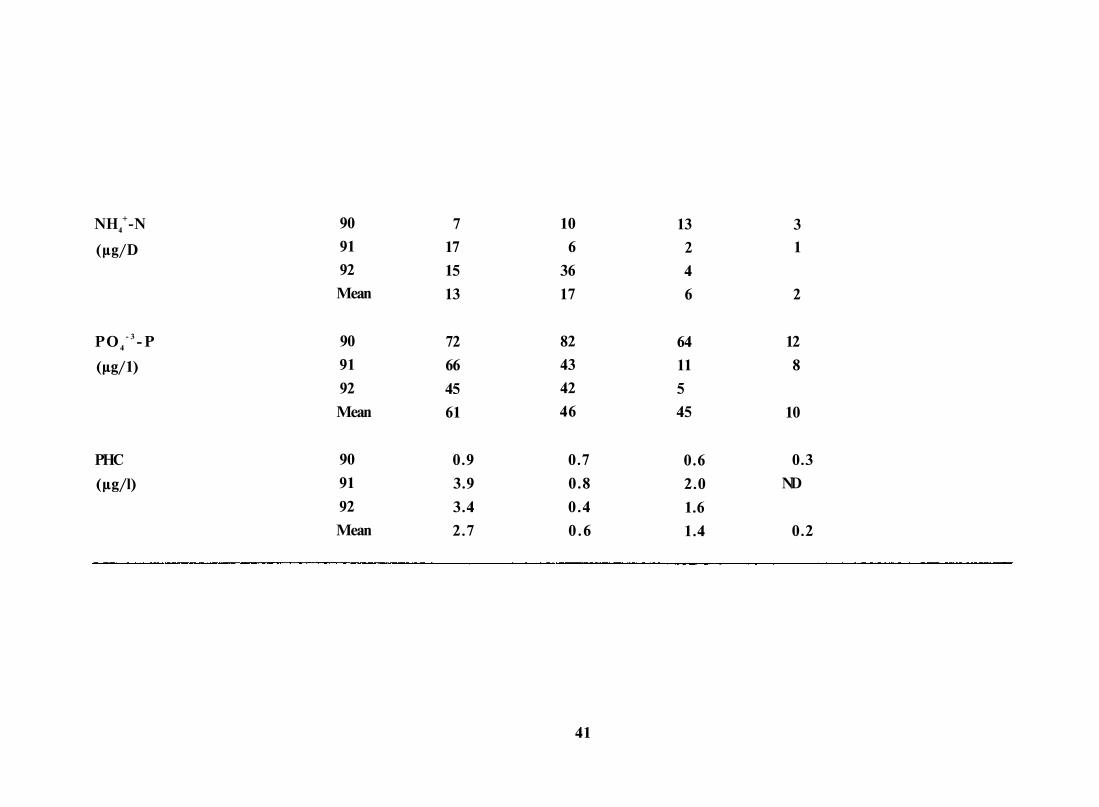
NH4
+-N
(μg/D
PO 4
- 3 -P
(μg/1)
PHC
(μg/l)
90
91
92
Mean
90
91
92
Mean
90
91
92
Mean
7
17
15
13
72
66
45
61
0.9
3.9
3.4
2.7
10
6
36
17
82
43
42
46
0.7
0.8
0.4
0.6
13
2
4
6
64
11
5
45
0.6
2.0
1.6
1.4
3
1
2
12
8
10
0.3
ND
0.2
41
4 3
Table 33: Baseline biological characteristics (zooplankton) at Murud
Year Biomass Population Total groups Major groupsdensity
ml/100 m3 no,103/100 m3
1990 2.1-26.1(12.1) 19.0-150.7(66.5) 14-17(16) Copepods, chaetognaths, decapods, Acetes, mysids,Lucifer sp.
1991 1.4-30.7 (11.0) 1.6-4.8 (3.5) 12-14(13) Copepods, decapods, Lucifer, sp, medusae.1992 4.2-8.3 (5.7) 5.4-13.9 (11.2) 9-14 (11) Decapods, mysids, copepods, chaetognaths, Lucifer SP.1993 1.7-10.1(6.9) 4.3-19.0 (12.3) 13-15(15) Copepods, decapods, amphipods, chaetognaths, Lucifer sp.
Station 2
1989 10.8-49.7(24.9) 15.9-21.5 (18.1) 11-12(11) Copepods, decapods, Lucifer sp. , chaetognaths, ctenophores.1990 1.9-5.3 (3.3) 6.3-25.1 (14.6) 16-17(17) Copepods, decapods, chaetognaths, Acetes, medusae,
Lucifer sp.1991 3.7-35.7 (17.5) 2.3-5.8 (3.5) 9-11 (10) Lucifer sp., copepods, decapods, fish eggs.1992 1.5-3.2 (2.6) 3.2-17.1 (8.7) 10-13(11) Copepods. decapods, chaetognaths, fish larvae, mysids.1993 3.9-10.4 (6.1) 6.2- 12.3 (7.0) 11-11(11) Copepods, decapods, amphipods, chaetognaths, Lucifer SP.
stomatopods.
Station 3
1989 43.4-63.9(53.7) 1.2-59.0 (55.1) 15-16(16) Copepods, chaetognaths, decapods, Lucifer sp., gastropods.1990 8.1-25.5 (16.8) 16.2-19.8 (18.0) 14-15(15) Copepods, decapods, chaetognaths, medusae, Lucifer sp.1991 7.6-9.4 (8.6) 96.2-102.2(99.2) 18-20(19) Copepods, decapods, chaetognaths.1992 0.5-1.0 (0.8) 3.4-3.4 (3.4) 11-12(12) Copepods, decapods, chaetognaths, medusae, fish larvae.1993 4.2 (4.2? 8.8 (8.8) 12(12) Decapods, copepods, acphipods, gastropods, chaetognaths.
Station 4
1989 120.3(120.3) 31.9 (31.9) 18(16) Copepods, chaetognaths, ctenophores, siphonophores.1990 8.0-30.5 (19.3) 38.7-55.3 (47.0) 16-18(17) Copepods, chaetognathe, amphipods, medusae, decapods.1991 3.5-4.4 (4.4) 4.0-13.8 (8.9) 18-20(19) Copepods, fish eggs, siphonophores.
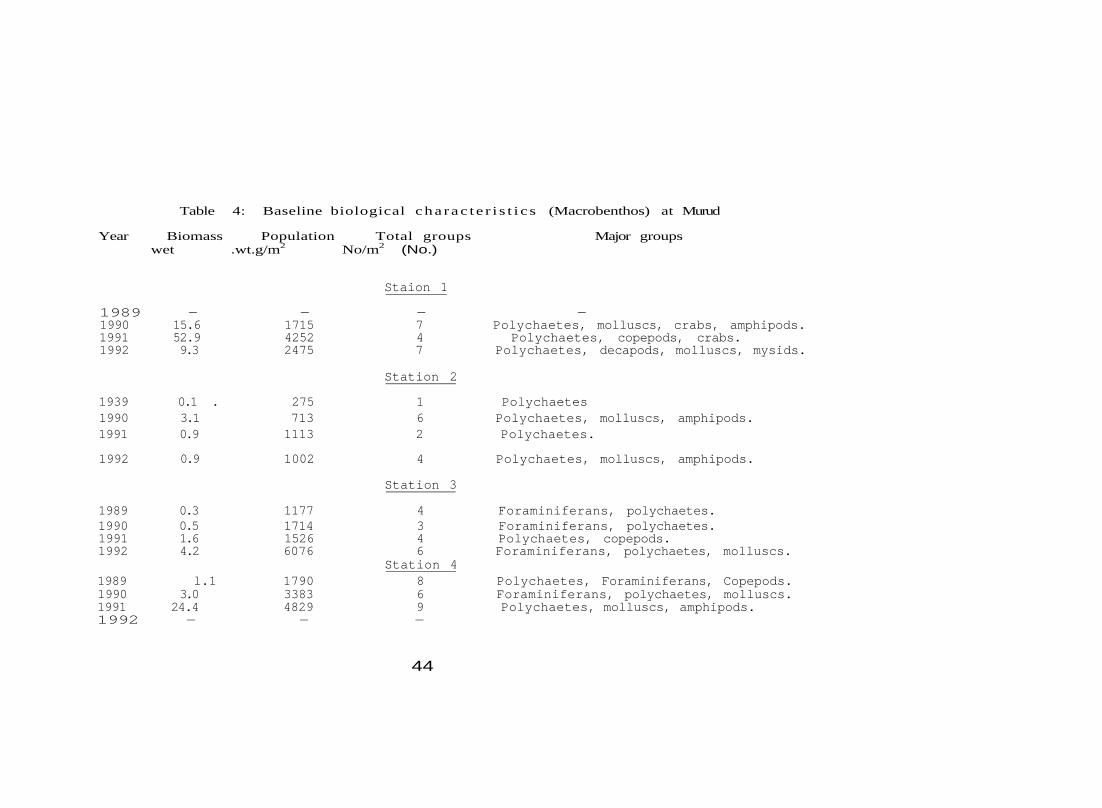
Table 4: Baseline biological cha rac t e r i s t i c s (Macrobenthos) at Murud
Year Biomass Population Total groups Major groupswet .wt.g/m2 No/m2 (No.)
Staion 1
1989 - - - -1990 15.6 1715 7 Polychaetes, molluscs, crabs, amphipods.1991 52.9 4252 4 Polychaetes, copepods, crabs.1992 9.3 2475 7 Polychaetes, decapods, molluscs, mysids.
Station 2
1939 0.1 . 275 1 Polychaetes1990 3.1 713 6 Polychaetes, molluscs, amphipods.1991 0.9 1113 2 Polychaetes.
1992 0.9 1002 4 Polychaetes, molluscs, amphipods.
Station 3
1989 0.3 1177 4 Foraminiferans, polychaetes.1990 0.5 1714 3 Foraminiferans, polychaetes.1991 1.6 1526 4 Polychaetes, copepods.1992 4.2 6076 6 Foraminiferans, polychaetes, molluscs.
Station 41989 l.1 1790 8 Polychaetes, Foraminiferans, Copepods.1990 3.0 3383 6 Foraminiferans, polychaetes, molluscs.1991 24.4 4829 9 Polychaetes, molluscs, amphipods.1992 - - -
44

Table 5: Baseline biological characteristics (Fishery) at Murud
Year Sts Catch Total Major species(kg/hr) species
1989 2 27.1 28 Coilia dussumieri, Johnius dussumieri, Scolidon laticaudata, Harpodon nehereus,
Pampus argenteus
3 29.0 20 C. dussumieri, Squilla s p . , J. dussumieri, S. laticaudata, Trichiurus savala
1090 2 29.6 29 Squilla s p , J. dussumieri, S. la t icaudata , Exhippolysmata ensirostr is ,Parapenaeopsis sp, Panulirus polyphagus, Acetes sp .
3 16.7 13 Squilla sp , S. laticaudatus, Neptuneus sanguionolentus, Johnius sp , C. dussumieri,Trichiurus haumela, P. argenteus, P. cinensis
4 14.7 22 Squilla sp , S. laticaudatus, Charybdis annulata, N.sanguinolentus , T.savala,C. dussumieri, Exhippolysmata ensirostris, Parapenaeopsis, stylitera
1991 2 22.9 26 C. dussumieri, P.cninensis, P. argenteus, H. nehereus, J. glaucus, S. laticaudatus
3 33.7 25 C. dussumieri, Solenocera sp, P. argenteus, P. chinensis, Squilla sp, Metapenaeusaffinis
4 37.5 21 C. dussumieri, H. nehereus, J. glaucus & Exhippolysmata ensirostris
45

Table 6: Effects of oil in some major ecosystemsEcosystems Expected initial impact Expected recoveryOpen ocean Light: Impact on pelagic
plankton dependent on chance event of contacting floating slick.Many organisms may avoid spill, surface dwellers may be affected. Not likely that oil would accumulate in open-ocean sediments to lethal or sublethal levels.
Fast: Rapid dispersion and degradation of oil. Effective reproduction and dispersal mechanisms for most pelagic organisms.
Outer continental shelf
Light to moderate: Impact on plankton populations light. Impact on spawning populations of fish larvae severe. Moderate impact on benthic systems if oil reaches bottom.
Fast to moderate: Fast recovery for plankton because of rapid regeneration times. Moderate recovery of benthic systems if oil reaches bottom.
Open estuarine areas, bays, channels and harbours
Moderate to heavy: Chronic oil may depress populations of fish and some benthos, or induce changes in species abundance and distributions. Spilled oil affects dependent on time of year (spawning, migration, etc) and oil's persistence.
Fast to slow: Dependent on flushing characteristics, route to benthos, shoreline characteristics and community stability. Individual year, classes of larval fauna may be severely affected.
Wetlands, marshes and mangroves
Heavy: Potential serious threat as result of vulnerability to spills and significance of estuarine functions (nursery and breeding grounds; high productivity). Faunal mortalities leading to decrease in population density, changes in species abundance and distribution. Damage to marsh grasses after repeated exposure and decrease in productivity. Damage to mangroves and neighbouring grasses
Moderate to slow: Persistence of oil in sediments prolongs toxicity. Once oil is removed, biological succession may be moderate in some areas, since organisms generally reproduce and disperse fairly rapidly. Mangrove swamps particularly complex and may take long to recover. Marsh areas may be affected for many years.
continued...2

Ecosystem Expected initial impact Expected recoveryCoral reefs Unknown: Some reports of
lethal and sublethal damage.
Unknown: Recover could be slow because of structural complexity of coral communities
Polar ecosystems
Unknown: Some reports of effects of arctic lakes and on individual organisms
Unknown: Recovery could be slow since spilled oil may persist longer at colder temperatures and since polar organisms have slower growth rates. Extended lite cycles, longer reproductive periodicity and narrower-ranging dispersal stages. However, recovery may be more rapid because organisms have already adapted to harsh conditions.
------------------------------------------------------------------

Table 4.2: Effects of oil on marine populations and communities.
Community or Expected degree of Expected recoverypopulation type initial impact rate
Plankton Light to Moderate Fast to Moderate
Benthic communitiesRocky intertidal Light FastSandy or muddyinter tidal Moderate Moderate
subtidal, ofshore Heavy Slow
Fish Light to Moderate Fast to Moderate
Birds Heavy Slow
Marine mammals Light Slow, If population,seriously affected.
48
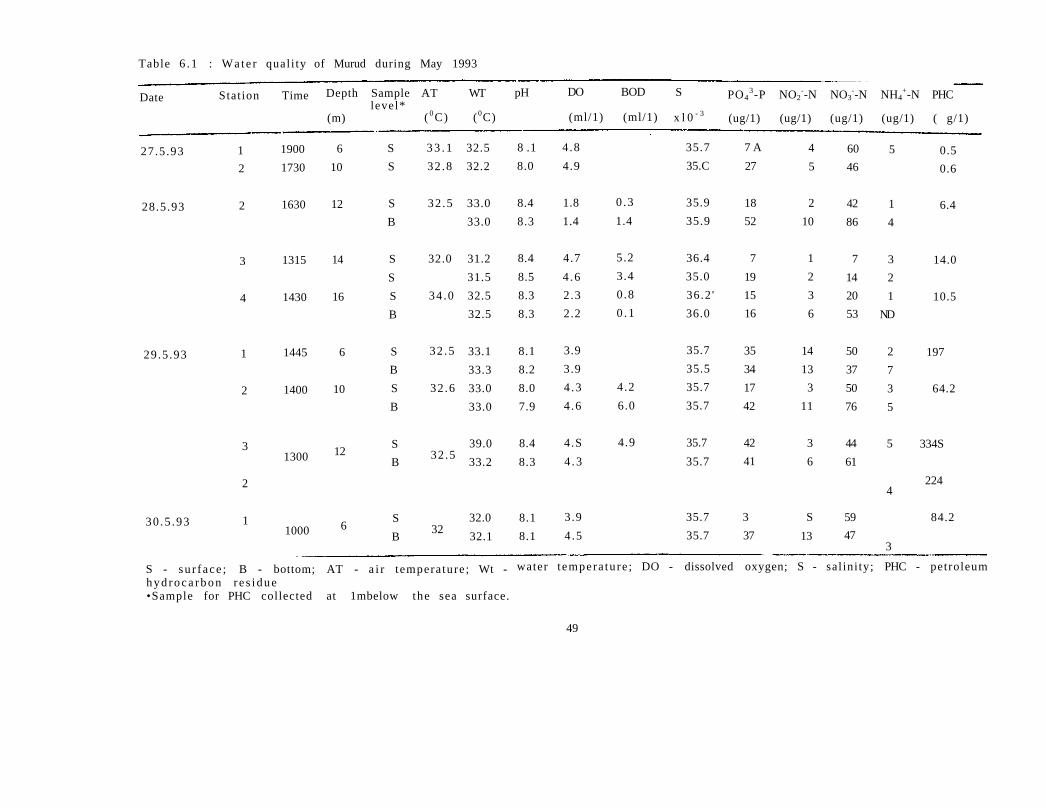
Table 6 . 1 : Wa te r qual i ty of Murud during May 1993
Date Station Time Depth Samplelevel*
(m)
AT WT
( 0 C) (0C)
pH DO BOD
(ml/1) (ml/1)
S
x l 0 - 3
PO43-P NO2
--N NO3--N NH4
+-N PHC
(ug/1) (ug/1) (ug/1) (ug/1) ( g/1)
27.5.93
28.5.93
29.5 .93
30 .5 .93
1
2
2
3
4
1
2
3
2
1
1900
1730
1630
1315
1430
1445
1400
1300
1000
6
10
12
14
16
6
10
12
6
S
S
S
B
S
S
S
B
S
B
S
B
S
B
S
B
3 3 . 1
32 .8
32 .5
32.0
34 .0
32 .5
32 .6
32.5
32
32.5
32.2
33.0
33.0
31.2
31.5
32.5
32.5
33.1
33.3
33.0
33.0
39.0
33.2
32.0
32.1
8 .1
8.0
8.4
8.3
8.4
8.5
8.3
8.3
8.1
8.2
8.0
7.9
8.4
8.3
8.1
8.1
4 .8
4.9
1.8
1.4
4.7
4 .6
2.3
2.2
3.9
3.9
4 .3
4 .6
4.S
4 .3
3.9
4 .5
0 .3
1.4
5.2
3.4
0.8
0 .1
4.2
6.0
4.9
35.7
35.C
35.9
35.9
36.4
35.0
36.2 '
36.0
35.7
35.5
35.7
35.7
35.7
35.7
35.7
35.7
7 A
27
18
52
7
19
15
16
35
34
17
42
42
41
3
37
4
5
2
10
1
2
3
6
14
13
3
11
3
6
S
13
60
46
42
86
7
14
20
53
50
37
50
76
44
61
59
47
5
1
4
3
2
1
ND
2
7
3
5
5
4
3
0.5
0.6
6.4
14.0
10.5
197
64.2
334S
224
84.2
49
S - su r f ace ; B - bottom; AT - a i r tempera ture ; Wt -h y d r o c a r b o n r e s i d u e•Sample for PHC collected at 1mbelow the sea surface.
water t empera ture ; DO - dissolved oxygen; S - sal ini ty; PHC - petroleum

Table 6.2 : Distr ibut ion of p h y t o p l a n k t o n pigments and population at Murud
Stn Date Tide Sampling C h l . a P h a e o - P h y t o - Total Major s p e c i e s Remarksp h y t i n , plankton species
(Time) (Depth) (mg/m3 ) (mg/m3 ) ce l l counts,
2 27.5.93 Eb Surface 0.5 2 . 1 190 23 Nitzschia sp. Navicula sp. Nitzschia pungens,Rhizosolema sp. T h a l l o s s i r e a d ic ip iens Normal
2 28.5.93 Fl Surface 2.7 1.1 196 22 Nitzschia sp. N.pungens, Navicula sp.(1600) Chaetoceros s p . Normal
2 28.5.93 Fl Bot 2.14 2 . 3(1600)
2 29.5.93 Fl Surface 1.1 N . D . 152 25 Nitzschia s p , N . p u n g e n s , R . s t o l t e r f o t h i ,(1400) Rhizosolenia ερ. R . s e t i g e r a , Coscinodis us sp.
Chaetoceros s p . 2S*
2 29.5.93 Fl Bot 0.5 2 . 1 65 22 Nitzschia s p , N.pungens, Thallossionema(1400) n i t z s h o i d s , C o s c i n o d i s c r s sp and Navicula sp .2B*
2 30.5.93 Fl Surface 2.7 6.3 -
2 30.5.93 Fl Bot 1.1 4 -
2S* Few s p e c i e s of Ni t sch ia were not iced as damaged and coated by t h e i r black l a y e r .2B* Few spec ies of Ni tzschia were noticed as damaged.
3 28.5.93 Fl Surface 1.0 1.2 14 22 Ni tzschia sp. T r i c h o d e s m i u r sp.(1300) Ditylum, Br ightwe l i i , Rhizosolenia s p . 3AS*
3 28.5.93 Fl Bot 1.1 0 .8 15.2 15 Nitzschia sp. R h i z o s o l e n i a sp.(1300) Thallossionema n i t z s c h o i d e s , Chaetoceros s p . 3AB*
5 0

Table 1 (contd)
29.5.93(1300)
29.5.93(1300)
28.5.93(1430)
F1
Fl
Fl
Surface
Bottom
Surface
5.3
3.74
ND 280
40
6.40
42
16
21
Ditylum brightwelli Asterionellajaponica, Nitzschia bungens,Nitzschia sp., Chaetoceros sp.
Nitzschia sp, Rhizosolenia sp,R. setigera, Ditylum brightwelli
Nitzschia pungens, Nitzschia sp.Trichodesmium sp., Synedra sp,Coscinodiscus sp.
3S*
Normal
Normal
3AS*
3AB*
3S*
Few species of Ditylum brightwellii, Trichodesmium sp, Rhizosolenia sp, Surirella sp, Chaetoceros, Nitzschiaclostrium were noticed as damaged and coated with black residue.
Few species of Ditylum brightwellii and Chaetoceros were noticed as damaged.
Chaetoceros sp., Biddulphia sinensis were noticed as damaged and coated with this black layer.
51
4
3
3

Table 1 (contd)
1 27.5.93 Eb Surface 3·7 1.5 68 6 Nitzschia sp, Rhizosolenia sp ,Coscinodiscus sp, Pleurosigma sp. Normal
1 29.5.93 Fl Surface 3.2 N.D 80 18 Nitzschia sp, N.cloesterium, N.pleupens,(1445) Skeletonema costatum,
Rhizosolenia sp. 1B*
1 29.5.93 Fl Bot 2.7 5.6 8.0 9 Nitzschia sp, Pleurosigma sp,(1445) Coscinodiscus sp, Thallassiosira sp . Normal
1 30.5.93 Fl Surface 2.1 0.1 17 15 Nitzschia sp, N.pungens, Rhizosolenia sp,Pleurosigma sp, Oscillatoria sp. 1S*
1B* Few species of Nitzschia, Cloestarium and Pleurosigm, v.tre noticed as damaged.
1S* Few species of Nitzschia, Rhizosolenia & Ditylum b r i g w e l l i were noticed as damaged.
52
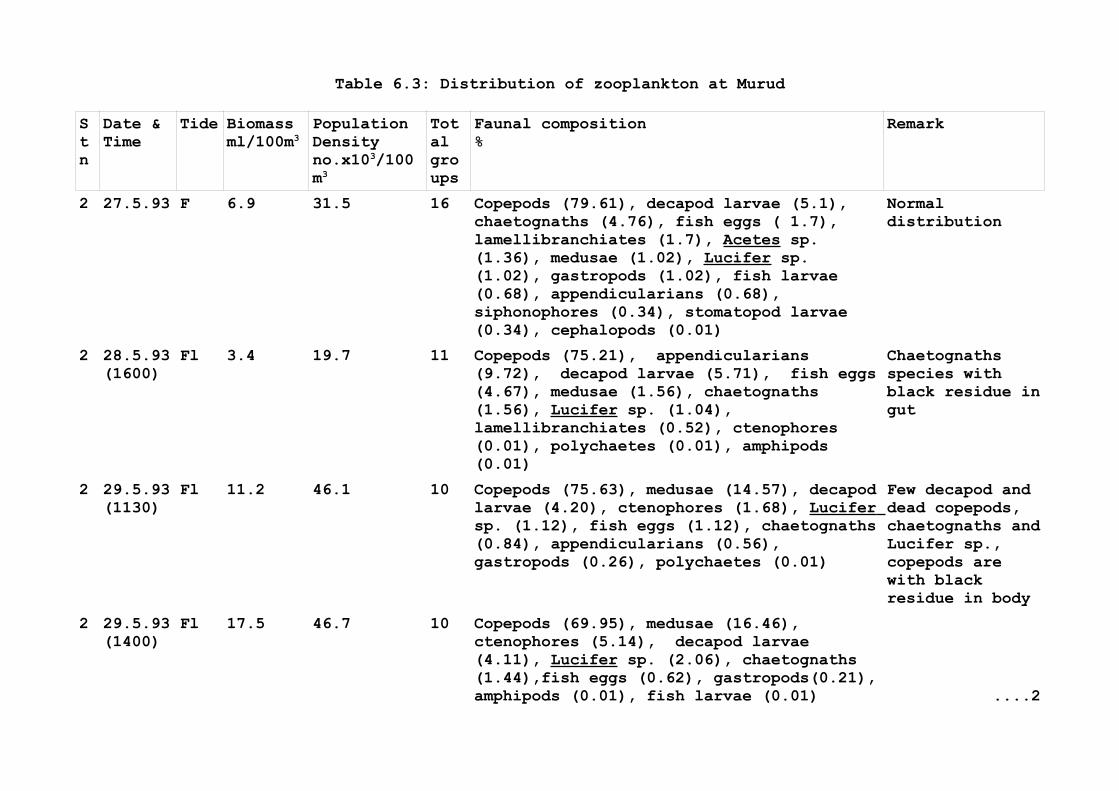
Table 6.3: Distribution of zooplankton at Murud
Stn
Date & Time
Tide Biomassml/100m3
Population Densityno.x103/100m3
Total groups
Faunal composition%
Remark
2 27.5.93 F 6.9 31.5 16 Copepods (79.61), decapod larvae (5.1), chaetognaths (4.76), fish eggs ( 1.7), lamellibranchiates (1.7), Acetes sp. (1.36), medusae (1.02), Lucifer sp. (1.02), gastropods (1.02), fish larvae (0.68), appendicularians (0.68), siphonophores (0.34), stomatopod larvae (0.34), cephalopods (0.01)
Normal distribution
2 28.5.93 (1600)
Fl 3.4 19.7 11 Copepods (75.21), appendicularians (9.72), decapod larvae (5.71), fish eggs (4.67), medusae (1.56), chaetognaths (1.56), Lucifer sp. (1.04), lamellibranchiates (0.52), ctenophores (0.01), polychaetes (0.01), amphipods (0.01)
Chaetognaths species with black residue in gut
2 29.5.93 (1130)
Fl 11.2 46.1 10 Copepods (75.63), medusae (14.57), decapod larvae (4.20), ctenophores (1.68), Lucifer sp. (1.12), fish eggs (1.12), chaetognaths (0.84), appendicularians (0.56), gastropods (0.26), polychaetes (0.01)
Few decapod and dead copepods, chaetognaths and Lucifer sp., copepods are with black residue in body
2 29.5.93 (1400)
Fl 17.5 46.7 10 Copepods (69.95), medusae (16.46), ctenophores (5.14), decapod larvae (4.11), Lucifer sp. (2.06), chaetognaths (1.44),fish eggs (0.62), gastropods(0.21), amphipods (0.01), fish larvae (0.01) ....2

Stn
Date & Time
Tide Biomassml/100m3
Population Densityno.x103/100m3
Total groups
Faunal composition%
Remark
2 30.5.93 (1530)
Fl 2.9 7.3 11 Copepods (48.7), Lucifer sp. (21.92), gastropods (14.61), decapod larvae (9.74), lamellibranchiates (1.94), medusae (0.97), chaetognaths (0.97), mysids (0.97), fish larvae (0.07), polychaetes (0.05), isopods (0.04)
Damaged & dead Lucifer sp.
3 28.5.93 (1300)
Fl 6.9 38.4 10 Copepods (95.88), decapod larvae (1.57), siphonophores (0.63), Lucifer sp. (0.63), chaetognaths (0.32), amphipods (0.32), lamellibranchiates (0.32), appendicularians (0.32), fish eggs (0.02), polychaetes (0.01)
Damaged & dead chaetognaths (40-50%), Damaged & dead Lucifer sp. (40-50%), Damaged & dead decapod larvae (5-10%), Acetes sp. (80-90%)
3 29.5.93 (1300)
Fl 4.2 33.1 9 Copepods (86.19), fish eggs (7.43), appendicularians (2.92), decapod larvae (2.65), medusae (0.27), Lucifer sp. (0.27), fish larvae (0.27), cladocera (0.01), stomatopod larvae (0.01)
Few damaged & dead chaetognaths & Lucifer sp.
4 29.5.93 (1445)
Fl 4.7 48.1 9 Copepods (95.8), decapod larvae (2.38), chaetognaths (0.72), appendicularians (0.72), medusae (0.48), siphonophores (0.24), gastropods (0.24), fish eggs (0.02), polychaetes (0.01)
Damaged & dead chaetognaths, Lucifer sp., Acetes sp., Fish larvae, Few copepods with oil residue

Stn
Date & Time
Tide Biomassml/100m3
Population Densityno.x103/100m3
Total groups
Faunal composition%
Remark
1 27.5.93 Eb 52.9 41.7 11 Copepods (76.61), Acetes sp. (8.06), decapod larvae (5.38), Lucifer sp. (3.5), chaetognaths (3.2), mysids (0.81), fish larvae (0.81), medusae (0.54), gastropods (0.54), fish eggs (0.54), isopods (0.01)
Normal with big fish larvae
1 29.5.93 (1445)
Fl 21.4 22.9 12 Copepods (53.9), ctenophores (17.65), medusae (8.49), decapod larvae (6.54), gastropods (4.9), Lucifer sp. (3.27), chaetognaths (1.96), mysids (1.31), lamellibranchiates (0.98), polychaetes (0.33), fish eggs (0.33), fish larvae (0.33)
Swarming of ctenophores
1 30.5.93 (0955)
Eb 74.4 52.9 11 Copepods (41.94), Lucifer sp. (27.21), decapod larvae (15.19), mysids (8.61), ctenophores (3.4), gastropods (2.27), medusae (0.68), lamellibranchiates (0.45), chaetognaths (0.23), fish eggs (0.01), fish larvae (0.01)
1 30.5.93 (1700)
Fl 4.2 14.2 10 Copepods (52.07), Lucifer sp. (13.02), mysids (10.42), decapod larvae (7.81), gastropods (7.81), lamellibranchiates (3.64), medusae (2.60), chaetognaths (2.08), ctenophores (0.52), fish larvae (0.02).

5 6
Table 6.4: Macrofauna] polulation (no/m2)and biomass (g/m2).
Groups
Polychaetes
Foraminiferans
Amphipoda
Copepoda
Tanaidacea
Mysids
Crustacean larvae
Seapen
Molluscs
Miscellaneous
TotalPopulation
Biomass
Station 3
1175
9250
75
50
25
25
10600
(3.74)
Station 4
1600
9500
l00
100
25
125
25
11475
(11.29)
Station 2
5600
(19.23)
100
100
50
5350
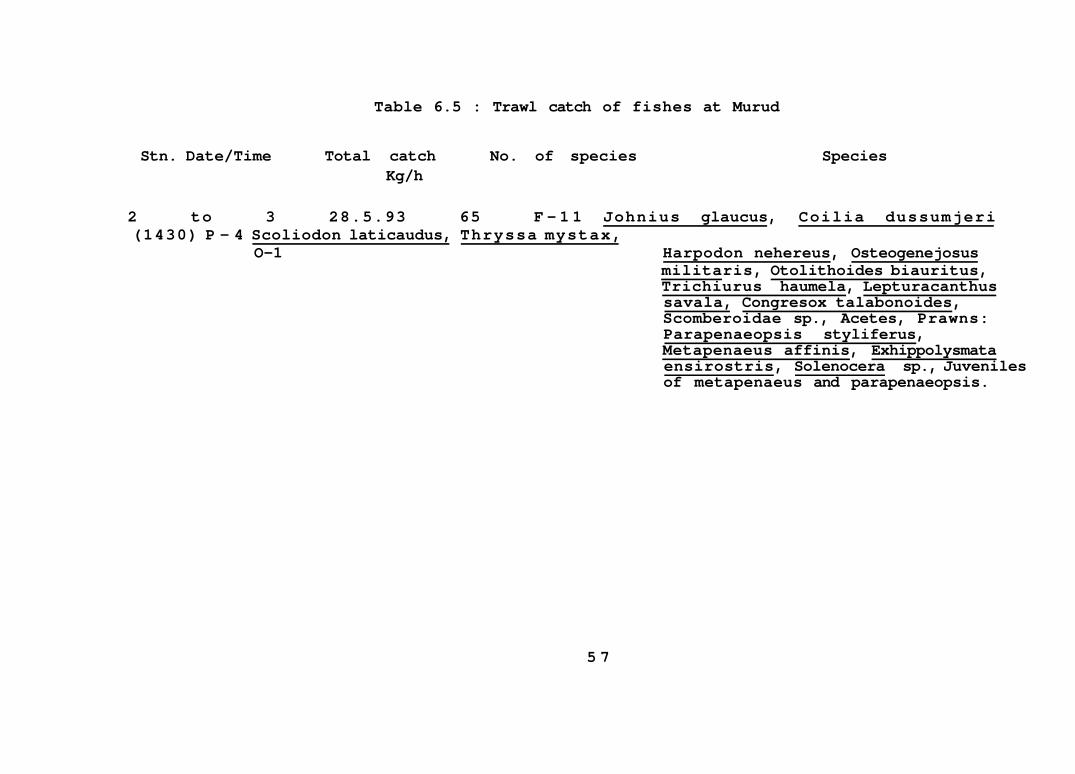
Table 6.5 : Trawl catch of fishes at Murud
Stn. Date/Time Total catch No. of species SpeciesKg/h
2 to 3 28.5.93 65 F - 1 1 Johnius glaucus, Coilia dussumjeri(1430) P - 4 Scoliodon laticaudus, Thryssa mystax,
O-1 Harpodon nehereus, Osteogenejosusmilitaris, Otolithoides biauritus,Trichiurus haumela, Lepturacanthussavala, Congresox talabonoides,Scomberoidae sp., Acetes, Prawns:Parapenaeopsis styliferus,Metapenaeus affinis, Exhippolysmataensirostris, Solenocera sp., Juvenilesof metapenaeus and parapenaeopsis.
5 7

Fig 1.1 Position of oil Spill in Bombay High
58


CONCLUSIONS AND RECOMMENDATIONS
CONCLUSIONS
The conclusions given below are based on the basis of
short term limited studies undertaken in Bombay High and
coastal marine environment of Murud. Hence the conclusions
are primarily suggestive of their prevailing conditions and
indicate only immediate observed impacts. To enable reliable
longterm predictions and assessments of environmental
degradation and damages to biota and their recovery detailed
planned investigations are required to be undertaken.
a) The accidental spillage of crude oil spilled in Bombay
High on 17th May 1993 was estimated between 3000 - 6000
tonnes. Under the prevailing environmental conditions it
was considered that around 40% of the spi11 (1500 - 3600
tonnes) would have evaporated within a couple of days.
The remaining viscous mass would undergo further
weathering and degradation with the passage of time. As
the high toxicity of crude oil is largely associated
with the volatile aromatic fractions, the residual tarry
material is not likely to cause large scale long terms
environmental damage in the open sea, though nearshore
benthic organisms and intertidal may be at risk.
b) The observed concentrations of floating and dissolved /
dispersed petroleum residues in certain areas of Bombay
1

High far exceeded the expected background.
c) Localized impacts in terms of decrease in its rate of
primary productivity and changes in the composition of
zooplankton were evident.
d) The predicted oil spill movement indicated probable
vulnerability of coastal region between Bombay and Goa
during May - September with high probability of
contamination of Murud-Janjira coastal belt during May.
e) Weathered crude contaminated the nearshore waters of
Murud on 28th May in the form of a large number of oily
patches of varying sizes severely affecting the seasonal
tourist industry. The Murud beach and adjacent rocky
shores were heavily oiled on the 29th May (morning) with
deposits as high as 35 kg/cm2 on the beach. The beach
alone was estimated to have an overburden of over 1000
tonnes of the tarry residue. The oil which entered the
adjacent creeks, oscillated up and down the creeks with
tidal movement and was ultimately trapped in the
interior tidal marshes some of which harboured extensive
mangroves. The oyster beds around the rocky shores were
also affected.
g) The beach tar melted under the summer heat and
2

percolated into the sand spreading the contamination at
least upto 5 cm below surface.
h) Although only Murud coast was monitored, the beaches
upto at least 30 km south also had heavy tarry deposits.
i) The approaching tarry patches caused considerable
deterioration in water quality and localised damages to
plankton. The fishery however did not seem to have
affected.
RECOMMENDATIONS
a) Non-availability of reliable baseline during different
seasons for Bombay High as well as for the vulnerable
coastal regions was glaringly evident during the present
study. A long-term study to evolve the baseline with
respect to water quality sediment quality and biological
characteristics should be initiated forthwith. Such a
study should take into account seasonal changes as well
as natural vulnerability in Bombay High coastal waters
and intertidal flora and fauna.
b) It was evident that local damage was observed in the
areas of investigation. It is therefore essential that
studies of recovering of damaged flora and fauna
including vital intertidal and sub-tidal areas are
3
undertaken. This will evolve understanding of the
impacts and recoveries of tropical ecosystems due to oil
spills which is 1argely lacking and will surve as an
important source of information in future.
a) Impact of Bombay High crude and its weathered products
on detected biota at different trophic levels should be
studied through laboratory simulation experiments.
d) Chemical dispersants and formulations frequently used in
the combating operations are sometimes known to cause
more harm to ecology than crude oil itself. Hence, all
dispersants should be strictly tested for its toxicity
to tropical marine organisms prior to bulk procurement.
Test samples from the bulk stored, should also be
occassionally tested for toxicity to ascertain that the
stock supplied is similar to the sample tested.
4
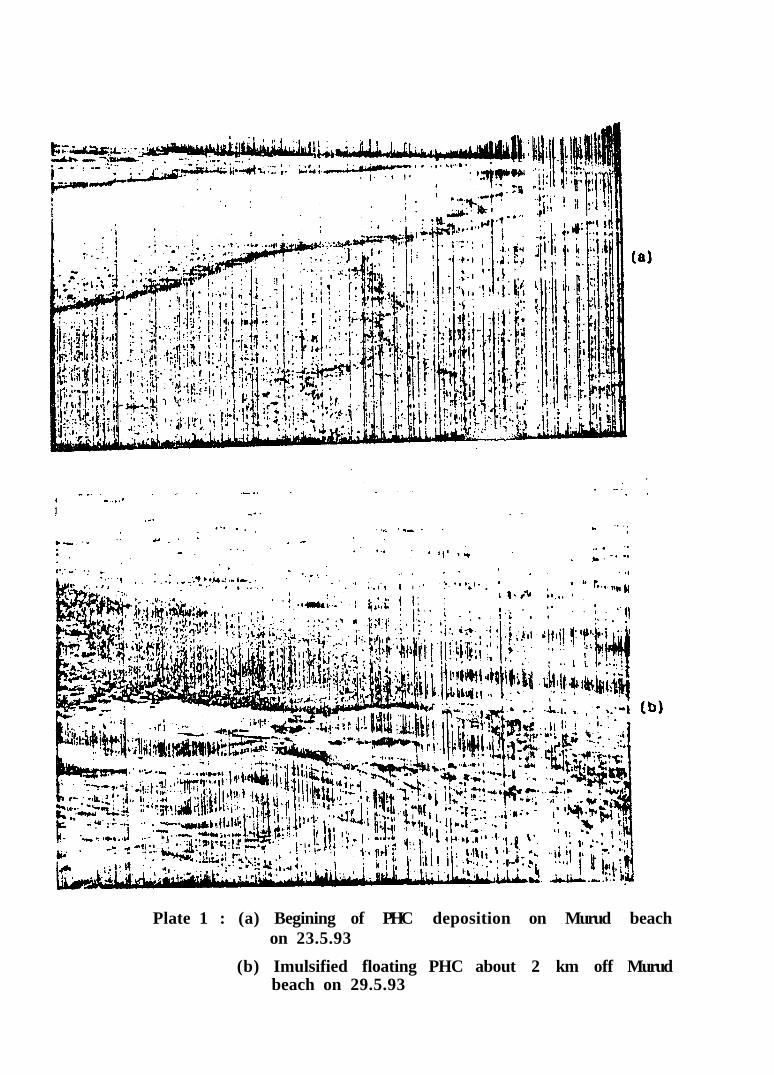
Plate 1 : (a) Begining of PHC deposition on Murud beachon 23.5.93
(b) Imulsified floating PHC about 2 km off Murudbeach on 29.5.93
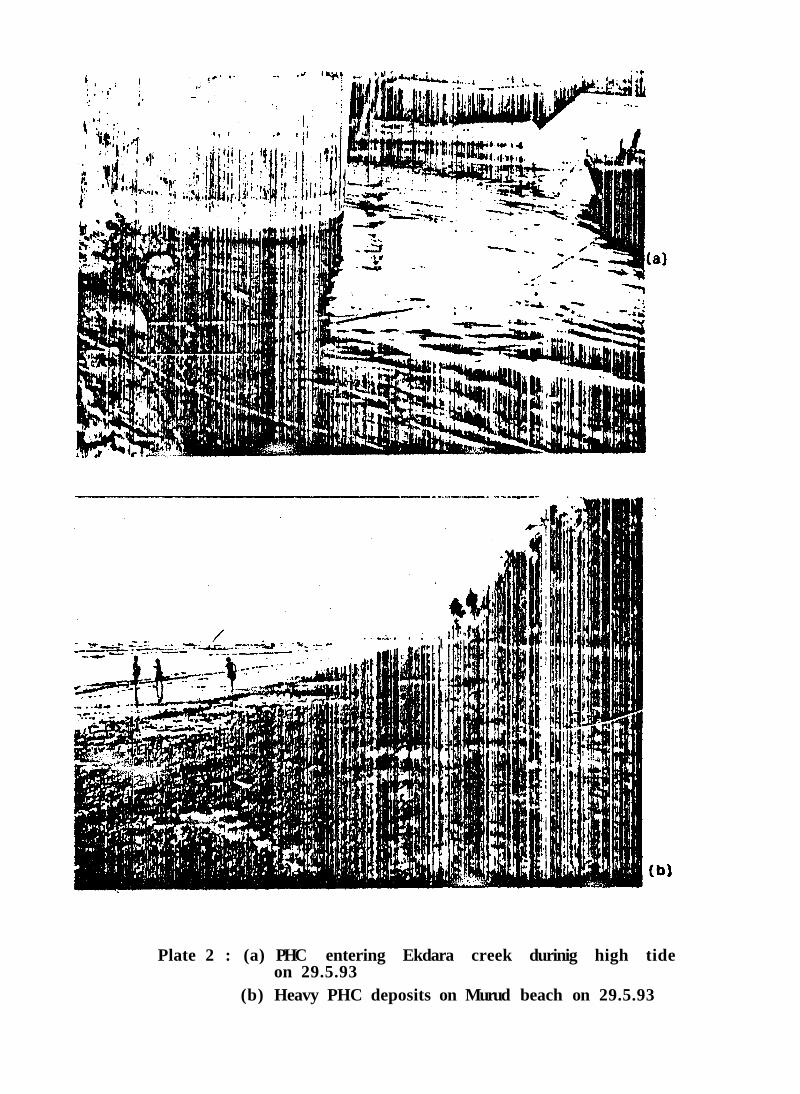
Plate 2 : (a) PHC entering Ekdara creek durinig high tideon 29.5.93
(b) Heavy PHC deposits on Murud beach on 29.5.93
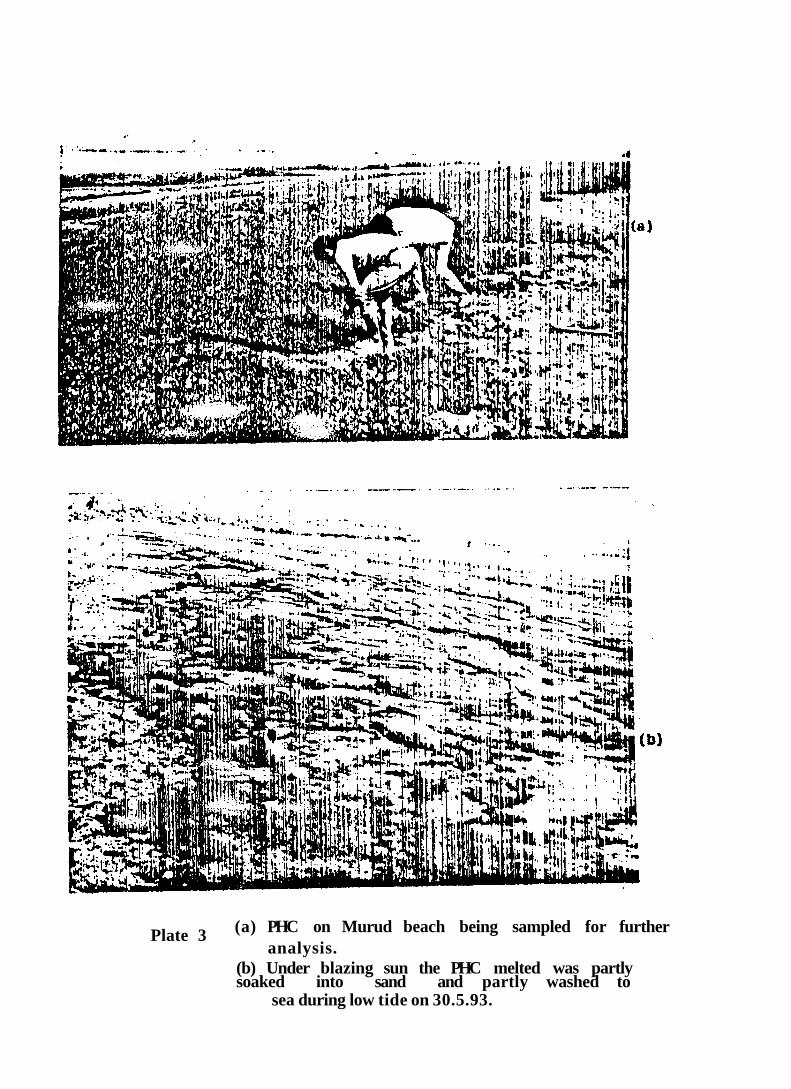
Plate 3 (a) PHC on Murud beach being sampled for furtheranalysis.
(b) Under blazing sun the PHC melted was partlysoaked into sand and partly washed to
sea during low tide on 30.5.93.

Plate 4 : (a) & (b) PHC got trappod in rocky pools on 1.6.93
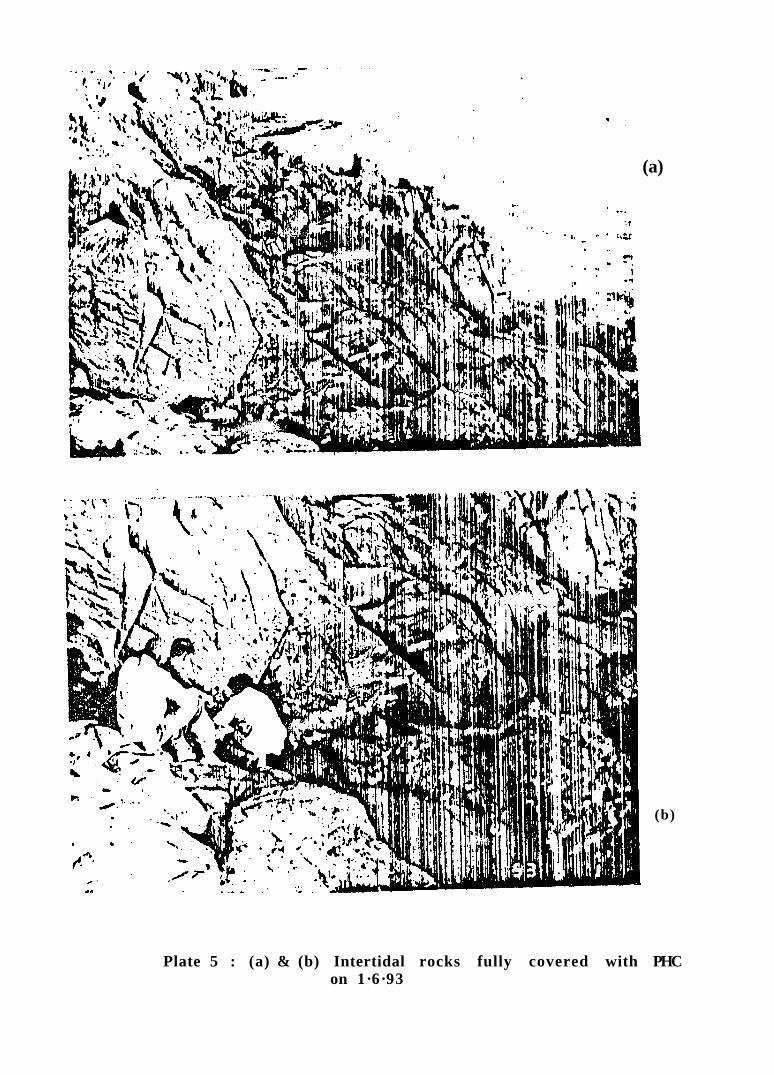
(a)
(b)
Plate 5 : (a) & (b) Intertidal rocks fully covered with PHCon 1·6·93


![Oil Spill Incidents and Their Impacts to Fisheries and Tourism Activities in … · in soil and water [20]. similar damages also occurred in Exxon Valdez oil spill incident in Alaska](https://img.pdfslide.net/doc/110x75/5e4a47c326f1aa7da346a6b5/oil-spill-incidents-and-their-impacts-to-fisheries-and-tourism-activities-in-in.jpg)