Embed Size (px)
Citation preview

1
Oilfield Fluids:
Tales of Mud and Worms
Geoffrey Maitland
Department of Chemical Engineering
Rideal Lecture Wednesday 28th March 2012
Collaborators
Schlumberger: Louise Bailey, Isabelle Couillet,
Trevor Hughes
Imperial College: Edo Boek, John Crawshaw
Utrecht University: Henk Lekkerkerker, Annemieke ten Brinke,
Marcel Vogel, Dzina Kleshchanok
Strasbourg ICS, CNRS Francoise Candau, Jean Candau
Twente University: Wim Briels, Johan Padding (Eindhoven)
Bristol University: Terence Cosgrove, Vania Croce
Cecile Dreiss (KCL) 2
Lecture Outline
• Design of Fluids and Materials
• Advanced Formulation and (More) Systematic Design of Fluids
• The Worm’s Tale
• Smarter Fracturing Fluids
• The Potter’s Tale
• Clays for Drilling Fluids – enhancing performance
• Some Conclusions
3
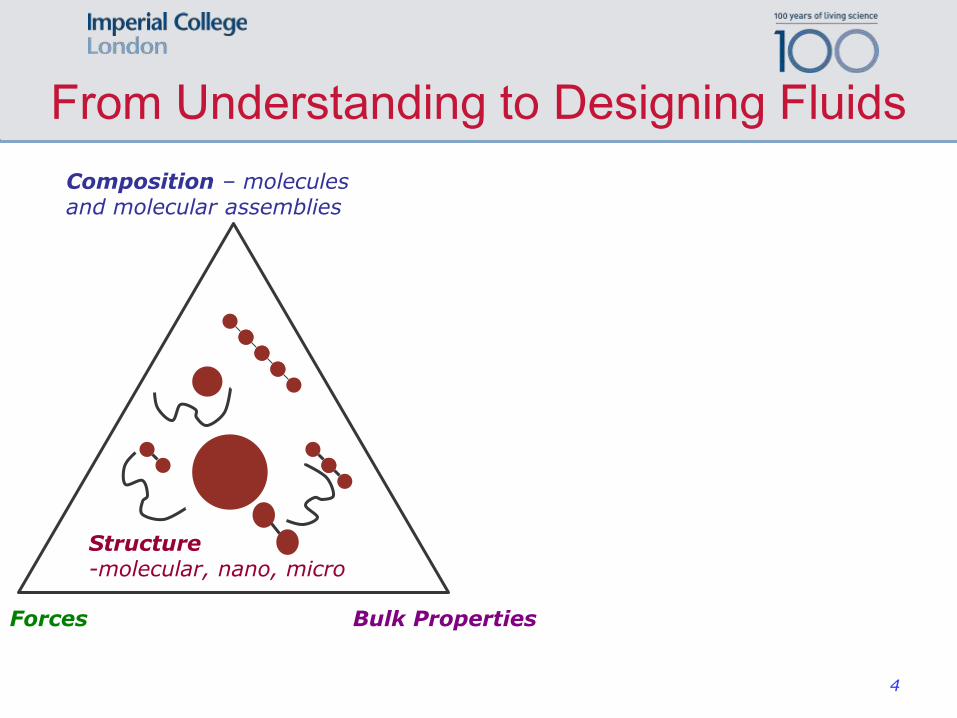
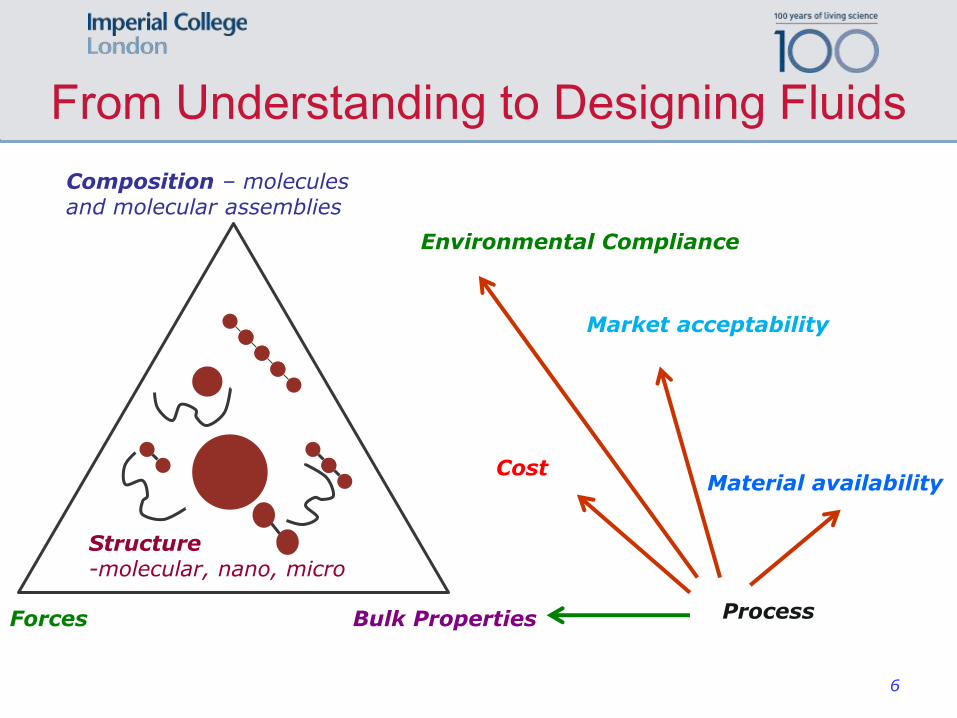
From Understanding to Designing Fluids
4
Composition – molecules and molecular assemblies
Forces Bulk Properties
Structure -molecular, nano, micro
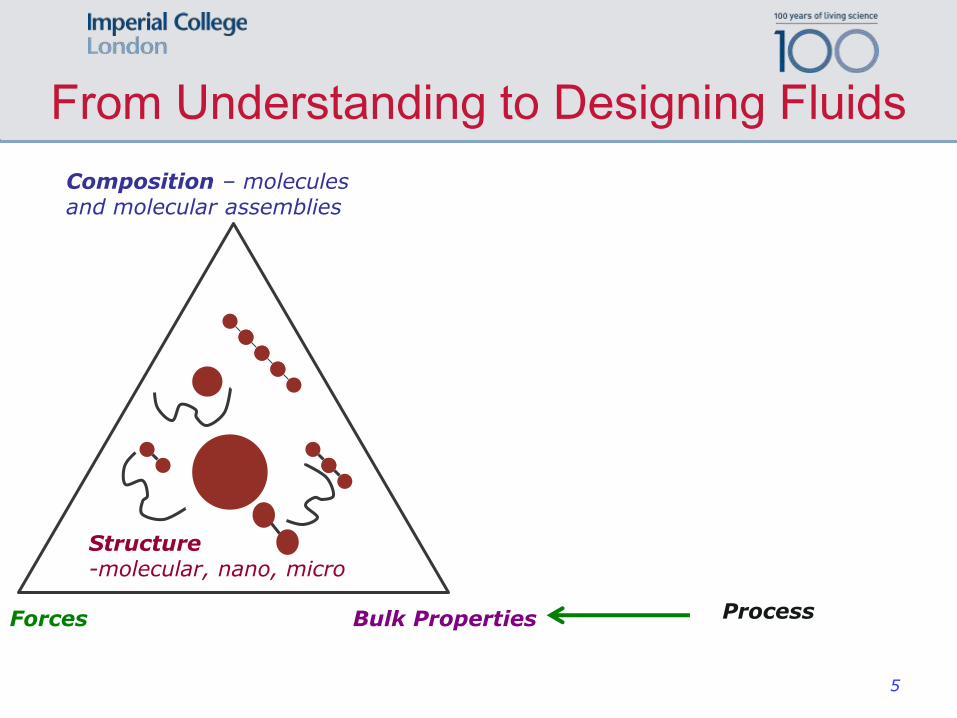
From Understanding to Designing Fluids
5
Composition – molecules and molecular assemblies
Forces Bulk Properties
Structure -molecular, nano, micro
Process
From Understanding to Designing Fluids
6
Composition – molecules and molecular assemblies
Forces Bulk Properties
Structure -molecular, nano, micro
Process
Cost Material availability
Market acceptability
Environmental Compliance
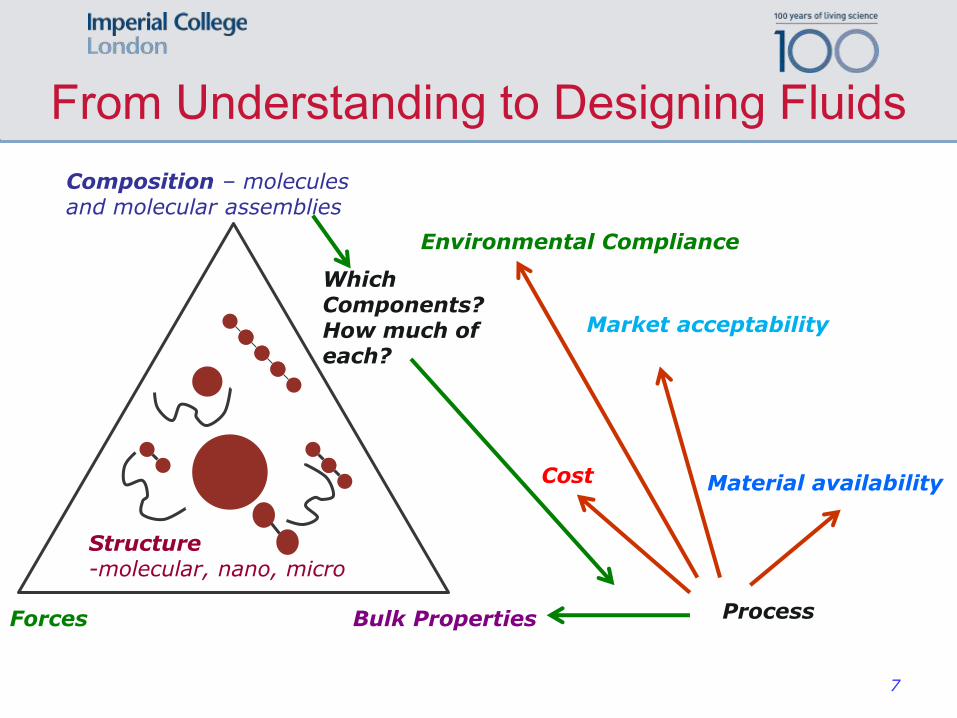
From Understanding to Designing Fluids
7
Composition – molecules and molecular assemblies
Forces Bulk Properties
Structure -molecular, nano, micro
Process
Cost Material availability
Market acceptability
Environmental Compliance
Which Components? How much of each?
8
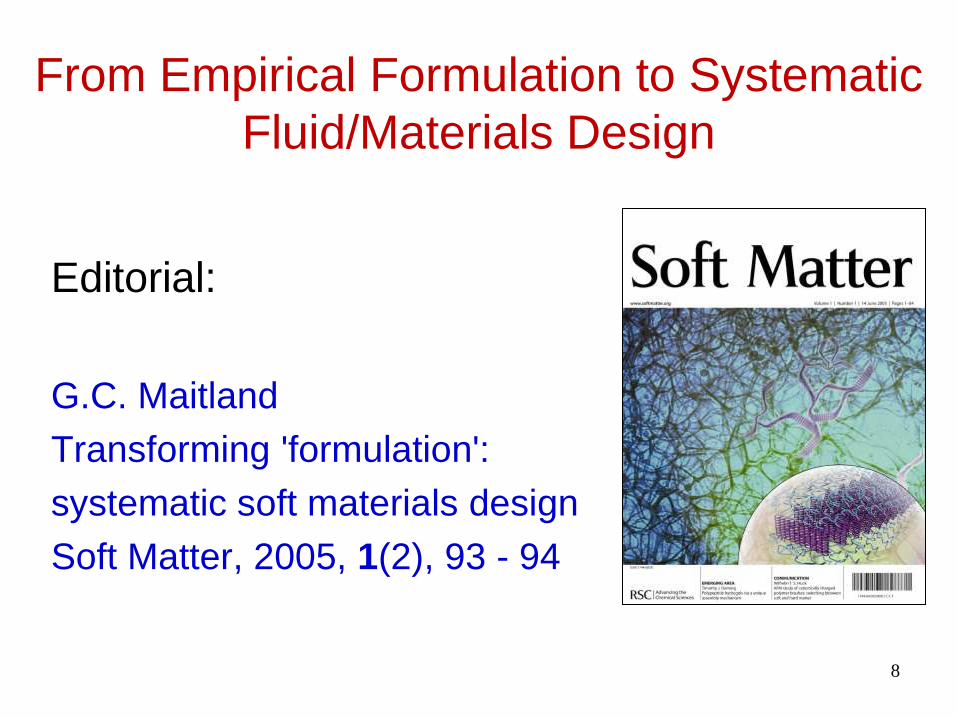
From Empirical Formulation to Systematic
Fluid/Materials Design
Editorial:
G.C. Maitland
Transforming 'formulation':
systematic soft materials design
Soft Matter, 2005, 1(2), 93 - 94
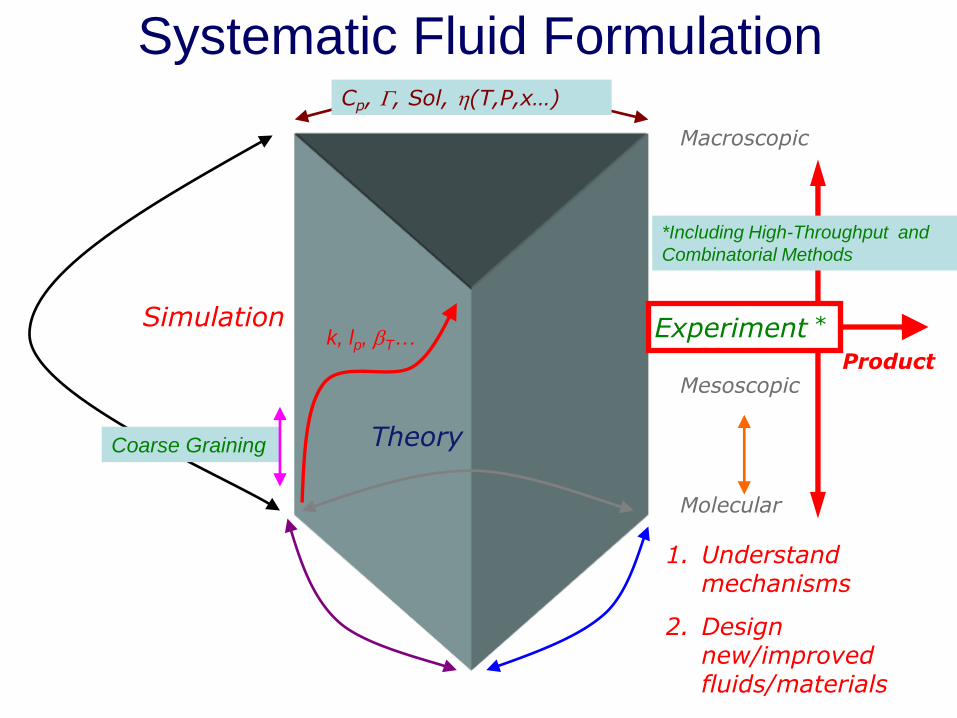
Systematic Fluid Formulation
Experiment Simulation
Theory
Macroscopic
Molecular
Mesoscopic
k, lp, bT… *
1. Understand mechanisms
2. Design new/improved fluids/materials
Cp, G, Sol, h(T,P,x…)
Coarse Graining
*Including High-Throughput and
Combinatorial Methods
Product
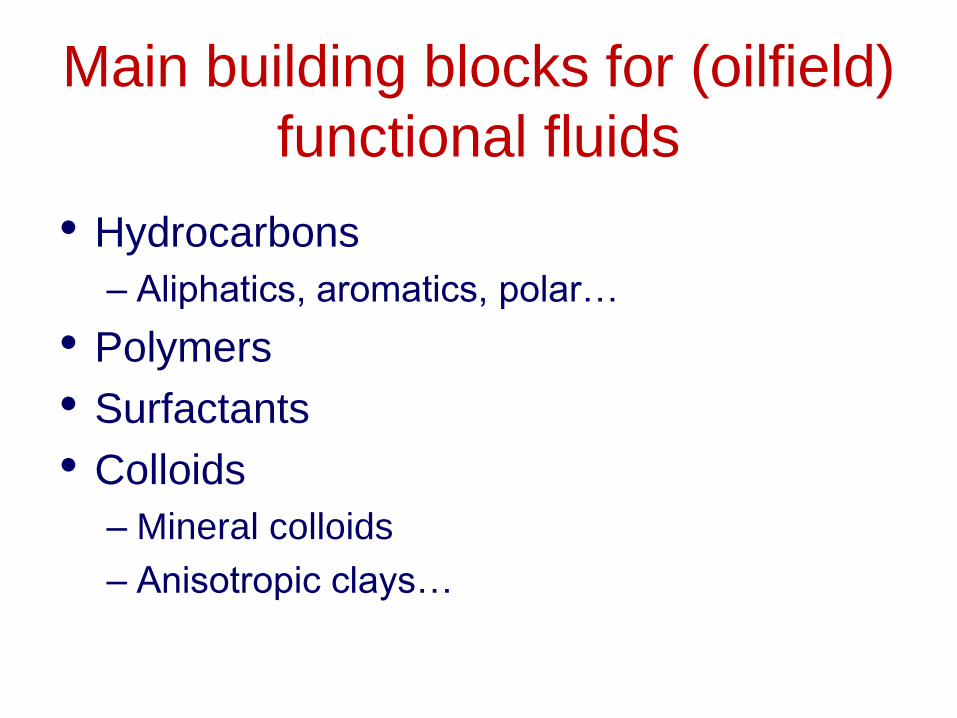
Main building blocks for (oilfield)
functional fluids
• Hydrocarbons
– Aliphatics, aromatics, polar…
• Polymers
• Surfactants
• Colloids
– Mineral colloids
– Anisotropic clays…
11
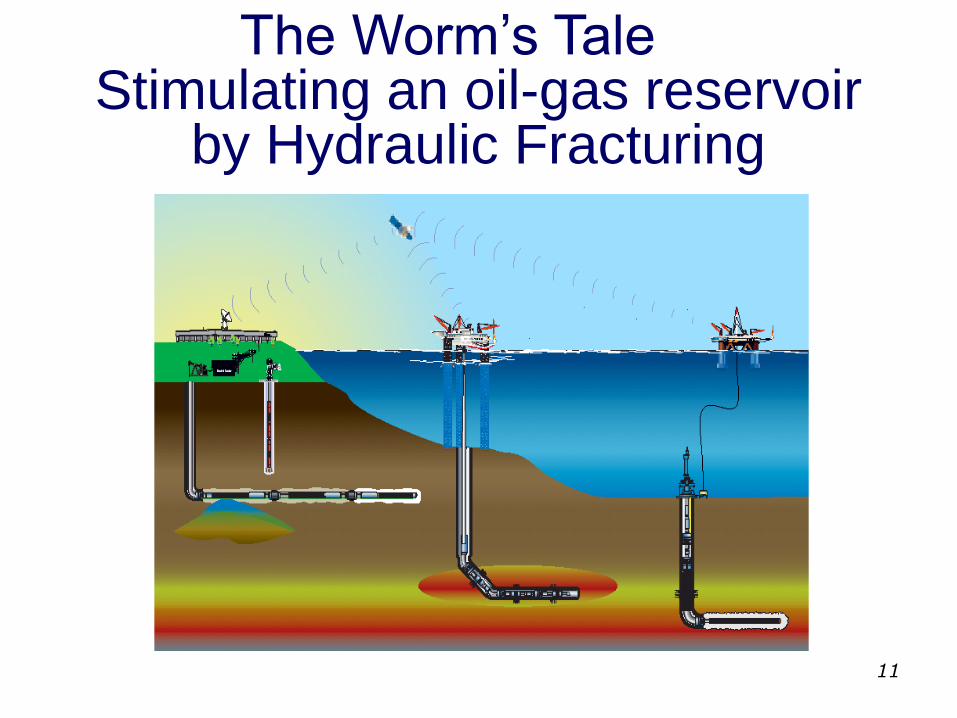
The Worm’s Tale Stimulating an oil-gas reservoir
by Hydraulic Fracturing
12
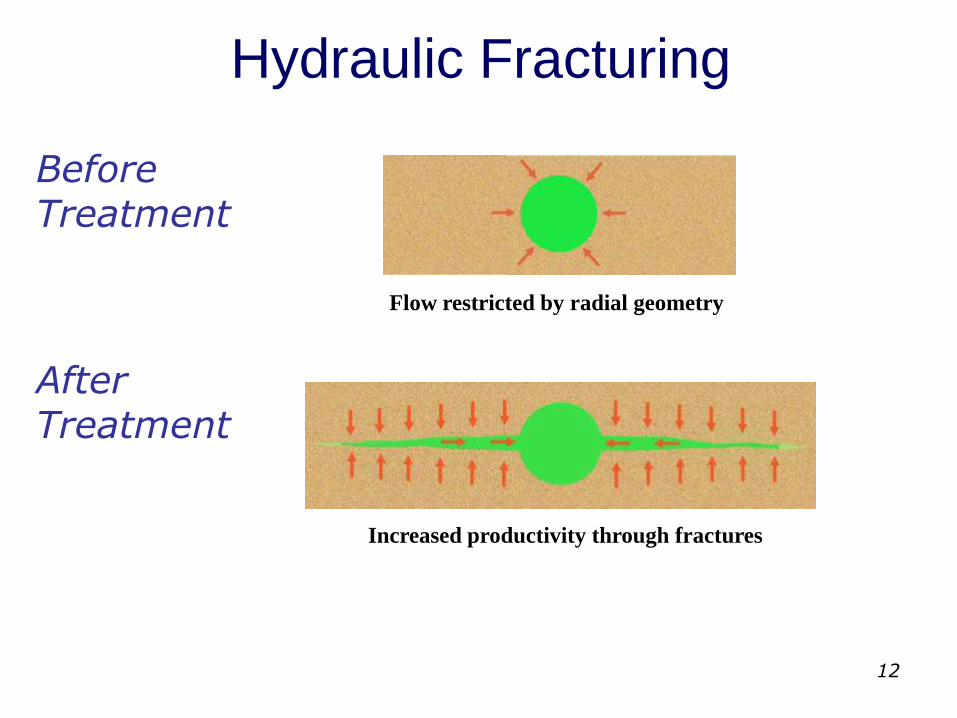
Hydraulic Fracturing
Flow restricted by radial geometry
Increased productivity through fractures
Before Treatment
After Treatment
13
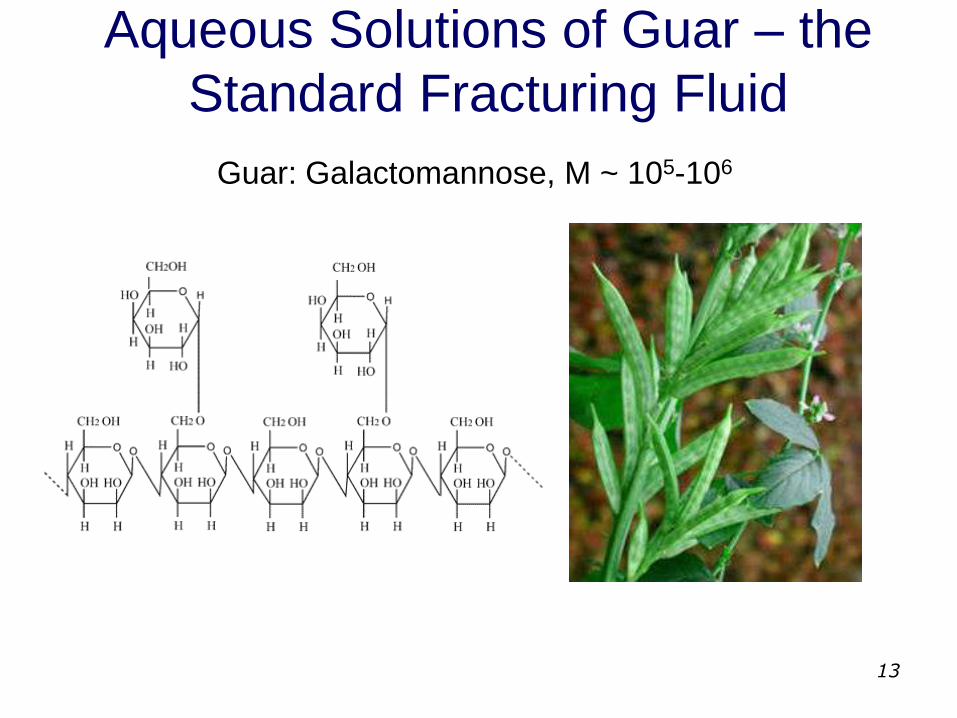
Aqueous Solutions of Guar – the
Standard Fracturing Fluid
Guar: Galactomannose, M ~ 105-106
14
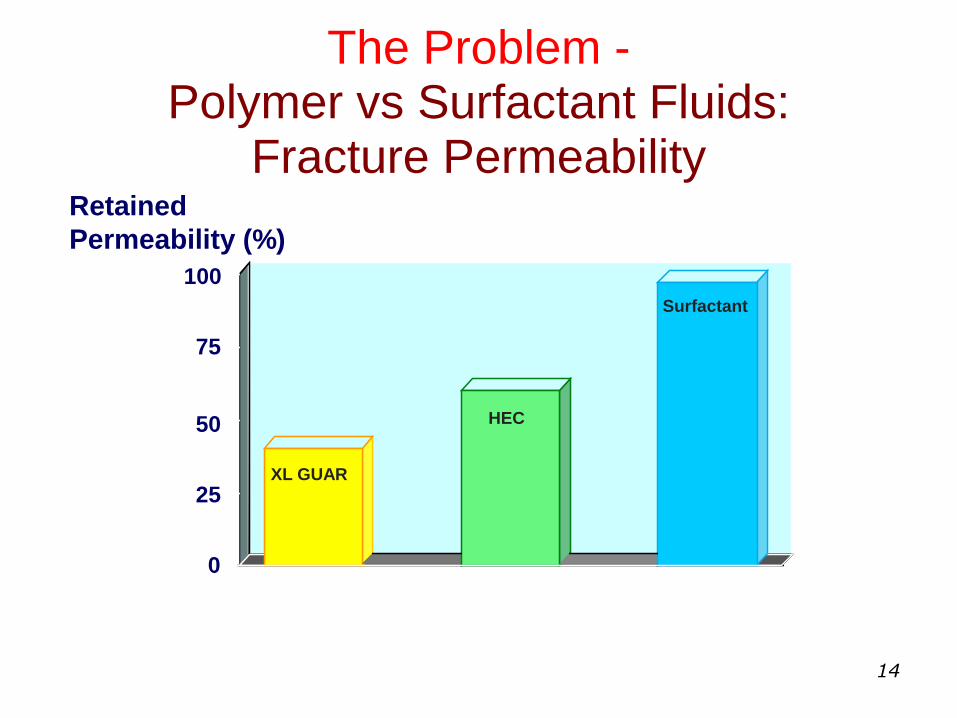
The Problem - Polymer vs Surfactant Fluids:
Fracture Permeability
100
75
50
25
0
XL GUAR
HEC
Retained
Permeability (%)
Surfactant
15
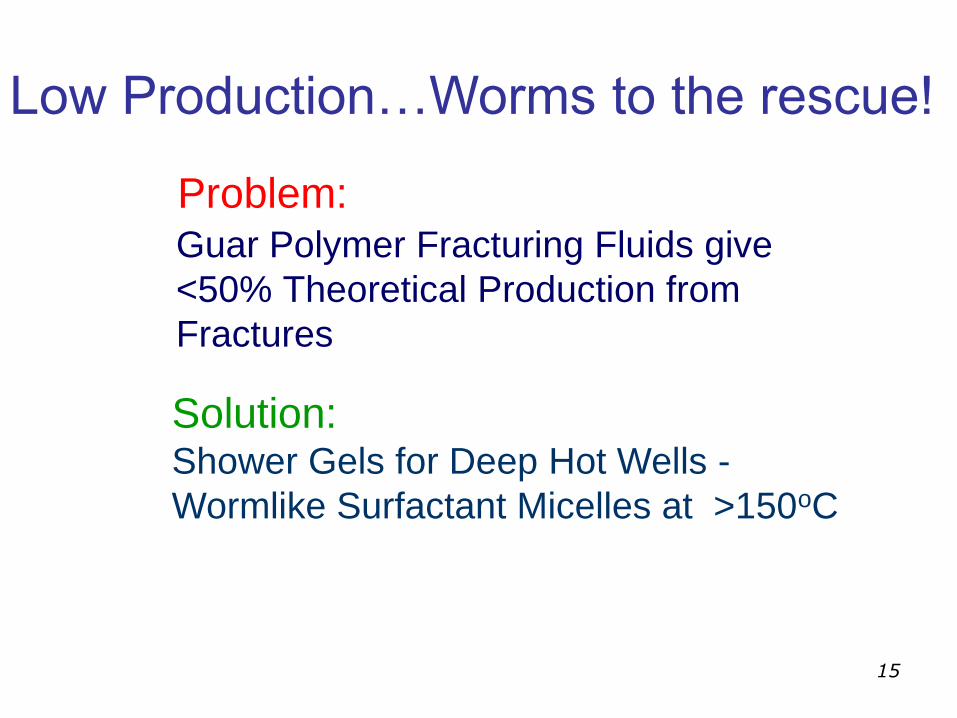
Problem: Guar Polymer Fracturing Fluids give
<50% Theoretical Production from
Fractures
Solution: Shower Gels for Deep Hot Wells -
Wormlike Surfactant Micelles at >150oC
Low Production…Worms to the rescue!
16
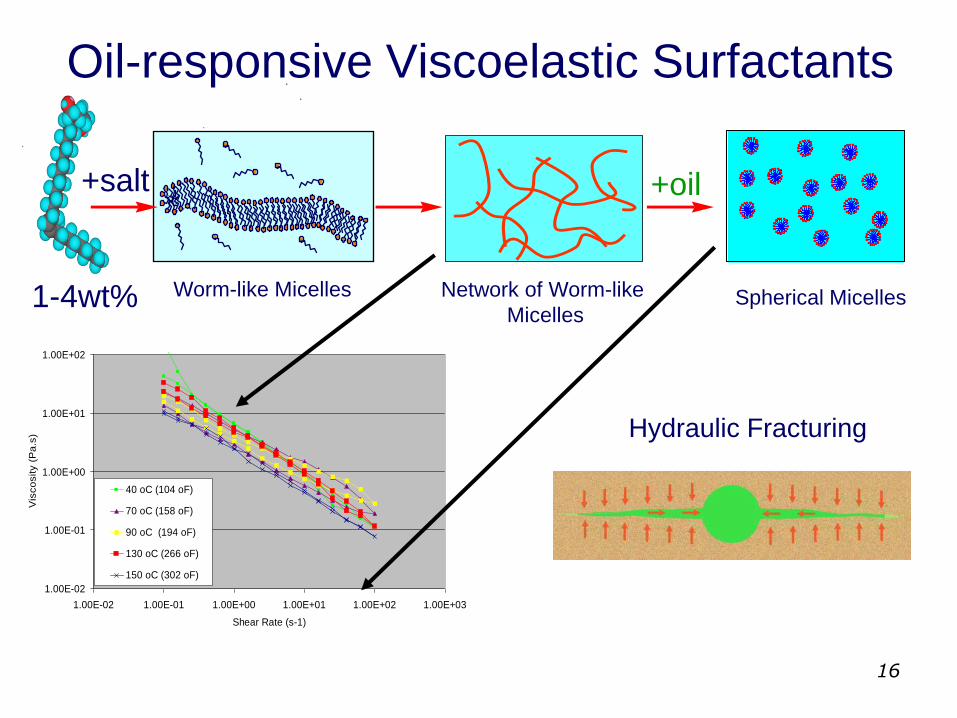
Oil-responsive Viscoelastic Surfactants
Worm-like Micelles Network of Worm-like
Micelles Spherical Micelles
1.00E-02
1.00E-01
1.00E+00
1.00E+01
1.00E+02
1.00E-02 1.00E-01 1.00E+00 1.00E+01 1.00E+02 1.00E+03
Shear Rate (s-1)
Vis
co
sity (
Pa
.s)
40 oC (104 oF)
70 oC (158 oF)
90 oC (194 oF)
130 oC (266 oF)
150 oC (302 oF)
Hydraulic Fracturing
+oil +salt
1-4wt%

One Source of Worms...
17
18
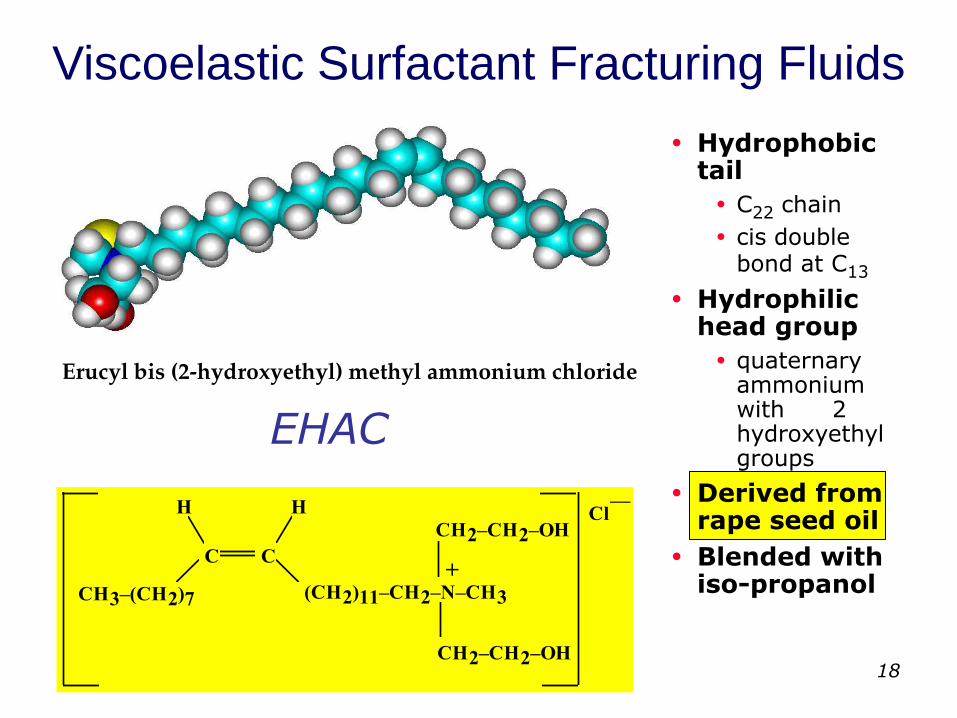
Viscoelastic Surfactant Fracturing Fluids
• • Hydrophobic
tail
• C22 chain
• cis double bond at C13
• Hydrophilic head group
• quaternary ammonium with 2 hydroxyethyl groups
• Derived from rape seed oil
• Blended with iso-propanol
CH3–(CH2)7
C C
HH
(CH2)11–CH2–N–CH3
CH2–CH2–OH
CH2–CH2–OH
+
—Cl
Erucyl bis (2-hydroxyethyl) methyl ammonium chloride
EHAC
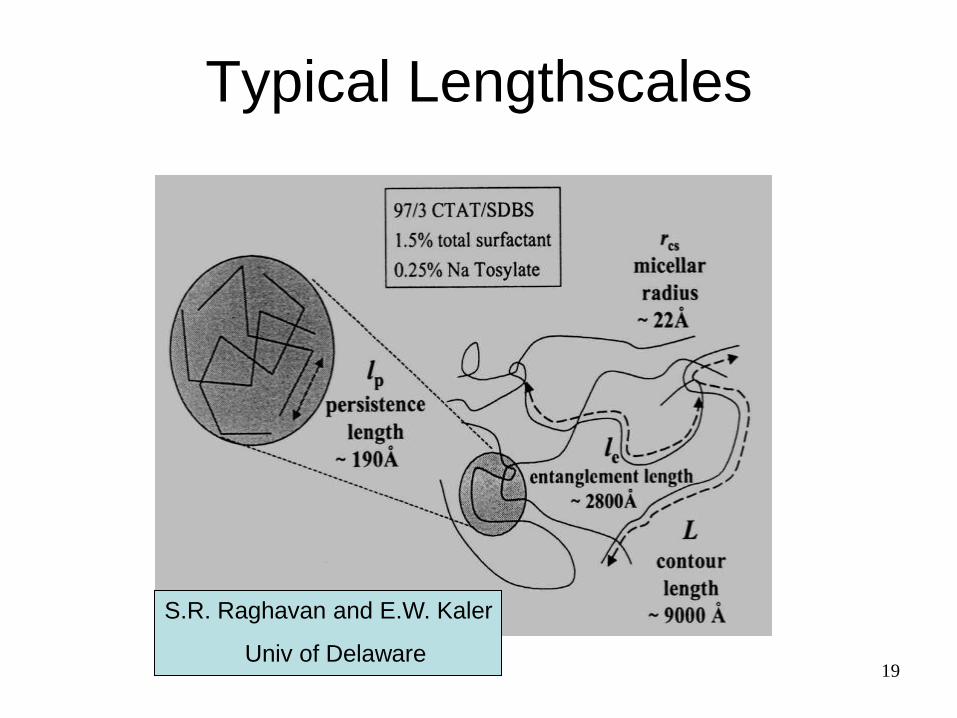
19
Typical Lengthscales
S.R. Raghavan and E.W. Kaler
Univ of Delaware
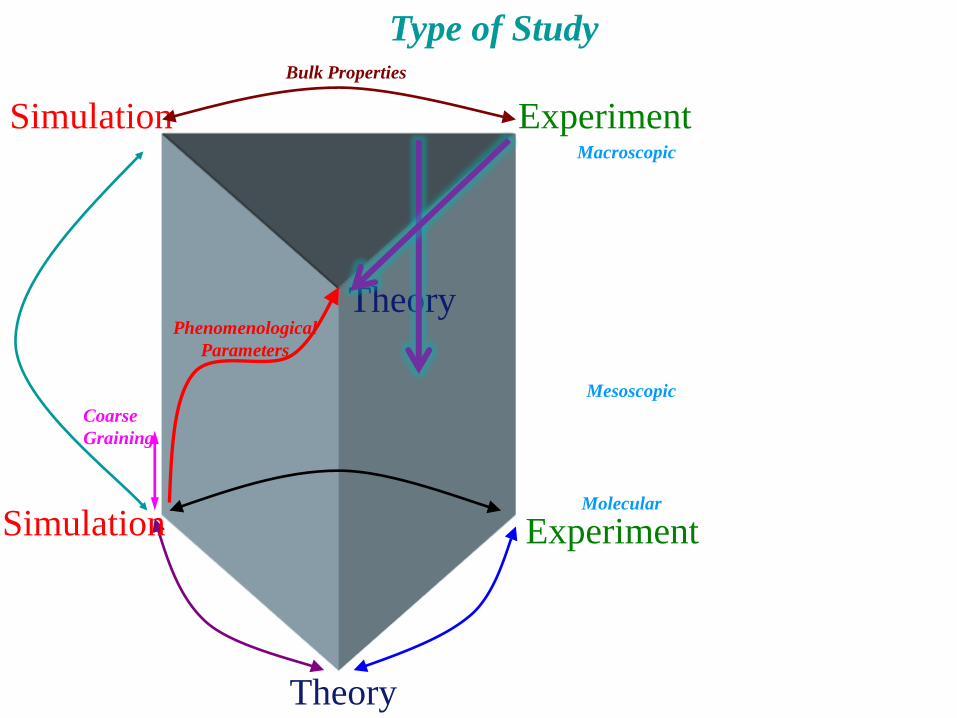
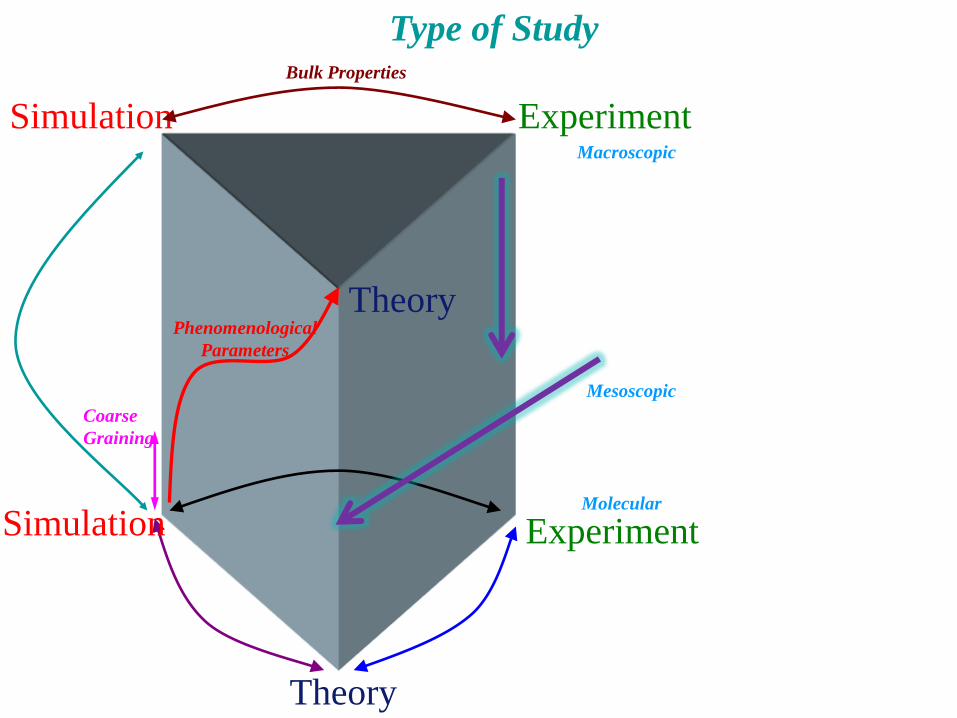
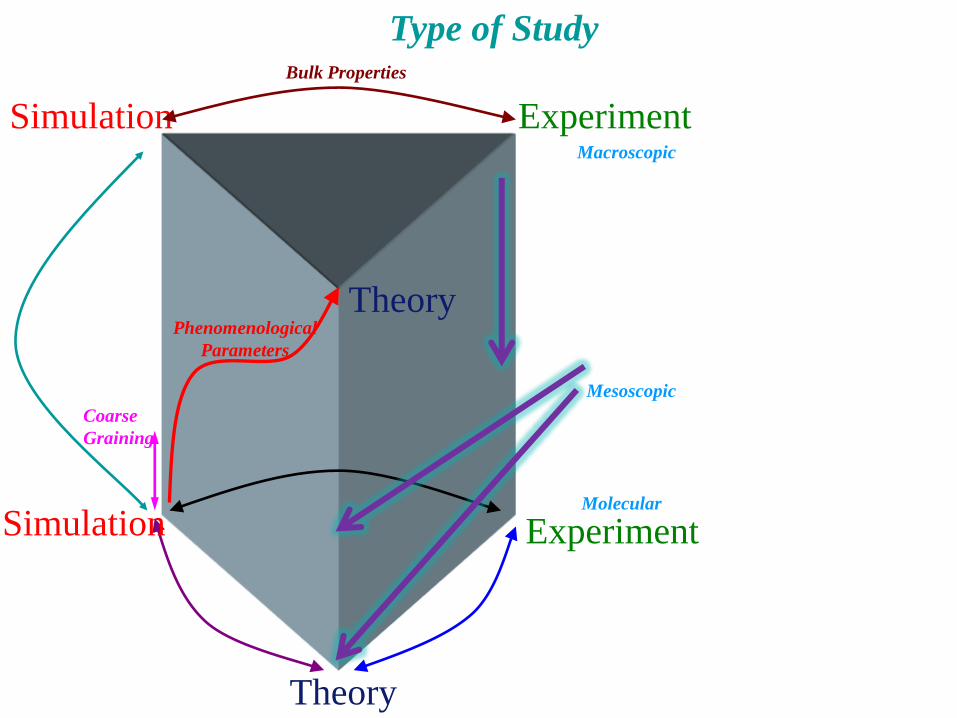
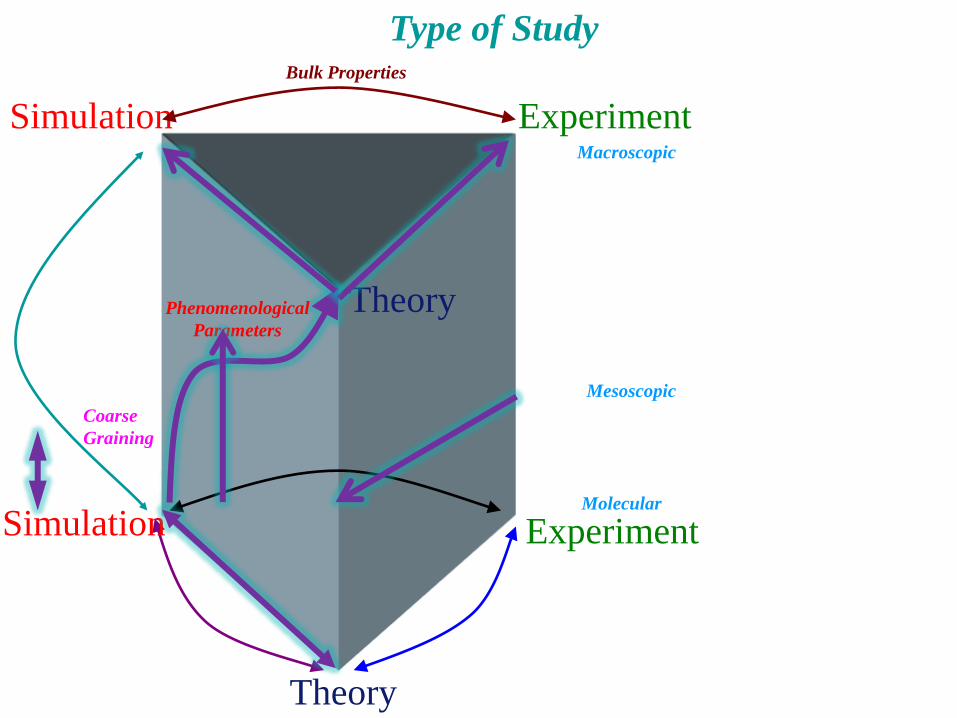
Bulk Properties
Simulation
Theory Phenomenological
Parameters
Simulation
Theory
Experiment Macroscopic
Molecular
Mesoscopic
Experiment
Coarse
Graining
Type of Study

Bulk Rheology
Continuous Shear Flow
22
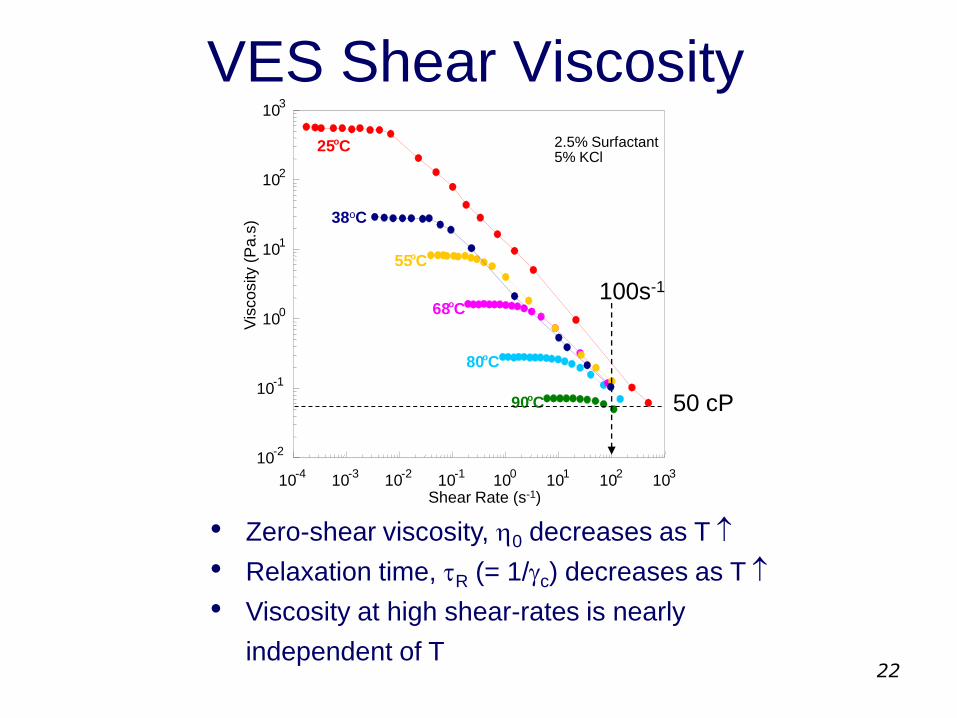
VES Shear Viscosity
10 -4
10 -3
10 -2
10 -1
10 0
10 1
10 2
10 3
10 -2
10 -1
10 0
10 1
10 2
10 3
25 o C
68 o C
90 o C
38oC
55 o C
80 o C
Shear Rate (s-1)
Vis
cosity (
Pa
.s)
2.5% Surfactant 5% KCl
• Zero-shear viscosity, h0 decreases as T
• Relaxation time, tR (= 1/gc) decreases as T
• Viscosity at high shear-rates is nearly
independent of T
100s-1
50 cP
23
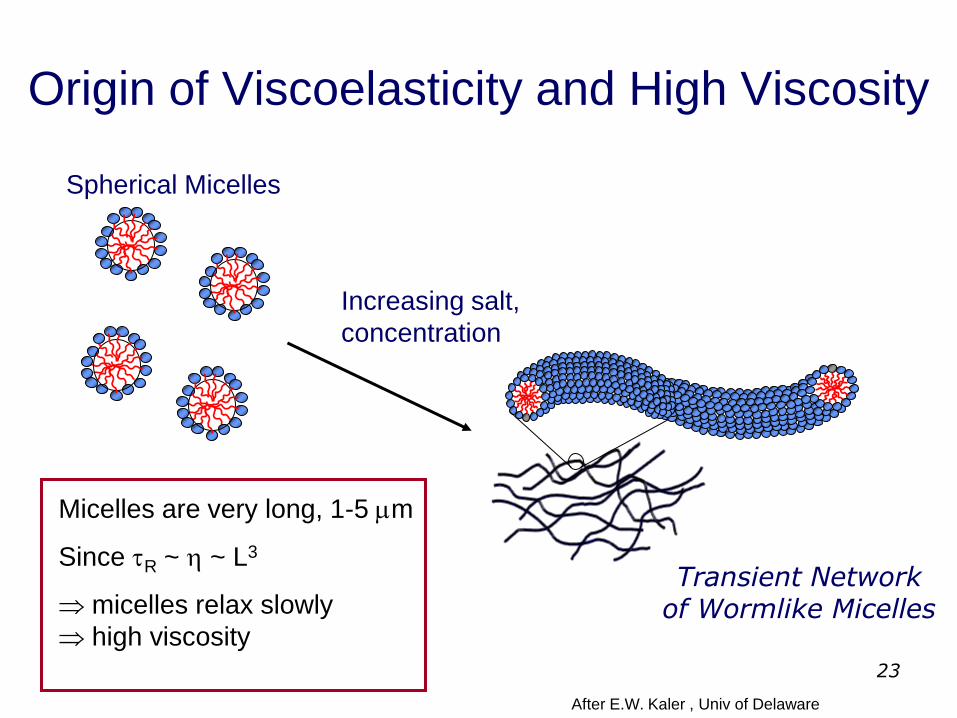
Origin of Viscoelasticity and High Viscosity
Spherical Micelles
Increasing salt,
concentration
Micelles are very long, 1-5 mm
Since tR ~ h ~ L3
micelles relax slowly
high viscosity
Transient Network of Wormlike Micelles
After E.W. Kaler , Univ of Delaware

Bulk Rheology
Oscillatory Shear Flow
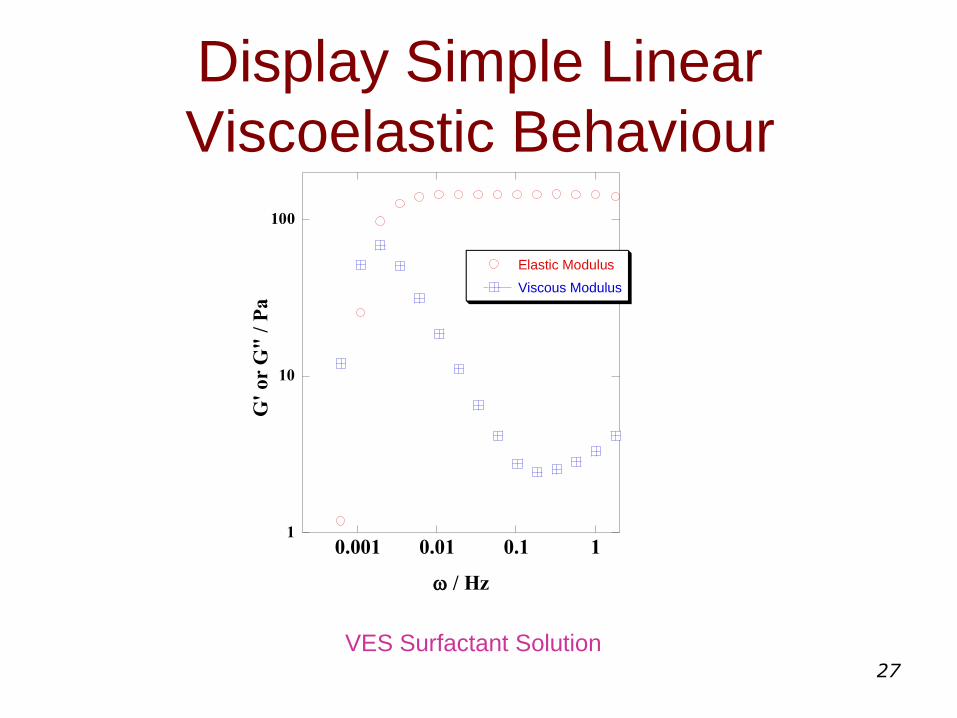
27
Display Simple Linear
Viscoelastic Behaviour
1
10
100
0.001 0.01 0.1 1
Elastic Modulus
Viscous Modulus
G'
or
G"
/ P
a
/ Hz
VES Surfactant Solution
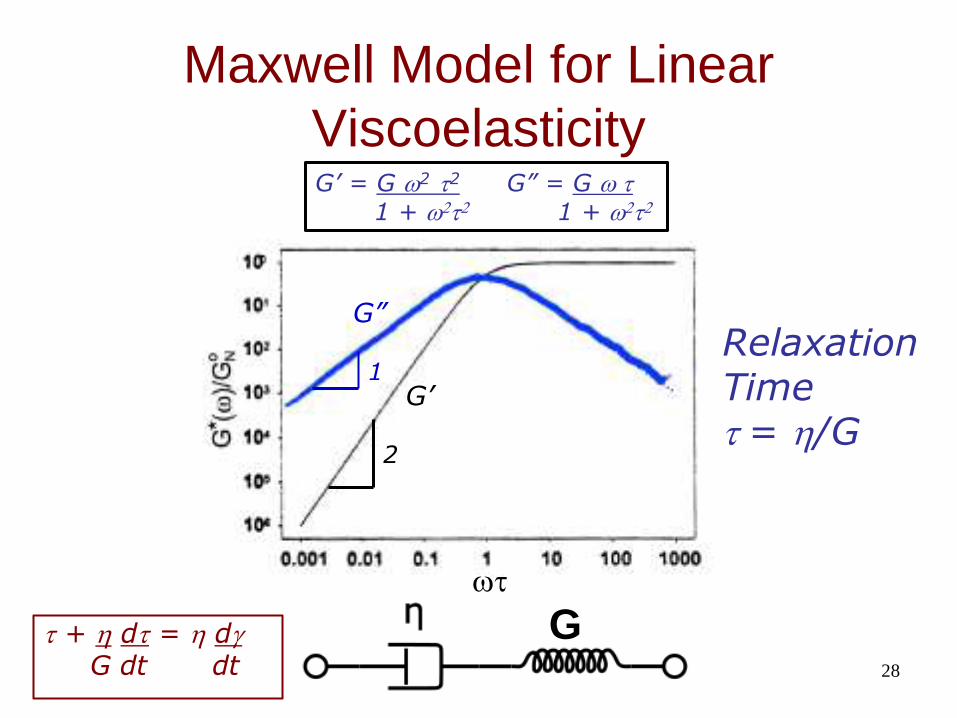
Maxwell Model for Linear
Viscoelasticity
28
G’ = G 2 t2 G” = G t
1 + 2t2 1 + 2t2
G t
Relaxation Time t = h/G
1
2
G’
G”
t + h dt = h dg
G dt dt
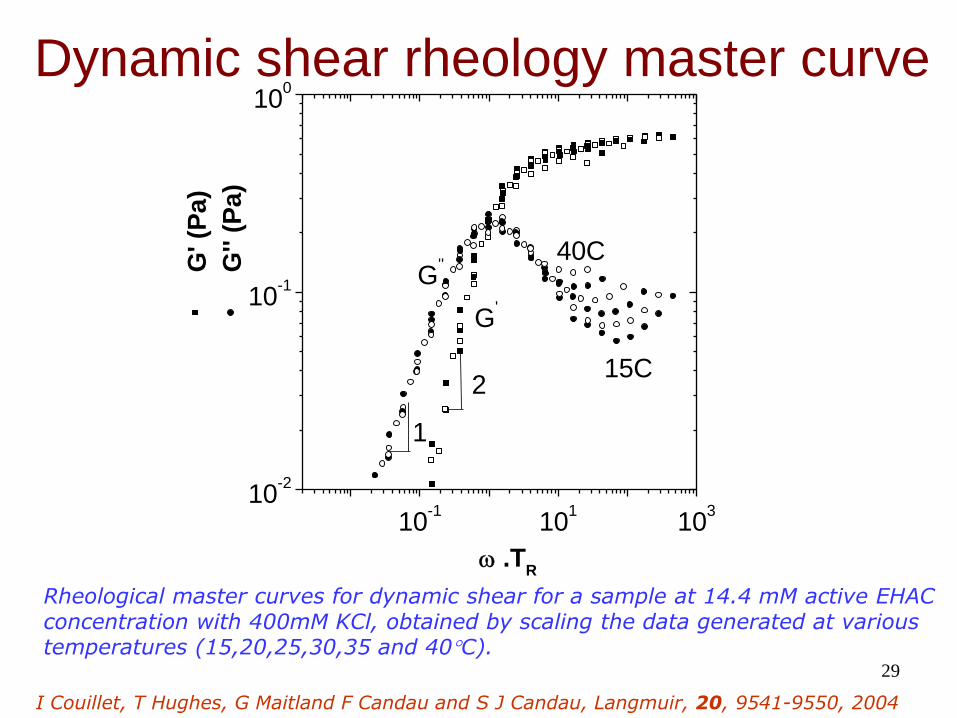
29
Dynamic shear rheology master curve
10-1
101
103
10-2
10-1
100
40C
15C2
1
G'
G'' G
' (P
a)
G''
(Pa)
.TR
Rheological master curves for dynamic shear for a sample at 14.4 mM active EHAC concentration with 400mM KCl, obtained by scaling the data generated at various temperatures (15,20,25,30,35 and 40C).
I Couillet, T Hughes, G Maitland F Candau and S J Candau, Langmuir, 20, 9541-9550, 2004
30
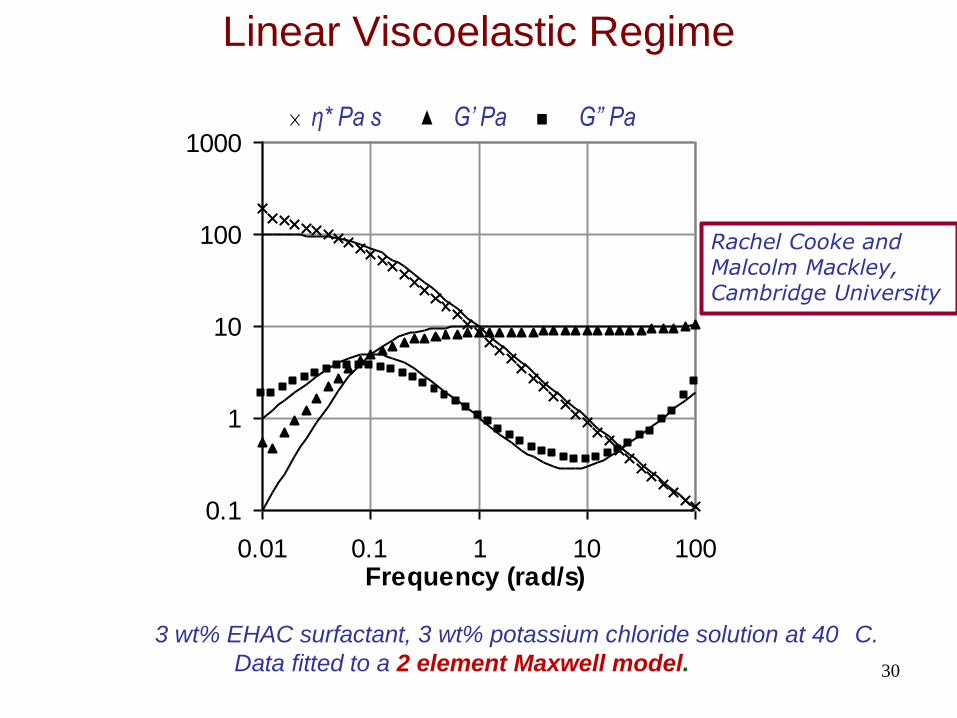
Linear Viscoelastic Regime
0.1
1
10
100
1000
0.01 0.1 1 10 100Frequency (rad/s)
3 wt% EHAC surfactant, 3 wt% potassium chloride solution at 40 C.
Data fitted to a 2 element Maxwell model.
η* Pa s G’ Pa G” Pa
Rachel Cooke and Malcolm Mackley, Cambridge University
31
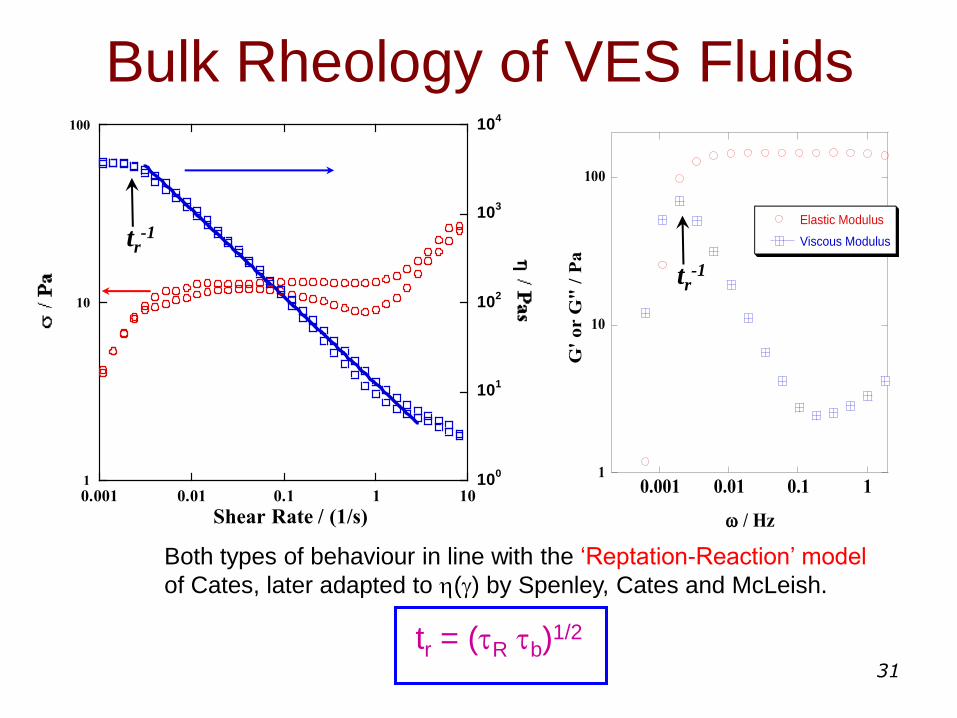
Bulk Rheology of VES Fluids
1
10
100
0.001 0.01 0.1 1
Elastic Modulus
Viscous Modulus
G'
or G
" /
Pa
/ Hz
tr-1
1
10
100
100
101
102
103
104
0.001 0.01 0.1 1 10
Shear Rate / (1/s)
tr-1
Both types of behaviour in line with the ‘Reptation-Reaction’ model
of Cates, later adapted to h(g) by Spenley, Cates and McLeish.
tr = (tR tb)1/2
Bulk Properties
Simulation
Theory Phenomenological
Parameters
Simulation
Theory
Experiment Macroscopic
Molecular
Mesoscopic
Experiment
Coarse
Graining
Type of Study
33
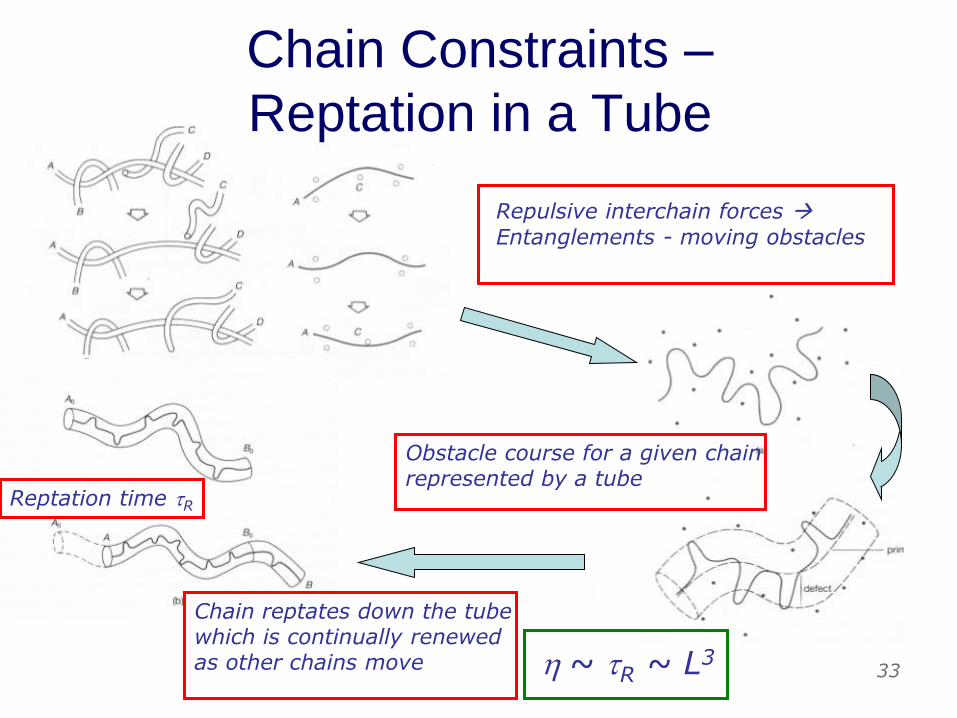
Chain Constraints –
Reptation in a Tube
Chain reptates down the tube which is continually renewed as other chains move
Repulsive interchain forces
Entanglements - moving obstacles
Obstacle course for a given chain represented by a tube
h ~ tR ~ L3
Reptation time tR

34
Cates-type models • Assume two main processes:
– Reptation, trep
– Chain scission-rehealing, tbr = (KL)-1
• Slow scission limit, tbr >> trep
– Terminal relaxation time tR = trep
h0 = L3c15/4
• Fast breaking limit, tbr << trep
tR = (tbrtrep)1/2
Maxwell behaviour for G’, G’’ with t = tR
h0 ~ Lc3
• Rouse modes at higher frequency if tRouse < tbr
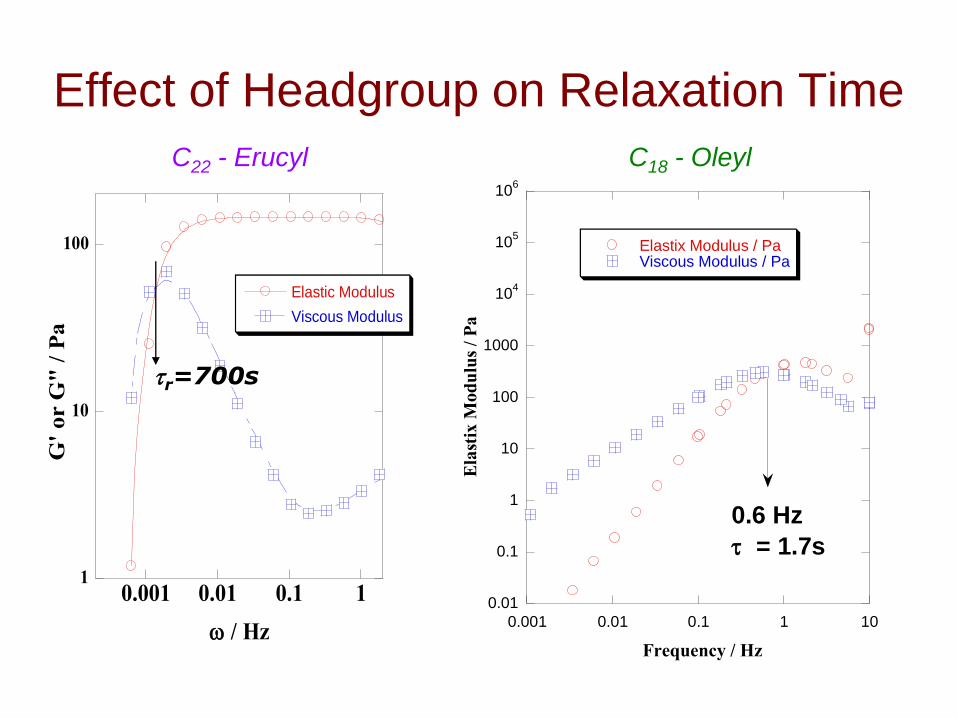
Effect of Headgroup on Relaxation Time
1
10
100
0.001 0.01 0.1 1
Elastic Modulus
Viscous Modulus
G'
or G
" /
Pa
/ Hz
tr=700s
0.01
0.1
1
10
100
1000
104
105
106
0.001 0.01 0.1 1 10
Kesbos at 1 Hz 0.05 strain
Elastix Modulus / PaViscous Modulus / Pa
Ela
stix
Mod
ulu
s /
Pa
Frequency / Hz
0.6 Hz
t = 1.7s
C18 - Oleyl C22 - Erucyl
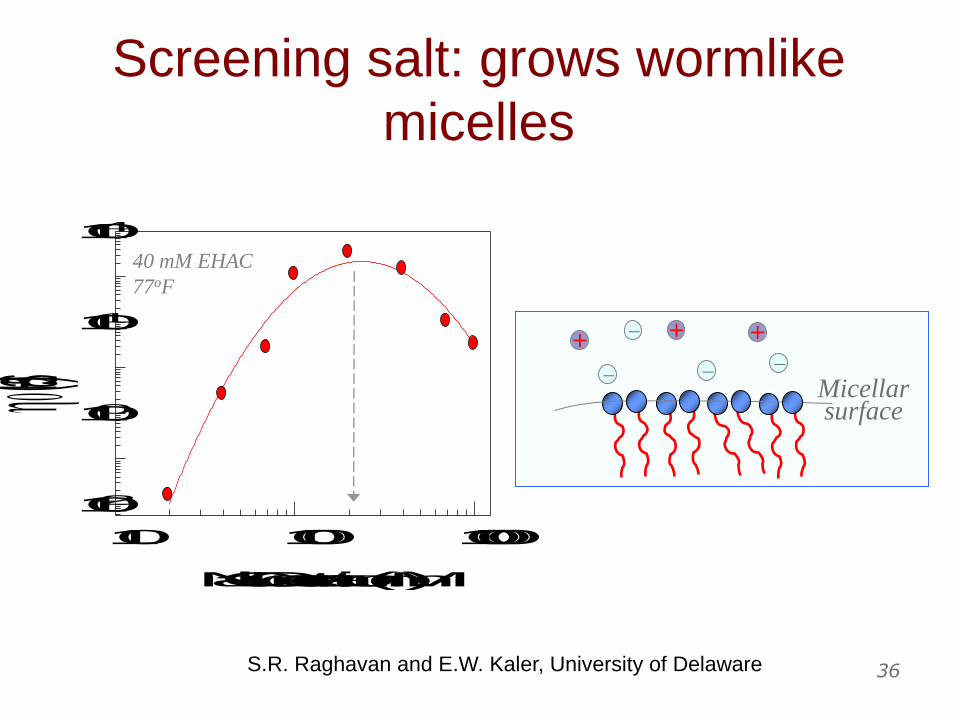
36
Screening salt: grows wormlike
micelles
NaCl Concentration (mM)
10 100 1000
h (Pa.s)
10-2
100
101
104
40 mM EHAC
77oF
Micellar surface
+
+ +
S.R. Raghavan and E.W. Kaler, University of Delaware
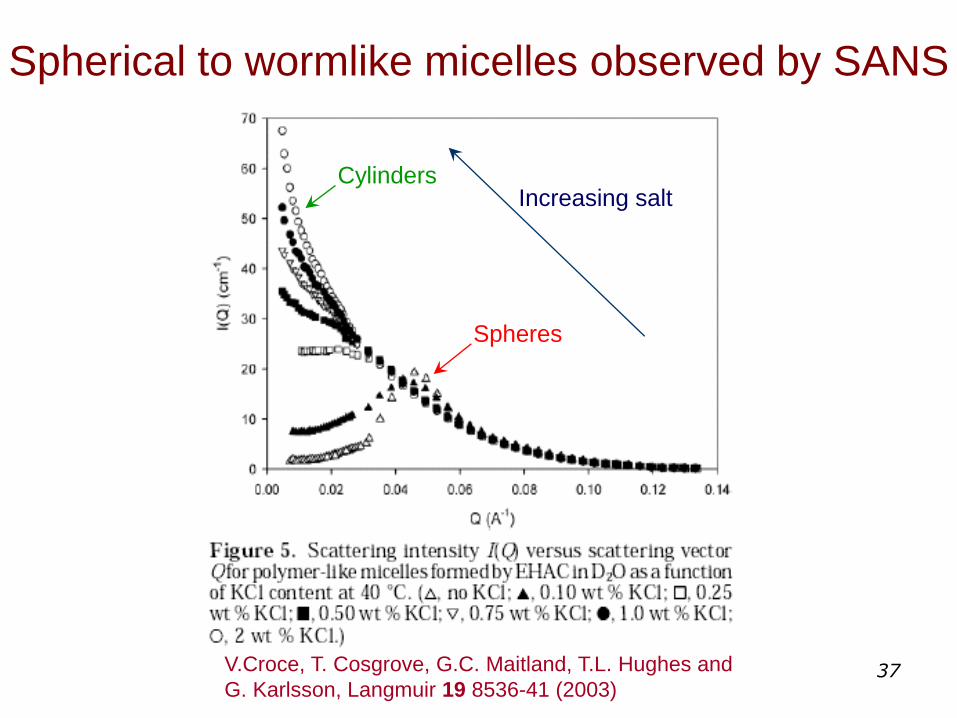
37
Spherical to wormlike micelles observed by SANS
Spheres
Cylinders Increasing salt
V.Croce, T. Cosgrove, G.C. Maitland, T.L. Hughes and
G. Karlsson, Langmuir 19 8536-41 (2003)
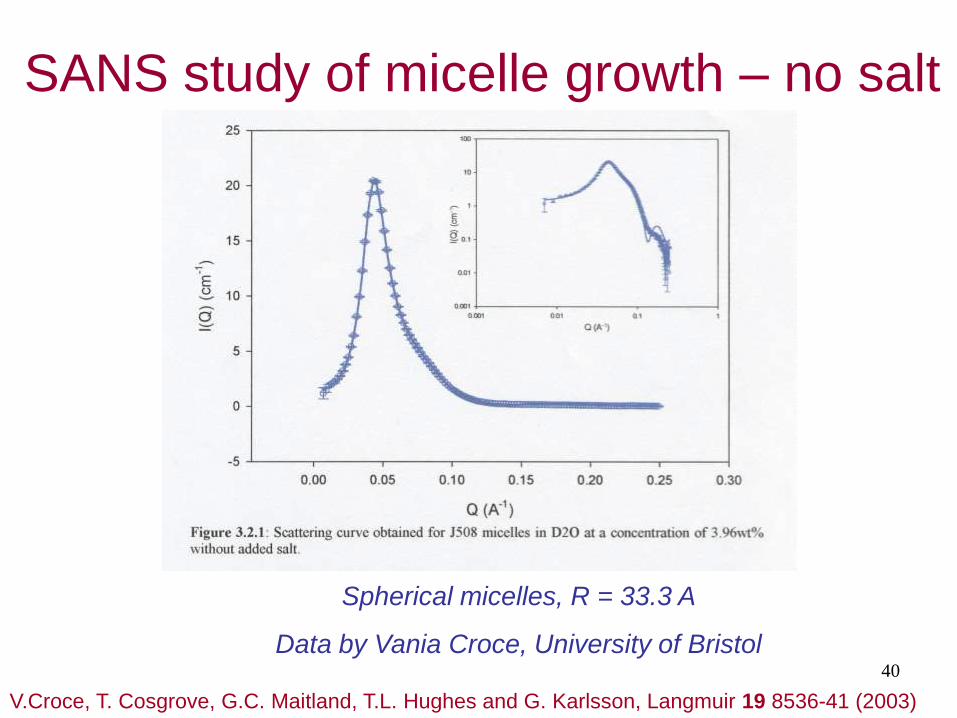
40
SANS study of micelle growth – no salt
Spherical micelles, R = 33.3 A
Data by Vania Croce, University of Bristol
V.Croce, T. Cosgrove, G.C. Maitland, T.L. Hughes and G. Karlsson, Langmuir 19 8536-41 (2003)
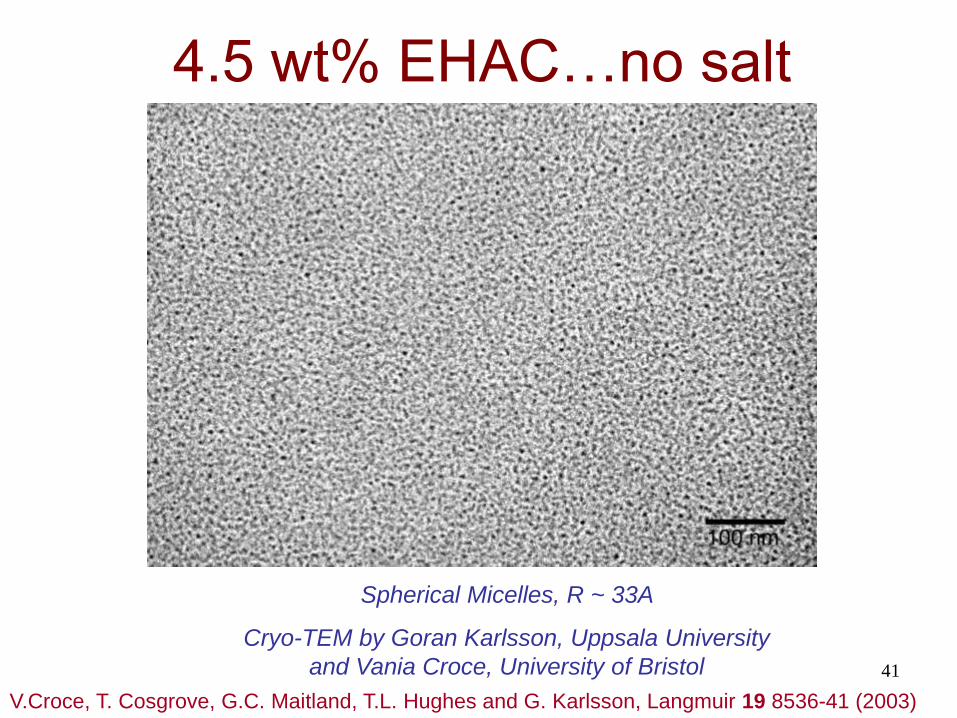
41
4.5 wt% EHAC…no salt
Spherical Micelles, R ~ 33A
Cryo-TEM by Goran Karlsson, Uppsala University
and Vania Croce, University of Bristol
V.Croce, T. Cosgrove, G.C. Maitland, T.L. Hughes and G. Karlsson, Langmuir 19 8536-41 (2003)
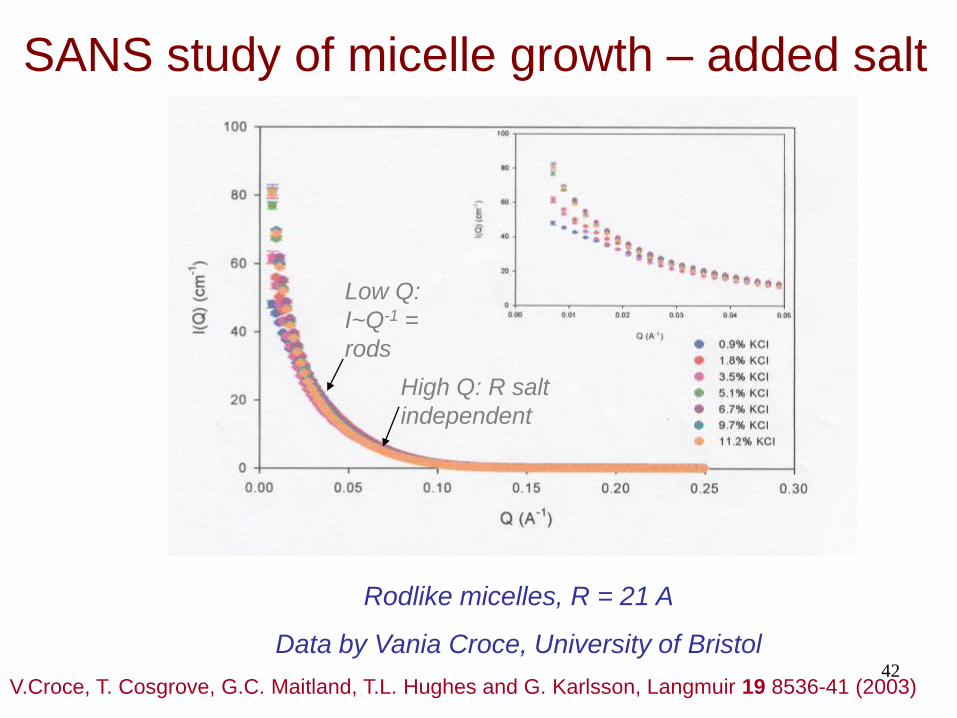
42
Rodlike micelles, R = 21 A
Data by Vania Croce, University of Bristol
SANS study of micelle growth – added salt
Low Q:
I~Q-1 =
rods
High Q: R salt
independent
V.Croce, T. Cosgrove, G.C. Maitland, T.L. Hughes and G. Karlsson, Langmuir 19 8536-41 (2003)

43
Add 2% KCl…peak viscosity
Entangled Wormlike Micelles
Cryo-TEM by Goran Karlsson, Uppsala University
and Vania Croce, University of Bristol
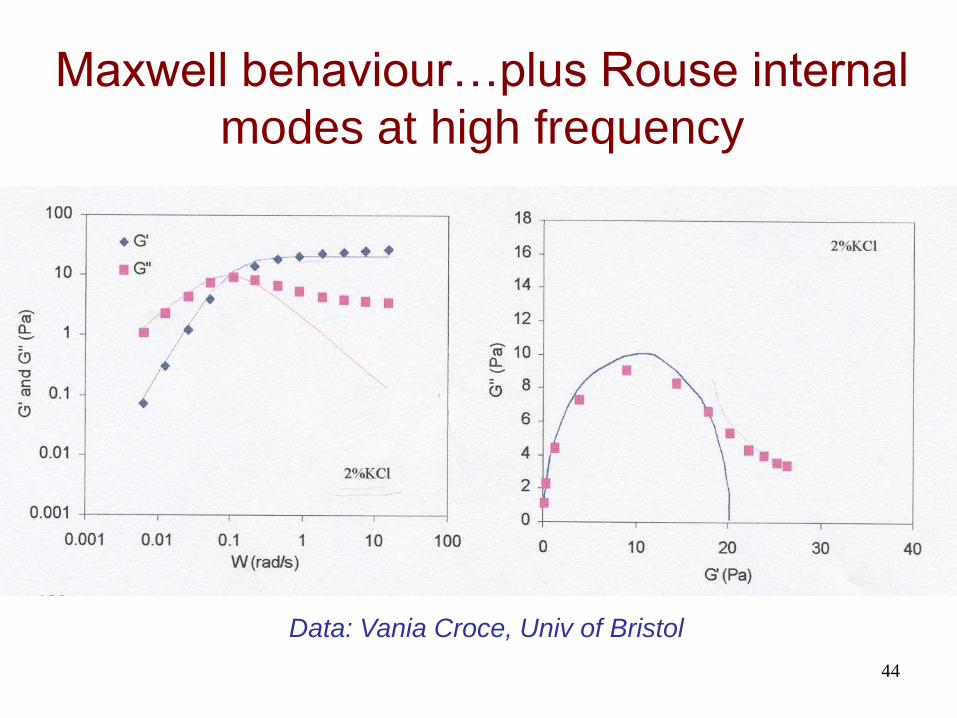
44
Maxwell behaviour…plus Rouse internal
modes at high frequency
Data: Vania Croce, Univ of Bristol
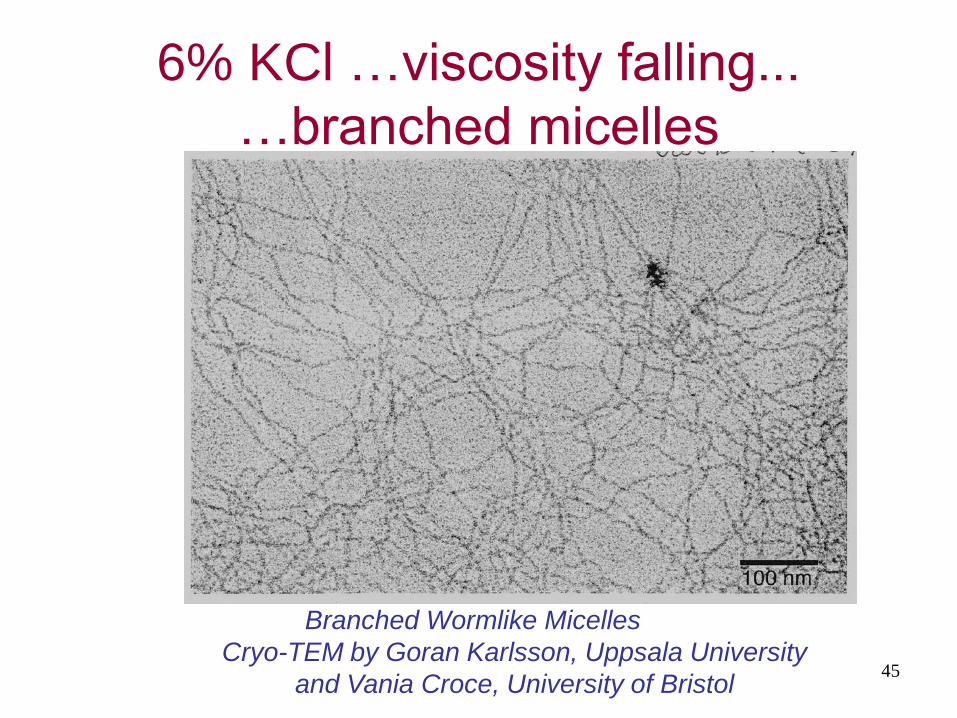
45
6% KCl …viscosity falling...
…branched micelles
Branched Wormlike Micelles
Cryo-TEM by Goran Karlsson, Uppsala University
and Vania Croce, University of Bristol
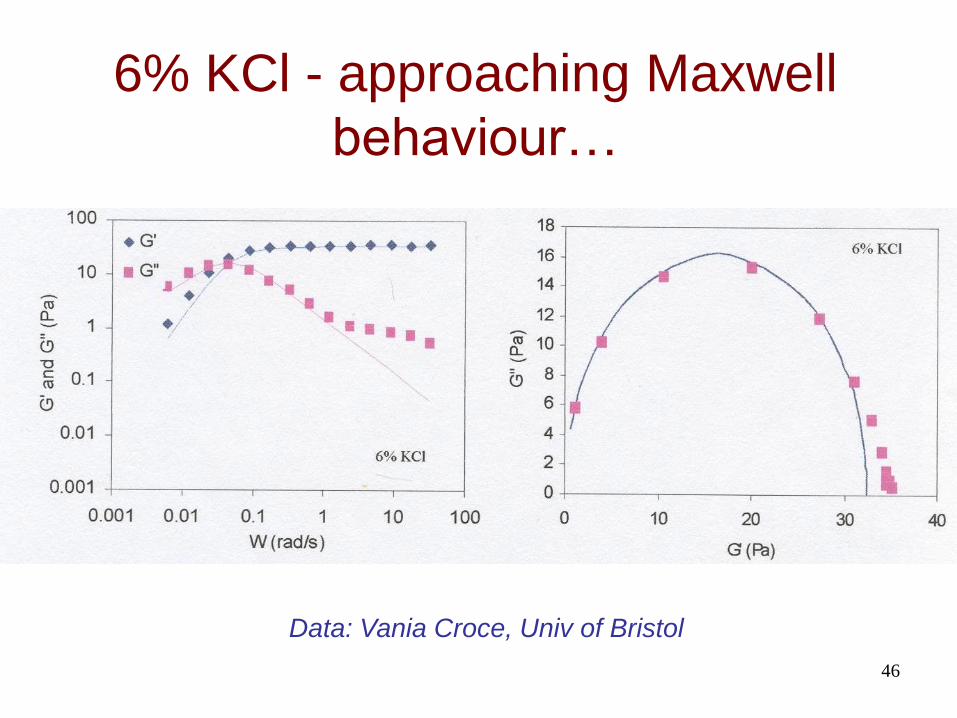
46
6% KCl - approaching Maxwell
behaviour…
Data: Vania Croce, Univ of Bristol
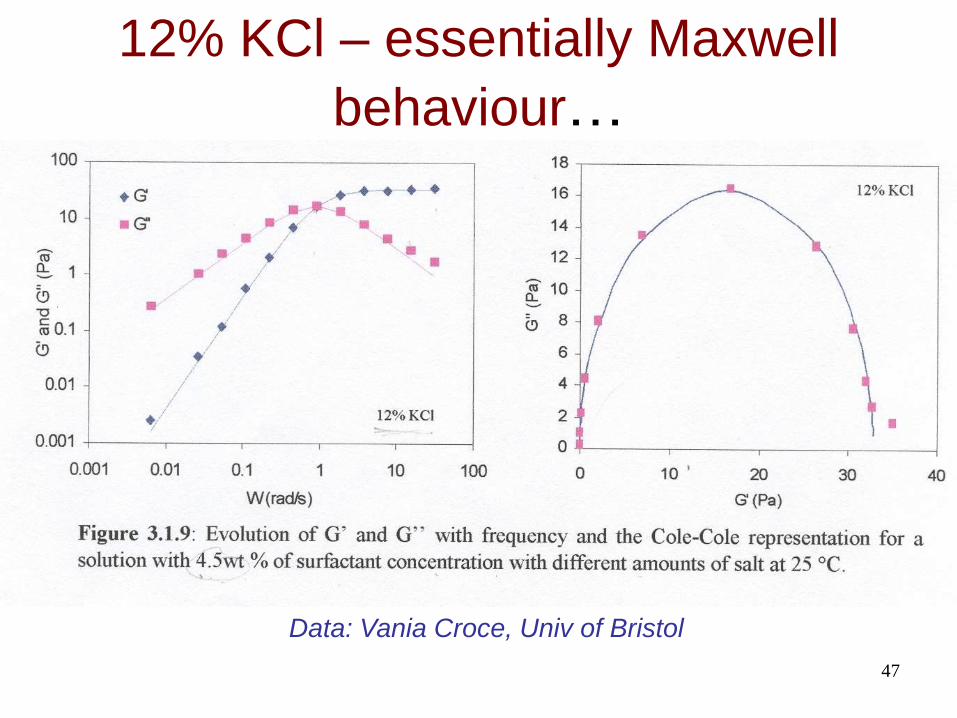
47
12% KCl – essentially Maxwell
behaviour…
Data: Vania Croce, Univ of Bristol
Bulk Properties
Simulation
Theory Phenomenological
Parameters
Simulation
Theory
Experiment Macroscopic
Molecular
Mesoscopic
Experiment
Coarse
Graining
Type of Study

Probing the Microstructure
Rheology and Light Scattering
Sch
lum
berg
er P
rivate
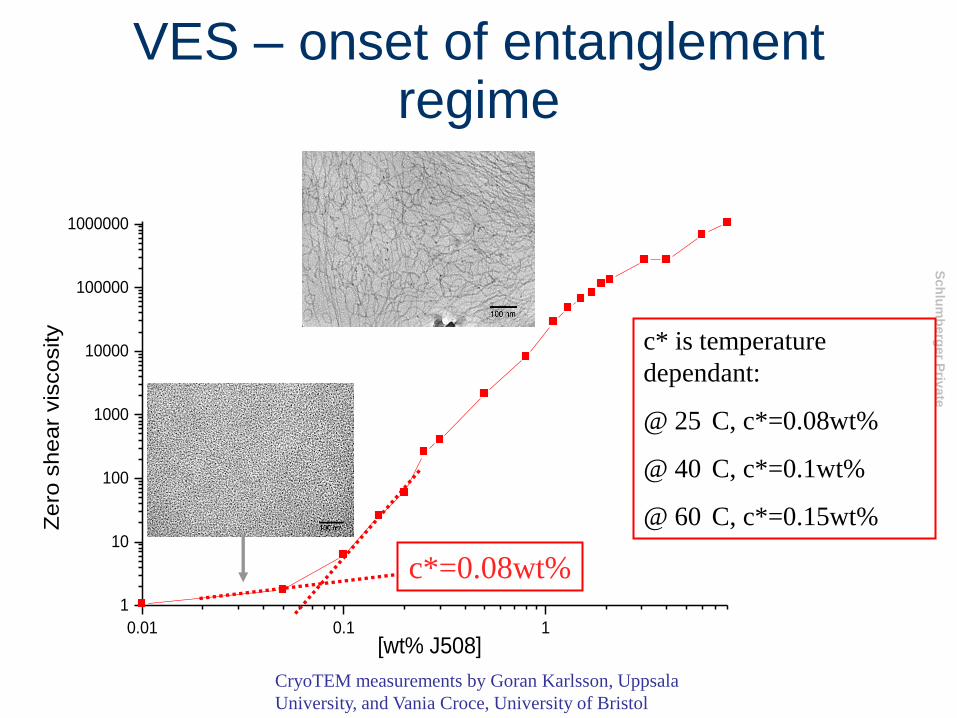
VES – onset of entanglement regime
0.01 0.1 1
1
10
100
1000
10000
100000
1000000
Zero
shear
vis
cosity
[wt% J508]
c*=0.08wt%
c* is temperature
dependant:
@ 25 C, c*=0.08wt%
@ 40 C, c*=0.1wt%
@ 60 C, c*=0.15wt%
CryoTEM measurements by Goran Karlsson, Uppsala
University, and Vania Croce, University of Bristol
13.06.06 51
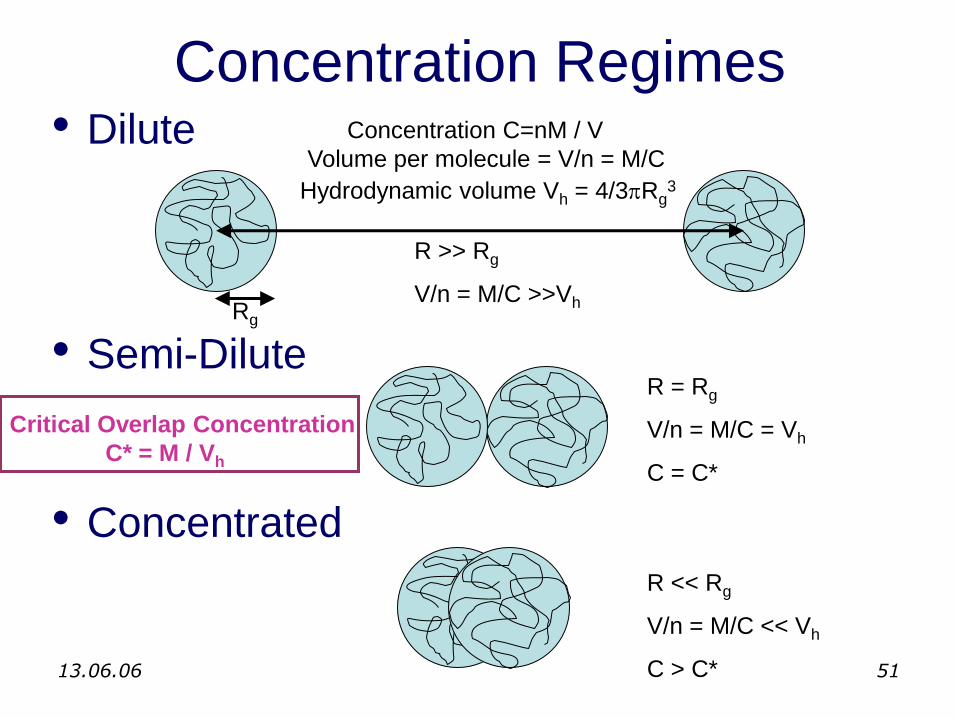
Concentration Regimes • Dilute
• Semi-Dilute
• Concentrated
Rg
Hydrodynamic volume Vh = 4/3pRg3
R >> Rg
V/n = M/C >>Vh
Concentration C=nM / V
Volume per molecule = V/n = M/C
R << Rg
V/n = M/C << Vh
C > C*
R = Rg
V/n = M/C = Vh
C = C*
Critical Overlap Concentration
C* = M / Vh
52
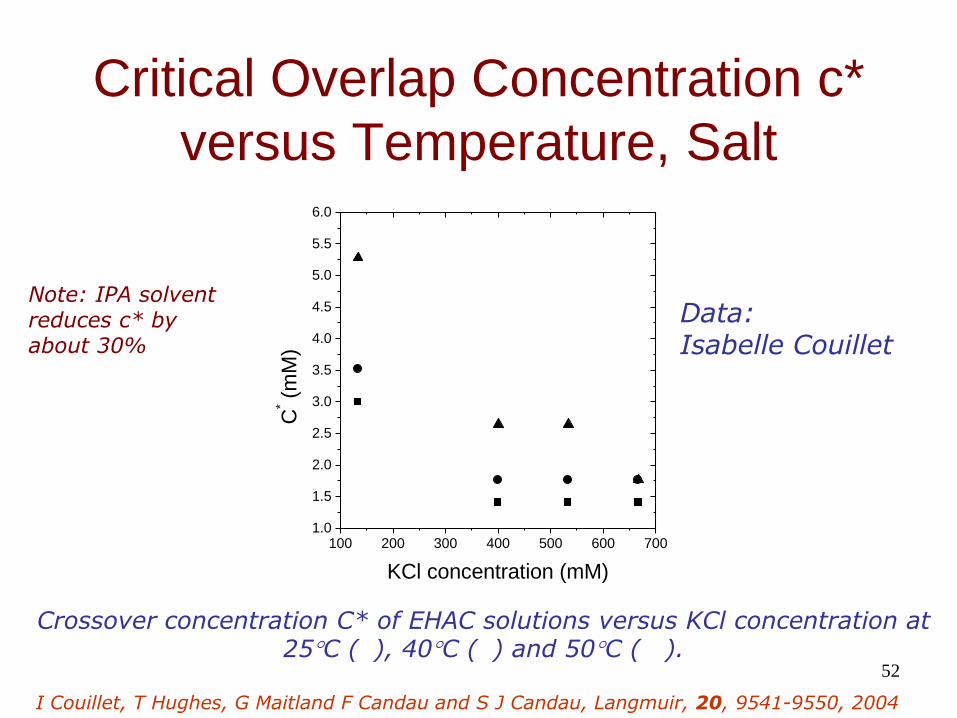
Critical Overlap Concentration c*
versus Temperature, Salt
100 200 300 400 500 600 7001.0
1.5
2.0
2.5
3.0
3.5
4.0
4.5
5.0
5.5
6.0
C* (
mM
)
KCl concentration (mM)
Crossover concentration C* of EHAC solutions versus KCl concentration at 25C ( ), 40C ( ) and 50C ( ).
Data: Isabelle Couillet
I Couillet, T Hughes, G Maitland F Candau and S J Candau, Langmuir, 20, 9541-9550, 2004
Note: IPA solvent reduces c* by about 30%
54
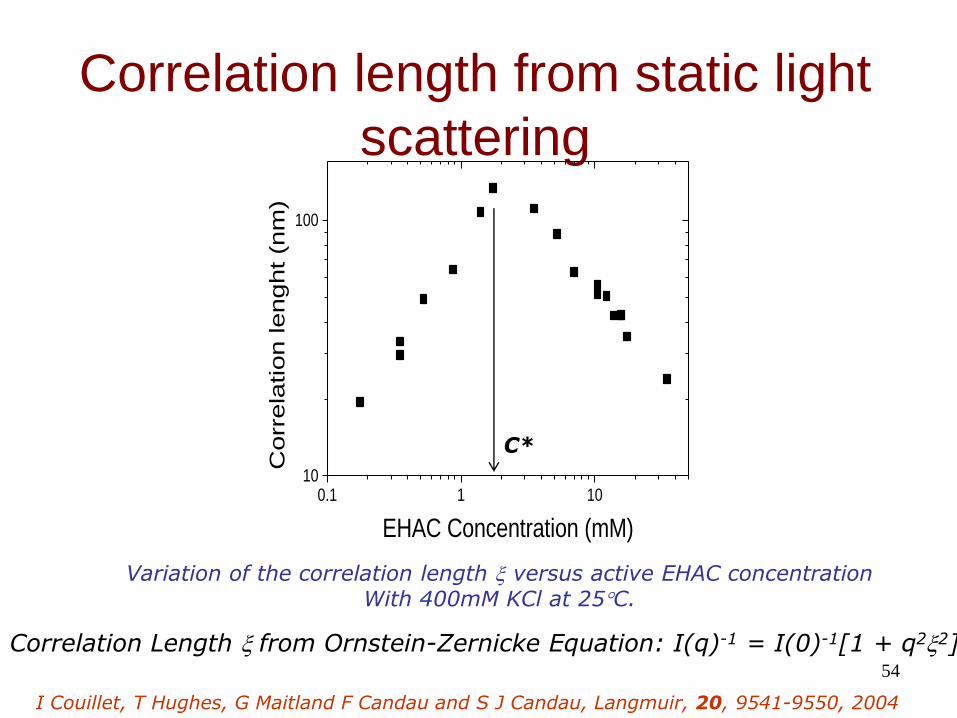
Correlation length from static light
scattering
0.1 1 1010
100
Corr
ela
tion lenght (n
m)
EHAC Concentration (mM)
Variation of the correlation length versus active EHAC concentration With 400mM KCl at 25C.
Correlation Length from Ornstein-Zernicke Equation: I(q)-1 = I(0)-1[1 + q22]
I Couillet, T Hughes, G Maitland F Candau and S J Candau, Langmuir, 20, 9541-9550, 2004
C*
55
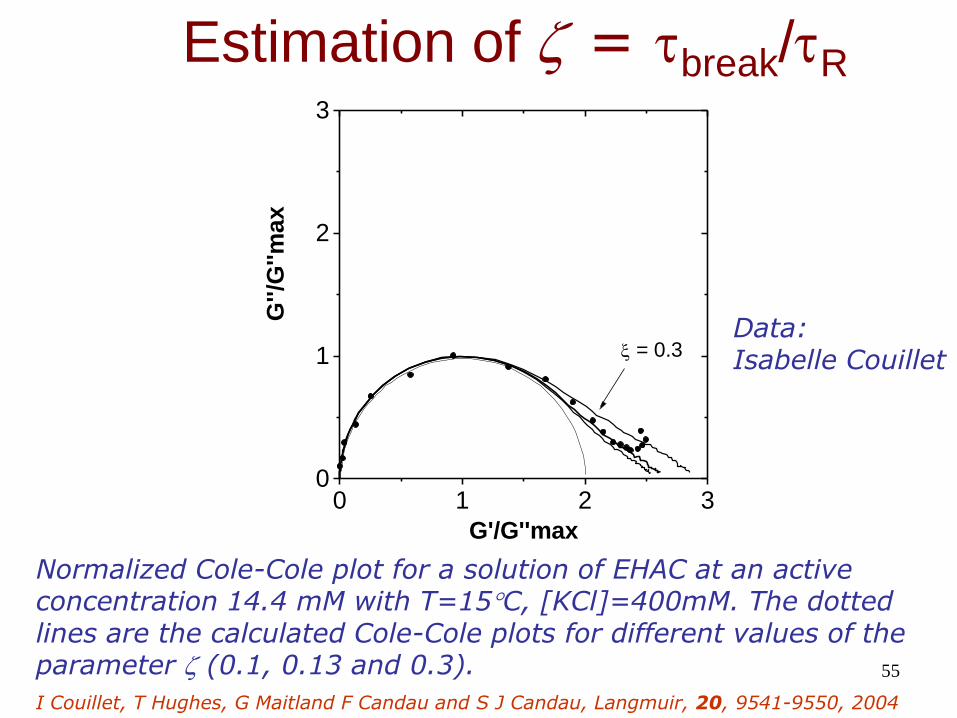
Estimation of = tbreak/tR
0 1 2 30
1
2
3
= 0.3
G''/
G''m
ax
G'/G''max
Data: Isabelle Couillet
Normalized Cole-Cole plot for a solution of EHAC at an active concentration 14.4 mM with T=15C, [KCl]=400mM. The dotted lines are the calculated Cole-Cole plots for different values of the parameter (0.1, 0.13 and 0.3).
I Couillet, T Hughes, G Maitland F Candau and S J Candau, Langmuir, 20, 9541-9550, 2004
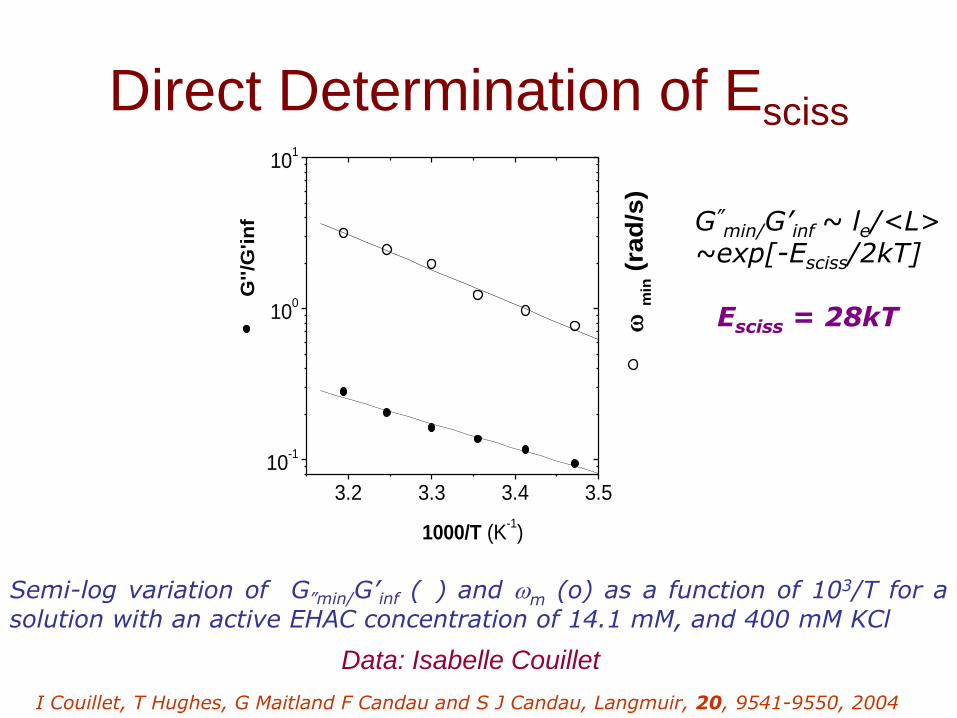
Direct Determination of Esciss
3.2 3.3 3.4 3.5
10-1
100
101
G''/G
'in
f
1000/T (K-1)
m
in (
rad
/s)
Semi-log variation of G”min/G’inf ( ) and m (o) as a function of 103/T for a
solution with an active EHAC concentration of 14.1 mM, and 400 mM KCl
Esciss = 28kT
G”min/G’inf ~ le/<L>
~exp[-Esciss/2kT]
Data: Isabelle Couillet
I Couillet, T Hughes, G Maitland F Candau and S J Candau, Langmuir, 20, 9541-9550, 2004
57
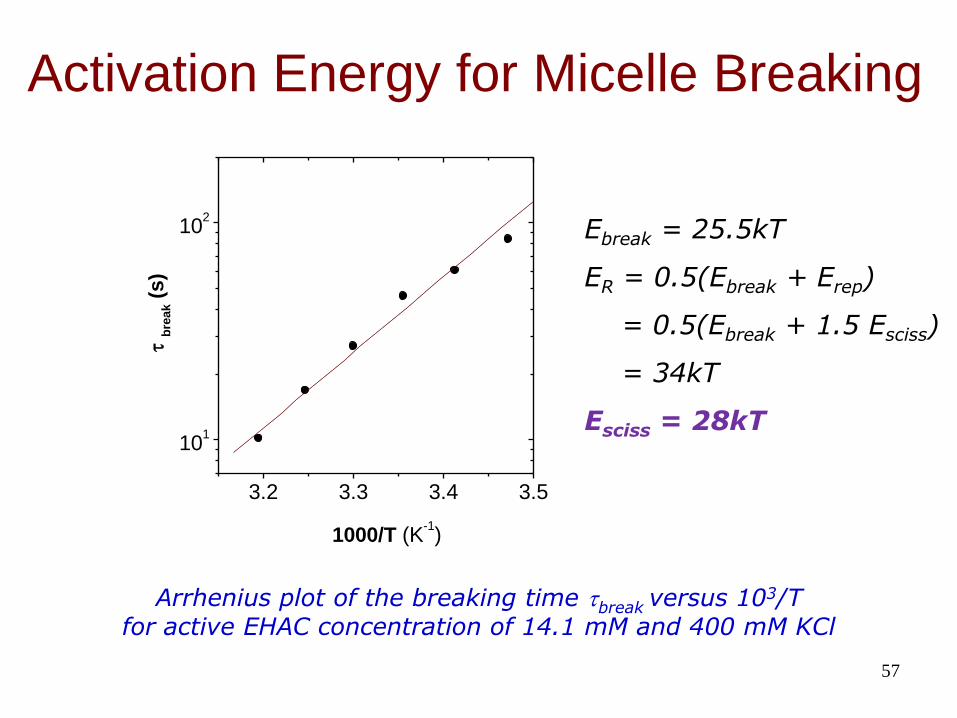
Activation Energy for Micelle Breaking
3.2 3.3 3.4 3.5
101
102
t b
reak (
s)
1000/T (K-1)
Arrhenius plot of the breaking time tbreak versus 103/T for active EHAC concentration of 14.1 mM and 400 mM KCl
Ebreak = 25.5kT
ER = 0.5(Ebreak + Erep)
= 0.5(Ebreak + 1.5 Esciss)
= 34kT
Esciss = 28kT
Bulk Properties
Simulation
Theory Phenomenological
Parameters
Simulation
Theory
Experiment Macroscopic
Molecular
Mesoscopic
Experiment
Coarse
Graining
Type of Study
59
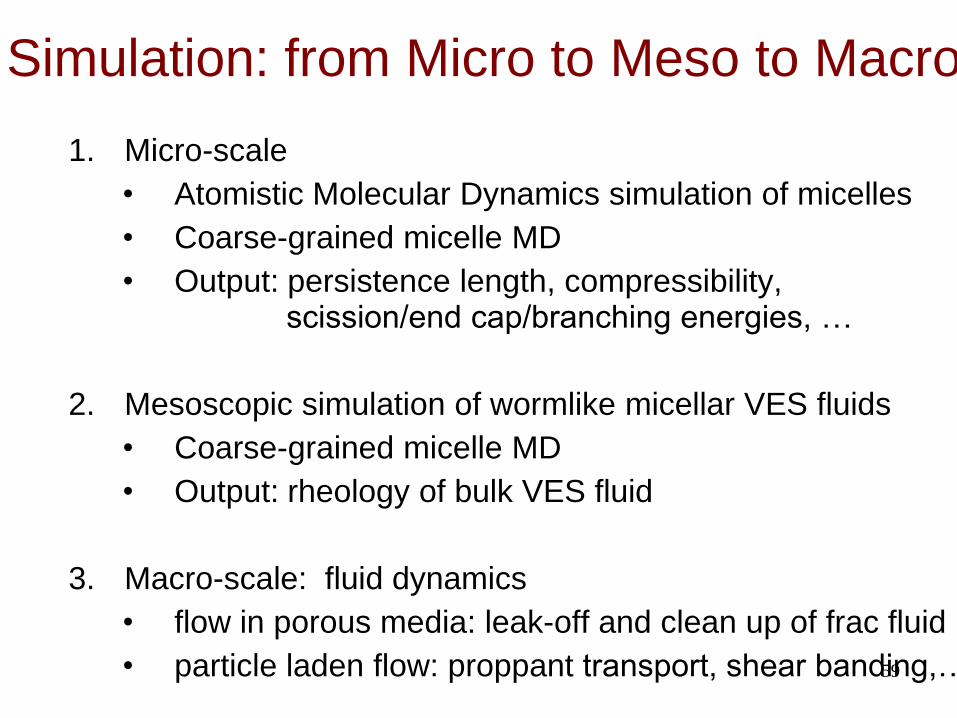
Simulation: from Micro to Meso to Macro
1. Micro-scale
• Atomistic Molecular Dynamics simulation of micelles
• Coarse-grained micelle MD
• Output: persistence length, compressibility, scission/end cap/branching energies, …
2. Mesoscopic simulation of wormlike micellar VES fluids
• Coarse-grained micelle MD
• Output: rheology of bulk VES fluid
3. Macro-scale: fluid dynamics
• flow in porous media: leak-off and clean up of frac fluid
• particle laden flow: proppant transport, shear banding,…
61
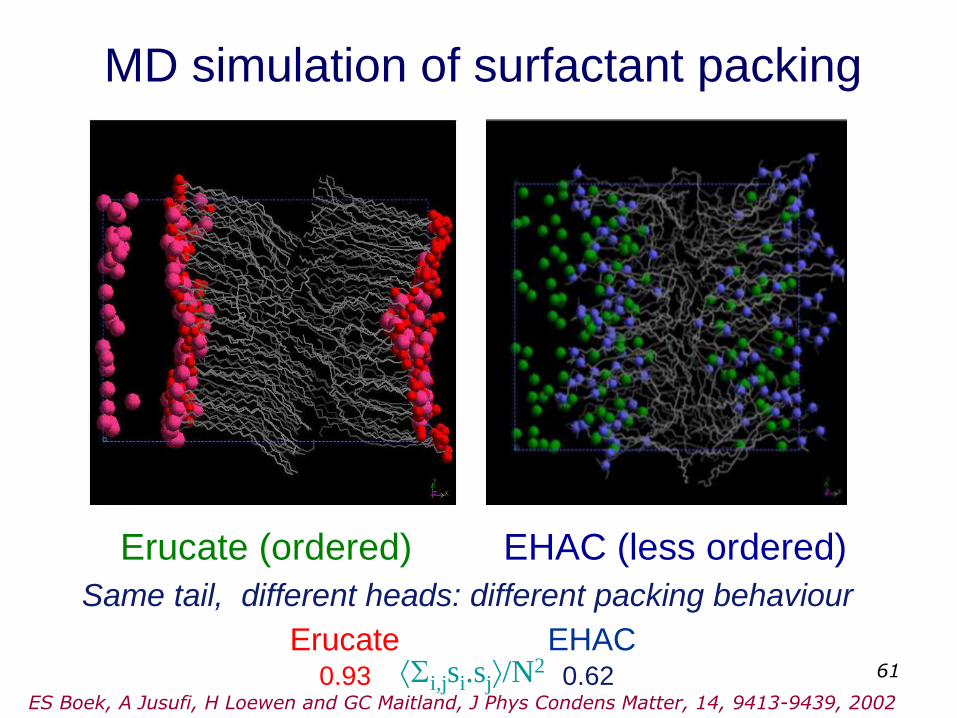
MD simulation of surfactant packing
Erucate (ordered)
Same tail, different heads: different packing behaviour
EHAC (less ordered)
Erucate EHAC Si,jsi.sj/N
2 0.93 0.62 ES Boek, A Jusufi, H Loewen and GC Maitland, J Phys Condens Matter, 14, 9413-9439, 2002
62
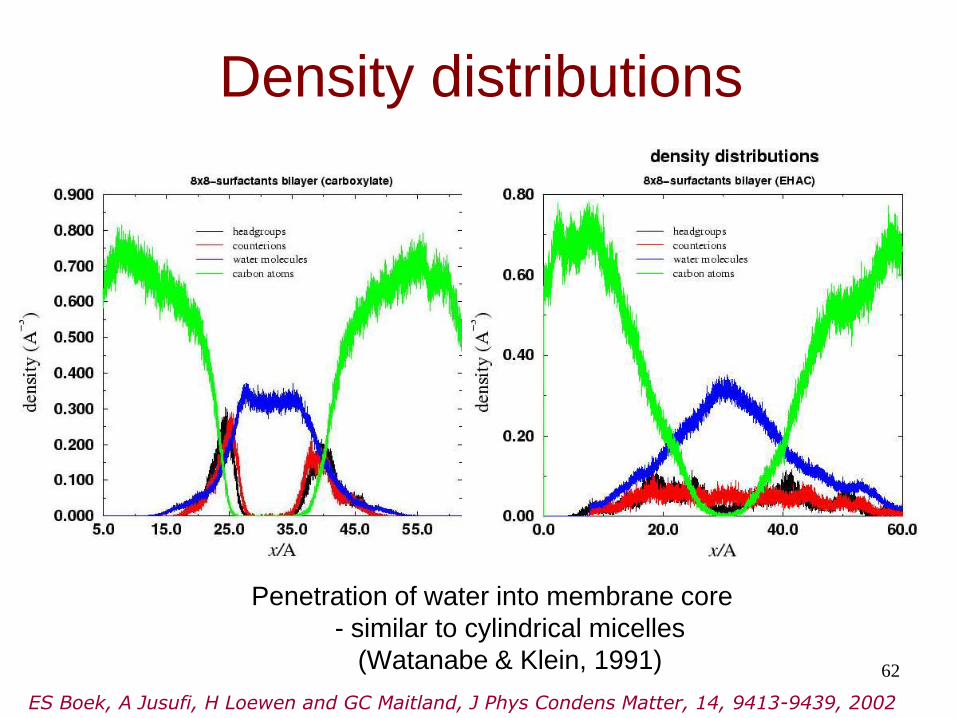
Density distributions
Penetration of water into membrane core
- similar to cylindrical micelles
(Watanabe & Klein, 1991)
ES Boek, A Jusufi, H Loewen and GC Maitland, J Phys Condens Matter, 14, 9413-9439, 2002
63
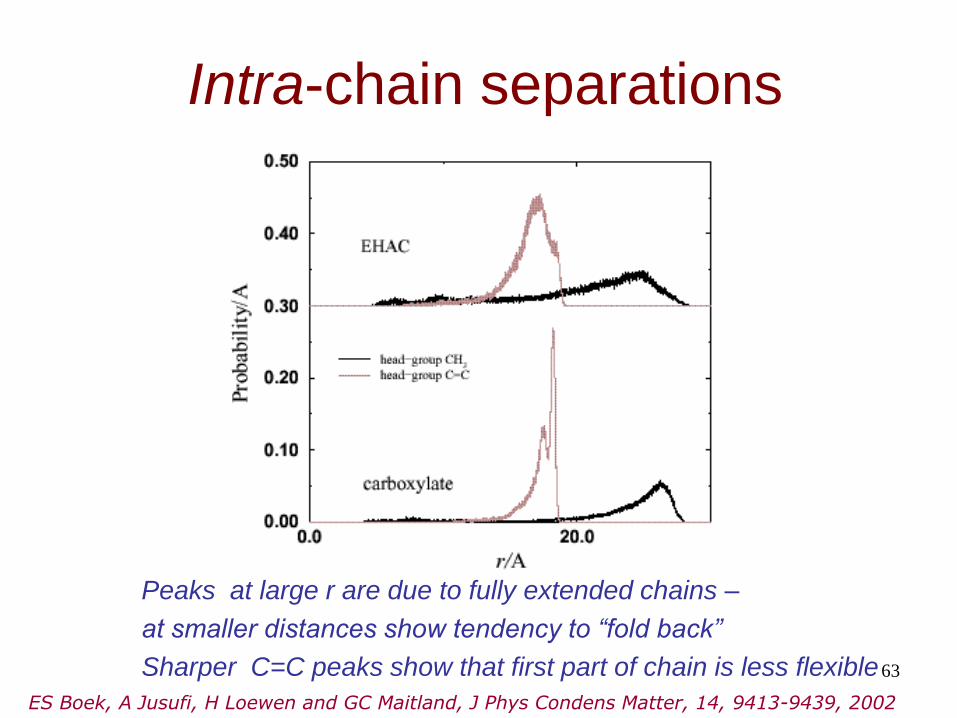
Intra-chain separations
Peaks at large r are due to fully extended chains –
at smaller distances show tendency to “fold back”
Sharper C=C peaks show that first part of chain is less flexible
ES Boek, A Jusufi, H Loewen and GC Maitland, J Phys Condens Matter, 14, 9413-9439, 2002
64
Control of Fluid Properties through
Design of Chemical Structure
Moving from Formulation towards
Molecular Engineering
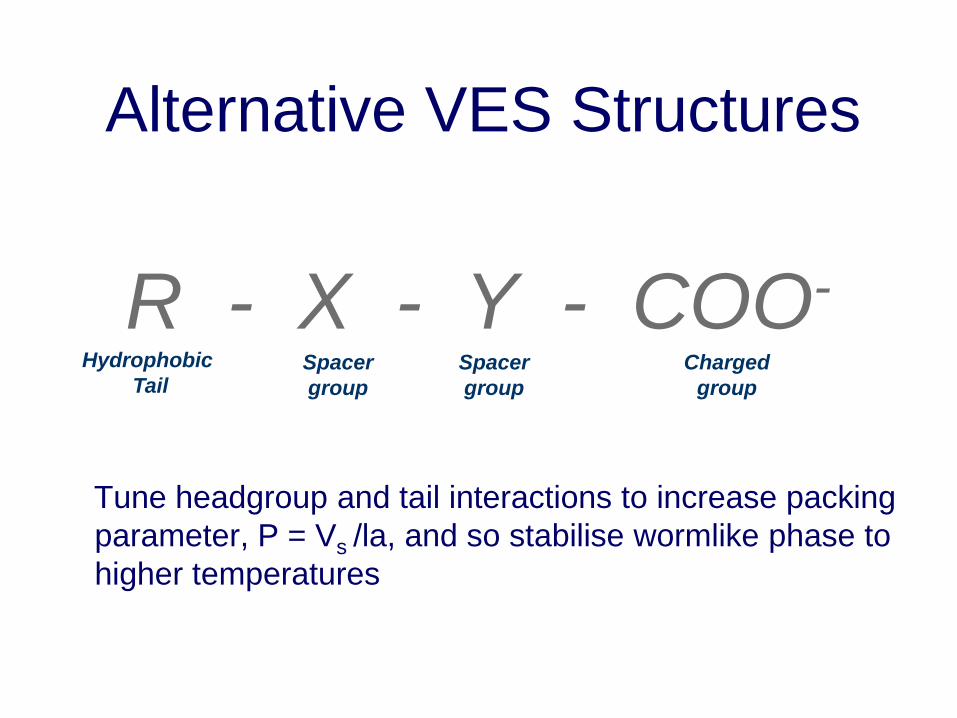
Alternative VES Structures
Tune headgroup and tail interactions to increase packing
parameter, P = Vs /la, and so stabilise wormlike phase to
higher temperatures
R - X - Y - COO- Hydrophobic
Tail Spacer
group Spacer
group Charged
group
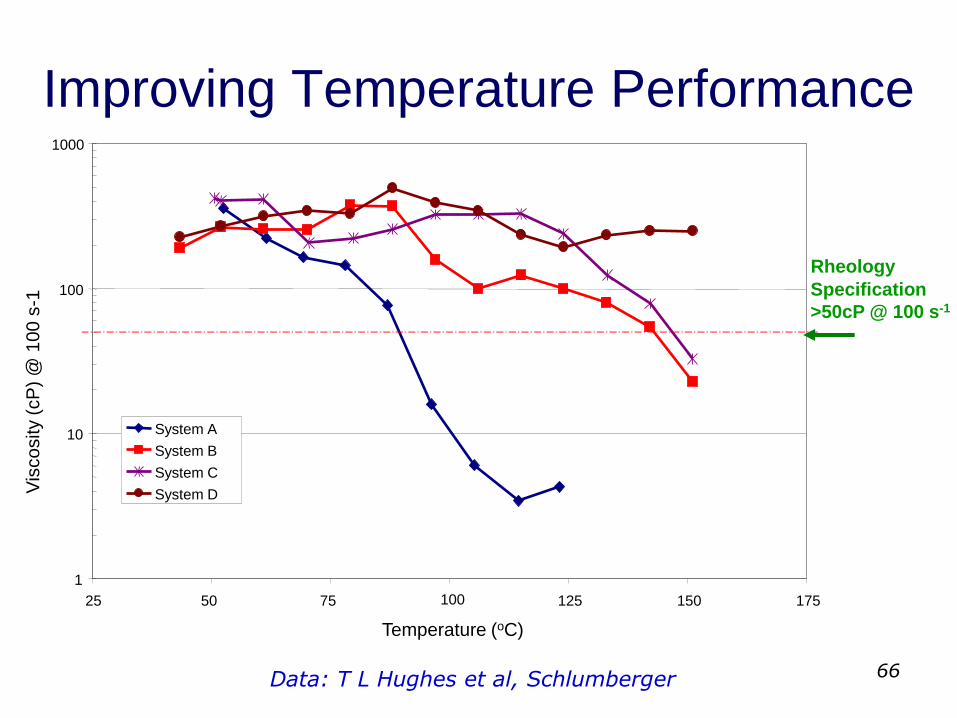
66
Improving Temperature Performance
1
10
100
1000
25 50 75 125 150 175
Temperature (oC)
Vis
co
sity (
cP
) @
100
s-1
System A
System B
System C
System D
100
Rheology
Specification
>50cP @ 100 s-1
Data: T L Hughes et al, Schlumberger
The major block for using new
molecules in the oilfield:
££££££££££££
Must leverage on other non-
oilfield applications

Bulk Properties
Simulation
Theory Phenomenological
Parameters
Simulation
Theory
Experiment Macroscopic
Molecular
Mesoscopic
Experiment
Coarse
Graining
Type of Study

Tuning Properties by Blends
(a) Surfactant Blends
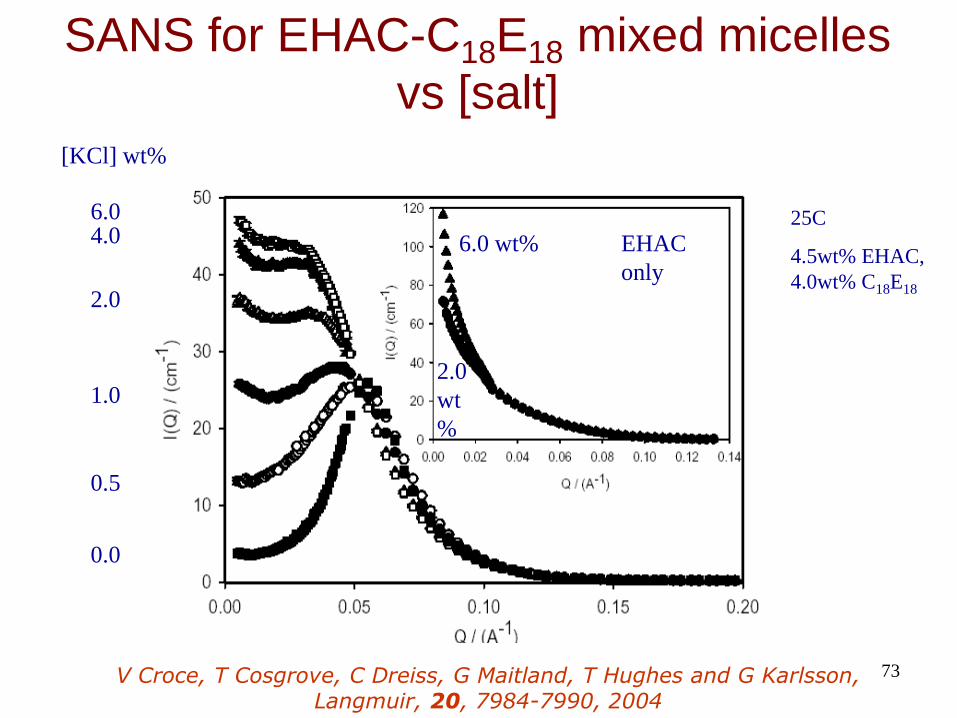
73
SANS for EHAC-C18E18 mixed micelles
vs [salt]
25C
4.5wt% EHAC,
4.0wt% C18E18
[KCl] wt%
6.0 4.0
2.0
1.0
0.5
0.0
2.0
wt
%
6.0 wt% EHAC
only
V Croce, T Cosgrove, C Dreiss, G Maitland, T Hughes and G Karlsson, Langmuir, 20, 7984-7990, 2004
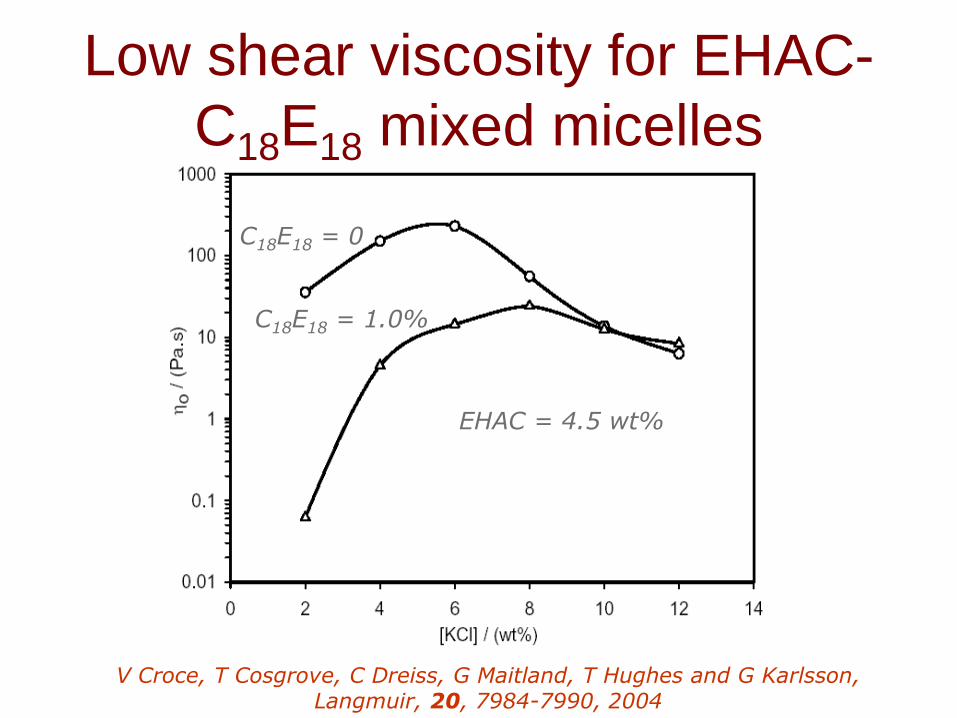
EHAC = 4.5 wt%
C18E18 = 0
C18E18 = 1.0%
Low shear viscosity for EHAC-
C18E18 mixed micelles
V Croce, T Cosgrove, C Dreiss, G Maitland, T Hughes and G Karlsson, Langmuir, 20, 7984-7990, 2004
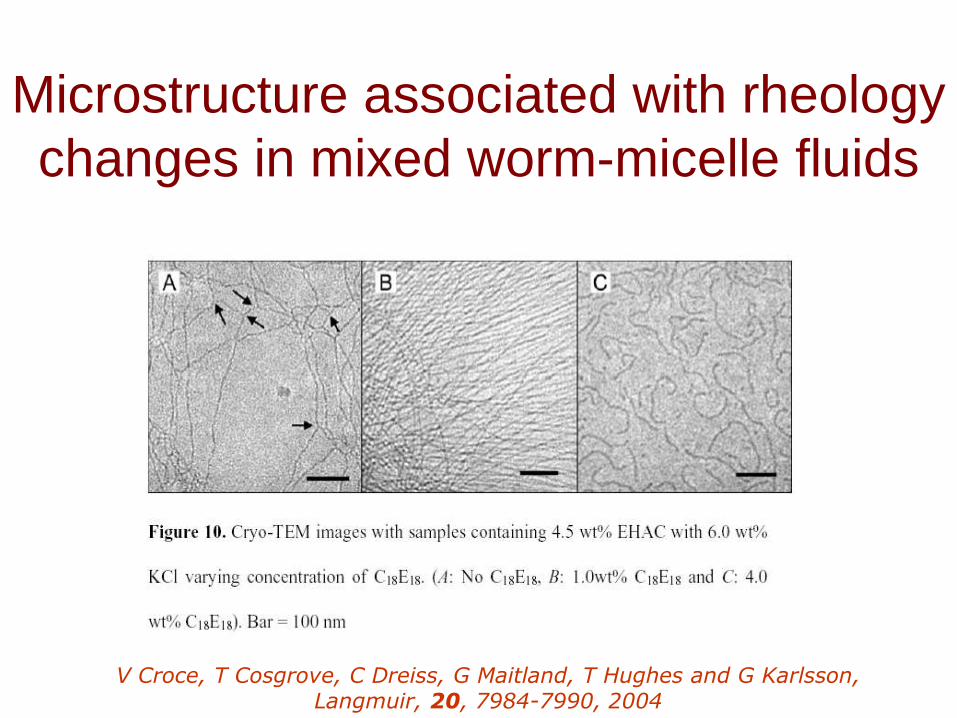
Microstructure associated with rheology
changes in mixed worm-micelle fluids
V Croce, T Cosgrove, C Dreiss, G Maitland, T Hughes and G Karlsson, Langmuir, 20, 7984-7990, 2004
Tuning Properties by Blends
(b) Polymer-Surfactant Blends
79
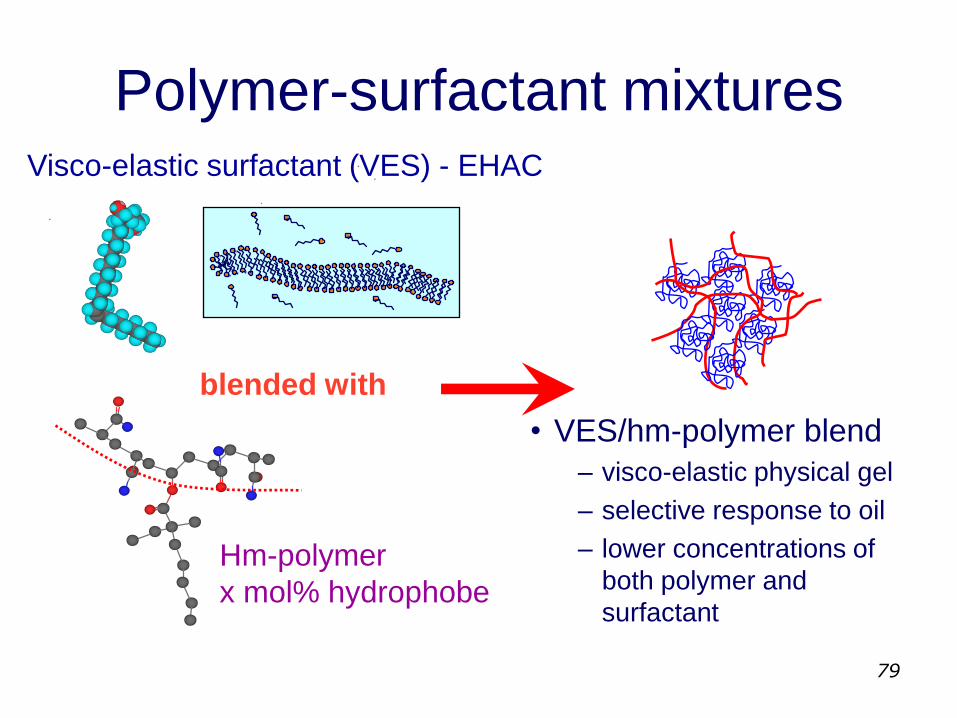
Polymer-surfactant mixtures Visco-elastic surfactant (VES) - EHAC
Hm-polymer
x mol% hydrophobe
• VES/hm-polymer blend
– visco-elastic physical gel
– selective response to oil
– lower concentrations of
both polymer and
surfactant
blended with
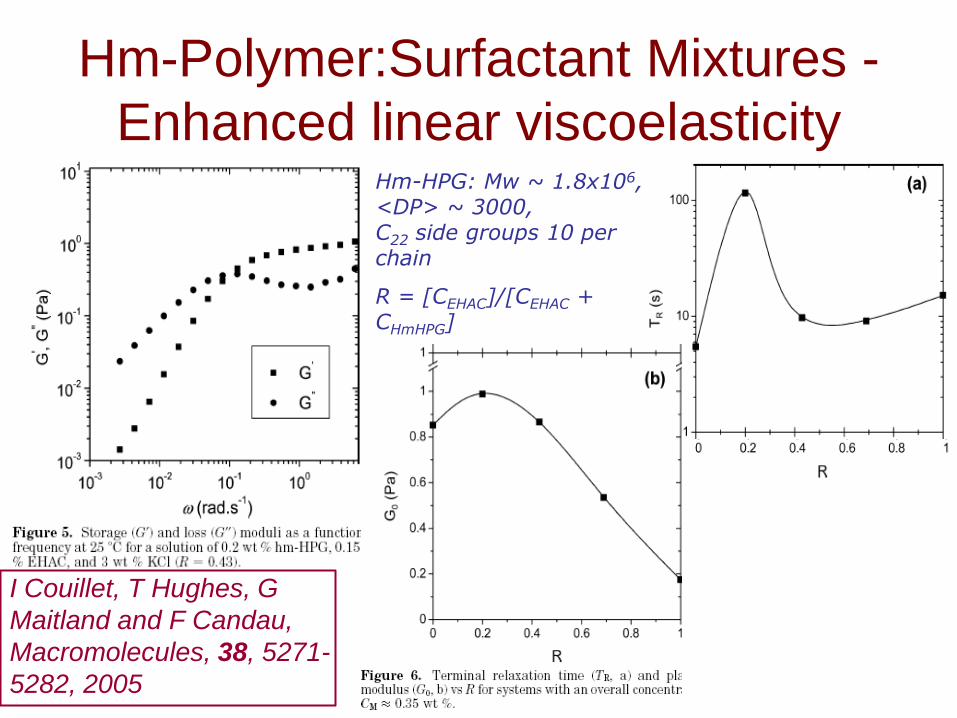
Hm-HPG: Mw ~ 1.8x10⁶, <DP> ~ 3000, C22 side groups 10 per chain
R = [CEHAC]/[CEHAC + CHmHPG]
Hm-Polymer:Surfactant Mixtures -
Enhanced linear viscoelasticity
I Couillet, T Hughes, G
Maitland and F Candau,
Macromolecules, 38, 5271-
5282, 2005
81
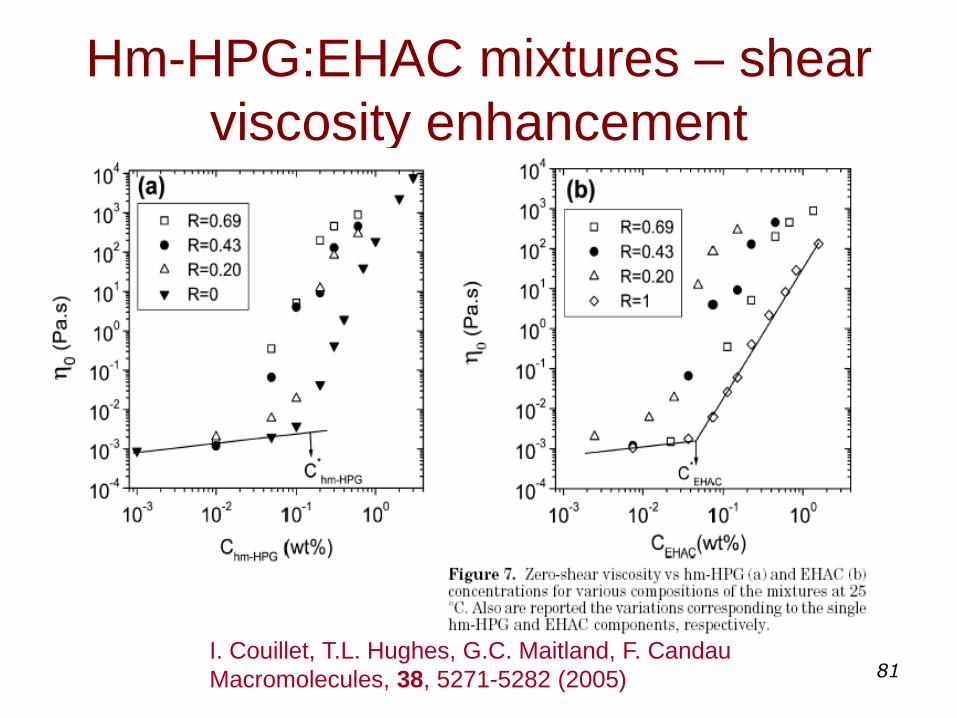
Hm-HPG:EHAC mixtures – shear
viscosity enhancement
I. Couillet, T.L. Hughes, G.C. Maitland, F. Candau
Macromolecules, 38, 5271-5282 (2005)
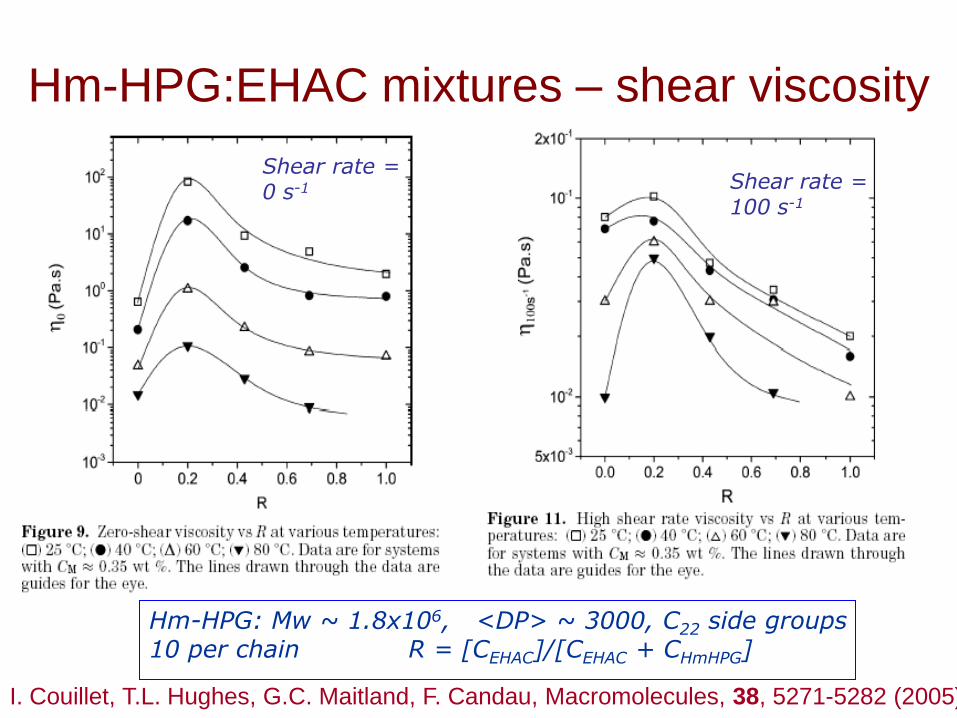
Hm-HPG:EHAC mixtures – shear viscosity
Hm-HPG: Mw ~ 1.8x10⁶, <DP> ~ 3000, C22 side groups 10 per chain R = [CEHAC]/[CEHAC + CHmHPG]
I. Couillet, T.L. Hughes, G.C. Maitland, F. Candau, Macromolecules, 38, 5271-5282 (2005)
Shear rate = 100 s-1
Shear rate = 0 s-1
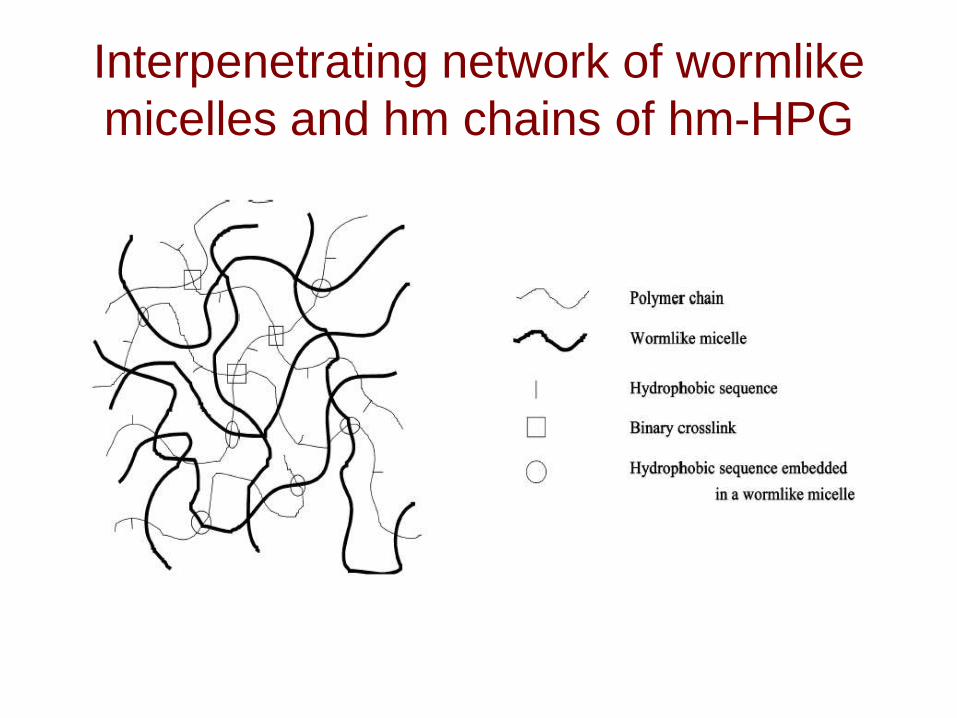
Interpenetrating network of wormlike
micelles and hm chains of hm-HPG
85
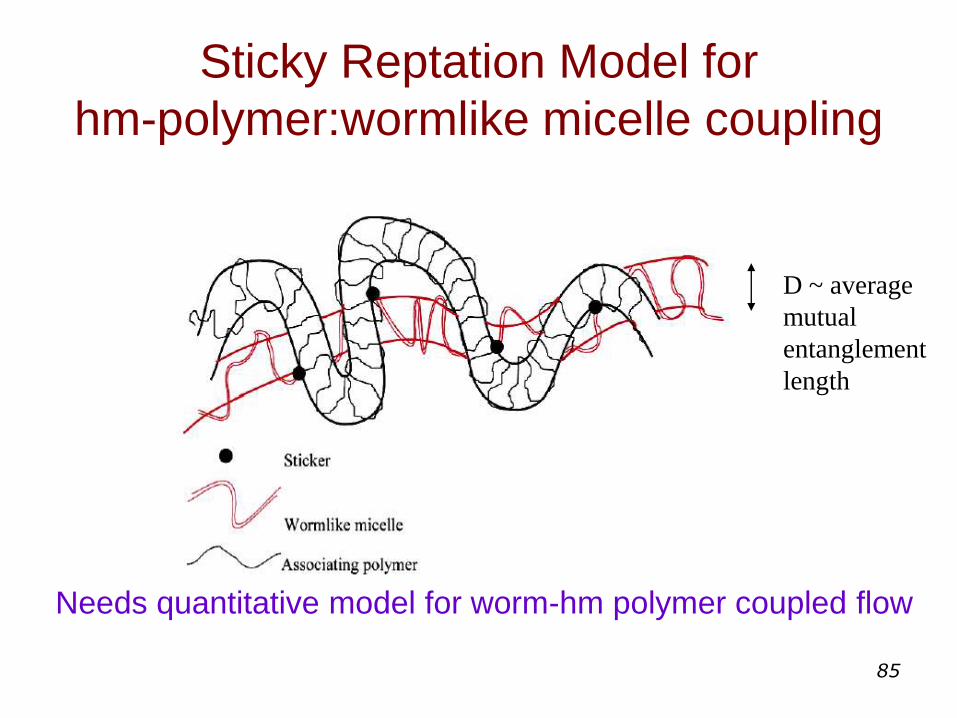
Sticky Reptation Model for
hm-polymer:wormlike micelle coupling
D ~ average
mutual
entanglement
length
Needs quantitative model for worm-hm polymer coupled flow
86
The Potter’s Tale
• Or…Mud, Glorious Mud
– Tubular conduit for fluids…out and in
• Macro Tubes
– Clay colloidal particles are everywhere
– Smectite montmorillonite or Bentonite
• Clay water-based muds
• Low permeability filtercakes
• Soft, swellable shales
…compacted clay rocks

The Industrial Driver – Drilling Fluids
87
88
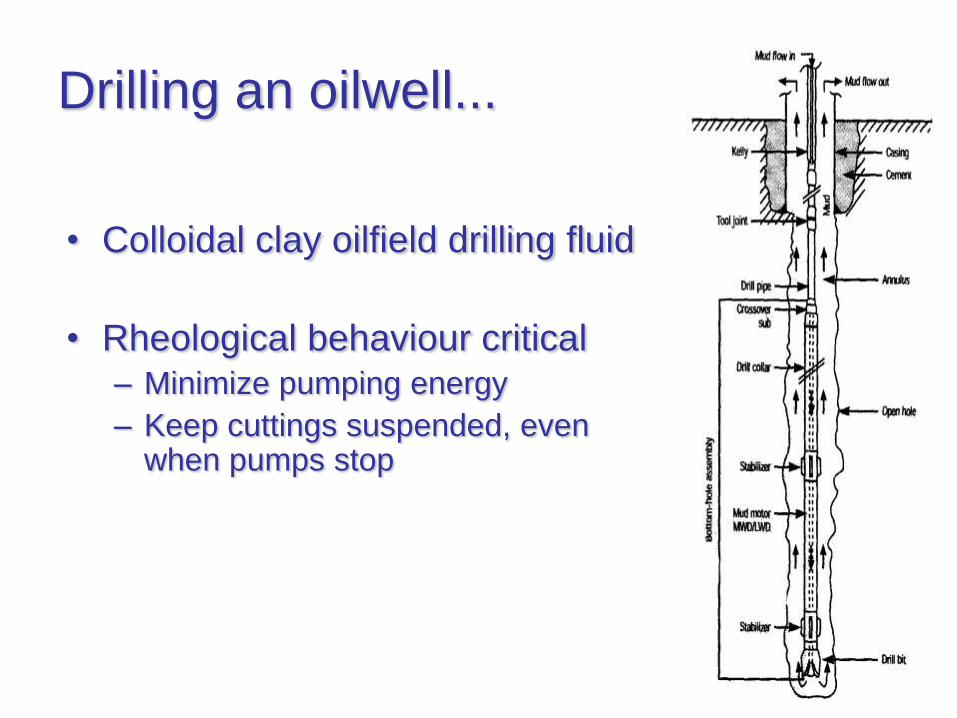
Drilling an oilwell...
• Colloidal clay oilfield drilling fluid
• Rheological behaviour critical – Minimize pumping energy
– Keep cuttings suspended, even when pumps stop
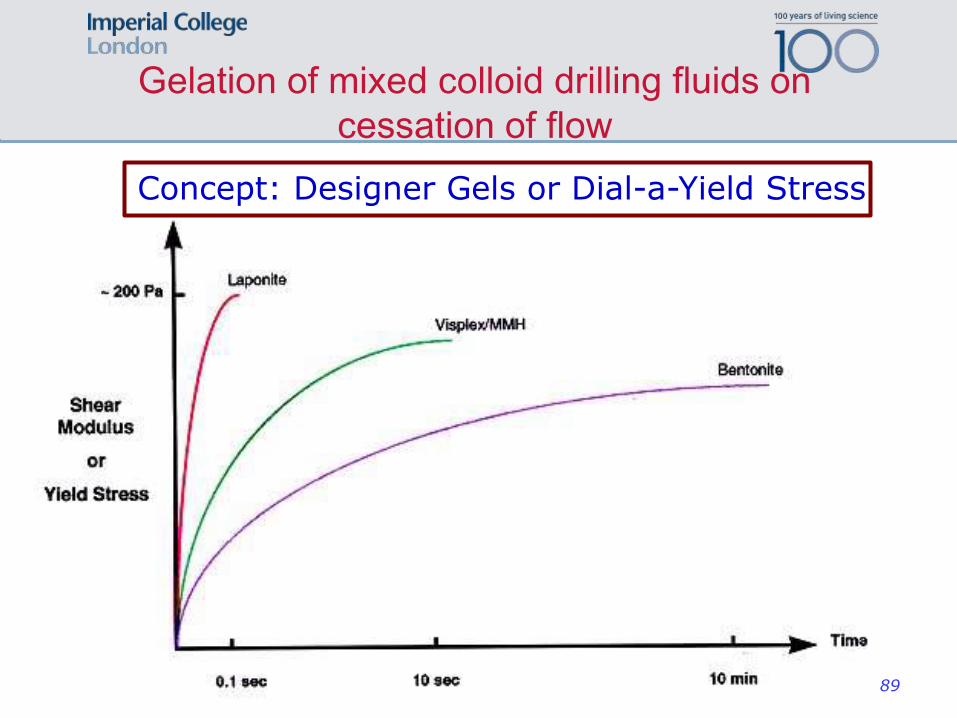
Gelation of mixed colloid drilling fluids on
cessation of flow
Concept: Designer Gels or Dial-a-Yield Stress
89
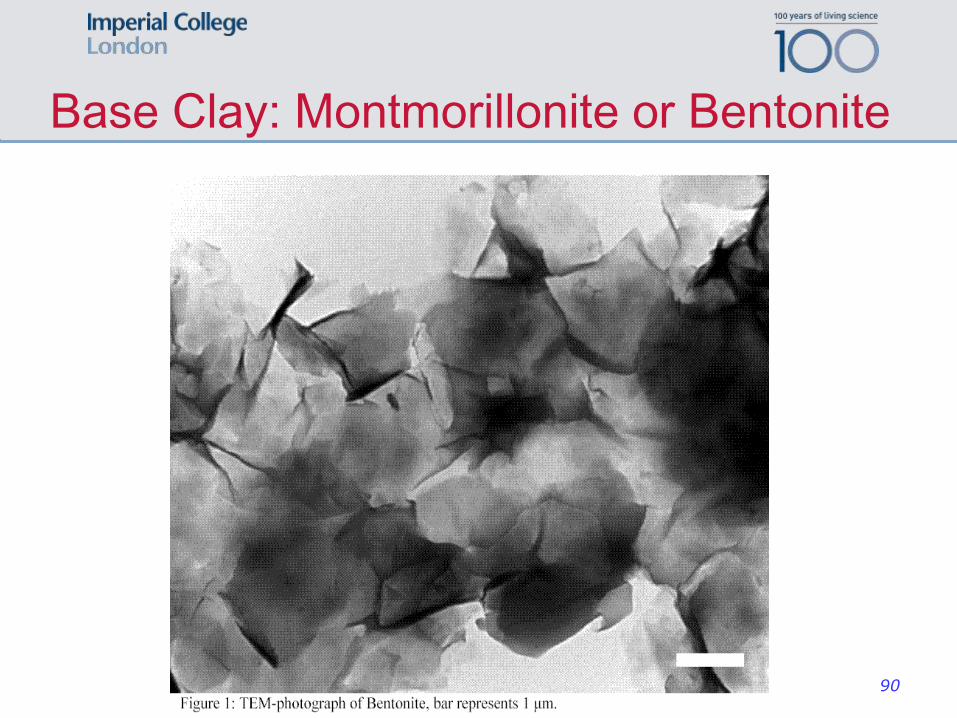
Base Clay: Montmorillonite or Bentonite
0
50
100
150
200
0 100 200 300 400 500 600 700
Shear rate (sec-1)
Shear
str
ess (
Pa/2
)
T = 25C
T = 125C, 16hrs
T = 125C, 32hrs
T = 150C, 16hrs
T = 190C, 16 hrs
90
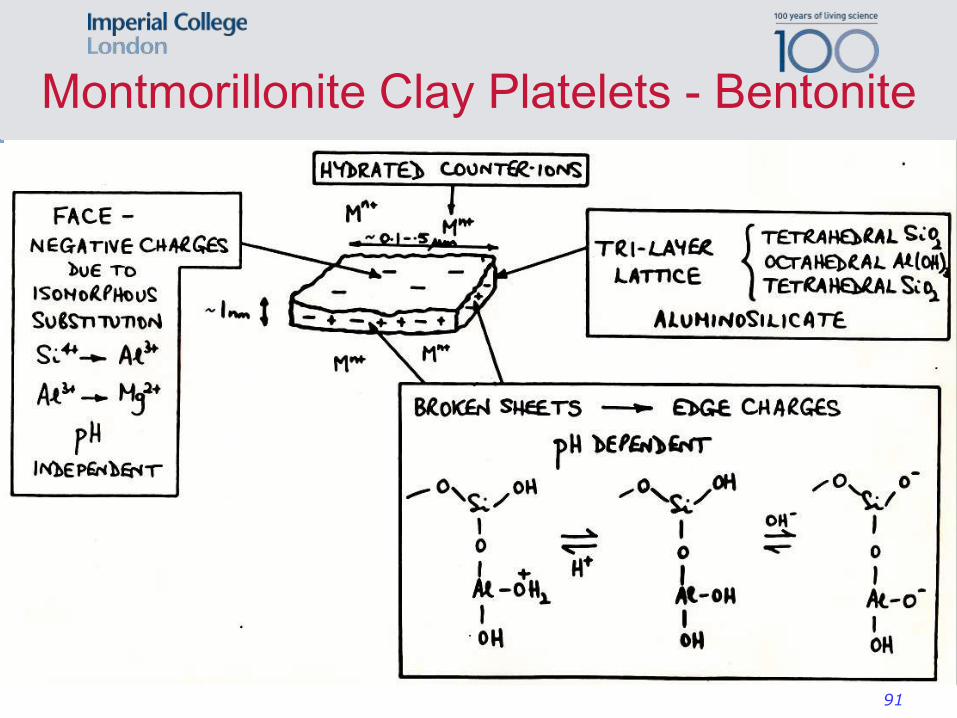
Montmorillonite Clay Platelets - Bentonite
91
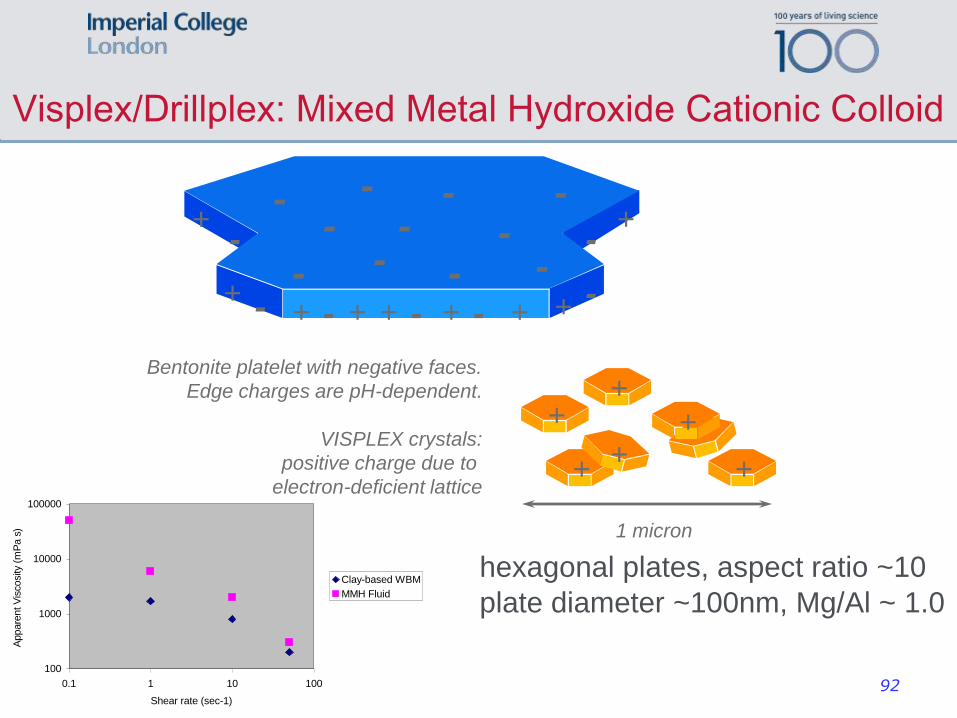
Visplex/Drillplex: Mixed Metal Hydroxide Cationic Colloid
hexagonal plates, aspect ratio ~10
plate diameter ~100nm, Mg/Al ~ 1.0
+
+
+
+
-
- -
-
- + - + + - + +
-
-
- -
- -
-
-
-
- -
+
+ +
+ +
+
1 micron
Bentonite platelet with negative faces.
Edge charges are pH-dependent.
VISPLEX crystals:
positive charge due to
electron-deficient lattice
100
1000
10000
100000
0.1 1 10 100
Shear rate (sec-1)
Appare
nt V
iscosity (
mP
a s
)
Clay-based WBM
MMH Fluid
92

Mixed metal oxide: TEM image
500 nm
93
But...problems -
• Loss of viscosity with salt, brines...seawater
• Gel degrades at temperatures higher than 115 oC
Visplex was renamed Drillplex but still these
issues persisted.
94

Henk Lekkerkerker to the rescue...
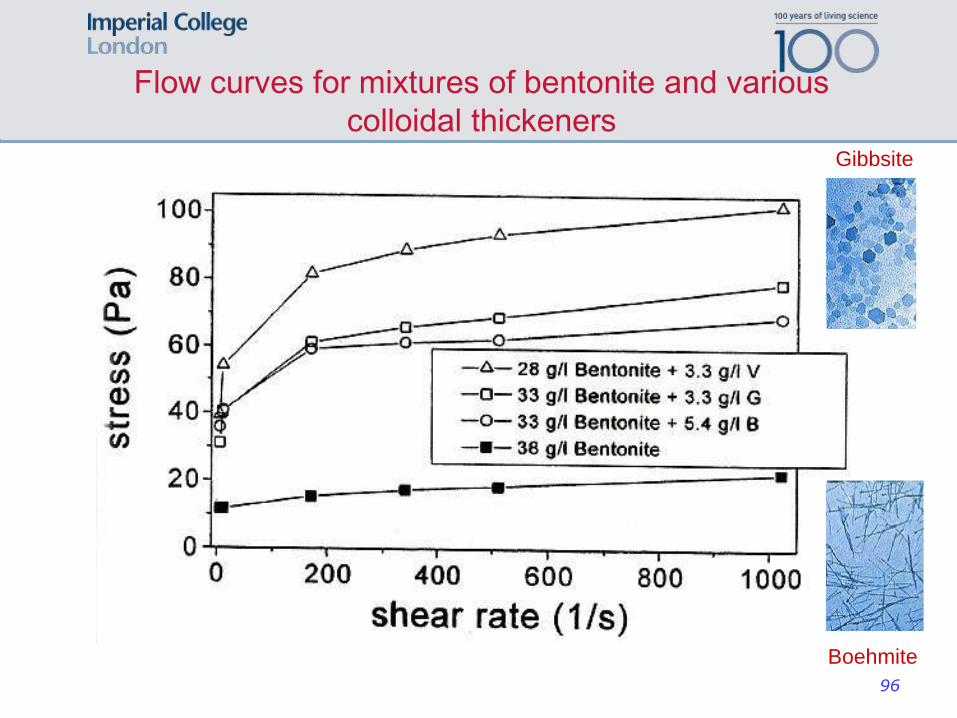
Flow curves for mixtures of bentonite and various
colloidal thickeners
Boehmite
Gibbsite
96
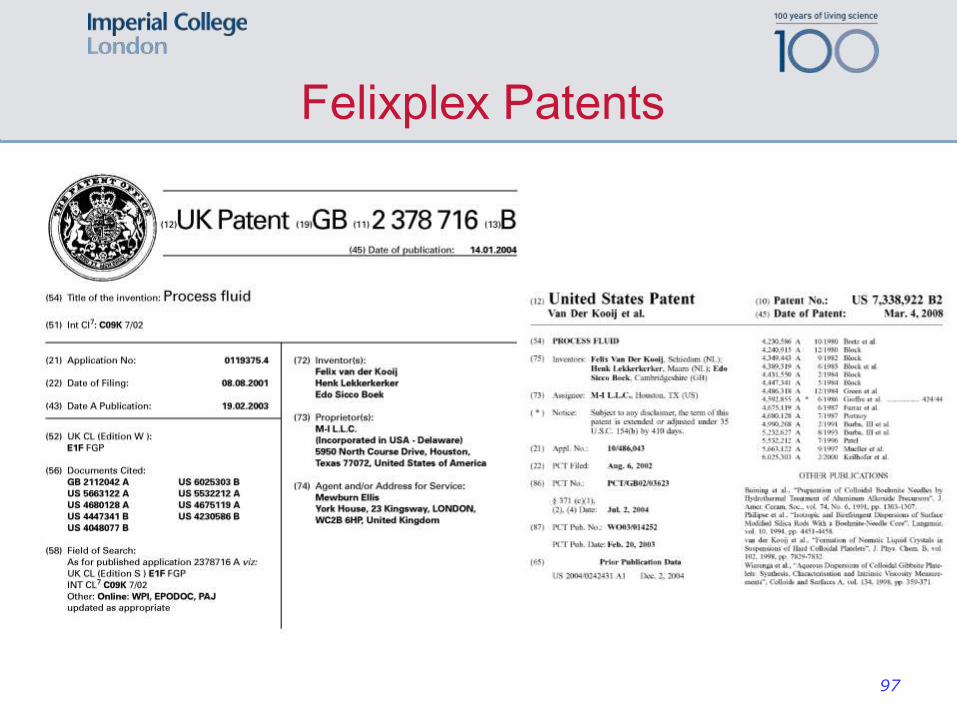
Felixplex Patents
97

Gelation of mixed colloid drilling fluids on
cessation of flow
Concept: Designer Gels or Dial-a-Yield Stress
98

Bulk Properties
Simulation
Theory Phenomenological
Parameters
Simulation
Theory
Experiment Macroscopic
Molecular
Mesoscopic
Experiment
Coarse
Graining
Type of Study

Shaplex: Objectives of Study
• To determine the rheology over a wide range of
stress/strain-rates (using oscillatory, transient and
continuous shear) of well-characterised gelling
suspensions of colloids of varying shape:
rods (boehmite), laths (hectorite), plates (gibbsite)
• To explore the rheological synergies in mixed-shape
colloidal suspensions:
2.5% w/w laths (hectorite)
+ 0.25% w/w rods (boehmite)
or plates (gibbsite)
or spheres (alumina-coated silica)
100
Acknowledgements
Thanks to
• Henk, Annemieke, Marcel and Louise for many years
of fruitful collaboration
• Nederlandse Organisatie voor Wetenschappelijk
Onderzoek (NWO) and
• Schlumberger Cambridge Research,
for financial support to Annemieke ten Brinke
• SoftComp EU 6th Framework Network of Excellence
• Edo Boek of Imperial College London (formerly
Schlumberger Cambridge Research) for helpful
discussions
• Dzina Kleshchanok, University of Utrecht, for
producing the TEM images 101
Key messages
• General complex rheological behaviour of clay and
clay-colloid mixtures as they transform from gels
(elastoviscous solids) to weakly elastic shear-thinning
liquids
• The significant enhancements to gel rheological
properties caused by minor (~ 1:10 w/w) additions of
a second colloidal component of varying shape
• Contrasts between hectorite and montmorillonite as
the base clay
• The contrasting effect of one particular additive (silica
spheres) depending on charge and clay concentration
102
103
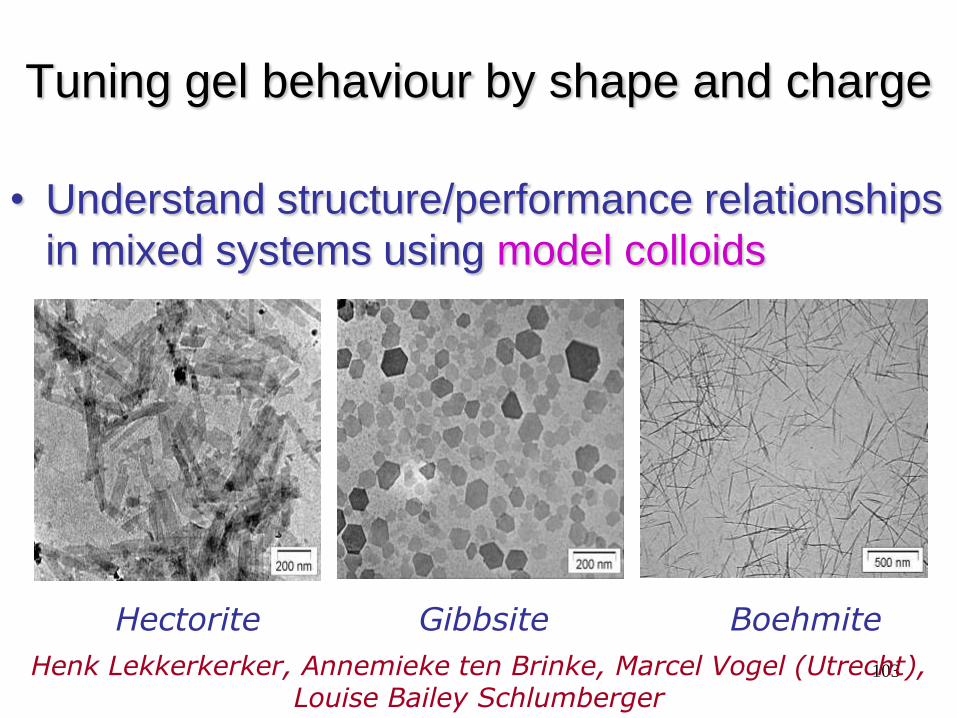
Tuning gel behaviour by shape and charge
• Understand structure/performance relationships
in mixed systems using model colloids
Hectorite Gibbsite Boehmite
Henk Lekkerkerker, Annemieke ten Brinke, Marcel Vogel (Utrecht), Louise Bailey Schlumberger
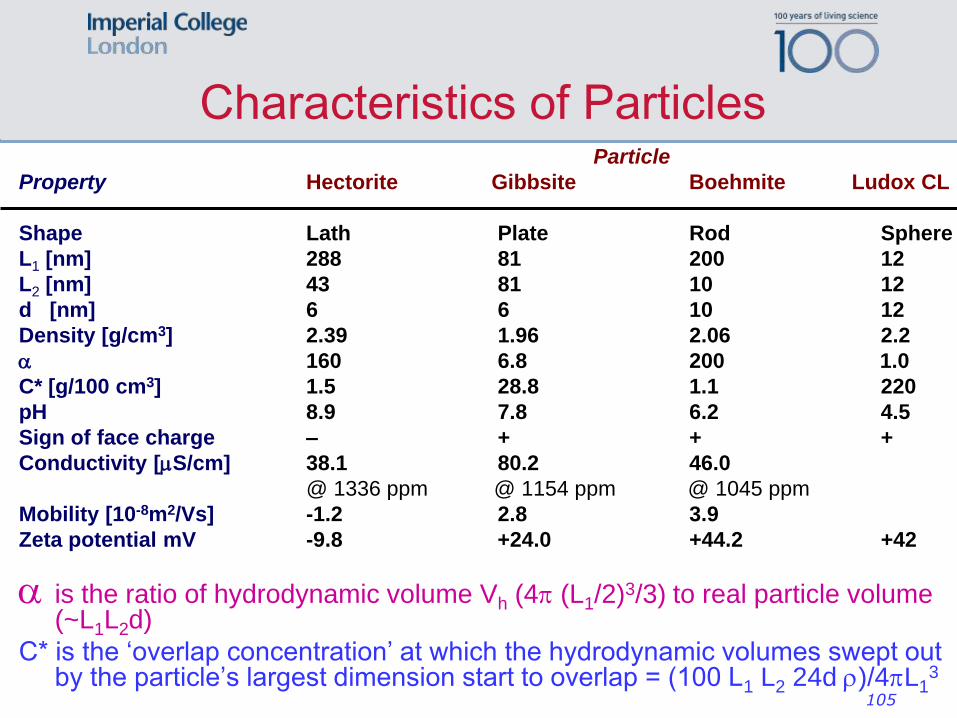
Characteristics of Particles Particle
Property Hectorite Gibbsite Boehmite Ludox CL
Shape Lath Plate Rod Sphere
L1 [nm] 288 81 200 12
L2 [nm] 43 81 10 12
d [nm] 6 6 10 12
Density [g/cm3] 2.39 1.96 2.06 2.2
160 6.8 200 1.0
C* [g/100 cm3] 1.5 28.8 1.1 220
pH 8.9 7.8 6.2 4.5
Sign of face charge – + + +
Conductivity [mS/cm] 38.1 80.2 46.0
@ 1336 ppm @ 1154 ppm @ 1045 ppm
Mobility [10-8m2/Vs] -1.2 2.8 3.9
Zeta potential mV -9.8 +24.0 +44.2 +42
is the ratio of hydrodynamic volume Vh (4p (L1/2)3/3) to real particle volume (~L1L2d)
C* is the ‘overlap concentration’ at which the hydrodynamic volumes swept out by the particle’s largest dimension start to overlap = (100 L1 L2 24d r)/4pL1
3
105
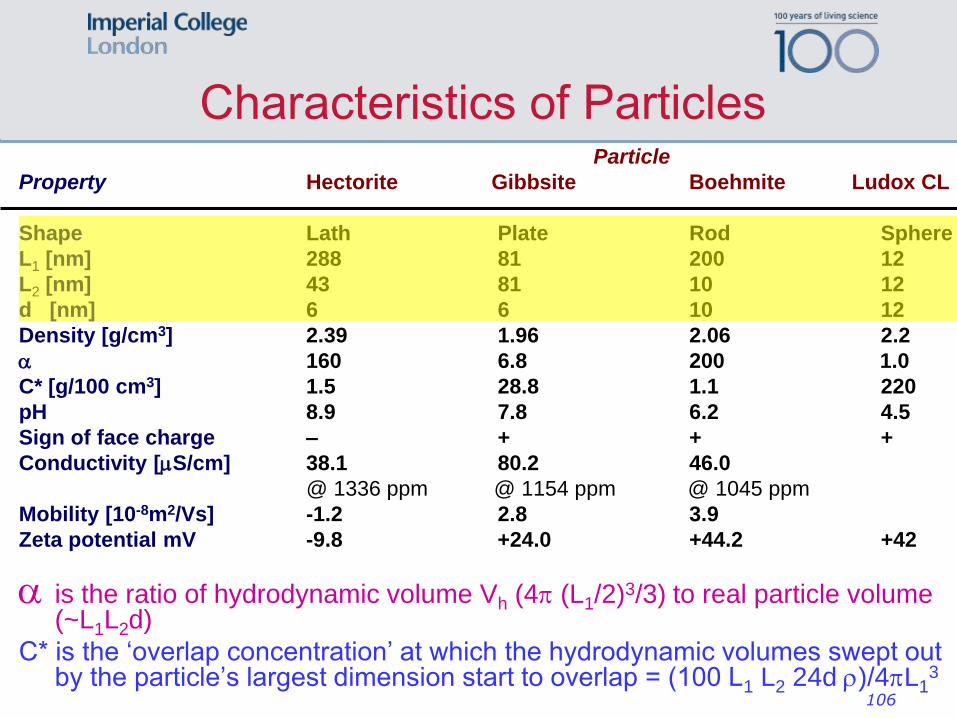
Characteristics of Particles Particle
Property Hectorite Gibbsite Boehmite Ludox CL
Shape Lath Plate Rod Sphere
L1 [nm] 288 81 200 12
L2 [nm] 43 81 10 12
d [nm] 6 6 10 12
Density [g/cm3] 2.39 1.96 2.06 2.2
160 6.8 200 1.0
C* [g/100 cm3] 1.5 28.8 1.1 220
pH 8.9 7.8 6.2 4.5
Sign of face charge – + + +
Conductivity [mS/cm] 38.1 80.2 46.0
@ 1336 ppm @ 1154 ppm @ 1045 ppm
Mobility [10-8m2/Vs] -1.2 2.8 3.9
Zeta potential mV -9.8 +24.0 +44.2 +42
is the ratio of hydrodynamic volume Vh (4p (L1/2)3/3) to real particle volume (~L1L2d)
C* is the ‘overlap concentration’ at which the hydrodynamic volumes swept out by the particle’s largest dimension start to overlap = (100 L1 L2 24d r)/4pL1
3
106
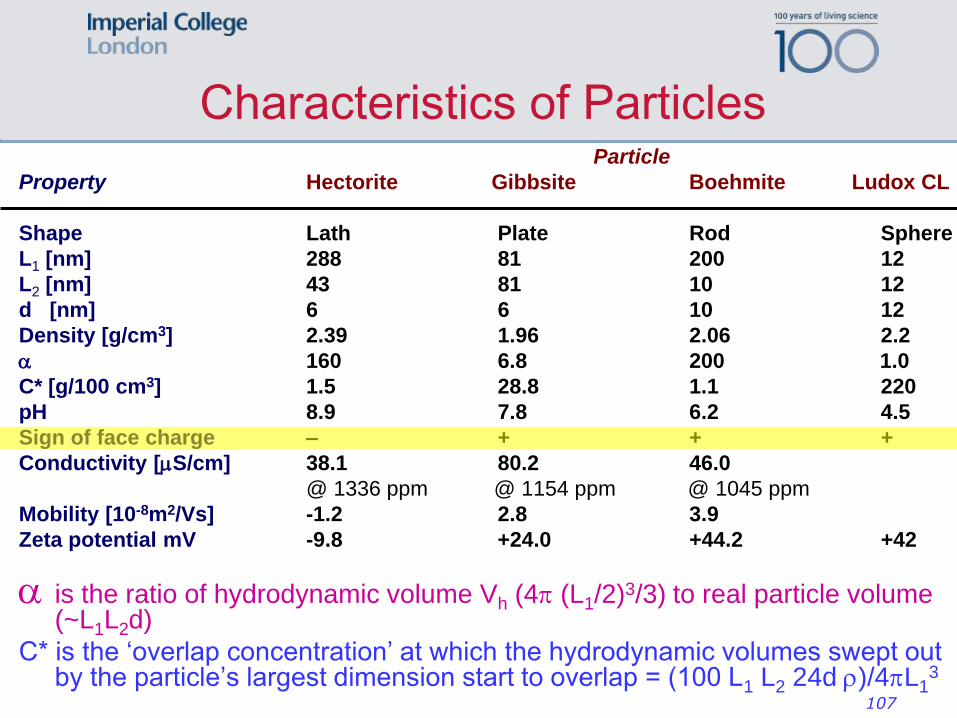
Characteristics of Particles Particle
Property Hectorite Gibbsite Boehmite Ludox CL
Shape Lath Plate Rod Sphere
L1 [nm] 288 81 200 12
L2 [nm] 43 81 10 12
d [nm] 6 6 10 12
Density [g/cm3] 2.39 1.96 2.06 2.2
160 6.8 200 1.0
C* [g/100 cm3] 1.5 28.8 1.1 220
pH 8.9 7.8 6.2 4.5
Sign of face charge – + + +
Conductivity [mS/cm] 38.1 80.2 46.0
@ 1336 ppm @ 1154 ppm @ 1045 ppm
Mobility [10-8m2/Vs] -1.2 2.8 3.9
Zeta potential mV -9.8 +24.0 +44.2 +42
is the ratio of hydrodynamic volume Vh (4p (L1/2)3/3) to real particle volume (~L1L2d)
C* is the ‘overlap concentration’ at which the hydrodynamic volumes swept out by the particle’s largest dimension start to overlap = (100 L1 L2 24d r)/4pL1
3
107
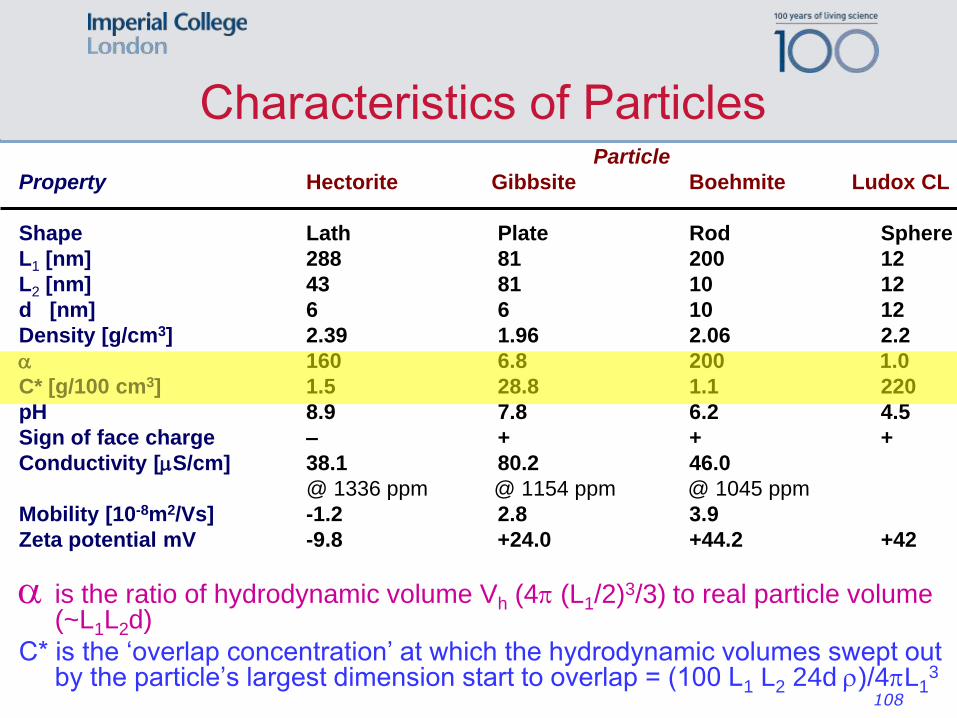
Characteristics of Particles Particle
Property Hectorite Gibbsite Boehmite Ludox CL
Shape Lath Plate Rod Sphere
L1 [nm] 288 81 200 12
L2 [nm] 43 81 10 12
d [nm] 6 6 10 12
Density [g/cm3] 2.39 1.96 2.06 2.2
160 6.8 200 1.0
C* [g/100 cm3] 1.5 28.8 1.1 220
pH 8.9 7.8 6.2 4.5
Sign of face charge – + + +
Conductivity [mS/cm] 38.1 80.2 46.0
@ 1336 ppm @ 1154 ppm @ 1045 ppm
Mobility [10-8m2/Vs] -1.2 2.8 3.9
Zeta potential mV -9.8 +24.0 +44.2 +42
is the ratio of hydrodynamic volume Vh (4p (L1/2)3/3) to real particle volume (~L1L2d)
C* is the ‘overlap concentration’ at which the hydrodynamic volumes swept out by the particle’s largest dimension start to overlap = (100 L1 L2 24d r)/4pL1
3
108
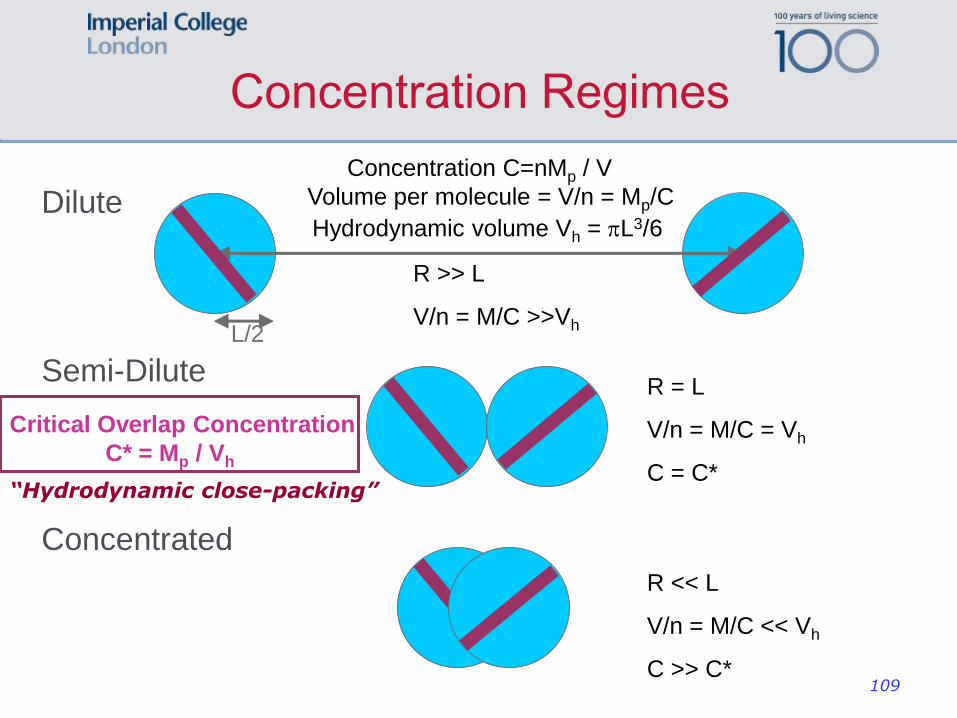
Concentration Regimes
Dilute
Semi-Dilute
Concentrated
R << L
V/n = M/C << Vh
C >> C*
R = L
V/n = M/C = Vh
C = C*
Critical Overlap Concentration
C* = Mp / Vh
L/2
Hydrodynamic volume Vh = pL3/6
R >> L
V/n = M/C >>Vh
Concentration C=nMp / V
Volume per molecule = V/n = Mp/C
“Hydrodynamic close-packing”
109
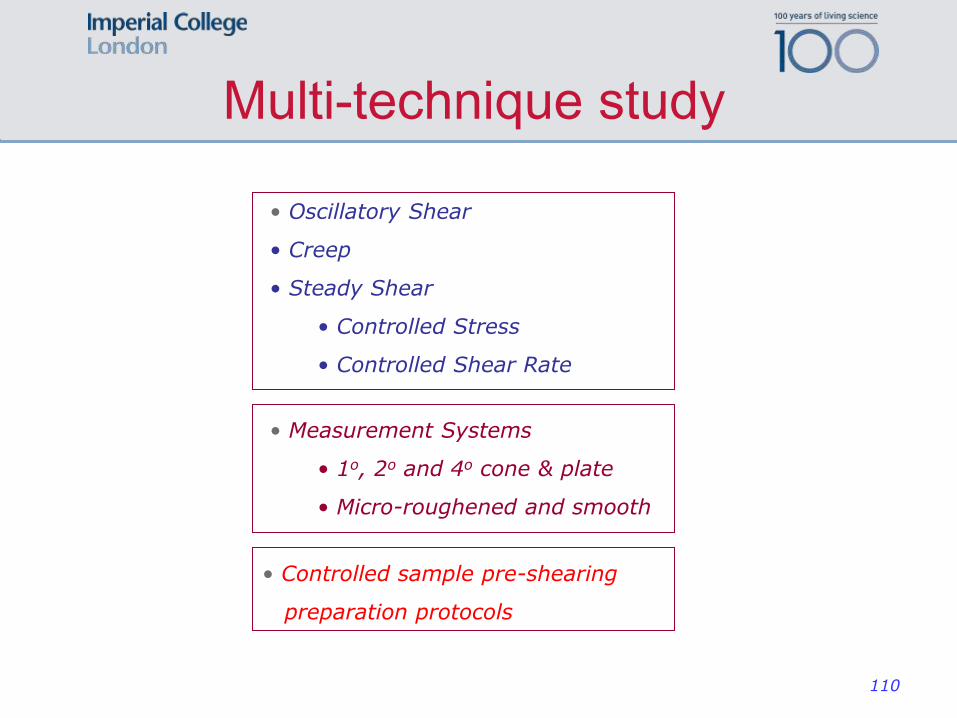
Multi-technique study
• Oscillatory Shear
• Creep
• Steady Shear
• Controlled Stress
• Controlled Shear Rate
• Measurement Systems
• 1o, 2o and 4o cone & plate
• Micro-roughened and smooth
• Controlled sample pre-shearing
preparation protocols
110
Pure Components
A few remarks...
111
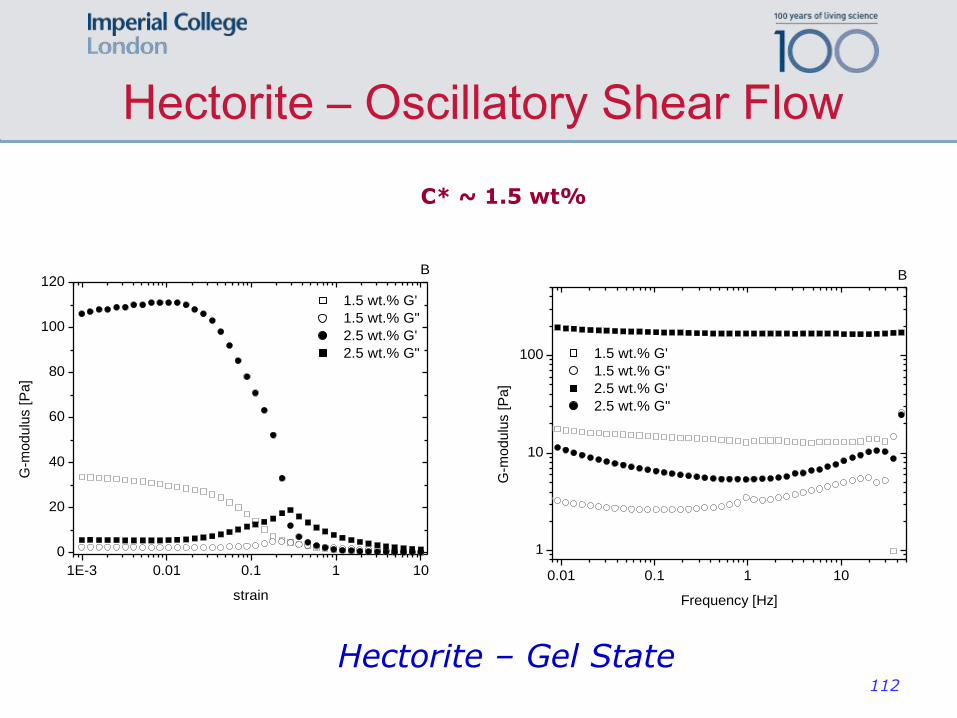
Hectorite – Oscillatory Shear Flow
1E-3 0.01 0.1 1 10
0
20
40
60
80
100
1E-3 0.01 0.1 1 10
0
20
40
60
80
100
120A
1.5 wt.% G'
1.5 wt.% G"
2.5 wt.% G'
2.5 wt.% G"
G-m
odulu
s [
Pa]
strain
1.5 wt.% G'
1.5 wt.% G"
2.5 wt.% G'
2.5 wt.% G"
B
G-m
odulu
s [
Pa]
strain
0.01 0.1 1 10
1
10
100
0.01 0.1 1 10
1
10
100
A
1.5 wt.% G'
1.5 wt.% G"
2.5 wt.% G'
2.5 wt.% G"
G-m
odulu
s [
Pa]
Frequency [Hz]
1.5 wt.% G'
1.5 wt.% G"
2.5 wt.% G'
2.5 wt.% G"
B
G-m
odulu
s [
Pa]
Frequency [Hz]
C* ~ 1.5 wt%
Hectorite – Gel State 112
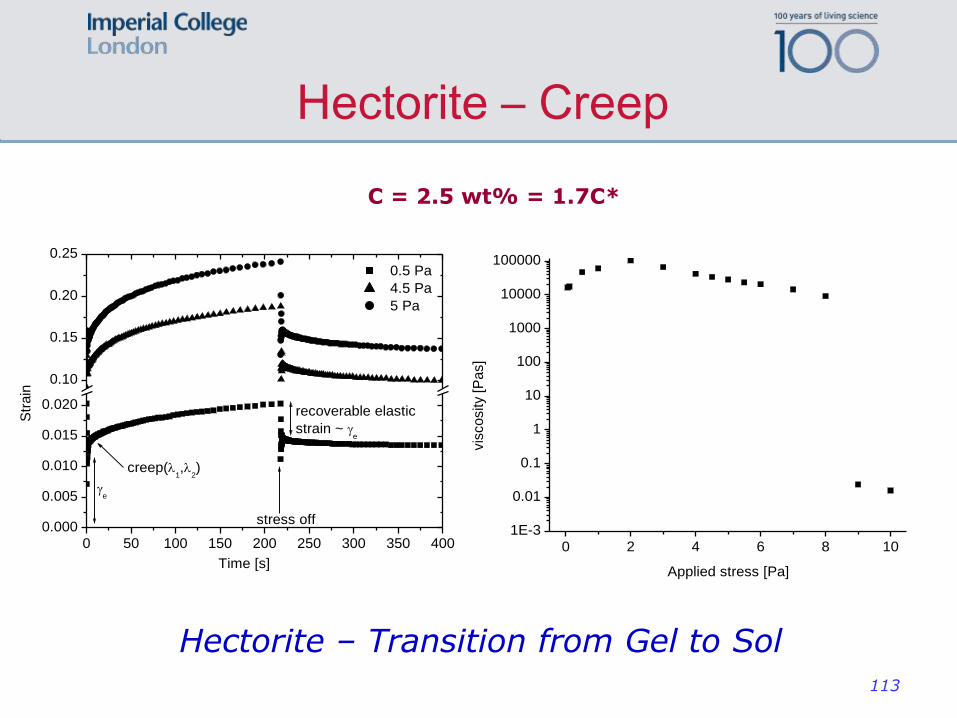
Hectorite – Creep
0 50 100 150 200 250 300 350 400
0.000
0.005
0.010
0.015
0.020
0.10
0.15
0.20
0.25
stress off
recoverable elastic
strain ~ ge
ge
creep(1,
2)
0.5 Pa
4.5 Pa
5 Pa
Str
ain
Time [s]
0 2 4 6 8 10
1E-3
0.01
0.1
1
10
100
1000
10000
100000
vis
co
sity
[Pa
s]
Applied stress [Pa]
C = 2.5 wt% = 1.7C*
Hectorite – Transition from Gel to Sol
113
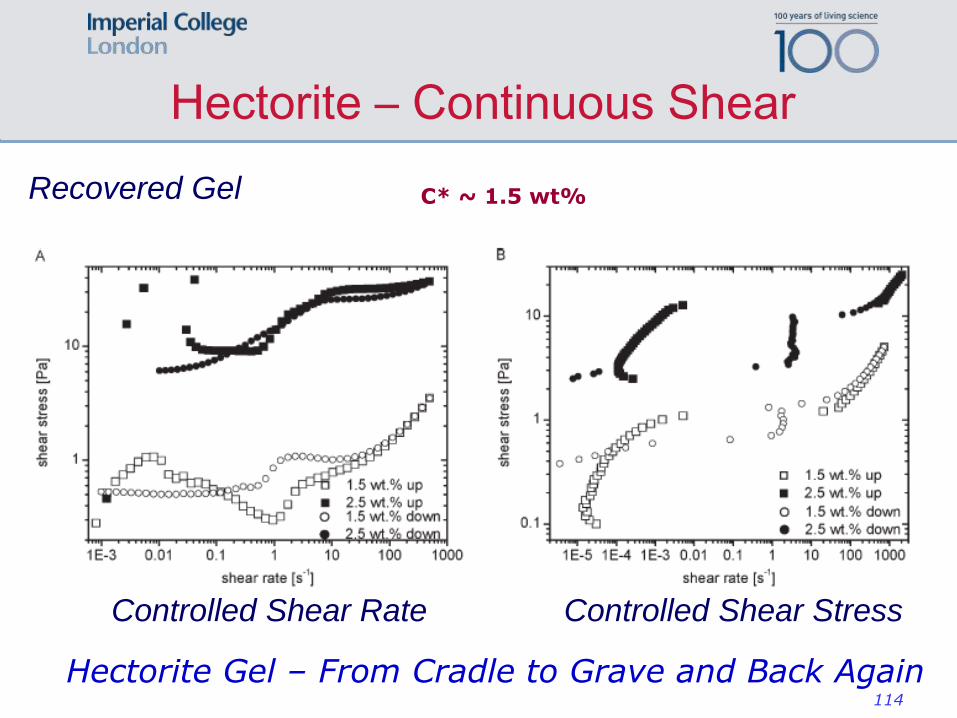
Hectorite – Continuous Shear
Recovered Gel C* ~ 1.5 wt%
Controlled Shear Rate Controlled Shear Stress
Hectorite Gel – From Cradle to Grave and Back Again 114
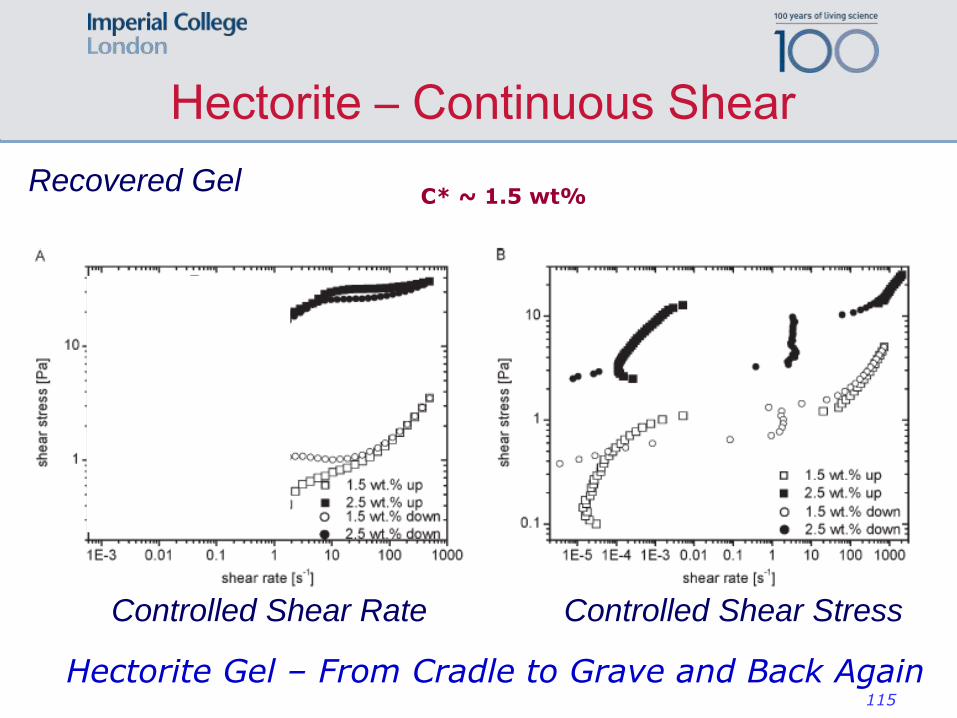
Hectorite – Continuous Shear
Recovered Gel C* ~ 1.5 wt%
Controlled Shear Rate Controlled Shear Stress
Hectorite Gel – From Cradle to Grave and Back Again 115
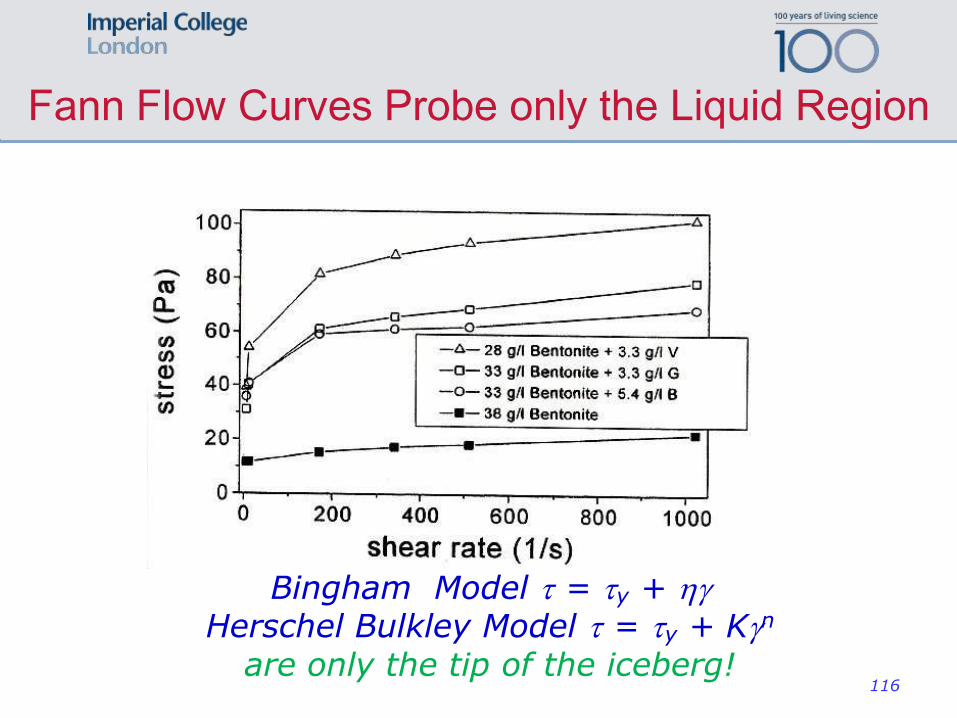
Fann Flow Curves Probe only the Liquid Region
Bingham Model t = ty + hg
Herschel Bulkley Model t = ty + Kgn are only the tip of the iceberg!
116
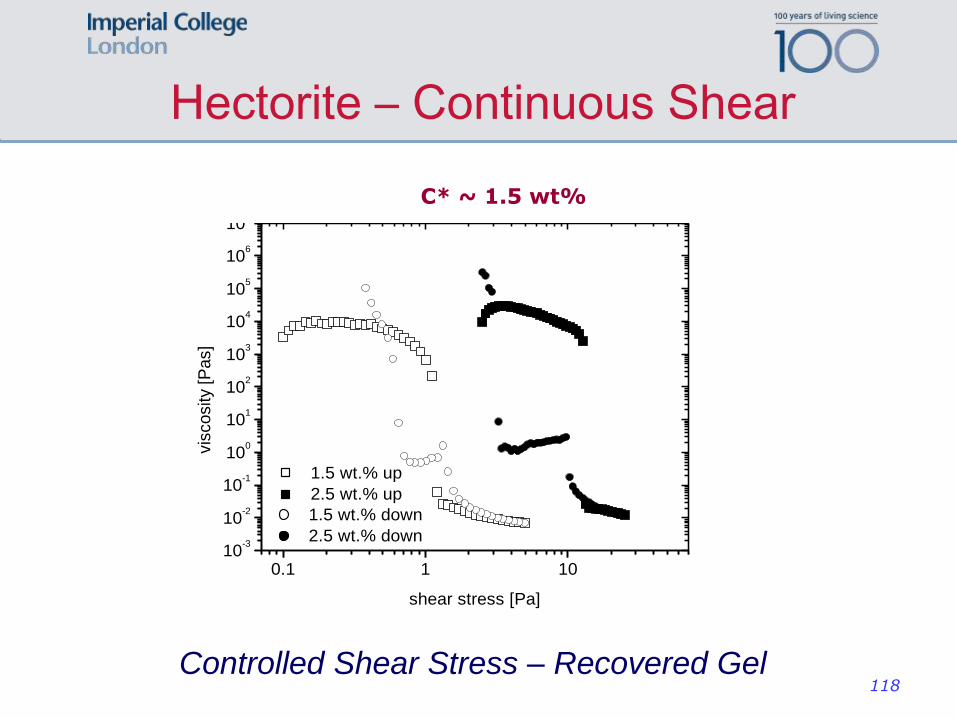
Hectorite – Continuous Shear
Controlled Shear Stress – Recovered Gel
C* ~ 1.5 wt%
1E-3 0.01 0.1 1 10 100 1000
1
10
1E-5 1E-4 1E-3 0.01 0.1 1 10 100 1000
0.1
1
10
0.1 1 1010
-3
10-2
10-1
100
101
102
103
104
105
106
107
1.5 wt.% up
2.5 wt.% up
shear
str
ess [
Pa]
shear rate [s-1]
1.5 wt.% down
2.5 wt.% down
1.5 wt.% up
2.5 wt.% up
shear
str
ess [
Pa]
shear rate [s-1]
1.5 wt.% down
2.5 wt.% down
B
C
A
1.5 wt.% up
2.5 wt.% up
vis
cosity
[Pas]
shear stress [Pa]
1.5 wt.% down
2.5 wt.% down
118
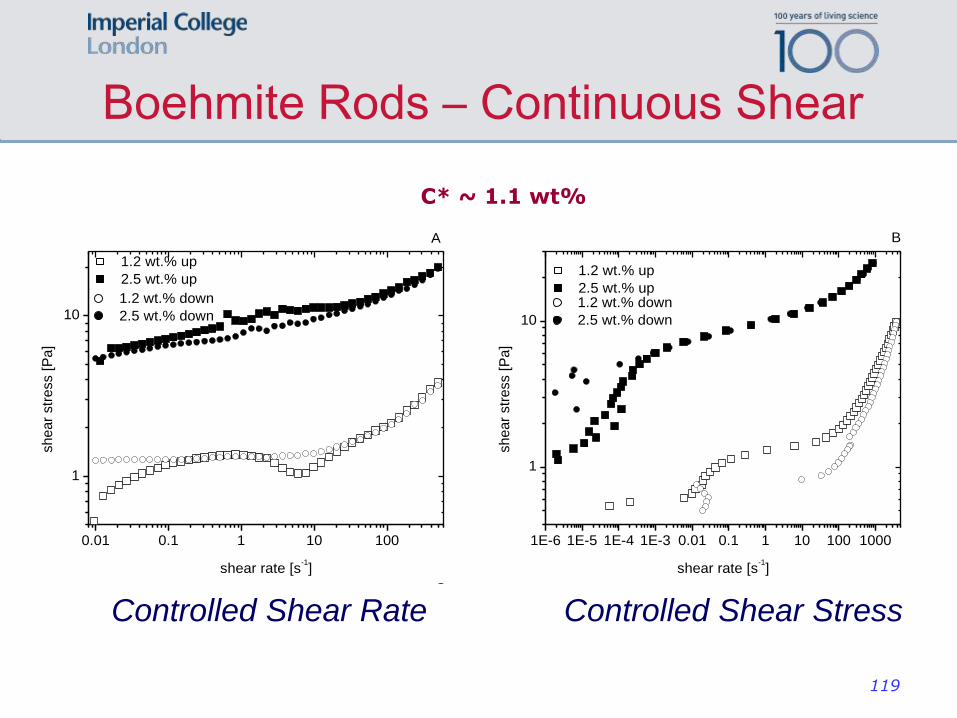
Boehmite Rods – Continuous Shear
Controlled Shear Rate Controlled Shear Stress
C* ~ 1.1 wt%
0.01 0.1 1 10 100
1
10
1E-6 1E-5 1E-4 1E-3 0.01 0.1 1 10 100 1000
1
10
1 10
10-2
10-1
100
101
102
103
104
105
106
1E-5 1E-4 1E-3 0.01 0.1 1 10 100 100010000
1
10
1.2 wt.% up
2.5 wt.% up
A
shear
str
ess [
Pa]
shear rate [s-1]
1.2 wt.% down
2.5 wt.% down
1.2 wt.% up
2.5 wt.% up
B
shear
str
ess [
Pa]
shear rate [s-1]
1.2 wt.% down
2.5 wt.% down
1.2 wt.% up
2.5 wt.% up
vis
cosity
[Pas]
shear stress [Pa]
1.2 wt.% down
2.5 wt.% down
C
1.2 wt.% up
2.5 wt.% up
D
shear
str
ess [
Pa]
shear rate [s-1]
1.2 wt.% down
2.5 wt.% down119

Continuous Shear – Generic Flow Curves
A
BP
M
L
K J
H
G
F
E
D
C
D’
J’
GIV
GIII
GII
GI
SIII
SII
SI
1E-3 0.01 0.1 1 10 100 1000
1
1E-3 0.01 0.1 1 10 100 1000
0.1
1
shear
str
ess [P
a]
shear rate [s ]-1
N
GV
L’
A
BP
M
L
K J
H
G
F
E
D
C
D’
J’
GIVGIV
GIIIGIII
GIIGII
GIGI
SIIISIII
SIISII
SISI
1E-3 0.01 0.1 1 10 100 1000
1
1E-3 0.01 0.1 1 10 100 1000
0.1
1
shear
str
ess [P
a]
shear rate [s ]-1
N
GVGV
L’
GI = Disordered Gel GII = Ordered Gel GIII = Breaking Gel
GIV = Partially-ordered Gel GV = Ordered Gel (not same as GII)
SI = Structured Sol SII = Breaking Fluid SIII = Dispersed, Partially-ordered Sol
120
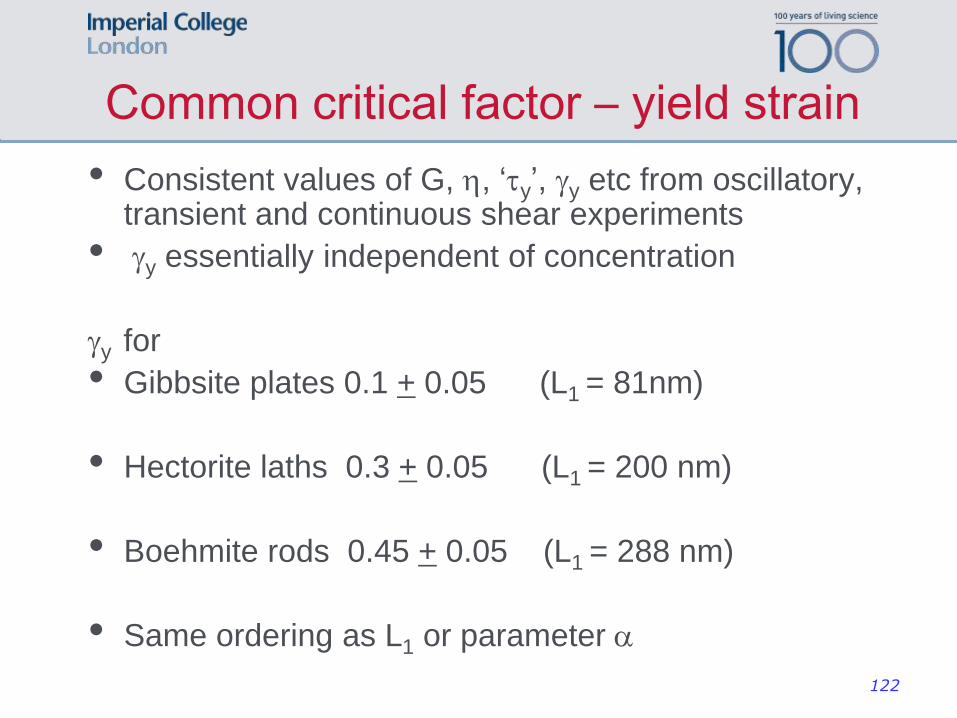
Common critical factor – yield strain
• Consistent values of G, h, ‘ty’, gy etc from oscillatory, transient and continuous shear experiments
• gy essentially independent of concentration
gy for
• Gibbsite plates 0.1 + 0.05 (L1 = 81nm)
• Hectorite laths 0.3 + 0.05 (L1 = 200 nm)
• Boehmite rods 0.45 + 0.05 (L1 = 288 nm)
• Same ordering as L1 or parameter
122
Mixed Shape Dispersions
Replacement of 10 wt% of the Hectorite
(@ 2.5 wt%) by a second component
123
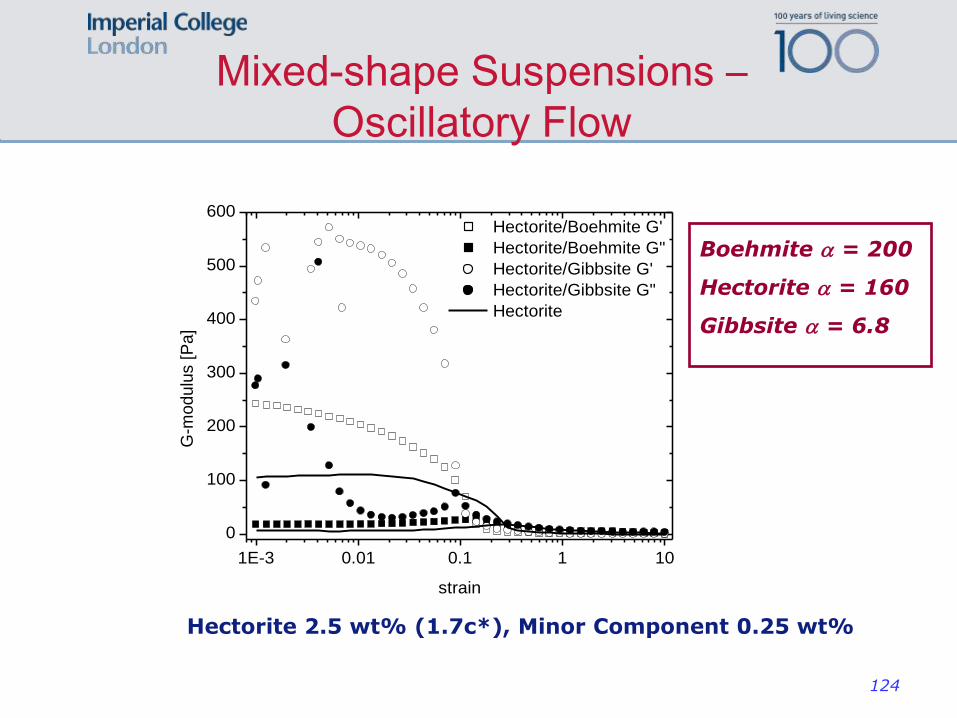
Mixed-shape Suspensions –
Oscillatory Flow
1E-3 0.01 0.1 1 10
0
100
200
300
400
500
600
1E-3 0.01 0.1 1 10
0
100
200
300
400
500
600A B
Hectorite/Boehmite G'
Hectorite/Boehmite G"
Hectorite/Gibbsite G'
Hectorite/Gibbsite G"
Hectorite
G-m
od
ulu
s [
Pa
]
strain
Hectorite/Boehmite G'
Hectorite/Boehmite G"
Hectorite/Gibbsite G'
Hectorite/Gibbsite G"
Hectorite
G
-mo
du
lus [
Pa
]
strain
Hectorite 2.5 wt% (1.7c*), Minor Component 0.25 wt%
Boehmite = 200
Hectorite = 160
Gibbsite = 6.8
124
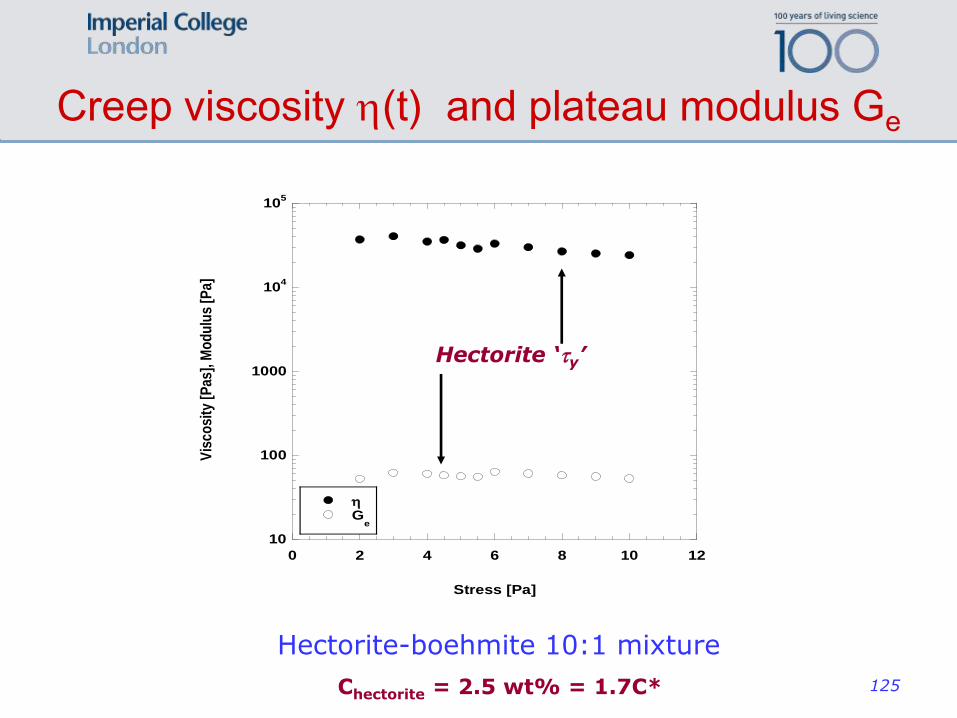
Creep viscosity h(t) and plateau modulus Ge
10
100
1000
104
105
0 2 4 6 8 10 12
hG
e
Vis
co
sity
[P
as],
Mo
du
lus
[Pa
]
Stress [Pa]
Hectorite-boehmite 10:1 mixture
Hectorite ‘ty’
Chectorite = 2.5 wt% = 1.7C* 125
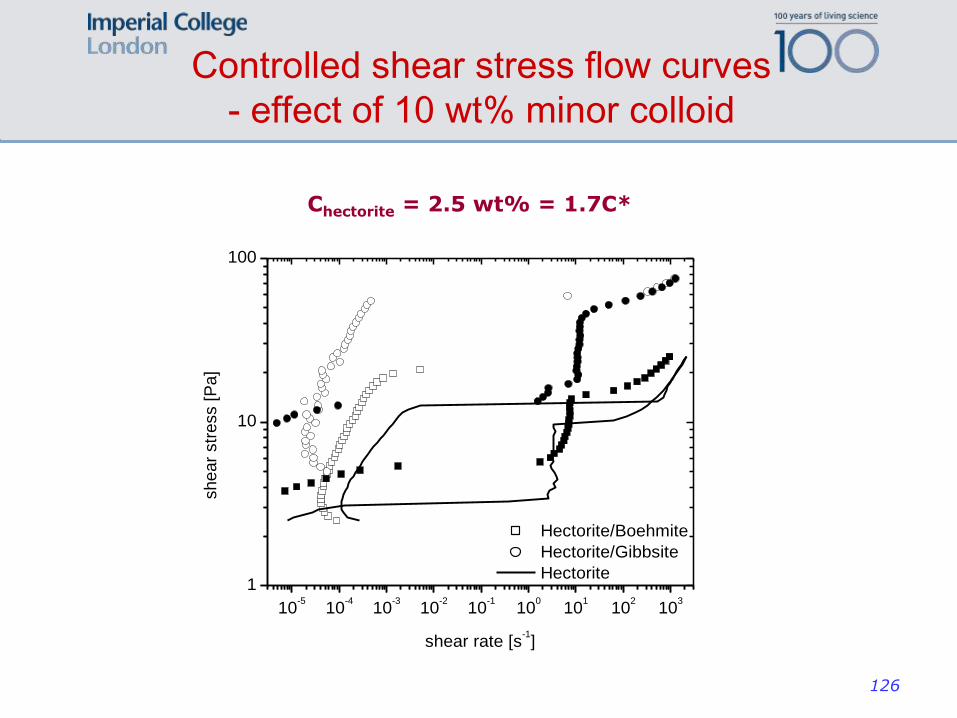
Controlled shear stress flow curves
- effect of 10 wt% minor colloid
10-5
10-4
10-3
10-2
10-1
100
101
102
103
1
10
100
1 10 10010
-2
10-1
100
101
102
103
104
105
106
Hectorite/Boehmite
Hectorite/Gibbsite
Hectorite
sh
ea
r str
ess [
Pa
]
shear rate [s-1]
Hectorite/Boehmite
Hectorite/Gibbsite
Hectorite
vis
co
sity
[Pa
s]
shear stress [Pa]
Chectorite = 2.5 wt% = 1.7C*
126
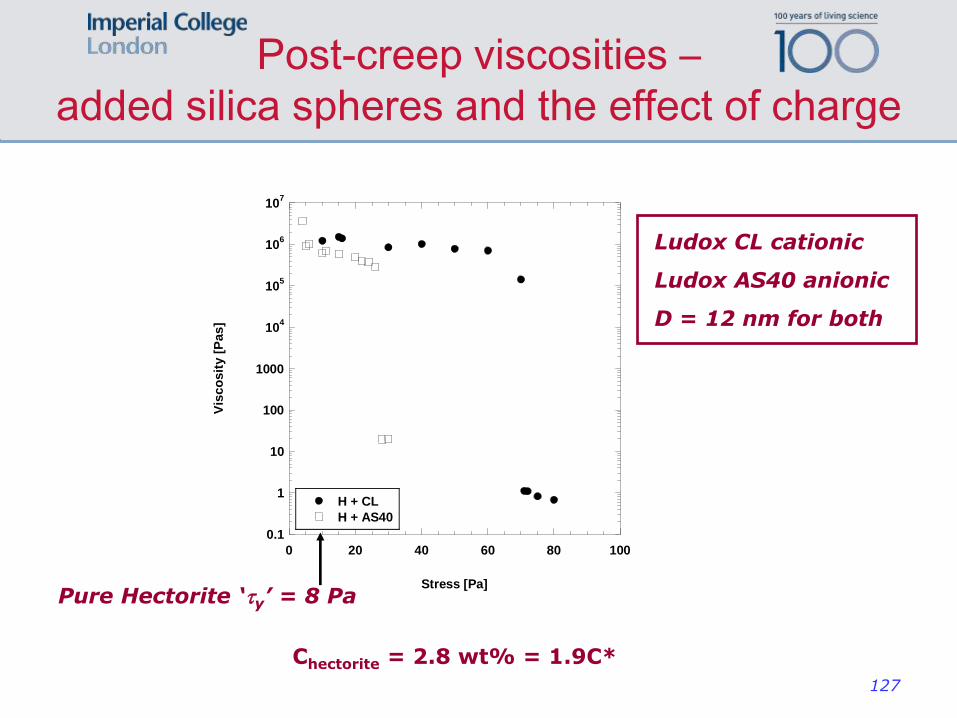
Post-creep viscosities –
added silica spheres and the effect of charge
0.1
1
10
100
1000
104
105
106
107
0 20 40 60 80 100
H + CL
H + AS40
Vis
co
sit
y [
Pa
s]
Stress [Pa]
Ludox CL cationic
Ludox AS40 anionic
D = 12 nm for both
Chectorite = 2.8 wt% = 1.9C*
Pure Hectorite ‘ty’ = 8 Pa
127
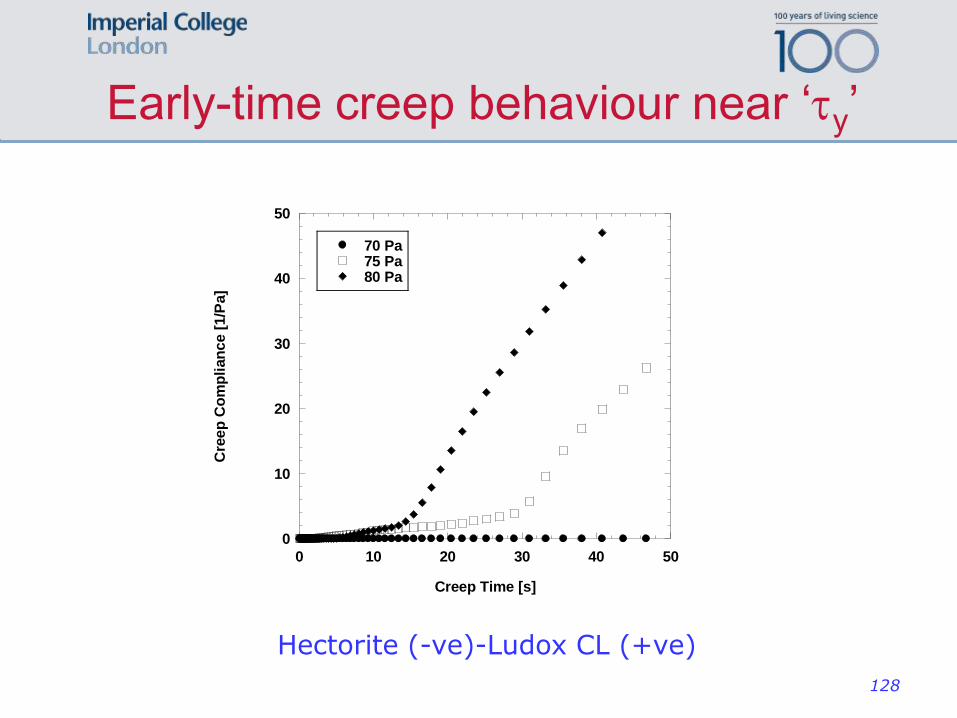
Early-time creep behaviour near ‘ty’
0
10
20
30
40
50
0 10 20 30 40 50
70 Pa75 Pa80 Pa
Cre
ep
Co
mp
lian
ce [
1/P
a]
Creep Time [s]
Hectorite (-ve)-Ludox CL (+ve)
128
130
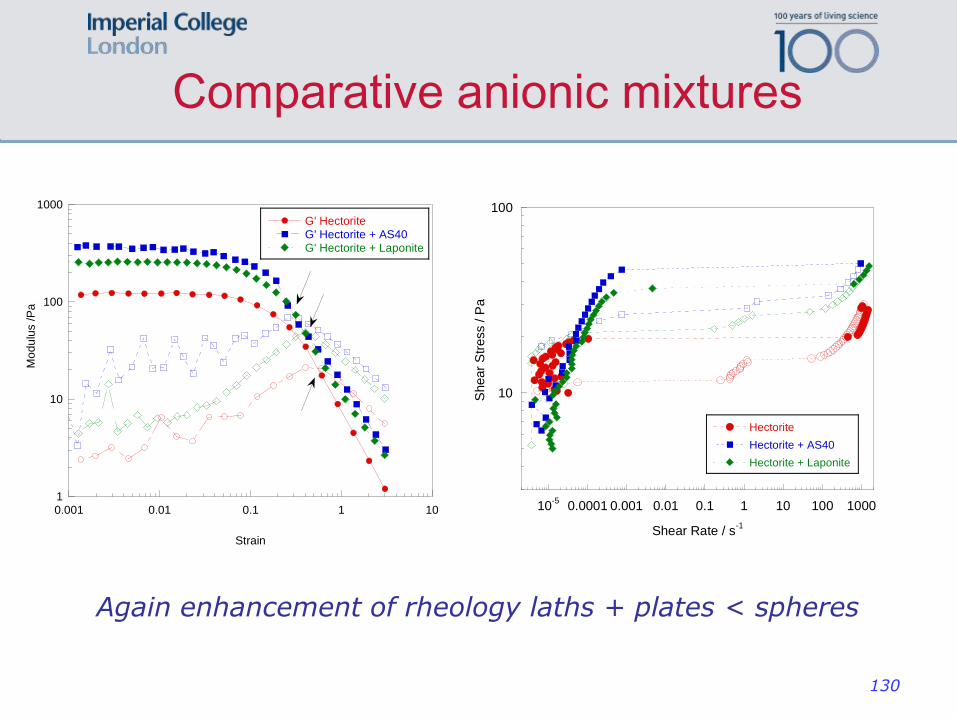
Comparative anionic mixtures
10
100
10-5
0.0001 0.001 0.01 0.1 1 10 100 1000
Hectorite
Hectorite + AS40
Hectorite + Laponite
Shear
Str
ess / P
a
Shear Rate / s-1
1
10
100
1000
0.001 0.01 0.1 1 10
G' HectoriteG' Hectorite + AS40G' Hectorite + Laponite
Mo
du
lus /
Pa
Strain
Again enhancement of rheology laths + plates < spheres
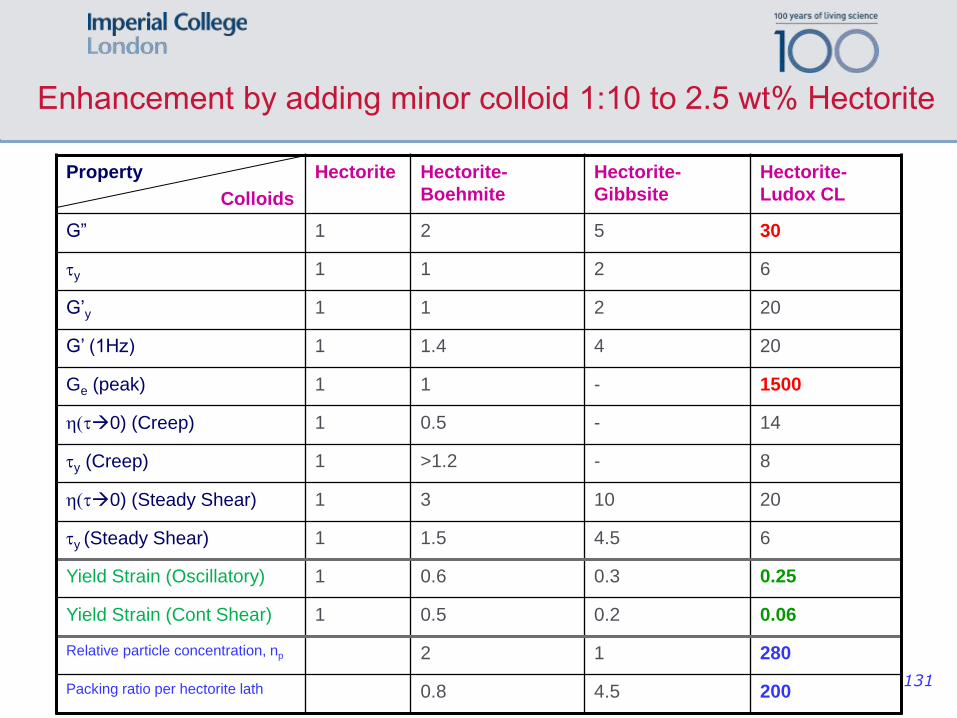
Enhancement by adding minor colloid 1:10 to 2.5 wt% Hectorite
Property
Colloids
Hectorite Hectorite-
Boehmite
Hectorite-
Gibbsite
Hectorite-
Ludox CL
G” 1 2 5 30
ty 1 1 2 6
G’y 1 1 2 20
G’ (1Hz) 1 1.4 4 20
Ge (peak) 1 1 - 1500
h(t0) (Creep) 1 0.5 - 14
ty (Creep) 1 >1.2 - 8
h(t0) (Steady Shear) 1 3 10 20
ty (Steady Shear) 1 1.5 4.5 6
Yield Strain (Oscillatory) 1 0.6 0.3 0.25
Yield Strain (Cont Shear) 1 0.5 0.2 0.06
Relative particle concentration, np 2 1 280
Packing ratio per hectorite lath 0.8 4.5 200 131
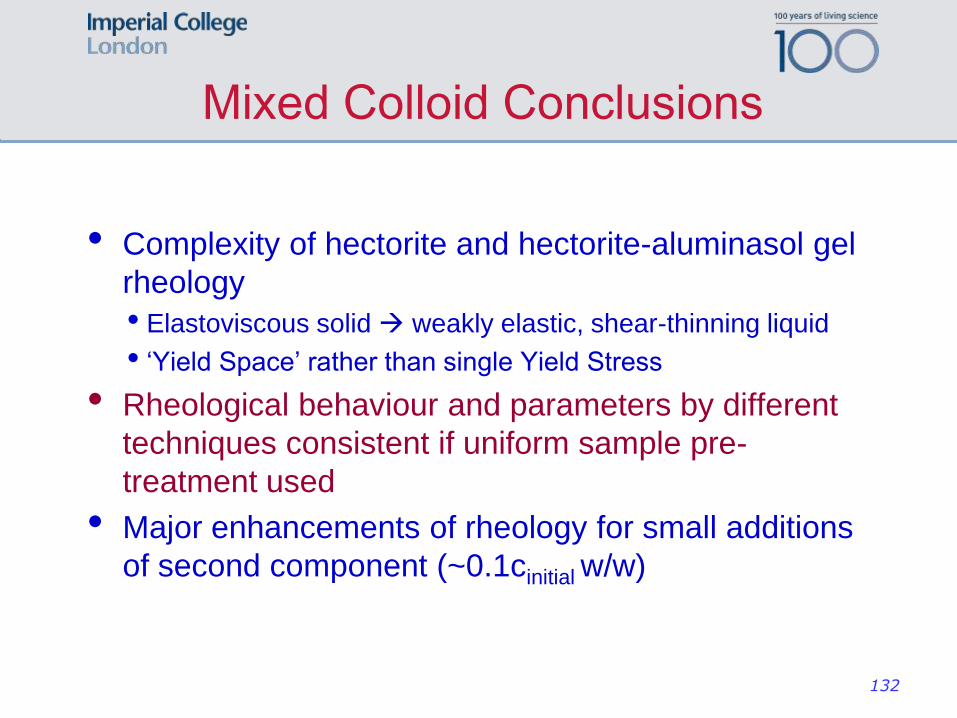
Mixed Colloid Conclusions
• Complexity of hectorite and hectorite-aluminasol gel
rheology
• Elastoviscous solid weakly elastic, shear-thinning liquid
• ‘Yield Space’ rather than single Yield Stress
• Rheological behaviour and parameters by different
techniques consistent if uniform sample pre-
treatment used
• Major enhancements of rheology for small additions
of second component (~0.1cinitial w/w)
132
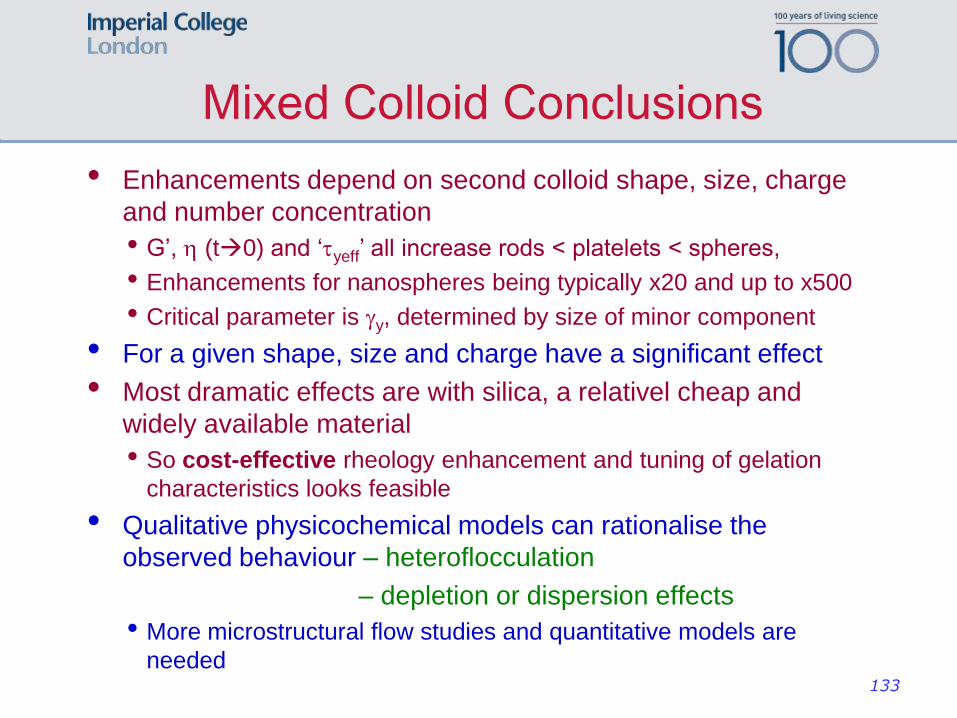
Mixed Colloid Conclusions
• Enhancements depend on second colloid shape, size, charge
and number concentration
• G’, h (t0) and ‘tyeff’ all increase rods < platelets < spheres,
• Enhancements for nanospheres being typically x20 and up to x500
• Critical parameter is gy, determined by size of minor component
• For a given shape, size and charge have a significant effect
• Most dramatic effects are with silica, a relativel cheap and
widely available material
• So cost-effective rheology enhancement and tuning of gelation
characteristics looks feasible
• Qualitative physicochemical models can rationalise the
observed behaviour – heteroflocculation
– depletion or dispersion effects
• More microstructural flow studies and quantitative models are
needed 133
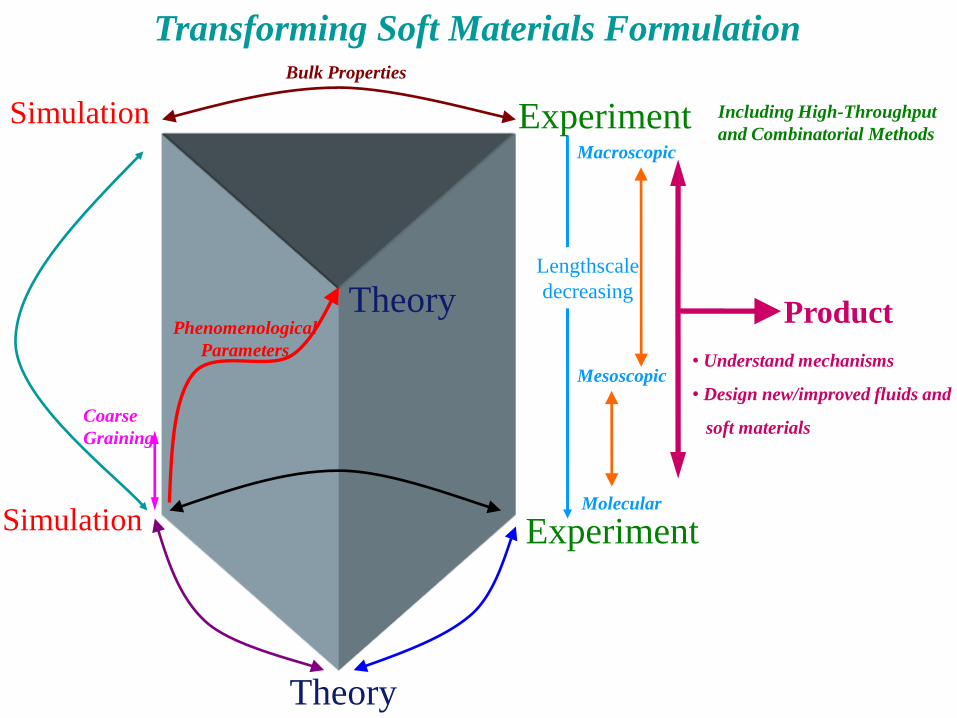
Bulk Properties
Simulation
Theory Phenomenological
Parameters
Simulation
Theory
Experiment Macroscopic
Molecular
Mesoscopic • Understand mechanisms
• Design new/improved fluids and
soft materials
Product
Experiment
Lengthscale
decreasing
Including High-Throughput
and Combinatorial Methods
Coarse
Graining
Transforming Soft Materials Formulation
135
Thank you all for your attention,
thanks to all my collaborators, in
Schlumberger, other companies,
many universities...
and many thanks to the SCI and
RSC Joint Colloid Groups for the
2012 Rideal Lecture Award.