Embed Size (px)
Citation preview

800.644.1704 | bkdcorporatefinance.com
OILFIELD SERVICES MERGERS & ACQUISITIONS PERSPECTIVES
Q4 2017

bkdcorporatefinance.com
INDUSTRY TRENDS
2
The major theme for 2017 has been the convergence of a strong recovery in oil prices (approximately 30 percent since June) and greater extraction efficiencies that have significantly lowered wellhead breakeven prices. As a result of this convergence, rig count, a proxy for oilfield services (“OFS”) activity, increased to 940 in September of 2017 from 407 in May of 2016. We believe this sets up the OFS market for very strong, sustainable financial performance in 2018 and beyond. With a consensus forecast of rising oil prices, better operating characteristics and improving financial performance by most players, 2018 is expected to be a very good year for OFS M&A activity. Those companies that demonstrated resiliency through the last downturn, have diversified customers and geographies and have focused on strong financial performance will be rewarded with premium valuation multiples.
Through the third quarter of 2017, there have been 58 transactions involving OFS companies, consisting of Oil and Gas Drilling and Oil and Gas Equipment and Services sectors in the United States. With a total transaction value of $5.8 billion for the year thus far, transaction value has seen a sharp decline from the same period in 2016 at $10.3 billion. To a large extent, this reflects a slow first quarter as the market sought stabilization of oil prices. For those transactions with disclosed seller financials, valuation multiples have also decreased from 11.9x EBITDA in 2016 to 8.1x EBITDA in year-to-date (“YTD”) September 2017. This decrease in valuation multiples can be attributed to fewer “blockbuster” deals in 2017, concerns of a potential second downturn in oil prices and interestingly, improved profitability of target companies.
CONTENTS
Transaction Activity
Public Comparables
Commodity Prices
Production & Consumption Data
Rig Counts & Breakeven Prices
BKD Services
About BKD Corporate Finance
ABOUT BKDCF
Founded in 1994, BKD Corporate Finance helps companies and stockholders go beyond their numbers by creating value through investment banking solutions that include mergers, acquisitions, sales, recapitalizations, management buyouts and financings.
ENERGY CONTACTS
Ken Hirsch
Managing Director
Dallas, TX
972.702.8262
Jason Corson
Director
Springfield, MO
417.865.8701
Ernest Hunter II
Vice President
Houston, TX
713.499.4600
16
20
1517
19
16
19 1816
2022
Q1 Q2 Q3 Q4 Q1 Q2 Q3 Q4 Q1 Q2 Q3
2015 2016 2017
OFS Transactions
Q1 2015–Q3 2017
O&G Drilling O&G Equipment & Services
Source: Capital IQ

bkdcorporatefinance.com
TRANSACTION ACTIVITY
3
Select Transactions
13%
87%
6%
94%
Transactions by Buyer Type
2016 & YTD September 2017
Financial Buyer Strategic Buyer
$ in millions
Date Acquiring Company Seller Seller Type Price Revenue EBITDAMultiple of
RevenueMultiple
of EBITDA
8/24/17 Tong Petrotech Inc.Cutters Group Management
Services Focused
15 37 - 0.40 N/A
8/14/17 Nabors Industries Ltd. Tesco Corporation Diversified 223 143 -35 1.56 NM
7/21/17 Quanta Services, Inc.Stronghold Ltd. and Stronghold Specialty
Diversified 548 500 - 1.10 N/A
6/20/17Primoris Services Corporation
Primoris Coastal Field Services
Services Focused
28 37 - 0.74 N/A
6/19/17 Enerflex Energy Systems Mesa CompressionServices Focused
106 26 - 4.12 N/A
5/30/17 Ensco plc Atwood OceanicsServices Focused
2,195 711 376 3.09 5.83
12/12/16 Patterson-UTI Energy Seventy Seven Energy Diversified 1,902 606 100 3.14 19.07
10/13/16 CIRCOR International Critical Flow SolutionsEquipment
Focused214 122 25 1.75 8.56
9/23/16 Endurance Lift SolutionsJohn Crane Production Solutions, Inc. and CDI Oilfield Services Srl
Equipment Focused
40 53 - 0.74 N/A
5/19/16 TechnipFMC plc FMC Technologies Diversified 7,836 5,876 807 1.33 9.72
Averages 1.80 10.80
58
72
68
150
89
132
96
79
56
102
123
YTD 2017
2016
2015
2014
2013
2012
2011
2010
2009
2008
2007
OFS Transactions
2007–YTD September 2017
Source: Capital IQ
bkdcorporatefinance.com
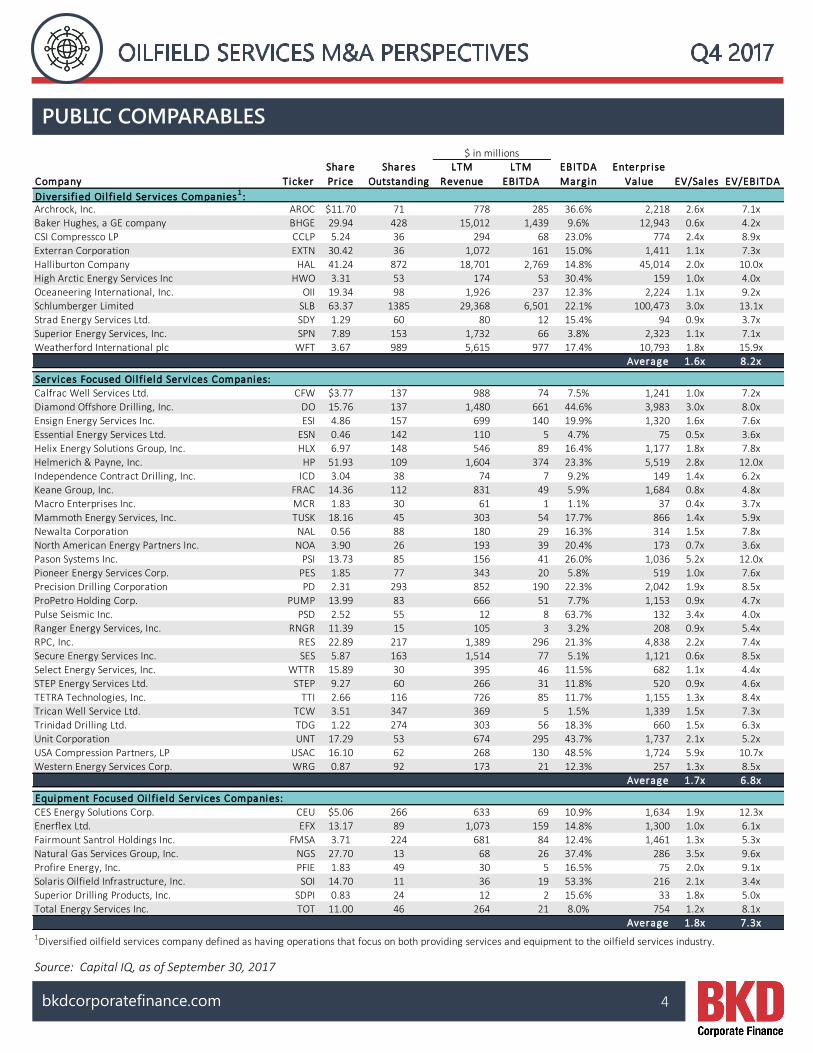
$ in millions
Company Ticker
Share
Pr ice
Shares
Outstanding
LTM
Revenue
LTM
EBITDA
EBITDA
Margin
Enterprise
Value EV/Sales EV/EBITDA
Diversi fied Oi l field Services Companies1 :Archrock, Inc. AROC $11.70 71 778 285 36.6% 2,218 2.6x 7.1x
Baker Hughes, a GE company BHGE 29.94 428 15,012 1,439 9.6% 12,943 0.6x 4.2x
CSI Compressco LP CCLP 5.24 36 294 68 23.0% 774 2.4x 8.9x
Exterran Corporation EXTN 30.42 36 1,072 161 15.0% 1,411 1.1x 7.3x
Halliburton Company HAL 41.24 872 18,701 2,769 14.8% 45,014 2.0x 10.0x
High Arctic Energy Services Inc HWO 3.31 53 174 53 30.4% 159 1.0x 4.0x
Oceaneering International, Inc. OII 19.34 98 1,926 237 12.3% 2,224 1.1x 9.2x
Schlumberger Limited SLB 63.37 1385 29,368 6,501 22.1% 100,473 3.0x 13.1x
Strad Energy Services Ltd. SDY 1.29 60 80 12 15.4% 94 0.9x 3.7x
Superior Energy Services, Inc. SPN 7.89 153 1,732 66 3.8% 2,323 1.1x 7.1x
Weatherford International plc WFT 3.67 989 5,615 977 17.4% 10,793 1.8x 15.9x
Average 1.6x 8.2x
Services Focused Oi l field Services Companies:
Calfrac Well Services Ltd. CFW $3.77 137 988 74 7.5% 1,241 1.0x 7.2x
Diamond Offshore Drilling, Inc. DO 15.76 137 1,480 661 44.6% 3,983 3.0x 8.0x
Ensign Energy Services Inc. ESI 4.86 157 699 140 19.9% 1,320 1.6x 7.6x
Essential Energy Services Ltd. ESN 0.46 142 110 5 4.7% 75 0.5x 3.6x
Helix Energy Solutions Group, Inc. HLX 6.97 148 546 89 16.4% 1,177 1.8x 7.8x
Helmerich & Payne, Inc. HP 51.93 109 1,604 374 23.3% 5,519 2.8x 12.0x
Independence Contract Drilling, Inc. ICD 3.04 38 74 7 9.2% 149 1.4x 6.2x
Keane Group, Inc. FRAC 14.36 112 831 49 5.9% 1,684 0.8x 4.8x
Macro Enterprises Inc. MCR 1.83 30 61 1 1.1% 37 0.4x 3.7x
Mammoth Energy Services, Inc. TUSK 18.16 45 303 54 17.7% 866 1.4x 5.9x
Newalta Corporation NAL 0.56 88 180 29 16.3% 314 1.5x 7.8x
North American Energy Partners Inc. NOA 3.90 26 193 39 20.4% 173 0.7x 3.6x
Pason Systems Inc. PSI 13.73 85 156 41 26.0% 1,036 5.2x 12.0x
Pioneer Energy Services Corp. PES 1.85 77 343 20 5.8% 519 1.0x 7.6x
Precision Drilling Corporation PD 2.31 293 852 190 22.3% 2,042 1.9x 8.5x
ProPetro Holding Corp. PUMP 13.99 83 666 51 7.7% 1,153 0.9x 4.7x
Pulse Seismic Inc. PSD 2.52 55 12 8 63.7% 132 3.4x 4.0x
Ranger Energy Services, Inc. RNGR 11.39 15 105 3 3.2% 208 0.9x 5.4x
RPC, Inc. RES 22.89 217 1,389 296 21.3% 4,838 2.2x 7.4x
Secure Energy Services Inc. SES 5.87 163 1,514 77 5.1% 1,121 0.6x 8.5x
Select Energy Services, Inc. WTTR 15.89 30 395 46 11.5% 682 1.1x 4.4x
STEP Energy Services Ltd. STEP 9.27 60 266 31 11.8% 520 0.9x 4.6x
TETRA Technologies, Inc. TTI 2.66 116 726 85 11.7% 1,155 1.3x 8.4x
Trican Well Service Ltd. TCW 3.51 347 369 5 1.5% 1,339 1.5x 7.3x
Trinidad Drilling Ltd. TDG 1.22 274 303 56 18.3% 660 1.5x 6.3x
Unit Corporation UNT 17.29 53 674 295 43.7% 1,737 2.1x 5.2x
USA Compression Partners, LP USAC 16.10 62 268 130 48.5% 1,724 5.9x 10.7x
Western Energy Services Corp. WRG 0.87 92 173 21 12.3% 257 1.3x 8.5x
Average 1.7x 6.8x
Equipment Focused Oi l field Services Companies:
CES Energy Solutions Corp. CEU $5.06 266 633 69 10.9% 1,634 1.9x 12.3x
Enerflex Ltd. EFX 13.17 89 1,073 159 14.8% 1,300 1.0x 6.1x
Fairmount Santrol Holdings Inc. FMSA 3.71 224 681 84 12.4% 1,461 1.3x 5.3xNatural Gas Services Group, Inc. NGS 27.70 13 68 26 37.4% 286 3.5x 9.6x
Profire Energy, Inc. PFIE 1.83 49 30 5 16.5% 75 2.0x 9.1x
Solaris Oilfield Infrastructure, Inc. SOI 14.70 11 36 19 53.3% 216 2.1x 3.4x
Superior Drilling Products, Inc. SDPI 0.83 24 12 2 15.6% 33 1.8x 5.0x
Total Energy Services Inc. TOT 11.00 46 264 21 8.0% 754 1.2x 8.1x
Average 1.8x 7.3x1Diversified oilfield services company defined as having operations that focus on both providing services and equipment to the oilfield services industry.
PUBLIC COMPARABLES
4
Source: Capital IQ, as of September 30, 2017

bkdcorporatefinance.com
COMMODITY PRICES
5
The Energy Information Administration (“EIA”) forecasts that the Brent crude oil (“Brent”) spot prices will increase approximately 7.5 percent to $55.95 throughout the projection period ending in the fourth quarter of 2018. The EIA forecasts that the West Texas Intermediate (“WTI”) spot prices will increase approximately 9 percent to $52.45 throughout the projection period. The average discount for WTI to Brent spot prices is approximately 6.5 percent throughout the forecast period. The discount that WTI crude trades at relative to Brent crude can be used as a barometer of the attractiveness of the exportation market for domestically produced crude oil. Domestically produced crude becomes increasingly attractive to foreign investment as the discount increases.
0% -2% 0%-4% -3%
-8%-7% -7% -7% -6% -6%
$45.46$49.18 $48.15
$50.85$49.50
$52.45$45.47
$49.25$49.59
$54.52$53.00
$55.95 -15%
-13%
-11%
-9%
-7%
-5%
-3%
-1%
1%$30.00
$34.00
$38.00
$42.00
$46.00
$50.00
$54.00
$58.00
Q2 Q3 Q4 Q1 Q2 Q3 Q4 Q1 Q2 Q3 Q4
2016 2017 2018
WTI
Dis
cou
nt
to B
ren
t
WTI
& B
ren
t Sp
ot
Ave
rage
$ p
er b
bl
WTI & Brent Crude Oil Spot Prices
West Texas Discount to Brent West Texas Intermediate Brent Spot Average
Forecast
$2.22
$2.99$3.15 $3.12 $3.19 $3.06 $3.19
$3.42$3.21 $3.25 $3.35
$1.50
$2.00
$2.50
$3.00
$3.50
$4.00
Q2 Q3 Q4 Q1 Q2 Q3 Q4 Q1 Q2 Q3 Q4
2016 2017 2018
$ p
er m
cf
Henry Hub Spot Price
Forecast
The EIA forecasts that the Henry Hub spot price will increase approximately 9.5 percent to $3.35 throughout theprojection period to the fourth quarter of 2018.
Source: Energy Information Administration

bkdcorporatefinance.com
PRODUCTION & CONSUMPTION DATA
6
The EIA forecasts crude oil and dry natural gas production growth of approximately 8 percent over the five-quarter forecast period to the fourth quarter of 2018.
21.5 21.0 20.7 20.7 20.9 21.2 21.6 22.4 22.8 23.0 23.0 23.2
Q1 Q2 Q3 Q4 Q1 Q2 Q3 Q4 Q1 Q2 Q3 Q4
2016 2017 2018
mm
bo
e/d
U.S. Crude Oil & Dry Natural Gas Production
Crude Oil Production Dry Natural Gas Production
The EIA’s forecast for total world supply is expected to outpace consumption by approximately 200,000 barrels (bbl) per day beginning in the fourth quarter of 2017. The forecast is expecting a supply deficit in the first quarter of 2018, followed by a surplus of approximately 600,000 bbl per day by the second quarter of 2018. The EIA estimates that 2018 will end with approximately 400,000 bbl per day surplus of world petroleum and other liquids production.
97
.0
96
.5
97
.0 98
.4
97
.0
97
.6
98
.3
99
.1
98
.9
10
0.0
10
0.4
10
0.9
96
.0
96
.4 97
.6
97
.9
97
.2
98
.3
98
.8
98
.9
99
.1
99
.5
10
0.6
10
0.5
-1.5
-1.0
-0.5
0.0
0.5
1.0
1.5
75.0
80.0
85.0
90.0
95.0
100.0
105.0
Q1 Q2 Q3 Q4 Q1 Q2 Q3 Q4 Q1 Q2 Q3 Q4
2016 2017 2018
Surp
lus/
Def
icit
mm
BB
Ls
Wo
rld
Su
pp
ly &
Co
nsu
mp
tio
nM
MB
OE
per
day
World Petroleum & Other Liquids Production & Consumption
Total World Supply Total World Consumption Total Surplus/(Deficit)
Forecast
Over-SuppliedUnder-Supplied
Forecast
Source: Energy Information Administration

bkdcorporatefinance.com
RIG COUNTS & BREAKEVEN PRICES
7
The Active Rotary Rig count in the U.S. increased from a low of 407 in May 2016 to its near highest of 940 in the past two years in September of 2017. Active rig count is a closely followed metric as it gives the market an idea of not only how active the industry is, but also where the industry is most active. Active rotary rig count is an important indication for the level of demand from the services industry, as an increase in rig count directly translates to an increase in demand for the associated services provided by services companies.
79
1
76
0
71
4
65
4
53
2
47
7
43
7
40
7
41
7
44
9
48
1
50
9
54
3
58
0
63
4
68
3 74
4
78
9 85
3
89
3
93
1
95
3
94
7
94
0
2015 2016 2017
Active Rotary Rigs in the U.S.
October 2015–September 2017
Breakeven Prices by Key Shale Plays
The average price per barrel necessary to generate a profit is about half of what it was in 2010, falling from an average of $74.90 per barrel to $35.70 per barrel across U.S. key shale plays. Improvements in extraction continue to lower this breakeven price in 2017. The Permian Midland basin has seen the largest decrease, falling from $80.50 in 2010 to an estimated $38.90 in 2017. The breakeven price from 2010 to estimated 2017 for each key shale play is featured in the chart below.
Sources: Baker Hughes, Rystad Energy
$0.0
$20.0
$40.0
$60.0
$80.0
$100.0
Bakken Eagle Ford Niobrara Delaware Basin Midland Basin
$ p
er b
bl
2010 2011 20122013 2014 20152016 2017E Average 2010 BreakevenAverage 2017 Breakeven

bkdcorporatefinance.com
BKD SERVICES
Abundant services.
Sheer precision.
BKD, LLP offers a full range of services and industry-focused expertise to provide you with insightful solutions and help you stay a cut above the competition.
FINANCIAL
ASSURANCE• Audit, review & compilations• Benchmarking• Internal audit• Internal control studies• SEC filings• SOX 404 compliance
CONSULTING• Accounting outsourcing• Bankruptcy consulting• Budgeting & financial planning• Cost accounting• Employee benefit plan
structuring & administering• ESOP feasibility analysis• Forecasts & projections
FEDERAL & STATE TAX
PLANNING & COMPLIANCE• Compensation planning• Corporate tax planning• Inventory tax planning• R&D tax credit enhancements• Real estate cost segregation
studies• Restructuring planning• State & local tax planning
FORENSICS & VALUATION
CONSULTING• Bankruptcy services• Business valuations• Fraud prevention• Litigation support
INTERNATIONAL TAX
STRATEGIES• DISC• Expatriate assignment services• Foreign tax credit planning• Global structuring support• Indirect global taxes• Transfer pricing
INVESTMENT & FINANCIAL
PLANNING• Estate & gift planning• Family tax planning• Investment management• Personal wealth planning• Retirement planning
TRANSACTION SERVICES• Federal, state & local tax
diligence• Financial diligence• Operations diligence• Technology diligence
GROWTH & ADVISORY
INVESTMENT BANKING• Mergers & acquisitions• Company sales & divestitures• Debt & equity recapitalizations• Management buyouts• Affiliations• Succession planning• Strategic options analysis
ECONOMIC DEVELOPMENT• Expansion projects• Grants & public incentives
INTERNATIONAL MARKET• Development• Exporting• Direct investment• Licensing• Acquisitions
OPERATIONS MANAGEMENT
PERFORMANCE ENHANCEMENT
ADVICE & KNOW-HOW (PEAK)
METHODOLOGY• Business process improvement• Decision costing• Inventory optimization• Lean manufacturing• Profit improvement
TECHNOLOGY
APPLICATIONS SOFTWARE• Best-Abra• MAS 90, 200 & 500• Microsoft CRM• Microsoft Dynamics AX• Microsoft Dynamics GP
IT SERVICES• IT assessments & planning• IT control reviews• Project management assistance• Security solutions & penetration
testing
STRATEGIC TECHNOLOGY• E-business planning• IT assessments & planning• Systems selection & implementation
8

bkdcorporatefinance.com
ABOUT US
BKDCF, a wholly owned subsidiary of BKD, LLP, helps companies and stockholders go beyond their numbers by creating value through investment banking solutions that include mergers, acquisitions, sales, recapitalizations, management buyouts and financings.
Founded in 1994, BKDCF is staffed with experienced investment bankers and financial analysts. In addition, the firm draws on the resources of BKD with its network of accountants, auditors, tax professionals, business consultants and industry-specific consultants.
BKDCF is a member of the Financial Industry Regulatory Authority and the Securities Investor Protection Corporation.
The professionals of BKD Corporate Finance, LLC (BKDCF) have more than 100
years of combined experience helping company owners plan for and execute
their growth and exit strategies. From managing the sale of a company to
negotiating the acquisition of a competitor or raising debt and equity capital to
improve financial and operational flexibility, BKDCF can help you to develop a
specific course of action for achieving your desired results.
Construction &
Engineering
Financial
Services
Health
Care
Manufacturing
&
Distribution
Business
Services
Consumer
Services &
Products
Energy
Technology,
Media &
Telecom
INDUSTRY FOCUSCONTACT US – ENERGY TEAM
9
Ken Hirsch
Managing Director
Dallas, TX
972.702.8262
Jason Corson
Director
Springfield, MO
417.865.8701
Ernest Hunter II
Vice President
Houston, TX
713.499.4600