Embed Size (px)
Citation preview
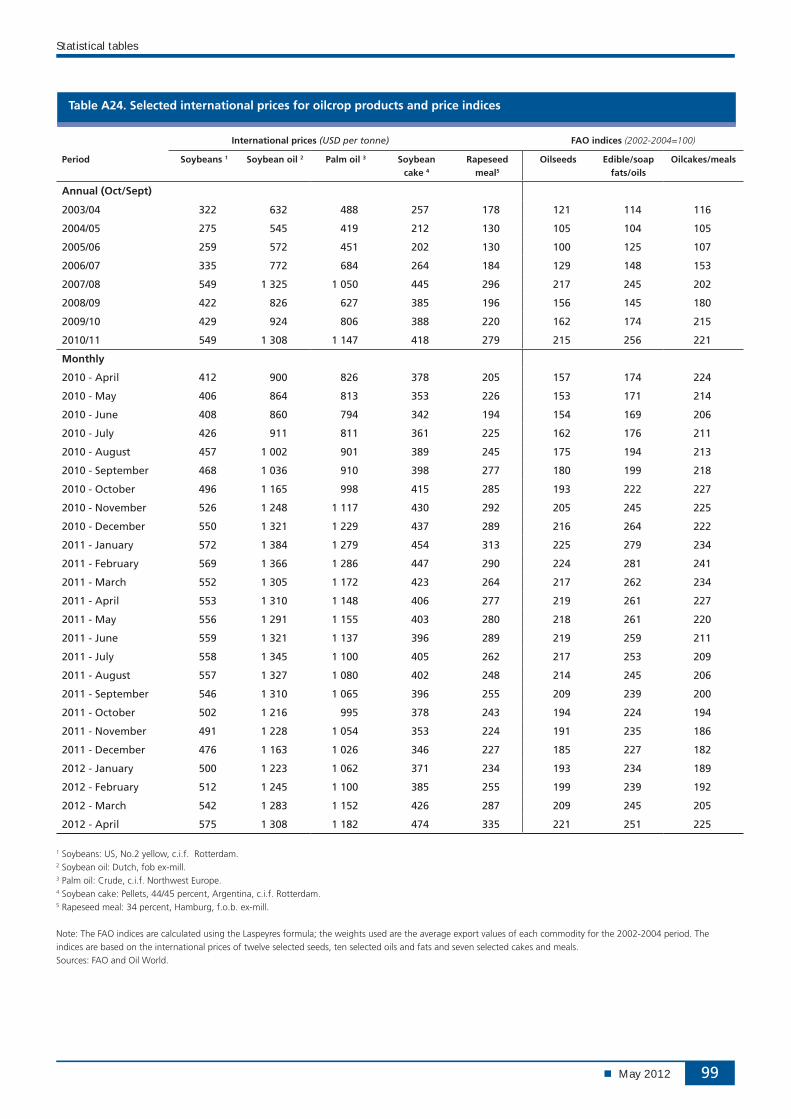
May 2012 5
Oilseeds market summary
After two seasons of relatively ample supplies, in 2011/12, the market for oilseeds and derived products is set to tighten again. Global oilcrop production will not be sufficient to satisfy growing demand for oils and meals. Global soybean production is estimated to decrease by almost 10 percent, one of the steepest year-on-year falls on record. With oilcrops other than soybeans only partly compensating for the shortfall, total oilcrop production should drop by 4 percent from last season to a three-year low. Notwithstanding, a moderate growth in global oil supplies should be possible, thanks mainly to further expanding palm oil production and to the availability of large stocks at the beginning of the season. Global meal supplies, on the other hand, given their heavy dependence on soybeans, anticipate to experience a pronounced drop. With respect to demand, global consumption of oils/fats should continue expanding at an about average rate, which also reflects further rising demand from the biodiesel industry. By contrast, growth in meal consumption is expected to slow down markedly, as reduced supplies and rising meal prices are expected to curtail demand. In general, consumption growth could only be satisfied by drawing from inventories with a conspicuous reduction in global stocks of oils, and especially meals, likely to be necessary. This will push the global stock-to-use ratios for both product groups to historically low levels. Consequently, following the last few months’ rise in international quotations for oilseeds and derived products, continued firmness in prices seems likely. Adding to market concerns is the prospect of only a modest, if any, growth in 2012/13 aggregate oilcrop plantings in the northern hemisphere, which would imply a strong reliance on South America for an improvement in the global supply situation.
50
100
150
200
250
300
20122011201020092008200720062005
Meals/cakes
Oils/fats
Oilseeds
FAO monthly international price indices for oilseeds, oils/fats and meals/cakes (2002-2004=100)
Contact:
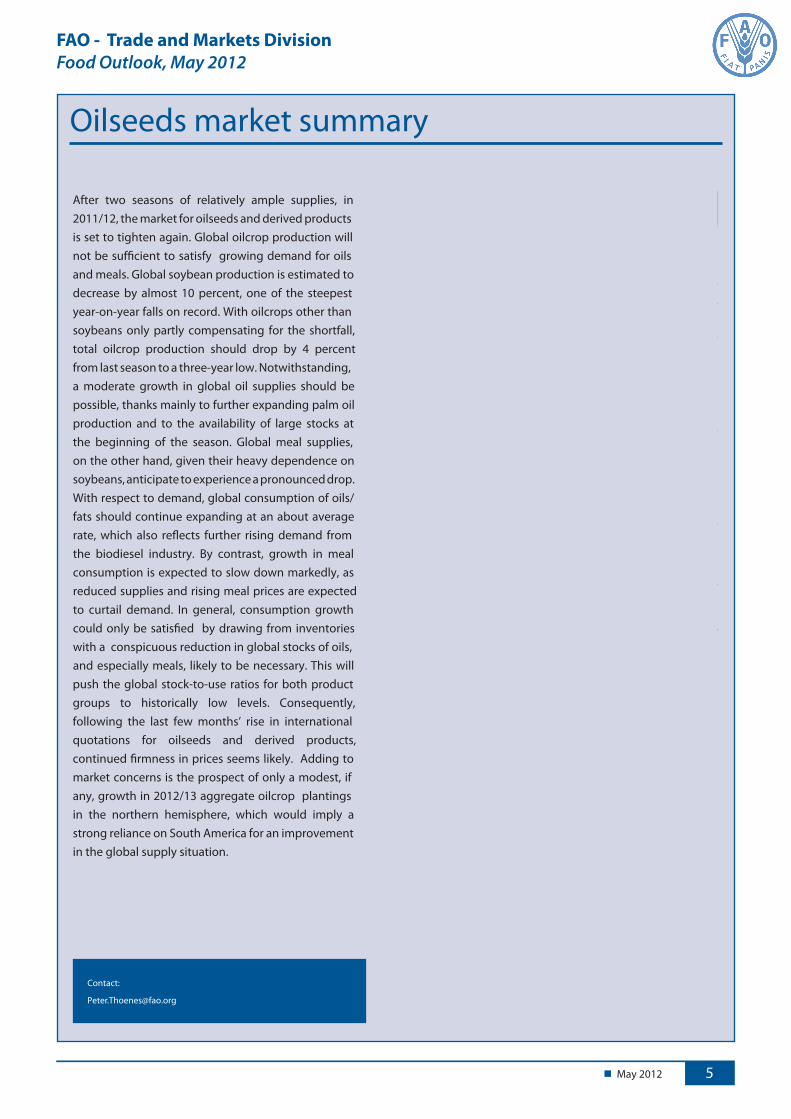
World oilseed and product market at a glance
2009/10 2010/11 2011/12
Change: 2011/12
over 2010/11
estim. f'cast
million tonnes %
TOTAL OILSEEDS
Production 456.7 468.0 450.9 -3.7
OILS AND FATS
1.19.1819.9716.271noitcudorP
8.15.2128.8024.691ylppuS
9.43.5817.6717.861noitazilitU
5.42.691.295.98edarT
Stock-to-utilization ratio (%) 16.5 17.4 14.8
MEALS AND CAKES
0.6-7.0118.7111.411noitcudorP
7.3-9.1319.6312.821ylppuS
1.20.6116.3114.701noitazilitU
9.05.079.962.76edarT
Stock-to-utilization ratio (%) 17.8 18.7 13.2
FAO PRICE INDICES (Jan-Dec) (2002-2004=100) 2010 2011 2012
Change: Jan-Apr 2012
over Jan-Apr 2011
Jan-Apr %
Oilseeds 172 211 205 -7.2
2.31-302212712sekac/slaeM
7.01-242252491staf/sliO
Note: Refer to table 11 for further explanation regarding definitions and coverage.
FAO - Trade and Markets DivisionFood Outlook, May 2012
Food Outlook
May 201232
OILSEEDS, OILS AND MEALS 9
PRICES 10
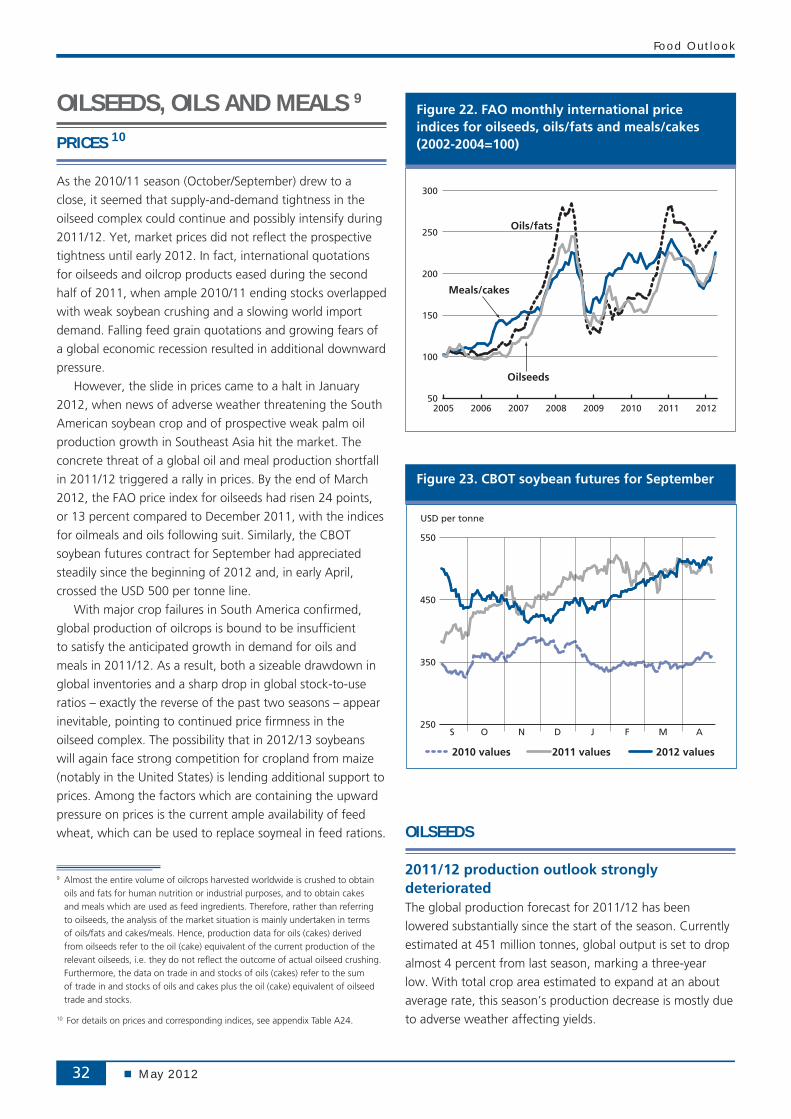
As the 2010/11 season (October/September) drew to a
close, it seemed that supply-and-demand tightness in the
oilseed complex could continue and possibly intensify during
2011/12. Yet, market prices did not reflect the prospective
tightness until early 2012. In fact, international quotations
for oilseeds and oilcrop products eased during the second
half of 2011, when ample 2010/11 ending stocks overlapped
with weak soybean crushing and a slowing world import
demand. Falling feed grain quotations and growing fears of
a global economic recession resulted in additional downward
pressure.
However, the slide in prices came to a halt in January
2012, when news of adverse weather threatening the South
American soybean crop and of prospective weak palm oil
production growth in Southeast Asia hit the market. The
concrete threat of a global oil and meal production shortfall
in 2011/12 triggered a rally in prices. By the end of March
2012, the FAO price index for oilseeds had risen 24 points,
or 13 percent compared to December 2011, with the indices
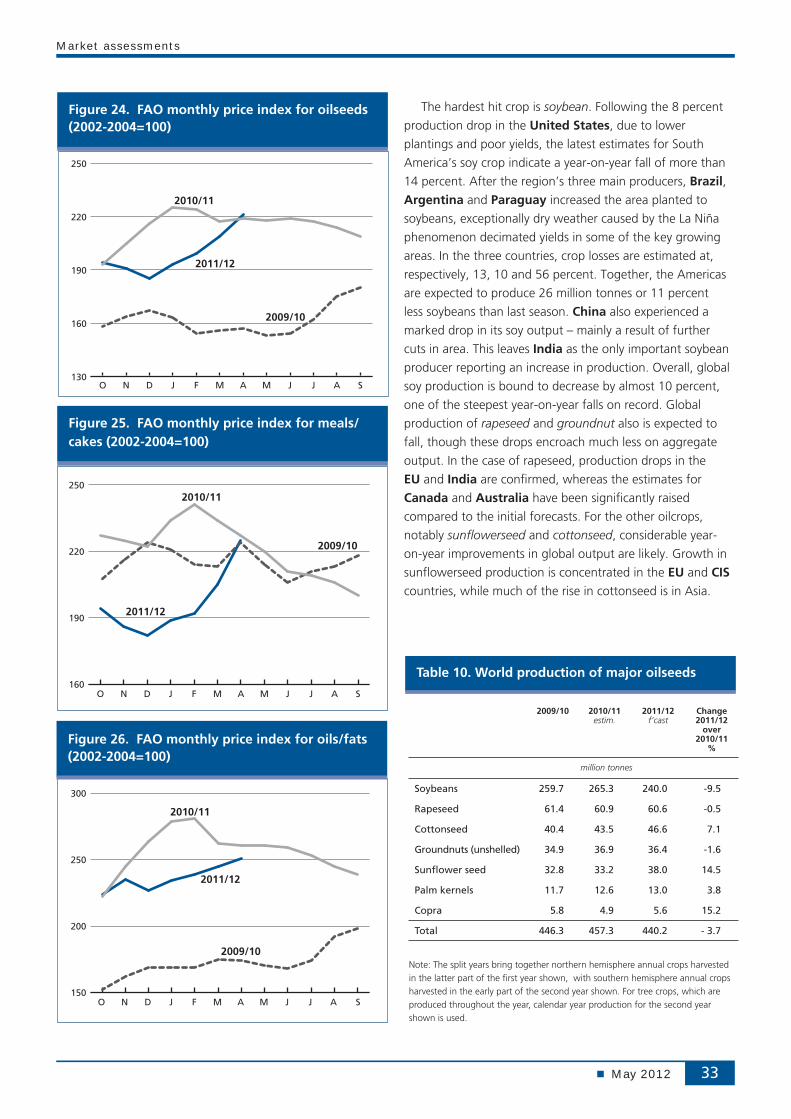
for oilmeals and oils following suit. Similarly, the CBOT
soybean futures contract for September had appreciated
steadily since the beginning of 2012 and, in early April,
crossed the USD 500 per tonne line.
With major crop failures in South America confirmed,
global production of oilcrops is bound to be insufficient
to satisfy the anticipated growth in demand for oils and
meals in 2011/12. As a result, both a sizeable drawdown in
global inventories and a sharp drop in global stock-to-use
ratios – exactly the reverse of the past two seasons – appear
inevitable, pointing to continued price firmness in the
oilseed complex. The possibility that in 2012/13 soybeans
will again face strong competition for cropland from maize
(notably in the United States) is lending additional support to
prices. Among the factors which are containing the upward
pressure on prices is the current ample availability of feed
wheat, which can be used to replace soymeal in feed rations.
9 Almost the entire volume of oilcrops harvested worldwide is crushed to obtain oils and fats for human nutrition or industrial purposes, and to obtain cakes and meals which are used as feed ingredients. Therefore, rather than referring to oilseeds, the analysis of the market situation is mainly undertaken in terms of oils/fats and cakes/meals. Hence, production data for oils (cakes) derived from oilseeds refer to the oil (cake) equivalent of the current production of the relevant oilseeds, i.e. they do not reflect the outcome of actual oilseed crushing. Furthermore, the data on trade in and stocks of oils (cakes) refer to the sum of trade in and stocks of oils and cakes plus the oil (cake) equivalent of oilseed trade and stocks.
10 For details on prices and corresponding indices, see appendix Table A24.
OILSEEDS
2011/12 production outlook strongly deterioratedThe global production forecast for 2011/12 has been
lowered substantially since the start of the season. Currently
estimated at 451 million tonnes, global output is set to drop
almost 4 percent from last season, marking a three-year
low. With total crop area estimated to expand at an about
average rate, this season’s production decrease is mostly due
to adverse weather affecting yields.
Figure 22. FAO monthly international price indices for oilseeds, oils/fats and meals/cakes (2002-2004=100)
50
100
150
200
250
300
20122011201020092008200720062005
Meals/cakes
Oils/fats
Oilseeds
Figure 23. CBOT soybean futures for September
250
350
450
550
USD per tonne
S O N D J F M A
2010 values 2011 values 2012 values
Market assessments
May 2012 33
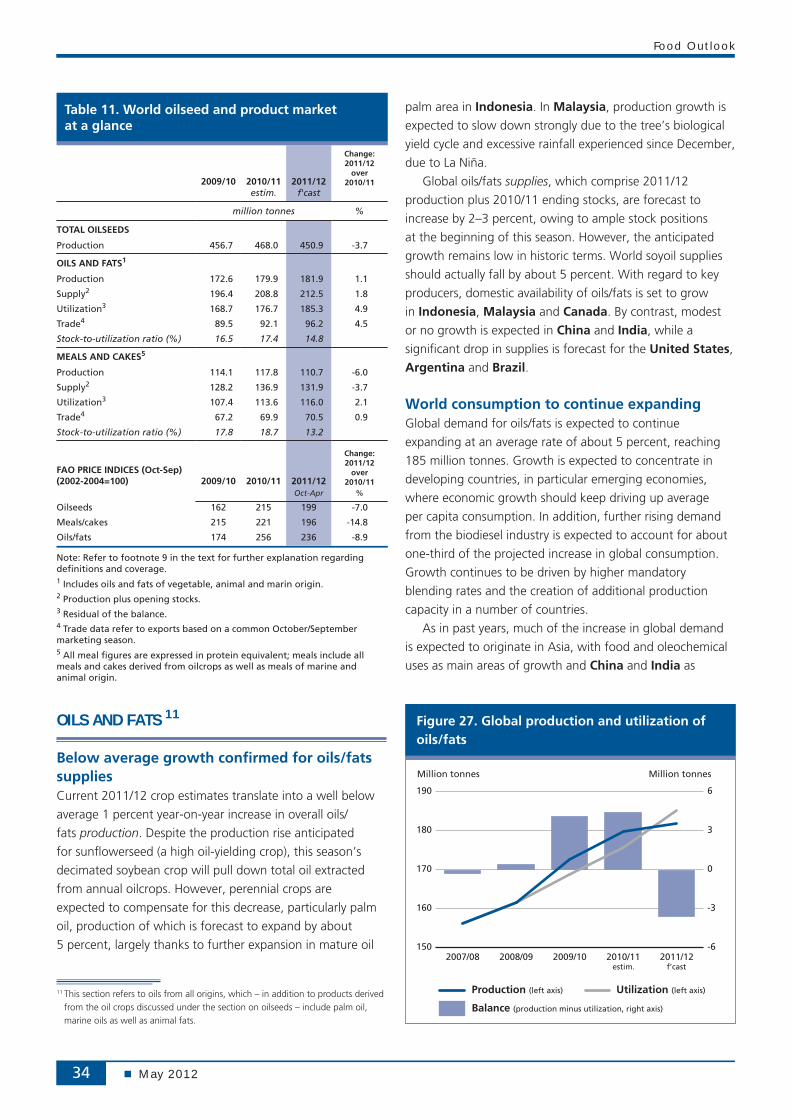
Figure 26. FAO monthly price index for oils/fats (2002-2004=100)
150
200
250
300
2009/10
2011/12
2010/11
SAJJMAMFJDNO
Figure 25. FAO monthly price index for meals/cakes (2002-2004=100)
160
190
220
250
2011/12
2009/10
2010/11
SAJJMAMFJDNO
Figure 24. FAO monthly price index for oilseeds (2002-2004=100)
130
160
190
220
250
2011/12
2009/10
2010/11
SAJJMAMFJDNO
The hardest hit crop is soybean. Following the 8 percent
production drop in the United States, due to lower
plantings and poor yields, the latest estimates for South
America’s soy crop indicate a year-on-year fall of more than
14 percent. After the region’s three main producers, Brazil, Argentina and Paraguay increased the area planted to
soybeans, exceptionally dry weather caused by the La Niña
phenomenon decimated yields in some of the key growing
areas. In the three countries, crop losses are estimated at,
respectively, 13, 10 and 56 percent. Together, the Americas
are expected to produce 26 million tonnes or 11 percent
less soybeans than last season. China also experienced a
marked drop in its soy output – mainly a result of further
cuts in area. This leaves India as the only important soybean
producer reporting an increase in production. Overall, global
soy production is bound to decrease by almost 10 percent,
one of the steepest year-on-year falls on record. Global
production of rapeseed and groundnut also is expected to
fall, though these drops encroach much less on aggregate
output. In the case of rapeseed, production drops in the
EU and India are confirmed, whereas the estimates for
Canada and Australia have been significantly raised
compared to the initial forecasts. For the other oilcrops,
notably sunflowerseed and cottonseed, considerable year-
on-year improvements in global output are likely. Growth in
sunflowerseed production is concentrated in the EU and CIS
countries, while much of the rise in cottonseed is in Asia.
Table 10. World production of major oilseeds
2009/10 2010/11estim.
2011/12 f’cast
Change 2011/12
over 2010/11
%
million tonnes
Soybeans 259.7 265.3 240.0 -9.5
Rapeseed 61.4 60.9 60.6 -0.5
Cottonseed 40.4 43.5 46.6 7.1
Groundnuts (unshelled) 34.9 36.9 36.4 -1.6
Sunflower seed 32.8 33.2 38.0 14.5
Palm kernels 11.7 12.6 13.0 3.8
Copra 5.8 4.9 5.6 15.2
Total 446.3 457.3 440.2 - 3.7
Note: The split years bring together northern hemisphere annual crops harvested in the latter part of the first year shown, with southern hemisphere annual crops harvested in the early part of the second year shown. For tree crops, which are produced throughout the year, calendar year production for the second year shown is used.
Food Outlook
May 201234
Table 11. World oilseed and product marketat a glance
2009/10 2010/11 2011/12
Change: 2011/12
over 2010/11
estim. f'cast
million tonnes %
TOTAL OILSEEDS
Production 456.7 468.0 450.9 -3.7
OILS AND FATS1
Production 172.6 179.9 181.9 1.1
Supply2 196.4 208.8 212.5 1.8
Utilization3 168.7 176.7 185.3 4.9
Trade4 89.5 92.1 96.2 4.5
Stock-to-utilization ratio (%) 16.5 17.4 14.8
MEALS AND CAKES5
Production 114.1 117.8 110.7 -6.0
Supply2 128.2 136.9 131.9 -3.7
Utilization3 107.4 113.6 116.0 2.1
Trade4 67.2 69.9 70.5 0.9
Stock-to-utilization ratio (%) 17.8 18.7 13.2
FAO PRICE INDICES (Oct-Sep) (2002-2004=100) 2009/10 2010/11 2011/12
Change: 2011/12
over 2010/11
Oct-Apr %
Oilseeds 162 215 199 -7.0
Meals/cakes 215 221 196 -14.8
Oils/fats 174 256 236 -8.9
Note: Refer to footnote 9 in the text for further explanation regarding definitions and coverage.1 Includes oils and fats of vegetable, animal and marin origin.2 Production plus opening stocks.3 Residual of the balance.4 Trade data refer to exports based on a common October/September marketing season.5 All meal figures are expressed in protein equivalent; meals include all meals and cakes derived from oilcrops as well as meals of marine and animal origin.
OILS AND FATS 11
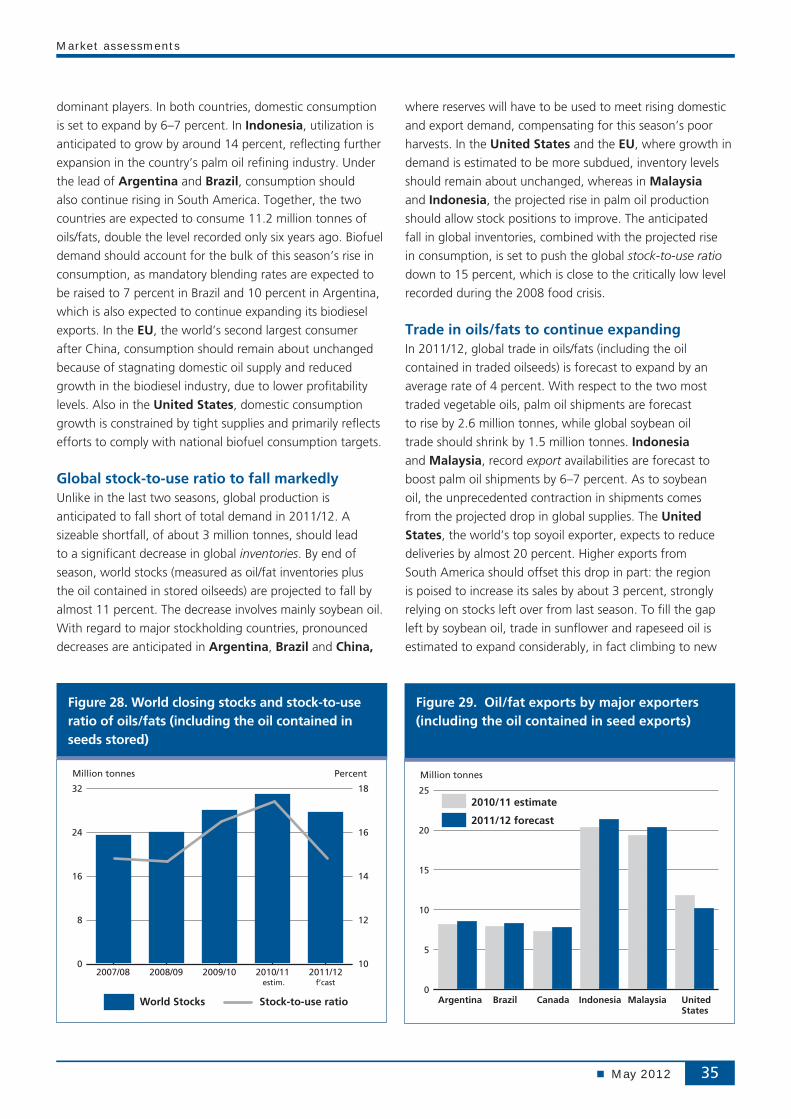
Below average growth confirmed for oils/fats supplies Current 2011/12 crop estimates translate into a well below
average 1 percent year-on-year increase in overall oils/
fats production. Despite the production rise anticipated
for sunflowerseed (a high oil-yielding crop), this season’s
decimated soybean crop will pull down total oil extracted
from annual oilcrops. However, perennial crops are
expected to compensate for this decrease, particularly palm
oil, production of which is forecast to expand by about
5 percent, largely thanks to further expansion in mature oil
11 This section refers to oils from all origins, which – in addition to products derived from the oil crops discussed under the section on oilseeds – include palm oil, marine oils as well as animal fats.
Figure 27. Global production and utilization of oils/fats
-6
-3
0
3
6
150
160
170
180
190
2011/122010/112009/102008/092007/08
Million tonnes Million tonnes
estim. f’cast
Balance (production minus utilization, right axis)
Production (left axis) Utilization (left axis)
palm area in Indonesia. In Malaysia, production growth is
expected to slow down strongly due to the tree’s biological
yield cycle and excessive rainfall experienced since December,
due to La Niña.
Global oils/fats supplies, which comprise 2011/12
production plus 2010/11 ending stocks, are forecast to
increase by 2–3 percent, owing to ample stock positions
at the beginning of this season. However, the anticipated
growth remains low in historic terms. World soyoil supplies
should actually fall by about 5 percent. With regard to key
producers, domestic availability of oils/fats is set to grow
in Indonesia, Malaysia and Canada. By contrast, modest
or no growth is expected in China and India, while a
significant drop in supplies is forecast for the United States,
Argentina and Brazil.
World consumption to continue expanding Global demand for oils/fats is expected to continue
expanding at an average rate of about 5 percent, reaching
185 million tonnes. Growth is expected to concentrate in
developing countries, in particular emerging economies,
where economic growth should keep driving up average
per capita consumption. In addition, further rising demand
from the biodiesel industry is expected to account for about
one-third of the projected increase in global consumption.
Growth continues to be driven by higher mandatory
blending rates and the creation of additional production
capacity in a number of countries.
As in past years, much of the increase in global demand
is expected to originate in Asia, with food and oleochemical
uses as main areas of growth and China and India as
Market assessments
May 2012 35
Figure 28. World closing stocks and stock-to-use ratio of oils/fats (including the oil contained in seeds stored)
0
8
16
24
32
2011/122010/112009/102008/092007/0810
12
14
16
18
Million tonnes Percent
World Stocks Stock-to-use ratio
estim. f’cast
dominant players. In both countries, domestic consumption
is set to expand by 6–7 percent. In Indonesia, utilization is
anticipated to grow by around 14 percent, reflecting further
expansion in the country’s palm oil refining industry. Under
the lead of Argentina and Brazil, consumption should
also continue rising in South America. Together, the two
countries are expected to consume 11.2 million tonnes of
oils/fats, double the level recorded only six years ago. Biofuel
demand should account for the bulk of this season’s rise in
consumption, as mandatory blending rates are expected to
be raised to 7 percent in Brazil and 10 percent in Argentina,
which is also expected to continue expanding its biodiesel
exports. In the EU, the world’s second largest consumer
after China, consumption should remain about unchanged
because of stagnating domestic oil supply and reduced
growth in the biodiesel industry, due to lower profitability
levels. Also in the United States, domestic consumption
growth is constrained by tight supplies and primarily reflects
efforts to comply with national biofuel consumption targets.
Global stock-to-use ratio to fall markedly Unlike in the last two seasons, global production is
anticipated to fall short of total demand in 2011/12. A
sizeable shortfall, of about 3 million tonnes, should lead
to a significant decrease in global inventories. By end of
season, world stocks (measured as oil/fat inventories plus
the oil contained in stored oilseeds) are projected to fall by
almost 11 percent. The decrease involves mainly soybean oil.
With regard to major stockholding countries, pronounced
decreases are anticipated in Argentina, Brazil and China,
where reserves will have to be used to meet rising domestic
and export demand, compensating for this season’s poor
harvests. In the United States and the EU, where growth in
demand is estimated to be more subdued, inventory levels
should remain about unchanged, whereas in Malaysia
and Indonesia, the projected rise in palm oil production
should allow stock positions to improve. The anticipated
fall in global inventories, combined with the projected rise
in consumption, is set to push the global stock-to-use ratio
down to 15 percent, which is close to the critically low level
recorded during the 2008 food crisis.
Trade in oils/fats to continue expandingIn 2011/12, global trade in oils/fats (including the oil
contained in traded oilseeds) is forecast to expand by an
average rate of 4 percent. With respect to the two most
traded vegetable oils, palm oil shipments are forecast
to rise by 2.6 million tonnes, while global soybean oil
trade should shrink by 1.5 million tonnes. Indonesia
and Malaysia, record export availabilities are forecast to
boost palm oil shipments by 6–7 percent. As to soybean
oil, the unprecedented contraction in shipments comes
from the projected drop in global supplies. The United States, the world’s top soyoil exporter, expects to reduce
deliveries by almost 20 percent. Higher exports from
South America should offset this drop in part: the region
is poised to increase its sales by about 3 percent, strongly
relying on stocks left over from last season. To fill the gap
left by soybean oil, trade in sunflower and rapeseed oil is
estimated to expand considerably, in fact climbing to new
Figure 29. Oil/fat exports by major exporters (including the oil contained in seed exports)
0
5
10
15
20
252010/11 estimate
2011/12 forecast
Million tonnes
UnitedStates
IndonesiaCanada MalaysiaArgentina Brazil
Food Outlook
May 201236
records. Growth mainly involves CIS countries, Canada and
Australia, which all have had good crops. With regards
to the Russian Federation and Ukraine, the share of
domestic seed and oil output entering trade is set to
continue rising.
As to global imports, most of the anticipated growth
is expected to occur in Asia under the lead of China and
India. China’s purchases are projected to climb 8 percent to
over 21 million tonnes (including the oil contained in seed
imports). India could import a record 9.6 million tonnes,
marking a 10 percent year-on-year increase. Their strong
growth rates are both related to further population and
income growth, coupled with stagnating domestic oilcrop
production. Both nations continue to rely heavily on foreign
purchases to satisfy domestic demand. Other countries in
Asia with rising import requirements include Malaysia,
Pakistan and Turkey. In the EU, the world’s second largest
buyer, imports should remain about unchanged thanks to
this year’s record sunflowerseed harvest as well as sluggish
demand growth in the biodiesel industry and rising imports
of ready-made biodiesel.
MEALS AND CAKES 12
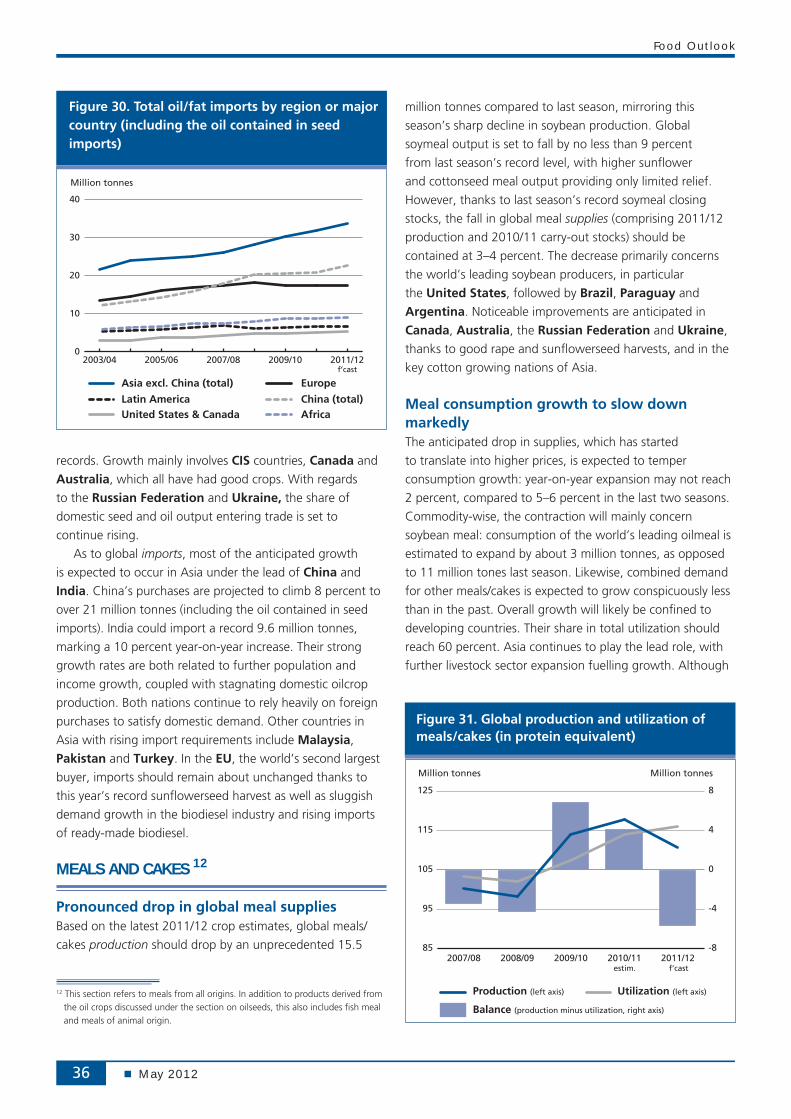
Pronounced drop in global meal supplies Based on the latest 2011/12 crop estimates, global meals/
cakes production should drop by an unprecedented 15.5
12 This section refers to meals from all origins. In addition to products derived from the oil crops discussed under the section on oilseeds, this also includes fish meal and meals of animal origin.
million tonnes compared to last season, mirroring this
season’s sharp decline in soybean production. Global
soymeal output is set to fall by no less than 9 percent
from last season’s record level, with higher sunflower
and cottonseed meal output providing only limited relief.
However, thanks to last season’s record soymeal closing
stocks, the fall in global meal supplies (comprising 2011/12
production and 2010/11 carry-out stocks) should be
contained at 3–4 percent. The decrease primarily concerns
the world’s leading soybean producers, in particular
the United States, followed by Brazil, Paraguay and
Argentina. Noticeable improvements are anticipated in
Canada, Australia, the Russian Federation and Ukraine,
thanks to good rape and sunflowerseed harvests, and in the
key cotton growing nations of Asia.
Meal consumption growth to slow down markedlyThe anticipated drop in supplies, which has started
to translate into higher prices, is expected to temper
consumption growth: year-on-year expansion may not reach
2 percent, compared to 5–6 percent in the last two seasons.
Commodity-wise, the contraction will mainly concern
soybean meal: consumption of the world’s leading oilmeal is
estimated to expand by about 3 million tonnes, as opposed
to 11 million tones last season. Likewise, combined demand
for other meals/cakes is expected to grow conspicuously less
than in the past. Overall growth will likely be confined to
developing countries. Their share in total utilization should
reach 60 percent. Asia continues to play the lead role, with
further livestock sector expansion fuelling growth. Although
Figure 31. Global production and utilization of meals/cakes (in protein equivalent)
-8
-4
0
4
8
85
95
105
115
125
2011/122010/112009/102008/092007/08
Million tonnes Million tonnes
estim. f’cast
Balance (production minus utilization, right axis)
Production (left axis) Utilization (left axis)
Figure 30. Total oil/fat imports by region or major country (including the oil contained in seed imports)
0
10
20
30
40
2011/122009/102007/082005/062003/04
Latin America
Asia excl. China (total) Europe
China (total)
Million tonnes
United States & Canada Africa
f’cast
Market assessments
May 2012 37
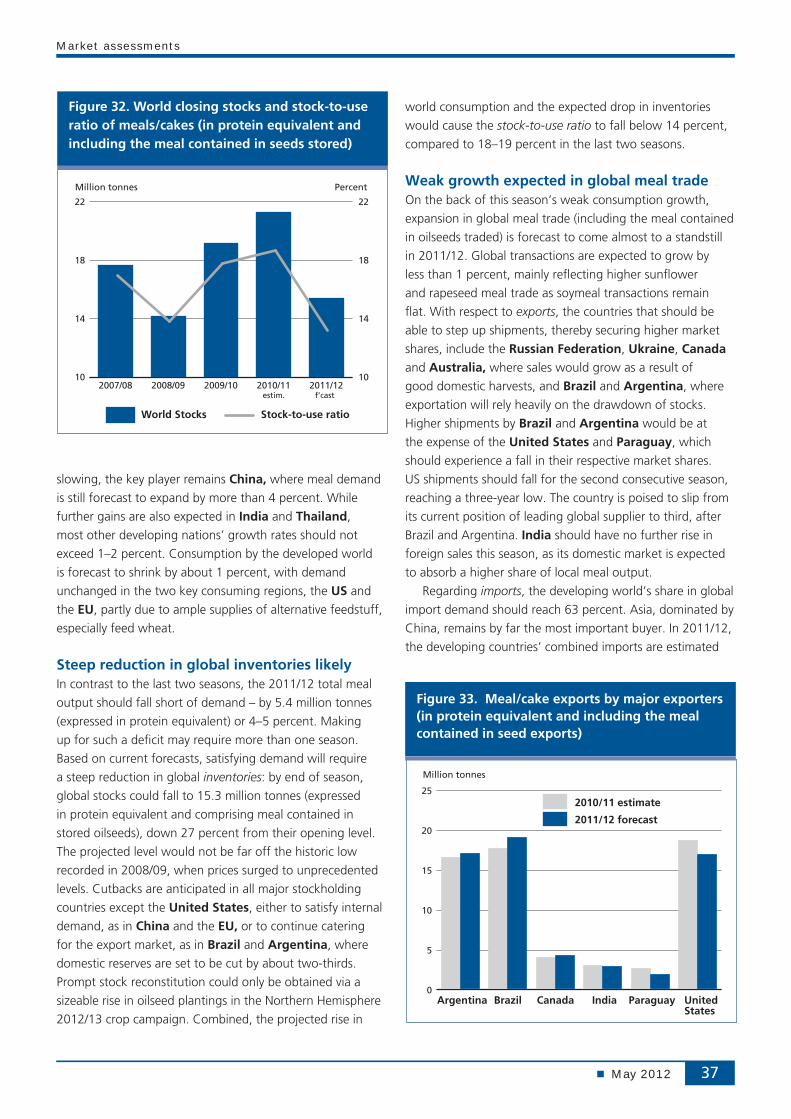
Figure 32. World closing stocks and stock-to-use ratio of meals/cakes (in protein equivalent and including the meal contained in seeds stored)
10
14
18
22
2011/122010/112009/102008/092007/0810
14
18
22
Million tonnes Percent
World Stocks Stock-to-use ratio
estim. f’cast
slowing, the key player remains China, where meal demand
is still forecast to expand by more than 4 percent. While
further gains are also expected in India and Thailand,
most other developing nations’ growth rates should not
exceed 1–2 percent. Consumption by the developed world
is forecast to shrink by about 1 percent, with demand
unchanged in the two key consuming regions, the US and
the EU, partly due to ample supplies of alternative feedstuff,
especially feed wheat.
Steep reduction in global inventories likely In contrast to the last two seasons, the 2011/12 total meal
output should fall short of demand – by 5.4 million tonnes
(expressed in protein equivalent) or 4–5 percent. Making
up for such a deficit may require more than one season.
Based on current forecasts, satisfying demand will require
a steep reduction in global inventories: by end of season,
global stocks could fall to 15.3 million tonnes (expressed
in protein equivalent and comprising meal contained in
stored oilseeds), down 27 percent from their opening level.
The projected level would not be far off the historic low
recorded in 2008/09, when prices surged to unprecedented
levels. Cutbacks are anticipated in all major stockholding
countries except the United States, either to satisfy internal
demand, as in China and the EU, or to continue catering
for the export market, as in Brazil and Argentina, where
domestic reserves are set to be cut by about two-thirds.
Prompt stock reconstitution could only be obtained via a
sizeable rise in oilseed plantings in the Northern Hemisphere
2012/13 crop campaign. Combined, the projected rise in
world consumption and the expected drop in inventories
would cause the stock-to-use ratio to fall below 14 percent,
compared to 18–19 percent in the last two seasons.
Weak growth expected in global meal trade On the back of this season’s weak consumption growth,
expansion in global meal trade (including the meal contained
in oilseeds traded) is forecast to come almost to a standstill
in 2011/12. Global transactions are expected to grow by
less than 1 percent, mainly reflecting higher sunflower
and rapeseed meal trade as soymeal transactions remain
flat. With respect to exports, the countries that should be
able to step up shipments, thereby securing higher market
shares, include the Russian Federation, Ukraine, Canada
and Australia, where sales would grow as a result of
good domestic harvests, and Brazil and Argentina, where
exportation will rely heavily on the drawdown of stocks.
Higher shipments by Brazil and Argentina would be at
the expense of the United States and Paraguay, which
should experience a fall in their respective market shares.
US shipments should fall for the second consecutive season,
reaching a three-year low. The country is poised to slip from
its current position of leading global supplier to third, after
Brazil and Argentina. India should have no further rise in
foreign sales this season, as its domestic market is expected
to absorb a higher share of local meal output.
Regarding imports, the developing world’s share in global
import demand should reach 63 percent. Asia, dominated by
China, remains by far the most important buyer. In 2011/12,
the developing countries’ combined imports are estimated
Figure 33. Meal/cake exports by major exporters (in protein equivalent and including the meal contained in seed exports)
0
5
10
15
20
252010/11 estimate
2011/12 forecast
Million tonnes
UnitedStates
Canada India ParaguayArgentina Brazil
Food Outlook
May 201238
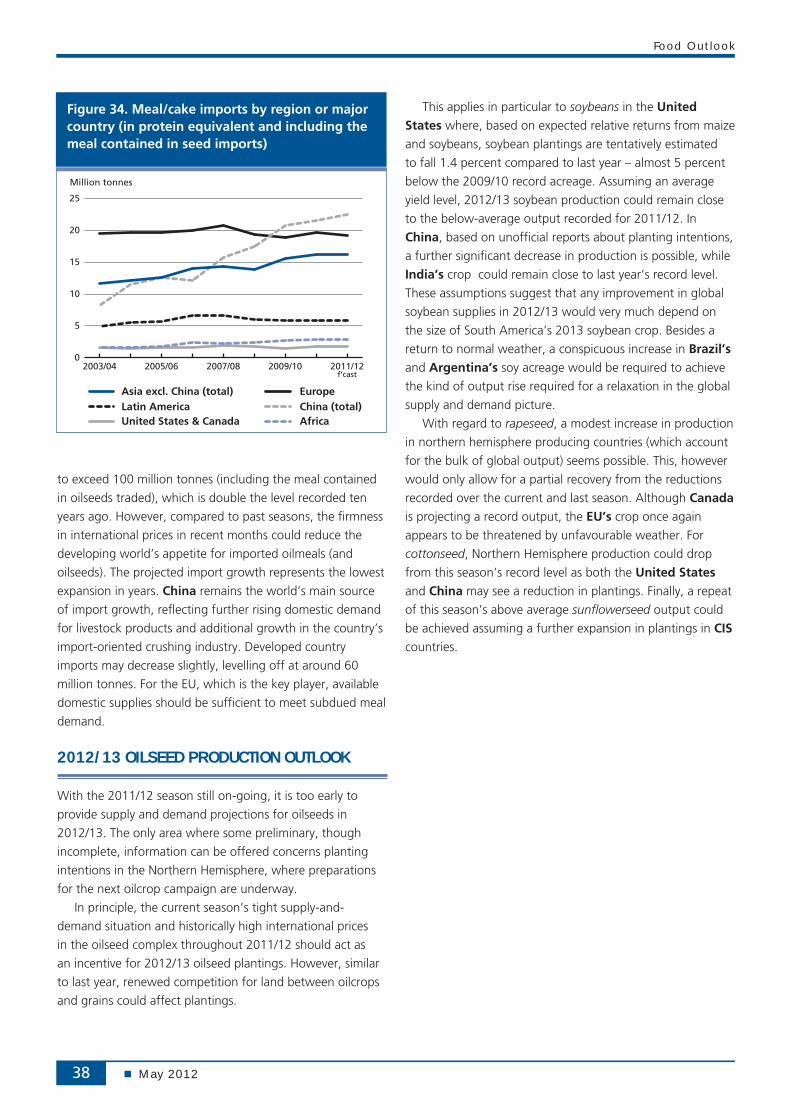
to exceed 100 million tonnes (including the meal contained
in oilseeds traded), which is double the level recorded ten
years ago. However, compared to past seasons, the firmness
in international prices in recent months could reduce the
developing world’s appetite for imported oilmeals (and
oilseeds). The projected import growth represents the lowest
expansion in years. China remains the world’s main source
of import growth, reflecting further rising domestic demand
for livestock products and additional growth in the country’s
import-oriented crushing industry. Developed country
imports may decrease slightly, levelling off at around 60
million tonnes. For the EU, which is the key player, available
domestic supplies should be sufficient to meet subdued meal
demand.
2012/13 OILSEED PRODUCTION OUTLOOK
With the 2011/12 season still on-going, it is too early to
provide supply and demand projections for oilseeds in
2012/13. The only area where some preliminary, though
incomplete, information can be offered concerns planting
intentions in the Northern Hemisphere, where preparations
for the next oilcrop campaign are underway.
In principle, the current season’s tight supply-and-
demand situation and historically high international prices
in the oilseed complex throughout 2011/12 should act as
an incentive for 2012/13 oilseed plantings. However, similar
to last year, renewed competition for land between oilcrops
and grains could affect plantings.
This applies in particular to soybeans in the United States where, based on expected relative returns from maize
and soybeans, soybean plantings are tentatively estimated
to fall 1.4 percent compared to last year – almost 5 percent
below the 2009/10 record acreage. Assuming an average
yield level, 2012/13 soybean production could remain close
to the below-average output recorded for 2011/12. In
China, based on unofficial reports about planting intentions,
a further significant decrease in production is possible, while
India’s crop could remain close to last year’s record level.
These assumptions suggest that any improvement in global
soybean supplies in 2012/13 would very much depend on
the size of South America’s 2013 soybean crop. Besides a
return to normal weather, a conspicuous increase in Brazil’s
and Argentina’s soy acreage would be required to achieve
the kind of output rise required for a relaxation in the global
supply and demand picture.
With regard to rapeseed, a modest increase in production
in northern hemisphere producing countries (which account
for the bulk of global output) seems possible. This, however
would only allow for a partial recovery from the reductions
recorded over the current and last season. Although Canada
is projecting a record output, the EU’s crop once again
appears to be threatened by unfavourable weather. For
cottonseed, Northern Hemisphere production could drop
from this season’s record level as both the United States
and China may see a reduction in plantings. Finally, a repeat
of this season’s above average sunflowerseed output could
be achieved assuming a further expansion in plantings in CIS countries.
Figure 34. Meal/cake imports by region or major country (in protein equivalent and including the meal contained in seed imports)
0
5
10
15
20
25
2011/122009/102007/082005/062003/04
Latin America Asia excl. China (total) Europe
China (total)
Million tonnes
United States & Canada Africa
f’cast
Market assessments
May 2012 39
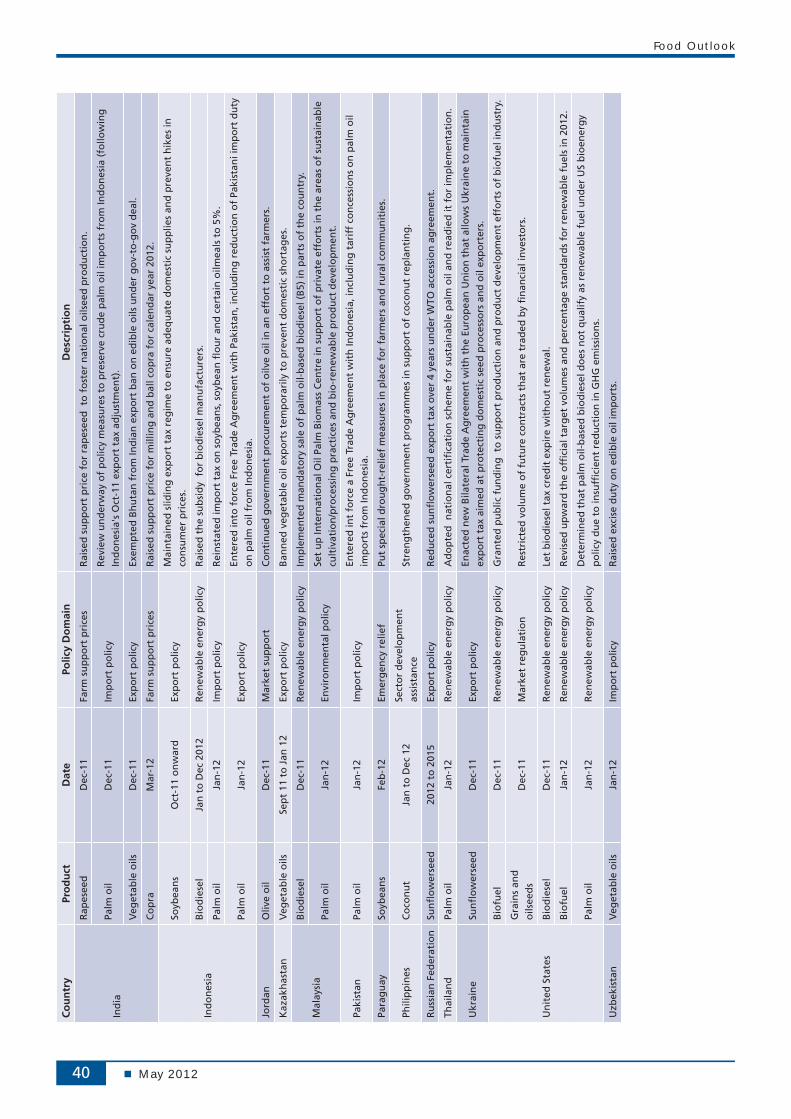
Tab
le 1
2. M
ajo
r O
ilsee
d P
olic
y D
evel
op
men
ts: O
cto
ber
201
1 to
Mar
ch 2
012
Co
un
try
Pro
du
ctD
ate
Polic
y D
om
ain
Des
crip
tio
n
Arg
enti
na
Ara
ble
cro
ps
Jan
-12
Lan
d r
igh
tsIn
tro
du
ced
new
lim
its
on
fo
reig
n o
wn
ersh
ip o
f la
nd
.
Ban
gla
des
hC
oo
kin
g o
ilFe
b-1
2Pr
ice
con
tro
lEx
ten
ded
ret
ail p
rice
co
ntr
ol m
easu
res,
to
sh
ield
co
nsu
mer
s fr
om
su
rges
in in
tern
atio
nal
pri
ces.
Bel
aru
sR
apes
eed
, ra
pes
eed
oil
Dec
-11
Exp
ort
po
licy
Ban
ned
exp
ort
s o
f ra
pes
eed
an
d r
apes
eed
oil
tem
po
rari
ly, t
o p
reve
nt
do
mes
tic
veg
etab
le o
il sh
ort
age.
Bh
uta
nV
eget
able
oils
Dec
-11
Imp
ort
po
licy
Secu
red
veg
etab
le o
il im
po
rts
fro
m In
dia
un
der
go
v-to
-go
v d
eal.
Bra
zil
Soyb
ean
sD
ec-1
1En
viro
nm
enta
l po
licy
Exte
nd
ed v
olu
nta
ry m
ora
tori
um
on
tra
din
g a
nd
fin
anci
ng
of
soyb
ean
s g
row
n o
n la
nd
ille
gal
y cl
eare
d in
th
e A
maz
on
reg
ion
un
til J
anau
ry 2
013.
Soyb
ean
oil
Dec
-11
Soci
al p
olic
yD
isco
nti
nu
ed s
oci
al t
ax r
ebat
e ap
ply
ing
to
so
yoil
and
mea
l des
tin
ed f
or
exp
ort
s.
Oils
eed
s an
d
gra
ins
Mar
-12
Tran
spo
rtat
ion
/exp
ort
p
olic
y Su
pp
ort
ed d
evel
op
men
t o
f n
ew m
ajo
r g
rain
s p
ort
in A
maz
on
Reg
ion
.
Can
ada
Cam
elin
a &
sa
fflo
wer
see
dD
ec-1
1En
viro
nm
enta
l po
licy
Gra
nte
d p
ub
lic f
un
din
g t
o a
dva
nce
su
stai
nab
le p
rod
uct
ion
of
new
oils
fo
r in
du
stri
al a
pp
licat
ion
s o
ther
th
an f
uel
.
Veg
etab
le o
ilsM
ar-1
2Pu
blic
hea
lth
po
licy
Au
tho
rize
d h
ealt
h c
laim
s ec
ou
rag
ing
th
e u
se o
f p
oly
/mo
no
-un
satu
rate
d f
at o
n f
oo
d p
rod
uct
lab
els.
Ch
ina
Soyb
ean
sSe
pt
to N
ov
2011
Stat
e re
serv
esR
elea
sed
sta
te r
eser
ves
in a
n e
ffo
rt t
o c
hec
k ri
se in
do
mes
tic
oil/
mea
l pri
ces.
Soyb
ean
sD
ec-1
1Fo
reig
n a
gri
cult
ura
l in
vest
men
t A
pp
rove
d in
vest
men
t b
y st
ate-
ow
ned
gra
in c
om
pan
y in
to c
rush
ing
fac
iliti
es in
Bra
zil.
Rap
esee
dJa
n-1
2St
ate
rese
rves
Rec
on
stit
ute
d s
tate
res
erve
s fo
r fu
ture
mar
ket
inte
rven
tio
ns
and
to
su
pp
ort
do
mes
tic
farm
gat
e p
rice
s.
Oilm
eals
Jan
-12
Imp
ort
po
licy
Susp
end
ed o
ilmea
l im
po
rts
fro
m In
dia
, bas
ed o
n d
etec
tio
n o
f h
azar
do
us
sub
stan
ces
in
rap
esee
dm
eal c
on
sig
nm
ents
.
Oliv
e o
ilFe
b-1
2Im
po
rt p
olic
ySu
spen
ded
imp
ort
s o
f o
ilve
oil
fro
m It
aly
to v
erif
y la
bel
ling
pra
ctic
es.
Oils
eed
s an
d
gra
ins
2012
to
201
5M
arke
t p
olic
ies
An
no
un
ced
pro
gra
mm
e to
fo
ster
th
e u
se o
f fu
ture
s m
arke
ts.
Rap
esee
dM
ar-1
2Im
po
rt p
olic
yR
elax
ed b
an o
n r
apes
eed
imp
ort
s fr
om
Can
ada
furt
her
.
Euro
pea
n U
nio
n
Bio
fuel
sO
ct-1
1R
enew
able
en
erg
y p
olic
yPo
stp
on
ed f
urt
her
th
e re
leas
e o
f g
uid
elin
es o
n t
he
imp
act
of
lan
d u
se c
han
ges
(IL
UC
) o
n c
arb
on
sa
vin
gs
in b
iofu
el u
tiliz
atio
n.
Sun
flo
wer
seed
Dec
-11
Imp
ort
po
licy
Lau
nch
ed n
ew B
ilate
ral T
rad
e A
gre
emen
t w
ith
Ukr
ain
e, a
llow
ing
Ukr
ain
e to
mai
nta
in e
xpo
rt t
ax
aim
ed a
t p
rote
ctin
g d
om
esti
c in
du
stry
.
Bio
die
sel
Jan
-12
Ren
ewab
le e
ner
gy
po
licy
Ad
mis
sio
n, b
y G
erm
any,
of
bio
die
sel p
rod
uce
d f
rom
use
d c
oo
kin
g o
il fo
r d
ou
ble
co
un
tin
g w
ith
in
the
EU’s
bio
ener
gy
con
sum
pti
on
tar
get
s.
Soyb
ean
sJa
n-1
2G
MO
po
licie
s an
d
reg
ula
tio
ns
Ap
pro
val s
et b
y Eu
rop
ean
Co
mm
issi
on
fo
r fo
ur
new
GM
so
y va
riet
ies
for
imp
ort
atio
n a
nd
p
roce
ssin
g, t
ho
ug
h n
ot
for
cult
ivat
ion
.
Food Outlook
May 201240
Co
un
try
Pro
du
ctD
ate
Polic
y D
om
ain
Des
crip
tio
n
Ind
ia
Rap
esee
dD
ec-1
1Fa
rm s
up
po
rt p
rice
sR
aise
d s
up
po
rt p
rice
fo
r ra
pes
eed
to
fo
ster
nat
ion
al o
ilsee
d p
rod
uct
ion
.
Palm
oil
Dec
-11
Imp
ort
po
licy
Rev
iew
un
der
way
of
po
licy
mea
sure
s to
pre
serv
e cr
ud
e p
alm
oil
imp
ort
s fr
om
Ind
on
esia
(fo
llow
ing
In
do
nes
ia's
Oct
-11
exp
ort
tax
ad
just
men
t).
Veg
etab
le o
ilsD
ec-1
1Ex
po
rt p
olic
yEx
emp
ted
Bh
uta
n f
rom
Ind
ian
exp
ort
ban
on
ed
ible
oils
un
der
go
v-to
-go
v d
eal.
Co
pra
Mar
-12
Farm
su
pp
ort
pri
ces
Rai
sed
su
pp
ort
pri
ce f
or
mill
ing
an
d b
all c
op
ra f
or
cale
nd
ar y
ear
2012
.
Ind
on
esia
Soyb
ean
sO
ct-1
1 o
nw
ard
Exp
ort
po
licy
Mai
nta
ined
slid
ing
exp
ort
tax
reg
ime
to e
nsu
re a
deq
uat
e d
om
esti
c su
pp
lies
and
pre
ven
t h
ikes
in
con
sum
er p
rice
s.
Bio
die
sel
Jan
to
Dec
201
2R
enew
able
en
erg
y p
olic
yR
aise
d t
he
sub
sid
y f
or
bio
die
sel m
anu
fact
ure
rs.
Palm
oil
Jan
-12
Imp
ort
po
licy
Rei
nst
ated
imp
ort
tax
on
so
ybea
ns,
so
ybea
n fl
ou
r an
d c
erta
in o
ilmea
ls t
o 5
%.
Palm
oil
Jan
-12
Exp
ort
po
licy
Ente
red
into
fo
rce
Free
Tra
de
Ag
reem
ent
wit
h P
akis
tan
, in
clu
din
g r
edu
ctio
n o
f Pa
kist
ani i
mp
ort
du
ty
on
pal
m o
il fr
om
Ind
on
esia
.
Jord
anO
live
oil
Dec
-11
Mar
ket
sup
po
rtC
on
tin
ued
go
vern
men
t p
rocu
rem
ent
of
oilv
e o
il in
an
eff
ort
to
ass
ist
farm
ers.
Kaz
akh
asta
nV
eget
able
oils
Sep
t 11
to
Jan
12
Exp
ort
po
licy
Ban
ned
veg
etab
le o
il ex
po
rts
tem
po
rari
ly t
o p
reve
nt
do
mes
tic
sho
rtag
es.
Mal
aysi
a
Bio
die
sel
Dec
-11
Ren
ewab
le e
ner
gy
po
licy
Imp
lem
ente
d m
and
ato
ry s
ale
of
pal
m o
il-b
ased
bio
die
sel (
B5)
in p
arts
of
the
cou
ntr
y.
Palm
oil
Jan
-12
Envi
ron
men
tal p
olic
ySe
t u
p In
tern
atio
nal
Oil
Palm
Bio
mas
s C
entr
e in
su
pp
ort
of
pri
vate
eff
ort
s in
th
e ar
eas
of
sust
ain
able
cu
ltiv
atio
n/p
roce
ssin
g p
ract
ices
an
d b
io-r
enew
able
pro
du
ct d
evel
op
men
t.
Paki
stan
Palm
oil
Jan
-12
Imp
ort
po
licy
Ente
red
int
forc
e a
Free
Tra
de
Ag
reem
ent
wit
h In
do
nes
ia, i
ncl
ud
ing
tar
iff
con
cess
ion
s o
n p
alm
oil
imp
ort
s fr
om
Ind
on
esia
.
Para
gu
aySo
ybea
ns
Feb
-12
Emer
gen
cy r
elie
fPu
t sp
ecia
l dro
ug
ht-
relie
f m
easu
res
in p
lace
fo
r fa
rmer
s an
d r
ura
l co
mm
un
itie
s.
Phili
pp
ines
Co
con
ut
Jan
to
Dec
12
Sect
or
dev
elo
pm
ent
assi
stan
ceSt
ren
gth
ened
go
vern
men
t p
rog
ram
mes
in s
up
po
rt o
f co
con
ut
rep
lan
tin
g.
Ru
ssia
n F
eder
atio
nSu
nfl
ow
erse
ed20
12 t
o 2
015
Exp
ort
po
licy
Red
uce
d s
un
flo
wer
seed
exp
ort
tax
ove
r 4
year
s u
nd
er W
TO a
cces
sio
n a
gre
emen
t.
Thai
lan
dPa
lm o
ilJa
n-1
2R
enew
able
en
erg
y p
olic
yA
do
pte
d n
atio
nal
cer
tifi
cati
on
sch
eme
for
sust
ain
able
pal
m o
il an
d r
ead
ied
it f
or
imp
lem
enta
tio
n.
Ukr
ain
eSu
nfl
ow
erse
edD
ec-1
1Ex
po
rt p
olic
yEn
acte
d n
ew B
ilate
ral T
rad
e A
gre
emen
t w
ith
th
e Eu
rop
ean
Un
ion
th
at a
llow
s U
krai
ne
to m
ain
tain
ex
po
rt t
ax a
imed
at
pro
tect
ing
do
mes
tic
seed
pro
cess
ors
an
d o
il ex
po
rter
s.
Un
ited
Sta
tes
Bio
fuel
Dec
-11
Ren
ewab
le e
ner
gy
po
licy
Gra
nte
d p
ub
lic f
un
din
g t
o s
up
po
rt p
rod
uct
ion
an
d p
rod
uct
dev
elo
pm
ent
effo
rts
of
bio
fuel
ind
ust
ry.
Gra
ins
and
o
ilsee
ds
Dec
-11
Mar
ket
reg
ula
tio
nR
estr
icte
d v
olu
me
of
futu
re c
on
trac
ts t
hat
are
tra
ded
by
fin
anci
al in
vest
ors
.
Bio
die
sel
Dec
-11
Ren
ewab
le e
ner
gy
po
licy
Let
bio
die
sel t
ax c
red
it e
xpir
e w
ith
ou
t re
new
al.
Bio
fuel
Jan
-12
Ren
ewab
le e
ner
gy
po
licy
Rev
ised
up
war
d t
he
offi
cial
tar
get
vo
lum
es a
nd
per
cen
tag
e st
and
ard
s fo
r re
new
able
fu
els
in 2
012.
Palm
oil
Jan
-12
Ren
ewab
le e
ner
gy
po
licy
Det
erm
ined
th
at p
alm
oil-
bas
ed b
iod
iese
l do
es n
ot
qu
alif
y as
ren
ewab
le f
uel
un
der
US
bio
ener
gy
po
licy
du
e to
insu
ffici
ent
red
uct
ion
in G
HG
em
issi
on
s.
Uzb
ekis
tan
Veg
etab
le o
ilsJa
n-1
2Im
po
rt p
olic
yR
aise
d e
xcis
e d
uty
on
ed
ible
oil
imp
ort
s.
Statistical tables
May 2012 85
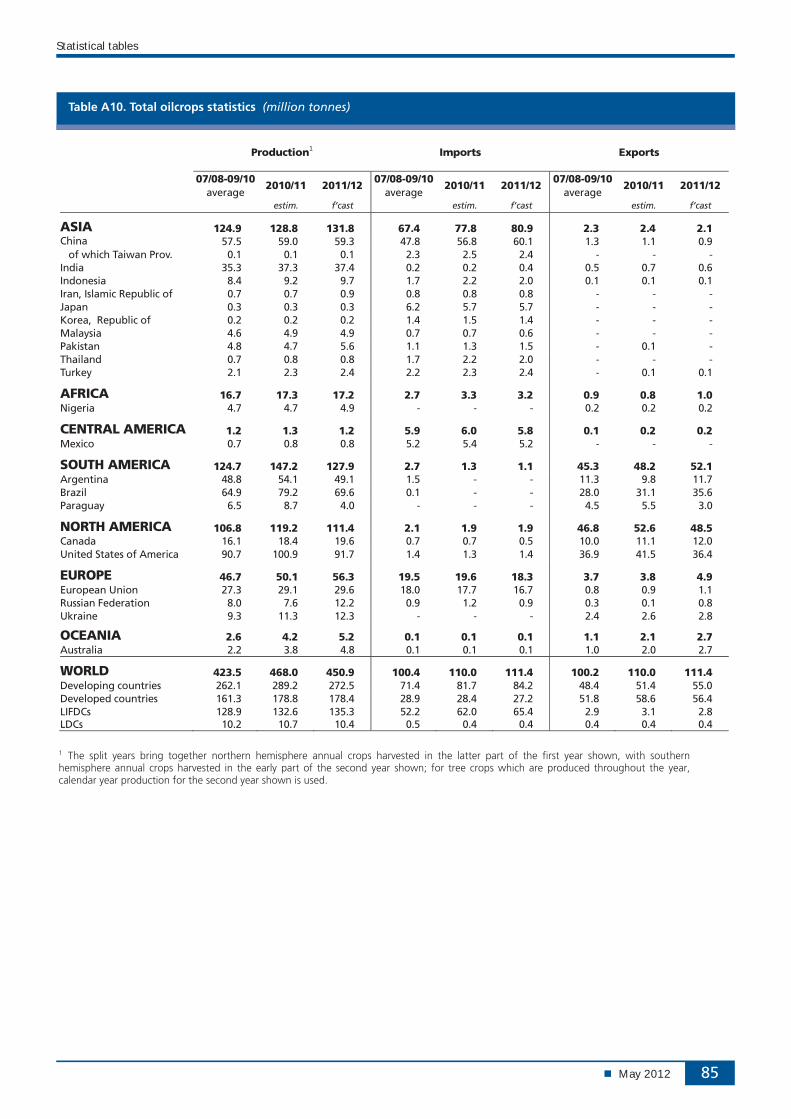
Table A10. Total oilcrops statistics (million tonnes)
Production1 Imports Exports
07/08-09/10 2010/11 2011/12
07/08-09/102010/11 2011/12
07/08-09/10 2010/11 2011/12
average average average estim. f’cast estim. f’cast estim. f’cast
ASIA 124.9 128.8 131.8 67.4 77.8 80.9 2.3 2.4 2.1China 57.5 59.0 59.3 47.8 56.8 60.1 1.3 1.1 0.9 of which Taiwan Prov. 0.1 0.1 0.1 2.3 2.5 2.4 - - - India 35.3 37.3 37.4 0.2 0.2 0.4 0.5 0.7 0.6 Indonesia 8.4 9.2 9.7 1.7 2.2 2.0 0.1 0.1 0.1 Iran, Islamic Republic of 0.7 0.7 0.9 0.8 0.8 0.8 - - - Japan 0.3 0.3 0.3 6.2 5.7 5.7 - - - Korea, Republic of 0.2 0.2 0.2 1.4 1.5 1.4 - - - Malaysia 4.6 4.9 4.9 0.7 0.7 0.6 - - - Pakistan 4.8 4.7 5.6 1.1 1.3 1.5 - 0.1 - Thailand 0.7 0.8 0.8 1.7 2.2 2.0 - - - Turkey 2.1 2.3 2.4 2.2 2.3 2.4 - 0.1 0.1
AFRICA 16.7 17.3 17.2 2.7 3.3 3.2 0.9 0.8 1.0Nigeria 4.7 4.7 4.9 - - - 0.2 0.2 0.2
CENTRAL AMERICA 1.2 1.3 1.2 5.9 6.0 5.8 0.1 0.2 0.2 Mexico 0.7 0.8 0.8 5.2 5.4 5.2 - - -
SOUTH AMERICA 124.7 147.2 127.9 2.7 1.3 1.1 45.3 48.2 52.1Argentina 48.8 54.1 49.1 1.5 - - 11.3 9.8 11.7 Brazil 64.9 79.2 69.6 0.1 - - 28.0 31.1 35.6 Paraguay 6.5 8.7 4.0 - - - 4.5 5.5 3.0
NORTH AMERICA 106.8 119.2 111.4 2.1 1.9 1.9 46.8 52.6 48.5Canada 16.1 18.4 19.6 0.7 0.7 0.5 10.0 11.1 12.0 United States of America 90.7 100.9 91.7 1.4 1.3 1.4 36.9 41.5 36.4
EUROPE 46.7 50.1 56.3 19.5 19.6 18.3 3.7 3.8 4.9 European Union 27.3 29.1 29.6 18.0 17.7 16.7 0.8 0.9 1.1 Russian Federation 8.0 7.6 12.2 0.9 1.2 0.9 0.3 0.1 0.8 Ukraine 9.3 11.3 12.3 - - - 2.4 2.6 2.8
OCEANIA 2.6 4.2 5.2 0.1 0.1 0.1 1.1 2.1 2.7 Australia 2.2 3.8 4.8 0.1 0.1 0.1 1.0 2.0 2.7
WORLD 423.5 468.0 450.9 100.4 110.0 111.4 100.2 110.0 111.4 Developing countries 262.1 289.2 272.5 71.4 81.7 84.2 48.4 51.4 55.0 Developed countries 161.3 178.8 178.4 28.9 28.4 27.2 51.8 58.6 56.4 LIFDCs 128.9 132.6 135.3 52.2 62.0 65.4 2.9 3.1 2.8 LDCs 10.2 10.7 10.4 0.5 0.4 0.4 0.4 0.4 0.4
1 The split years bring together northern hemisphere annual crops harvested in the latter part of the first year shown, with southern hemisphere annual crops harvested in the early part of the second year shown; for tree crops which are produced throughout the year, calendar year production for the second year shown is used.
Food Outlook
May 201286
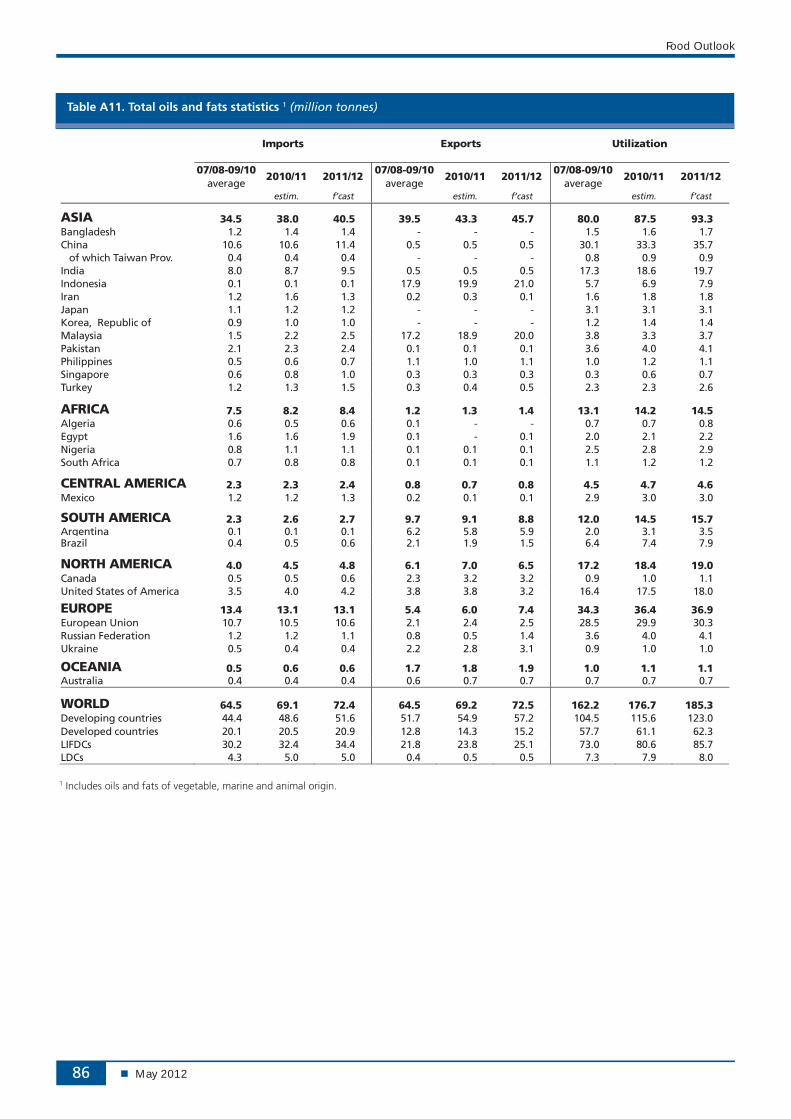
Table A11. Total oils and fats statistics 1 (million tonnes)
Imports Exports Utilization
07/08-09/10 2010/11 2011/12
07/08-09/102010/11 2011/12
07/08-09/10 2010/11 2011/12
average average average estim. f’cast estim. f’cast estim. f’cast
ASIA 34.5 38.0 40.5 39.5 43.3 45.7 80.0 87.5 93.3Bangladesh 1.2 1.4 1.4 - - - 1.5 1.6 1.7 China 10.6 10.6 11.4 0.5 0.5 0.5 30.1 33.3 35.7 of which Taiwan Prov. 0.4 0.4 0.4 - - - 0.8 0.9 0.9 India 8.0 8.7 9.5 0.5 0.5 0.5 17.3 18.6 19.7 Indonesia 0.1 0.1 0.1 17.9 19.9 21.0 5.7 6.9 7.9 Iran 1.2 1.6 1.3 0.2 0.3 0.1 1.6 1.8 1.8 Japan 1.1 1.2 1.2 - - - 3.1 3.1 3.1 Korea, Republic of 0.9 1.0 1.0 - - - 1.2 1.4 1.4 Malaysia 1.5 2.2 2.5 17.2 18.9 20.0 3.8 3.3 3.7 Pakistan 2.1 2.3 2.4 0.1 0.1 0.1 3.6 4.0 4.1 Philippines 0.5 0.6 0.7 1.1 1.0 1.1 1.0 1.2 1.1 Singapore 0.6 0.8 1.0 0.3 0.3 0.3 0.3 0.6 0.7 Turkey 1.2 1.3 1.5 0.3 0.4 0.5 2.3 2.3 2.6
AFRICA 7.5 8.2 8.4 1.2 1.3 1.4 13.1 14.2 14.5Algeria 0.6 0.5 0.6 0.1 - - 0.7 0.7 0.8 Egypt 1.6 1.6 1.9 0.1 - 0.1 2.0 2.1 2.2 Nigeria 0.8 1.1 1.1 0.1 0.1 0.1 2.5 2.8 2.9 South Africa 0.7 0.8 0.8 0.1 0.1 0.1 1.1 1.2 1.2
CENTRAL AMERICA 2.3 2.3 2.4 0.8 0.7 0.8 4.5 4.7 4.6 Mexico 1.2 1.2 1.3 0.2 0.1 0.1 2.9 3.0 3.0
SOUTH AMERICA 2.3 2.6 2.7 9.7 9.1 8.8 12.0 14.5 15.7Argentina 0.1 0.1 0.1 6.2 5.8 5.9 2.0 3.1 3.5Brazil 0.4 0.5 0.6 2.1 1.9 1.5 6.4 7.4 7.9
NORTH AMERICA 4.0 4.5 4.8 6.1 7.0 6.5 17.2 18.4 19.0Canada 0.5 0.5 0.6 2.3 3.2 3.2 0.9 1.0 1.1 United States of America 3.5 4.0 4.2 3.8 3.8 3.2 16.4 17.5 18.0
EUROPE 13.4 13.1 13.1 5.4 6.0 7.4 34.3 36.4 36.9 European Union 10.7 10.5 10.6 2.1 2.4 2.5 28.5 29.9 30.3 Russian Federation 1.2 1.2 1.1 0.8 0.5 1.4 3.6 4.0 4.1 Ukraine 0.5 0.4 0.4 2.2 2.8 3.1 0.9 1.0 1.0
OCEANIA 0.5 0.6 0.6 1.7 1.8 1.9 1.0 1.1 1.1 Australia 0.4 0.4 0.4 0.6 0.7 0.7 0.7 0.7 0.7
WORLD 64.5 69.1 72.4 64.5 69.2 72.5 162.2 176.7 185.3 Developing countries 44.4 48.6 51.6 51.7 54.9 57.2 104.5 115.6 123.0 Developed countries 20.1 20.5 20.9 12.8 14.3 15.2 57.7 61.1 62.3 LIFDCs 30.2 32.4 34.4 21.8 23.8 25.1 73.0 80.6 85.7 LDCs 4.3 5.0 5.0 0.4 0.5 0.5 7.3 7.9 8.0
1 Includes oils and fats of vegetable, marine and animal origin.
Statistical tables
May 2012 87
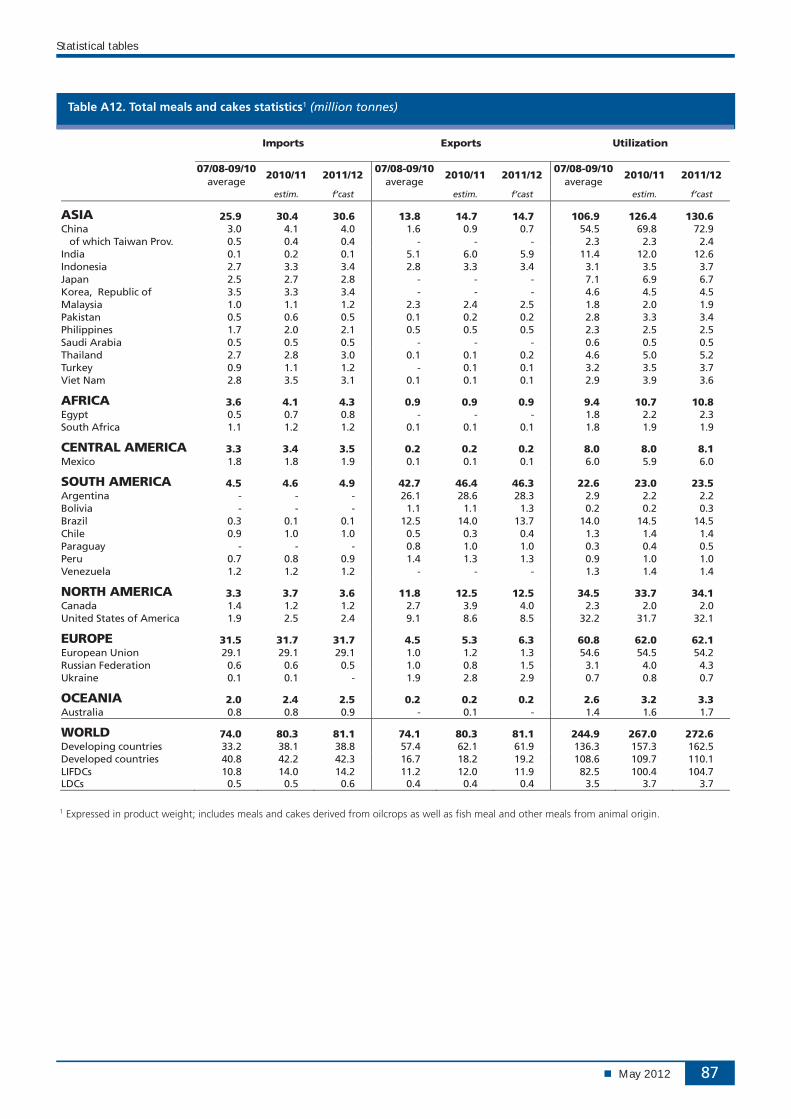
Table A12. Total meals and cakes statistics1 (million tonnes)
Imports Exports Utilization
07/08-09/10 2010/11 2011/12
07/08-09/102010/11 2011/12
07/08-09/10 2010/11 2011/12
average average average estim. f’cast estim. f’cast estim. f’cast
ASIA 25.9 30.4 30.6 13.8 14.7 14.7 106.9 126.4 130.6China 3.0 4.1 4.0 1.6 0.9 0.7 54.5 69.8 72.9 of which Taiwan Prov. 0.5 0.4 0.4 - - - 2.3 2.3 2.4 India 0.1 0.2 0.1 5.1 6.0 5.9 11.4 12.0 12.6 Indonesia 2.7 3.3 3.4 2.8 3.3 3.4 3.1 3.5 3.7 Japan 2.5 2.7 2.8 - - - 7.1 6.9 6.7 Korea, Republic of 3.5 3.3 3.4 - - - 4.6 4.5 4.5 Malaysia 1.0 1.1 1.2 2.3 2.4 2.5 1.8 2.0 1.9 Pakistan 0.5 0.6 0.5 0.1 0.2 0.2 2.8 3.3 3.4 Philippines 1.7 2.0 2.1 0.5 0.5 0.5 2.3 2.5 2.5 Saudi Arabia 0.5 0.5 0.5 - - - 0.6 0.5 0.5 Thailand 2.7 2.8 3.0 0.1 0.1 0.2 4.6 5.0 5.2 Turkey 0.9 1.1 1.2 - 0.1 0.1 3.2 3.5 3.7 Viet Nam 2.8 3.5 3.1 0.1 0.1 0.1 2.9 3.9 3.6
AFRICA 3.6 4.1 4.3 0.9 0.9 0.9 9.4 10.7 10.8Egypt 0.5 0.7 0.8 - - - 1.8 2.2 2.3 South Africa 1.1 1.2 1.2 0.1 0.1 0.1 1.8 1.9 1.9
CENTRAL AMERICA 3.3 3.4 3.5 0.2 0.2 0.2 8.0 8.0 8.1 Mexico 1.8 1.8 1.9 0.1 0.1 0.1 6.0 5.9 6.0
SOUTH AMERICA 4.5 4.6 4.9 42.7 46.4 46.3 22.6 23.0 23.5Argentina - - - 26.1 28.6 28.3 2.9 2.2 2.2 Bolivia - - - 1.1 1.1 1.3 0.2 0.2 0.3 Brazil 0.3 0.1 0.1 12.5 14.0 13.7 14.0 14.5 14.5 Chile 0.9 1.0 1.0 0.5 0.3 0.4 1.3 1.4 1.4 Paraguay - - - 0.8 1.0 1.0 0.3 0.4 0.5 Peru 0.7 0.8 0.9 1.4 1.3 1.3 0.9 1.0 1.0 Venezuela 1.2 1.2 1.2 - - - 1.3 1.4 1.4
NORTH AMERICA 3.3 3.7 3.6 11.8 12.5 12.5 34.5 33.7 34.1Canada 1.4 1.2 1.2 2.7 3.9 4.0 2.3 2.0 2.0 United States of America 1.9 2.5 2.4 9.1 8.6 8.5 32.2 31.7 32.1
EUROPE 31.5 31.7 31.7 4.5 5.3 6.3 60.8 62.0 62.1 European Union 29.1 29.1 29.1 1.0 1.2 1.3 54.6 54.5 54.2 Russian Federation 0.6 0.6 0.5 1.0 0.8 1.5 3.1 4.0 4.3 Ukraine 0.1 0.1 - 1.9 2.8 2.9 0.7 0.8 0.7
OCEANIA 2.0 2.4 2.5 0.2 0.2 0.2 2.6 3.2 3.3Australia 0.8 0.8 0.9 - 0.1 - 1.4 1.6 1.7
WORLD 74.0 80.3 81.1 74.1 80.3 81.1 244.9 267.0 272.6Developing countries 33.2 38.1 38.8 57.4 62.1 61.9 136.3 157.3 162.5 Developed countries 40.8 42.2 42.3 16.7 18.2 19.2 108.6 109.7 110.1 LIFDCs 10.8 14.0 14.2 11.2 12.0 11.9 82.5 100.4 104.7 LDCs 0.5 0.5 0.6 0.4 0.4 0.4 3.5 3.7 3.7
1 Expressed in product weight; includes meals and cakes derived from oilcrops as well as fish meal and other meals from animal origin.
Statistical tables
May 2012 99
Table A24. Selected international prices for oilcrop products and price indices
International prices (USD per tonne) FAO indices (2002-2004=100)
Period Soybeans 1 Soybean oil 2 Palm oil 3 Soybean cake 4
Rapeseed meal5
Oilseeds Edible/soap fats/oils
Oilcakes/meals
Annual (Oct/Sept)
2003/04 322 632 488 257 178 121 114 116
2004/05 275 545 419 212 130 105 104 105
2005/06 259 572 451 202 130 100 125 107
2006/07 335 772 684 264 184 129 148 153
2007/08 549 1 325 1 050 445 296 217 245 202
2008/09 422 826 627 385 196 156 145 180
2009/10 429 924 806 388 220 162 174 215
2010/11 549 1 308 1 147 418 279 215 256 221
Monthly
2010 - April 412 900 826 378 205 157 174 224
2010 - May 406 864 813 353 226 153 171 214
2010 - June 408 860 794 342 194 154 169 206
2010 - July 426 911 811 361 225 162 176 211
2010 - August 457 1 002 901 389 245 175 194 213
2010 - September 468 1 036 910 398 277 180 199 218
2010 - October 496 1 165 998 415 285 193 222 227
2010 - November 526 1 248 1 117 430 292 205 245 225
2010 - December 550 1 321 1 229 437 289 216 264 222
2011 - January 572 1 384 1 279 454 313 225 279 234
2011 - February 569 1 366 1 286 447 290 224 281 241
2011 - March 552 1 305 1 172 423 264 217 262 234
2011 - April 553 1 310 1 148 406 277 219 261 227
2011 - May 556 1 291 1 155 403 280 218 261 220
2011 - June 559 1 321 1 137 396 289 219 259 211
2011 - July 558 1 345 1 100 405 262 217 253 209
2011 - August 557 1 327 1 080 402 248 214 245 206
2011 - September 546 1 310 1 065 396 255 209 239 200
2011 - October 502 1 216 995 378 243 194 224 194
2011 - November 491 1 228 1 054 353 224 191 235 186
2011 - December 476 1 163 1 026 346 227 185 227 182
2012 - January 500 1 223 1 062 371 234 193 234 189
2012 - February 512 1 245 1 100 385 255 199 239 192
2012 - March 542 1 283 1 152 426 287 209 245 205
2012 - April 575 1 308 1 182 474 335 221 251 225
1 Soybeans: US, No.2 yellow, c.i.f. Rotterdam.2 Soybean oil: Dutch, fob ex-mill.3 Palm oil: Crude, c.i.f. Northwest Europe.4 Soybean cake: Pellets, 44/45 percent, Argentina, c.i.f. Rotterdam.5 Rapeseed meal: 34 percent, Hamburg, f.o.b. ex-mill. Note: The FAO indices are calculated using the Laspeyres formula; the weights used are the average export values of each commodity for the 2002-2004 period. The indices are based on the international prices of twelve selected seeds, ten selected oils and fats and seven selected cakes and meals.Sources: FAO and Oil World.