Embed Size (px)
Citation preview

Ok, That’s Over. What’s Next?!
Ok, That’s Over. What’s Next?!
Stanley F. Duobinis, Ph.D.Crystal Ball Economics, Inc.
Stanley F. Duobinis, Ph.D.Crystal Ball Economics, Inc.
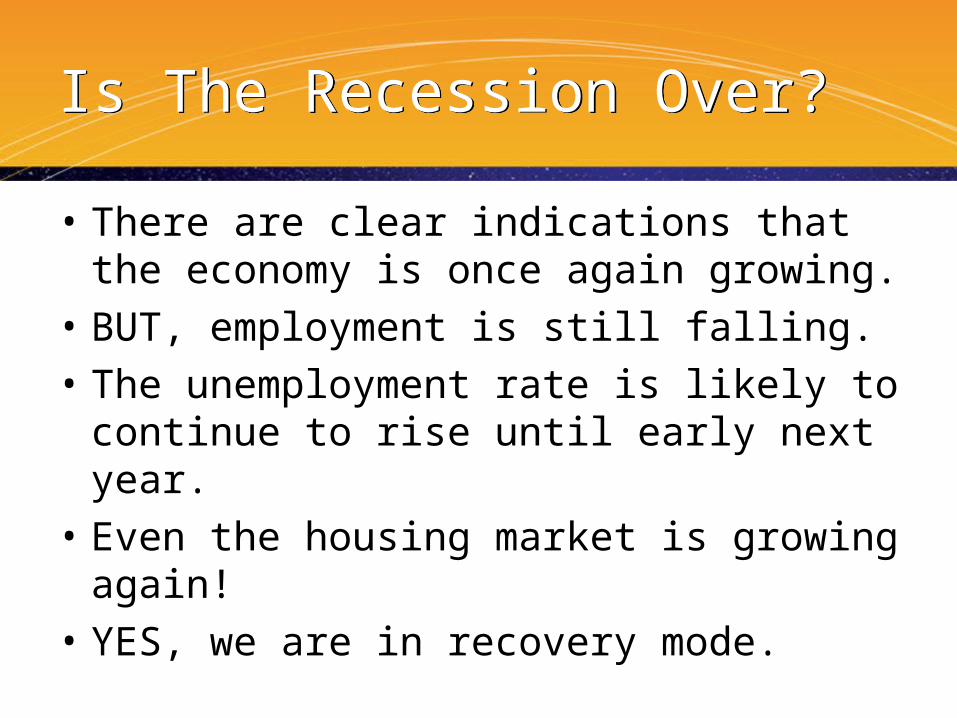
Is The Recession Over?Is The Recession Over?
• There are clear indications that the economy is once again growing.
• BUT, employment is still falling.• The unemployment rate is likely to
continue to rise until early next year.• Even the housing market is growing
again!• YES, we are in recovery mode.

What Caused the Turnaround?What Caused the Turnaround?
• Adjustments happened as they always do.– Inventories were drawn down.– Saving increased (and borrowing declined).
• The Federal Reserve took many steps to help financial markets recover from what could have been a true financial disaster.
• While we still have a long way to go until these markets are normal again, we are headed in the correct direction.

What About Housing?What About Housing?
• The housing industry did experience the largest downturn it has seen since the Great Depression.– Housing Starts fell by 72.0 percent from
2005 to 2009.• Single-family housing starts fell by 73.1%.• While multifamily housing starts fell by
67.5%.

Is The Recession Over?Is The Recession Over?
• Employment is still falling.• The unemployment rate is likely to
continue to rise until early next year. • But this is normal.• Employment growth and the
unemployment rate are lagging indicators.
• Yes, the recession is over.

Total Payroll EmploymentTotal Payroll Employment
-8
-6
-4
-2
0
2
4
6
1989 1991 1993 1995 1997 1999 2001 2003 2005 2007 2009 2011
Percent Change

Total Payroll EmploymentTotal Payroll Employment
-10
-5
0
5
10
15
1948 1958 1968 1978 1988 1998 2008
Percent Change

U.S. Unemployment RateU.S. Unemployment Rate
23456789
1011
1948 1954 1960 1966 1972 1978 1984 1990 1996 2002 2008
Percent

Real GDPReal GDP
-8-6-4-20
2468
1989 1991 1993 1995 1997 1999 2001 2003 2005 2007 2009 2011
Percent Change – 2005 Dollars
3.0

Real GDPReal GDP
-15
-10
-5
0
5
10
15
20
1947 1954 1961 1968 1975 1982 1989 1996 2003 2010
Percent Change

Consumer Confidence IndexConsumer Confidence Index
020406080
100120140160
1980 1983 1986 1989 1992 1995 1998 2001 2004 2007
1985 = 100
Stock Market Tumbles
September 11th
The War in Iraq Hurricanes
A Slowdown for Housing
Oil Price Spikes

Consumer Confidence IndexConsumer Confidence Index
0
50
100
150
200
1980 1983 1986 1989 1992 1995 1998 2001 2004 2007
1985 = 100
Current Situation
Expectations

Housing Market IndexBuilder ConfidenceHousing Market IndexBuilder Confidence
0102030405060708090
100
1985 1988 1991 1994 1997 2000 2003 2006 2009

Housing Market IndexBuilder ConfidenceHousing Market IndexBuilder Confidence
0102030405060708090
100
1985 1988 1991 1994 1997 2000 2003 2006 2009
Present Situation ---
Expectations for the next 6 Months ---

Housing Market IndexBuilder ConfidenceHousing Market IndexBuilder Confidence
01020304050607080
1985 1988 1991 1994 1997 2000 2003 2006 2009
Traffic of Prospective Buyers ---

First-time Homebuyer Tax CreditFirst-time Homebuyer Tax Credit• The tax credit is set to expire at the end of
the year.• Probably won’t be extended.• It has helped both the existing home
market and the new home market.• It is directed at first-time home buyers –
defined as someone who hasn’t owned a home during the three years prior to the purchase of the qualifying home. (Second homes don’t count.)

Federal Reserve PolicyFederal Reserve Policy
• Will the Fed do more to help the housing market?
• The Federal Funds rate has been lowered from 5.25% in 2007 to its current 0.2%!
• This is a negative real rate!• There has been no room to lower rates for
some time.• In fact, the next move is an increase in rates.• So, the Fed will continue its alphabet soup of
programs designed to firm up financial markets – TALF, CPFF, MMIFF, AMLF, etc.

Federal Funds Rate TargetFederal Funds Rate Target
0
2
4
6
8
10
12
1989 1992 1995 1998 2001 2004 2007 2010
Percent

Mortgage RatesMortgage Rates
3456789
101112
1989 1992 1995 1998 2001 2004 2007 2010
Percent
Fixed Rate
Adjustable Rate

Credit Is Still Hard to GetCredit Is Still Hard to Get
• Interest rates are important, but a bank’s willingness to lend is also critical.
• The progressive tightening of lending standards in all major components of U.S. credit markets slowed the housing market.
• The Federal Reserve’s Senior Loan Officer Opinion Survey (SLOOS) documents a progressive tightening of lending standards during the past three years.
• BUT, the most recent SLOOS shows that that fewer lending institutions are tightening standards.

Home PricesHome Prices
• What about falling home prices? • Aren’t they still falling? • Yes, in most markets.• But, the rate of decline is
becoming smaller.

U.S. Home Price IndicesU.S. Home Price Indices
-30
-20
-10
0
10
20
30
2000 2001 2002 2003 2004 2005 2006 2007 2008 2009
O F H E O C ase-S ch iller (20 M etro )
Percent Change Annual Rate

U.S. Home Price IndicesU.S. Home Price Indices
-30
-20
-10
0
10
20
30
1987 1990 1993 1996 1999 2002 2005 2008
O F H E O C ase-S ch iller (10 M etro )
Percent Change Annual Rate

Home SalesHome Sales
0.0
0 .2
0 .4
0 .6
0 .8
1 .0
1 .2
1 .4
1989 1992 1995 1998 2001 2004 2007 2010
0.01 .02 .03 .04 .05 .06 .07 .08 .0
New Existing
Millions

Single-Family Housing StartsSingle-Family Housing Starts
0.0
0.5
1.0
1 .5
2 .0
1989 1992 1995 1998 2001 2004 2007 2010
Millions

New Home InventoryNew Home Inventory
0
1 0 0
2 0 0
3 0 0
4 0 0
5 0 0
6 0 0
1 9 8 9 1 9 9 1 1 9 9 3 1 9 9 5 1 9 9 7 1 9 9 9 2 0 0 1 2 0 0 3 2 0 0 5 2 0 0 7 2 0 0 9
Completed U nder Construction Not Started
120
112
40
570
272
Thousands

Homeownership RateHomeownership Rate
63
64
65
66
67
68
69
70
1989 1991 1993 1995 1997 1999 2001 2003 2005 2007 2009
Percent

Rental Vacancy RatesRental Vacancy Rates
6.0
7.0
8.0
9 .0
10.0
11.0
1989 1991 1993 1995 1997 1999 2001 2003 2005 2007 2009
Percent
All Rental Units

Rental Vacancy RatesRental Vacancy Rates
0.0
2.0
4.0
6 .0
8 .0
10.0
12.0
14.0
1968 1972 1976 1980 1984 1988 1992 1996 2000 2004 2008
Percent Buildings with 5 or More Units
Single-family

Multi-family Housing StartsMulti-family Housing Starts
0.0
0 .1
0 .2
0 .3
0 .4
0 .5
1989 1992 1995 1998 2001 2004 2007 2010
Millions

Condo Share of Multi-family Housing Starts
Condo Share of Multi-family Housing Starts
0
10
20
30
40
50
60
1989 1992 1995 1998 2001 2004 2007
Percent

Total Housing StartsTotal Housing Starts
0.0
0.5
1.0
1 .5
2 .0
2 .5
1989 1992 1995 1998 2001 2004 2007 2010
Single-Family Multifamily
Millions

State-by-State ForecastsState-by-State Forecasts
• Looking across the country reveals a great variation in performance.
• This is true whether we look at single-family or multifamily housing starts.
• Unfortunately, the one thing that almost every state has in common this year is that single-family housing starts will show year over year declines.
• That means gains everywhere next year.• Multifamily will experience a similar cycle.

Single-Family Housing Starts
2008-2009
Single-Family Housing Starts
2008-2009
Percent Change
-14 to 4 (10)-25 to -15 (17)-33 to -26 (14)-41 to -34 (10)

Single-Family Housing Starts
2009-2010
Single-Family Housing Starts
2009-2010
Percent Change
58 to 67 (12)49 to 57 (17)44 to 49 (13)35 to 43 (9)

Single-Family Housing Starts
2010-2011
Single-Family Housing Starts
2010-2011
Percent Change
45 to 79 (11)38 to 44 (11)31 to 37 (19)24 to 30 (10)

Multifamily Housing Starts2008-2009
Multifamily Housing Starts2008-2009
Percent Change
-16 to 48 (6)-59 to -17 (27)-69 to -60 (10)-81 to -70 (8)

Multifamily Housing Starts2009-2010
Multifamily Housing Starts2009-2010
Percent Change
-13 to 10 (10)-25 to -14 (18)-34 to -26 (13)-55 to -35 (10)
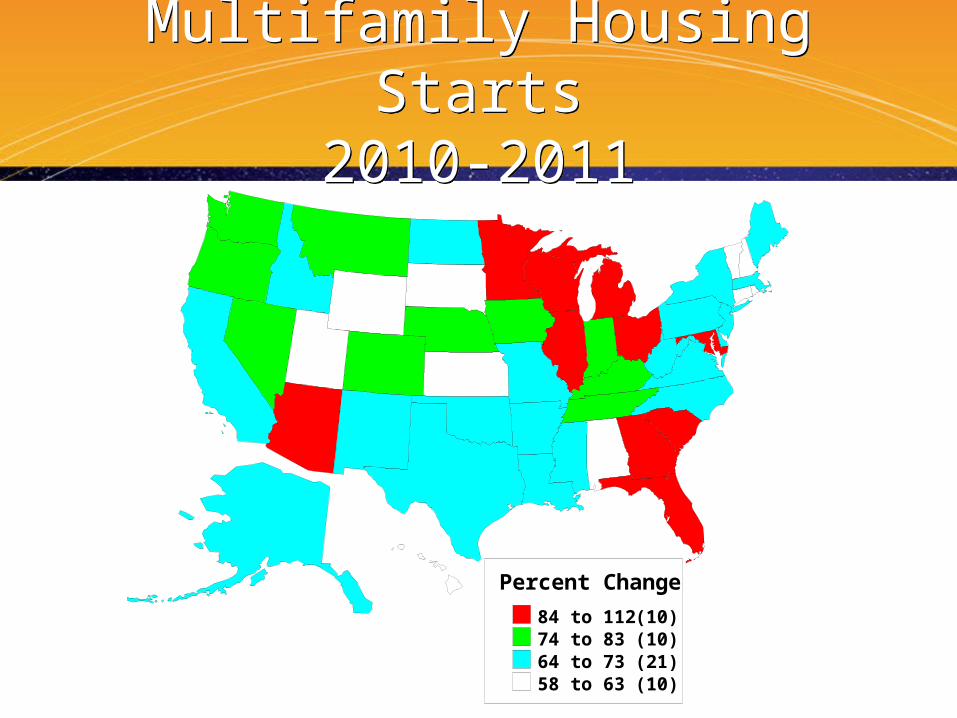
Multifamily Housing Starts2010-2011
Multifamily Housing Starts2010-2011
Percent Change
84 to 112 (10)74 to 83 (10)64 to 73 (21)58 to 63 (10)

Nonresidential ConstructionNonresidential Construction
150
175
200
225
250
275
300
1993 1996 1999 2002 2005 2008
Billions of 2000 Dollars

Nonresidential ConstructionNonresidential Construction
0
10
20
30
40
50
1993 1996 1999 2002 2005 2008
Billions of 2000 Dollars
Other Commercial
Retail
Lodging
Dining/Drinking

Data Access Data Access
• This presentation as well as all supporting data tables are available at:
• www.cbeconomics.com/bcmc

Open Forum DiscussionOpen Forum Discussion
• Please participate by asking questions and offering comments so that everyone can learn from each other.
• (Remember to fill out your session evaluation form.)