Embed Size (px)
Citation preview
Adaptation Strategyfor Climate Change in Japan - Toward Water-disaster Adaptive society -
September 22, 2008
Toshio OkazumiDirector for International Water Management Coordination
Ministry of Land, Infrastructure, Transport and TourismGovernment of Japan
Tone River
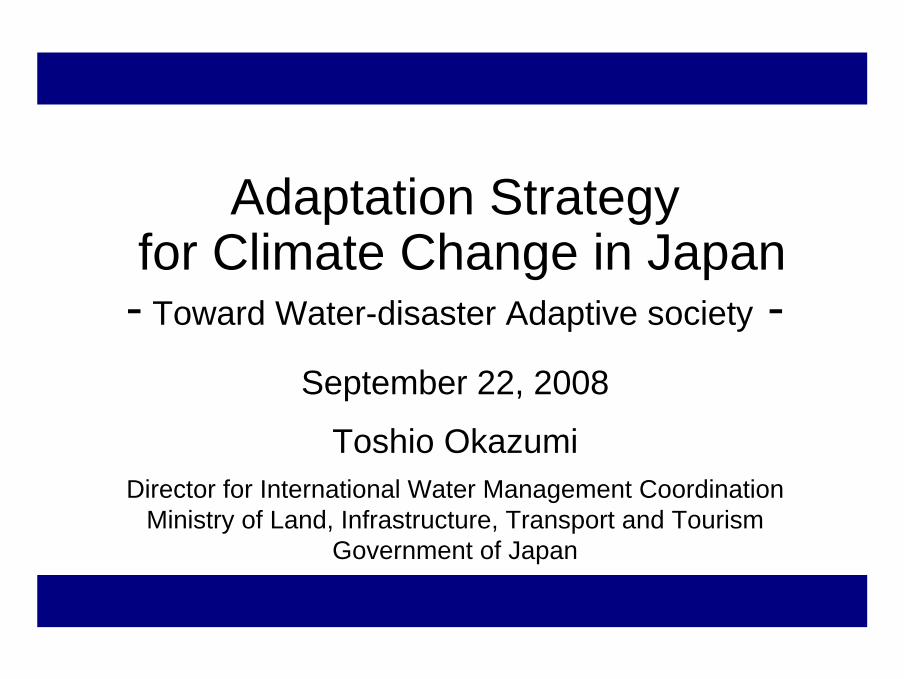
Japan is vulnerable to climate change 1. Present conditions and issues
TokyoStation
UenoStation
Ayase
River
ShinnakaRiver
Old E
do River
Ara
River
Kanda River
Shibuya RiverMeguro River
IkebukuroStation
ShinjukuStation
ShibuyaStation
Sumida River
KameidoStation
KinsicyoStation
Yodo RiverOsaka Castle
Osaka Station
Shin-Osaka Station
Tennouji Station
Neya River
HiranoRiver
Kanzaki RiverAmagasaki
Station
Kanto RegionKinki Region
Elevation
3m – 4m1m – 3m0m – 1m
-1m – 0m-1m –Water Area
Elevation
3m – 4m1m – 3m0m – 1m
-1m – 0m-1m –Water Area
About 50% of populationand about 75% of property on about 10% of land lower than water levels in rivers during flooding
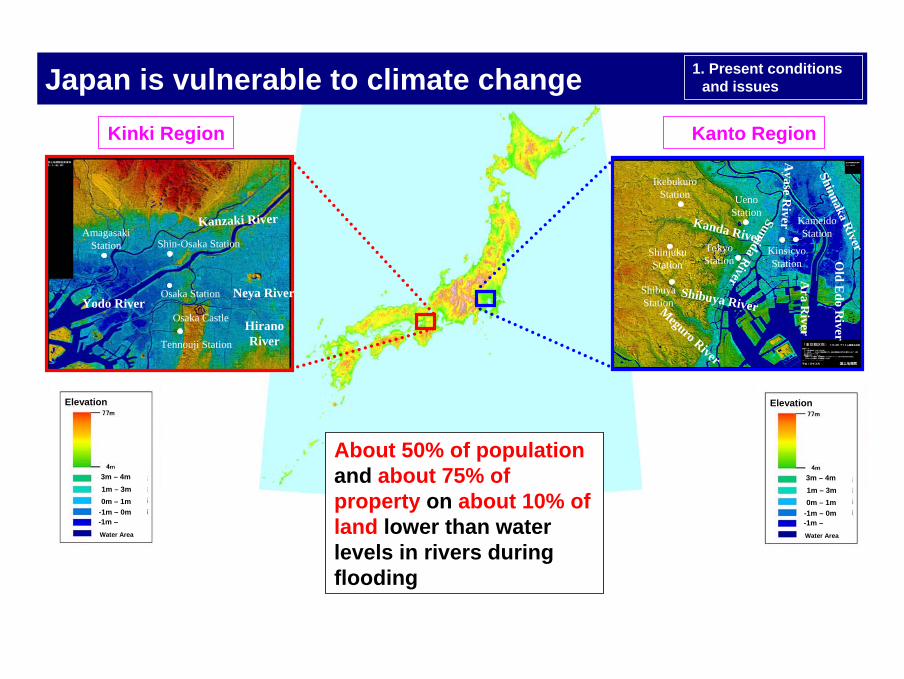
2008 Floods in Japan 1. Present conditions and issues
Break Point
Amount rainfall per hourAmount rainfall per hour
0
20
40
60
80
100
120
140
160
15 16 17 18 19 20 21 22 23 24 1 2 3 4 5 6 7 8 9 10
雨量
largest-ever amount rainfall per hour
(146mm/h)
2008.7.28 Floods in Hyogo Pref. 2008.8.29 Floods in Aichi Pref.
Rapid water level rise of 134cm in 10 minutes
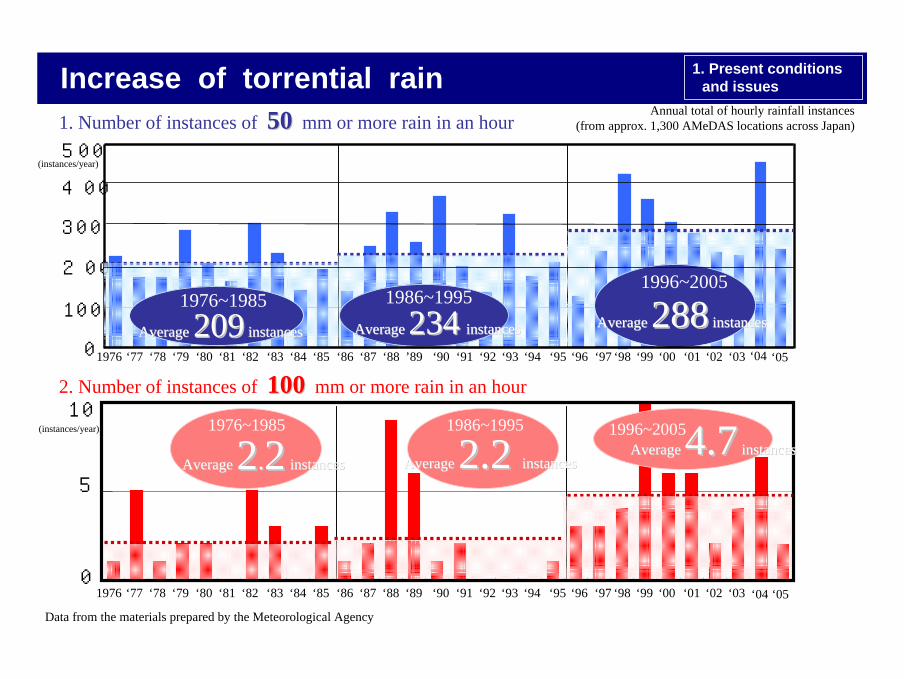
Increase of torrential rain
0
100
200
300
1. Number of instances of 5050 mm or more rain in an hour
2. Number of instances of 100100 mm or more rain in an hour
1976 ‘77 ‘78 ‘79 ‘80 ‘81 ‘82 ‘83 ‘84 ‘85 ‘86 ‘87 ‘88 ’89 ‘90 ‘91 ‘92 ‘93 ‘94 ‘95 ‘96 ‘97 ‘98 ‘99 ‘00 ‘01 ‘02 ‘03
1996~2005
AverageAverage 228888 instancesinstancesAverageAverage 234234 instancesinstances
1986~1995
AverageAverage 209209 instancesinstances
1976~1985
(instances/year)
0
5
10
1976 ‘77 ‘78 ‘79 ‘80 ‘81 ‘82 ‘83 ‘84 ‘85 ‘86 ‘87 ‘88 ‘89 ‘90 ‘91 ‘92 ‘93 ‘94 ‘95 ‘96 ‘97 ‘98 ‘99 ‘00 ‘01 ‘02 ‘03
1996~2005AverageAverage 4.74.7 instancesinstances
AverageAverage 2.2 2.2 instancesinstances
1986~1995
AverageAverage 22..22 instancesinstances
1976~1985
‘04
500
Annual total of hourly rainfall instances(from approx. 1,300 AMeDAS locations across Japan)
400
‘04 ‘05
‘05
Data from the materials prepared by the Meteorological Agency
(instances/year)
1. Present conditions and issues
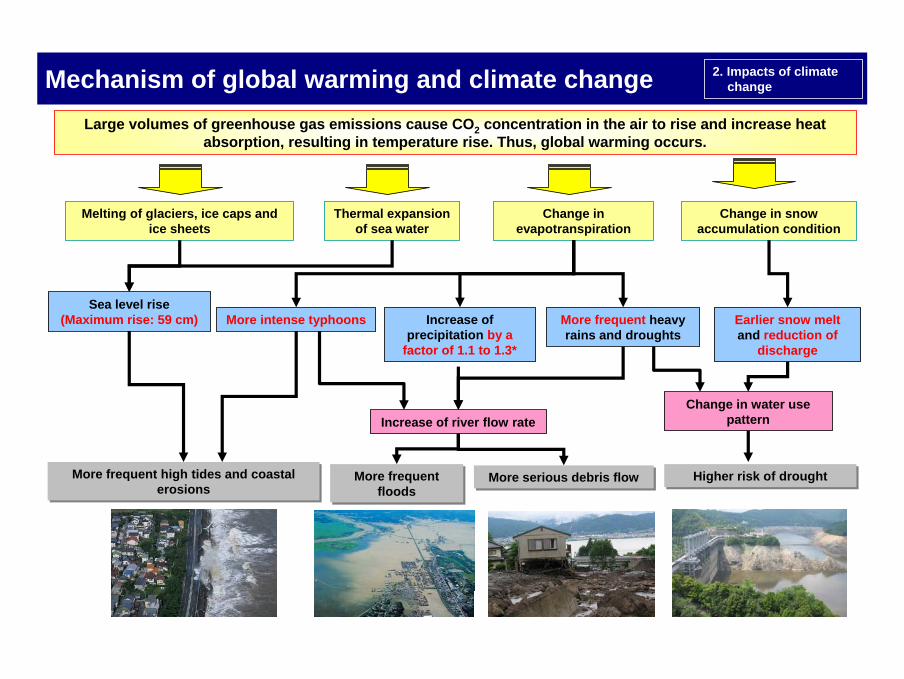
Mechanism of global warming and climate change Large volumes of greenhouse gas emissions cause CO2 concentration in the air to rise and increase heat
absorption, resulting in temperature rise. Thus, global warming occurs.
Increase of precipitation by a
factor of 1.1 to 1.3*
Change in snow accumulation condition
Thermal expansion of sea water
Change in evapotranspiration
Melting of glaciers, ice caps and ice sheets
More intense typhoons
More frequent high tides and coastal erosions
More frequent high tides and coastal erosions
Increase of river flow rate
More frequent floods
More frequent floods
More serious debris flowMore serious debris flow Higher risk of droughtHigher risk of drought
Earlier snow melt and reduction of
discharge
Change in water use pattern
More frequent heavy rains and droughts
2. Impacts of climate change
Sea level rise (Maximum rise: 59 cm)
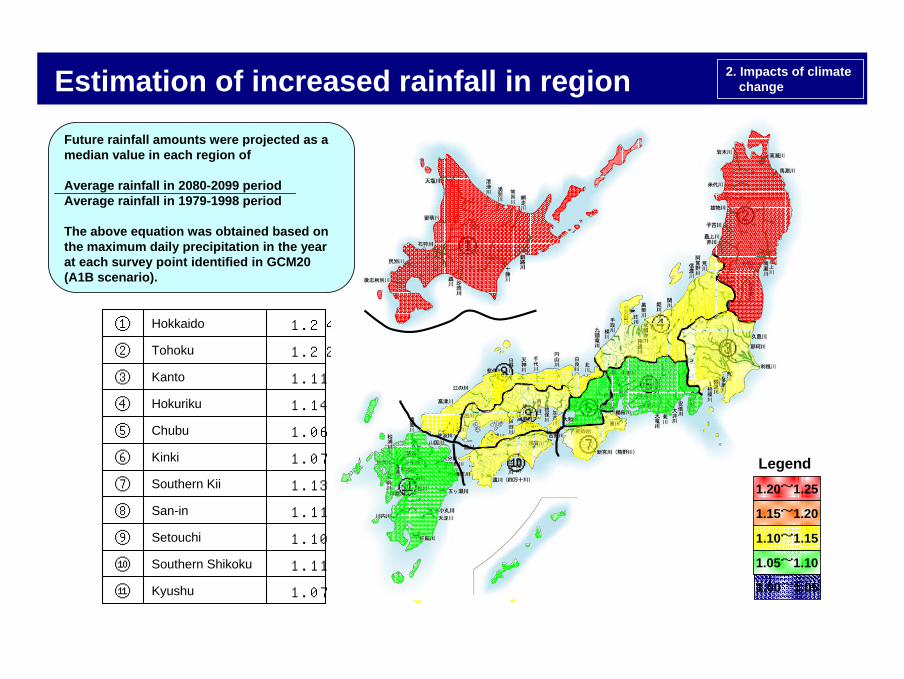
Estimation of increased rainfall in region
1.07 Kyushu⑪
1.11 Southern Shikoku⑩
1.10 Setouchi⑨
1.11 San-in⑧
1.13 Southern Kii⑦
1.07 Kinki⑥
1.06 Chubu⑤
1.14 Hokuriku④
1.11 Kanto③
1.22 Tohoku②
1.24 Hokkaido①
①
②
③
④
⑤
⑥
⑦
⑧
⑨
⑩
⑪
①
②
③
④
⑤⑥
⑦
⑧
⑨
⑩
⑪
Future rainfall amounts were projected as a median value in each region of
Average rainfall in 2080-2099 periodAverage rainfall in 1979-1998 period
The above equation was obtained based on the maximum daily precipitation in the year at each survey point identified in GCM20 (A1B scenario).
1.20~1.25
1.15~1.20
1.10~1.15
1.05~1.10
1.00~1.05
Legend
2. Impacts of climate change
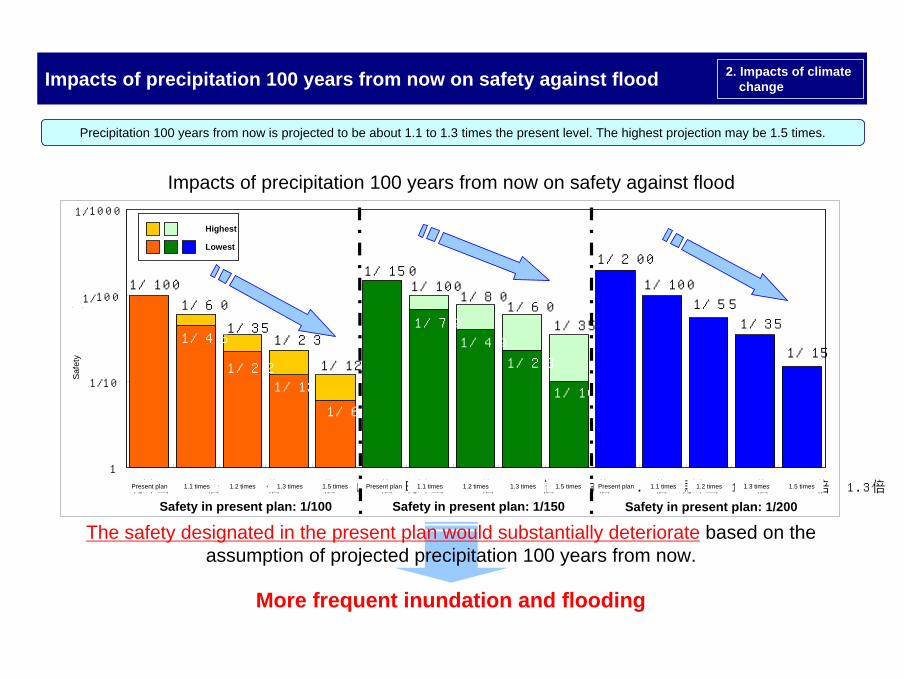
1/100
1/45
1/221/12
1/6
1/150
1/70
1/40
1/23
1/10
1/200
1/100
1/55
1/35
1/15
1/60
1/351/23
1/12
1/1001/80
1/601/35
1
10
100
1000
現計画 1.1倍 1.2倍 1.3倍 1.5倍 現計画 1.1倍 1.2倍 1.3倍 1.5倍 現計画 1.1倍 1.2倍 1.3倍 1.5倍
治水
安全
度
最大
最小
Impacts of precipitation 100 years from now on safety against flood
Impacts of precipitation 100 years from now on safety against flood
The safety designated in the present plan would substantially deteriorate based on the assumption of projected precipitation 100 years from now.
More frequent inundation and flooding
1/
1/
1/
Highest
Lowest
Safety in present plan: 1/100 Safety in present plan: 1/200Safety in present plan: 1/150
Precipitation 100 years from now is projected to be about 1.1 to 1.3 times the present level. The highest projection may be 1.5 times.
Present plan
Safe
ty
1.1 times 1.2 times 1.3 times 1.5 times Present plan 1.1 times 1.2 times 1.3 times 1.5 times Present plan 1.1 times 1.2 times 1.3 times 1.5 times
2. Impacts of climate change
計画降雨量の増加と基本高水のピーク流量の変化
0% 20% 40% 60% 80% 100% 120% 140% 160% 180%
嘉瀬川
(九州)
那賀川
(四国)
太田川
(中国)
紀の川
(近畿)
雲出川
(中部)
黒部川
(北陸)
利根川
(関東)
北上川
(東北)
石狩川
(北海道)
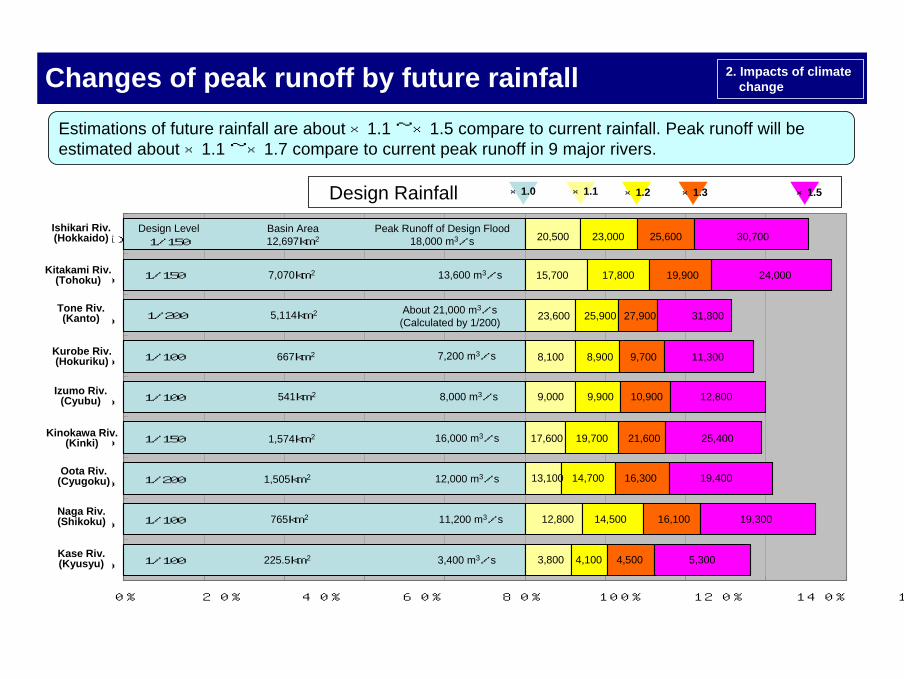
Estimations of future rainfall are about ×1.1 ~×1.5 compare to current rainfall. Peak runoff will be estimated about ×1.1 ~×1.7 compare to current peak runoff in 9 major rivers.
×1.0 ×1.1 ×1.2
Design Level1/150
1/150
1/200
1/100
1/100
1/150
1/200
1/100
1/100
Basin Area12,697km2
7,070km2
5,114km2
667km2
541km2
1,574km2
1,505km2
765km2
225.5km2
Peak Runoff of Design Flood18,000 m3/s
13,600 m3/s
About 21,000 m3/s(Calculated by 1/200)
7,200 m3/s
8,000 m3/s
16,000 m3/s
12,000 m3/s
11,200 m3/s
3,400 m3/s
20,500
15,700
23,600
8,100
9,000
17,600
13,100
12,800
3,800
23,000
17,800
25,900
8,900
9,900
19,700
14,700
14,500
4,100
25,600
19,900
27,900
9,700
10,900
21,600
16,300
16,100
4,500
30,700
24,000
31,800
11,300
12,800
25,400
19,400
19,300
5,300
×1.3 ×1.5
Ishikari Riv.(Hokkaido)
Kitakami Riv.(Tohoku)
Tone Riv.(Kanto)
Kurobe Riv.(Hokuriku)
Izumo Riv.(Cyubu)
Kinokawa Riv.(Kinki)
Oota Riv.(Cyugoku)
Naga Riv.(Shikoku)
Kase Riv.(Kyusyu)
Design Rainfall
Changes of peak runoff by future rainfall 2. Impacts of climate change
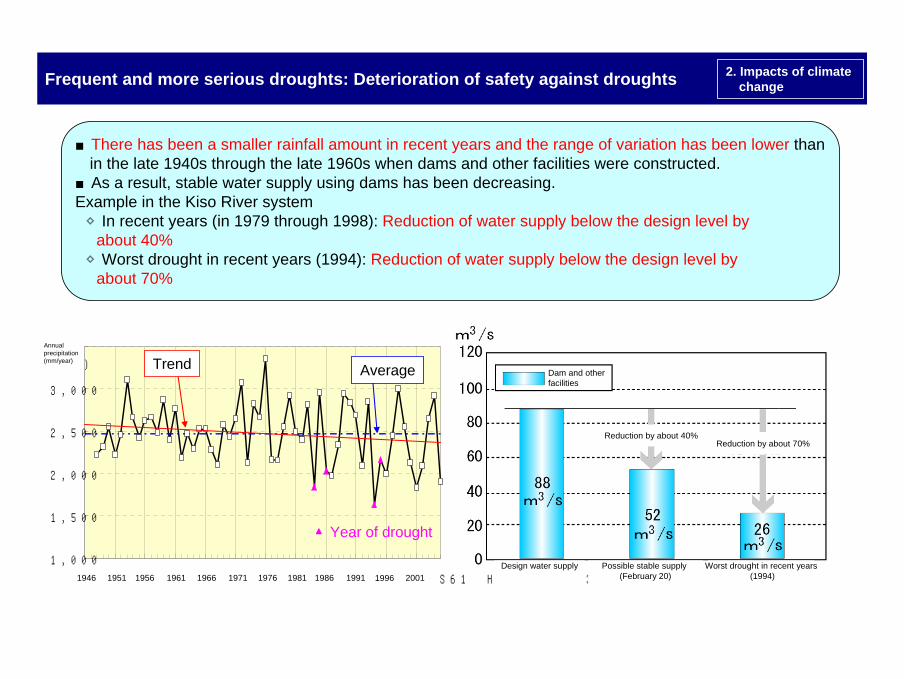
Frequent and more serious droughts: Deterioration of safety against droughts
1,000
1,500
2,000
2,500
3,000
S21 S26 S31 S36 S41 S46 S51 S56 S61 H3 H8 H13
年降水量(㎜/年)
▲Year of drought
Trend Average
Design water supply Possible stable supply (February 20)
Worst drought in recent years(1994)
■There has been a smaller rainfall amount in recent years and the range of variation has been lower than in the late 1940s through the late 1960s when dams and other facilities were constructed.
■As a result, stable water supply using dams has been decreasing.Example in the Kiso River system
◇In recent years (in 1979 through 1998): Reduction of water supply below the design level by about 40%
◇Worst drought in recent years (1994): Reduction of water supply below the design level by about 70%
Annual precipitation (mm/year)
Dam and other facilities
Reduction by about 40%Reduction by about 70%
1946 1951 1956 1961 1966 1971 1976 1981 1986 1991 1996 2001
2. Impacts of climate change
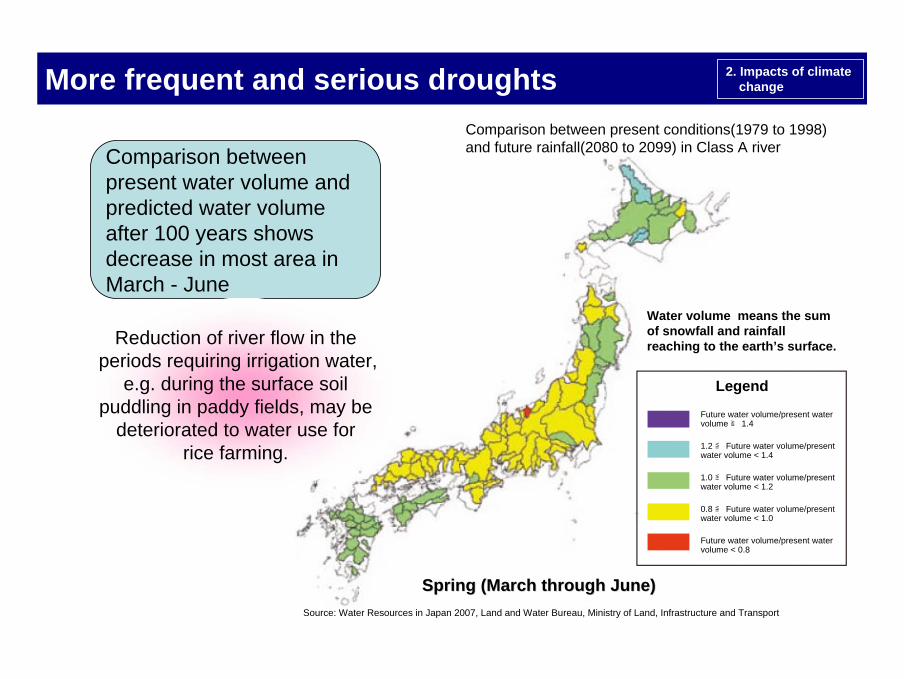
More frequent and serious droughts
Comparison between present water volume and predicted water volume after 100 years shows decrease in most area in March - June
Comparison between present conditions(1979 to 1998) and future rainfall(2080 to 2099) in Class A river
Source: Water Resources in Japan 2007, Land and Water Bureau, Ministry of Land, Infrastructure and Transport
Legend
Spring (March through June)Spring (March through June)
Future water volume/present water volume ≧ 1.4
1.2 ≦ Future water volume/present water volume < 1.4
1.0 ≦ Future water volume/present water volume < 1.2
0.8 ≦ Future water volume/present water volume < 1.0
Future water volume/present water volume < 0.8
Reduction of river flow in the periods requiring irrigation water,
e.g. during the surface soil puddling in paddy fields, may be
deteriorated to water use for rice farming.
2. Impacts of climate change
Water volume means the sum of snowfall and rainfall reaching to the earth’s surface.
Frequent and more serious droughts
Source: Water Resources in Japan 2007, Land and Water Bureau, Ministry of Land, Infrastructure and Transport
0
50
100
150
200
250
300
10月 1日 11月 1日 12月 1日 1月 1日 2月 1日 3月 1日 4月 1日 5月 1日
積雪深
平 均
将 来
cm )
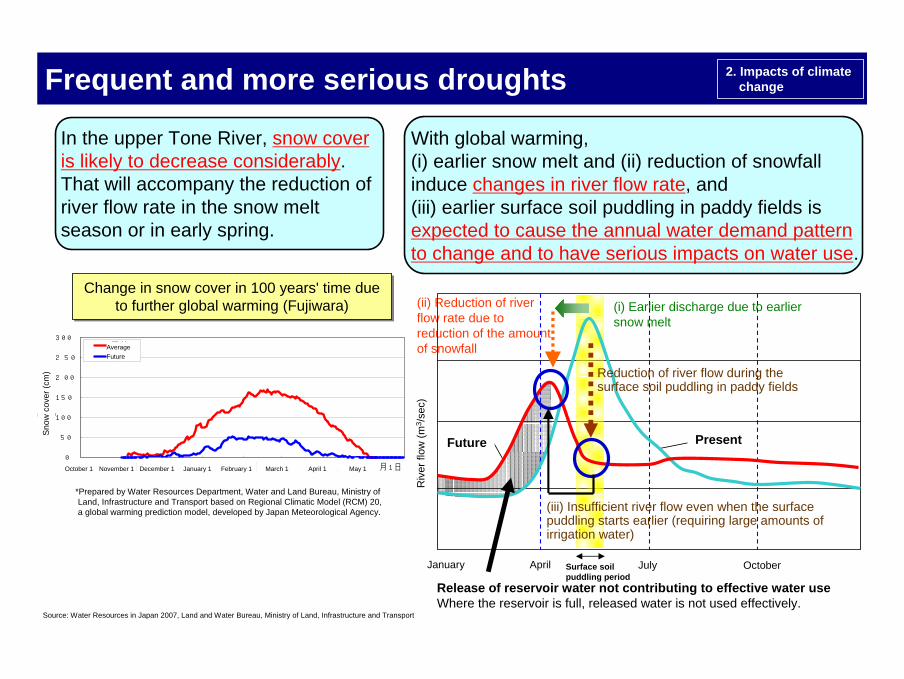
Change in snow cover in 100 years' time due to further global warming (Fujiwara)
Change in snow cover in 100 years' time due to further global warming (Fujiwara)
In the upper Tone River, snow cover is likely to decrease considerably.That will accompany the reduction of river flow rate in the snow melt season or in early spring.
*Prepared by Water Resources Department, Water and Land Bureau, Ministry of Land, Infrastructure and Transport based on Regional Climatic Model (RCM) 20, a global warming prediction model, developed by Japan Meteorological Agency.
AverageFuture
March 1October 1 November 1 December 1 January 1 February 1 April 1 May 1
Release of reservoir water not contributing to effective water useWhere the reservoir is full, released water is not used effectively.
現況将来
Surface soil puddling period
Riv
er fl
ow (m
3 /se
c)
(ii) Reduction of river flow rate due to reduction of the amount of snowfall
With global warming,(i) earlier snow melt and (ii) reduction of snowfall induce changes in river flow rate, and(iii) earlier surface soil puddling in paddy fields is expected to cause the annual water demand pattern to change and to have serious impacts on water use.
(i) Earlier discharge due to earlier snow melt
January JulyApril October
(iii) Insufficient river flow even when the surface puddling starts earlier (requiring large amounts of irrigation water)
Reduction of river flow during the surface soil puddling in paddy fields
Snow
cov
er (c
m)
Future Present
2. Impacts of climate change
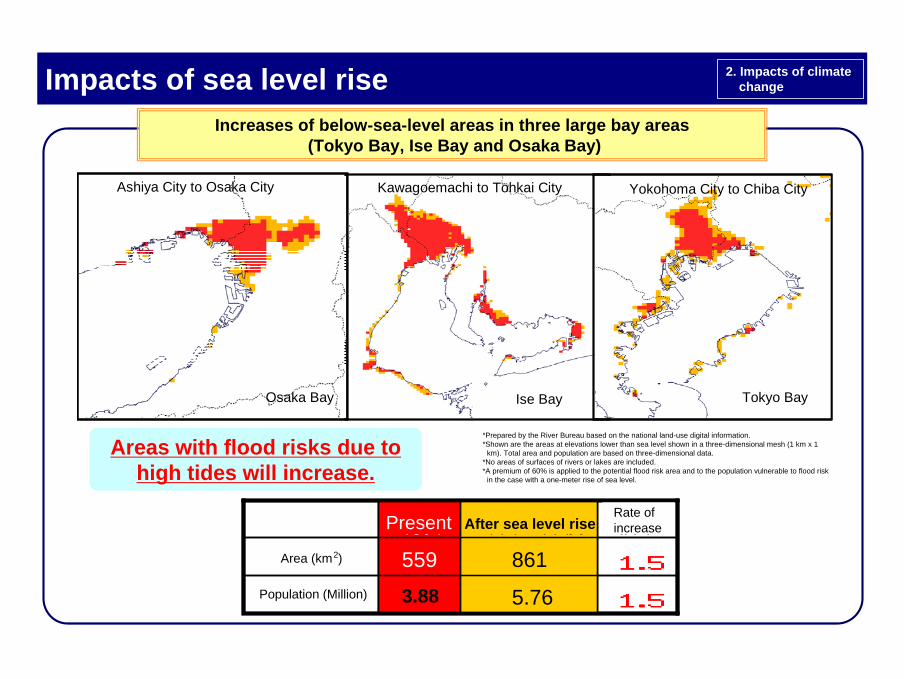
Increases of below-sea-level areas in three large bay areas(Tokyo Bay, Ise Bay and Osaka Bay)
*Prepared by the River Bureau based on the national land-use digital information.*Shown are the areas at elevations lower than sea level shown in a three-dimensional mesh (1 km x 1
km). Total area and population are based on three-dimensional data.*No areas of surfaces of rivers or lakes are included.*A premium of 60% is applied to the potential flood risk area and to the population vulnerable to flood risk
in the case with a one-meter rise of sea level.
Areas with flood risks due to high tides will increase.
Impacts of sea level rise
Ise Bay
Kawagoemachi to Tohkai City
Osaka Bay
Ashiya City to Osaka City
Tokyo Bay
Yokohoma City to Chiba City
Ise Bay
Kawagoemachi to Tohkai City
Osaka Bay
Ashiya City to Osaka City
Tokyo Bay
Yokohoma City to Chiba City
593
879海面上昇後
1.5404人口(万人)
1.5577面積(k㎡)
倍率現状
5.76
861海面上昇後
1.53.88人口(万人)
1.5559面積(k㎡)
倍率現状Present After sea level riseRate of increase
Area (km2)
Population (Million)
2. Impacts of climate change
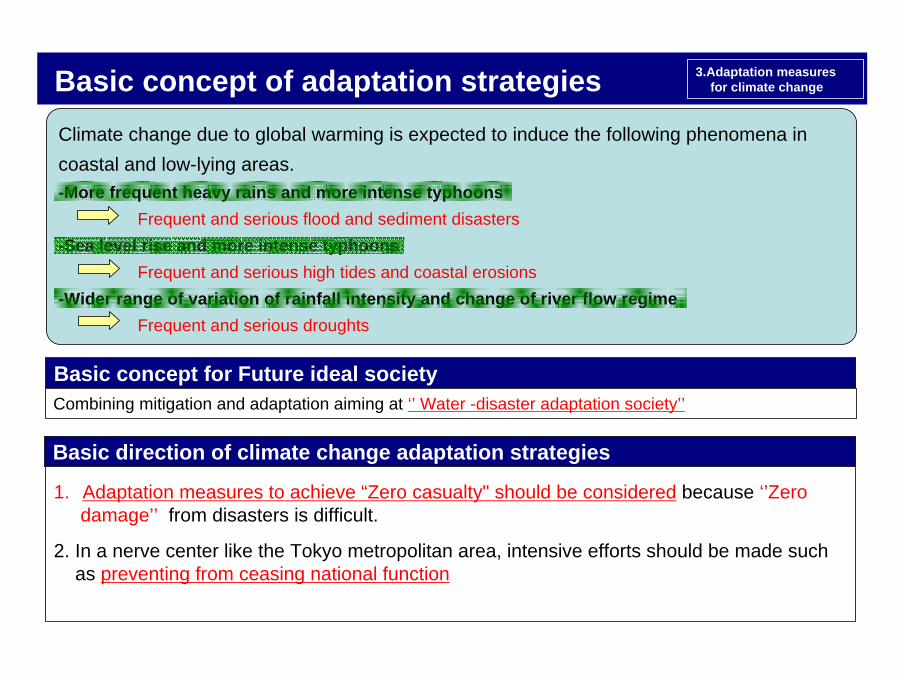
Basic concept of adaptation strategies 3.Adaptation measures for climate change
Climate change due to global warming is expected to induce the following phenomena in coastal and low-lying areas.-More frequent heavy rains and more intense typhoons
Frequent and serious flood and sediment disasters-Sea level rise and more intense typhoons
Frequent and serious high tides and coastal erosions-Wider range of variation of rainfall intensity and change of river flow regime
Frequent and serious droughts
Basic concept for Future ideal society
Basic direction of climate change adaptation strategies
Combining mitigation and adaptation aiming at ‘’ Water -disaster adaptation society’’
1. Adaptation measures to achieve “Zero casualty" should be considered because ‘’Zero damage’’ from disasters is difficult.
2. In a nerve center like the Tokyo metropolitan area, intensive efforts should be made such as preventing from ceasing national function
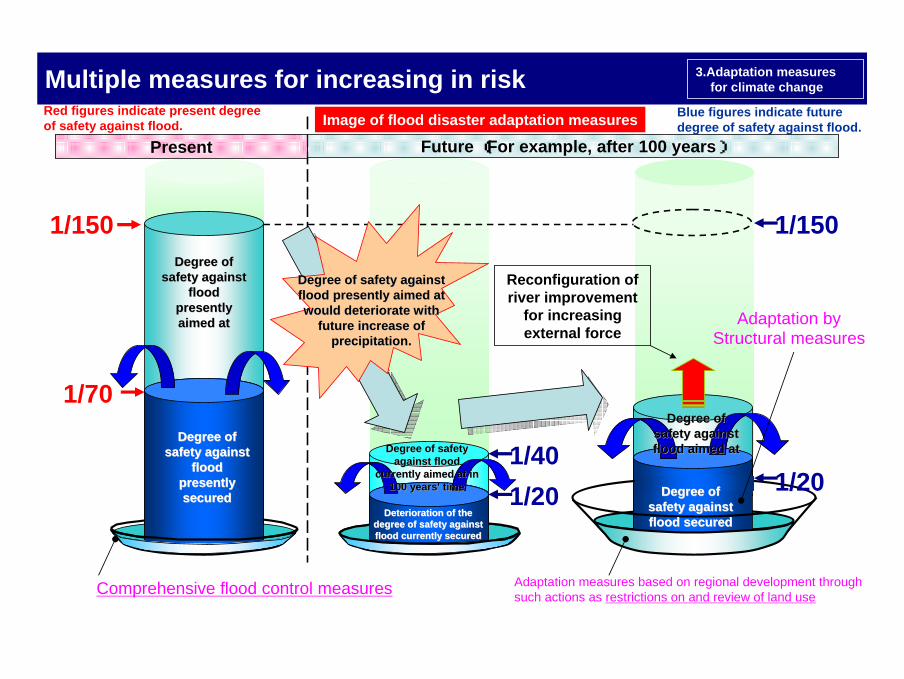
1/150 1/150
1/70
1/401/20
Comprehensive flood control measures
Present Future (For example, after 100 years)
Multiple measures for increasing in riskRed figures indicate present degree of safety against flood.
Blue figures indicate future degree of safety against flood.
Degree of Degree of safety against safety against
flood flood presently presently aimed ataimed at
Degree of Degree of safety against safety against
flood flood presently presently securedsecured
1/20Degree of safety Degree of safety
against flood against flood currently aimed at in currently aimed at in
100 years' time100 years' time
Deterioration of the Deterioration of the degree of safety against degree of safety against flood currently securedflood currently secured
Degree of safety against Degree of safety against flood presently aimed at flood presently aimed at would deteriorate with would deteriorate with
future increase of future increase of precipitation.precipitation.
Adaptation measures based on regional development through such actions as restrictions on and review of land use
Degree of Degree of safety against safety against flood aimed atflood aimed at
Degree of Degree of safety against safety against flood securedflood secured
Adaptation by Structural measures
Reconfiguration of river improvement
for increasing external force
Image of flood disaster adaptation measures
3.Adaptation measures for climate change
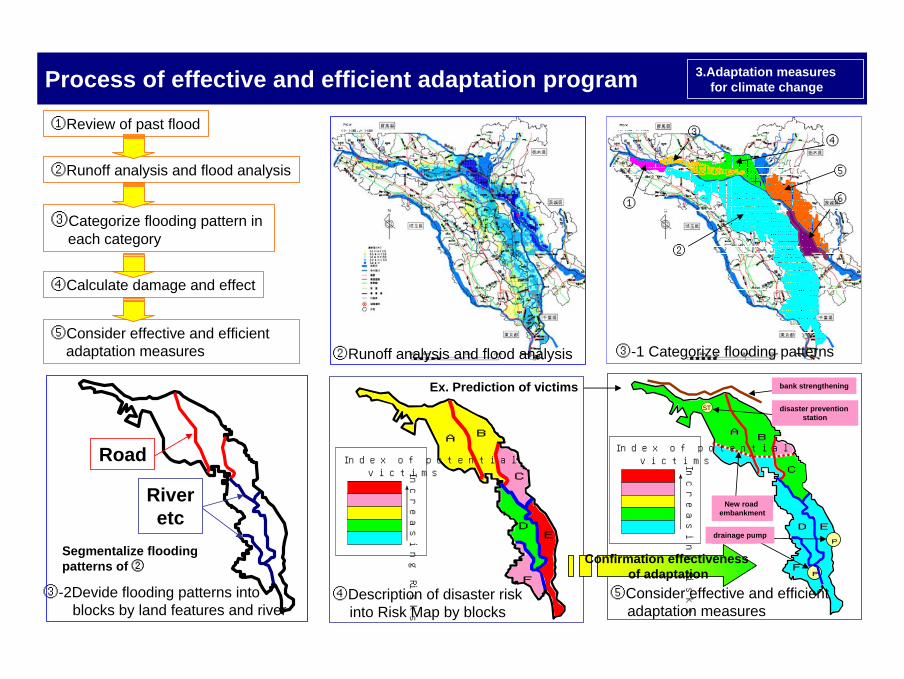
Process of effective and efficient adaptation program
①Review of past flood
②Runoff analysis and flood analysis
③Categorize flooding pattern in each category
⑤Consider effective and efficient adaptation measures ②Runoff analysis and flood analysis
入間台地
③-1 Categorize flooding patterns
③-2Devide flooding patterns into blocks by land features and river
④Description of disaster risk into Risk Map by blocks
BA
C
ED
F
Index of potentialvictims In
cre
asing R
isks
Ex. Prediction of victims
防災ステーション
堤防補強
排水ポンプ
新設する道路盛土
⑤Consider effective and efficient adaptation measures
Confirmation effectiveness of adaptation
①
②
③④
⑤
⑥
④Calculate damage and effect
P
P
ST
AABB
CC
DD EE
FF
Index of potentialvictims In
cre
asing R
isks
bank strengthening
disaster prevention station
drainage pump
New road embankment
Road
Riveretc
Segmentalize flooding patterns of ②
3.Adaptation measures for climate change
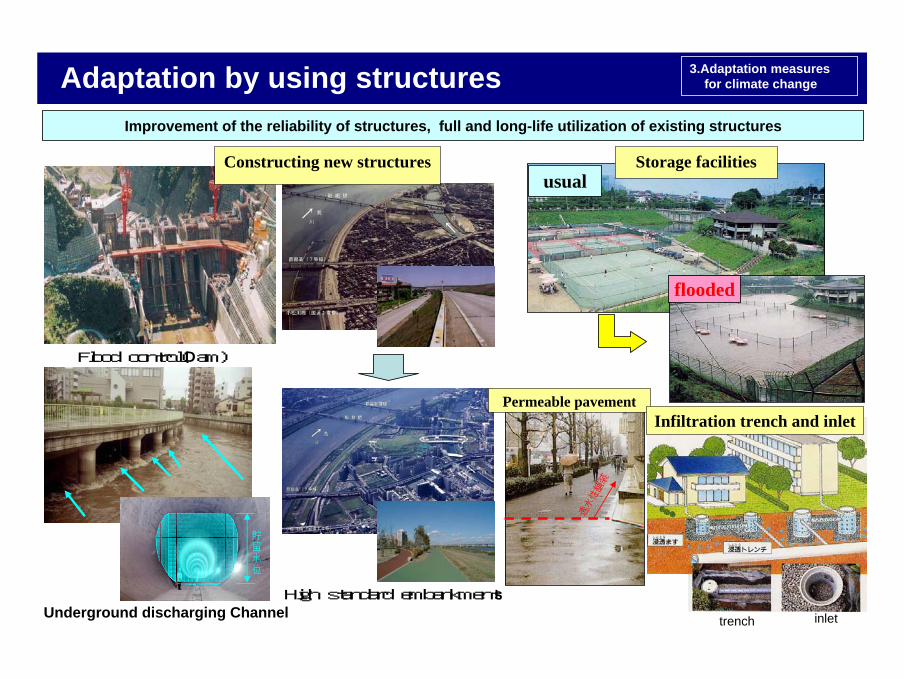
対策後対策後
Flood control(Dam)
High standard embankmentsUnderground discharging Channel
貯留水位
usual
flooded
Permeable pavement
透水性舗装
trench雨水浸透ます
inlet
Infiltration trench and inlet
Improvement of the reliability of structures, full and long-life utilization of existing structures
Storage facilitiesConstructing new structures
Adaptation by using structures 3.Adaptation measures for climate change
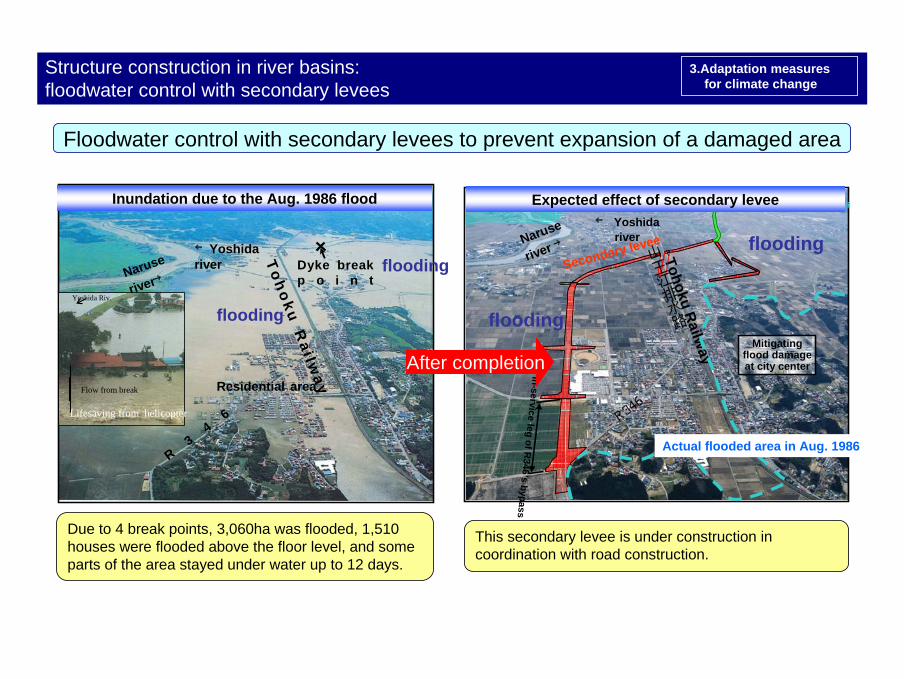
Floodwater control with secondary levees to prevent expansion of a damaged area
R346
Naruse
river →
Mitigating flood damage at city center
Tohoku Railway
山王江排水路
Actual flooded area in Aug. 1986
Secondary levee
flooding
flooding← Yoshida
river
In-service leg of R346’s bypass
←Yoshida riverNaruse
river→
Toh
oku R
ai lwayResidential area
R3
46
Dyke break p o i n t
flooding
flooding
Lifesaving from helicopter
Yoshida Riv.
Flow from break
Inundation due to the Aug. 1986 flood Expected effect of secondary levee
After completion
Due to 4 break points, 3,060ha was flooded, 1,510 houses were flooded above the floor level, and some parts of the area stayed under water up to 12 days.
This secondary levee is under construction in coordination with road construction.
Structure construction in river basins:floodwater control with secondary levees
3.Adaptation measures for climate change
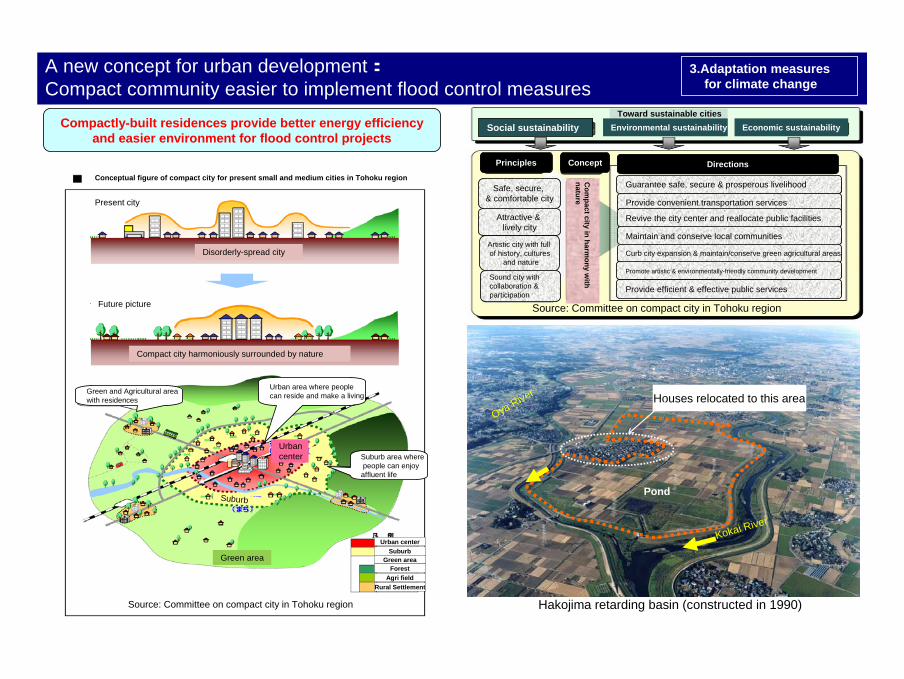
A new concept for urban development:Compact community easier to implement flood control measures
Source: Committee on compact city in Tohoku region
Source: Committee on compact city in Tohoku region
Compactly-built residences provide better energy efficiency and easier environment for flood control projects
Hakojima retarding basin (constructed in 1990)
イメージイメージ
Conceptual figure of compact city for present small and medium cities in Tohoku region
Present city
Disorderly-spread city
Compact city harmoniously surrounded by nature
Green and Agricultural area with residences
Urban area where people can reside and make a living
Suburb area wherepeople can enjoy
affluent life
Future picture
Suburb
Urbancenter
Green area
Toward sustainable citiesSocial sustainability Environmental sustainability Economic sustainability
Principles
Safe, secure, & comfortable city
Attractive & lively city
Artistic city with full of history, cultures
and nature
Sound city with collaboration & participation
Concept Directions
Guarantee safe, secure & prosperous livelihood
Provide convenient transportation services
Revive the city center and reallocate public facilities
Maintain and conserve local communities
Curb city expansion & maintain/conserve green agricultural areas
Promote artistic & environmentally-friendly community development
Provide efficient & effective public services
Urban centerSuburb
Green areaForest
Agri fieldRural Settlement
Com
pact city in harmony w
ith nature
3.Adaptation measures for climate change
Kokai River
Oya River Houses relocated to this area
Pond
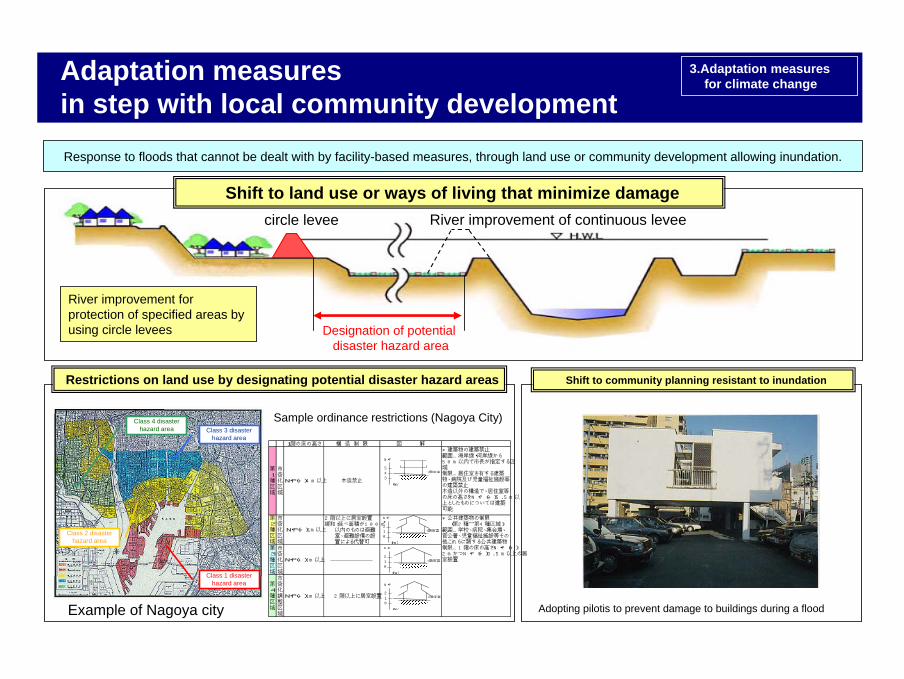
Response to floods that cannot be dealt with by facility-based measures, through land use or community development allowing inundation.
Shift to land use or ways of living that minimize damage
River improvement for protection of specified areas by using circle levees
Example of Nagoya city
Class 2 disaster hazard area
Class 1 disaster hazard area
Class 3 disaster hazard area
Class 4 disaster hazard area
Sample ordinance restrictions (Nagoya City)
1階の床の高さ 構 造 制 限*建築物の建築禁止範囲…海岸線・河岸線から50m以内で市長が指定する区域制限…居住室を有する建築物、病院及び児童福祉施設等の建築禁止木造以外の構造で、居住室等の床の高さをN・P(+)5.5m以上としたものについては建築可能
2階以上に居室設置 *公共建築物の制限緩和:延べ面積が100㎡ (第2種~第4種区域)以内のものは避難室、避難設備の設置による代替可
範囲…学校、病院、集会場、官公署、児童福祉施設等その他これらに類する公共建築物
第3種区域
市街化区域
N・P(+)1m以上
第4種区域
市街化調整区域
N・P(+)1m以上 2階以上に居室設置
図 解
N・P(+)1m以上
市街化区域
第2種区域
木造禁止N・P(+)4m以上
市街化区域
第1種区域
制限…1階の床の高さN・P(+)2mかつN・P(+)3.5m以上の居室設置
1階床高
N・P
543
(m)
1階床高
N・P
210
(m)
1階床高
N・P
210
(m)
1階床高
N・P
210
(m)
Restrictions on land use by designating potential disaster hazard areas
Adopting pilotis to prevent damage to buildings during a flood
Shift to community planning resistant to inundation
Designation of potential disaster hazard area
River improvement of continuous leveecircle levee
3.Adaptation measures for climate change
Adaptation measuresin step with local community development
3.Adaptation measures for climate change
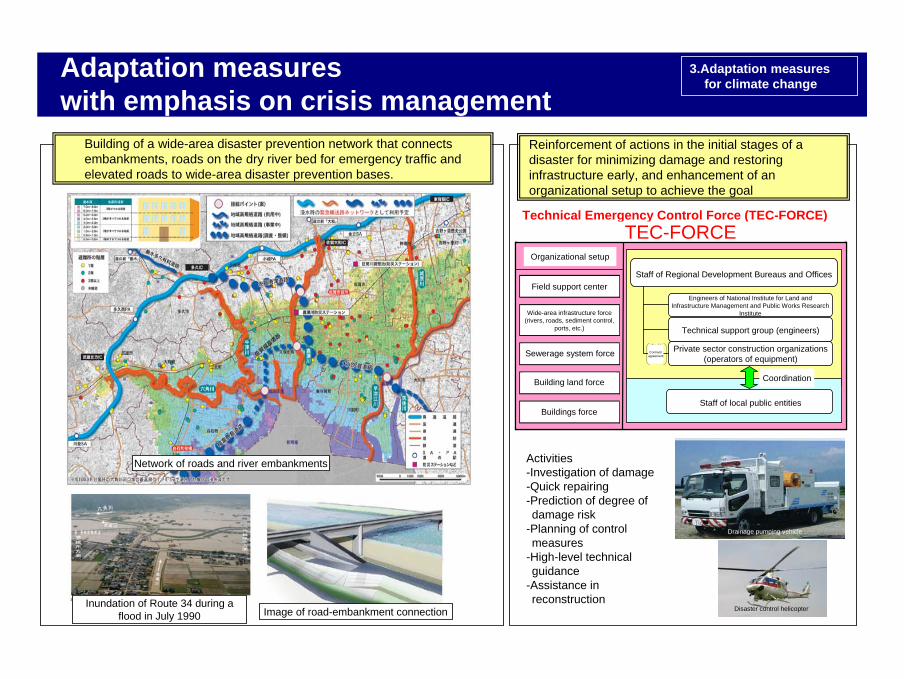
Image of road-embankment connectionInundation of Route 34 during a
flood in July 1990
Network of roads and river embankments
Building of a wide-area disaster prevention network that connects embankments, roads on the dry river bed for emergency traffic and elevated roads to wide-area disaster prevention bases.
《緊急災害対策派遣隊》
構 成 員
現地支援センター
広域基盤施設部隊〈河川・道路・砂防・港湾等〉
下水道部隊
宅地部隊
建築物部隊
体 制各地方整備局・事務所職員
民間建設関連(資機材の操作員)
国総研・土研等の技術専門家
技術支援グループ(技術専門家)契約
協定
地方公共団体職員
連携
《緊急災害対策派遣隊》
構 成 員
現地支援センター
広域基盤施設部隊〈河川・道路・砂防・港湾等〉
下水道部隊
宅地部隊
建築物部隊
体 制各地方整備局・事務所職員
民間建設関連(資機材の操作員)
国総研・土研等の技術専門家
技術支援グループ(技術専門家)契約
協定
地方公共団体職員
連携
Activities-Investigation of damage-Quick repairing-Prediction of degree of damage risk
-Planning of control measures
-High-level technical guidance
-Assistance in reconstruction
Disaster control helicopter
Technical Emergency Control Force (TEC-FORCE)
Reinforcement of actions in the initial stages of a disaster for minimizing damage and restoring infrastructure early, and enhancement of an organizational setup to achieve the goal
Drainage pumping vehicle
6. Japan's response to climate change
Organizational setup
Field support center
Wide-area infrastructure force (rivers, roads, sediment control,
ports, etc.)
Sewerage system force
Building land force
Buildings force
TEC-FORCE
Staff of Regional Development Bureaus and Offices
Engineers of National Institute for Land and Infrastructure Management and Public Works Research
Institute
Technical support group (engineers)
Private sector construction organizations (operators of equipment)
Staff of local public entities
Coordination
Contract/agreement
Adaptation measureswith emphasis on crisis management
3.Adaptation measures for climate change
洪水ハザードマップの作成イメージ洪水ハザードマップの作成イメージ
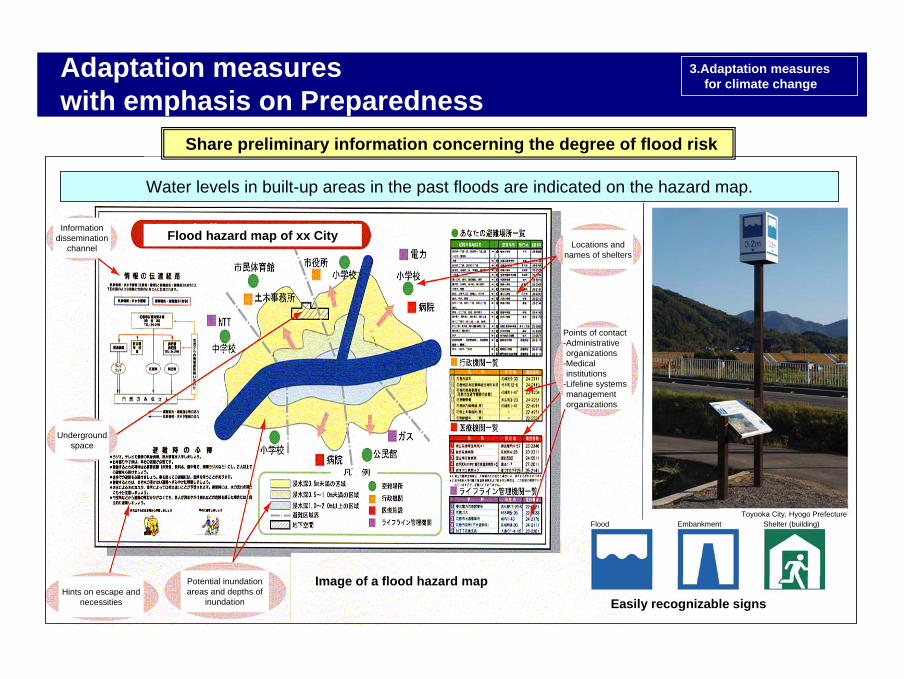
Image of a flood hazard map
Easily recognizable signs
6. Japan's response to climate change
Underground space
Information dissemination
channel Locations and names of shelters
Points of contact-Administrative organizations
-Medical institutions
-Lifeline systems management organizations
Hints on escape and necessities
Potential inundation areas and depths of
inundation
Flood hazard map of xx City
Flood Embankment Shelter (building)Toyooka City, Hyogo Prefecture
Water levels in built-up areas in the past floods are indicated on the hazard map.
Share preliminary information concerning the degree of flood risk
Adaptation measureswith emphasis on Preparedness
3.Adaptation measures for climate change
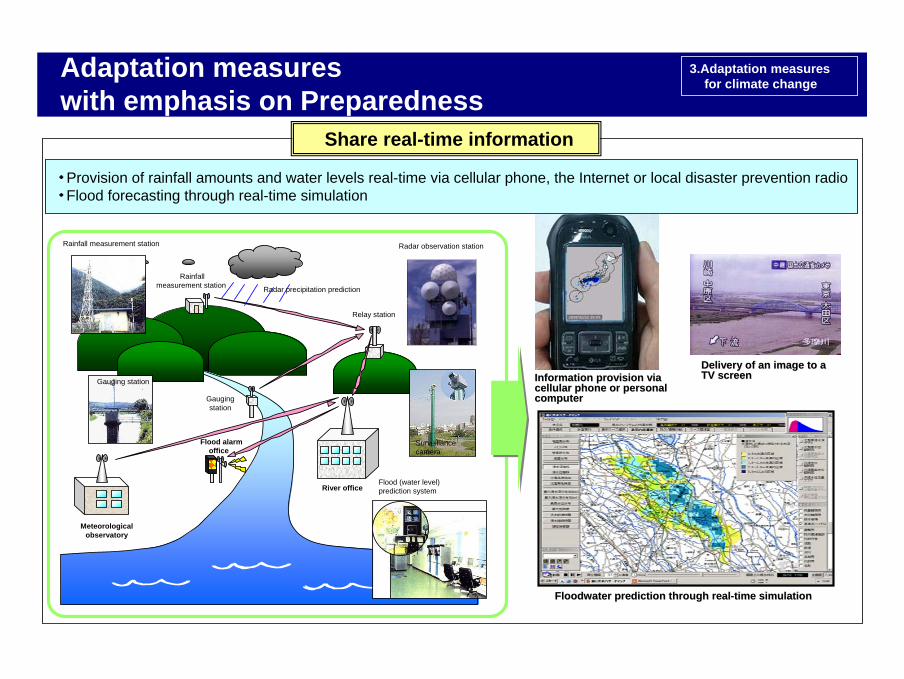
Relay station
Flood alarm office
Meteorological observatory
River office
Radar precipitation prediction
Rainfall measurement station
Rainfall measurement station
Gauging station
Flood (water level) prediction system
Share real-time information
Information provision via Information provision via cellular phone or personal cellular phone or personal computercomputer
Delivery of an image to a Delivery of an image to a TV screenTV screen
Radar observation station
Gauging station
Surveillance camera
Floodwater prediction through realFloodwater prediction through real--time simulationtime simulation
6. Japan's response to climate change
・ Provision of rainfall amounts and water levels real-time via cellular phone, the Internet or local disaster prevention radio・ Flood forecasting through real-time simulation
Adaptation measureswith emphasis on Preparedness
3.Adaptation measures for climate change
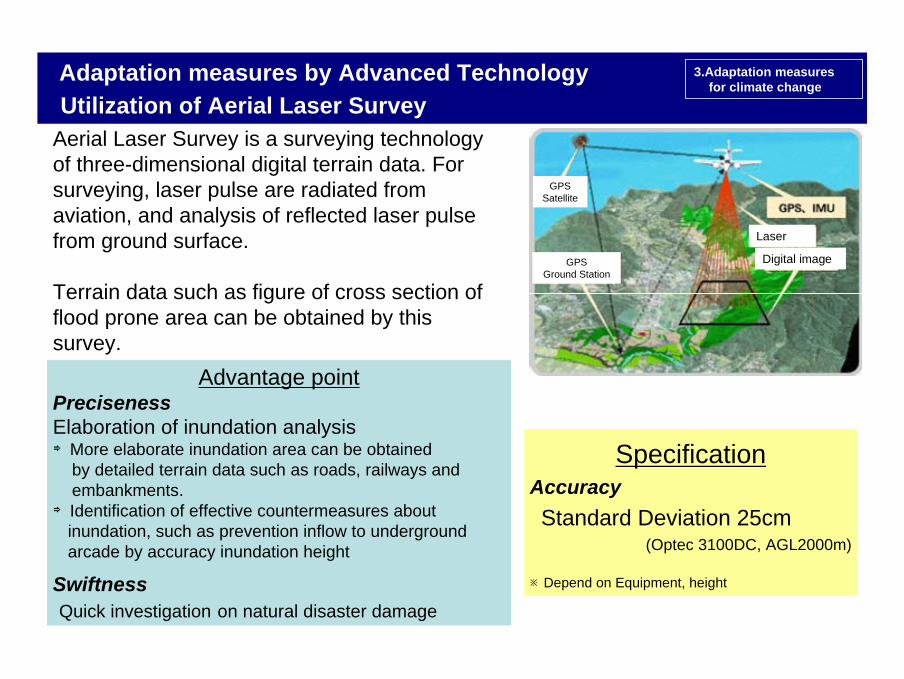
Adaptation measures by Advanced TechnologyUtilization of Aerial Laser Survey
Aerial Laser Survey is a surveying technology of three-dimensional digital terrain data. For surveying, laser pulse are radiated from aviation, and analysis of reflected laser pulse from ground surface.
Terrain data such as figure of cross section of flood prone area can be obtained by this survey.
Advantage pointPreciseness Elaboration of inundation analysis⇒More elaborate inundation area can be obtained
by detailed terrain data such as roads, railways and embankments.
⇒Identification of effective countermeasures about inundation, such as prevention inflow to underground arcade by accuracy inundation height
SwiftnessQuick investigation on natural disaster damage
SpecificationAccuracy Standard Deviation 25cm
(Optec 3100DC, AGL2000m)
※Depend on Equipment, height
GPSSatellite
GPSGround Station
Digital image
Laser
3.Adaptation measures for climate change
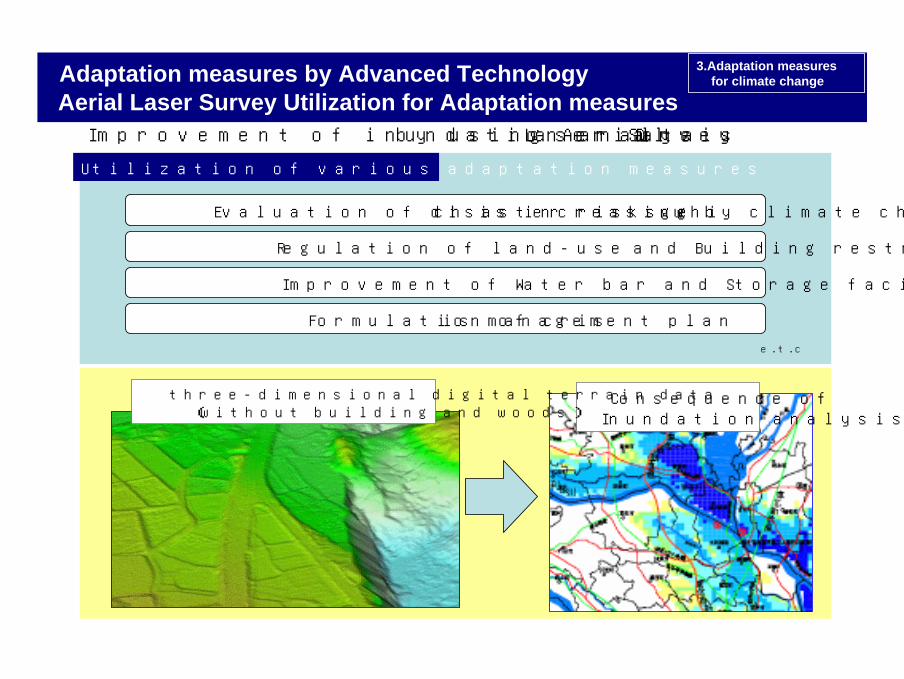
Improvement of inundation analysis by using Aerial Laser Survey Data
Evaluation of disaster risks which is increasing by climate change
Regulation of land-use and Building restrictions
Improvement of Water bar and Storage facility
Formulation of crisis management plan
e.t.c
Utilization of various adaptation measures
Consequence of Inundation analysis
three-dimensional digital terrain data(without building and woods)
Adaptation measures by Advanced TechnologyAerial Laser Survey Utilization for Adaptation measures
3.Adaptation measures for climate change

(C.f.) Earthquake damage investigation by using Aerial Laser Survey
Landslide dams Lake were built in several places by the Iwate-Miyagi NairikuEarthquake in 2008. Aerial Laser Survey Data was used for consideration on finding appropriate countermeasures. Aerial Laser Survey can be useful in the case of difficult situation to approach the damage area.◎ Understanding of landslide dams lake
by three-dimensional digital terrain data◎ Measuring deformation volume compared
with before-and-after on earthquake
Level (m)
Change of height (m)
2006 measured2008 measured
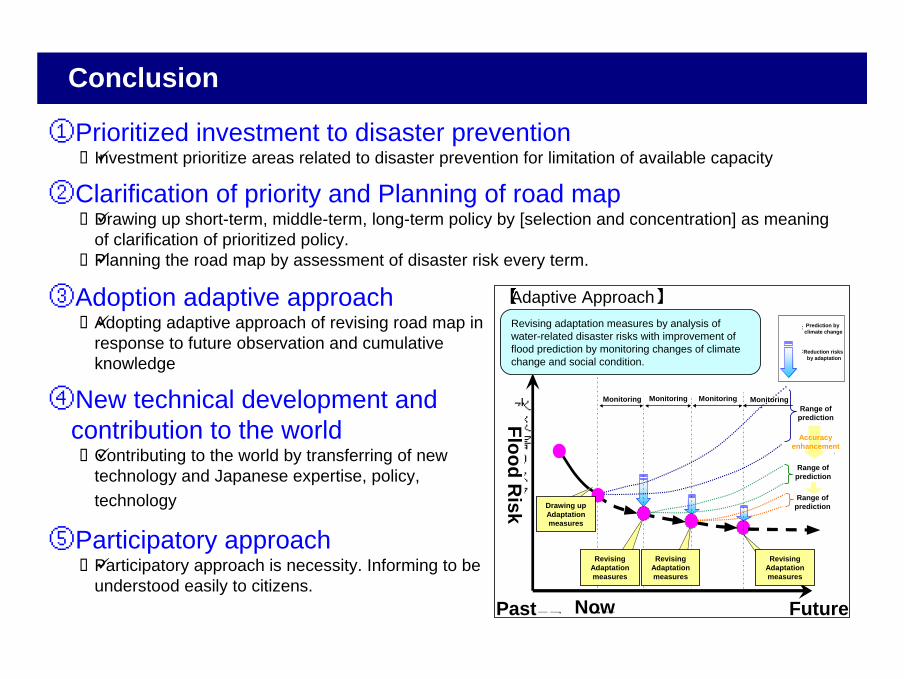
Conclusion
①Prioritized investment to disaster preventionInvestment prioritize areas related to disaster prevention for limitation of available capacity
②Clarification of priority and Planning of road mapDrawing up short-term, middle-term, long-term policy by [selection and concentration] as meaning of clarification of prioritized policy.Planning the road map by assessment of disaster risk every term.
③Adoption adaptive approachAdopting adaptive approach of revising road map in response to future observation and cumulative knowledge
④New technical development and contribution to the world
Contributing to the world by transferring of new technology and Japanese expertise, policy, technology
⑤Participatory approachParticipatory approach is necessity. Informing to be understood easily to citizens.
水災害リスク
現在過去 未来
モニタリング モニタリング モニタリング
適応策策定
適応策見直し 適応策見直し適応策見直し
予測の範囲
精度の向上
精度の向上
モニタリング
予測の範囲
予測の範囲
:適応策によって低減されるリスク
:気象変動の予測値
Revising adaptation measures by analysis of water-related disaster risks with improvement of flood prediction by monitoring changes of climate change and social condition.
【Adaptive Approach】
Flood Risk
Past Now Future
Prediction by climate change
Reduction risks by adaptation
Range ofprediction
Range ofprediction
Range ofprediction
Accuracyenhancement
Monitoring Monitoring Monitoring Monitoring
Drawing upAdaptation measures
RevisingAdaptation measures
RevisingAdaptation measures
RevisingAdaptation measures