Embed Size (px)
Citation preview
301 W. Michigan Ave. | Suite 200 | Ypsilanti, Michigan 48197 | Phone: 734.961.6900 | www.cypq.org
The David P. Weikart Center for Youth Program Quality is a division of The Forum for Youth Investment.
Oklahoma 21st Century Community
Learning Centers Statewide Evaluation 2015-2016 Annual Report Report to the Oklahoma State Department of Education
February, 2017
2015-2016 Oklahoma 21st CCLC Statewide Evaluation Report Page 2
Oklahoma 21st Century Community Learning Centers Statewide Evaluation Report: 2015-2016 Annual Report
February, 2017
Prepared by
Anna Gersh, Charles Smith, Angelina Garner, & Colin Macleod
The David P. Weikart Center for Youth Program Quality
A Division of the Forum for Youth Investment
2015-2016 Oklahoma 21st CCLC Statewide Evaluation Report Page 3
Table of Contents
Table of Contents ............................................................................................................................................... 3
Introduction ....................................................................................................................................................... 4
Purpose and Components of the Evaluation ......................................................................................................... 5
Oklahoma 21st CCLC Project Goals and Objectives.......................................................................................... 7
Summary of Findings.......................................................................................................................................... 8
Evaluation Methodology................................................................................................................................... 12
Findings/Results .............................................................................................................................................. 21
Leading Indicator 1.1 – Staffing Model .......................................................................................................... 23
Leading Indicator 1.2 – Continuous Improvement .......................................................................................... 24
Leading Indicator 1.2 – Continuous Improvement continued .......................................................................... 25
Leading Indicator 1.2 – Continuous Improvement (continued) ....................................................................... 27
Leading Indicator 1.3 – Youth Governance .................................................................................................... 28
Leading Indicator 1.4 – Enrollment Policy ..................................................................................................... 29
Leading Indicator 2.1 – Academic Press......................................................................................................... 31
Leading Indicator 2.2 – Engaging Instruction ................................................................................................. 32
Leading Indicator 2.2 – Engaging Instruction (continued) ............................................................................... 33
Leading Indicator 3.1 – System Norms .......................................................................................................... 35
Leading Indicator 3.2 – Family Engagement .................................................................................................. 36
Leading Indicator 3.3 – School Alignment ..................................................................................................... 37
Leading Indicator 3.4 – Community Resources .............................................................................................. 39
Leading Indicator 4.1 – Socioemotional Development .................................................................................... 41
Leading Indicator 4.2 – Academic Efficacy .................................................................................................... 42
Leading Indicator 4.2 – Academic Efficacy (continued) .................................................................................. 44
Leading Indicator 5.1 – Family Satisfaction ................................................................................................... 47
Leading Indicator 5.1 – Family Satisfaction (continued) ................................................................................. 48
Recommendations for the 2016-2017 programming year .................................................................................... 49
References ........................................................................................................................................................ 52
Appendix A: Technical Detail on Reliability of Measures ................................................................................... 54
Appendix B: Profiles of High- and Low-Performing Sites ................................................................................... 56
Appendix C. 2014-2015 Oklahoma State Department of Education 21st CCLC Coach Support Services Menu .... 58
2015-2016 Oklahoma 21st CCLC Statewide Evaluation Report Page 4
Introduction
In 2002, the No Child Left Behind Act (NCLB) was reauthorized and the responsibility for distributing federal funding
regarding 21st Century Community Learning Centers (CCLC) was shifted to each state. These dollars are intended to
fund afterschool programs that are located in high poverty areas or in low-achieving schools. Grants are awarded to
applicants whose main goals are to increase academic achievement, provide additional enrichment activities, and
provide literacy and educational services for the parents of youth who attend the afterschool programs (United
States Department of Education, 2016).
Both the State Education Agency (SEA) and grantees must comply with specific evaluation and accountability
policies and reporting structures. SEAs must provide comprehensive annual evaluations of their 21st CCLC
programs, reporting on the performance measures listed in their applications to the United States Department of
Education. These reports must be made available for public consumption.
In order to aide in the evaluation process, grantees are required to submit data annually using a Federal Annual
Performance Reporting Data Collection System. This system, new to grantees as of November 2015, is an online
portal that houses information from all 21st CCLC grantees across the United States.
Since 2002, the Oklahoma State Department of Education (OSDE) has utilized federal dollars to fund afterschool
programming in a wide variety of school districts and community organizations. To date, OSDE has awarded
approximately 184 grantees serving over 12,000 youth per year (Afterschool Alliance, 2013; Oklahoma State
Department of Education, 2014).
During the 2015-2016 program year, nine new grantees received awards bringing the total number of grantees
receiving funding to 59. These 59 grantees, representing 98 different sites/centers shared in the approximately
$11.9 million that was delegated to OSDE by the federal government.
In fulfillment of the federal requirement for an annual evaluation, and because OSDE does not require that grantees
hire local evaluators, OSDE sought an evaluation design that prioritized usefulness to grantee-level stakeholders.
Therefore, in the fall of 2010, the OSDE enlisted the David P. Weikart Center for Youth Program Quality at the Forum
for Youth Investment (hereafter “evaluation contractor”) to provide a statewide evaluation of the Oklahoma 21st
CCLC program.
2015-2016 Oklahoma 21st CCLC Statewide Evaluation Report Page 5
Purpose and Components of the Evaluation
The evaluation design includes two overarching components – Program Evaluation and Program Quality
Improvement. Program Evaluation includes (a) support in the collection and submission of federally required data
through the Annual Performance Reporting (APR) system, (b) collection of statewide Leading Indicator data1 at
multiple levels from multiple sources, and (c) preparation of grantee-level Leading Indicator reports allowing for
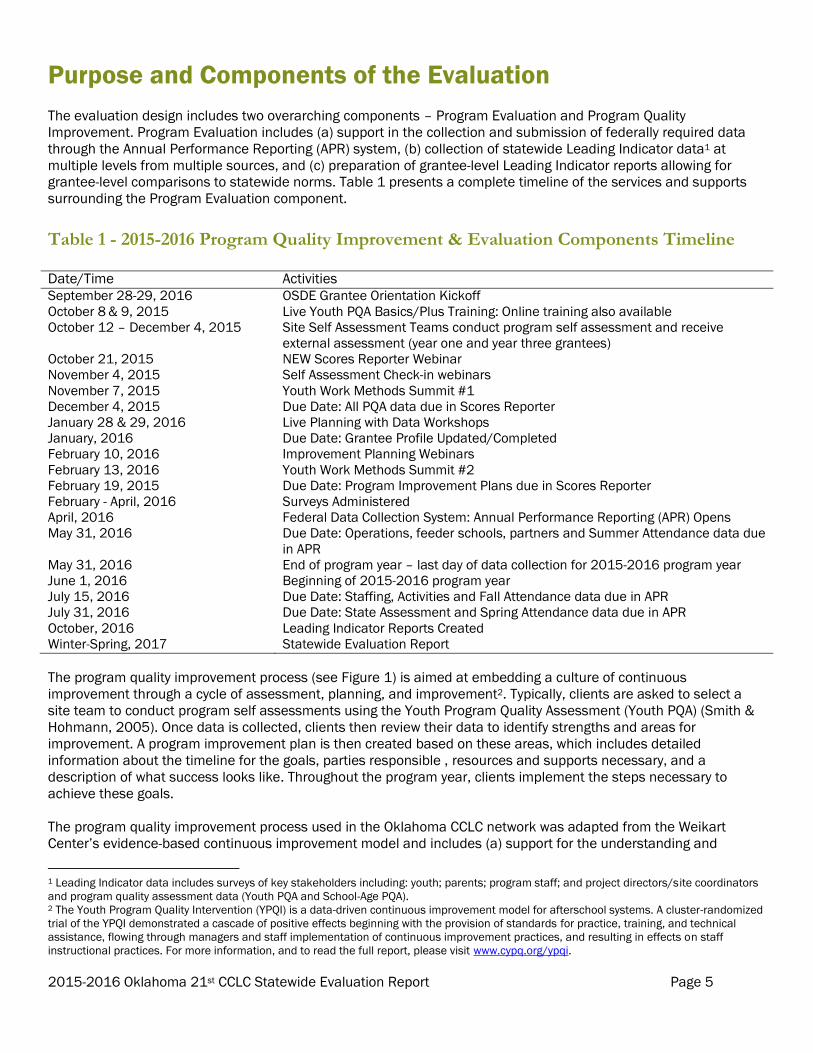
grantee-level comparisons to statewide norms. Table 1 presents a complete timeline of the services and supports
surrounding the Program Evaluation component.
Table 1 - 2015-2016 Program Quality Improvement & Evaluation Components Timeline Date/Time Activities
September 28-29, 2016 OSDE Grantee Orientation Kickoff
October 8 & 9, 2015 Live Youth PQA Basics/Plus Training: Online training also available
October 12 – December 4, 2015
October 21, 2015
November 4, 2015
Site Self Assessment Teams conduct program self assessment and receive
external assessment (year one and year three grantees)
NEW Scores Reporter Webinar
Self Assessment Check-in webinars
November 7, 2015
December 4, 2015
Youth Work Methods Summit #1
Due Date: All PQA data due in Scores Reporter
January 28 & 29, 2016 Live Planning with Data Workshops
January, 2016 Due Date: Grantee Profile Updated/Completed
February 10, 2016
February 13, 2016
Improvement Planning Webinars
Youth Work Methods Summit #2
February 19, 2015 Due Date: Program Improvement Plans due in Scores Reporter
February - April, 2016 Surveys Administered
April, 2016 Federal Data Collection System: Annual Performance Reporting (APR) Opens
May 31, 2016 Due Date: Operations, feeder schools, partners and Summer Attendance data due
in APR
May 31, 2016 End of program year – last day of data collection for 2015-2016 program year
June 1, 2016 Beginning of 2015-2016 program year
July 15, 2016 Due Date: Staffing, Activities and Fall Attendance data due in APR
July 31, 2016 Due Date: State Assessment and Spring Attendance data due in APR
October, 2016 Leading Indicator Reports Created
Winter-Spring, 2017 Statewide Evaluation Report
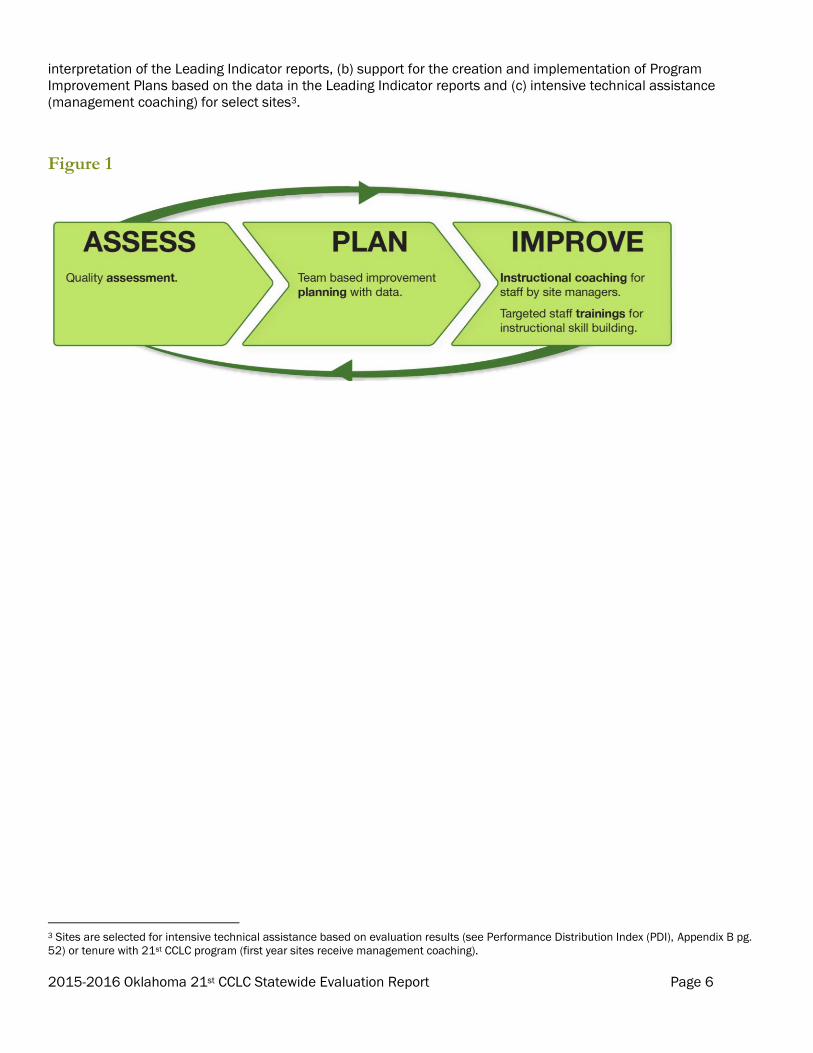
The program quality improvement process (see Figure 1) is aimed at embedding a culture of continuous
improvement through a cycle of assessment, planning, and improvement2. Typically, clients are asked to select a
site team to conduct program self assessments using the Youth Program Quality Assessment (Youth PQA) (Smith &
Hohmann, 2005). Once data is collected, clients then review their data to identify strengths and areas for
improvement. A program improvement plan is then created based on these areas, which includes detailed
information about the timeline for the goals, parties responsible , resources and supports necessary, and a
description of what success looks like. Throughout the program year, clients implement the steps necessary to
achieve these goals.
The program quality improvement process used in the Oklahoma CCLC network was adapted from the Weikart
Center’s evidence-based continuous improvement model and includes (a) support for the understanding and
1 Leading Indicator data includes surveys of key stakeholders including: youth; parents; program staff; and project directors/site coordinators
and program quality assessment data (Youth PQA and School-Age PQA). 2 The Youth Program Quality Intervention (YPQI) is a data-driven continuous improvement model for afterschool systems. A cluster-randomized
trial of the YPQI demonstrated a cascade of positive effects beginning with the provision of standards for practice, training, and technical
assistance, flowing through managers and staff implementation of continuous improvement practices, and resulting in effects on staff
instructional practices. For more information, and to read the full report, please visit www.cypq.org/ypqi.
2015-2016 Oklahoma 21st CCLC Statewide Evaluation Report Page 6
interpretation of the Leading Indicator reports, (b) support for the creation and implementation of Program
Improvement Plans based on the data in the Leading Indicator reports and (c) intensive technical assistance
(management coaching) for select sites3.
Figure 1
3 Sites are selected for intensive technical assistance based on evaluation results (see Performance Distribution Index (PDI), Appendix B pg.
52) or tenure with 21st CCLC program (first year sites receive management coaching).
2015-2016 Oklahoma 21st CCLC Statewide Evaluation Report Page 7
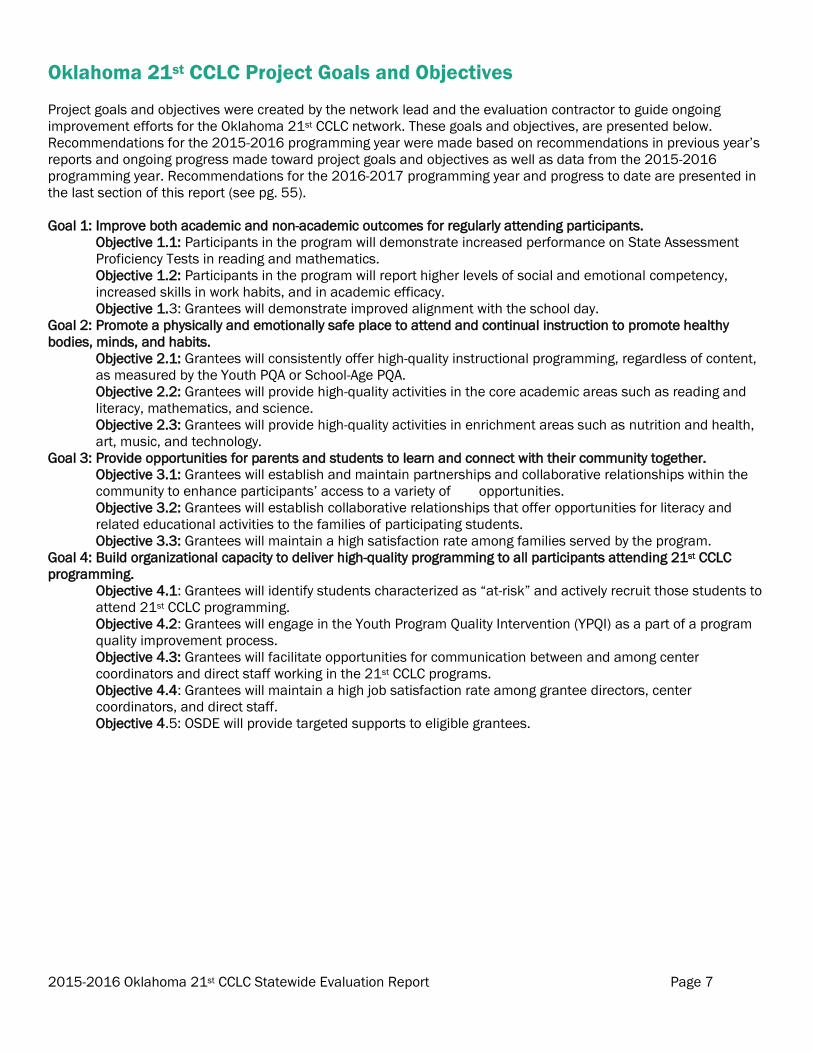
Oklahoma 21st CCLC Project Goals and Objectives
Project goals and objectives were created by the network lead and the evaluation contractor to guide ongoing
improvement efforts for the Oklahoma 21st CCLC network. These goals and objectives, are presented below.
Recommendations for the 2015-2016 programming year were made based on recommendations in previous year’s
reports and ongoing progress made toward project goals and objectives as well as data from the 2015-2016
programming year. Recommendations for the 2016-2017 programming year and progress to date are presented in
the last section of this report (see pg. 55).
Goal 1: Improve both academic and non-academic outcomes for regularly attending participants.
Objective 1.1: Participants in the program will demonstrate increased performance on State Assessment
Proficiency Tests in reading and mathematics.
Objective 1.2: Participants in the program will report higher levels of social and emotional competency,
increased skills in work habits, and in academic efficacy.
Objective 1.3: Grantees will demonstrate improved alignment with the school day.
Goal 2: Promote a physically and emotionally safe place to attend and continual instruction to promote healthy
bodies, minds, and habits.
Objective 2.1: Grantees will consistently offer high-quality instructional programming, regardless of content,
as measured by the Youth PQA or School-Age PQA.
Objective 2.2: Grantees will provide high-quality activities in the core academic areas such as reading and
literacy, mathematics, and science.
Objective 2.3: Grantees will provide high-quality activities in enrichment areas such as nutrition and health,
art, music, and technology.
Goal 3: Provide opportunities for parents and students to learn and connect with their community together.
Objective 3.1: Grantees will establish and maintain partnerships and collaborative relationships within the
community to enhance participants’ access to a variety of opportunities.
Objective 3.2: Grantees will establish collaborative relationships that offer opportunities for literacy and
related educational activities to the families of participating students.
Objective 3.3: Grantees will maintain a high satisfaction rate among families served by the program.
Goal 4: Build organizational capacity to deliver high-quality programming to all participants attending 21st CCLC
programming.
Objective 4.1: Grantees will identify students characterized as “at-risk” and actively recruit those students to
attend 21st CCLC programming.
Objective 4.2: Grantees will engage in the Youth Program Quality Intervention (YPQI) as a part of a program
quality improvement process.
Objective 4.3: Grantees will facilitate opportunities for communication between and among center
coordinators and direct staff working in the 21st CCLC programs.
Objective 4.4: Grantees will maintain a high job satisfaction rate among grantee directors, center
coordinators, and direct staff.
Objective 4.5: OSDE will provide targeted supports to eligible grantees.
2015-2016 Oklahoma 21st CCLC Statewide Evaluation Report Page 8
Summary of Findings During the 2015-2016 program year, the Oklahoma 21st CCLC (for 98 sites representing 59 grantees) successfully
completed requirements for both components of the statewide evaluation: Program Evaluation and Program Quality
Improvement, for 98 sites representing 59 grantees. The Program Quality Improvement process is composed of four
core elements: program assessment (self or external); data-driven improvement planning; professional development
aligned with program improvement goals; and continuous feedback loops about instructional practice between
managers and staff. This year, 97% of grantees (n=95) submitted program assessments using the Youth or School-
Age PQA, and 97% of grantees (n=95) submitted program improvement plans based upon data from PQA and/or
Leading Indicator reports.
Goal 1: Improve both academic and non-academic outcomes for regularly
attending participants.
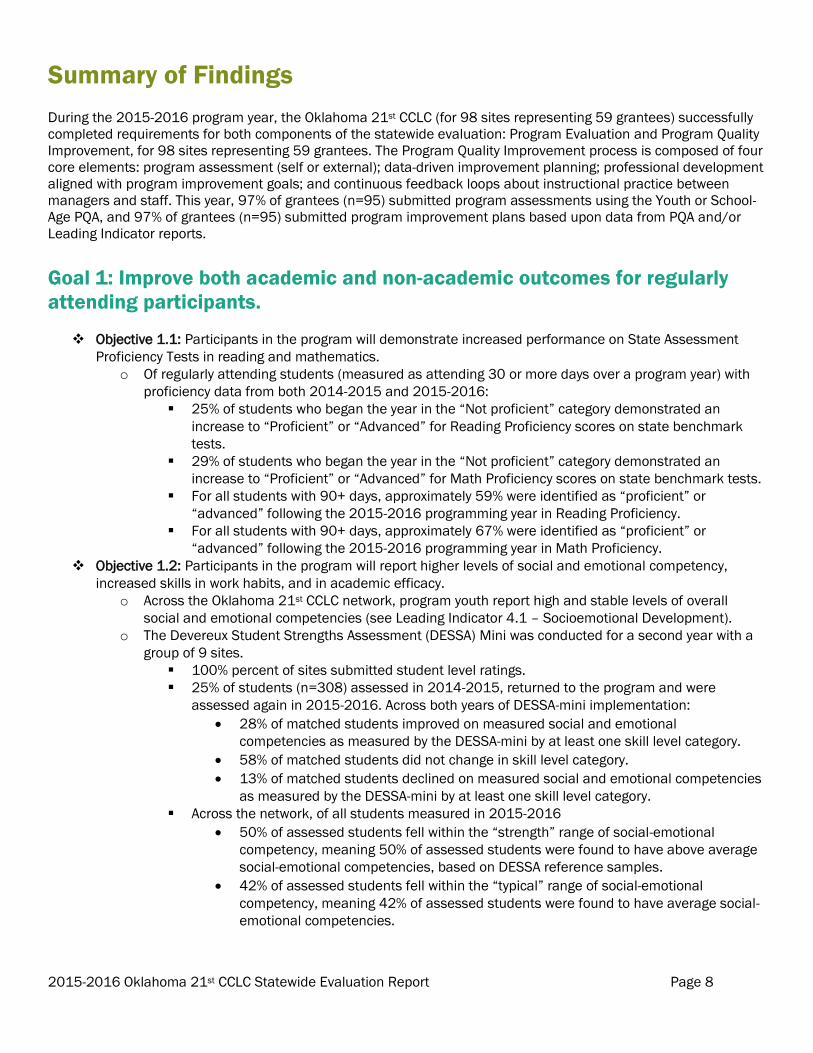
Objective 1.1: Participants in the program will demonstrate increased performance on State Assessment
Proficiency Tests in reading and mathematics.
o Of regularly attending students (measured as attending 30 or more days over a program year) with
proficiency data from both 2014-2015 and 2015-2016:
25% of students who began the year in the “Not proficient” category demonstrated an
increase to “Proficient” or “Advanced” for Reading Proficiency scores on state benchmark
tests.
29% of students who began the year in the “Not proficient” category demonstrated an
increase to “Proficient” or “Advanced” for Math Proficiency scores on state benchmark tests.
For all students with 90+ days, approximately 59% were identified as “proficient” or
“advanced” following the 2015-2016 programming year in Reading Proficiency.
For all students with 90+ days, approximately 67% were identified as “proficient” or
“advanced” following the 2015-2016 programming year in Math Proficiency.
Objective 1.2: Participants in the program will report higher levels of social and emotional competency,
increased skills in work habits, and in academic efficacy.
o Across the Oklahoma 21st CCLC network, program youth report high and stable levels of overall
social and emotional competencies (see Leading Indicator 4.1 – Socioemotional Development).
o The Devereux Student Strengths Assessment (DESSA) Mini was conducted for a second year with a
group of 9 sites.
100% percent of sites submitted student level ratings.
25% of students (n=308) assessed in 2014-2015, returned to the program and were
assessed again in 2015-2016. Across both years of DESSA-mini implementation:
28% of matched students improved on measured social and emotional
competencies as measured by the DESSA-mini by at least one skill level category.
58% of matched students did not change in skill level category.
13% of matched students declined on measured social and emotional competencies
as measured by the DESSA-mini by at least one skill level category.
Across the network, of all students measured in 2015-2016
50% of assessed students fell within the “strength” range of social-emotional
competency, meaning 50% of assessed students were found to have above average
social-emotional competencies, based on DESSA reference samples.
42% of assessed students fell within the “typical” range of social-emotional
competency, meaning 42% of assessed students were found to have average social-
emotional competencies.
2015-2016 Oklahoma 21st CCLC Statewide Evaluation Report Page 9
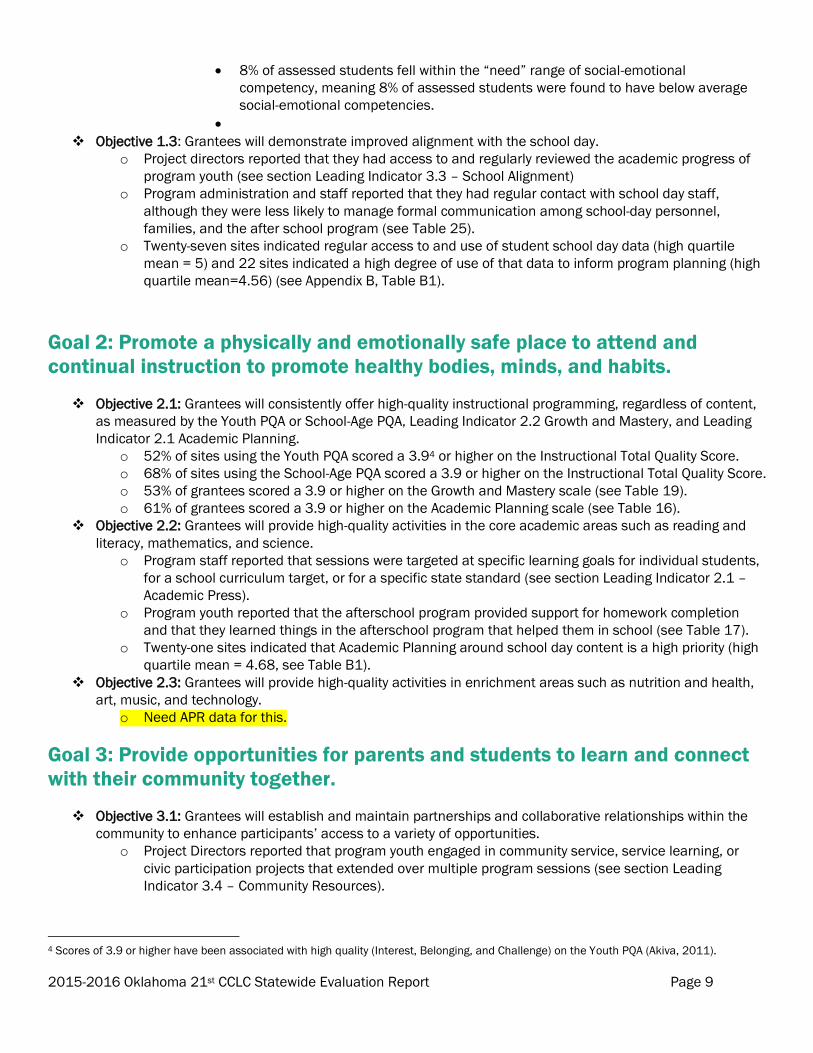
8% of assessed students fell within the “need” range of social-emotional
competency, meaning 8% of assessed students were found to have below average
social-emotional competencies.
Objective 1.3: Grantees will demonstrate improved alignment with the school day.
o Project directors reported that they had access to and regularly reviewed the academic progress of
program youth (see section Leading Indicator 3.3 – School Alignment)
o Program administration and staff reported that they had regular contact with school day staff,
although they were less likely to manage formal communication among school-day personnel,
families, and the after school program (see Table 25).
o Twenty-seven sites indicated regular access to and use of student school day data (high quartile
mean = 5) and 22 sites indicated a high degree of use of that data to inform program planning (high
quartile mean=4.56) (see Appendix B, Table B1).
Goal 2: Promote a physically and emotionally safe place to attend and
continual instruction to promote healthy bodies, minds, and habits.
Objective 2.1: Grantees will consistently offer high-quality instructional programming, regardless of content,
as measured by the Youth PQA or School-Age PQA, Leading Indicator 2.2 Growth and Mastery, and Leading
Indicator 2.1 Academic Planning.
o 52% of sites using the Youth PQA scored a 3.94 or higher on the Instructional Total Quality Score.
o 68% of sites using the School-Age PQA scored a 3.9 or higher on the Instructional Total Quality Score.
o 53% of grantees scored a 3.9 or higher on the Growth and Mastery scale (see Table 19).
o 61% of grantees scored a 3.9 or higher on the Academic Planning scale (see Table 16).
Objective 2.2: Grantees will provide high-quality activities in the core academic areas such as reading and
literacy, mathematics, and science.
o Program staff reported that sessions were targeted at specific learning goals for individual students,
for a school curriculum target, or for a specific state standard (see section Leading Indicator 2.1 –
Academic Press).
o Program youth reported that the afterschool program provided support for homework completion
and that they learned things in the afterschool program that helped them in school (see Table 17).
o Twenty-one sites indicated that Academic Planning around school day content is a high priority (high
quartile mean = 4.68, see Table B1).
Objective 2.3: Grantees will provide high-quality activities in enrichment areas such as nutrition and health,
art, music, and technology.
o Need APR data for this.
Goal 3: Provide opportunities for parents and students to learn and connect
with their community together.
Objective 3.1: Grantees will establish and maintain partnerships and collaborative relationships within the
community to enhance participants’ access to a variety of opportunities.
o Project Directors reported that program youth engaged in community service, service learning, or
civic participation projects that extended over multiple program sessions (see section Leading
Indicator 3.4 – Community Resources).
4 Scores of 3.9 or higher have been associated with high quality (Interest, Belonging, and Challenge) on the Youth PQA (Akiva, 2011).
2015-2016 Oklahoma 21st CCLC Statewide Evaluation Report Page 10
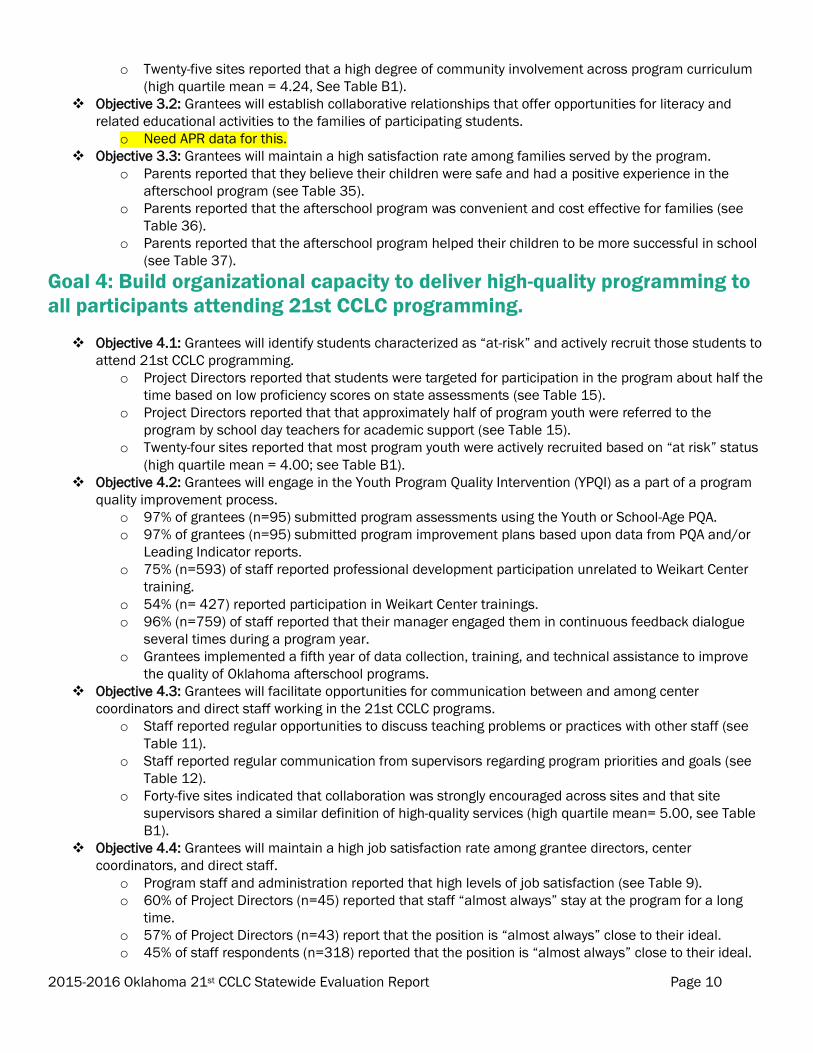
o Twenty-five sites reported that a high degree of community involvement across program curriculum
(high quartile mean = 4.24, See Table B1).
Objective 3.2: Grantees will establish collaborative relationships that offer opportunities for literacy and
related educational activities to the families of participating students.
o Need APR data for this.
Objective 3.3: Grantees will maintain a high satisfaction rate among families served by the program.
o Parents reported that they believe their children were safe and had a positive experience in the
afterschool program (see Table 35).
o Parents reported that the afterschool program was convenient and cost effective for families (see
Table 36).
o Parents reported that the afterschool program helped their children to be more successful in school
(see Table 37).
Goal 4: Build organizational capacity to deliver high-quality programming to
all participants attending 21st CCLC programming.
Objective 4.1: Grantees will identify students characterized as “at-risk” and actively recruit those students to
attend 21st CCLC programming.
o Project Directors reported that students were targeted for participation in the program about half the
time based on low proficiency scores on state assessments (see Table 15).
o Project Directors reported that that approximately half of program youth were referred to the
program by school day teachers for academic support (see Table 15).
o Twenty-four sites reported that most program youth were actively recruited based on “at risk” status
(high quartile mean = 4.00; see Table B1).
Objective 4.2: Grantees will engage in the Youth Program Quality Intervention (YPQI) as a part of a program
quality improvement process.
o 97% of grantees (n=95) submitted program assessments using the Youth or School-Age PQA.
o 97% of grantees (n=95) submitted program improvement plans based upon data from PQA and/or
Leading Indicator reports.
o 75% (n=593) of staff reported professional development participation unrelated to Weikart Center
training.
o 54% (n= 427) reported participation in Weikart Center trainings.
o 96% (n=759) of staff reported that their manager engaged them in continuous feedback dialogue
several times during a program year.
o Grantees implemented a fifth year of data collection, training, and technical assistance to improve
the quality of Oklahoma afterschool programs.
Objective 4.3: Grantees will facilitate opportunities for communication between and among center
coordinators and direct staff working in the 21st CCLC programs.
o Staff reported regular opportunities to discuss teaching problems or practices with other staff (see
Table 11).
o Staff reported regular communication from supervisors regarding program priorities and goals (see
Table 12).
o Forty-five sites indicated that collaboration was strongly encouraged across sites and that site
supervisors shared a similar definition of high-quality services (high quartile mean= 5.00, see Table
B1).
Objective 4.4: Grantees will maintain a high job satisfaction rate among grantee directors, center
coordinators, and direct staff.
o Program staff and administration reported that high levels of job satisfaction (see Table 9).
o 60% of Project Directors (n=45) reported that staff “almost always” stay at the program for a long
time.
o 57% of Project Directors (n=43) report that the position is “almost always” close to their ideal.
o 45% of staff respondents (n=318) reported that the position is “almost always” close to their ideal.
2015-2016 Oklahoma 21st CCLC Statewide Evaluation Report Page 11
Objective 4.5: OSDE will provide targeted supports to eligible grantees.
o OSDE used the Performance Distribution Index (PDI)5 to identify challenges specific to grantees.
Among the 99 sites, 46 sites had a PDI score of 3 or less.
Nine sites had a PDI score of 10 or more (see Appendix B).
o 100% of new sites received intensive technical assistance from a Quality Coach (management
coaching).
5 The Performance Distribution Index is an analysis used to identify sites in need of intensive technical assistance from the network. Scores on
the 22 Leading Indicator scales are examined according to quartile placement. Sites with ten or more scale scores in the lowest quartiles are
identified as in need of targeted assistance.
2015-2016 Oklahoma 21st CCLC Statewide Evaluation Report Page 12
Evaluation Methodology
Measures, Data Collection Procedures, and Sample Characteristics
Much of the summary data and evaluative comparisons presented in this report are organized around a Leading
Indicators framework developed by the evaluation contractor to serve several key purposes:
to improve cost effectiveness of investments in evaluation by reorienting evaluation purposes to include
grantee/site-level continuous improvement as a primary goal while maintaining system-wide summative
conclusions as an important but secondary goal.
to support continuous improvement decisions by:
o collecting data that is focused on specific best practices at multiple levels (i.e., system, organization,
and point of service) in order to simultaneously empower actors at all levels and roles to improve
performance;
o collecting child level data that is proximal to the point-of-service setting where instruction is delivered
in order to more effectively inform site-level actors about actionable beliefs and skills that children
both bring to and develop in the program.
to improve our ability to differentiate between high and low quality programs by including information from
multiple measures in a single profile of grantee/site performance, thereby reducing the threat of erroneous
decision-making due to error in any single measure.
The Leading Indicators framework came from the Youth Program Quality Intervention Study (Smith et al., 2012) and
was first executed in the state of Michigan’s 21st CCLC programs beginning in 2008. In the Oklahoma evaluation,
Leading Indicator reports were produced for each grantee, comparing grantee performance with normative
performance across all grantees in the state. This report provides a summative profile of performance for the
statewide system, across all sites and grantees.
The 13 Leading Indicators described on pages 22-47 of this report were constructed as composites from 31 scale
scores drawn from surveys administered to program staff, students, and parents and observational measures of
program quality. Scale scores were designed to identify best practices that impact the quality and effectiveness of
afterschool programs, according to theory, research and the experience of Weikart Center staff. The 13 leading
indicator composite scores were constructed as means across each of the unweighted scales in that domain (Smith
et al., 2012). These composite scores are most appropriately used for exploratory purposes, guiding grantee/site
staff toward further examination of scale- and item-level scores. The Leading Indicators are arranged in alignment
with five primary contexts that characterize afterschool programming: Organizational, Instructional, External
Relationships, Youth Skills, and Family Satisfaction.
The reliability and validity of the leading indicators are described in a report to the Oklahoma Department of
Education and are based on research methods for composing scores from multiple criteria (Bobko, Roth, & Buster,
2007; Fralicx & Raju, 1982; Smith et al., 2012). Appendix A provides descriptive information and reliability evidence
for the Oklahoma 2015-2016 sample. In general, the 31 scales demonstrate acceptable levels of internal
consistency (items within scales) and fairly high levels of inter-rater agreement (persons within program sites).
The following section describes each of the Leading Indicator measures, sample characteristics, additional sources
of information used in this report, and procedures for data collection.
NOTE*** Significant changes in the federal Annual Performance Reporting (APR) data collection system were
advanced over the 2014-2015 programming year. System revisions included, but were not limited to multiple data
collection periods (e.g., Summer; Fall; Spring) throughout the programming year (previously APR data was collected
from sites only once at the end of the programming year); a new system-user interface; and adjustments to data
collection periods. These updates are addressed in greater detail in the Annual Performance Reporting – Data
Management section, following the description of measures (see p. 19).
2015-2016 Oklahoma 21st CCLC Statewide Evaluation Report Page 13
Grantee Director/Site Coordinator Survey & Sample
In many 21st CCLC systems across the United States, a grantee oversees multiple sites (or locations where
programming is offered. Each of these is managed by a site coordinator who is responsible for the daily operations
of programming and staff supervision. The grantee director typically operates at a higher level of management,
communicating accountability policies to site coordinators. However, in Oklahoma’s 21st CCLC system, there are
many grantees who offer programming at only one site such that the grantee director is also the site coordinator.
Therefore, this survey was directed primarily at grantee directors although site coordinators who were not also
grantee directors were surveyed where appropriate.
The Grantee Director/Site Coordinator survey consisted of 44 items assessing practices and organizational
characteristics related to the Organizational and External Relationships Contexts. These questions focused on issues
such as staff capacity to carry out the work, job satisfaction, the roles youth have in governing the program,
enrollment for students with academic risk factors, accountability and collaboration norms, connections to the
school day, and community engagement with the afterschool program.
The Grantee Director/Site Coordinator survey was administered February – April, 2015. Surveys were constructed
within Qualtrics, an online survey program, and a link to the survey was posted on the Oklahoma 21st CCLC project
page of the evaluation contractor’s website, with e-mail reminders sent to non-respondents roughly halfway through
the data collection period.
A total of 75 grantee directors and site coordinators responded to the online survey, representing 64% of the 98
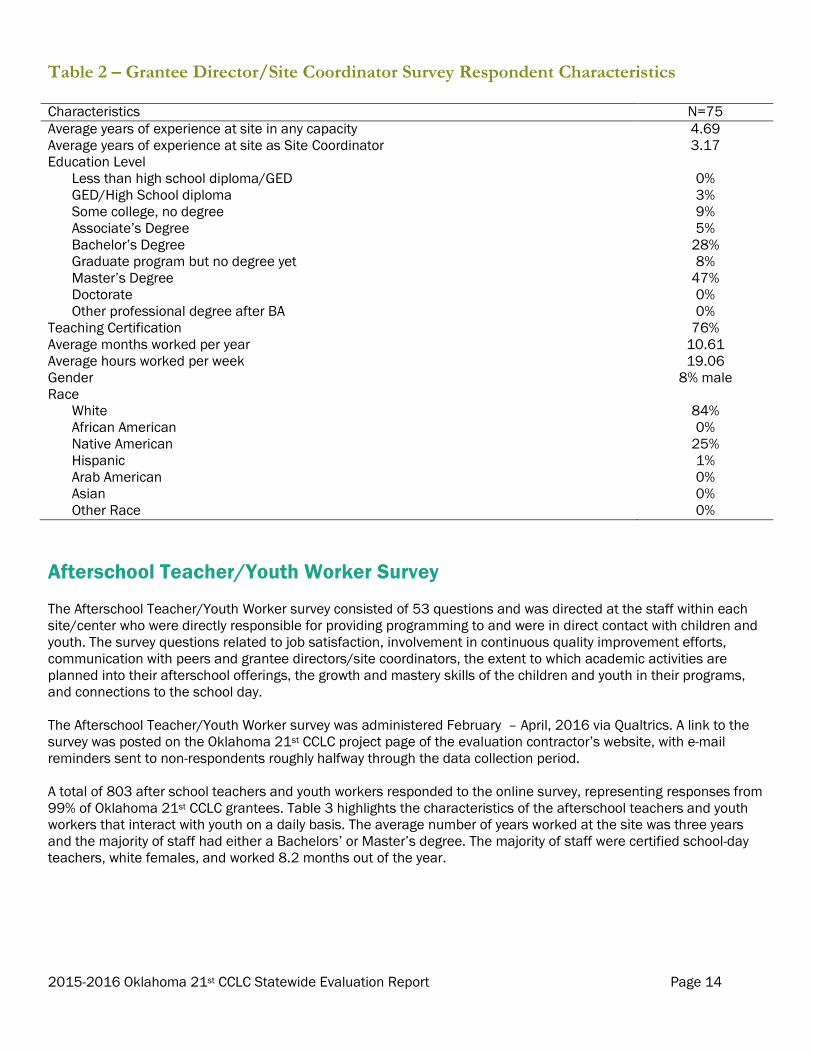
Oklahoma 21st CCLC sites. Table 2 below displays characteristics of grantee directors and site coordinators. The
majority of respondents had a Master’s degree, and were white females, and certified teachers.
2015-2016 Oklahoma 21st CCLC Statewide Evaluation Report Page 14
Table 2 – Grantee Director/Site Coordinator Survey Respondent Characteristics Characteristics N=75
Average years of experience at site in any capacity 4.69
Average years of experience at site as Site Coordinator 3.17
Education Level
Less than high school diploma/GED 0%
GED/High School diploma 3%
Some college, no degree 9%
Associate’s Degree 5%
Bachelor’s Degree 28%
Graduate program but no degree yet 8%
Master’s Degree 47%
Doctorate 0%
Other professional degree after BA 0%
Teaching Certification 76%
Average months worked per year 10.61
Average hours worked per week 19.06
Gender 8% male
Race
White 84%
African American 0%
Native American 25%
Hispanic 1%
Arab American 0%
Asian 0%
Other Race 0%
Afterschool Teacher/Youth Worker Survey
The Afterschool Teacher/Youth Worker survey consisted of 53 questions and was directed at the staff within each
site/center who were directly responsible for providing programming to and were in direct contact with children and
youth. The survey questions related to job satisfaction, involvement in continuous quality improvement efforts,
communication with peers and grantee directors/site coordinators, the extent to which academic activities are
planned into their afterschool offerings, the growth and mastery skills of the children and youth in their programs,
and connections to the school day.
The Afterschool Teacher/Youth Worker survey was administered February – April, 2016 via Qualtrics. A link to the
survey was posted on the Oklahoma 21st CCLC project page of the evaluation contractor’s website, with e-mail
reminders sent to non-respondents roughly halfway through the data collection period.
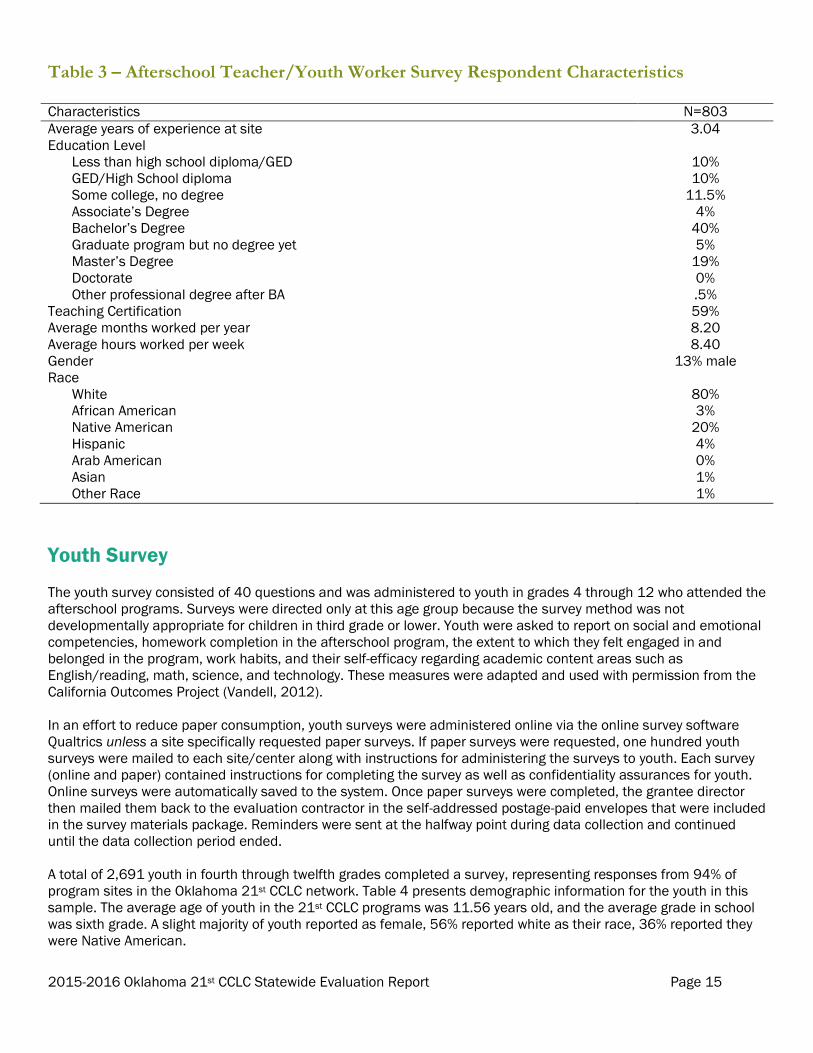
A total of 803 after school teachers and youth workers responded to the online survey, representing responses from
99% of Oklahoma 21st CCLC grantees. Table 3 highlights the characteristics of the afterschool teachers and youth
workers that interact with youth on a daily basis. The average number of years worked at the site was three years
and the majority of staff had either a Bachelors’ or Master’s degree. The majority of staff were certified school-day
teachers, white females, and worked 8.2 months out of the year.
2015-2016 Oklahoma 21st CCLC Statewide Evaluation Report Page 15
Table 3 – Afterschool Teacher/Youth Worker Survey Respondent Characteristics Characteristics N=803
Average years of experience at site 3.04
Education Level
Less than high school diploma/GED 10%
GED/High School diploma 10%
Some college, no degree 11.5%
Associate’s Degree 4%
Bachelor’s Degree 40%
Graduate program but no degree yet 5%
Master’s Degree 19%
Doctorate 0%
Other professional degree after BA .5%
Teaching Certification 59%
Average months worked per year 8.20
Average hours worked per week 8.40
Gender 13% male
Race
White 80%
African American 3%
Native American 20%
Hispanic 4%
Arab American 0%
Asian 1%
Other Race 1%
Youth Survey
The youth survey consisted of 40 questions and was administered to youth in grades 4 through 12 who attended the
afterschool programs. Surveys were directed only at this age group because the survey method was not
developmentally appropriate for children in third grade or lower. Youth were asked to report on social and emotional
competencies, homework completion in the afterschool program, the extent to which they felt engaged in and
belonged in the program, work habits, and their self-efficacy regarding academic content areas such as
English/reading, math, science, and technology. These measures were adapted and used with permission from the
California Outcomes Project (Vandell, 2012).
In an effort to reduce paper consumption, youth surveys were administered online via the online survey software
Qualtrics unless a site specifically requested paper surveys. If paper surveys were requested, one hundred youth
surveys were mailed to each site/center along with instructions for administering the surveys to youth. Each survey
(online and paper) contained instructions for completing the survey as well as confidentiality assurances for youth.
Online surveys were automatically saved to the system. Once paper surveys were completed, the grantee director
then mailed them back to the evaluation contractor in the self-addressed postage-paid envelopes that were included
in the survey materials package. Reminders were sent at the halfway point during data collection and continued
until the data collection period ended.
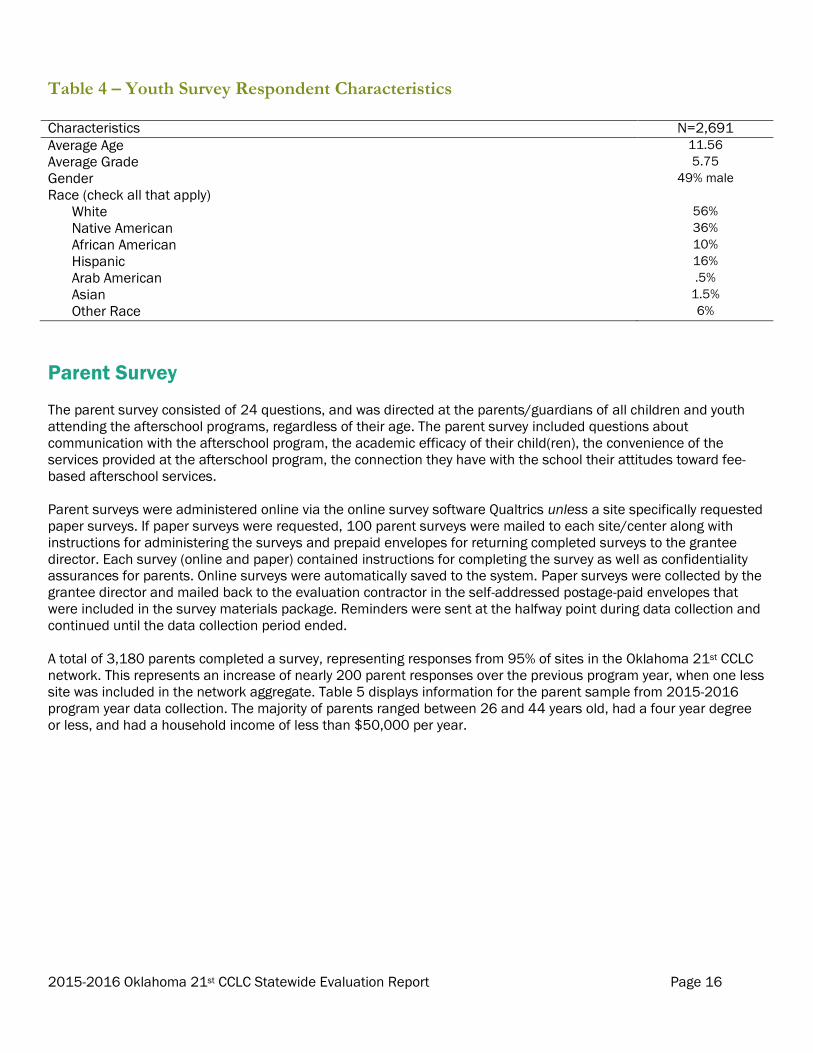
A total of 2,691 youth in fourth through twelfth grades completed a survey, representing responses from 94% of
program sites in the Oklahoma 21st CCLC network. Table 4 presents demographic information for the youth in this
sample. The average age of youth in the 21st CCLC programs was 11.56 years old, and the average grade in school
was sixth grade. A slight majority of youth reported as female, 56% reported white as their race, 36% reported they
were Native American.
2015-2016 Oklahoma 21st CCLC Statewide Evaluation Report Page 16
Table 4 – Youth Survey Respondent Characteristics Characteristics N=2,691
Average Age 11.56
Average Grade 5.75
Gender 49% male
Race (check all that apply)
White 56%
Native American 36%
African American 10%
Hispanic 16%
Arab American .5%
Asian 1.5%
Other Race 6%
Parent Survey
The parent survey consisted of 24 questions, and was directed at the parents/guardians of all children and youth
attending the afterschool programs, regardless of their age. The parent survey included questions about
communication with the afterschool program, the academic efficacy of their child(ren), the convenience of the
services provided at the afterschool program, the connection they have with the school their attitudes toward fee-
based afterschool services.
Parent surveys were administered online via the online survey software Qualtrics unless a site specifically requested
paper surveys. If paper surveys were requested, 100 parent surveys were mailed to each site/center along with
instructions for administering the surveys and prepaid envelopes for returning completed surveys to the grantee
director. Each survey (online and paper) contained instructions for completing the survey as well as confidentiality
assurances for parents. Online surveys were automatically saved to the system. Paper surveys were collected by the
grantee director and mailed back to the evaluation contractor in the self-addressed postage-paid envelopes that
were included in the survey materials package. Reminders were sent at the halfway point during data collection and
continued until the data collection period ended.
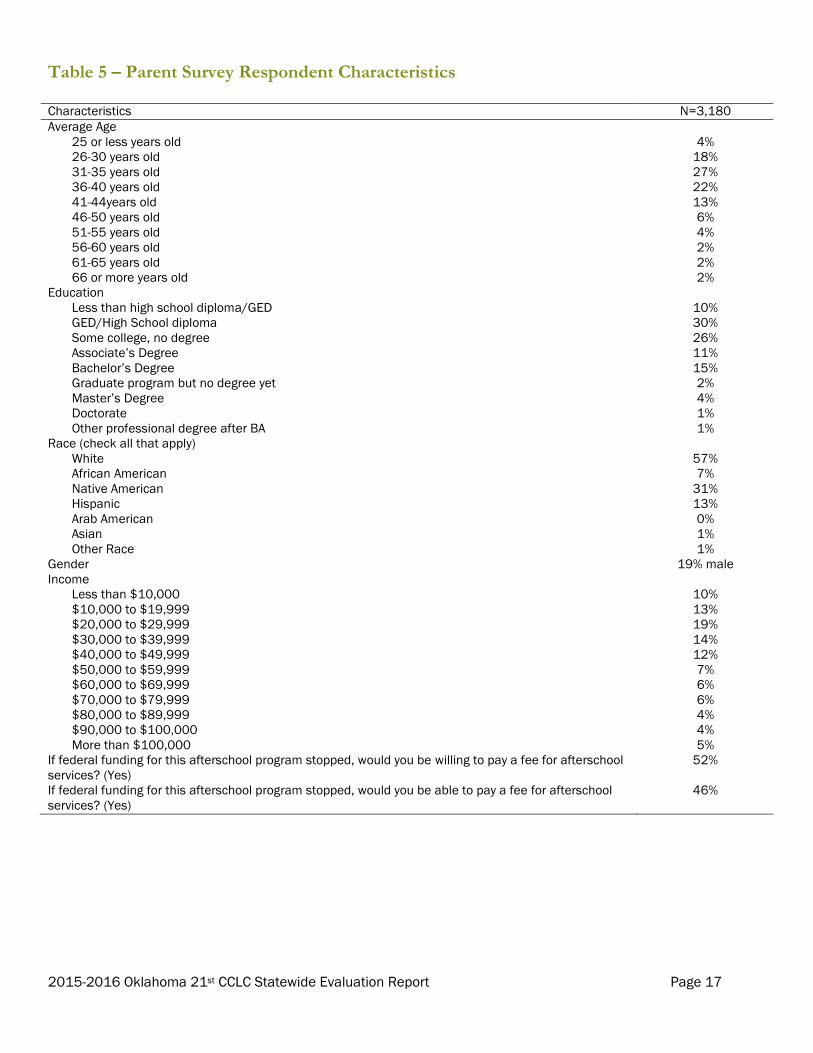
A total of 3,180 parents completed a survey, representing responses from 95% of sites in the Oklahoma 21st CCLC
network. This represents an increase of nearly 200 parent responses over the previous program year, when one less
site was included in the network aggregate. Table 5 displays information for the parent sample from 2015-2016
program year data collection. The majority of parents ranged between 26 and 44 years old, had a four year degree
or less, and had a household income of less than $50,000 per year.
2015-2016 Oklahoma 21st CCLC Statewide Evaluation Report Page 17
Table 5 – Parent Survey Respondent Characteristics Characteristics N=3,180
Average Age
25 or less years old 4%
26-30 years old 18%
31-35 years old 27%
36-40 years old 22%
41-44years old 13%
46-50 years old 6%
51-55 years old 4%
56-60 years old 2%
61-65 years old 2%
66 or more years old 2%
Education
Less than high school diploma/GED 10%
GED/High School diploma 30%
Some college, no degree 26%
Associate’s Degree 11%
Bachelor’s Degree 15%
Graduate program but no degree yet 2%
Master’s Degree 4%
Doctorate 1%
Other professional degree after BA 1%
Race (check all that apply)
White 57%
African American 7%
Native American 31%
Hispanic 13%
Arab American 0%
Asian 1%
Other Race 1%
Gender 19% male
Income
Less than $10,000 10%
$10,000 to $19,999 13%
$20,000 to $29,999 19%
$30,000 to $39,999 14%
$40,000 to $49,999 12%
$50,000 to $59,999 7%
$60,000 to $69,999 6%
$70,000 to $79,999 6%
$80,000 to $89,999 4%
$90,000 to $100,000 4%
More than $100,000 5%
If federal funding for this afterschool program stopped, would you be willing to pay a fee for afterschool
services? (Yes)
52%
If federal funding for this afterschool program stopped, would you be able to pay a fee for afterschool
services? (Yes)
46%
2015-2016 Oklahoma 21st CCLC Statewide Evaluation Report Page 18
Program Quality Assessment
The Youth Program Quality Assessment (Youth PQA) and the School-Age Program Quality Assessment (School-Age
PQA) are observation-based measures that were used to conduct program self assessments. These measures were
a critical component of the Program Quality Improvement process and also provided data for the Instructional
Context scales of the Leading Indicators. Raters using the PQA use observational notes to score rubrics describing
the extent to which specific staff practices are happening within each program session.
The Youth PQA is composed of 60 items comprising 18 scales, that fall into four domains: Safe Environment,
Supportive Environment, Interaction, and Engagement. The Youth PQA is currently being used in over 80 afterschool
networks across the United States and evidence from multiple replication samples suggests that data produced by
the Youth PQA has characteristics of both precision (reliability) and meaningfulness (validity) (Smith et al., 2012;
Smith & Hohmann, 2005).
The School-Age PQA is composed of 68 items comprising 20 scales, that fall into the same four domains as the
Youth PQA: Safe Environment, Supportive Environment, Interaction, and Engagement. The School-Age PQA assesses
staff instructional practices that are developmentally appropriate for younger children. Evidence of reliability and
validity for the School-Age PQA is available from the Weikart Center.
Program quality self assessments were conducted with each grantee. The program self assessment method
includes the selection of a site team that observes each other’s practice using the developmentally appropriate PQA
assessment tool (Youth PQA or School-Age PQA). Once the site team has had a chance to observe each other’s
practice, a scoring meeting is scheduled in which staff discusses their observations and come to a consensus on the
score for each item on the PQA.
Program quality external assessments were also conducted for a subset of these grantees (i.e., those in the second
year of their grant). Grantees who received program quality external assessment contracted with independent raters
to come in and observe their programs. Raters received endorsement through the completion of a rigorous reliability
training process in which they are required to pass an examination by surpassing 80% perfect agreement with the
Weikart Center’s gold standard scores on the PQA.
Between October 2015 and December 2015, a total of 33 self assessments with the Youth PQA and 80 self
assessments with the School-Age PQA were conducted, representing 95% of all sites. Also between October and
December, a total of 14 external assessments using the Youth PQA and 32 external assessments using the School-
Age PQA were conducted, representing 93% of all second-year grantees.
2015-2016 Oklahoma 21st CCLC Statewide Evaluation Report Page 19
Annual Performance Reporting – Data Management
The online federal data collection system (hereafter referred to as the APR System) was designed to collect site
operations data including: offering content, recruitment and retention, student demographic data, and partner and
staffing information across the Oklahoma 21st CCLC network. The evaluation contractor provided technical
assistance to grantees needing to fulfill data submission requirements via the APR System and submitted the
staffing, attendance, and impact category for regular attendees in the APR System for all grantees.
In order to complete the attendance, staffing, and state assessment modules for grantees, the evaluation contractor
asked all grantees to keep track of their data using an Excel spreadsheet created by the evaluation contractor.
Grantees were asked to update these files on a monthly basis and then submit them to the evaluation contractor
once the program year had ended.
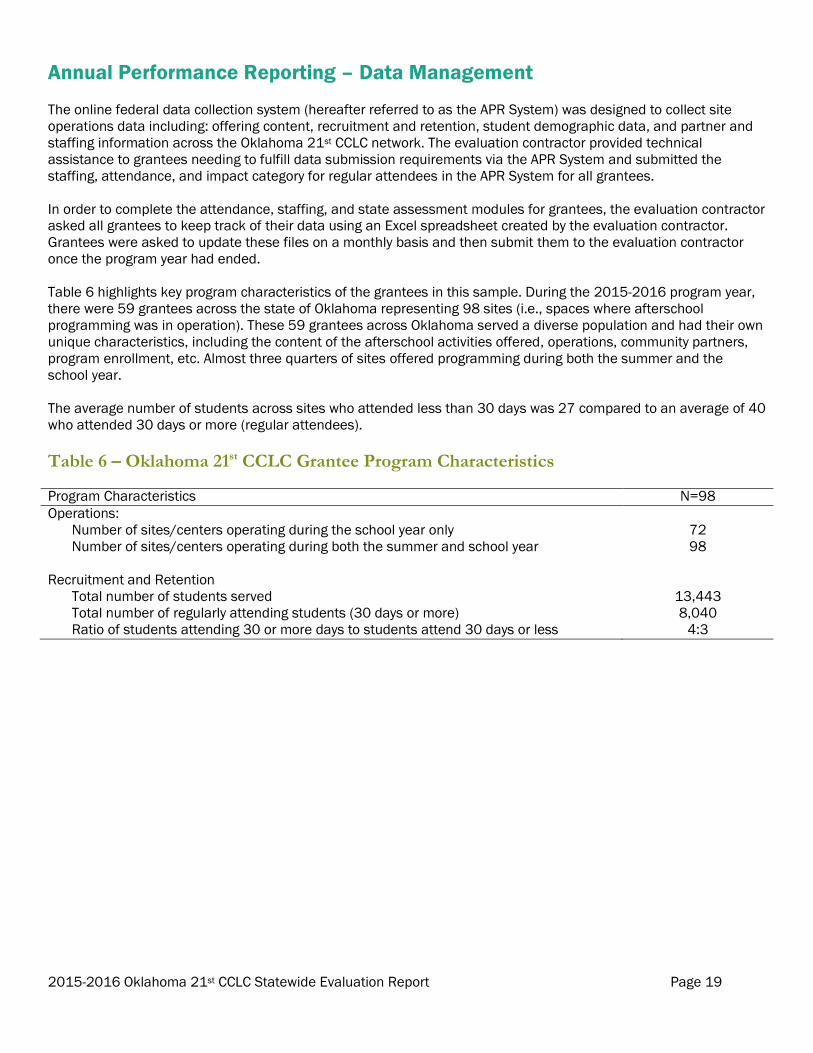
Table 6 highlights key program characteristics of the grantees in this sample. During the 2015-2016 program year,
there were 59 grantees across the state of Oklahoma representing 98 sites (i.e., spaces where afterschool
programming was in operation). These 59 grantees across Oklahoma served a diverse population and had their own
unique characteristics, including the content of the afterschool activities offered, operations, community partners,
program enrollment, etc. Almost three quarters of sites offered programming during both the summer and the
school year.
The average number of students across sites who attended less than 30 days was 27 compared to an average of 40
who attended 30 days or more (regular attendees).
Table 6 – Oklahoma 21st CCLC Grantee Program Characteristics Program Characteristics N=98
Operations:
Number of sites/centers operating during the school year only 72
Number of sites/centers operating during both the summer and school year
98
Recruitment and Retention
Total number of students served
Total number of regularly attending students (30 days or more)
13,443
8,040
Ratio of students attending 30 or more days to students attend 30 days or less 4:3
2015-2016 Oklahoma 21st CCLC Statewide Evaluation Report Page 20
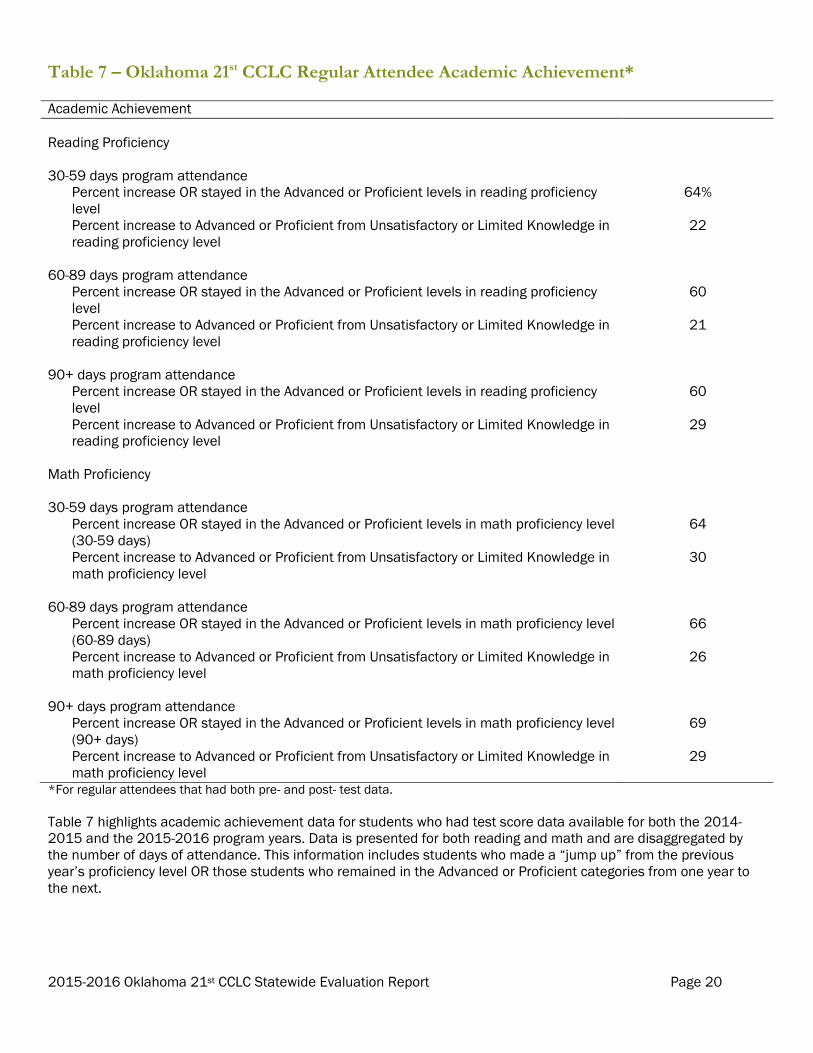
Table 7 – Oklahoma 21st CCLC Regular Attendee Academic Achievement* Academic Achievement
Reading Proficiency
30-59 days program attendance
Percent increase OR stayed in the Advanced or Proficient levels in reading proficiency
level
64%
Percent increase to Advanced or Proficient from Unsatisfactory or Limited Knowledge in
reading proficiency level
22
60-89 days program attendance
Percent increase OR stayed in the Advanced or Proficient levels in reading proficiency
level
60
Percent increase to Advanced or Proficient from Unsatisfactory or Limited Knowledge in
reading proficiency level
21
90+ days program attendance
Percent increase OR stayed in the Advanced or Proficient levels in reading proficiency
level
60
Percent increase to Advanced or Proficient from Unsatisfactory or Limited Knowledge in
reading proficiency level
29
Math Proficiency
30-59 days program attendance
Percent increase OR stayed in the Advanced or Proficient levels in math proficiency level
(30-59 days)
64
Percent increase to Advanced or Proficient from Unsatisfactory or Limited Knowledge in
math proficiency level
30
60-89 days program attendance
Percent increase OR stayed in the Advanced or Proficient levels in math proficiency level
(60-89 days)
66
Percent increase to Advanced or Proficient from Unsatisfactory or Limited Knowledge in
math proficiency level
26
90+ days program attendance
Percent increase OR stayed in the Advanced or Proficient levels in math proficiency level
(90+ days)
69
Percent increase to Advanced or Proficient from Unsatisfactory or Limited Knowledge in
math proficiency level
29
*For regular attendees that had both pre- and post- test data.
Table 7 highlights academic achievement data for students who had test score data available for both the 2014-
2015 and the 2015-2016 program years. Data is presented for both reading and math and are disaggregated by
the number of days of attendance. This information includes students who made a “jump up” from the previous
year’s proficiency level OR those students who remained in the Advanced or Proficient categories from one year to
the next.
2015-2016 Oklahoma 21st CCLC Statewide Evaluation Report Page 21
Findings/Results
The following section presents findings from the 2015-2016 Oklahoma 21st CCLC Statewide Evaluation conducted
by the evaluation contractor. The 2015-2016 program year marks the sixth year the evaluation contractor has used
the leading indicators framework to collect, analyze, and present data aligned with specific best practices at multiple
levels of each grantee. As such, 2015-2016 program data is presented alongside 2012-2013, 2013-2014, and
2014-2015 program data6.
The inclusion of, 2012-2013, 2013-2014, and 2014-2015 program data is provided to support comparisons across
years, with a number of critical caveats:
In most cases, these data cannot be used to represent changes in the behavior of specific individuals.
Because we do not collect identifying information for any specific individual, year-to-year comparisons only
represent changes in the average scores for groups of individuals (within sites) that almost certainly involve
different individuals across years.
Aggregating across scale scores to create the indicator composites may obscure actual patterns of change
on scales (e.g., the composite indicator may go up a little because two component scales went up a lot but a
third went down even more).
We lack criteris for how much change is substantively important.
The inclusion of multi-year data is intended to promote more critical thinking, investigation, and question-raising to
support lower stakes decision making about program improvement.
All summaries of data tables and figures described below are predicated upon 2015-2016 program year data only.
Data representations for the 2012-2013, 2014-2015, and the 2014-2015 program years are solely meant for
reference and examination purposes.
6 Data for 2010-2011 and 2011-2012 have been omitted. Data from the 2010-2011 program year were omitted due to the sites having been
evaluated at the grantee level, rather than the site level, as in subsequent years. Specifically data from grantees with more than one site were
aggregated to the grantee level and grantee data was compared with the network aggregate. Following this initial baseline year, all sites were
measured individually and compared with the network aggregate. Data from the 2011-2012 program year have been omitted in favor of
adequate presentation space for 2012-2016. Data from the 2011-2012 programming year is available from OSDE. Information on the pilot
and subsequent implementation year can be obtained through the Oklahoma State Department of Education.
2015-2016 Oklahoma 21st CCLC Statewide Evaluation Report Page 22
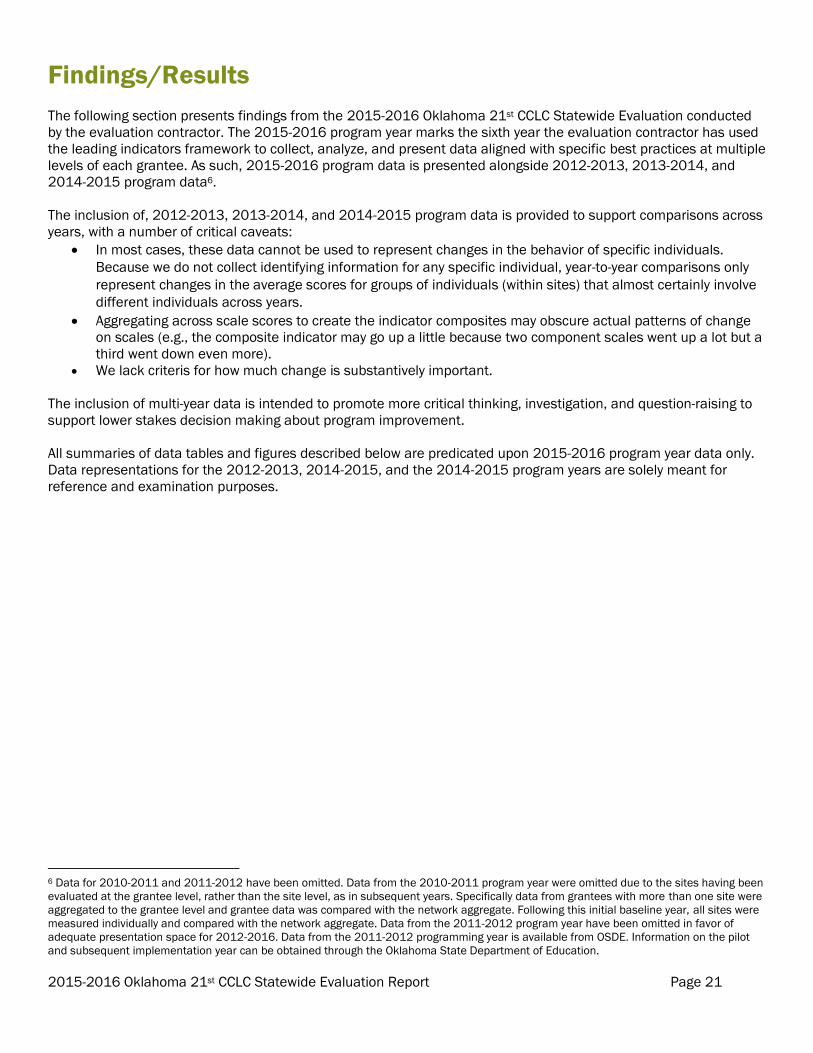
Organizational Context Four Leading Indicators were included under the organizational context: Staffing Model, Continuous Improvement,
Youth Governance, and Enrollment Policy. These four indicators reflect organizational level policies and practices.
Scores are presented in Figure 2.
Figure 2 –Organizational Context Leading Indicators
Staffing Model assesses the extent to which grantee directors and site coordinators feel that their staff members
are prepared for their jobs, their staff members feel like they enjoy their jobs, and their own ability to offer supports
and resources to their staff is sufficient. Overall, it appears that grantee directors and site coordinators feel that
their staff members are generally prepared to lead afterschool activities and respondents are satisfied with their job
most of the time.
Continuous Improvement assesses the extent to which staff members participate in professional development
opportunities and activities that are meant to increase the quality of the services they provide. It also measures how
well staff members communicate with their peers and supervisors regarding program quality. For the 2015-2016
Statewide Evaluation report, the Continuous Improvement Leading Indicator was updated to measure participation
in YPQI practices only. Items that had previously been considered as a single scale calculation have been broken out
into two separate scales. Three additional tables have been included: Breadth of Fidelity, Program Impact, and YPQI
Value. The Breadth of Fidelity scale has been included for program planning and consideration but is not included in
the calculation of the Continuous Improvement Leading Indicator value. Although we consider these updates to be
minimal and therefore comparable to previous years, 2015-2016 scores should be considered with these changes
in mind.
Youth Governance scores were generally lower than Staffing Model and Continuous Improvement scores; however
this leading indicator has shown improvement over time. It is important to note that questions related to this
Leading Indicator were only asked of grantees who serve middle school and high school age youth and questions
ask respondents to report about middle school and high school age youth.
The Enrollment Policy Leading Indicator represents intentional efforts to target low-income at-risk youth, a primary
purpose of the 21st CCLC funding stream. While this indicator has demonstrated gradual and consistent
improvement over time, 2015-2016 scores indicated a small decline.
1
2
3
4
5
Leading Indicator 1.1 -
Staffing Model
Leading Indicator 1.2 -
Continuous Improvement
Leading Indicator 1.3 -
Youth Governance
Leading Indicator 1.4 -
Enrollment Policy
Sco
re
Indicator
2012-2013 (N=107) 2013-2014 (N=86) 2014-2015 (N=99) 2015-2016
2015-2016 Oklahoma 21st CCLC Statewide Evaluation Report Page 23
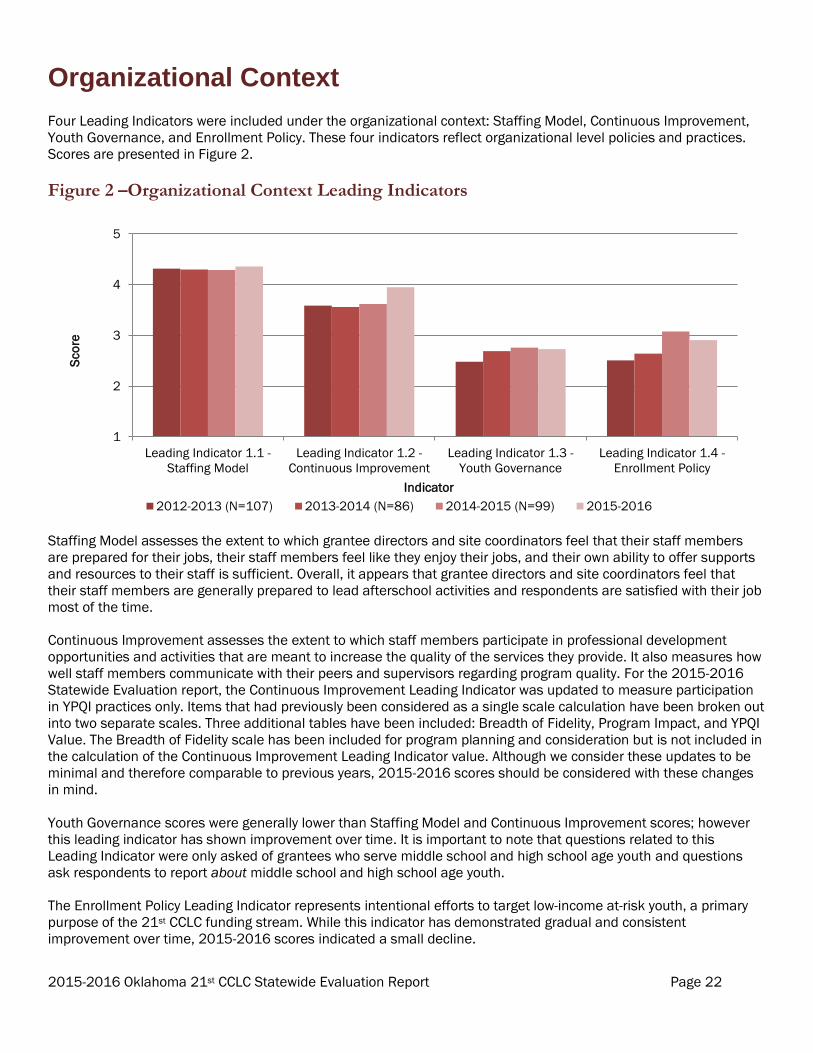
Leading Indicator 1.1 – Staffing Model
This Leading Indicator is meant to capture the degree to which staff are prepared for their position and have the
necessary supports and resources to do their job effectively. Also, this Leading Indicator captures an overall sense of
job satisfaction.
Figure 3 – Leading Indicator 1.1 Staffing Model: Scale Scores
Table 8 – Capacity Scale Detailed Scores
PROMPT: Please rate the extent to which the following statements are true for
staff in your program (1=Almost never true of staff, 3=True for about half of
staff, 5=Almost always true of staff).
2012-2013
OK
Aggregate
(N=107)
2013-2014
OK
Aggregate
(N=86)
2014-2015
OK
Aggregate
(N=99)
2015-2016
OK
Aggregate
(N=98)
Capacity 4.19 4.15 4.30 4.43
Staff come to the program with adequate training or experience 4.14 4.08 4.13 4.47
Staff stay at our program for a long time 4.42 4.46 4.46 4.48
We have enough staff and/or student-to-staff ratios are good 4.49 4.43 4.63 4.70
New staff get an adequate orientation 3.99 3.89 4.13 4.33
Staff have enough time to attend meetings or do planning 3.74 3.69 4.03 4.08 Staff are designing and delivering activities consistent with
program goals and objectives for students 4.35
4.32 4.44
4.52
Data Source: Grantee Director/Site Coordinator Survey
Table 9 – Job Satisfaction Scale Detailed Scores
PROMPT: Please rate the extent to which the following statements are true for
you (1=Almost never true, 3=True about half of the time, 5=Almost always true).
2012-2013
OK
Aggregate
(N=107)
2013-2014
OK
Aggregate
(N=86)
2014-2015
OK
Aggregate
(N=99)
2015-2016
OK
Aggregate
(N=98)
Job Satisfaction 4.25 4.26 4.28 4.34
In most ways, this job is close to my ideal 4.17 4.14 4.15 4.20
The condition of my current job is excellent 4.37 4.38 4.33 4.46
I am satisfied with this job 4.29 4.45 4.52 4.56
If I could change my career so far, I would not change anything 4.17 4.09 4.14 4.14 Data Source: Grantee Director/Site Coordinator Survey & Afterschool Teacher/Youth Worker Survey
Key Points:
- Grantee directors reported that staff retention is high and that staff are coming into the program with
adequate training or experience.
- Managers reported that they have adequate staff and student-to-teacher ratios are good.
- Site managers and staff reported a high degree of job satisfaction.
4.25
4.19
4.26
4.15
4.28
4.3
4.34
4.33
1 2 3 4 5
Job Satisfaction
Capacity
Score
Sca
le
2015-2016 (N=98) 2014-2015 (N=99) 2013-2014 (N=86) 2012-2013 (N=107)
2015-2016 Oklahoma 21st CCLC Statewide Evaluation Report Page 24
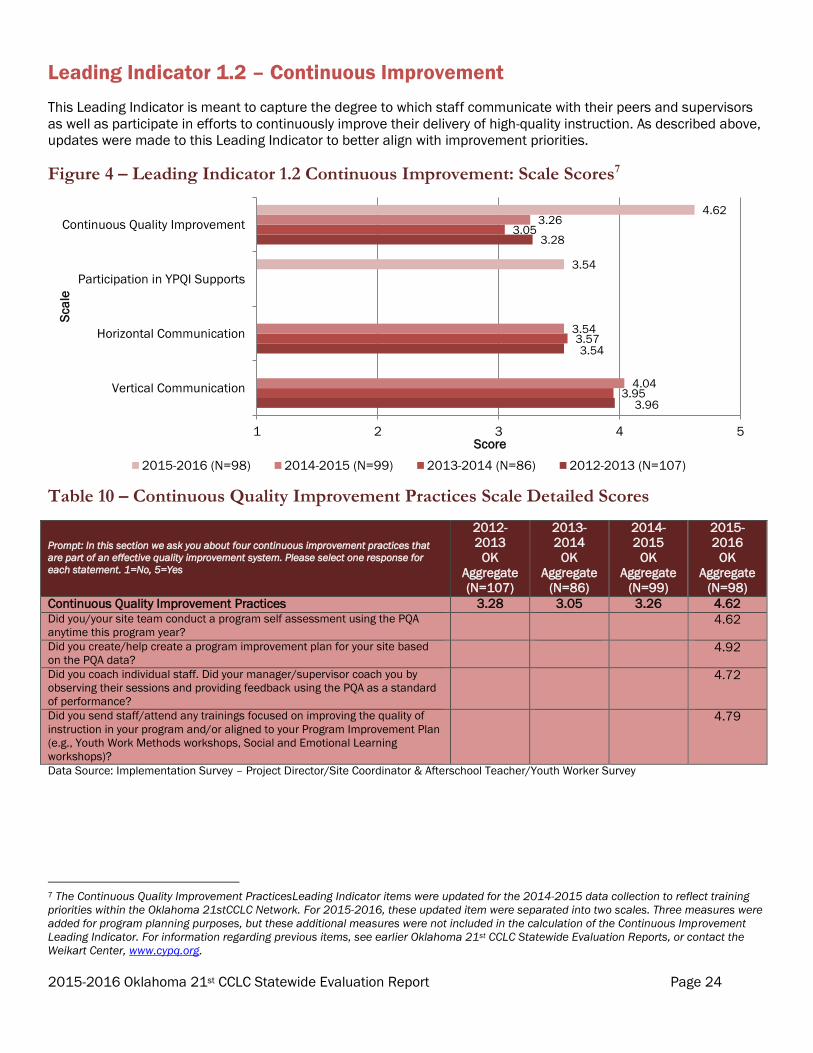
Leading Indicator 1.2 – Continuous Improvement
This Leading Indicator is meant to capture the degree to which staff communicate with their peers and supervisors
as well as participate in efforts to continuously improve their delivery of high-quality instruction. As described above,
updates were made to this Leading Indicator to better align with improvement priorities.
Figure 4 – Leading Indicator 1.2 Continuous Improvement: Scale Scores7
Table 10 – Continuous Quality Improvement Practices Scale Detailed Scores
Prompt: In this section we ask you about four continuous improvement practices that
are part of an effective quality improvement system. Please select one response for
each statement. 1=No, 5=Yes
2012-
2013
OK
Aggregate
(N=107)
2013-
2014
OK
Aggregate
(N=86)
2014-
2015
OK
Aggregate
(N=99)
2015-
2016
OK
Aggregate
(N=98)
Continuous Quality Improvement Practices 3.28 3.05 3.26 4.62 Did you/your site team conduct a program self assessment using the PQA
anytime this program year?
4.62
Did you create/help create a program improvement plan for your site based
on the PQA data?
4.92
Did you coach individual staff. Did your manager/supervisor coach you by
observing their sessions and providing feedback using the PQA as a standard
of performance?
4.72
Did you send staff/attend any trainings focused on improving the quality of
instruction in your program and/or aligned to your Program Improvement Plan
(e.g., Youth Work Methods workshops, Social and Emotional Learning
workshops)?
4.79
Data Source: Implementation Survey – Project Director/Site Coordinator & Afterschool Teacher/Youth Worker Survey
7 The Continuous Quality Improvement PracticesLeading Indicator items were updated for the 2014-2015 data collection to reflect training
priorities within the Oklahoma 21stCCLC Network. For 2015-2016, these updated item were separated into two scales. Three measures were
added for program planning purposes, but these additional measures were not included in the calculation of the Continuous Improvement
Leading Indicator. For information regarding previous items, see earlier Oklahoma 21st CCLC Statewide Evaluation Reports, or contact the
Weikart Center, www.cypq.org.
3.96
3.54
3.28
3.95
3.57
3.05
4.04
3.54
3.26
3.54
4.62
1 2 3 4 5
Vertical Communication
Horizontal Communication
Participation in YPQI Supports
Continuous Quality Improvement
Score
Sca
le
2015-2016 (N=98) 2014-2015 (N=99) 2013-2014 (N=86) 2012-2013 (N=107)
2015-2016 Oklahoma 21st CCLC Statewide Evaluation Report Page 25
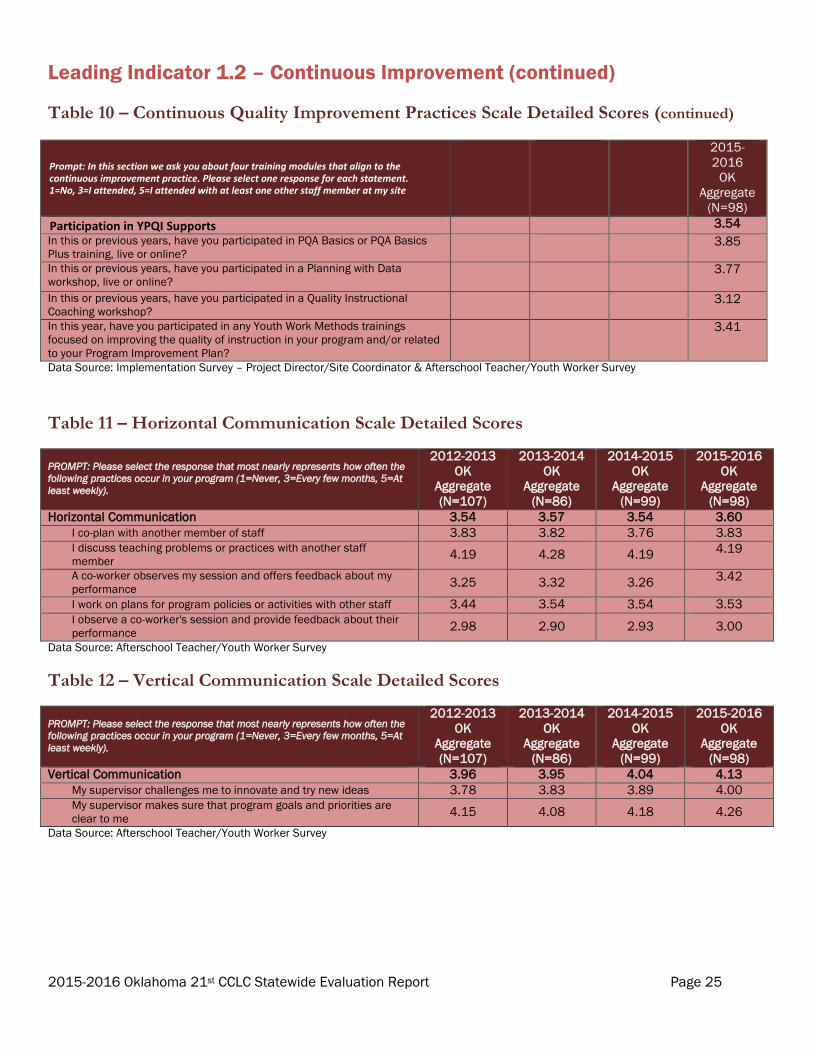
Leading Indicator 1.2 – Continuous Improvement (continued)
Table 10 – Continuous Quality Improvement Practices Scale Detailed Scores (continued)
Prompt: In this section we ask you about four training modules that align to the continuous improvement practice. Please select one response for each statement. 1=No, 3=I attended, 5=I attended with at least one other staff member at my site
2015-
2016
OK
Aggregate
(N=98)
Participation in YPQI Supports 3.54
In this or previous years, have you participated in PQA Basics or PQA Basics
Plus training, live or online?
3.85
In this or previous years, have you participated in a Planning with Data
workshop, live or online?
3.77
In this or previous years, have you participated in a Quality Instructional
Coaching workshop?
3.12
In this year, have you participated in any Youth Work Methods trainings
focused on improving the quality of instruction in your program and/or related
to your Program Improvement Plan?
3.41
Data Source: Implementation Survey – Project Director/Site Coordinator & Afterschool Teacher/Youth Worker Survey
Table 11 – Horizontal Communication Scale Detailed Scores
PROMPT: Please select the response that most nearly represents how often the
following practices occur in your program (1=Never, 3=Every few months, 5=At
least weekly).
2012-2013
OK
Aggregate
(N=107)
2013-2014
OK
Aggregate
(N=86)
2014-2015
OK
Aggregate
(N=99)
2015-2016
OK
Aggregate
(N=98)
Horizontal Communication 3.54 3.57 3.54 3.60
I co-plan with another member of staff 3.83 3.82 3.76 3.83 I discuss teaching problems or practices with another staff
member 4.19
4.28 4.19 4.19
A co-worker observes my session and offers feedback about my
performance 3.25
3.32 3.26 3.42
I work on plans for program policies or activities with other staff 3.44 3.54 3.54 3.53
I observe a co-worker's session and provide feedback about their
performance 2.98
2.90 2.93
3.00
Data Source: Afterschool Teacher/Youth Worker Survey
Table 12 – Vertical Communication Scale Detailed Scores
PROMPT: Please select the response that most nearly represents how often the
following practices occur in your program (1=Never, 3=Every few months, 5=At
least weekly).
2012-2013
OK
Aggregate
(N=107)
2013-2014
OK
Aggregate
(N=86)
2014-2015
OK
Aggregate
(N=99)
2015-2016
OK
Aggregate
(N=98)
Vertical Communication 3.96 3.95 4.04 4.13
My supervisor challenges me to innovate and try new ideas 3.78 3.83 3.89 4.00 My supervisor makes sure that program goals and priorities are
clear to me 4.15
4.08 4.18
4.26
Data Source: Afterschool Teacher/Youth Worker Survey
2015-2016 Oklahoma 21st CCLC Statewide Evaluation Report Page 26
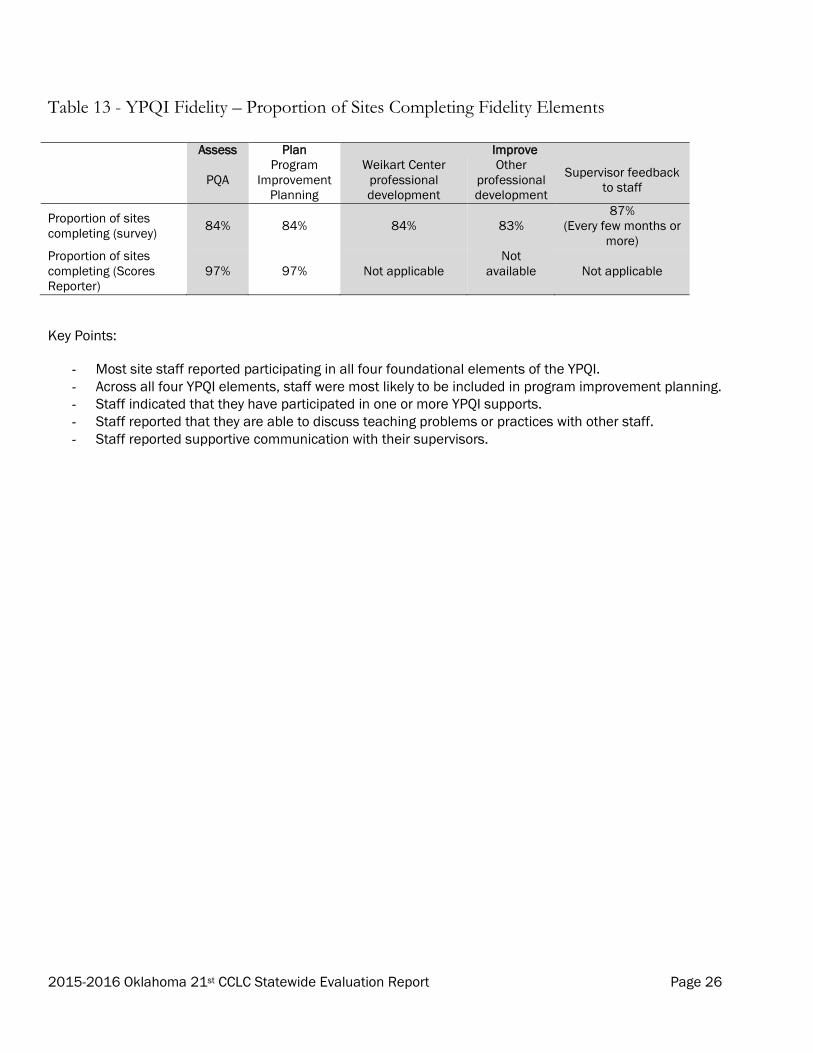
Table 13 - YPQI Fidelity – Proportion of Sites Completing Fidelity Elements
Assess Plan Improve
PQA
Program
Improvement
Planning
Weikart Center
professional
development
Other
professional
development
Supervisor feedback
to staff
Proportion of sites
completing (survey) 84% 84% 84%
83%
87%
(Every few months or
more)
Proportion of sites
completing (Scores
Reporter)
97% 97% Not applicable
Not
available Not applicable
Key Points:
- Most site staff reported participating in all four foundational elements of the YPQI.
- Across all four YPQI elements, staff were most likely to be included in program improvement planning.
- Staff indicated that they have participated in one or more YPQI supports.
- Staff reported that they are able to discuss teaching problems or practices with other staff.
- Staff reported supportive communication with their supervisors.
2015-2016 Oklahoma 21st CCLC Statewide Evaluation Report Page 27
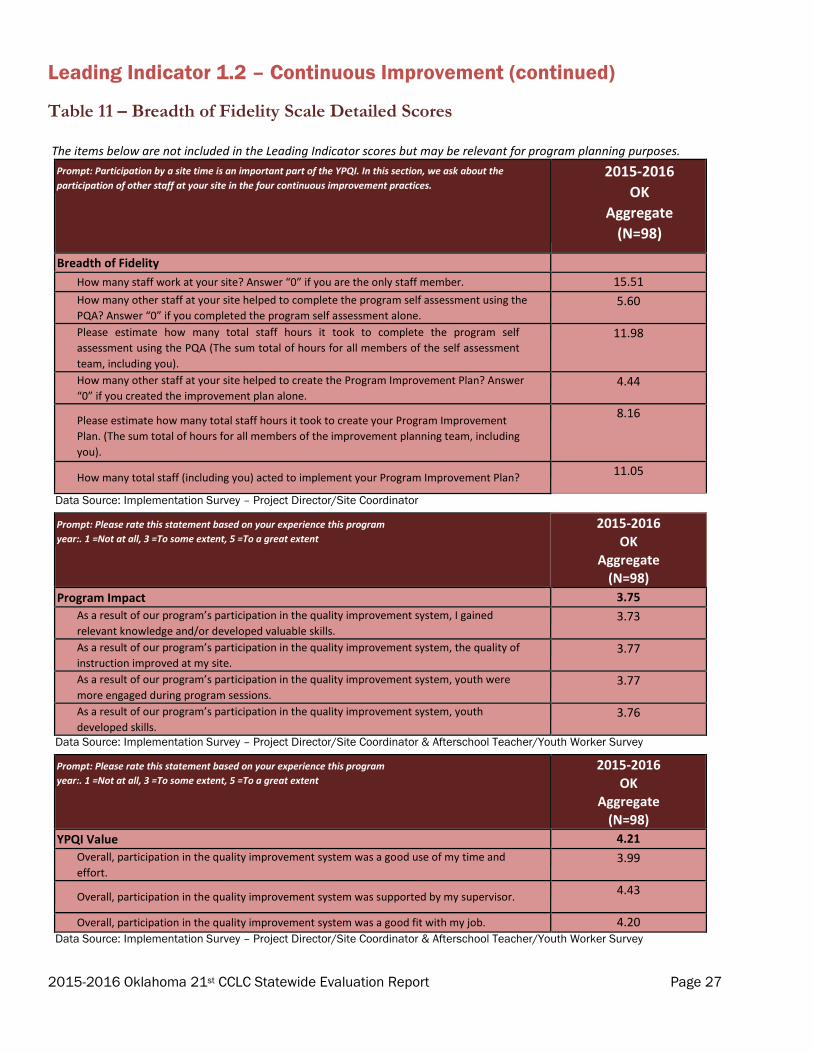
Leading Indicator 1.2 – Continuous Improvement (continued)
Table 11 – Breadth of Fidelity Scale Detailed Scores The items below are not included in the Leading Indicator scores but may be relevant for program planning purposes.
Prompt: Participation by a site time is an important part of the YPQI. In this section, we ask about the
participation of other staff at your site in the four continuous improvement practices. 2015-2016
OK
Aggregate
(N=98)
Breadth of Fidelity
How many staff work at your site? Answer “0” if you are the only staff member. 15.51
How many other staff at your site helped to complete the program self assessment using the
PQA? Answer “0” if you completed the program self assessment alone. 5.60
Please estimate how many total staff hours it took to complete the program self
assessment using the PQA (The sum total of hours for all members of the self assessment
team, including you).
11.98
How many other staff at your site helped to create the Program Improvement Plan? Answer
“0” if you created the improvement plan alone. 4.44
Please estimate how many total staff hours it took to create your Program Improvement
Plan. (The sum total of hours for all members of the improvement planning team, including
you).
8.16
How many total staff (including you) acted to implement your Program Improvement Plan? 11.05
Data Source: Implementation Survey – Project Director/Site Coordinator
Prompt: Please rate this statement based on your experience this program
year:. 1 =Not at all, 3 =To some extent, 5 =To a great extent
2015-2016 OK
Aggregate (N=98)
Program Impact 3.75
As a result of our program’s participation in the quality improvement system, I gained
relevant knowledge and/or developed valuable skills. 3.73
As a result of our program’s participation in the quality improvement system, the quality of
instruction improved at my site. 3.77
As a result of our program’s participation in the quality improvement system, youth were
more engaged during program sessions. 3.77
As a result of our program’s participation in the quality improvement system, youth
developed skills. 3.76
Data Source: Implementation Survey – Project Director/Site Coordinator & Afterschool Teacher/Youth Worker Survey
Prompt: Please rate this statement based on your experience this program
year:. 1 =Not at all, 3 =To some extent, 5 =To a great extent
2015-2016 OK
Aggregate
(N=98)
YPQI Value 4.21
Overall, participation in the quality improvement system was a good use of my time and
effort. 3.99
Overall, participation in the quality improvement system was supported by my supervisor. 4.43
Overall, participation in the quality improvement system was a good fit with my job. 4.20 Data Source: Implementation Survey – Project Director/Site Coordinator & Afterschool Teacher/Youth Worker Survey
2015-2016 Oklahoma 21st CCLC Statewide Evaluation Report Page 28
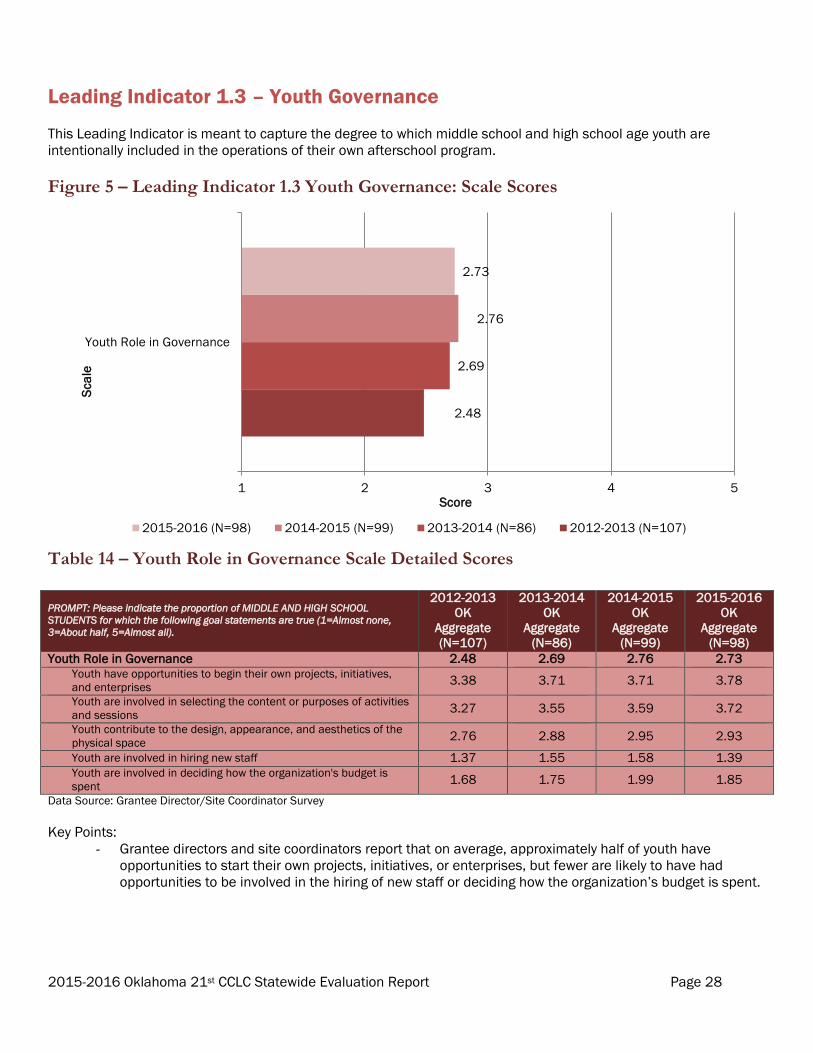
Leading Indicator 1.3 – Youth Governance
This Leading Indicator is meant to capture the degree to which middle school and high school age youth are
intentionally included in the operations of their own afterschool program.
Figure 5 – Leading Indicator 1.3 Youth Governance: Scale Scores
Table 14 – Youth Role in Governance Scale Detailed Scores
PROMPT: Please indicate the proportion of MIDDLE AND HIGH SCHOOL
STUDENTS for which the following goal statements are true (1=Almost none,
3=About half, 5=Almost all).
2012-2013
OK
Aggregate
(N=107)
2013-2014
OK
Aggregate
(N=86)
2014-2015
OK
Aggregate
(N=99)
2015-2016
OK
Aggregate
(N=98)
Youth Role in Governance 2.48 2.69 2.76 2.73 Youth have opportunities to begin their own projects, initiatives,
and enterprises 3.38
3.71 3.71
3.78
Youth are involved in selecting the content or purposes of activities
and sessions 3.27
3.55 3.59
3.72
Youth contribute to the design, appearance, and aesthetics of the
physical space 2.76
2.88 2.95
2.93
Youth are involved in hiring new staff 1.37 1.55 1.58 1.39 Youth are involved in deciding how the organization's budget is
spent 1.68
1.75 1.99
1.85
Data Source: Grantee Director/Site Coordinator Survey
Key Points:
- Grantee directors and site coordinators report that on average, approximately half of youth have
opportunities to start their own projects, initiatives, or enterprises, but fewer are likely to have had
opportunities to be involved in the hiring of new staff or deciding how the organization’s budget is spent.
2.48
2.69
2.76
2.73
1 2 3 4 5
Youth Role in Governance
Score
Sca
le
2015-2016 (N=98) 2014-2015 (N=99) 2013-2014 (N=86) 2012-2013 (N=107)
2015-2016 Oklahoma 21st CCLC Statewide Evaluation Report Page 29
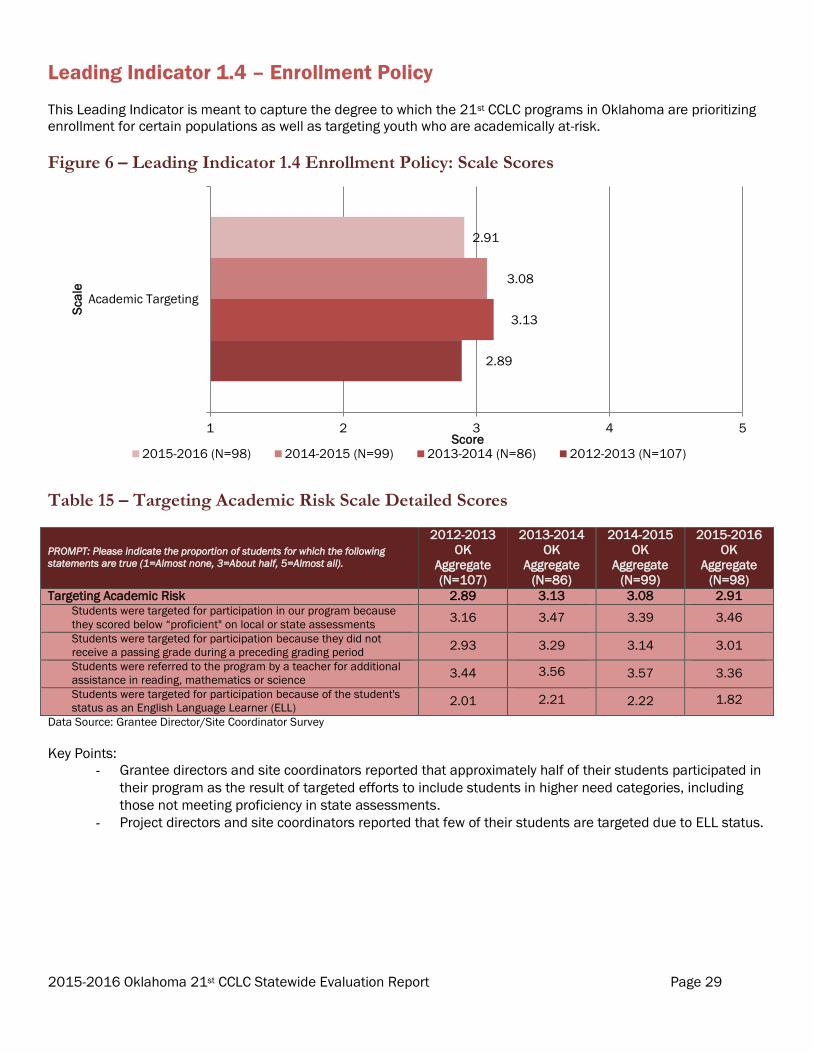
Leading Indicator 1.4 – Enrollment Policy
This Leading Indicator is meant to capture the degree to which the 21st CCLC programs in Oklahoma are prioritizing
enrollment for certain populations as well as targeting youth who are academically at-risk.
Figure 6 – Leading Indicator 1.4 Enrollment Policy: Scale Scores
Table 15 – Targeting Academic Risk Scale Detailed Scores
PROMPT: Please indicate the proportion of students for which the following
statements are true (1=Almost none, 3=About half, 5=Almost all).
2012-2013
OK
Aggregate
(N=107)
2013-2014
OK
Aggregate
(N=86)
2014-2015
OK
Aggregate
(N=99)
2015-2016
OK
Aggregate
(N=98)
Targeting Academic Risk 2.89 3.13 3.08 2.91 Students were targeted for participation in our program because
they scored below “proficient" on local or state assessments 3.16
3.47 3.39
3.46
Students were targeted for participation because they did not
receive a passing grade during a preceding grading period 2.93
3.29 3.14
3.01
Students were referred to the program by a teacher for additional
assistance in reading, mathematics or science 3.44
3.56 3.57
3.36
Students were targeted for participation because of the student's
status as an English Language Learner (ELL) 2.01
2.21 2.22
1.82
Data Source: Grantee Director/Site Coordinator Survey
Key Points:
- Grantee directors and site coordinators reported that approximately half of their students participated in
their program as the result of targeted efforts to include students in higher need categories, including
those not meeting proficiency in state assessments.
- Project directors and site coordinators reported that few of their students are targeted due to ELL status.
2.89
3.13
3.08
2.91
1 2 3 4 5
Academic Targeting
Score
Sca
le
2015-2016 (N=98) 2014-2015 (N=99) 2013-2014 (N=86) 2012-2013 (N=107)
2015-2016 Oklahoma 21st CCLC Statewide Evaluation Report Page 30
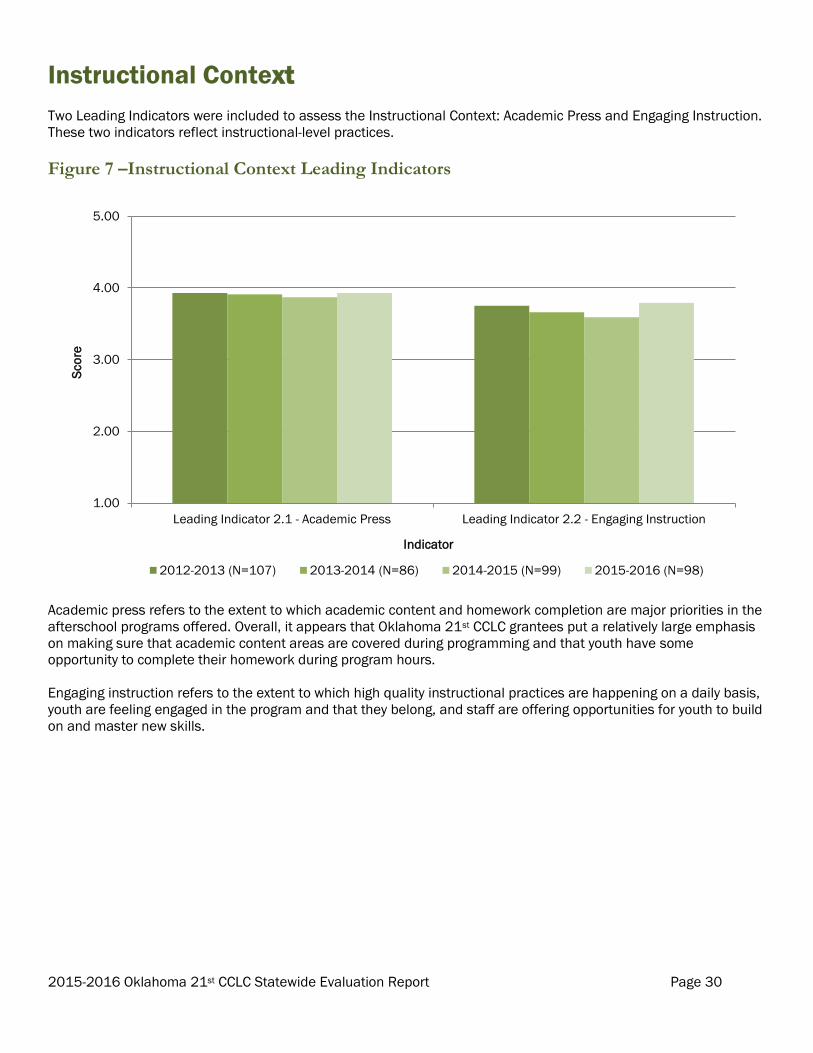
Instructional Context
Two Leading Indicators were included to assess the Instructional Context: Academic Press and Engaging Instruction.
These two indicators reflect instructional-level practices.
Figure 7 –Instructional Context Leading Indicators
Academic press refers to the extent to which academic content and homework completion are major priorities in the
afterschool programs offered. Overall, it appears that Oklahoma 21st CCLC grantees put a relatively large emphasis
on making sure that academic content areas are covered during programming and that youth have some
opportunity to complete their homework during program hours.
Engaging instruction refers to the extent to which high quality instructional practices are happening on a daily basis,
youth are feeling engaged in the program and that they belong, and staff are offering opportunities for youth to build
on and master new skills.
1.00
2.00
3.00
4.00
5.00
Leading Indicator 2.1 - Academic Press Leading Indicator 2.2 - Engaging Instruction
Sco
re
Indicator
2012-2013 (N=107) 2013-2014 (N=86) 2014-2015 (N=99) 2015-2016 (N=98)
2015-2016 Oklahoma 21st CCLC Statewide Evaluation Report Page 31
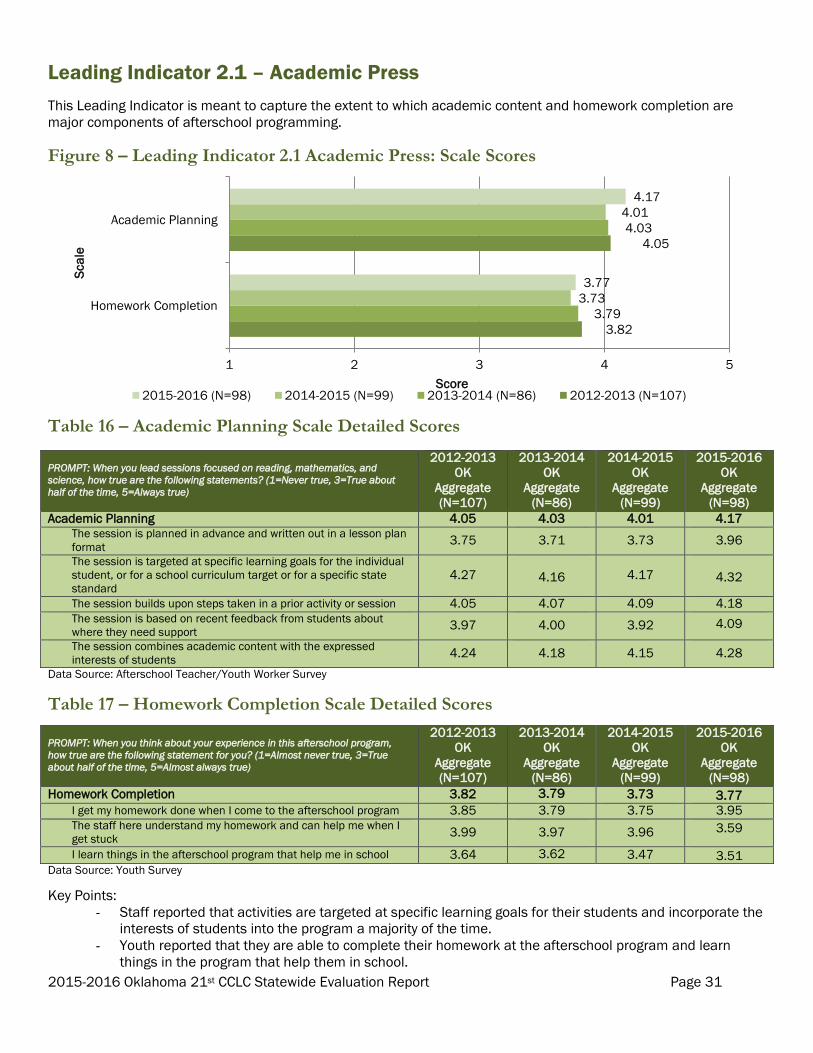
Leading Indicator 2.1 – Academic Press
This Leading Indicator is meant to capture the extent to which academic content and homework completion are
major components of afterschool programming.
Figure 8 – Leading Indicator 2.1 Academic Press: Scale Scores
Table 16 – Academic Planning Scale Detailed Scores
PROMPT: When you lead sessions focused on reading, mathematics, and
science, how true are the following statements? (1=Never true, 3=True about
half of the time, 5=Always true)
2012-2013
OK
Aggregate
(N=107)
2013-2014
OK
Aggregate
(N=86)
2014-2015
OK
Aggregate
(N=99)
2015-2016
OK
Aggregate
(N=98)
Academic Planning 4.05 4.03 4.01 4.17 The session is planned in advance and written out in a lesson plan
format 3.75
3.71 3.73
3.96
The session is targeted at specific learning goals for the individual
student, or for a school curriculum target or for a specific state
standard 4.27
4.16 4.17
4.32
The session builds upon steps taken in a prior activity or session 4.05 4.07 4.09 4.18 The session is based on recent feedback from students about
where they need support 3.97
4.00 3.92
4.09
The session combines academic content with the expressed
interests of students 4.24
4.18 4.15
4.28
Data Source: Afterschool Teacher/Youth Worker Survey
Table 17 – Homework Completion Scale Detailed Scores
PROMPT: When you think about your experience in this afterschool program,
how true are the following statement for you? (1=Almost never true, 3=True
about half of the time, 5=Almost always true)
2012-2013
OK
Aggregate
(N=107)
2013-2014
OK
Aggregate
(N=86)
2014-2015
OK
Aggregate
(N=99)
2015-2016
OK
Aggregate
(N=98)
Homework Completion 3.82 3.79 3.73 3.77 I get my homework done when I come to the afterschool program 3.85 3.79 3.75 3.95 The staff here understand my homework and can help me when I
get stuck 3.99
3.97 3.96 3.59
I learn things in the afterschool program that help me in school 3.64 3.62 3.47 3.51 Data Source: Youth Survey
Key Points:
- Staff reported that activities are targeted at specific learning goals for their students and incorporate the
interests of students into the program a majority of the time.
- Youth reported that they are able to complete their homework at the afterschool program and learn
things in the program that help them in school.
3.82
4.05
3.79
4.03
3.73
4.01
3.77
4.17
1 2 3 4 5
Homework Completion
Academic Planning
Score
Sca
le
2015-2016 (N=98) 2014-2015 (N=99) 2013-2014 (N=86) 2012-2013 (N=107)
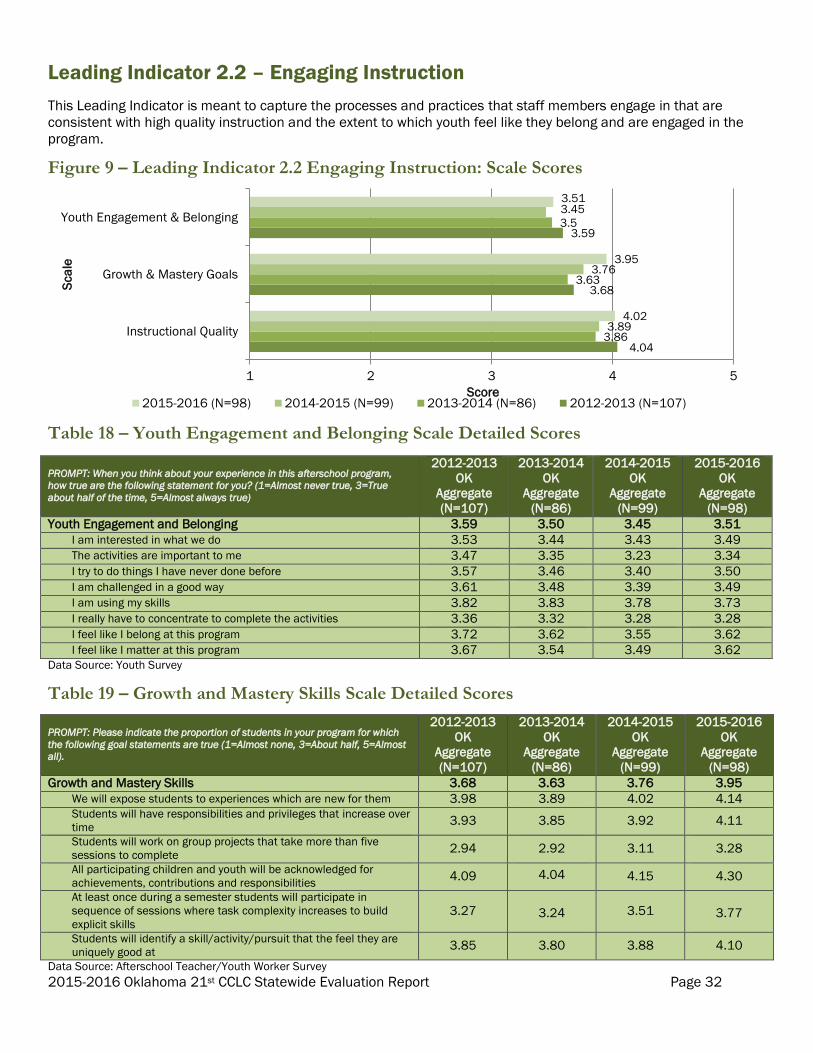
2015-2016 Oklahoma 21st CCLC Statewide Evaluation Report Page 32
Leading Indicator 2.2 – Engaging Instruction
This Leading Indicator is meant to capture the processes and practices that staff members engage in that are
consistent with high quality instruction and the extent to which youth feel like they belong and are engaged in the
program.
Figure 9 – Leading Indicator 2.2 Engaging Instruction: Scale Scores
Table 18 – Youth Engagement and Belonging Scale Detailed Scores
PROMPT: When you think about your experience in this afterschool program,
how true are the following statement for you? (1=Almost never true, 3=True
about half of the time, 5=Almost always true)
2012-2013
OK
Aggregate
(N=107)
2013-2014
OK
Aggregate
(N=86)
2014-2015
OK
Aggregate
(N=99)
2015-2016
OK
Aggregate
(N=98)
Youth Engagement and Belonging 3.59 3.50 3.45 3.51
I am interested in what we do 3.53 3.44 3.43 3.49
The activities are important to me 3.47 3.35 3.23 3.34
I try to do things I have never done before 3.57 3.46 3.40 3.50
I am challenged in a good way 3.61 3.48 3.39 3.49
I am using my skills 3.82 3.83 3.78 3.73
I really have to concentrate to complete the activities 3.36 3.32 3.28 3.28
I feel like I belong at this program 3.72 3.62 3.55 3.62
I feel like I matter at this program 3.67 3.54 3.49 3.62 Data Source: Youth Survey
Table 19 – Growth and Mastery Skills Scale Detailed Scores
PROMPT: Please indicate the proportion of students in your program for which
the following goal statements are true (1=Almost none, 3=About half, 5=Almost
all).
2012-2013
OK
Aggregate
(N=107)
2013-2014
OK
Aggregate
(N=86)
2014-2015
OK
Aggregate
(N=99)
2015-2016
OK
Aggregate
(N=98)
Growth and Mastery Skills 3.68 3.63 3.76 3.95
We will expose students to experiences which are new for them 3.98 3.89 4.02 4.14 Students will have responsibilities and privileges that increase over
time 3.93
3.85 3.92
4.11
Students will work on group projects that take more than five
sessions to complete 2.94
2.92 3.11
3.28
All participating children and youth will be acknowledged for
achievements, contributions and responsibilities 4.09
4.04 4.15
4.30
At least once during a semester students will participate in
sequence of sessions where task complexity increases to build
explicit skills 3.27
3.24 3.51
3.77
Students will identify a skill/activity/pursuit that the feel they are
uniquely good at 3.85
3.80 3.88
4.10
Data Source: Afterschool Teacher/Youth Worker Survey
4.04
3.68
3.59
3.86
3.63
3.5
3.89
3.76
3.45
4.02
3.95
3.51
1 2 3 4 5
Instructional Quality
Growth & Mastery Goals
Youth Engagement & Belonging
Score
Sca
le
2015-2016 (N=98) 2014-2015 (N=99) 2013-2014 (N=86) 2012-2013 (N=107)
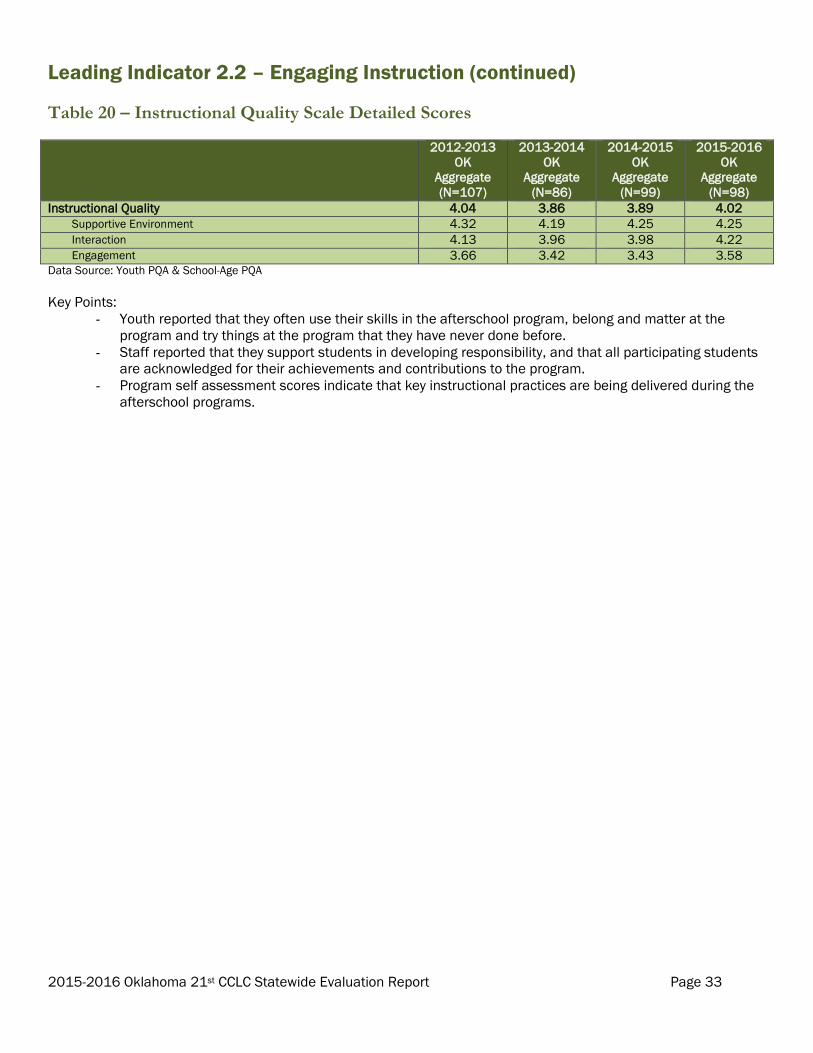
2015-2016 Oklahoma 21st CCLC Statewide Evaluation Report Page 33
Leading Indicator 2.2 – Engaging Instruction (continued)
Table 20 – Instructional Quality Scale Detailed Scores
2012-2013
OK
Aggregate
(N=107)
2013-2014
OK
Aggregate
(N=86)
2014-2015
OK
Aggregate
(N=99)
2015-2016
OK
Aggregate
(N=98)
Instructional Quality 4.04 3.86 3.89 4.02
Supportive Environment 4.32 4.19 4.25 4.25
Interaction 4.13 3.96 3.98 4.22
Engagement 3.66 3.42 3.43 3.58 Data Source: Youth PQA & School-Age PQA
Key Points:
- Youth reported that they often use their skills in the afterschool program, belong and matter at the
program and try things at the program that they have never done before.
- Staff reported that they support students in developing responsibility, and that all participating students
are acknowledged for their achievements and contributions to the program.
- Program self assessment scores indicate that key instructional practices are being delivered during the
afterschool programs.
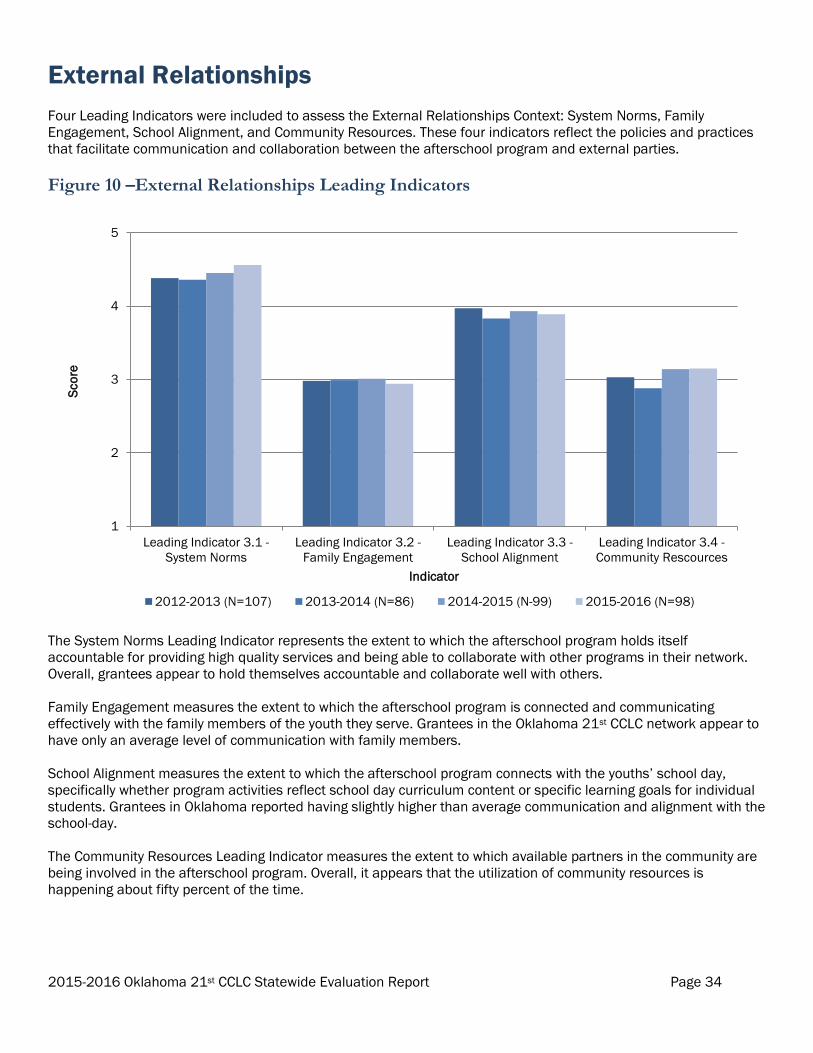
2015-2016 Oklahoma 21st CCLC Statewide Evaluation Report Page 34
External Relationships
Four Leading Indicators were included to assess the External Relationships Context: System Norms, Family
Engagement, School Alignment, and Community Resources. These four indicators reflect the policies and practices
that facilitate communication and collaboration between the afterschool program and external parties.
Figure 10 –External Relationships Leading Indicators
The System Norms Leading Indicator represents the extent to which the afterschool program holds itself
accountable for providing high quality services and being able to collaborate with other programs in their network.
Overall, grantees appear to hold themselves accountable and collaborate well with others.
Family Engagement measures the extent to which the afterschool program is connected and communicating
effectively with the family members of the youth they serve. Grantees in the Oklahoma 21st CCLC network appear to
have only an average level of communication with family members.
School Alignment measures the extent to which the afterschool program connects with the youths’ school day,
specifically whether program activities reflect school day curriculum content or specific learning goals for individual
students. Grantees in Oklahoma reported having slightly higher than average communication and alignment with the
school-day.
The Community Resources Leading Indicator measures the extent to which available partners in the community are
being involved in the afterschool program. Overall, it appears that the utilization of community resources is
happening about fifty percent of the time.
1
2
3
4
5
Leading Indicator 3.1 -
System Norms
Leading Indicator 3.2 -
Family Engagement
Leading Indicator 3.3 -
School Alignment
Leading Indicator 3.4 -
Community Rescources
Sco
re
Indicator
2012-2013 (N=107) 2013-2014 (N=86) 2014-2015 (N-99) 2015-2016 (N=98)
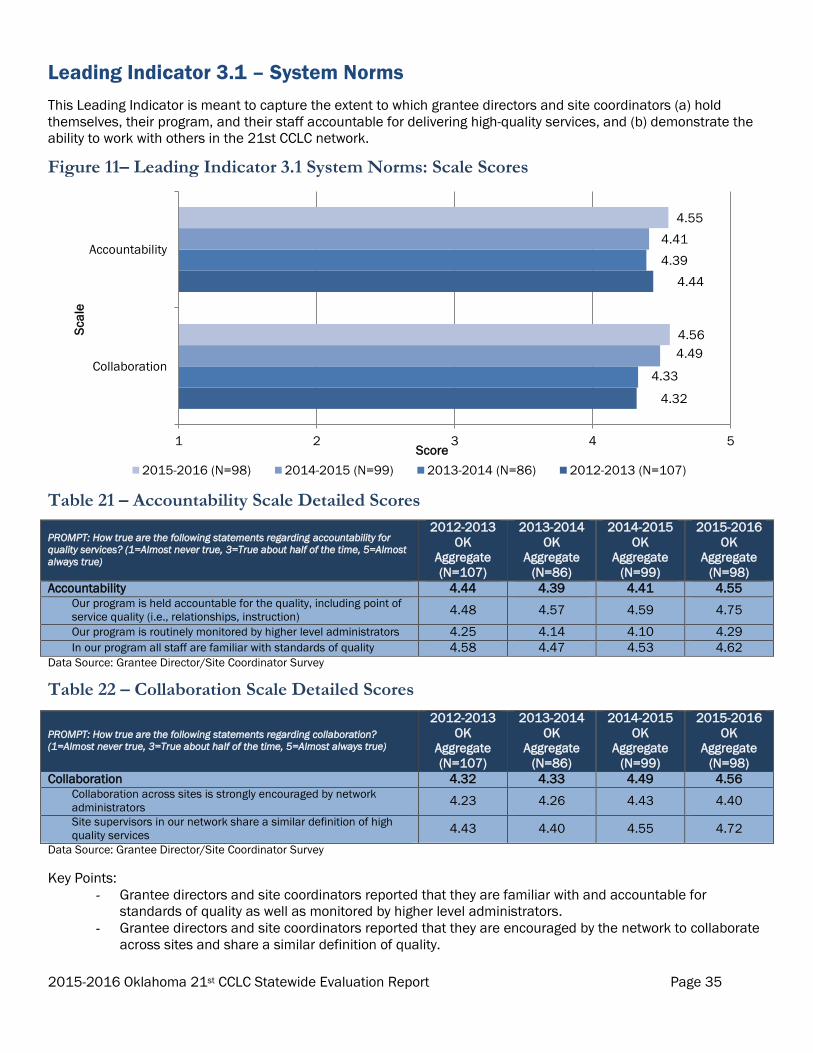
2015-2016 Oklahoma 21st CCLC Statewide Evaluation Report Page 35
Leading Indicator 3.1 – System Norms
This Leading Indicator is meant to capture the extent to which grantee directors and site coordinators (a) hold
themselves, their program, and their staff accountable for delivering high-quality services, and (b) demonstrate the
ability to work with others in the 21st CCLC network.
Figure 11– Leading Indicator 3.1 System Norms: Scale Scores
Table 21 – Accountability Scale Detailed Scores
PROMPT: How true are the following statements regarding accountability for
quality services? (1=Almost never true, 3=True about half of the time, 5=Almost
always true)
2012-2013
OK
Aggregate
(N=107)
2013-2014
OK
Aggregate
(N=86)
2014-2015
OK
Aggregate
(N=99)
2015-2016
OK
Aggregate
(N=98)
Accountability 4.44 4.39 4.41 4.55 Our program is held accountable for the quality, including point of
service quality (i.e., relationships, instruction) 4.48
4.57 4.59
4.75
Our program is routinely monitored by higher level administrators 4.25 4.14 4.10 4.29
In our program all staff are familiar with standards of quality 4.58 4.47 4.53 4.62 Data Source: Grantee Director/Site Coordinator Survey
Table 22 – Collaboration Scale Detailed Scores
PROMPT: How true are the following statements regarding collaboration?
(1=Almost never true, 3=True about half of the time, 5=Almost always true)
2012-2013
OK
Aggregate
(N=107)
2013-2014
OK
Aggregate
(N=86)
2014-2015
OK
Aggregate
(N=99)
2015-2016
OK
Aggregate
(N=98)
Collaboration 4.32 4.33 4.49 4.56 Collaboration across sites is strongly encouraged by network
administrators 4.23
4.26 4.43
4.40
Site supervisors in our network share a similar definition of high
quality services 4.43
4.40 4.55
4.72
Data Source: Grantee Director/Site Coordinator Survey
Key Points:
- Grantee directors and site coordinators reported that they are familiar with and accountable for
standards of quality as well as monitored by higher level administrators.
- Grantee directors and site coordinators reported that they are encouraged by the network to collaborate
across sites and share a similar definition of quality.
4.32
4.44
4.33
4.39
4.49
4.41
4.56
4.55
1 2 3 4 5
Collaboration
Accountability
Score
Sca
le
2015-2016 (N=98) 2014-2015 (N=99) 2013-2014 (N=86) 2012-2013 (N=107)
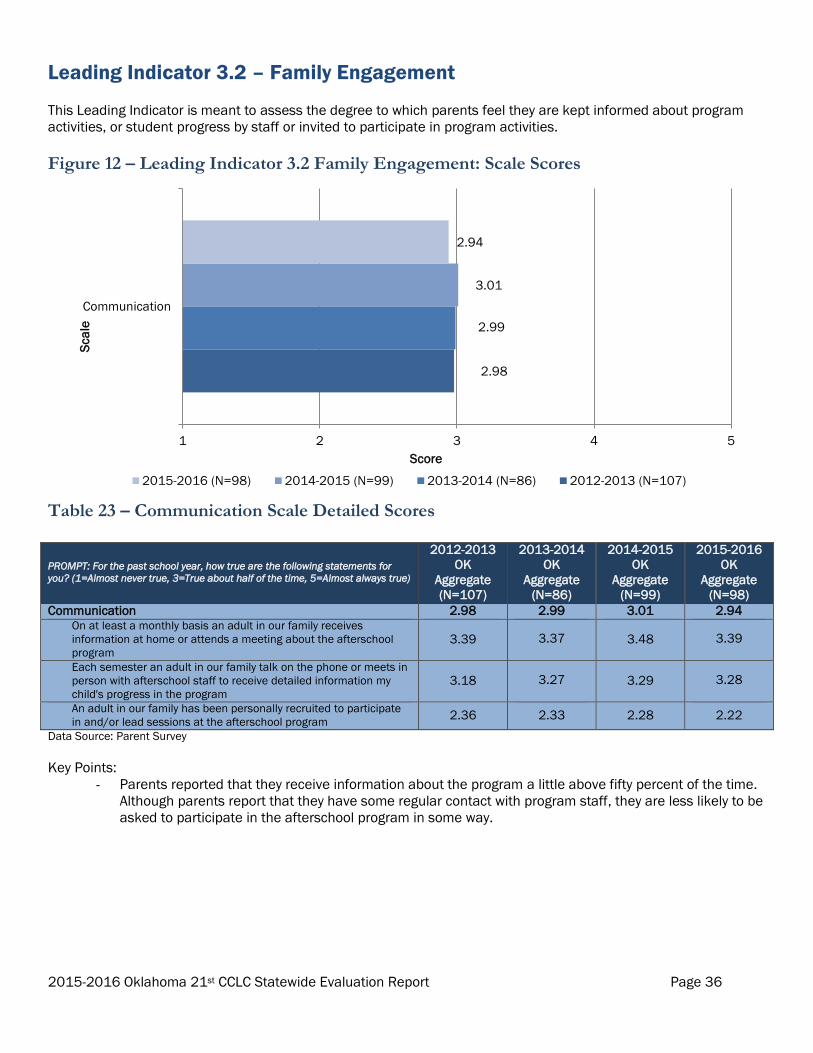
2015-2016 Oklahoma 21st CCLC Statewide Evaluation Report Page 36
Leading Indicator 3.2 – Family Engagement This Leading Indicator is meant to assess the degree to which parents feel they are kept informed about program
activities, or student progress by staff or invited to participate in program activities.
Figure 12 – Leading Indicator 3.2 Family Engagement: Scale Scores
Table 23 – Communication Scale Detailed Scores
PROMPT: For the past school year, how true are the following statements for
you? (1=Almost never true, 3=True about half of the time, 5=Almost always true)
2012-2013
OK
Aggregate
(N=107)
2013-2014
OK
Aggregate
(N=86)
2014-2015
OK
Aggregate
(N=99)
2015-2016
OK
Aggregate
(N=98)
Communication 2.98 2.99 3.01 2.94 On at least a monthly basis an adult in our family receives
information at home or attends a meeting about the afterschool
program 3.39
3.37 3.48
3.39
Each semester an adult in our family talk on the phone or meets in
person with afterschool staff to receive detailed information my
child's progress in the program 3.18
3.27 3.29
3.28
An adult in our family has been personally recruited to participate
in and/or lead sessions at the afterschool program 2.36
2.33 2.28
2.22
Data Source: Parent Survey
Key Points:
- Parents reported that they receive information about the program a little above fifty percent of the time.
Although parents report that they have some regular contact with program staff, they are less likely to be
asked to participate in the afterschool program in some way.
2.98
2.99
3.01
2.94
1 2 3 4 5
Communication
Score
Sca
le
2015-2016 (N=98) 2014-2015 (N=99) 2013-2014 (N=86) 2012-2013 (N=107)
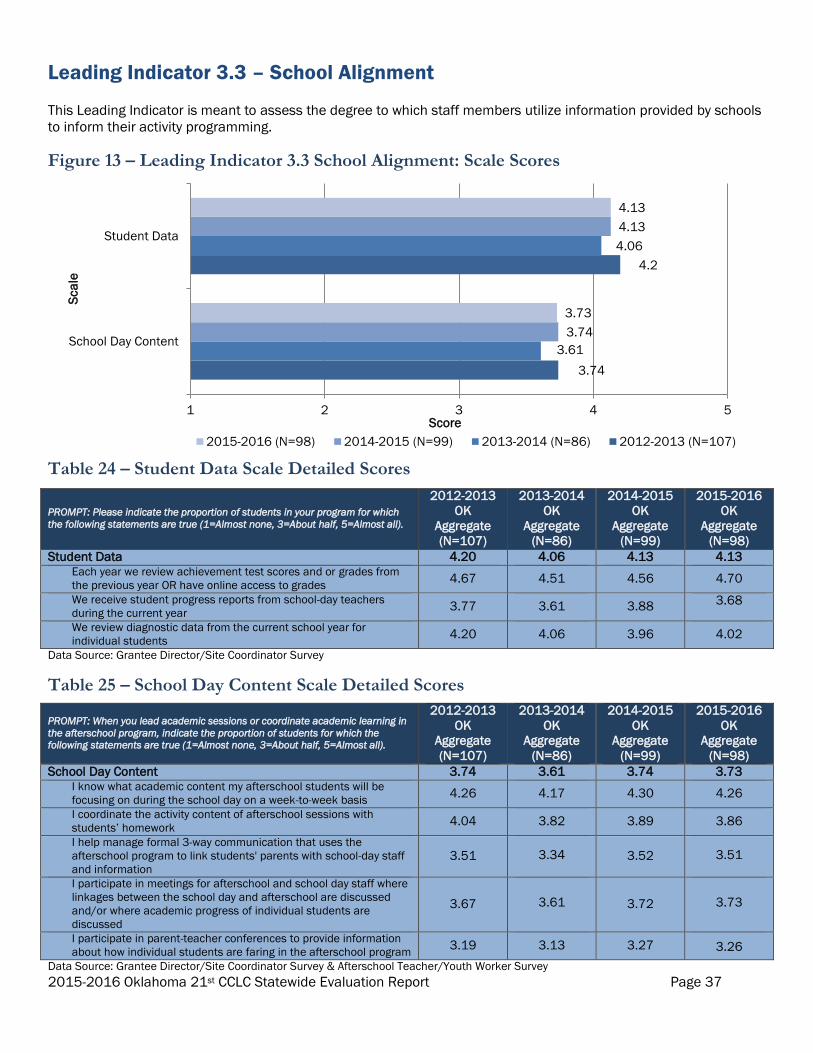
2015-2016 Oklahoma 21st CCLC Statewide Evaluation Report Page 37
Leading Indicator 3.3 – School Alignment This Leading Indicator is meant to assess the degree to which staff members utilize information provided by schools
to inform their activity programming.
Figure 13 – Leading Indicator 3.3 School Alignment: Scale Scores
Table 24 – Student Data Scale Detailed Scores
PROMPT: Please indicate the proportion of students in your program for which
the following statements are true (1=Almost none, 3=About half, 5=Almost all).
2012-2013
OK
Aggregate
(N=107)
2013-2014
OK
Aggregate
(N=86)
2014-2015
OK
Aggregate
(N=99)
2015-2016
OK
Aggregate
(N=98)
Student Data 4.20 4.06 4.13 4.13 Each year we review achievement test scores and or grades from
the previous year OR have online access to grades 4.67
4.51 4.56
4.70
We receive student progress reports from school-day teachers
during the current year 3.77
3.61 3.88 3.68
We review diagnostic data from the current school year for
individual students 4.20
4.06 3.96
4.02
Data Source: Grantee Director/Site Coordinator Survey
Table 25 – School Day Content Scale Detailed Scores
PROMPT: When you lead academic sessions or coordinate academic learning in
the afterschool program, indicate the proportion of students for which the
following statements are true (1=Almost none, 3=About half, 5=Almost all).
2012-2013
OK
Aggregate
(N=107)
2013-2014
OK
Aggregate
(N=86)
2014-2015
OK
Aggregate
(N=99)
2015-2016
OK
Aggregate
(N=98)
School Day Content 3.74 3.61 3.74 3.73 I know what academic content my afterschool students will be
focusing on during the school day on a week-to-week basis 4.26
4.17 4.30
4.26
I coordinate the activity content of afterschool sessions with
students’ homework 4.04
3.82 3.89
3.86
I help manage formal 3-way communication that uses the
afterschool program to link students' parents with school-day staff
and information 3.51
3.34 3.52
3.51
I participate in meetings for afterschool and school day staff where
linkages between the school day and afterschool are discussed
and/or where academic progress of individual students are
discussed
3.67
3.61 3.72
3.73
I participate in parent-teacher conferences to provide information
about how individual students are faring in the afterschool program 3.19
3.13 3.27
3.26
Data Source: Grantee Director/Site Coordinator Survey & Afterschool Teacher/Youth Worker Survey
3.74
4.2
3.61
4.06
3.74
4.13
3.73
4.13
1 2 3 4 5
School Day Content
Student Data
Score
Sca
le
2015-2016 (N=98) 2014-2015 (N=99) 2013-2014 (N=86) 2012-2013 (N=107)
2015-2016 Oklahoma 21st CCLC Statewide Evaluation Report Page 38
Key Points:
- Grantee directors and site coordinators reported that they review achievement test scores on a yearly
basis but are less likely to review student progress reports.
- Grantee directors and site coordinators reported that they know what academic content their students
are covering during the school day but are less likely to participate in parent-teacher conferences to
provide information on individual students’ progress in the afterschool program.
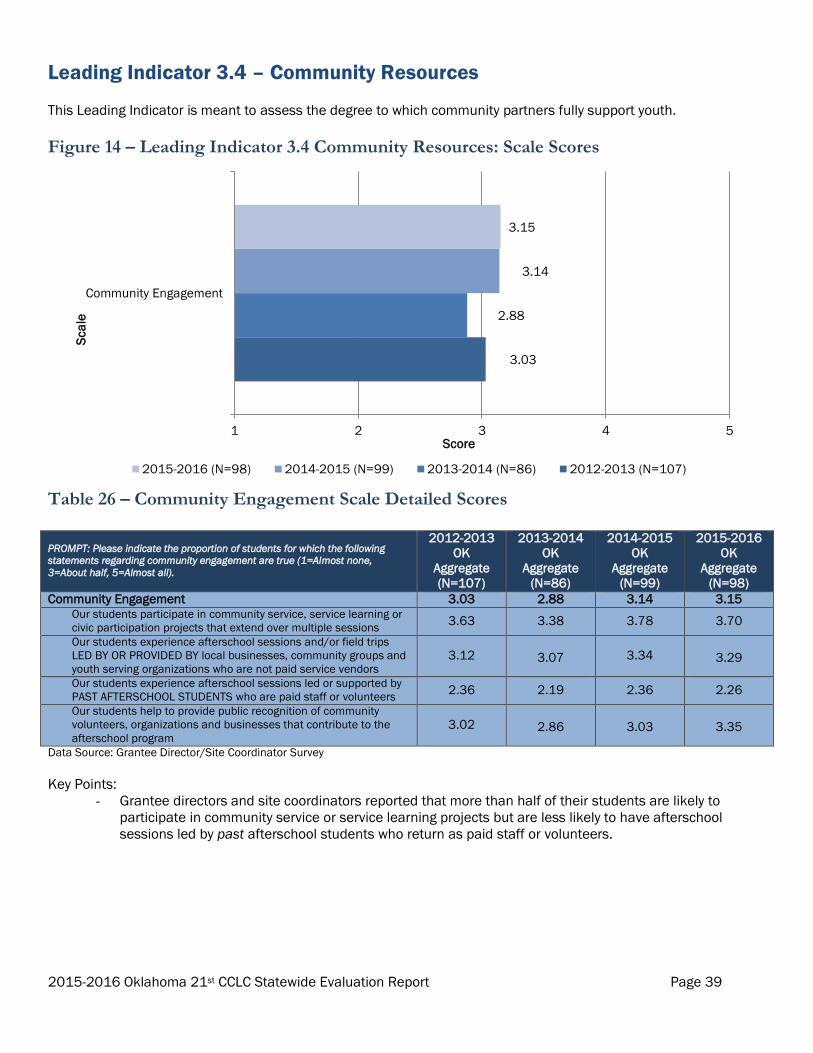
2015-2016 Oklahoma 21st CCLC Statewide Evaluation Report Page 39
Leading Indicator 3.4 – Community Resources This Leading Indicator is meant to assess the degree to which community partners fully support youth.
Figure 14 – Leading Indicator 3.4 Community Resources: Scale Scores
Table 26 – Community Engagement Scale Detailed Scores
PROMPT: Please indicate the proportion of students for which the following
statements regarding community engagement are true (1=Almost none,
3=About half, 5=Almost all).
2012-2013
OK
Aggregate
(N=107)
2013-2014
OK
Aggregate
(N=86)
2014-2015
OK
Aggregate
(N=99)
2015-2016
OK
Aggregate
(N=98)
Community Engagement 3.03 2.88 3.14 3.15 Our students participate in community service, service learning or
civic participation projects that extend over multiple sessions 3.63
3.38 3.78
3.70
Our students experience afterschool sessions and/or field trips
LED BY OR PROVIDED BY local businesses, community groups and
youth serving organizations who are not paid service vendors 3.12
3.07 3.34
3.29
Our students experience afterschool sessions led or supported by
PAST AFTERSCHOOL STUDENTS who are paid staff or volunteers 2.36
2.19 2.36
2.26
Our students help to provide public recognition of community
volunteers, organizations and businesses that contribute to the
afterschool program 3.02
2.86
3.03
3.35
Data Source: Grantee Director/Site Coordinator Survey
Key Points:
- Grantee directors and site coordinators reported that more than half of their students are likely to
participate in community service or service learning projects but are less likely to have afterschool
sessions led by past afterschool students who return as paid staff or volunteers.
3.03
2.88
3.14
3.15
1 2 3 4 5
Community Engagement
Score
Sca
le
2015-2016 (N=98) 2014-2015 (N=99) 2013-2014 (N=86) 2012-2013 (N=107)
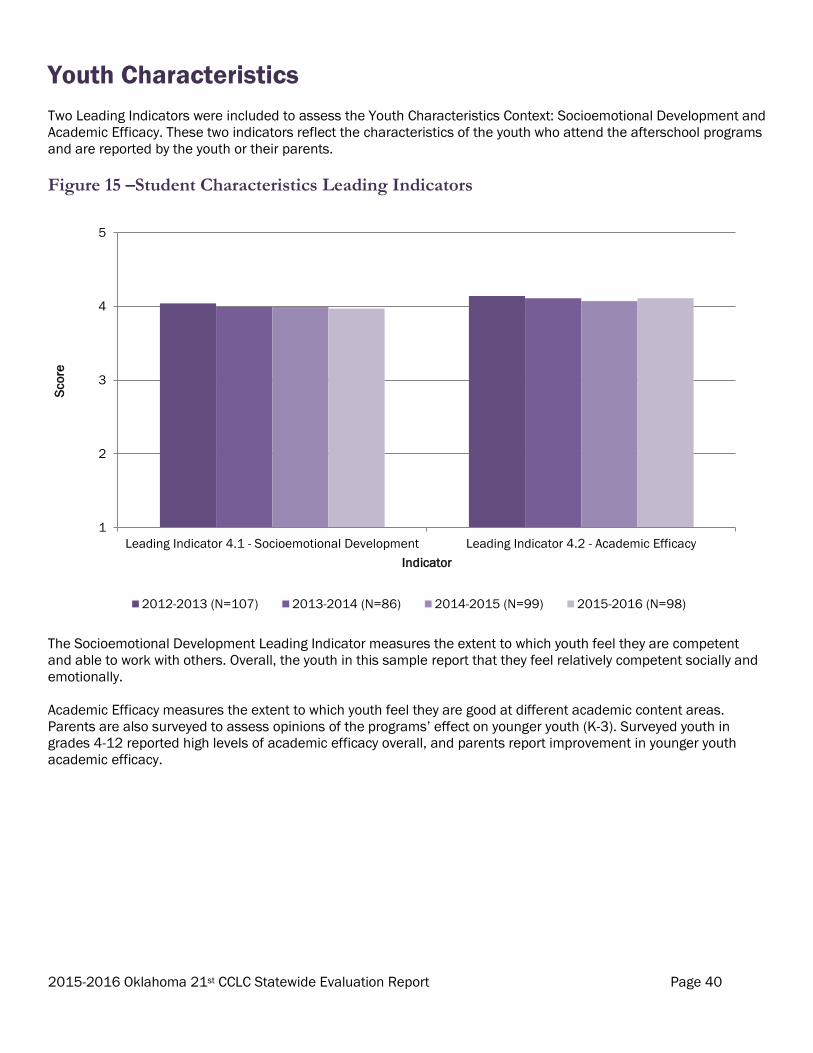
2015-2016 Oklahoma 21st CCLC Statewide Evaluation Report Page 40
Youth Characteristics
Two Leading Indicators were included to assess the Youth Characteristics Context: Socioemotional Development and
Academic Efficacy. These two indicators reflect the characteristics of the youth who attend the afterschool programs
and are reported by the youth or their parents.
Figure 15 –Student Characteristics Leading Indicators
The Socioemotional Development Leading Indicator measures the extent to which youth feel they are competent
and able to work with others. Overall, the youth in this sample report that they feel relatively competent socially and
emotionally.
Academic Efficacy measures the extent to which youth feel they are good at different academic content areas.
Parents are also surveyed to assess opinions of the programs’ effect on younger youth (K-3). Surveyed youth in
grades 4-12 reported high levels of academic efficacy overall, and parents report improvement in younger youth
academic efficacy.
1
2
3
4
5
Leading Indicator 4.1 - Socioemotional Development Leading Indicator 4.2 - Academic Efficacy
Sco
re
Indicator
2012-2013 (N=107) 2013-2014 (N=86) 2014-2015 (N=99) 2015-2016 (N=98)
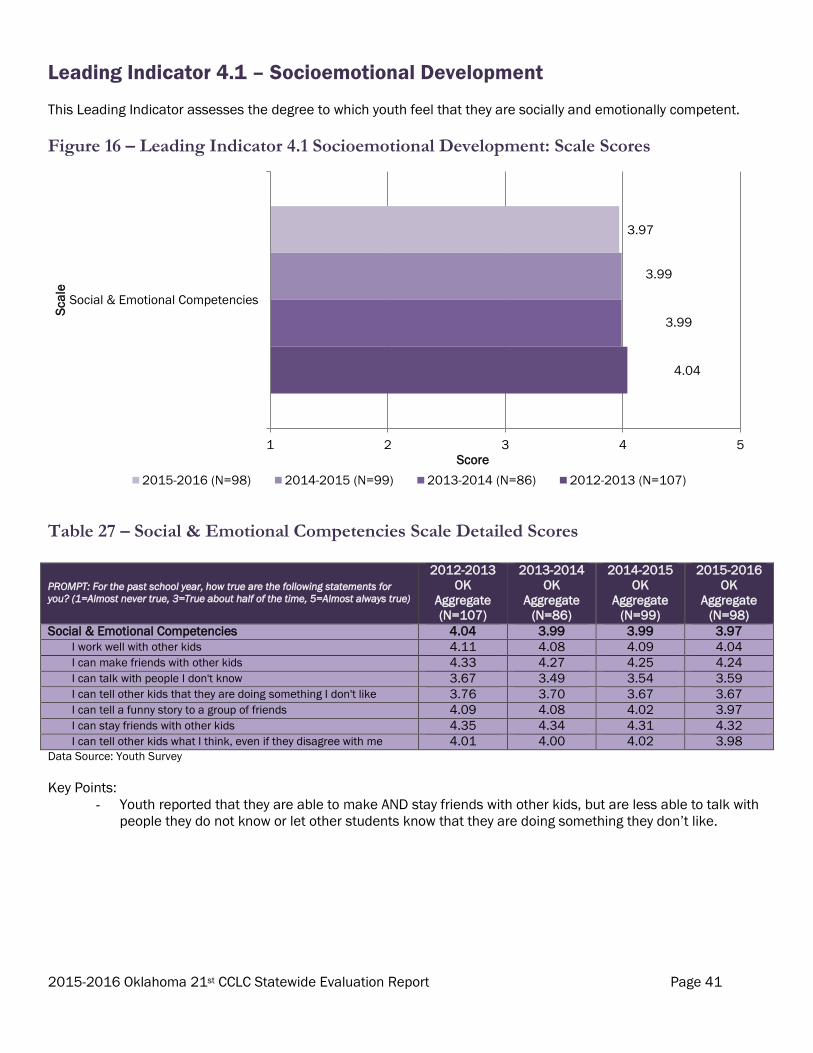
2015-2016 Oklahoma 21st CCLC Statewide Evaluation Report Page 41
Leading Indicator 4.1 – Socioemotional Development
This Leading Indicator assesses the degree to which youth feel that they are socially and emotionally competent.
Figure 16 – Leading Indicator 4.1 Socioemotional Development: Scale Scores
Table 27 – Social & Emotional Competencies Scale Detailed Scores
PROMPT: For the past school year, how true are the following statements for
you? (1=Almost never true, 3=True about half of the time, 5=Almost always true)
2012-2013
OK
Aggregate
(N=107)
2013-2014
OK
Aggregate
(N=86)
2014-2015
OK
Aggregate
(N=99)
2015-2016
OK
Aggregate
(N=98)
Social & Emotional Competencies 4.04 3.99 3.99 3.97
I work well with other kids 4.11 4.08 4.09 4.04
I can make friends with other kids 4.33 4.27 4.25 4.24
I can talk with people I don't know 3.67 3.49 3.54 3.59
I can tell other kids that they are doing something I don't like 3.76 3.70 3.67 3.67
I can tell a funny story to a group of friends 4.09 4.08 4.02 3.97
I can stay friends with other kids 4.35 4.34 4.31 4.32
I can tell other kids what I think, even if they disagree with me 4.01 4.00 4.02 3.98 Data Source: Youth Survey
Key Points:
- Youth reported that they are able to make AND stay friends with other kids, but are less able to talk with
people they do not know or let other students know that they are doing something they don’t like.
4.04
3.99
3.99
3.97
1 2 3 4 5
Social & Emotional Competencies
Score
Sca
le
2015-2016 (N=98) 2014-2015 (N=99) 2013-2014 (N=86) 2012-2013 (N=107)
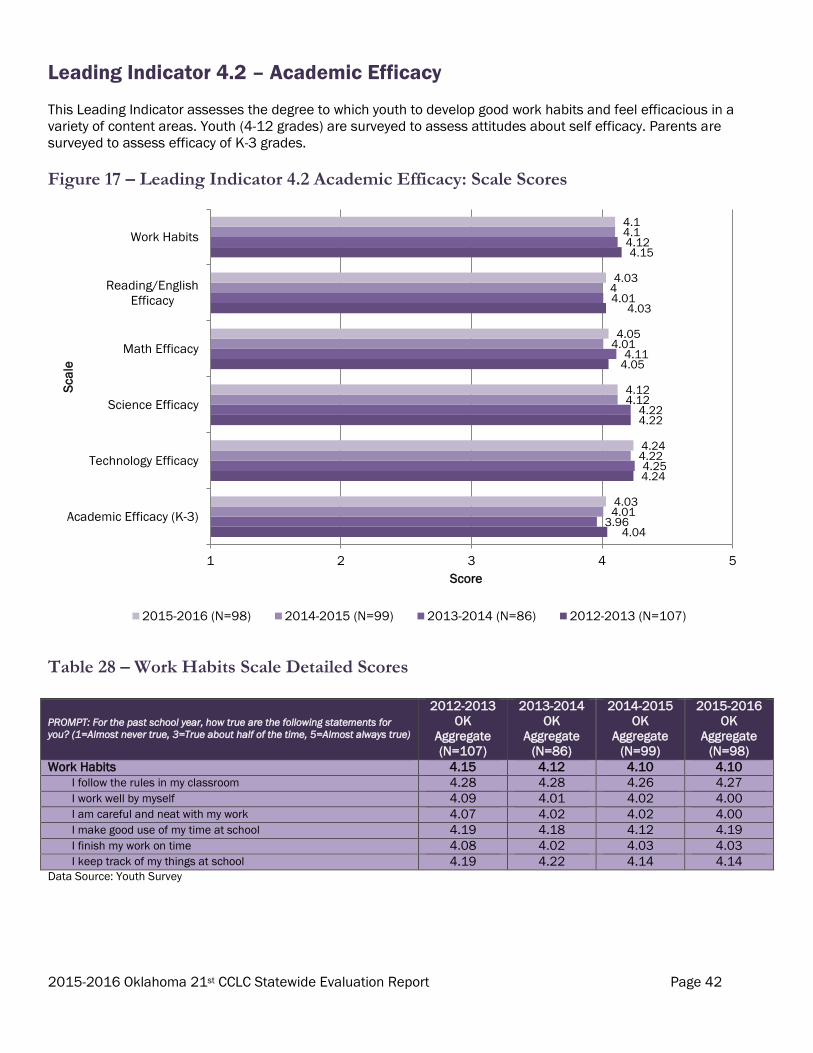
2015-2016 Oklahoma 21st CCLC Statewide Evaluation Report Page 42
Leading Indicator 4.2 – Academic Efficacy
This Leading Indicator assesses the degree to which youth to develop good work habits and feel efficacious in a
variety of content areas. Youth (4-12 grades) are surveyed to assess attitudes about self efficacy. Parents are
surveyed to assess efficacy of K-3 grades.
Figure 17 – Leading Indicator 4.2 Academic Efficacy: Scale Scores
Table 28 – Work Habits Scale Detailed Scores
PROMPT: For the past school year, how true are the following statements for
you? (1=Almost never true, 3=True about half of the time, 5=Almost always true)
2012-2013
OK
Aggregate
(N=107)
2013-2014
OK
Aggregate
(N=86)
2014-2015
OK
Aggregate
(N=99)
2015-2016
OK
Aggregate
(N=98)
Work Habits 4.15 4.12 4.10 4.10
I follow the rules in my classroom 4.28 4.28 4.26 4.27
I work well by myself 4.09 4.01 4.02 4.00
I am careful and neat with my work 4.07 4.02 4.02 4.00
I make good use of my time at school 4.19 4.18 4.12 4.19
I finish my work on time 4.08 4.02 4.03 4.03
I keep track of my things at school 4.19 4.22 4.14 4.14 Data Source: Youth Survey
4.04
4.24
4.22
4.05
4.03
4.15
3.96
4.25
4.22
4.11
4.01
4.12
4.01
4.22
4.12
4.01
4
4.1
4.03
4.24
4.12
4.05
4.03
4.1
1 2 3 4 5
Academic Efficacy (K-3)
Technology Efficacy
Science Efficacy
Math Efficacy
Reading/English
Efficacy
Work Habits
Score
Sca
le
2015-2016 (N=98) 2014-2015 (N=99) 2013-2014 (N=86) 2012-2013 (N=107)
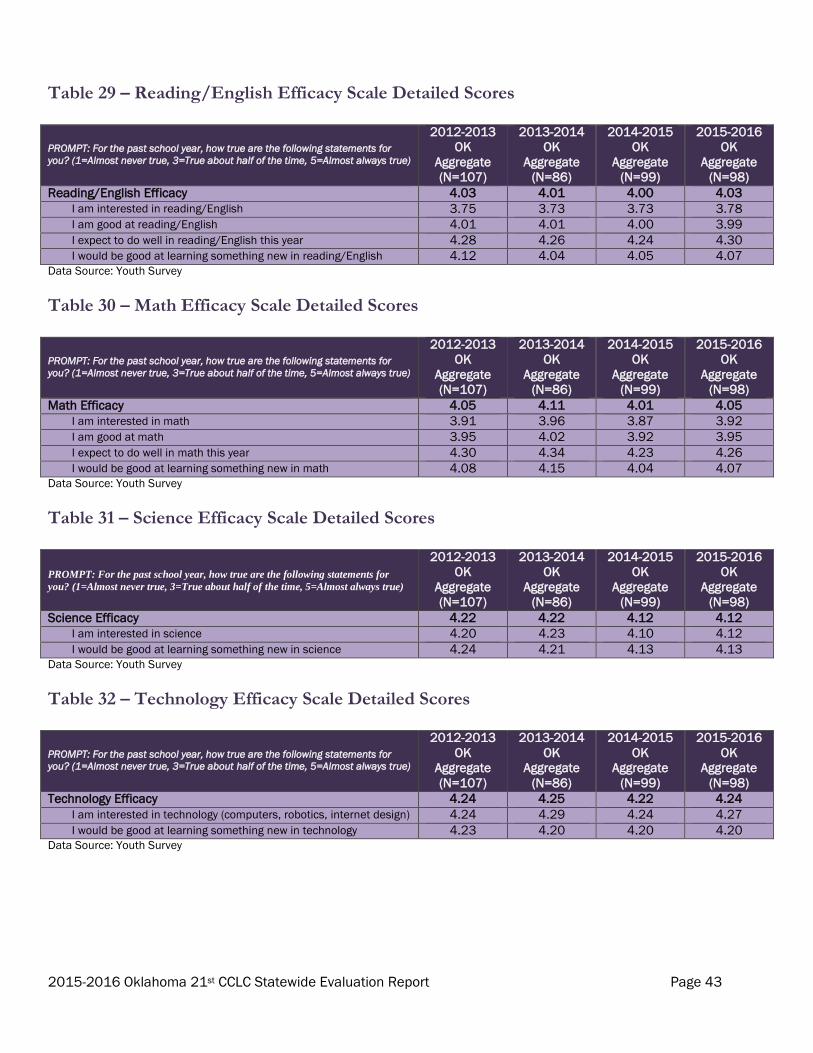
2015-2016 Oklahoma 21st CCLC Statewide Evaluation Report Page 43
Table 29 – Reading/English Efficacy Scale Detailed Scores
PROMPT: For the past school year, how true are the following statements for
you? (1=Almost never true, 3=True about half of the time, 5=Almost always true)
2012-2013
OK
Aggregate
(N=107)
2013-2014
OK
Aggregate
(N=86)
2014-2015
OK
Aggregate
(N=99)
2015-2016
OK
Aggregate
(N=98)
Reading/English Efficacy 4.03 4.01 4.00 4.03
I am interested in reading/English 3.75 3.73 3.73 3.78
I am good at reading/English 4.01 4.01 4.00 3.99
I expect to do well in reading/English this year 4.28 4.26 4.24 4.30
I would be good at learning something new in reading/English 4.12 4.04 4.05 4.07 Data Source: Youth Survey
Table 30 – Math Efficacy Scale Detailed Scores
PROMPT: For the past school year, how true are the following statements for
you? (1=Almost never true, 3=True about half of the time, 5=Almost always true)
2012-2013
OK
Aggregate
(N=107)
2013-2014
OK
Aggregate
(N=86)
2014-2015
OK
Aggregate
(N=99)
2015-2016
OK
Aggregate
(N=98)
Math Efficacy 4.05 4.11 4.01 4.05
I am interested in math 3.91 3.96 3.87 3.92
I am good at math 3.95 4.02 3.92 3.95
I expect to do well in math this year 4.30 4.34 4.23 4.26
I would be good at learning something new in math 4.08 4.15 4.04 4.07 Data Source: Youth Survey
Table 31 – Science Efficacy Scale Detailed Scores
PROMPT: For the past school year, how true are the following statements for
you? (1=Almost never true, 3=True about half of the time, 5=Almost always true)
2012-2013
OK
Aggregate
(N=107)
2013-2014
OK
Aggregate
(N=86)
2014-2015
OK
Aggregate
(N=99)
2015-2016
OK
Aggregate
(N=98)
Science Efficacy 4.22 4.22 4.12 4.12
I am interested in science 4.20 4.23 4.10 4.12
I would be good at learning something new in science 4.24 4.21 4.13 4.13 Data Source: Youth Survey
Table 32 – Technology Efficacy Scale Detailed Scores
PROMPT: For the past school year, how true are the following statements for
you? (1=Almost never true, 3=True about half of the time, 5=Almost always true)
2012-2013
OK
Aggregate
(N=107)
2013-2014
OK
Aggregate
(N=86)
2014-2015
OK
Aggregate
(N=99)
2015-2016
OK
Aggregate
(N=98)
Technology Efficacy 4.24 4.25 4.22 4.24
I am interested in technology (computers, robotics, internet design) 4.24 4.29 4.24 4.27
I would be good at learning something new in technology 4.23 4.20 4.20 4.20 Data Source: Youth Survey
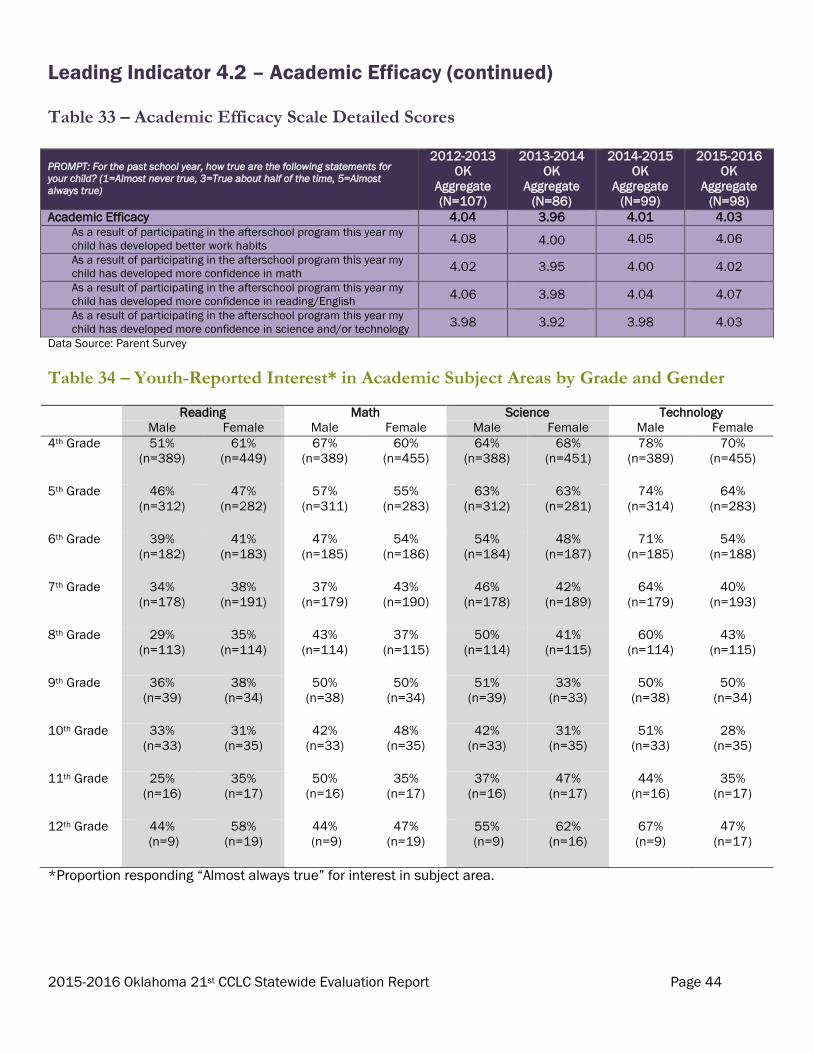
2015-2016 Oklahoma 21st CCLC Statewide Evaluation Report Page 44
Leading Indicator 4.2 – Academic Efficacy (continued) Table 33 – Academic Efficacy Scale Detailed Scores
PROMPT: For the past school year, how true are the following statements for
your child? (1=Almost never true, 3=True about half of the time, 5=Almost
always true)
2012-2013
OK
Aggregate
(N=107)
2013-2014
OK
Aggregate
(N=86)
2014-2015
OK
Aggregate
(N=99)
2015-2016
OK
Aggregate
(N=98)
Academic Efficacy 4.04 3.96 4.01 4.03 As a result of participating in the afterschool program this year my
child has developed better work habits 4.08
4.00 4.05
4.06
As a result of participating in the afterschool program this year my
child has developed more confidence in math 4.02
3.95 4.00
4.02
As a result of participating in the afterschool program this year my
child has developed more confidence in reading/English 4.06
3.98 4.04
4.07
As a result of participating in the afterschool program this year my
child has developed more confidence in science and/or technology 3.98
3.92 3.98
4.03
Data Source: Parent Survey
Table 34 – Youth-Reported Interest* in Academic Subject Areas by Grade and Gender Reading Math Science Technology
Male Female Male Female Male Female Male Female
4th Grade 51%
(n=389)
61%
(n=449)
67%
(n=389)
60%
(n=455)
64%
(n=388)
68%
(n=451)
78%
(n=389)
70%
(n=455)
5th Grade 46%
(n=312)
47%
(n=282)
57%
(n=311)
55%
(n=283)
63%
(n=312)
63%
(n=281)
74%
(n=314)
64%
(n=283)
6th Grade 39%
(n=182)
41%
(n=183)
47%
(n=185)
54%
(n=186)
54%
(n=184)
48%
(n=187)
71%
(n=185)
54%
(n=188)
7th Grade 34%
(n=178)
38%
(n=191)
37%
(n=179)
43%
(n=190)
46%
(n=178)
42%
(n=189)
64%
(n=179)
40%
(n=193)
8th Grade 29%
(n=113)
35%
(n=114)
43%
(n=114)
37%
(n=115)
50%
(n=114)
41%
(n=115)
60%
(n=114)
43%
(n=115)
9th Grade 36%
(n=39)
38%
(n=34)
50%
(n=38)
50%
(n=34)
51%
(n=39)
33%
(n=33)
50%
(n=38)
50%
(n=34)
10th Grade 33%
(n=33)
31%
(n=35)
42%
(n=33)
48%
(n=35)
42%
(n=33)
31%
(n=35)
51%
(n=33)
28%
(n=35)
11th Grade 25%
(n=16)
35%
(n=17)
50%
(n=16)
35%
(n=17)
37%
(n=16)
47%
(n=17)
44%
(n=16)
35%
(n=17)
12th Grade 44%
(n=9)
58%
(n=19)
44%
(n=9)
47%
(n=19)
55%
(n=9)
62%
(n=16)
67%
(n=9)
47%
(n=17)
*Proportion responding “Almost always true” for interest in subject area.
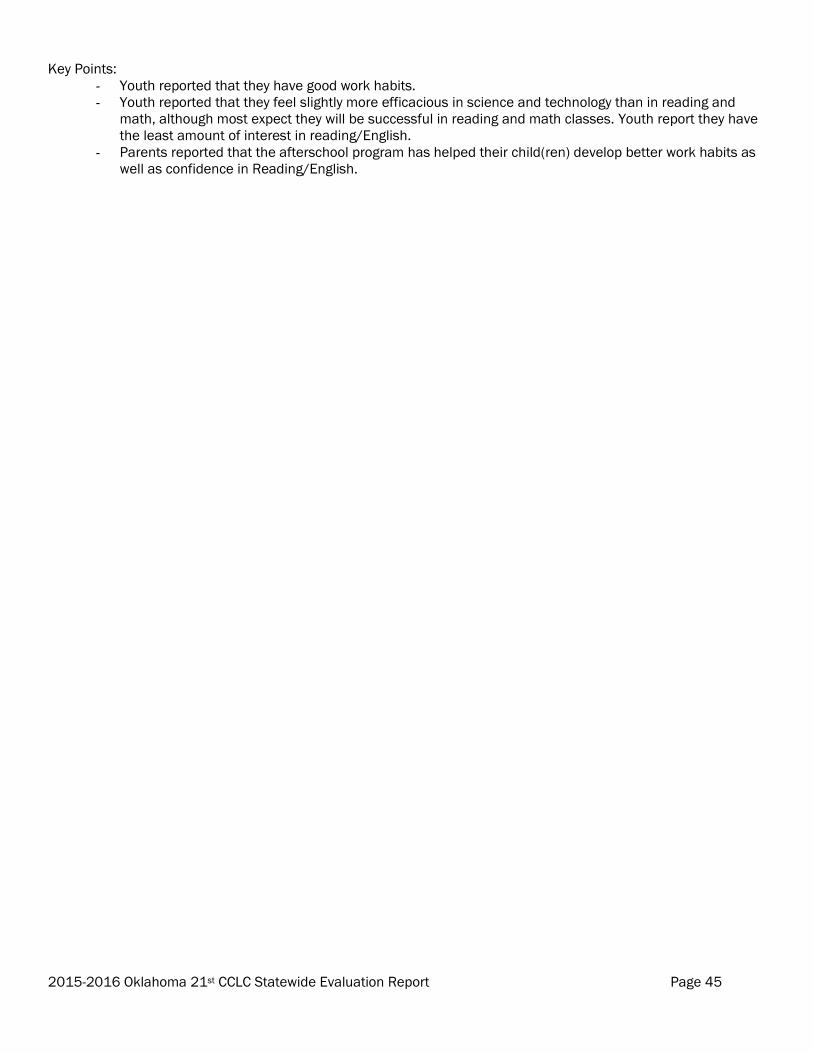
2015-2016 Oklahoma 21st CCLC Statewide Evaluation Report Page 45
Key Points:
- Youth reported that they have good work habits.
- Youth reported that they feel slightly more efficacious in science and technology than in reading and
math, although most expect they will be successful in reading and math classes. Youth report they have
the least amount of interest in reading/English.
- Parents reported that the afterschool program has helped their child(ren) develop better work habits as
well as confidence in Reading/English.
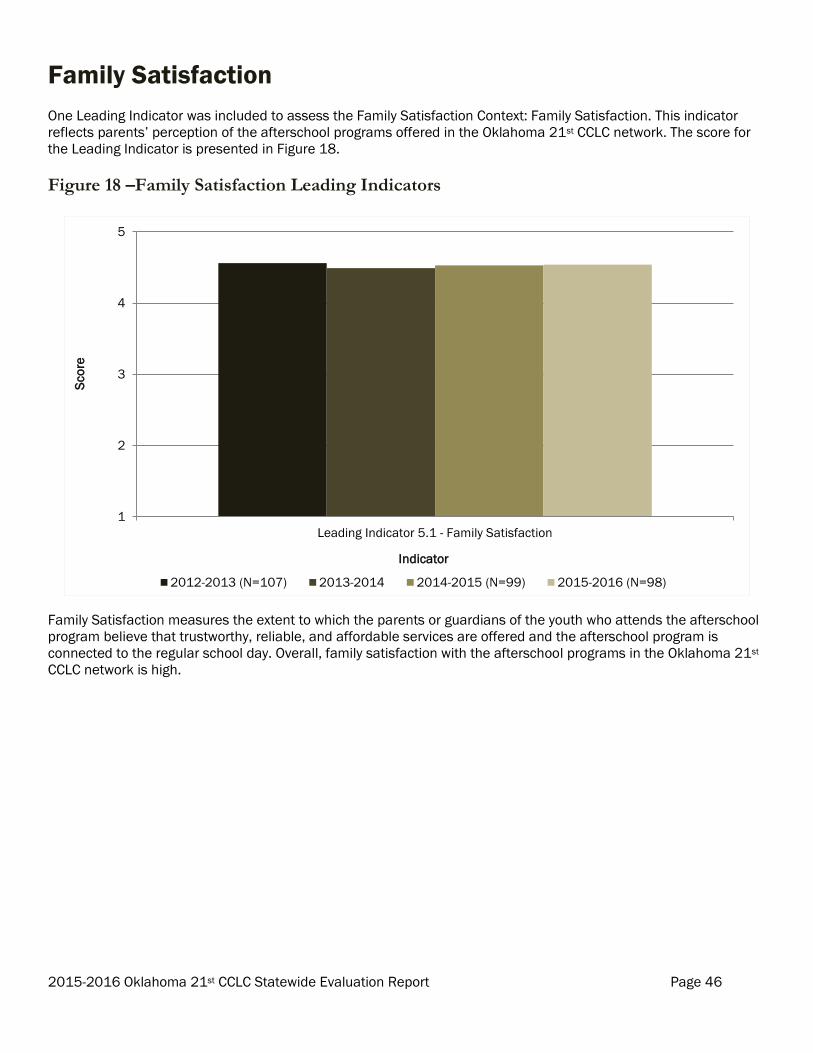
2015-2016 Oklahoma 21st CCLC Statewide Evaluation Report Page 46
Family Satisfaction
One Leading Indicator was included to assess the Family Satisfaction Context: Family Satisfaction. This indicator
reflects parents’ perception of the afterschool programs offered in the Oklahoma 21st CCLC network. The score for
the Leading Indicator is presented in Figure 18.
Figure 18 –Family Satisfaction Leading Indicators
Family Satisfaction measures the extent to which the parents or guardians of the youth who attends the afterschool
program believe that trustworthy, reliable, and affordable services are offered and the afterschool program is
connected to the regular school day. Overall, family satisfaction with the afterschool programs in the Oklahoma 21st
CCLC network is high.
1
2
3
4
5
Leading Indicator 5.1 - Family Satisfaction
Sco
re
Indicator
2012-2013 (N=107) 2013-2014 2014-2015 (N=99) 2015-2016 (N=98)
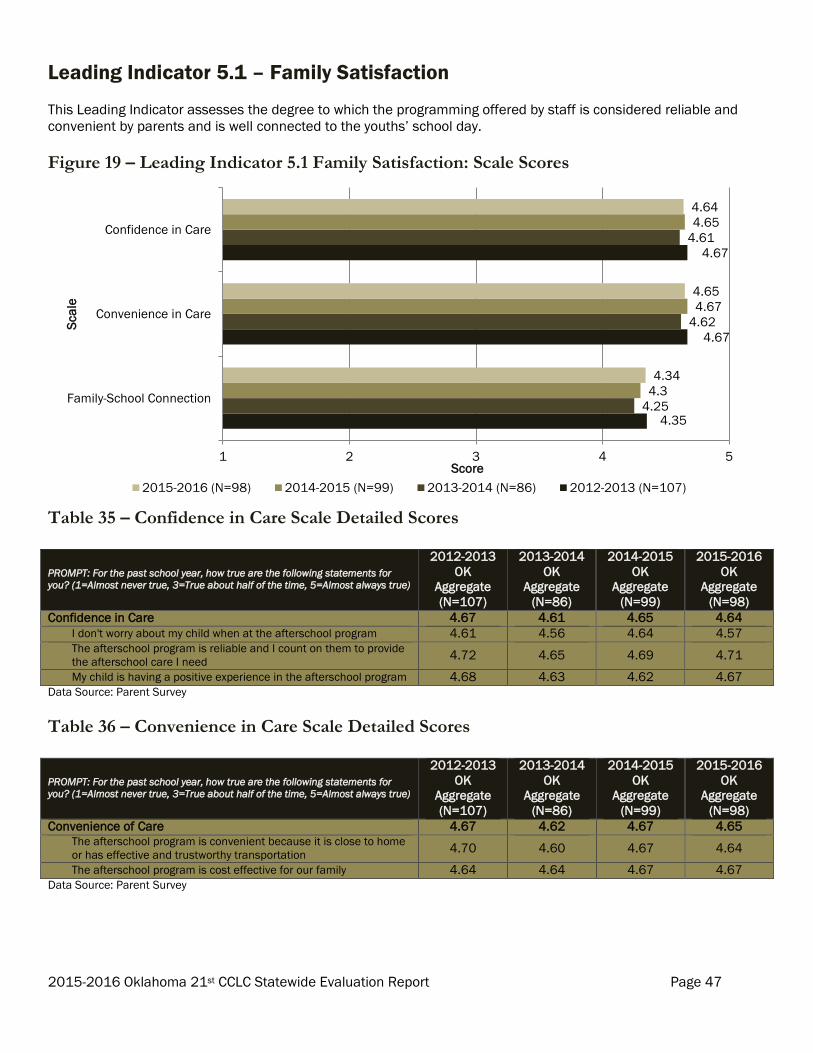
2015-2016 Oklahoma 21st CCLC Statewide Evaluation Report Page 47
Leading Indicator 5.1 – Family Satisfaction
This Leading Indicator assesses the degree to which the programming offered by staff is considered reliable and
convenient by parents and is well connected to the youths’ school day.
Figure 19 – Leading Indicator 5.1 Family Satisfaction: Scale Scores
Table 35 – Confidence in Care Scale Detailed Scores
PROMPT: For the past school year, how true are the following statements for
you? (1=Almost never true, 3=True about half of the time, 5=Almost always true)
2012-2013
OK
Aggregate
(N=107)
2013-2014
OK
Aggregate
(N=86)
2014-2015
OK
Aggregate
(N=99)
2015-2016
OK
Aggregate
(N=98)
Confidence in Care 4.67 4.61 4.65 4.64
I don't worry about my child when at the afterschool program 4.61 4.56 4.64 4.57 The afterschool program is reliable and I count on them to provide
the afterschool care I need 4.72
4.65 4.69
4.71
My child is having a positive experience in the afterschool program 4.68 4.63 4.62 4.67 Data Source: Parent Survey
Table 36 – Convenience in Care Scale Detailed Scores
PROMPT: For the past school year, how true are the following statements for
you? (1=Almost never true, 3=True about half of the time, 5=Almost always true)
2012-2013
OK
Aggregate
(N=107)
2013-2014
OK
Aggregate
(N=86)
2014-2015
OK
Aggregate
(N=99)
2015-2016
OK
Aggregate
(N=98)
Convenience of Care 4.67 4.62 4.67 4.65 The afterschool program is convenient because it is close to home
or has effective and trustworthy transportation 4.70
4.60 4.67
4.64
The afterschool program is cost effective for our family 4.64 4.64 4.67 4.67 Data Source: Parent Survey
4.35
4.67
4.67
4.25
4.62
4.61
4.3
4.67
4.65
4.34
4.65
4.64
1 2 3 4 5
Family-School Connection
Convenience in Care
Confidence in Care
Score
Sca
le
2015-2016 (N=98) 2014-2015 (N=99) 2013-2014 (N=86) 2012-2013 (N=107)
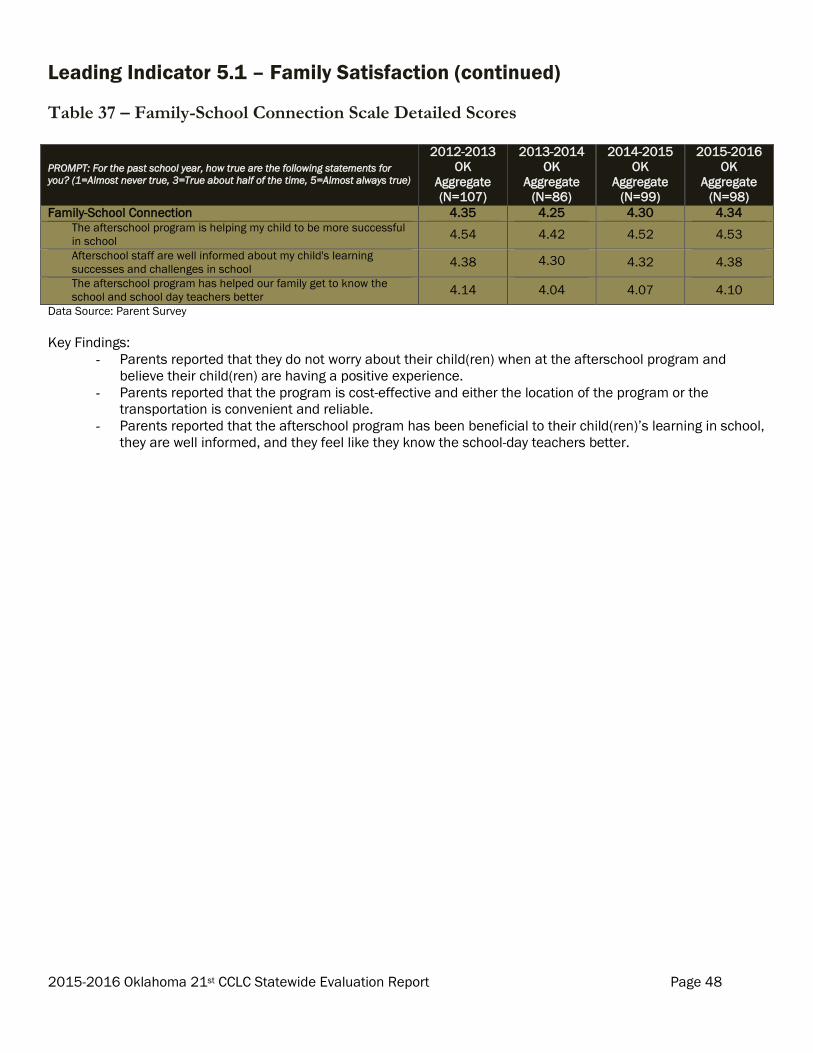
2015-2016 Oklahoma 21st CCLC Statewide Evaluation Report Page 48
Leading Indicator 5.1 – Family Satisfaction (continued)
Table 37 – Family-School Connection Scale Detailed Scores
PROMPT: For the past school year, how true are the following statements for
you? (1=Almost never true, 3=True about half of the time, 5=Almost always true)
2012-2013
OK
Aggregate
(N=107)
2013-2014
OK
Aggregate
(N=86)
2014-2015
OK
Aggregate
(N=99)
2015-2016
OK
Aggregate
(N=98)
Family-School Connection 4.35 4.25 4.30 4.34 The afterschool program is helping my child to be more successful
in school 4.54
4.42 4.52
4.53
Afterschool staff are well informed about my child's learning
successes and challenges in school 4.38
4.30 4.32
4.38
The afterschool program has helped our family get to know the
school and school day teachers better 4.14
4.04 4.07
4.10
Data Source: Parent Survey
Key Findings:
- Parents reported that they do not worry about their child(ren) when at the afterschool program and
believe their child(ren) are having a positive experience.
- Parents reported that the program is cost-effective and either the location of the program or the
transportation is convenient and reliable.
- Parents reported that the afterschool program has been beneficial to their child(ren)’s learning in school,
they are well informed, and they feel like they know the school-day teachers better.
2015-2016 Oklahoma 21st CCLC Statewide Evaluation Report Page 49
Recommendations for the 2016-2017 programming year
In 2013, OSDE proposed a set of statewide goals and objectives for 21st CCLC programs, based on multi-year trends of performance on the Leading Indicators measurement system. In this section, we report progress to date for each goal and provide recommendations for continued improvement. As the statewide continuous improvement system is large and complex, changes may take several years to implement, or for results to be measured. Therefore, some recommendations may be repeated from year to year. In 2014, the federal annual performance reporting data collection system was updated to reflect changing priorities in program accountability and analysis. As of the end of the 2015-2016 programming year and the completion of the system transition, these updates were not expected to include the broad reporting functions associated with the previous system. OSDE is currently exploring new systems to manage the collection of these data.
Goal 1: Improve both academic and non-academic outcomes for regularly
attending participants.
Objective 1.1: Participants in the program will demonstrate increased performance on State Assessment
Proficiency Tests in reading and mathematics.
Objective 1.2: Participants in the program will report higher levels of social and emotional competency,
increased skills in work habits, and in academic efficacy.
Objective 1.3: Grantees will demonstrate improved alignment with the school day.
Context: Social-emotional competencies are known to support both academic and non-academic outcomes
(Farrington et al., 2012; Nagaoka, Farrington, Ehrlich, & Heath, 2015).
Progress to Date: The 2015-2016 programming year, marked the end of a second year of data collection on youth
social and emotional skills using the Devereux Student Strengths Assessment (DESSA)–Mini, the network
determined it would end its relationship with Devereaux in favor of further exploration into best practices for
evaluating and supporting the development of social and emotional learning in program youth. Following the 2-year
pilot, the network lead felt confident that implementation of additional child level measures was feasible, though
there may be other measures which may also be better aligned with what OSDE is already doing across the network.
During the 2015-2016 programming year, the network lead participated in discussions with the Weikart Center
(Network Leader Roadmap series) examining the extent to which social and emotional skills are measured using the
Leading Indicators framework. Additionally, the network revised the Continuation Report for sites to include
documentation on how sites are communicating with external stakeholders, including; parents, the supporting
community, and regular school day personnel.
Goal 2: Promote a physically and emotionally safe place to attend and
continual instruction to promote healthy bodies, minds, and habits.
Objective 2.1: Grantees will consistently offer high-quality instructional programming, regardless of content,
as measured by the Youth PQA or School-Age PQA, Leading Indicator 2.2 Growth and Mastery, and Leading
Indicator 2.1 Academic Planning.
Objective 2.2: Grantees will provide high-quality activities in the core academic areas such as reading and
literacy, mathematics, and science.
Objective 2.3: Grantees will provide high-quality activities in enrichment areas such as nutrition and health,
art, music, and technology.
Context: An important pathway to skill development is involving students in engaging activities that sequentially grow
more complex over time (J. A. Durlak & R. P. Weissberg, 2007; Marzano, 1998), (e.g., project-based learning and
2015-2016 Oklahoma 21st CCLC Statewide Evaluation Report Page 50
skills training). Successful project-based learning opportunities provide physically and emotionally safe learning
environments that support sequential instruction and leadership opportunities for youth.
Progress to date: Updates to the federal APR system included changes in how sites record activities and operations
data and whether sites provided programming for families of participants. This data is no longer available via a
system reporting function. During the transition, the network examined several options for collecting this data.
Goal 3: Provide opportunities for parents and students to learn and connect
with their community together.
Objective 3.1: Grantees will establish and maintain partnerships and collaborative relationships within the
community to enhance participants’ access to a variety of opportunities.
Objective 3.2: Grantees will establish collaborative relationships that offer opportunities for literacy and
related educational activities to the families of participating students.
Objective 3.3: Grantees will maintain a high satisfaction rate among families served by the program.
Context: Community engagement supports the development of youth to be engaged citizens (Flanagan & Levine,
2010) and helps the community to see young people as productive and valued members of the community (Smith et
al., 2016).
Progress to date: In anticipation of sun setting grantees’ transition away from the protection of 21st CCLC funding,
the network has begun to examine ways to support site sustainability before funding ends.
Goal 4: Build organizational capacity to deliver high-quality programming to
all participants attending 21st CCLC programming.
Objective 4.1: Grantees will identify students characterized as “at-risk” and actively recruit those students to
attend 21st CCLC programming.
Objective 4.2: Grantees will engage in the Youth Program Quality Intervention (YPQI) as a part of a program
quality improvement process.
Objective 4.3: Grantees will facilitate opportunities for communication between and among center
coordinators and direct staff working in the 21st CCLC programs.
Objective 4.4: Grantees will maintain a high job satisfaction rate among grantee directors, center
coordinators, and direct staff.
Objective 4.5: OSDE will provide targeted supports to eligible grantees.
Context: Research has shown that regular participation in high-quality expanded learning programs is linked to
significant gains in academic, behavioral, and future employability outcomes (J. Durlak & R. Weissberg, 2007;
Farrington et al., 2012; D. Vandell, Reisner, & Pierce, 2007).
Progress to date: During the 2015-2016 programming year OSDE supported grantees in the following ways:
Objective 4.1:
o Maintained work with the student support office. Priority points continued to be awarded to
applications from the lowest performing 5% of districts/schools.
o Persisted in addressing the issue of targeting “at-risk” students at the YPQI Kick-Off, discussed
Leading Indicator data for Targeting scale to bring grantee attention to targeting “at-risk” population.
Objective 4.2:
2015-2016 Oklahoma 21st CCLC Statewide Evaluation Report Page 51
o Required program staff to complete the newly developed continuation report. This gave grantees the
opportunity to discern there exact position within the continuous improvement process.
o Grantees completed a risk analysis which addressed SDE audit findings, active compliance plan, and
time since last monitoring visit.
o Youth Work Methods Summits were set up to allow grantees networking opportunities’ with other
grantees.
Objective 4.3:
o Created quarterly Afterschool Conversations That Inspire Organize and Network (A.C.T.I.O.N) calls.
These conversations provided grantee directors the opportunity to articulate their expertise with other
networks, and gain knowledge about new concepts to help strengthen their program.
Objective 4.4:
o Grantees were given the opportunity to discuss major problem areas at the Walkabout at Kickoff.
This was led by the project directors and resulted in rich conversation.
o A.C.T.I.O.N calls promoted communication amongst project directors and facilitated team building.
Objective 4.5:
o Provided sites technical assistance around the shift into the in new federal APR system.
o Grantees applied and were selected to participate in the NASA Stem Challenge. Grantees were given
additional technical assistance to facilitate the NASA Journey which provided the youth the chance to
work with engineers and astronauts.
o OSDE participated in family engagement calls with USDE Family engagement resource providers.
o OSDE provided additional support to sites performing in the lowest quartile. These supports focused
specifically on quality and organizational issues.
Recommendations:
Over the course of the preparation of this report OSDE and the Weikart Center have realized that, in order
for state leaders to be able to use the recommendations to direct their data and conversations, the
recommendations in the state wide evaluation have to be more concrete and closer to real-time. In past
years each goal has had up to four recommendations associated with it, but they were often very broad
and general. The purpose of these recommendations is to not only show innovation, but to measure
improvement, which requires that the recommendations become more directly applicable. In order to
facilitate this process, OSDE and the Weikart Center will begin to design a more responsive
recommendation process.
The first action step will include scheduling two recommendation calls, between the network lead and the
Weikart Center staff that focus on supporting OSDE through selected goals. First, OSDE will select three
goals that they want to work on throughout the program year. The first call will occur in December in
replace of the December OSDE team call. During this call OSDE will list out the strengths and challenges,
as well as processes that have worked and others that have not around the three selected goals. The
Weikart Center’s team will then generate a memo within two weeks that includes recommendations in
response to the challenges that OSDE had expressed. The second check-in would occur in June in which
OSDE will express what challenges and strengths they were having in response to the first set of
recommendations. The Weikart Center will then generate a final set of recommendations within two
weeks. Once these have been reviewed by OSDE and finalized they will be included into the final statewide
report.
2015-2016 Oklahoma 21st CCLC Statewide Evaluation Report Page 52
References
Afterschool Alliance. (2013). Defining Youth Outcomes for STEM Learning in Afterschool: Afterschool Alliance.
Bliese, P. D. (2000). Within-Group Agreement, Non-Independence, and Reliability: Implications for Data Aggregation
and Analysis. In K. J. Klein & S. W. Kozlowski (Eds.), Multilevel Theory, Research, and Methods in
Organizations: Foundations, Extensions, and New Directions (1 ed., pp. 349-381): Jossey-Bass.
Bobko, P., Roth, P. L., & Buster, M. A. (2007). The usefulness of unit weights in creating composite scores: A
literature review, application to content validity, and meta-analysis. Organizational Research Methods, 10(4),
689-709.
Durlak, J., & Weissberg, R. (2007). The impact after-school programs that promote personal and social skills.
Chicago, IL.
Durlak, J. A., & Weissberg, R. P. (2007). The impact of after-school programs that promote personal and social skills.
Chicago, IL: Collaborative for Academic, Social, and Emotional Learning (CASEL).
Farrington, C. A., Roderick, M., Johnson, D. W., Keyes, T. S., Allensworth, E., Nagaoka, J., & Beechum, N. O. (2012).
Teaching Adolescents to Become Learners: The Role of Noncognitive Factors in Shaping School
Performance. The University of Chicago Consortium on Chicago School Research.
Flanagan, C., & Levine, P. (2010). Civic engagement and the transition to adulthood. The Future of Children, 20(1),
159-179.
Fralicx, R. D., & Raju, N. S. (1982). A comparison of five methods for combining multiple criteria into a single
composite. Educational and Psychological Measurement, 42, 823-827.
Marzano, R. J. (1998). A theory-based meta-analysis of research on instruction. Aurora, CO: Mid-continent Regional
Educational Laboratory.
Nagaoka, J., Farrington, C., Ehrlich, S. B., & Heath, R. D. (2015). Foundations for Young Adult Success: A
Developmental Framework. Concept Paper for Research and Practice: The University of Chicago Constortium
on Chicago School Research.
Oklahoma State Department of Education. (2014). 21st Century Community Learning Centers Award Recipients.
Retrieved from http://ok.gov/sde/21st-century-community-learning-centers-award-recipients
Smith, C., Akiva, T., Sugar, S., Lo, Y. J., Frank, K. A., Peck, S. C., & Cortina, K. S. (2012). Continuous quality
improvement in afterschool settings: Impact findings from the Youth Program Quality Intervention study.
Ypsilanti, MI: David P. Weikart Center for Youth Program Quality at the Forum for Youth Investment.
2015-2016 Oklahoma 21st CCLC Statewide Evaluation Report Page 53
Smith, C., & Hohmann, C. (2005). Full findings from the Youth PQA validation study. Ypsilanti, MI: High/Scope
Educational Research Foundation.
Smith, C., McGovern, G., Larson, R., Hillaker, B., & Peck, S. C. (2016). Preparing Youth to Thrive: Promising Practices
for Social and Emotional Learning. Ypsilanti, MI: David P. Weikart Center for Youth Program Quality at the
Forum for Youth Investment.
Vandell, D. L. (2012). California Afterschool Outcome Measures Project: Field Test Of The Online Toolbox Final
Report To California Department Of Education. Irvine, CA: University of California, Irvine.
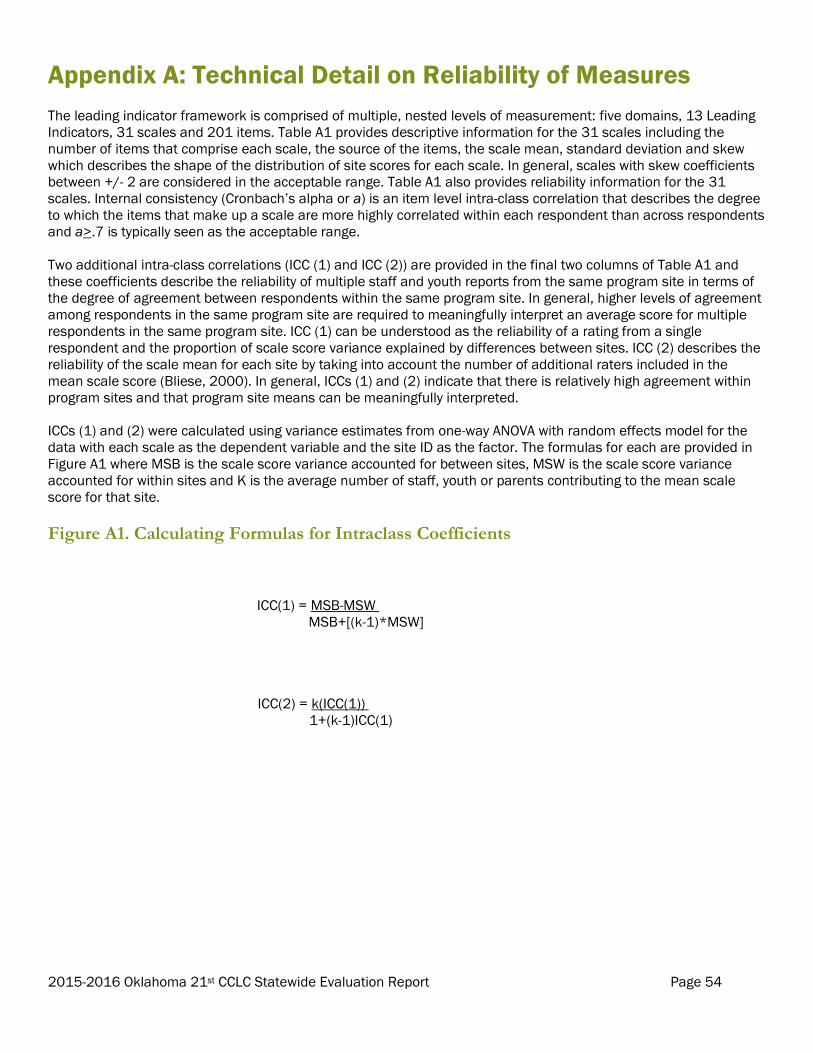
2015-2016 Oklahoma 21st CCLC Statewide Evaluation Report Page 54
Appendix A: Technical Detail on Reliability of Measures
The leading indicator framework is comprised of multiple, nested levels of measurement: five domains, 13 Leading
Indicators, 31 scales and 201 items. Table A1 provides descriptive information for the 31 scales including the
number of items that comprise each scale, the source of the items, the scale mean, standard deviation and skew
which describes the shape of the distribution of site scores for each scale. In general, scales with skew coefficients
between +/- 2 are considered in the acceptable range. Table A1 also provides reliability information for the 31
scales. Internal consistency (Cronbach’s alpha or a) is an item level intra-class correlation that describes the degree
to which the items that make up a scale are more highly correlated within each respondent than across respondents
and a>.7 is typically seen as the acceptable range.
Two additional intra-class correlations (ICC (1) and ICC (2)) are provided in the final two columns of Table A1 and
these coefficients describe the reliability of multiple staff and youth reports from the same program site in terms of
the degree of agreement between respondents within the same program site. In general, higher levels of agreement
among respondents in the same program site are required to meaningfully interpret an average score for multiple
respondents in the same program site. ICC (1) can be understood as the reliability of a rating from a single
respondent and the proportion of scale score variance explained by differences between sites. ICC (2) describes the
reliability of the scale mean for each site by taking into account the number of additional raters included in the
mean scale score (Bliese, 2000). In general, ICCs (1) and (2) indicate that there is relatively high agreement within
program sites and that program site means can be meaningfully interpreted.
ICCs (1) and (2) were calculated using variance estimates from one-way ANOVA with random effects model for the
data with each scale as the dependent variable and the site ID as the factor. The formulas for each are provided in
Figure A1 where MSB is the scale score variance accounted for between sites, MSW is the scale score variance
accounted for within sites and K is the average number of staff, youth or parents contributing to the mean scale
score for that site.
Figure A1. Calculating Formulas for Intraclass Coefficients
ICC(1) = MSB-MSW .
MSB+[(k-1)*MSW]
ICC(2) = k(ICC(1)) .
1+(k-1)ICC(1)
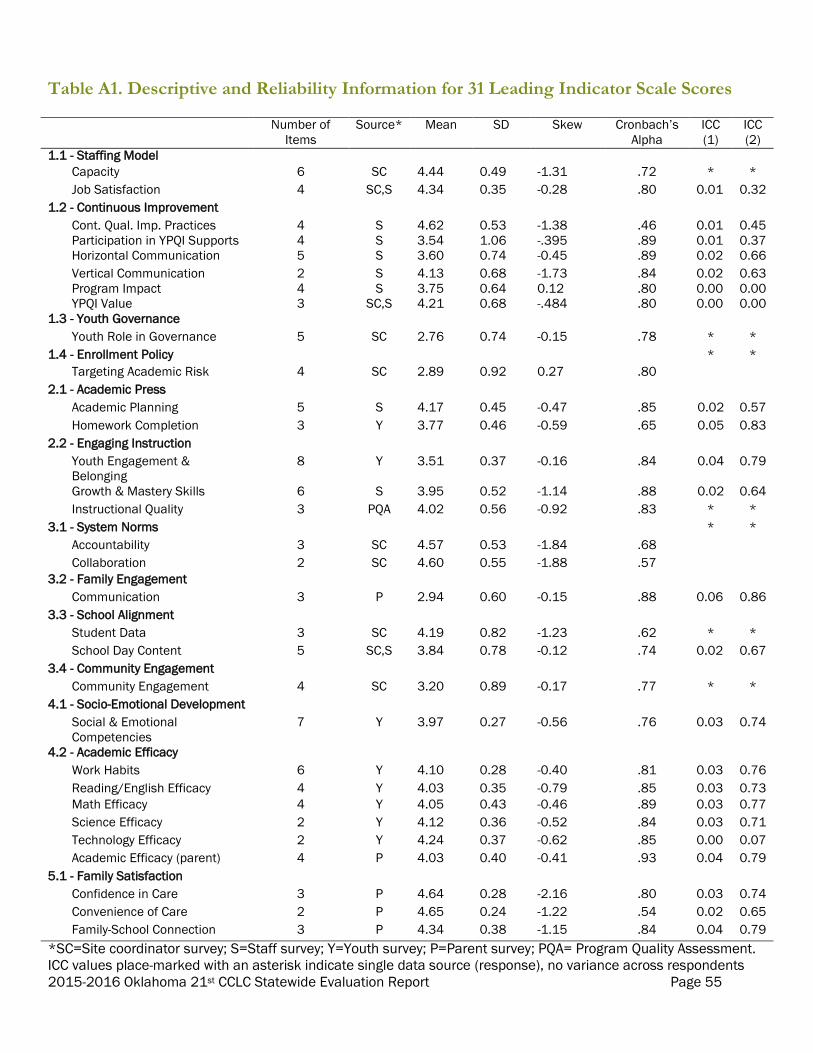
2015-2016 Oklahoma 21st CCLC Statewide Evaluation Report Page 55
Table A1. Descriptive and Reliability Information for 31 Leading Indicator Scale Scores
Number of
Items
Source* Mean SD Skew Cronbach’s
Alpha
ICC
(1)
ICC
(2)
1.1 - Staffing Model
Capacity 6 SC 4.44 0.49 -1.31 .72 * *
Job Satisfaction 4 SC,S 4.34 0.35 -0.28 .80 0.01 0.32
1.2 - Continuous Improvement
Cont. Qual. Imp. Practices
Participation in YPQI Supports
4
4
S
S
4.62
3.54
0.53
1.06
-1.38
-.395
.46
.89
0.01
0.01
0.45
0.37
Horizontal Communication 5 S 3.60 0.74 -0.45 .89 0.02 0.66
Vertical Communication
Program Impact
YPQI Value
2
4
3
S
S
SC,S
4.13
3.75
4.21
0.68
0.64
0.68
-1.73
0.12
-.484
.84
.80
.80
0.02
0.00
0.00
0.63
0.00
0.00
1.3 - Youth Governance
Youth Role in Governance 5 SC 2.76 0.74 -0.15 .78 * *
1.4 - Enrollment Policy * *
Targeting Academic Risk 4 SC 2.89 0.92 0.27 .80
2.1 - Academic Press
Academic Planning 5 S 4.17 0.45 -0.47 .85 0.02 0.57
Homework Completion 3 Y 3.77 0.46 -0.59 .65 0.05 0.83
2.2 - Engaging Instruction
Youth Engagement &
Belonging
8 Y 3.51 0.37 -0.16 .84 0.04 0.79
Growth & Mastery Skills 6 S 3.95 0.52 -1.14 .88 0.02 0.64
Instructional Quality 3 PQA 4.02 0.56 -0.92 .83 * *
3.1 - System Norms * *
Accountability 3 SC 4.57 0.53 -1.84 .68
Collaboration 2 SC 4.60 0.55 -1.88 .57
3.2 - Family Engagement
Communication 3 P 2.94 0.60 -0.15 .88 0.06 0.86
3.3 - School Alignment
Student Data 3 SC 4.19 0.82 -1.23 .62 * *
School Day Content 5 SC,S 3.84 0.78 -0.12 .74 0.02 0.67
3.4 - Community Engagement
Community Engagement 4 SC 3.20 0.89 -0.17 .77 * *
4.1 - Socio-Emotional Development
Social & Emotional
Competencies
7 Y 3.97 0.27 -0.56 .76 0.03 0.74
4.2 - Academic Efficacy
Work Habits 6 Y 4.10 0.28 -0.40 .81 0.03 0.76
Reading/English Efficacy 4 Y 4.03 0.35 -0.79 .85 0.03 0.73
Math Efficacy 4 Y 4.05 0.43 -0.46 .89 0.03 0.77
Science Efficacy 2 Y 4.12 0.36 -0.52 .84 0.03 0.71
Technology Efficacy 2 Y 4.24 0.37 -0.62 .85 0.00 0.07
Academic Efficacy (parent) 4 P 4.03 0.40 -0.41 .93 0.04 0.79
5.1 - Family Satisfaction
Confidence in Care 3 P 4.64 0.28 -2.16 .80 0.03 0.74
Convenience of Care 2 P 4.65 0.24 -1.22 .54 0.02 0.65
Family-School Connection 3 P 4.34 0.38 -1.15 .84 0.04 0.79
*SC=Site coordinator survey; S=Staff survey; Y=Youth survey; P=Parent survey; PQA= Program Quality Assessment.
ICC values place-marked with an asterisk indicate single data source (response), no variance across respondents
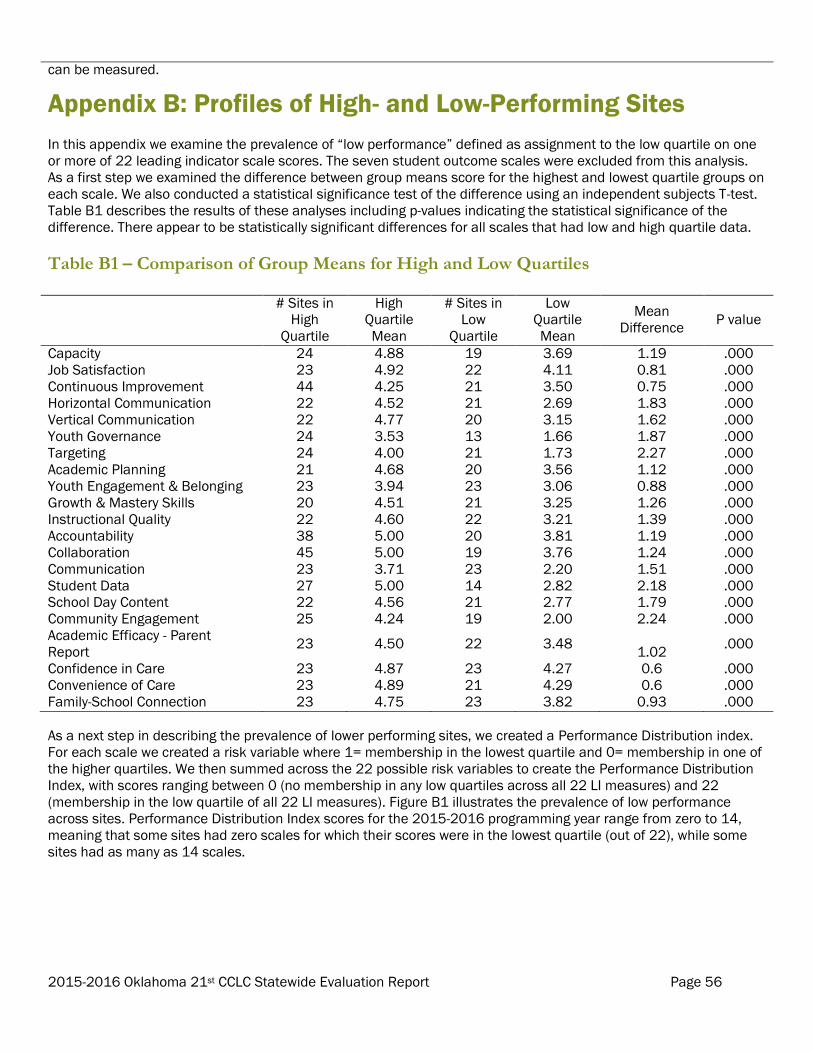
2015-2016 Oklahoma 21st CCLC Statewide Evaluation Report Page 56
can be measured.
Appendix B: Profiles of High- and Low-Performing Sites
In this appendix we examine the prevalence of “low performance” defined as assignment to the low quartile on one
or more of 22 leading indicator scale scores. The seven student outcome scales were excluded from this analysis.
As a first step we examined the difference between group means score for the highest and lowest quartile groups on
each scale. We also conducted a statistical significance test of the difference using an independent subjects T-test.
Table B1 describes the results of these analyses including p-values indicating the statistical significance of the
difference. There appear to be statistically significant differences for all scales that had low and high quartile data.
Table B1 – Comparison of Group Means for High and Low Quartiles # Sites in
High
Quartile
High
Quartile
Mean
# Sites in
Low
Quartile
Low
Quartile
Mean
Mean
Difference P value
Capacity 24 4.88 19 3.69 1.19 .000
Job Satisfaction 23 4.92 22 4.11 0.81 .000
Continuous Improvement 44 4.25 21 3.50 0.75 .000
Horizontal Communication 22 4.52 21 2.69 1.83 .000
Vertical Communication 22 4.77 20 3.15 1.62 .000
Youth Governance 24 3.53 13 1.66 1.87 .000
Targeting 24 4.00 21 1.73 2.27 .000
Academic Planning 21 4.68 20 3.56 1.12 .000
Youth Engagement & Belonging 23 3.94 23 3.06 0.88 .000
Growth & Mastery Skills 20 4.51 21 3.25 1.26 .000
Instructional Quality 22 4.60 22 3.21 1.39 .000
Accountability 38 5.00 20 3.81 1.19 .000
Collaboration 45 5.00 19 3.76 1.24 .000
Communication 23 3.71 23 2.20 1.51 .000
Student Data 27 5.00 14 2.82 2.18 .000
School Day Content 22 4.56 21 2.77 1.79 .000
Community Engagement 25 4.24 19 2.00 2.24 .000
Academic Efficacy - Parent
Report 23 4.50 22 3.48
1.02 .000
Confidence in Care 23 4.87 23 4.27 0.6 .000
Convenience of Care 23 4.89 21 4.29 0.6 .000
Family-School Connection 23 4.75 23 3.82 0.93 .000
As a next step in describing the prevalence of lower performing sites, we created a Performance Distribution index.
For each scale we created a risk variable where 1= membership in the lowest quartile and 0= membership in one of
the higher quartiles. We then summed across the 22 possible risk variables to create the Performance Distribution
Index, with scores ranging between 0 (no membership in any low quartiles across all 22 LI measures) and 22
(membership in the low quartile of all 22 LI measures). Figure B1 illustrates the prevalence of low performance
across sites. Performance Distribution Index scores for the 2015-2016 programming year range from zero to 14,
meaning that some sites had zero scales for which their scores were in the lowest quartile (out of 22), while some
sites had as many as 14 scales.
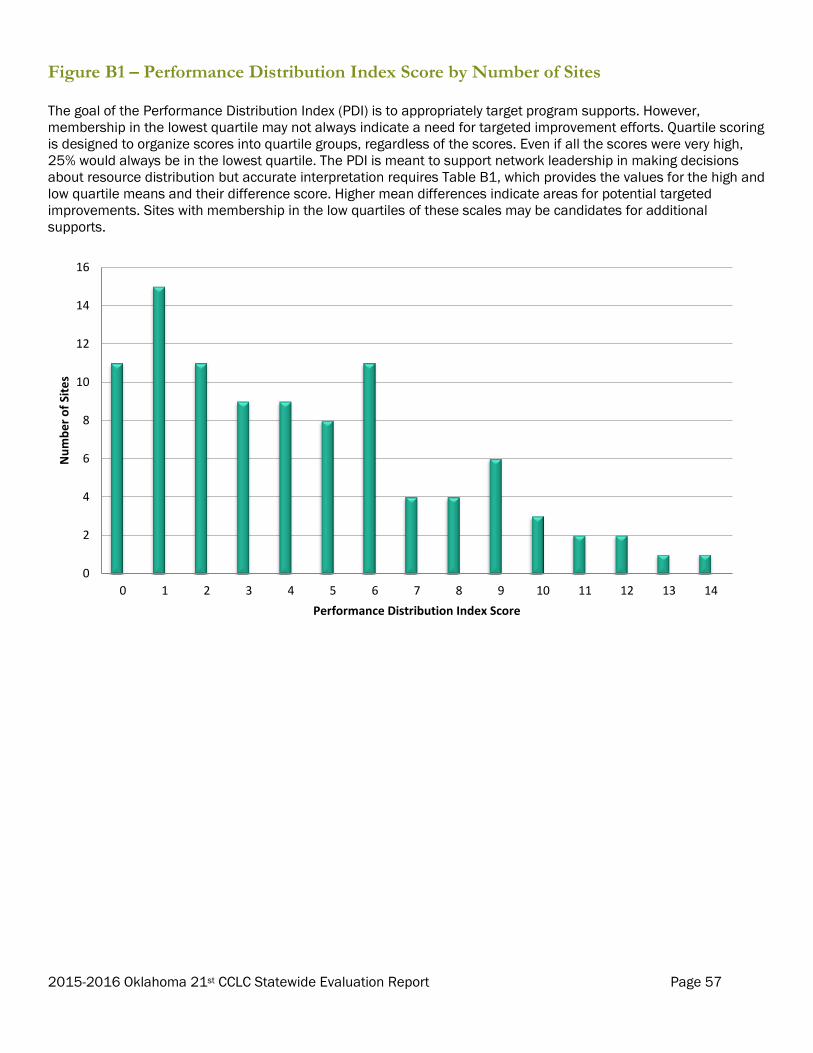
2015-2016 Oklahoma 21st CCLC Statewide Evaluation Report Page 57
Figure B1 – Performance Distribution Index Score by Number of Sites The goal of the Performance Distribution Index (PDI) is to appropriately target program supports. However,
membership in the lowest quartile may not always indicate a need for targeted improvement efforts. Quartile scoring
is designed to organize scores into quartile groups, regardless of the scores. Even if all the scores were very high,
25% would always be in the lowest quartile. The PDI is meant to support network leadership in making decisions
about resource distribution but accurate interpretation requires Table B1, which provides the values for the high and
low quartile means and their difference score. Higher mean differences indicate areas for potential targeted
improvements. Sites with membership in the low quartiles of these scales may be candidates for additional
supports.
0
2
4
6
8
10
12
14
16
0 1 2 3 4 5 6 7 8 9 10 11 12 13 14
Nu
mb
er
of
Site
s
Performance Distribution Index Score
2015-2016 Oklahoma 21st CCLC Statewide Evaluation Report Page 58
Appendix C. 2014-2015 Oklahoma State Department of
Education 21st CCLC Coach Support Services Menu Welcome Letter Learning community members receive a letter welcoming them to the initiative and providing a brief introduction to their coach and the supports available. Introductory TACSS Meeting Coach and project director meet to review the TACSS initiative and process and emphasize relationship development. Returning learning community members may use this time for continued relationship development as well as updates to any services or changes to service levels. TA Planning Coach, project director, and other appropriate staff meet to review the menu of core and supplemental services and develop a working draft of the TA Plan. Self-Assessment Support Coach provides support related to the self-assessment process. This may include discussing the PQA process with staff, login support, scoring questions, brainstorming, etc… PQA Basics or PQA Plus Coach facilitates regional PQA Basics or PQA Plus training for project director, site coordinators, vendors, youth, program staff or others as appropriate. Planning with Data Coach co-facilitates a regional Planning with Data workshop to assist Project Director and program staff with analyzing PQA data and goal-setting for program improvement. Improvement Plan Supports Coach co-facilitates a regional Data Planning Session for program staff with project director and other appropriate staff. Observation/Reflection Coach conducts an Observation/Reflection with a staff member in order to model the technique for site-coordinators or project director. Youth Work Methods Coach facilitates one of several Youth Work Methods trainings for program staff. Program Management Support Coach provides topic specific support to project director. Examples might include developing job descriptions, preparing for a board presentation, etc… Site Visit Coach visits program sites with project director. Ongoing Communication Coach will maintain relationship and information sharing with project director through e-mail, phone and face-to-face communication. Coach Reflection Report Coach provides project director with a year-end report which includes a summary of services, highlights and recommendations for the future.