Embed Size (px)
Citation preview

Oklahoma Major Trauma Summary Report: 2009–2015
Oklahoma State Trauma Registry
Emergency Systems
Oklahoma State Department of Health

1
Prepared and Edited by:
Yang Wan, Ph.D. Statistical Research Specialist
Kenneth Stewart, Ph.D.
Epidemiologist
Acknowledgements
The Emergency Systems wish to thank all Hospital Trauma Registrars for their dedication to data entry and submission, which made this report possible.
Emergency Systems Oklahoma State Department of Health
1000 N.E.10th Street, Room 206 Oklahoma City, OK 73117-1299
Phone: (405) 271-4027 Fax: (405) 271-4240
April 2017

2
Table of Contents
List of Charts ................................................................................................................. 3
Glossary ....................................................................................................................... 5
Oklahoma Trauma System and Registry........................................................................... 6
Trauma Case Inclusion and Exclusion Criteria ................................................................. 7
Case Inclusion Criteria ..................................................................................................... 7
Case Exclusion Criteria .................................................................................................... 7
Hospital Reporting and Participation ............................................................................. 8
Executive Summary ..................................................................................................... 12

3
List of Charts
Chart 1. Major Trauma Patients by Year: 2009–2015 ................................................................ 15
Chart 2. Major Trauma Patients by Quarter: 2009–2015 ........................................................... 16
Chart 3. Major Trauma Patients by Month: 2009–2015 ............................................................. 17
Chart 4. Major Trauma Patients by Weekday: 2009–2015 .......................................................... 18
Chart 5. Major Trauma Patients by Hour: 2009–2015 ............................................................... 19
Chart 6. Major Trauma Patients by Hospital Region: 2009–2015 ................................................. 20
Chart 7. Major Trauma Patients by Hospital Level: 2009–2015 ................................................... 21
Chart 8. Major Trauma Patients by System Entry: 2009–2015 ..................................................... 22
Chart 9. Direct and Transferred Major Trauma Patients by Mode: 2009–2015 ................................. 23
Chart 10. Major Trauma Patients by Race: 2009–2015 .............................................................. 24
Chart 11. Major Trauma Patients by Gender: 2009–2015 .......................................................... 25
Chart 12. Major Trauma Patients by Gender and Age Group over 2009–2015 ................................. 26
Chart 13. Age Specific Rate by Gender over 2009–2015 ............................................................ 27
Chart 14. Major Trauma Patients by Injury Etiology over 2009–2015 ............................................ 28
Chart 15. Major Trauma Patients by Injury Etiology: 2009–2015 ................................................. 29
Chart 16. Major Trauma Patients by Injury Type over 2009–2015 ................................................ 30
Chart 17. Major Trauma Patients by Injury Type: 2009–2015 ..................................................... 31
Chart 18. Major Trauma Patients by ISS Group: 2009–2015 ....................................................... 32
Chart 19. Mean Minutes in the ED by ISS Group: 2009–2015 ..................................................... 33
Chart 20. Mean Minutes in the ED by ISS Group over 2009–2015 ................................................ 34
Chart 21. Mean Minutes in the ED by System Entry at Definitive Care: 2009–2015 .......................... 35
Chart 22. Mean Minutes in the ED by ED Disposition: 2009–2015 ............................................... 36
Chart 23. Mortality Proportion by Year: 2009–2015 ................................................................ 37
Chart 24. Mortality Rate by ISS Group: 2009–2015 ................................................................. 38
Chart 25. Age Specific Mortality Rates over 2009–2015 ............................................................ 39
Chart 26. Age Specific Mortality Rates by Year: 2009–2015 ....................................................... 40
Chart 27. Age Specific Mortality by Gender: 2009–2015 ........................................................... 41
Chart 28. Mean Revised Trauma Score by ISS Group and Discharge Status: 2009–2015 ...................... 42

4
Chart 29. Major Trauma Patients by ED Disposition: 2009–2015 ................................................. 43
Chart 30. Major Trauma Patients by ED Disposition and ISS Group: 2009–2015 .............................. 44
Chart 31. Major Trauma Patients by Hospital Discharge: 2009–2015 ............................................ 45
Chart 32. Proportional Distribution of Deaths by Mechanism of Injury: 2009–2015 .......................... 46
Chart 33. Mechanism of Injury by Outcome: 2009–2015 ........................................................... 47
Chart 34. Case Fatality Rate by Mechanism of Injury: 2009–2015 ................................................ 48
Chart 35. ED Disposition by Discharge Status: 2009–2015 ......................................................... 49
Chart 36. Total Hospital Days by Etiology: 2009–2015 ............................................................. 50
Chart 37. Total Hospital Days by ISS Group: 2009–2015 ........................................................... 51
Chart 38. Total ICU Days by ISS Group: 2009–2015 ................................................................ 52
Chart 39. Mean LOS in Days by Etiology: 2009–2015 ............................................................... 53
Chart 40. Mean LOS in Days by ISS Group: 2009–2015 ............................................................ 54
Chart 41. Mean LOS in Days by Hospital Region over 2009–2015 ................................................ 55
Chart 42. Mean LOS in Days by Hospital Level: 2009–2015 ....................................................... 56
Chart 43. Mean ICU Days by Etiology: 2009–2015 .................................................................. 57
Chart 44. Mean ICU Days by ISS Group: 2009–2015 ................................................................ 58
Chart 45. Mean ICU Days by Hospital Level: 2009–2015........................................................... 59
Chart 46. Injury by Body Region: 2009–2015 ......................................................................... 60
Chart 47. Injury by Body Region over 2009–2015.................................................................... 61
Chart 48. Injury Distribution of Major Trauma Patients: 2009–2015 ............................................. 62
Chart 49. Type of Injury by Head and Neck of Major Trauma Patients: 2009–2015 ........................... 63
Chart 50. Type of Injury by Spine and Back of Major Trauma Patients: 2009–2015 ........................... 64
Chart 51. Type of Injury by Torso of Major Trauma Patients: 2009–2015....................................... 65
Chart 52. Type of Injury by Extremities of Major Trauma Patients: 2009–2015 ............................... 66

5
Glossary
AIS—Abbreviated Injury Scale—a scale for scoring individual injuries; ranges from 1 (minor) to 6 (non-survivable).
All Reported Trauma—includes minor trauma transfers and ‘duplicate’ patients from the transferring and receiving facilities.
ED—Emergency Department.
EMS—Emergency Medical Service.
GCS—Glasgow Coma Scale—a quick assessment of neurologic status based upon eye, verbal and motor responses; ranges from 3 (worst) to 15 (best).
ICU—Intensive Care Unit.
Incident Case—patient only counted once even if reported by two or more facilities.
ISS—Injury Severity Score—a means for combining individual AIS scores into a summary score for a multiple-injured patient; score range from 1 (minor) to 75 (maximum score).
Major Trauma—cases that met the statutory major trauma criteria and are unduplicated (not counted more than once in the database).
MVC—Motor Vehicle Crashes.
OR—Operation Room.
OTR—Oklahoma Trauma Registry.
POV—Privately Owned Vehicle.
TRISS—Trauma Injury Severity Score—a survival probability score calculated from the age, primary injury type (blunt/penetrating), ISS and RTS scores. Score range is between 0 and 1: below 0.50 ‘expected’ to die and above 0.50 ‘expected’ to live.
RTS—Revised Trauma Score—a score indicator of physiologic status of a patient upon arrival at ED; based on initial systolic blood pressure, unassisted respiratory rate, and total Glasgow Coma Scale. Score range is 0 to 7.841 with higher values indicating better vital signs.
RR—Respiratory Rate.
SBP—Systolic Blood Pressure.
System Entry—relates to patient’s means of arrival at the reporting facility—by EMS transport from the scene, privately owned vehicle, or transfer from another acute care hospital.

6
Oklahoma Trauma System and Registry
Senate Bill (SB) 1554—the Oklahoma Trauma System Improvement and Development Act—was passed during the 2004 legislative session. To fulfill this legislative mandate and facilitate the development of a statewide trauma system, several tools and resources have been developed and put into operation for the past decade. One of them is the Oklahoma Trauma Registry (OTR) which is used to collect and gather trauma data and information for the development and improvement of Oklahoma trauma system.
The OTR collects data regarding injured patients from all state-licensed acute care hospitals. Acute care hospitals are required to submit data on all injured patients that meet Oklahoma’s Major Trauma Criteria (see Criteria). In addition, all injured patients that require transfer to another acute care facility must be reported regardless of severity. Patients meeting any of the exclusion criteria listed in the case definition are not required to be reported.
The focus of this report is on the definitive care record of patients who met Oklahoma’s Major Trauma Criteria during the period January 1st, 2009 through December 31st, 2015 (N = 43,890).

7
Trauma Case Inclusion and Exclusion Criteria
Oklahoma Administrative Code (OAC) 310: 667-59-1(b) requires all hospitals to submit trauma registry data to the OSDH State Trauma Registry. The following Case Inclusion and Exclusion criteria apply to those cases that MUST be included in the Oklahoma State Trauma Registry. Hospitals may elect to include additional cases in the database and to transmit/download those cases to the State Registry if desired.
Case Inclusion Criteria All patients must have at least one of ICD-9 of 800.00-959.9 AND at least one of the following:
- length of hospital stay ≥ 48 hours; or - patient dead on arrival or died while in hospital; or - patient transferred with major or minor† trauma; or - patient admitted to ICU; or - patient transferred directly to OR for surgery to the head, chest, abdomen, or vascular system
Each reportable major trauma case must also meet at least one of the following criteria as computed by the trauma registry software:
1. an Abbreviated Injury Scale severity value of 3 or higher; or 2. an Injury Severity Score of 9 or higher; or 3. a TRISS or Burn Survival Probability less than .90; or 4. death
Case Exclusion Criteria - isolated orthopedic injury to the extremities due to same level falls* (E885.9) - overexertion injuries - injury caused by pre-existing condition, e.g. osteoporosis (fracture); esophageal stricture (choking) - injuries greater than 30 days old - poisonings and toxic events (960-989.9) - submersion injuries (994.1) - foreign body (leading to choking or otherwise) (non-codable) - strangulation/asphyxiation/anoxic brain death (994.7) - electrocution (994.8)
* The Exclusion criteria were modified effective July 1, 2003. Previously, the exclusion was for isolated orthopedic injuries to extremities regardless of cause/mechanism of injury. Now isolated orthopedic injuries to extremities that meet severity criteria will be included if they are due to causes other than same level falls. † Minor trauma transfer patients required to be reported (minimal database) effective July 1, 2004.

8
Hospital Reporting and Participation
There were 110 hospitals classified as trauma centers and submitted data to the OTR over 2009–2015, including:
Level I: 1 classified trauma center
Level II: 2 classified trauma centers
Level III: 26 classified trauma centers
Level IV: 80 classified trauma centers
These hospitals are located in eight trauma regions in Oklahoma, where Region 7 and 8 are the metropolitan areas of Tulsa and Oklahoma City, respectively.
Region 1: NW (20)
Region 2: NE (15)
Region 3: SE (20)
Region 4: East Central (13)
Region 5: SW (13)
Region 6: Central (9)
Region 7: Tulsa County (9)
Region 8: Oklahoma County (11)
Region Name Level
Region 1—NW
AllianceHealth Clinton IV
AllianceHealth Woodward IV
Beaver County Memorial Hospital IV
Cimarron Memorial Hospital IV
Cordell Memorial Hospital IV
Fairview Hospital IV
Great Plains Regional Medical Center IV
Harper County Community Hospital IV
INTEGRIS Bass Baptist Health Center III
Memorial Hospital of Texas County IV
Mercy Hospital Kingfisher IV
Mercy Hospital Watonga IV
Newman Memorial Hospital IV
Okeene Municipal Hospital IV
Roger Mills Memorial Hospital IV

9
Sayre Memorial Hospital* IV
Seiling Municipal Hospital IV
Share Medical Center IV
St. Mary's Regional Medical Center III
Weatherford Regional Hospital IV
Region 2—NE
Blackwell Regional Hospital IV
AllianceHealth Ponca City IV
AllianceHealth Pryor IV
Cleveland Area Hospital IV
Saint Francis Hospital Vinita IV
Fairfax Memorial Hospital IV
Hillcrest Hospital Claremore IV
Hillcrest Hospital Cushing IV
INTEGRIS Miami Hospital IV
INTEGRIS Grove Hospital IV
Jane Phillips Medical Center III
Jane Phillips Nowata Health Center IV
Pawhuska Hospital IV
Perry Memorial Hospital IV
Stillwater Medical Center III
Region 3—SE
Arbuckle Memorial Hospital IV
Carnegie Tri-County Municipal Hospital IV
Comanche County Memorial Hospital III
Duncan Regional Hospital III
Elkview General Hospital IV
Grady Memorial Hospital III
Harmon Memorial Hospital IV
Jackson County Memorial Hospital IV
Jefferson County Hospital IV
Lindsay Municipal Hospital IV
Memorial Hospital & Physician Group* IV
Mercy Health Love County IV
Mercy Hospital Ada III

10
Mercy Hospital Ardmore III
Mercy Hospital Healdton IV
Mercy Hospital Tishomingo IV
Pauls Valley General Hospital IV
Quartz Mountain Medical Center IV
Southwestern Medical Center IV
The Physicians' Hospital in Anadarko IV
Region 4— East Central
Bristow Memorial Hospital IV
Drumright Regional Hospital IV
EASTAR Health System III
Haskell County Community Hospital IV
Hillcrest Hospital Henryetta IV
Epic Medical Center IV
Memorial Hospital of Stilwell IV
Muscogee (Creek) Nation Medical Center IV
Muskogee Community Hospital* IV
Northeastern Health System III
Sequoyah County-City of Sallisaw Hospital IV
St. John Sapulpa IV
Wagoner Community Hospital IV
Region 5—SW
AllianceHealth Durant III
AllianceHealth Madill IV
AllianceHealth Seminole IV
Atoka County Medical Center IV
Choctaw Memorial Hospital IV
Creek Nation Community Hospital IV
Eastern Oklahoma Medical Center IV
Holdenville General Hospital IV
Latimer County General Hospital IV
Mary Hurley Hospital IV
McAlester Regional Health Center III
McCurtain Memorial Hospital IV
Pushmataha County-Town of Antlers Hospital Authority IV

11
Region 6—Central
INTEGRIS Canadian Valley Hospital III
Mercy Hospital El Reno IV
Mercy Hospital Logan County IV
Norman Regional Health System III
Prague Community Hospital IV
Purcell Municipal Hospital IV
St. Anthony Shawnee Hospital IV
Stroud Municipal Hospital IV
Region 7— Tulsa County
Bailey Medical Center IV
Hillcrest Hospital South III
Hillcrest Medical Center III
Oklahoma State University Medical Center III
Saint Francis Hospital Tulsa II
Saint Francis Hospital South III
St. John Broken Arrow IV
St. John Medical Center II
St. John Owasso IV
Region 8— Oklahoma County
AllianceHealth Deaconess III
AllianceHealth Midwest III
Community Hospital IV
INTEGRIS Baptist Medical Center III
INTEGRIS Health Edmond III
INTEGRIS Southwest Medical Center III
McBride Clinic Othopedic Hospital IV
Mercy Hospital Oklahoma City III
Oklahoma Heart Hospital IV
OU Medical Center I
OU Medical Center Edmond † I
St. Anthony Hospital III
Note: * indicates that hospitals were closed but submitted substantial data to OTR over 2009–2015. † indicates that it is a facility of another hospital under the same license.

12
Executive Summary
Demographics
Major trauma incidents increased an average of 1.4% per year from 2009 to 2015.
Quarter 3 (July–September) consistently had the highest number of reported patients.
By month, August had the highest frequency of trauma patients while February had the fewest
reported trauma patients.
Saturday had the most trauma incidents by day of the week.
The trauma incidents generally peaked around 19:00.
83.8% of trauma incidents occurred in the urban areas (Region 7 and 8).
29.9% of major trauma patients received definitive care at a Level I trauma center.
33.4% of major trauma patients received definitive care at a Level II trauma center.
82.0% of major trauma patients were reported as white.
Proportions of male and female patients were 60.5% and 39.5% respectively.
Among age groups, the age 65+ group had the highest proportion of trauma patients (34.7%),
followed by the age 15–24 group (12.8%).
System Entry
57.3% of major trauma patients arrived at definitive care directly and 38.5% of patients were
transferred to definitive care.
For patients arriving direct from the scene, 74.0% patients arrived by land ambulance, 13.4% by
helicopter ambulance, and 12.5% by private vehicle or walk-in.
For transferred trauma patients, 74.3% patients arrived by land ambulance, 23.6% by helicopter
ambulance, and 2.1% by private vehicle or walk-in.
Mechanism of Injury
Falls and MVC were the two leading mechanisms of injury, accounting for 42.4% and 25.9%,
respectively.
Falls had an increasing trend while the number injured in an MVC decreased slightly over this 6
year period.
90.2% of trauma was classified as blunt trauma.
Burn-related trauma was the least frequent mechanism (1.6%) but had the highest case-fatality rate
of 26.6%.
Falls consistently accounted for the greatest proportion of deaths, followed by MVC, ‘other’ injury
etiology, Motorcycle, and gunshot.
Gunshot injuries had the highest case-fatality rate of 32.8%, followed by pedestrian injuries with a
rate of 16.3%. Much of the fatality rate for gunshot wounds was attributable to suicides.

13
ED and ED Disposition
Patients with an ISS 16–24 spent an average of 4.2 hours in the ED before disposition.
91.1% of major trauma patients went to floor, ICU, and OR from the ED.
Hospital and ICU Days
Fall-related trauma patients accounted for the greatest number of hospital days (114,043 days).
The average length of stay (LOS) was longest for pedestrian-related trauma patients with an average
LOS of 9.3 days.
Patients with an ISS 9–14 accounted for the greatest number of total hospital days (155,224 days).
Patients in the ISS 25+ group had the longest average LOS of 12.7 days.
Average length of stay in Regions 7 and 8 were 7.5 and 7.7 days respectively, while LOS in other
regions varied from 5 to 6 days.
Patients injured by motorcycle, pedestrian, MVC, gunshot, and ‘other’ incidents had average ICU
stays of more than four days, whereas fall-related patients averaged two days in ICU.
The most severely injured patients (ISS 25+) had the longest average ICU stay (8.4 days) and
accounted for the greatest number of total of ICU days (50,770 days).
Average ICU days for patients treated at a Level I hospital was 5.4 days and for patients treated at a
Level II hospital the average ICU days was 3.7 days.
Outcomes
62.8% of Oklahoma major trauma patients had an ISS of 9–14.
Crude mortality rate for major trauma patients was 9.7% over the 6-year period, ranging from a
high of 10.1% in 2011 to a low of 9.4% in 2013.
The crude mortality rate among the most severely injured patients (ISS 25+) was 36.9%.
The mortality rate was highest among the age 65+ group at 43.7%, and lowest among the age 0–14
group at 4.3%.
The mortality rate for males was consistently higher than that of females across all age groups.
Average revised trauma score (RTS) values decreased with increasing injury severity for both
patients that lived and among those that died.
60.1% of major trauma patients were discharged to home.
19.4% and 14.0% of trauma patients were discharged to rehabilitation facilities or skilled nursing
facilities (SNF) respectively.
Injuries by Body Region
It was common for a major trauma patient to have significant injuries (AIS 2+) to more than one
body region (40.0%).
The most frequently injured single body region was extremity (27.7%), followed by head (20.2%),
thorax (6.8%), and abdomen (3.2%).

14
Internal organ injury was the most common injury type in the Head and Neck region, accounting
for 42.5% of injuries.
Fractures were the most common injuries in the Spine and Back region comprising 94.5% of
diagnoses.
Internal organ injury and fractures made up almost 51.9% of the diagnoses in the Torso region.
Fracture was the most common injury type in the Extremities, accounting for 67.8% of the
diagnoses.

15
In Oklahoma, major trauma incidents, with the exception of 2014, slowly increased from 2009 to
2015. On average, the number of trauma patients reported has increased 1.4% every year over this
period of time, which was slower than that from 2005 to 2008. Oklahoma’s estimated population
grew 5.2% from 2009 to 2015, whereas the reported major trauma incidents increased 9.9% over
this same 7-year period.
5948 6027 6087
63776564
63496538
2009 2010 2011 2012 2013 2014 2015
Year
0
2000
4000
6000
No
. o
f T
rau
ma
Pa
tie
nts
Chart 1. Major Trauma Patients by Year: 2009–2015

16
This chart illustrates the number of trauma patients by quarter over 2009–2015. Quarter 3
consistently had the most trauma patients, whereas Quarter 1 consistently had the fewest.
1414 1549 1619 1366
1305 1596 1637 1489
1366 1611 1669 1441
1412 1666 1698 1601
1448 1693 1784 1639
1534 1713 1689 1413
1497 1666 1749 1626
Q1 Q2 Q3 Q4
Quarter
0
2000
4000
6000
8000
10000
12000
No
. o
f T
rau
ma
Pa
tie
nts
2009
2010
2011
2012
2013
2014
2015
2015201420132012201120102009Year
Chart 2. Major Trauma Patients by Quarter: 2009–2015

17
The number of trauma patients peaked in August, while February had the fewest reported trauma
patients.
505 402 507 492 515 542 562 564 493 424 486 456
470 386 449 489 575 532 576 577 484 527 490 472
485 391 490 526 559 526 560 574 535 533 431 477
444 415 553 492 620 554 534 579 585 585 506 510
469 407 572 501 582 610 581 621 582 569 523 547
541 447 546 570 554 589 566 585 538 523 453 437
561 436 500 505 542 619 610 577 562 600 512 514
Jan. Feb. Mar. Apr. May Jun. Jul. Aug. Sep. Oct. Nov. Dec.
Month
0
1000
2000
3000
4000
No
. o
f T
rau
ma
Pa
tie
nts
2009
2010
2011
2012
2013
2014
2015
2015201420132012201120102009Year
Chart 3. Major Trauma Patients by Month: 2009–2015
18
The highest number of trauma patients was consistently on Saturday, followed by Sunday and
Friday. In comparison, the number of trauma incidents was stable from Monday to Thursday.
884776 1046904 788783 767
900765 969949 821816 807
805823 1089945 804788 833
889829 10861048 822887 816
942916 11291041 879844 813
905816 1086978 858856 850
948877 1108968 873875 889
Sunday Monday Tuesday Wednesday Thursday Friday Saturday
Weekday
0
2000
4000
6000
8000
No
. o
f T
rau
ma
Pa
tie
nts
2009
2010
2011
2012
2013
2014
2015
2015201420132012201120102009Year
Chart 4. Major Trauma Patients by Weekday: 2009–2015

19
Early morning hours (5:00–7:00) had the fewest trauma incidents. The number of trauma patients
thereafter increased until it peaked between 17:00–19:00). This pattern was consistent over 2009–
2015.
240 220 207 163 130 125 108 101 165 159 213 225 254 279 326 333 323 373 365 336 365 345 323 268
223 208 220 183 137 113 116 107 142 190 178 253 286 273 299 365 353 348 385 384 341 323 309 290
287 227 214 167 160 112 130 115 167 186 202 236 284 302 291 294 358 358 364 399 321 338 312 261
252 239 238 168 141 135 122 124 155 192 228 274 297 299 301 339 356 380 390 390 352 353 342 310
261 229 236 193 156 111 145 119 165 200 265 266 277 304 316 356 391 387 373 395 405 368 342 303
244 240 195 155 136 124 117 161 167 213 235 250 293 303 329 320 380 342 385 412 360 389 312 287
265 249 234 206 138 127 144 123 183 175 226 250 279 342 358 340 368 356 407 384 383 369 340 290
0 1 2 3 4 5 6 7 8 9 10 11 12 13 14 15 16 17 18 19 20 21 22 23
Hour
0
500
1000
1500
2000
2500
No
. o
f T
rau
ma
Pa
tie
nts
2009
2010
2011
2012
2013
2014
2015
2015201420132012201120102009Year
Chart 5. Major Trauma Patients by Hour: 2009–2015

20
This chart shows the number major trauma patients seen in each of Oklahoma’s eight Trauma
Regions. Region 8 (Oklahoma County) consistently had the most reported trauma patients,
followed by Region 7 (Tulsa County). The trauma incidents gradually increased over 2009–2015 in
Region 7 and 8, while many of the other regions saw a decrease.
207 219 491 59 66 305 1975 2626
177 183 433 88 59 204 2304 2579
119 223 341 98 51 161 2370 2724
146 175 327 103 41 136 2518 2931
129 136 330 68 73 194 2503 3131
146 119 391 41 103 146 2408 2995
101 103 390 27 70 123 2547 3177
Region 1 Region 2 Region 3 Region 4 Region 5 Region 6 Region 7 Region 8
Hospital Region
0
1000
2000
3000
No
. o
f T
rau
ma
Pa
tie
nts
2009
2010
2011
2012
2013
2014
2015
2015201420132012201120102009Year
Chart 6. Major Trauma Patients by Hospital Region: 2009–2015

21
The number of trauma patients cared for in a Level I hospital was steady over 2009–2011 but
increased thereafter. The number of trauma patients in Level II hospitals has gradually increased
over 2009–2015 but decreased in 2014, with a growth rate of 3.5%. In contrast, the number of
trauma patients has been decreasing in Level III hospitals with the exception of 2013 and has
remained stable in Level IV hospitals.
1677 1814 2255 202
1676 2015 2144 192
1701 2086 2072 228
1962 2158 2039 218
1925 2187 2224 228
2011 2152 2018 168
2167 2259 1978 134
Level 1 Level 2 Level 3 Level 4
Hospital Level
0
500
1000
1500
2000
No
. o
f T
rau
ma
Pa
tie
nts
2009
2010
2011
2012
2013
2014
2015
2015201420132012201120102009Year
Chart 7. Major Trauma Patients by Hospital Level: 2009–2015

22
This chart indicates how major trauma patients arrived at definitive care: 1) Direct from scene by
ambulance; 2) Direct from scene by privately owned vehicle (POV); and 3) Transfer from another
acute care hospital. Overall, 57.3% of major trauma patients arrived at definitive care directly from
scene by ambulance each year, however the proportion showed a decreasing trend over the six year
period 2009–2015.
3552 3464 3459 3614 3710 3604 3542
273 218 189 217 212 236 477
2057 2303 2412 2509 2545 2448 2514
2009 2010 2011 2012 2013 2014 2015
Year
0%
20%
40%
60%
Pe
rce
nt
Direct from Scene
Trauma Team/POV
Inter-Facil ity Transfer
Inter-Facility TransferTrauma Team/POVDirect from Scene
System Entry
Chart 8. Major Trauma Patients by System Entry: 2009–2015

23
The majority of major trauma patients were transported by land ambulance. The direct patients had
an increasing trend while the transferred patients increased in 2009–2013 but decreased in 2014–
2015. Helicopter ambulance was the next most frequent mode which remained relatively stable but
decreased in recent years. Private vehicle or walk-in was very common among direct patients.
Chart 9. Direct and Transferred Major Trauma Patients by Mode: 2009–2015
2015201420132012201120102009Year
Mode
14
33 15
81
16
53 17
89 1
99
41
91
11
83
5
53
76
06
64
76
30
47
34
57
52
8
49
55
65
50
45
51
36
Transferred
27
61
25
88
25
97 2
79
1 29
84
29
36
30
09
54
96
04
55
25
52
40
84
09 49
5
49
94
68
47
64
63
51
04
76
43
5
Direct
Ambulance
Land
Ambulance
Helicopter
Vehicle/Walk-in
Private
Ambulance
Land
Ambulance
Helicopter
Vehicle/Walk-in
Private
0
1000
2000
3000
No
. o
f T
rau
ma
Pa
tie
nts

24
White was the reported race more than 80.0% of the time among major trauma patients. There
was an increase in the number of white patients in 2012 and 2013, whereas the numbers for Black,
American Indian, and other races remained steady over the same period of time.
4914 427 265 41 240
4942 428 334 28 225
4885 463 360 41 246
5146 484 358 33 302
5337 459 382 47 242
5087 482 327 30 243
5090 529 385 47 345
White Black American Indian Asian Other
Race
0
1000
2000
3000
4000
5000
No
. o
f T
rau
ma
Pa
tie
nts
2009
2010
2011
2012
2013
2014
2015
2015201420132012201120102009Year
Chart 10. Major Trauma Patients by Race: 2009–2015

25
Males represented 60.4% of major trauma patients and females represented 39.6%. The numbers
of male and female major trauma patients grew at a rate of 1.1% and 1.9%, respectively.
3618 2322
3734 2288
3765 2315
3790 2535
3880 2681
3749 2576
3907 2631
Male Female
Gender
0
1000
2000
3000
4000
No
. o
f T
rau
ma
Pa
tie
nts
2009
2010
2011
2012
2013
2014
2015
2015201420132012201120102009Year
Chart 11. Major Trauma Patients by Gender: 2009–2015

26
The ratio of males to females started at just below 2 for age 0–14 group. From age 15 to 44, the
ratio increased to about 3 to 1. The ratio began to decrease in the age 45–54 group and finally
reversed to 0.68 to 1 among those 65 or older.
2194 4080 3838 3128 3739 3285 6178
1229 1523 1217 1109 1435 1802 9033
0-14 15-24 25-34 35-44 45-54 55-64 65+
Age Group
0
2000
4000
6000
8000
No
. o
f T
rau
ma
Pa
tie
nts
Male
Female
FemaleMaleGender
Chart 12. Major Trauma Patients by Gender and Age Group over 2009–2015

27
This graph exhibits the annualized, age-specific rate per 100,000 population by gender. The rates of
age 0–14 group between males and females were lower than other age groups, especially among
males. There was a large difference in rates by gender, with males having a higher rate until age
65+. The largest difference between males and females occurred in the age 25–34 group where the
rate for males was 3.1 times than that for females. The rates of age 65+ group were the highest
among all age groups; however, the rate for females was 1.2 times than that of males in this group.
78.0 209.1 207.4 190.3 212.6 209.1 373.3
45.0 83.1 67.7 68.1 80.6 108.4 429.4
0-14 15-24 25-34 35-44 45-54 55-64 65+
Age Group
100
200
300
400
An
nu
ali
ze
d R
ate
pe
r 100,0
00
Male
Female
FemaleMaleGender
Chart 13. Age Specific Rate by Gender over 2009–2015

28
The injury categories used are based on the primary E-code (external cause of injury code). Falls
and MVC were the two major causes of trauma, representing 42.4% and 25.9%, respectively.
Within this seven category grouping there were 15.0% of trauma patients with an etiology of
‘other’, which includes things such as unarmed assault, animal-related injuries, and other specific
injury etiologies that do not fit in the other categories.
42.4%
25.9%
15.0%
6.2%4.9%
2.9% 2.8%
Falls MVC Other Motorcycle Gunshot Pedestrian Stabbing
Injury Etilogy
0%
10%
20%
30%
40%
Pe
rce
nt
(%)
Chart 14. Major Trauma Patients by Injury Etiology over 2009–2015

29
This chart further examines injury etiology by year. Falls were the most common injury etiology.
The major trauma patients due to falls increased 4.0% per year on average, while the patients due
to MVC decreased 1.1% per year over 2009–2015. In contrast, the proportion of other injury
etiologies such as motorcycle, pedestrian-related, and gunshot were relatively stable.
1672 384 179 280 204 2312 910
1663 447 162 279 179 2286 995
1635 405 185 299 169 2382 997
1701 407 176 338 151 2654 938
1588 391 195 287 166 3014 919
1544 311 170 292 172 2966 889
1539 364 216 376 172 2956 915
MVC Motorcycle Pedestrian Gunshot Stabbing Falls Other
Injury Etilogy
0
1000
2000
3000
No
. o
f T
rau
ma
Pa
tie
nts
2009
2010
2011
2012
2013
2014
2015
2015201420132012201120102009Year
Chart 15. Major Trauma Patients by Injury Etiology: 2009–2015
30
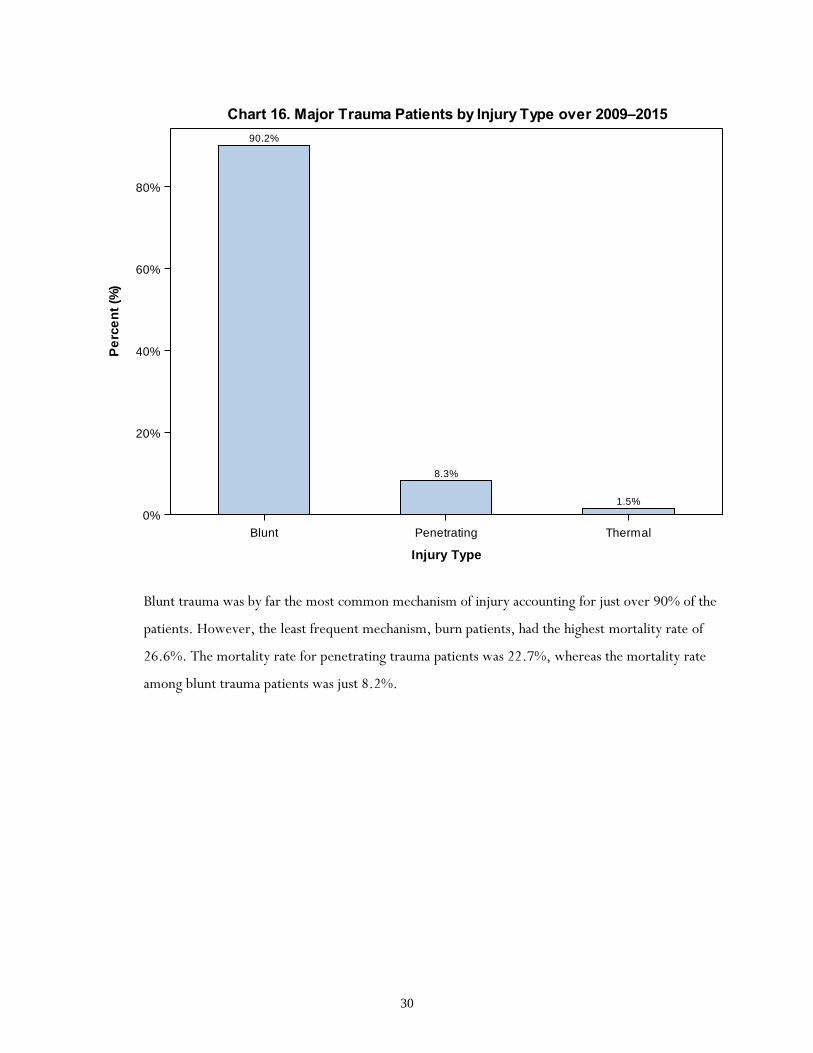
Blunt trauma was by far the most common mechanism of injury accounting for just over 90% of the
patients. However, the least frequent mechanism, burn patients, had the highest mortality rate of
26.6%. The mortality rate for penetrating trauma patients was 22.7%, whereas the mortality rate
among blunt trauma patients was just 8.2%.
90.2%
8.3%
1.5%
Blunt Penetrating Thermal
Injury Type
0%
20%
40%
60%
80%
Pe
rce
nt
(%)
Chart 16. Major Trauma Patients by Injury Type over 2009–2015

31
The number blunt trauma patients increased 1.3% per year from 2009 to 2015, whereas the
penetrating and thermal trauma patients remained stable.
5338 81 515
5394 128 497
5472 106 501
5735 99 532
5971 91 491
5751 82 495
5830 87 605
Blunt Thermal Penetrating
Injury Type
0
1000
2000
3000
4000
5000
6000
No
. o
f T
rau
ma
Pa
tie
nts
2009
2010
2011
2012
2013
2014
2015
2015201420132012201120102009Year
Chart 17. Major Trauma Patients by Injury Type: 2009–2015

32
Injury Severity Score (ISS) groups for major trauma patients are shown here by year. The ISS 1–8
group was smaller as it consisted of patients that died or had a survival probability below 0.90,
which were uncommonly seen in patients with an ISS below 9. The greatest increases occurred at
the ISS threshold of 9 while the numbers of the most severely injured remained fairly stable.
86 3784 1192 872
94 3811 1200 911
76 3715 1304 971
81 3953 1354 973
96 4165 1321 970
105 4013 1268 953
119 4075 1378 958
ISS 1-8 ISS 9-14 ISS 16-24 ISS 25+
ISS Group
0
1000
2000
3000
4000
No
. o
f T
rau
ma
Pa
tie
nts
2009
2010
2011
2012
2013
2014
2015
2015201420132012201120102009Year
Chart 18. Major Trauma Patients by ISS Group: 2009–2015

33
Each line above represents an ISS group and shows the mean minutes spent in the emergency
department by year. Only patients at the definitive care facility are included, so the graph
represents the time in the ED before being sent to the floor, ICU, OR, or morgue. Again, there
were very few major trauma patients with an ISS 1-8 which made variability in that group much
higher. Patients with an ISS of 16 to 24 consistently spent the most time in the ED.
151.7
223.1
229.1
194.0
136.8
224.4
226.4
184.1
129.1
222.8
225.0
188.0
105.6
229.1
241.2
178.7
153.1
234.3
264.3
203.0
201.2
247.5
274.6
202.0192.7
278.5302.0
223.2
2009 2010 2011 2012 2013 2014 2015
Year
0
50
100
150
200
250
300
Min
ute
s in
ED
ISS 25+ISS 16-24ISS 9-14ISS 1-8ISS Group
Chart 19. Mean Minutes in the ED by ISS Group: 2009–2015

34
Patients across all seven years were aggregated according to their ISS value and the columns show
the average number of minutes spent in the ED before disposition. Again, it can be seen that
patients with an ISS of 16–24 spent the longest time in the ED, averaging more than four hours
over this seven year period. The patients in the ISS 9–14 group spent about 15 minutes less than the
ISS 16-24 group, while those in ISS 25+ group spent 41 minutes less.
156.8
237.6
252.5
196.1
ISS 1-8 ISS 9-14 ISS 16-24 ISS 25+
ISS Group
0
50
100
150
200
250
Min
ute
s in
ED
Chart 20. Mean Minutes in the ED by ISS Group over 2009–2015

35
Each line above represents the mean minutes spent in the emergency department by system entry:
1) Direct from scene by ambulance; 2) Direct from scene by privately owned vehicle (POV); and
3) Transfer from another acute care hospital. Patients arriving directly from scene by ambulance
spent 20–30 minutes longer in the ED than transferred patients over 2009–2012 but reversed over
2013–2015. Moreover, the average time in the ED for patients arriving by POV had a decreasing
trend over 2009–2013 but increased over 2014–2015.
228.2
258.3
195.8
227.8
244.2
196.2
224.9
237.0
201.0
231.3
232.2
208.0
243.1
224.5
224.5
247.8
239.2244.1
268.6259.7
284.1
2009 2010 2011 2012 2013 2014 2015
Year
0
50
100
150
200
250
300
Min
ute
s in
ED
Inter-Facility TransferTrauma Team/POVDirect from Scene
System Entry
Chart 21. Mean Minutes in the ED by System Entry at Definitive Care: 2009–2015

36
Mean minutes in the ED are shown by ED disposition and year. Four major ED dispositions—
floor, ICU, OR, and morgue—were selected for this chart. Patients sent to ICU or to the Floor
had nearly identical ED time in 2009; however, the gap between them has been increasing up to 30
minutes in recent years. Mean time to OR has remained fairly stable at just under 3 hours but
increased in 2015. The mean time in the ED for patients that died varied from a low of 85.8
minutes in 2009 to a high of 121.0 minutes in 2011.
85.8
235.6
239.9
157.1
94.5
238.8
227.3
169.5
121.0
232.6
224.0
163.7
91.3
254.0
218.0
168.9
119.1
256.8
237.1
172.8
101.6
270.4
245.0
172.6
112.3
306.4
276.1
197.3
2009 2010 2011 2012 2013 2014 2015
Year
0
50
100
150
200
250
300
Min
ute
s in
ED
ORICUFloorMorgueED Disposition
Chart 22. Mean Minutes in the ED by ED Disposition: 2009–2015

37
The columns above indicate the unadjusted mortality proportions for each year. The average
mortality proportion over 7-year period was 9.4%; ranging from a high of 10.1% in 2011 to a low
of 9.4% in 2013.
9.5
10 10.19.9
9.4 9.5
10
2009 2010 2011 2012 2013 2014 2015
Year
0
2
4
6
8
10
12
Pro
po
rtio
n (
%)
Chart 23. Mortality Proportion by Year: 2009–2015

38
Note: ISS 1–8 group was excluded because many of these patients only met major trauma criteria
because they died, which artificially inflated the mortality rate.
Mortality rates are shown for each ISS category by year. Mortality among patients with ISS of 9–14
was low and virtually unchanged over the seven year period. Mortality among patients with ISS of
16–24 also remained fairly stable across the years but jumped in 2015. The overall mortality rate
among the most severely injured patients (ISS 25+) was 36.8% ranging from a high of 38.1% in
2011 to a low of 36.0% in 2013.
2.73.3 2.8 2.6 2.8 3 3
76.2 6.1
76.3
5.2
7.5
36.537.1
38.1 38
36 36.2 36.2
ISS 9-14 ISS 16-24 ISS 25+
ISS Group
0
10
20
30
40
Pe
rce
nt
(%)
2015201420132012201120102009Year
Chart 24. Mortality Rate by ISS Group: 2009–2015

39
The columns above indicate the mortality rates per 100,000 population by age group for 2009–
2014. The mortality rate for the age 0–14 group was the lowest at 4.3, whereas the highest
mortality rate was seen in the age 65+ group at 43.7. In comparison, the other age groups had a
similar mortality rate, with an average of 14.1.
4.3
14.413.3
14.1 14.1 14.4
43.7
0-14 15-24 25-34 35-44 45-54 55-64 65+
Age Group
0
10
20
30
40
Mo
rta
lity
Ra
te p
er
100,0
00
Chart 25. Age Specific Mortality Rates over 2009–2015

40
The mortality rates per 100,000 population above are shown for each age group and year. The
greatest variation over time was seen among older age groups from age 25 to 64, whereas the least
variation was among younger age groups from 0 to 24. The rates were dramatically higher among
the 65+ age group and were primarily related to falls.
4.5 16.5 10.5 16.5 13.5 10.5 42.0
4.5 16.5 12.0 12.0 15.0 10.5 48.0
6.0 13.5 15.0 10.5 15.0 18.0 42.0
3.0 13.5 15.0 18.0 13.5 13.5 43.5
4.5 12.0 9.0 13.5 16.5 19.5 42.0
3.0 12.0 15.0 12.0 10.5 13.5 46.5
4.5 16.5 16.5 16.5 15.0 15.0 42.0
0-14 15-24 25-34 35-44 45-54 55-64 65+
Age Group
0
10
20
30
40
50
Mo
rta
lity
Ra
te p
er
100,0
00
2009
2010
2011
2012
2013
2014
2015
201520142013
2012201120102009
Year
Chart 26. Age Specific Mortality Rates by Year: 2009–2015

41
Mortality rates for females and males by age group are shown above. The mortality rate for males
remained consistently higher than that of females across all the age groups. The mortality rate for
males was just slightly higher than females in the 0–14 age group, whereas the rate for males was
triple that of females from age 15 to 64. The mortality rates for both females and males were much
higher in the 65+ age group.
5.1 21.4 21.0 21.9 21.9 21.9 51.4
3.4 7.3 5.6 6.4 6.4 6.9 36.0
0-14 15-24 25-34 35-44 45-54 55-64 65+
Age Group
10
20
30
40
50
An
nu
ali
ze
d M
ort
ali
ty R
ate
pe
r 100,0
00
Male
Female
FemaleMaleGender
Chart 27. Age Specific Mortality by Gender: 2009–2015

42
The relationship between the revised trauma score (RTS) and ISS is illustrated above. The RTS is a
composite measure based on the initial hospital vital signs of a trauma patient. It ranges from 7.841
to 0, with higher values indicating better vital signs. It includes the Glasgow Coma Scale score,
systolic blood pressure, and unassisted respiratory rate. In this chart, the RTS was based on the
initial vital signs measured in the definitive care ED. As expected RTS values decreased with
increasing injury severity for both survivors and patients that died. However, the differences in
RTS scores of survivors and patients that died were large even within the same ISS group.
7.678
5.323
7.322
3.991
6.423
3.348
ISS 9-14 ISS 16-24 ISS 25+
ISS Group
0
1
2
3
4
5
6
7
8
Me
an
Re
vis
ed
Tra
um
a S
co
re
DiedAliveDischarge Status
Chart 28. Mean Revised Trauma Score by ISS Group and Discharge Status: 2009–2015

43
The proportional distribution of ED disposition locations are shown above. More than ninety
percent of the patients were sent to floor, ICU, and OR. There were 3.1% of major trauma
patients sent directly to morgue from ED.
43.3%
32.1%
15.7%
3.1%
1.7% 1.7% 1.3% 1.2%
Floor ICU OR Morgue Telemetry Stepdown Other Home
ED Disposition
0%
10%
20%
30%
40%
Pe
rce
nt
(%)
Chart 29. Major Trauma Patients by ED Disposition: 2009–2015

44
Each window shows ED disposition location according to the patient’s ISS group. Patients within
the ISS 1–8 group represent a very small group because they typically only meet Oklahoma’s Major
Trauma Criteria by either dying or because of very poor vital signs at system entry. Because of the
aforementioned reasons among those in the ISS 1-8 group 48.7% were sent to ICU and 30.3%
were sent directly to the morgue. Just 63.6% of trauma patients with an ISS of 9–14 were sent to
floor, whereas more than 50.0% of trauma patients with an ISS of 16 or higher were disposed to
the ICU. About 93.5% of patients with an ISS of 25+ were sent to either the ICU, OR, or Morgue.
Chart 30. Major Trauma Patients by ED Disposition and ISS Group: 2009–2015
ISS Group
No
. o
f T
rau
ma
Pa
tie
nts
9.9%
6.5%
57.2%
26.4%
ISS 25+
2.6%
27.4%
52.9%
17.1%
ISS 16-24
0.9%
63.6%
21.3%
14.3%
ISS 9-14
30.3%
15.4%
48.7%
5.5%
ISS 1-8
Morgue Floor ICU ORMorgue Floor ICU OR
0%
20%
40%
60%
0%
20%
40%
60%

45
Each column shows hospital discharge destination proportions for patients that survived to
discharge. There were 60.1% of major trauma patients sent to home without mention of home
healthcare. Slightly over 33% of the patients were discharged to a rehabilitation (Rehab) or skilled
nursing facility (SNF).
60.1%
19.4%
14.0%
6.4%
Home Rehab SNF Home,Healthcare
Hospital Discharge
0%
20%
40%
60%
Pe
rce
nt
(%)
Chart 31. Major Trauma Patients by Hospital Discharge: 2009–2015
46
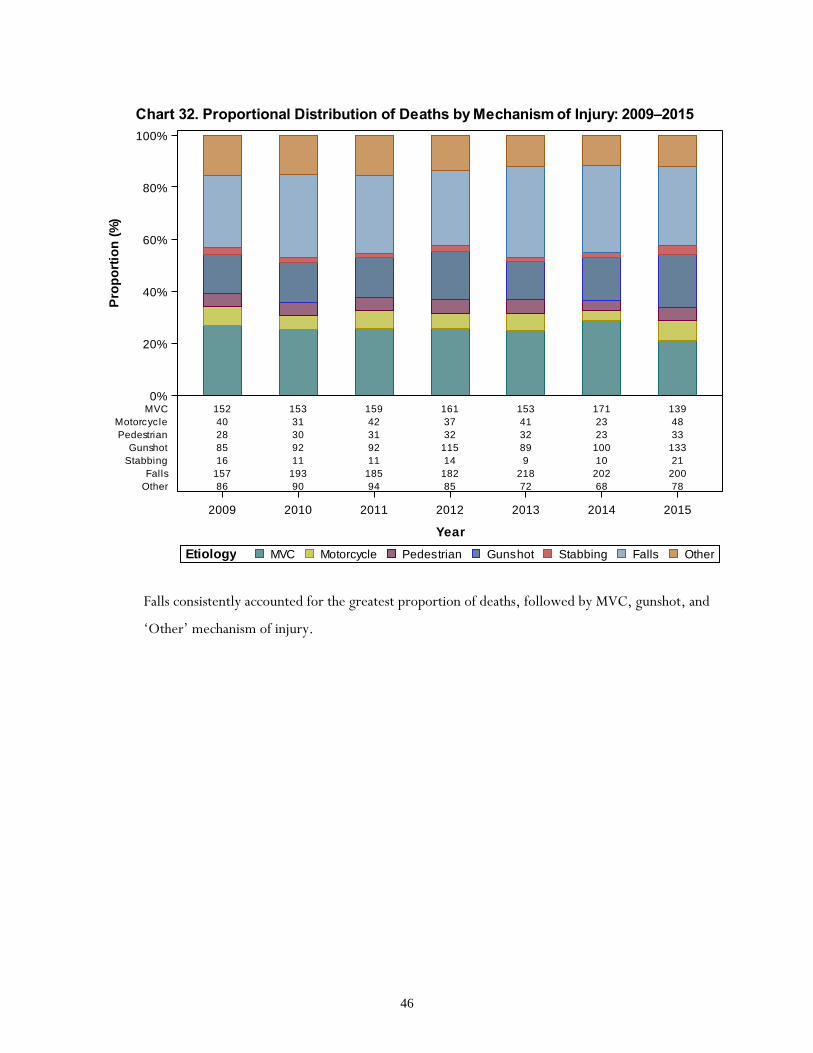
Falls consistently accounted for the greatest proportion of deaths, followed by MVC, gunshot, and
‘Other’ mechanism of injury.
152 153 159 161 153 171 139
40 31 42 37 41 23 48
28 30 31 32 32 23 33
85 92 92 115 89 100 133
16 11 11 14 9 10 21
157 193 185 182 218 202 200
86 90 94 85 72 68 78
2009 2010 2011 2012 2013 2014 2015
Year
0%
20%
40%
60%
80%
100%
Pro
po
rtio
n (
%)
MVC
Motorcycle
Pedestrian
Gunshot
Stabbing
Falls
Other
OtherFallsStabbingGunshotPedestrianMotorcycleMVCEtiology
Chart 32. Proportional Distribution of Deaths by Mechanism of Injury: 2009–2015

47
The left side y-axis indicates the number of trauma cases, whereas the right y-axis indicates the
case-fatality rate by mechanism of injury. The majority of trauma deaths were due to MVC and fall;
however, gunshot injuries had the highest case-fatality rate of 32.8%. The high case-fatality rate for
gunshot wounds is driven in part by firearm suicides, which carry a very high case-fatality rate.
Pedestrian injuries had the next highest rate at 16.3% and falls had the lowest at 7.2%. MVC and
motorcycle had very similar case-facility rates of 9.6% and 9.7%, respectively.
90.4%
9.6%
90.3%
9.7%
83.7%
16.3%
67.2%
32.8%
92.8%
7.2%
91.3%
8.7%
92.4%
7.6%
10254 2447 1073 1445 17228 5990 1121
1088 262 209 706 1337 573 92
MVC Motorcycle Pedestrian Gunshot Falls Other Stabbing
Mechanism of Injury
0
5000
10000
15000
No
. o
f T
rau
ma
Pa
tie
nts
0%
10%
20%
30%
40%
Ca
se F
acil
ity (
%)
Alive
Died
DiedAliveDischarge Status
Chart 33. Mechanism of Injury by Outcome: 2009–2015

48
This chart further examines specific case-fatality rates by mechanism of injury and year. The
greatest variation was seen for the four least frequently reported etiologies: gunshot, motorcycle,
stabbing, and pedestrian injuries. The case-fatality rates for the other etiologies were fairly stable
over 2009–2015.
9.1 9.2 9.7 9.5 9.6 11.1 9.0
10.4 6.9 10.4 9.1 10.5 7.4 13.2
15.6 18.5 16.8 18.2 16.5 13.5 15.3
30.4 33.0 30.8 34.0 31.0 34.2 35.4
7.8 6.1 6.5 9.3 5.4 5.8 12.2
6.8 8.4 7.8 6.9 7.2 6.8 6.8
9.5 9.0 9.4 9.1 7.8 7.6 8.5
2009 2010 2011 2012 2013 2014 2015
10
20
30
Ca
se F
ata
lity
Ra
te (
%)
MVC
Motorcycle
Pedestrian
Gunshot
Stabbing
Falls
Other
OtherFallsStabbing
GunshotPedestrianMotorcycleMVC
Etiology
Chart 34. Case Fatality Rate by Mechanism of Injury: 2009–2015

49
Among survivors, almost half of the patients were sent to the floor from the ED. The ICU was next
most frequent discharge location for survivors. Among those that died, 42.6% of the patients were
sent to ICU and 33.1% of the patients were discharged directly to the morgue from the ED
indicating the death occurred very soon after arrival.
17988 443
11959 1711
6136 533
1327
Alive Died
0%
10%
20%
30%
40%
50%P
rop
ort
ion
(%
)
Floor
ICU
OR
Morgue
MorgueORICUFloorDischarge Status
Chart 35. ED Disposition by Discharge Status: 2009–2015

50
Total hospital days by etiology followed the frequency of reported trauma patients for each injury
etiology. Falls and MVC were the most frequently reported etiology, and therefore constituted the
largest total number of hospital days.
114043
94566
49718
24517
18228
11866
6878
Falls MVC Other Motorcycle Gunshot Pedestrian Stabbing
Etiology
0
20000
40000
60000
80000
100000
120000
No
. o
f D
ays
Chart 36. Total Hospital Days by Etiology: 2009–2015

51
Patients in the ISS 9–14 group accounted for the largest number of total hospital days (48.5%). The
patients in the ISS 25+ group had the second largest number of total hospital days (26.2%) even
though the number of patients in this group was less than that of ISS 16–24 group (24.3%).
3073
155224
77862
83759
ISS 1-8 ISS 9-14 ISS 16-24 ISS 25+
ISS Group
0
50000
100000
150000
No
. o
f D
ays
Chart 37. Total Hospital Days by ISS Group: 2009–2015

52
The greatest number of the total ICU days was accounted for by patients in the ISS 25+ group
(43.8%), followed by the ISS 16–24 group (29.3%).
1614
29472
33962
50770
ISS 1-8 ISS 9-14 ISS 16-24 ISS 25+
ISS Group
0
10000
20000
30000
40000
50000
No
. o
f D
ays
Chart 38. Total ICU Days by ISS Group: 2009–2015

53
Pedestrian and motorcycle related trauma had the longest average stay with an average of 9.2 days
in hospital. The shortest average stay was 5.7 days among stabbing-related patients.
9.39.1
8.58.3
7.6
6.1
5.7
Pedestrian Motorcycle Gunshot MVC Other Falls Stabbing
Etiology
0
2
4
6
8
Me
an
No
. o
f D
ays
Chart 39. Mean LOS in Days by Etiology: 2009–2015

54
Patients in with an ISS 1-8 had an average length of stay of 4.7 days while patients in the ISS 25+
group had an average length of stay of nearly 2 weeks.
4.7
5.6
8.6
12.7
ISS 1-8 ISS 9-14 ISS 16-24 ISS 25+
ISS Group
0.0
2.5
5.0
7.5
10.0
12.5
Me
an
No
. o
f D
ays
Chart 40. Mean LOS in Days by ISS Group: 2009–2015

55
Trauma patients in Region 7 and 8 had almost the same average LOS at nearly 8 days. Mean LOS
for patients cared for in other regions ranged from 5 to 6 days.
5.6
4.8
5.95.7
5.5 5.4
7.57.7
Region 1 Region 2 Region 3 Region 4 Region 5 Region 6 Region 7 Region 8
Hospital Region
0
2
4
6
8
Me
an
No
. o
f D
ays
Chart 41. Mean LOS in Days by Hospital Region over 2009–2015

56
The patients treated in a Level I hospital stayed 8.4 days on average, followed by patients treated in
a Level II for 7.4 days. The patients in Level III and IV stayed averaged 6.4 days and 5.3 days
respectively over the 7-year period.
8.4
7.4
6.4
5.3
Level 1 Level 2 Level 3 Level 4
Hospital Level
0
2
4
6
8
Me
an
No
. o
f D
ays
Chart 42. Mean LOS in Days by Hospital Level: 2009–2015

57
Trauma patients injured in motorcycle crashes had an average ICU stay of nearly five days. The
patients injured due to pedestrian, MVC, and gunshot had average ICU stays of more than four
days. The patients injured due to falls averaged only two days in ICU, the shortest among these
etiologies.
4.9
4.74.5
4.4
4.1
2.4
2.0
Motorcycle Pedestrian MVC Gunshot Other Stabbing Falls
Etiology
0
1
2
3
4
5
Me
an
No
. o
f D
ays
Chart 43. Mean ICU Days by Etiology: 2009–2015

58
Mean ICU days by ISS group are shown above. The ISS 1–8 group was excluded due to the large
variability created by few patients. Patients with an ISS of 25+ stayed the longest in ICU due to
their severe injuries. In contrast, the patients in ISS 9–14 group averaged just 1.4 days in ICU.
1.4
4.5
8.4
ISS 9-14 ISS 16-24 ISS 25+
ISS Group
0
2
4
6
8
Me
an
No
. o
f D
ays
Chart 44. Mean ICU Days by ISS Group: 2009–2015

59
The patients treated in a Level I hospital had the longest average ICU stay at 5.4 days , followed by
patients treated in a Level II at 3.7 days. In contrast, ICU stays were much less common for
patients treated in Level III and IV facilities overall and the stays were much shorter, averaging just
1.8 days and 0.5 days respectively.
* Many level IV facilities do not have an ICU.
5.4
3.7
1.8
0.5
Level 1 Level 2 Level 3 Level 4
Hospital Level
0
1
2
3
4
5
Me
an
No
. o
f D
ays
Chart 45. Mean ICU Days by Hospital Level: 2009–2015
60
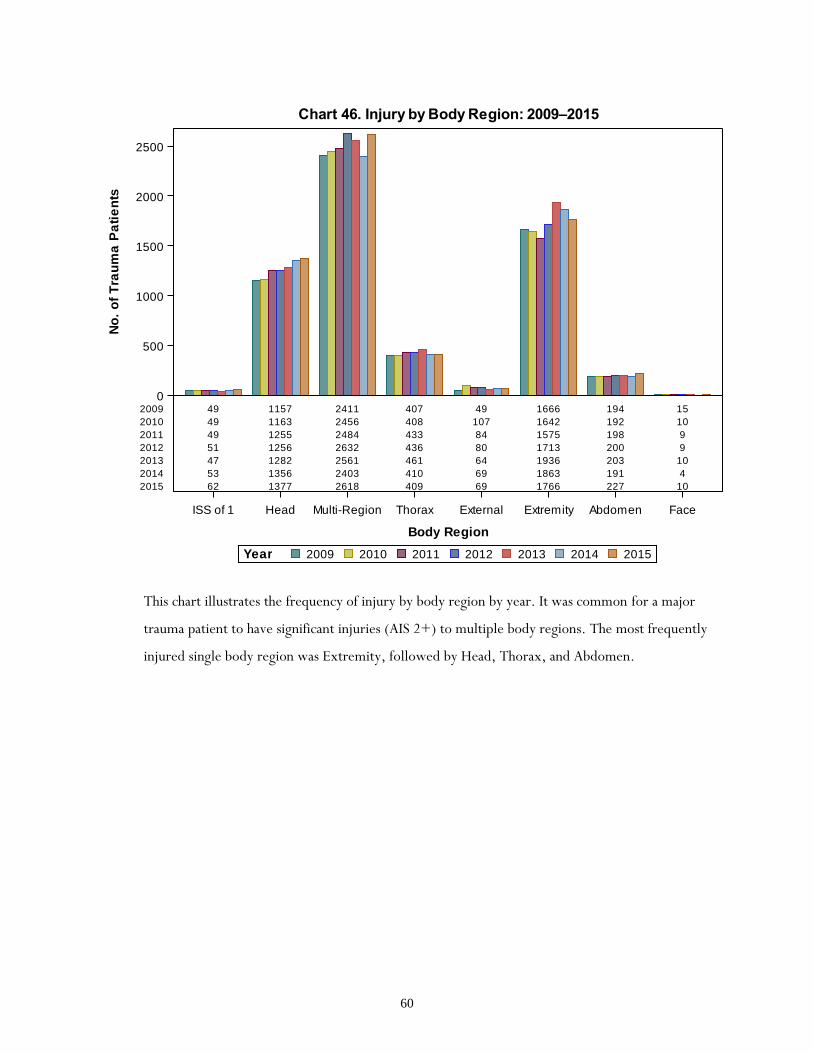
This chart illustrates the frequency of injury by body region by year. It was common for a major
trauma patient to have significant injuries (AIS 2+) to multiple body regions. The most frequently
injured single body region was Extremity, followed by Head, Thorax, and Abdomen.
49 1157 2411 407 49 1666 194 15
49 1163 2456 408 107 1642 192 10
49 1255 2484 433 84 1575 198 9
51 1256 2632 436 80 1713 200 9
47 1282 2561 461 64 1936 203 10
53 1356 2403 410 69 1863 191 4
62 1377 2618 409 69 1766 227 10
ISS of 1 Head Multi-Region Thorax External Extremity Abdomen Face
Body Region
0
500
1000
1500
2000
2500
No
. o
f T
rau
ma
Pa
tie
nts
2009
2010
2011
2012
2013
2014
2015
2015201420132012201120102009Year
Chart 46. Injury by Body Region: 2009–2015

61
The proportional distribution of injury by body region is shown above. About 40.0% of major
trauma patients had multiple body regions injured. Extremity, Head, and Thorax were the top
three single body regions injured, together accounting for 54.7% of the patients.
40.0%
27.7%
20.2%
6.8%
3.2%
1.2% 0.8%0.2%
Multi-Region Extremity Head Thorax Abdomen External ISS of 1 Face
Body Region
0%
10%
20%
30%
40%
Pe
rce
nt
Chart 47. Injury by Body Region over 2009–2015
62
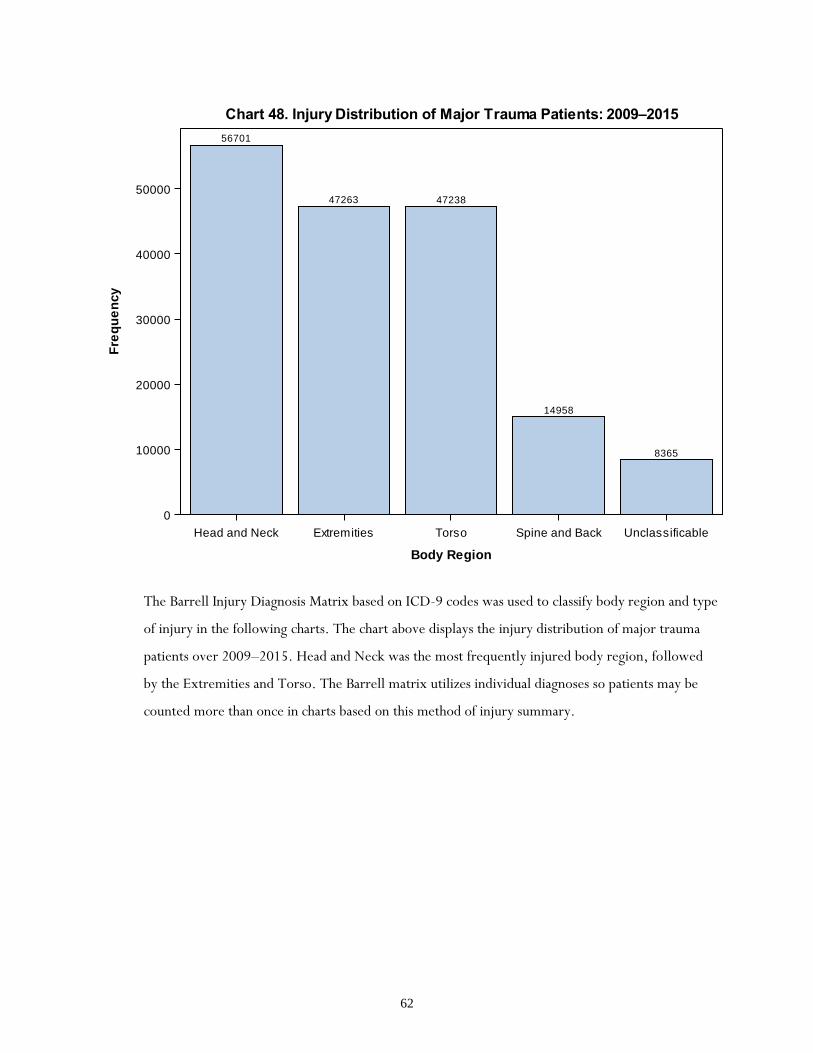
The Barrell Injury Diagnosis Matrix based on ICD-9 codes was used to classify body region and type
of injury in the following charts. The chart above displays the injury distribution of major trauma
patients over 2009–2015. Head and Neck was the most frequently injured body region, followed
by the Extremities and Torso. The Barrell matrix utilizes individual diagnoses so patients may be
counted more than once in charts based on this method of injury summary.
56701
47263 47238
14958
8365
Head and Neck Extremities Torso Spine and Back Unclassificable
Body Region
0
10000
20000
30000
40000
50000
Fre
qu
en
cy
Chart 48. Injury Distribution of Major Trauma Patients: 2009–2015

63
Internal organ injury was most common and accounted for 42.3% of injuries in the Head and Neck
area. Fractures were next most common type of injury.
24064
14482
9033
7456
980527
95 56
Internal Organ
Fractures
Superficial/C
ontusion
Open W
ounds
Unspecified
Blood Vessels
Nerves
Dislocation
Diagnosis
0
5000
10000
15000
20000
25000
Fre
qu
en
cy
Chart 49. Type of Injury by Head and Neck of Major Trauma Patients: 2009–2015

64
Fractures were by far the most common type of injury in the Spine and Back region accounting for
94.5% of the diagnoses.
14136
430 262 130
Fractures Internal Organ Dislocation Sprains and Strains
Diagnosis
0
5000
10000
15000
Fre
qu
en
cy
Chart 50. Type of Injury by Spine and Back of Major Trauma Patients: 2009–2015

65
The top three common injury types—internal organ, fracture, and superficial/contusion—
accounted for 93.9% of total injuries by Torso.
24481
15537
4275
1871
599 388 19 17
Internal Organ
Fractures
Superficial/C
ontusion
Open W
ounds
Blood Vessels
Unspecified
Crushing
Nerves
Diagnosis
0
5000
10000
15000
20000
25000
Fre
qu
en
cy
Chart 51. Type of Injury by Torso of Major Trauma Patients: 2009–2015

66
Fracture was the most common injury type to the extremities, accounting for 67.8%.
Superficial/contusion injury and open wounds were the next most frequent injury types accounting
for 13.3% and 11.2% respectively.
32046
62655278
1344818 757 352 164 142 80
Fractures
Superficial/C
ontusion
Open W
ounds
Dislocation
Sprains and S
trains
Blood Vessels
Nerves
Amputations
Unspecified
Crushing
Diagnosis
0
10000
20000
30000
Fre
qu
en
cy
Chart 52. Type of Injury by Extremities of Major Trauma Patients: 2009–2015