Embed Size (px)
Citation preview
Copyright © 2014 Board of Regents of the University of Oklahoma. Oklahoma Monthly Climate Summary 1
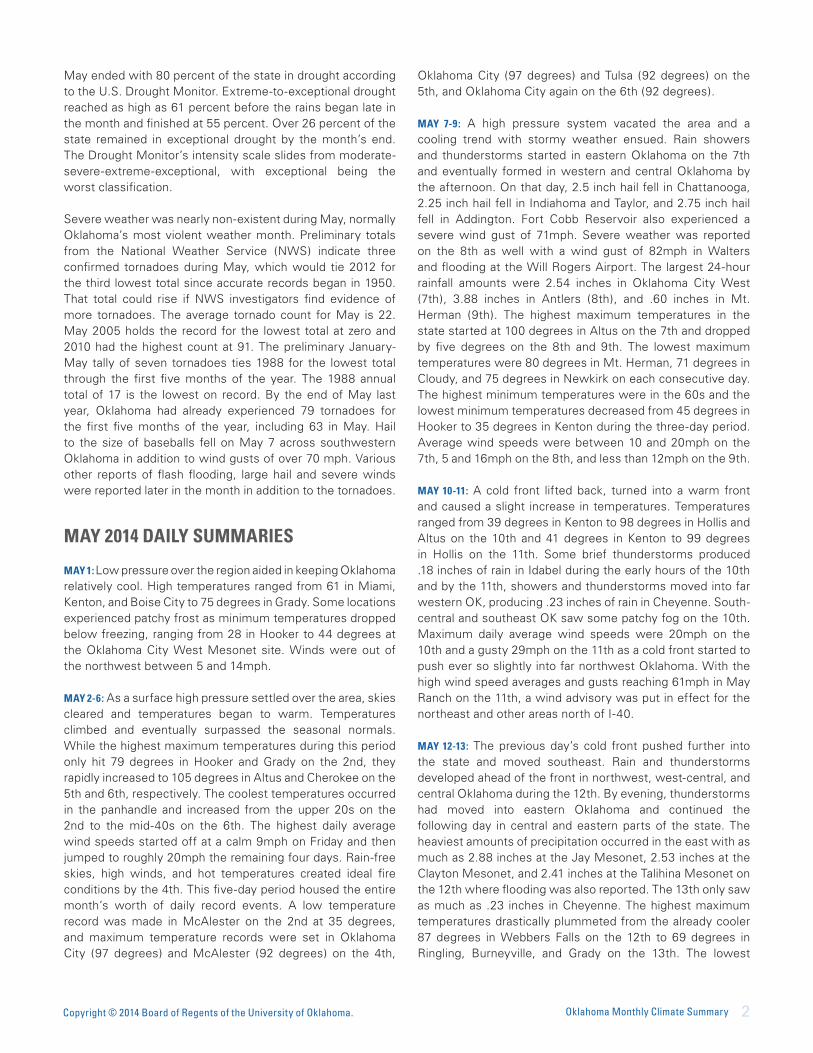
Drought made significant advances across Oklahoma through the first three weeks of May, aided by a string of hot, windy days coupled with a persistent absence of spring rains. The prolonged drought preempted the normal spring green-up of vegetation and extended the wildfire season well into May. Fire danger rose to extreme levels prompting a state of emergency declaration by the Governor as well as a burn ban for 36 counties across central and western Oklahoma. More than 30,000 acres were burned in wildfires in just a few days during the month’s second week, including a fire in Noble County that killed one person and destroyed or damaged 60 properties. Relief finally arrived in the form of a slow-moving upper-level low pressure system camped over the Desert Southwest. The spinning storm system allowed for ample moisture return into the Southern Plains from the Gulf of Mexico, an ingredient sorely lacking with other systems since the beginning of the year. The event’s first impacts were felt on the 21st with a few showers in the Panhandle and continued through the end of the month as the storm moved slowly east and meandered about the Ark-La-Tex region. Rain fell somewhere in Oklahoma on each of May’s final 11 days.
MAY 2014Oklahoma Monthly Climate Summary
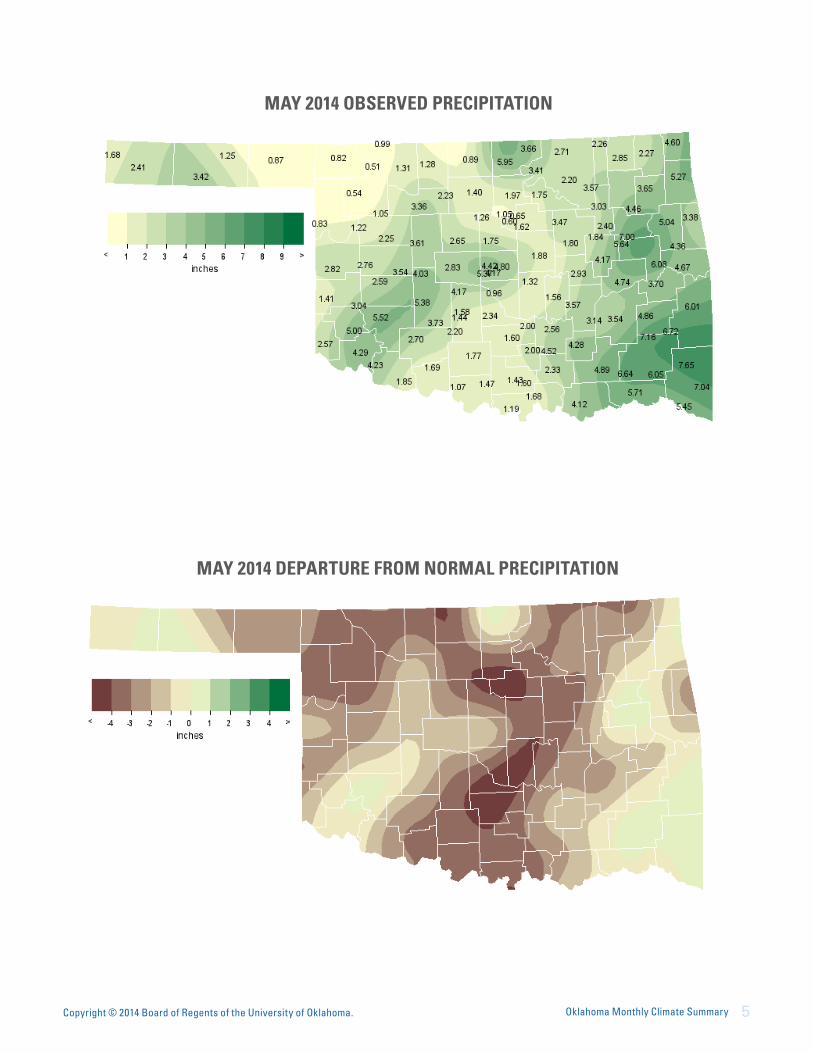
those areas, respectively. The lowest May total, 0.51 inches, was recorded at the Freedom Mesonet site. Oklahoma’s climatological spring (March-May) ended as the 10th driest on record with a statewide average of 6.50 inches, 5.18 inches below normal. The January-May ranking was worse with an average of 7.32 inches, 7.57 inches below normal and the third driest such period on record. The first five months of the year were the sixth driest for Tulsa with a total of 8.45 inches, approximately 8 inches below normal. Oklahoma City shared a similar fate with 7.13 inches, a deficit of about 6.5 inches to rank as the ninth driest such period on record.
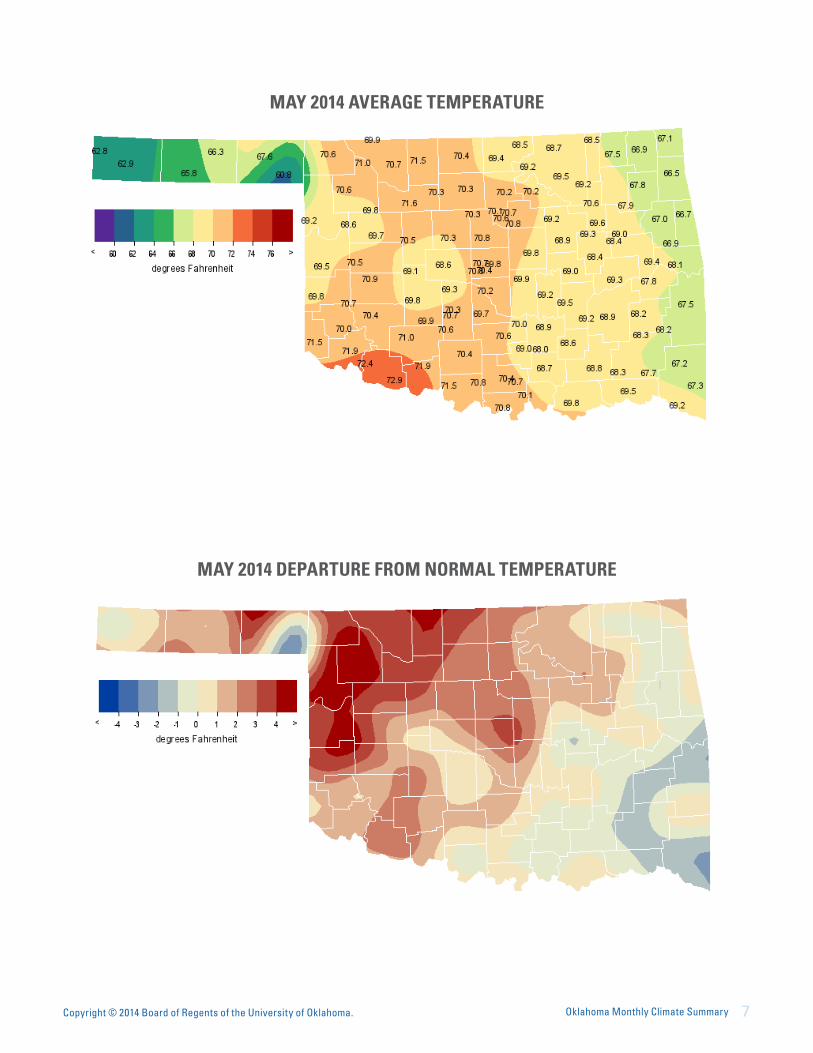
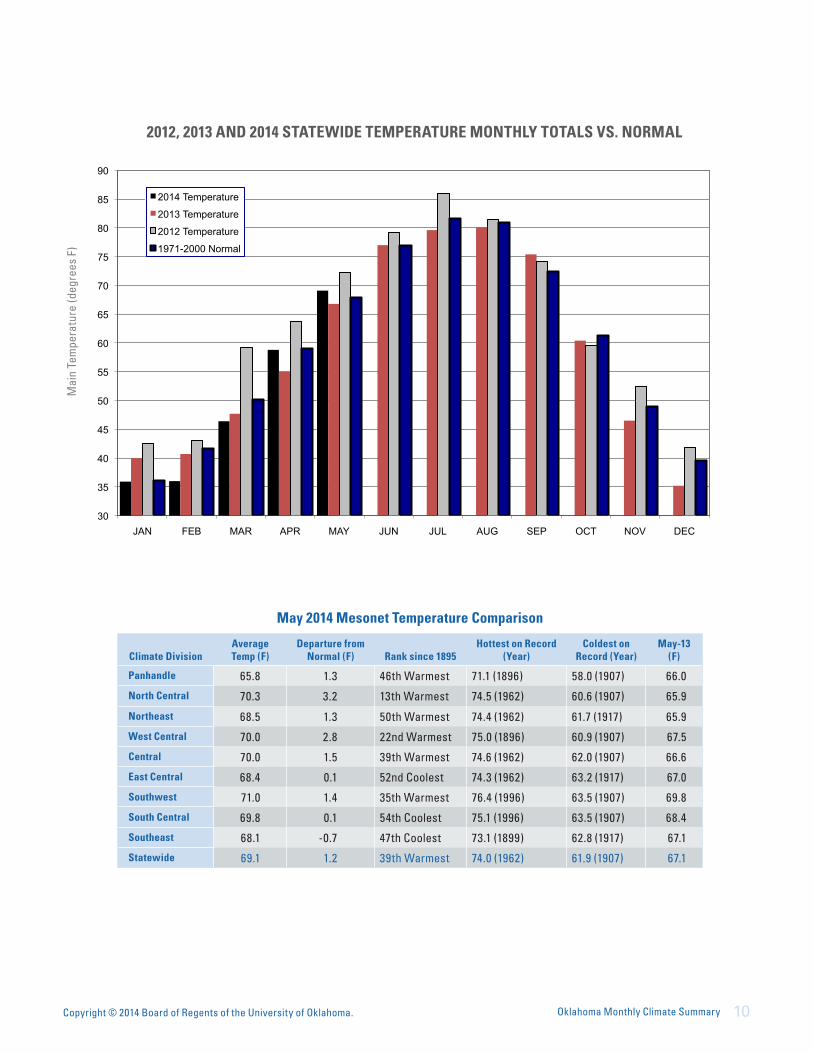
Owing to the extreme drought-fueled heat of the first half of the month, May finished 1.2 degrees above normal with a statewide average of 69.1 degrees. That ranked the month as the 39th warmest May on record, and also the first month to end warmer than normal since September 2013. The highest May temperature recorded by the Mesonet was 105 degrees at Altus and Cherokee on May 5 and 6, respectively. The lowest temperature of 26 degrees was recorded at Kenton on May 2, although it did freeze in the western Panhandle as late as May 14. Climatological spring was quite cool with a statewide average temperature of 58.2 degrees, 0.9 degrees below normal to rank as the 38th coolest on record. The January-May statewide average of 49.5 degrees was 1.6 degrees below normal and the 23rd coolest such period on record.
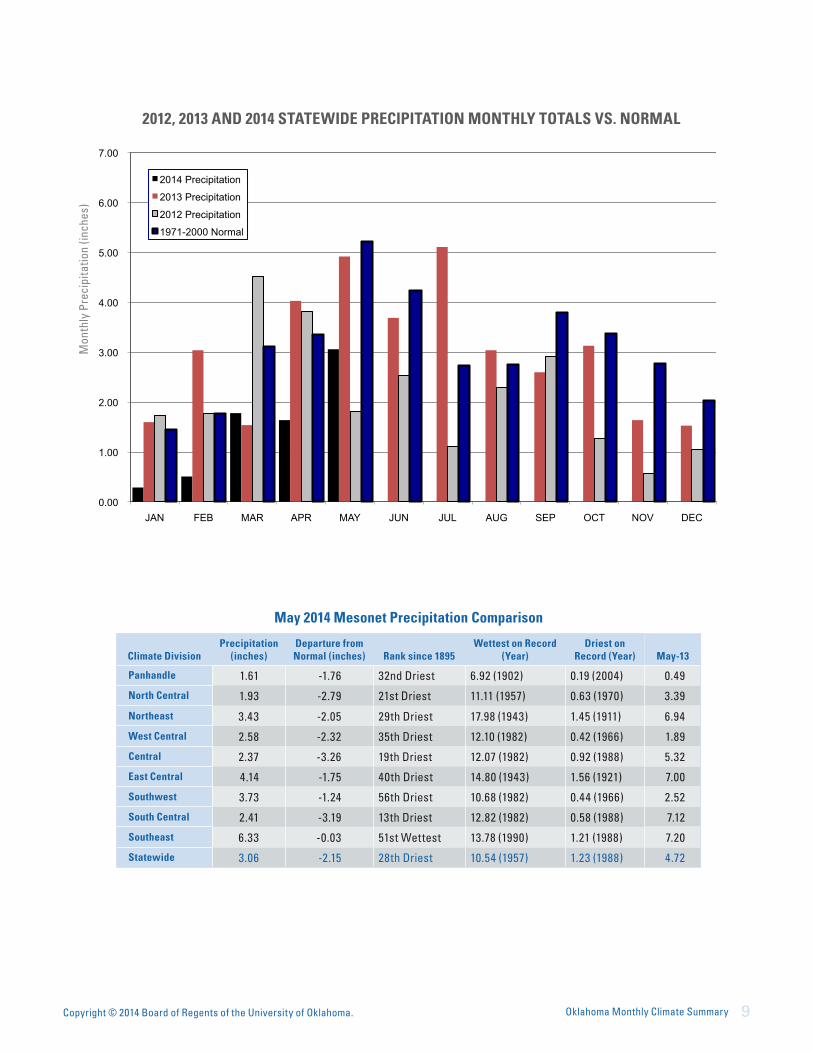
The highest monthly rain totals occurred in far southeastern Oklahoma with Mt. Herman leading all Oklahoma Mesonet sites at 7.65 inches. Southwestern Oklahoma, an area plagued by drought for well over three years, also saw widespread 4-5 inch amounts. Even the central Oklahoma Panhandle received more than three inches, which is about an inch above normal for that area. Unfortunately, outside of those and a few other isolated regions, Oklahoma’s wettest month still came up short. According to preliminary data from the Mesonet, the statewide average rainfall total for May was 3.06 inches, 2.15 inches below normal and the 28th driest since records began in 1895. Central and south central Oklahoma were particularly dry at more than 3 inches below normal, the 19th driest and 13th driest May on record for
May 2014 Statewide Extremes
Description Extreme Station Day
High Temperature 105ºF Altus, Cherokee
5, 6
Low Temperature 26ºF Kenton 2
High Precipitation 7.65 in. Mt. Herman
Low Precipitation 0.51 in. Freedom
May 2014 Statewide StatisticsTemperature
Average Depart. Rank (1895-2014)
Month (May) 69.1ºF 1.2ºF 39th Warmest
Season-to-Date (Mar-May)
58.2ºF -0.9ºF 38th Coolest
Year-to-Date (Jan-May)
49.5ºF -1.6ºF 23rd Coolest
Precipitation
Total Depart. Rank (1895-2014)
Month (May) 3.06 in. -2.15 in. 28th DriestSeason-to-Date (Mar-May)
6.50 in. -5.18 in. 10th Driest
Year-to-Date (Jan-May)
7.32 in. -7.57 in. 3rd Driest
Depart. = departure from 30-year normal
Copyright © 2014 Board of Regents of the University of Oklahoma. Oklahoma Monthly Climate Summary 2
Oklahoma City (97 degrees) and Tulsa (92 degrees) on the 5th, and Oklahoma City again on the 6th (92 degrees).
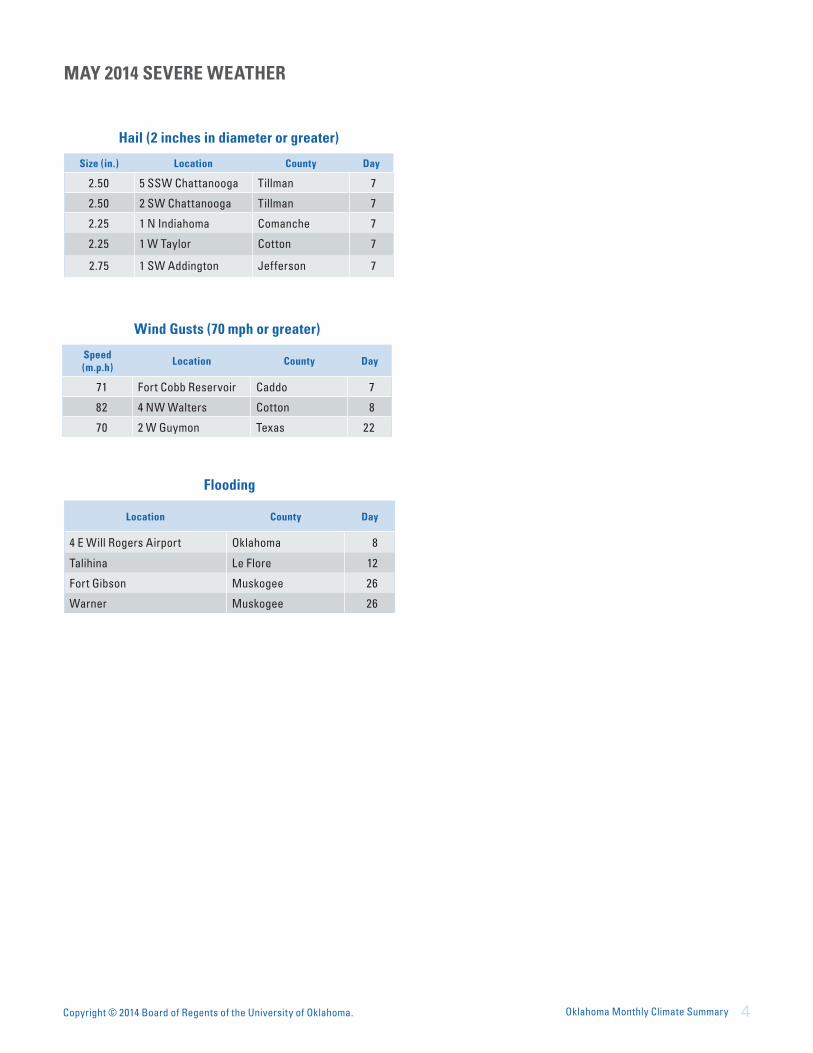
MAY 7-9: A high pressure system vacated the area and a cooling trend with stormy weather ensued. Rain showers and thunderstorms started in eastern Oklahoma on the 7th and eventually formed in western and central Oklahoma by the afternoon. On that day, 2.5 inch hail fell in Chattanooga, 2.25 inch hail fell in Indiahoma and Taylor, and 2.75 inch hail fell in Addington. Fort Cobb Reservoir also experienced a severe wind gust of 71mph. Severe weather was reported on the 8th as well with a wind gust of 82mph in Walters and flooding at the Will Rogers Airport. The largest 24-hour rainfall amounts were 2.54 inches in Oklahoma City West (7th), 3.88 inches in Antlers (8th), and .60 inches in Mt. Herman (9th). The highest maximum temperatures in the state started at 100 degrees in Altus on the 7th and dropped by five degrees on the 8th and 9th. The lowest maximum temperatures were 80 degrees in Mt. Herman, 71 degrees in Cloudy, and 75 degrees in Newkirk on each consecutive day. The highest minimum temperatures were in the 60s and the lowest minimum temperatures decreased from 45 degrees in Hooker to 35 degrees in Kenton during the three-day period. Average wind speeds were between 10 and 20mph on the 7th, 5 and 16mph on the 8th, and less than 12mph on the 9th. MAY 10-11: A cold front lifted back, turned into a warm front and caused a slight increase in temperatures. Temperatures ranged from 39 degrees in Kenton to 98 degrees in Hollis and Altus on the 10th and 41 degrees in Kenton to 99 degrees in Hollis on the 11th. Some brief thunderstorms produced .18 inches of rain in Idabel during the early hours of the 10th and by the 11th, showers and thunderstorms moved into far western OK, producing .23 inches of rain in Cheyenne. South-central and southeast OK saw some patchy fog on the 10th. Maximum daily average wind speeds were 20mph on the 10th and a gusty 29mph on the 11th as a cold front started to push ever so slightly into far northwest Oklahoma. With the high wind speed averages and gusts reaching 61mph in May Ranch on the 11th, a wind advisory was put in effect for the northeast and other areas north of I-40.
MAY 12-13: The previous day’s cold front pushed further into the state and moved southeast. Rain and thunderstorms developed ahead of the front in northwest, west-central, and central Oklahoma during the 12th. By evening, thunderstorms had moved into eastern Oklahoma and continued the following day in central and eastern parts of the state. The heaviest amounts of precipitation occurred in the east with as much as 2.88 inches at the Jay Mesonet, 2.53 inches at the Clayton Mesonet, and 2.41 inches at the Talihina Mesonet on the 12th where flooding was also reported. The 13th only saw as much as .23 inches in Cheyenne. The highest maximum temperatures drastically plummeted from the already cooler 87 degrees in Webbers Falls on the 12th to 69 degrees in Ringling, Burneyville, and Grady on the 13th. The lowest
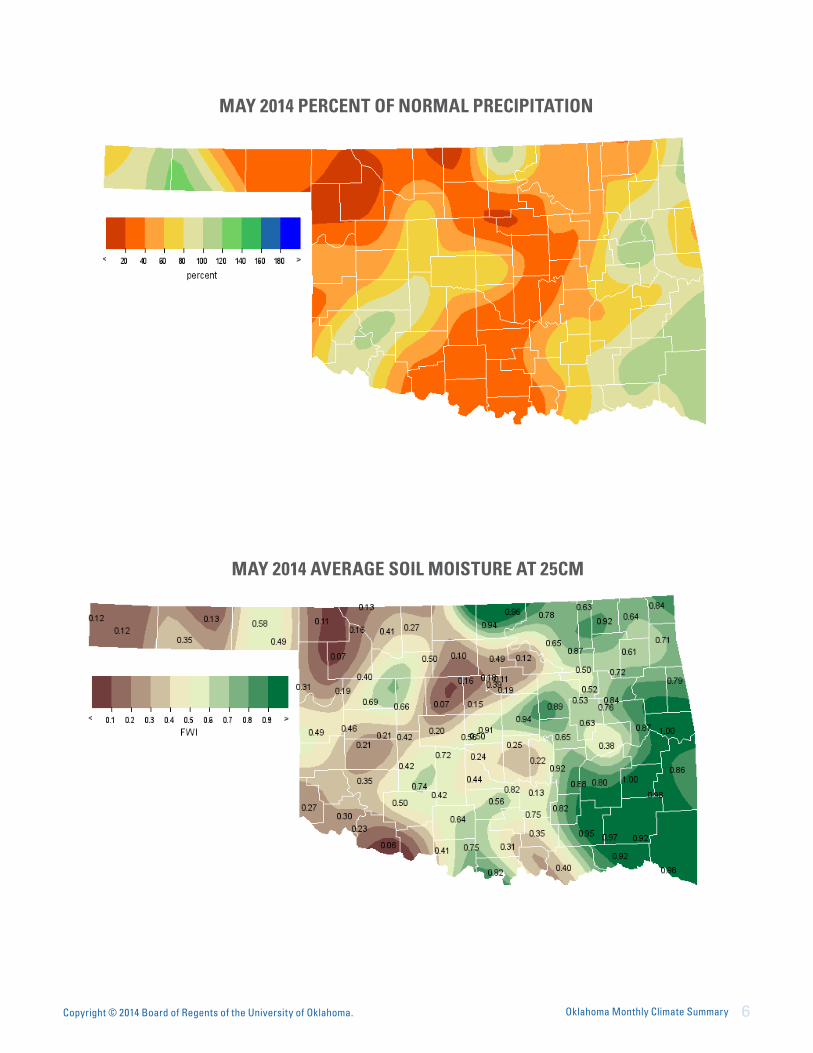
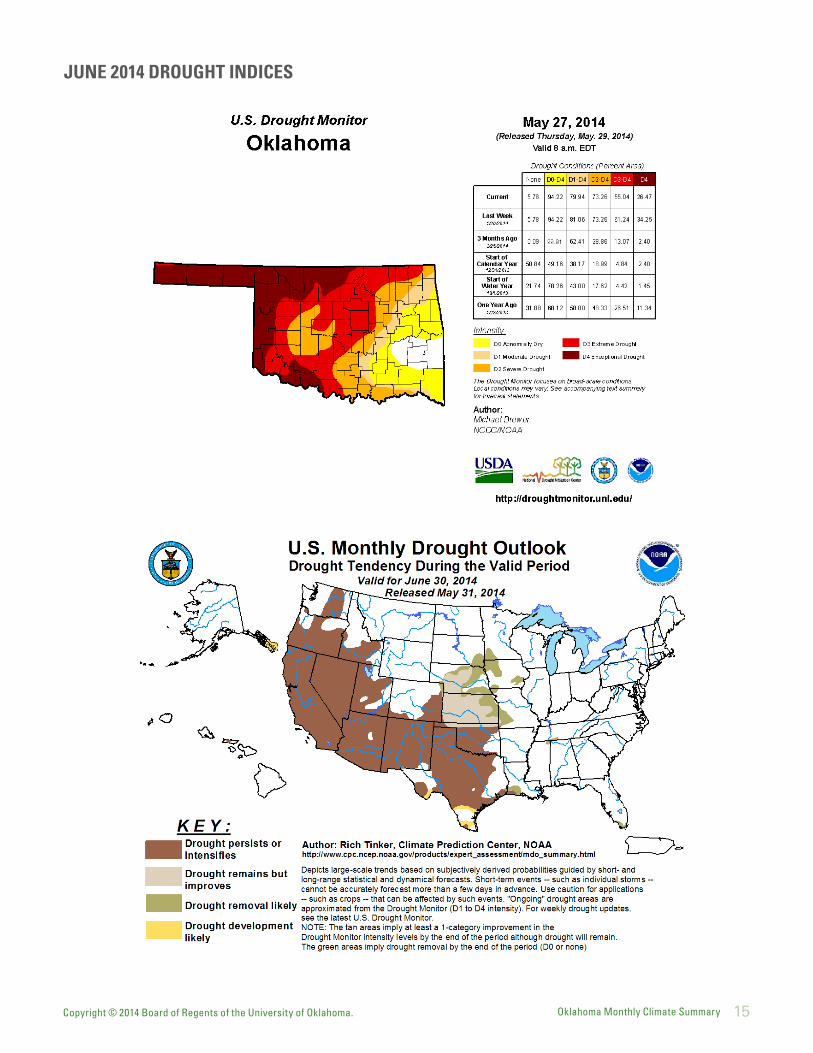
May ended with 80 percent of the state in drought according to the U.S. Drought Monitor. Extreme-to-exceptional drought reached as high as 61 percent before the rains began late in the month and finished at 55 percent. Over 26 percent of the state remained in exceptional drought by the month’s end. The Drought Monitor’s intensity scale slides from moderate-severe-extreme-exceptional, with exceptional being the worst classification.
Severe weather was nearly non-existent during May, normally Oklahoma’s most violent weather month. Preliminary totals from the National Weather Service (NWS) indicate three confirmed tornadoes during May, which would tie 2012 for the third lowest total since accurate records began in 1950. That total could rise if NWS investigators find evidence of more tornadoes. The average tornado count for May is 22. May 2005 holds the record for the lowest total at zero and 2010 had the highest count at 91. The preliminary January-May tally of seven tornadoes ties 1988 for the lowest total through the first five months of the year. The 1988 annual total of 17 is the lowest on record. By the end of May last year, Oklahoma had already experienced 79 tornadoes for the first five months of the year, including 63 in May. Hail to the size of baseballs fell on May 7 across southwestern Oklahoma in addition to wind gusts of over 70 mph. Various other reports of flash flooding, large hail and severe winds were reported later in the month in addition to the tornadoes.
MAY 2014 DAILY SUMMARIES
MAY 1: Low pressure over the region aided in keeping Oklahoma relatively cool. High temperatures ranged from 61 in Miami, Kenton, and Boise City to 75 degrees in Grady. Some locations experienced patchy frost as minimum temperatures dropped below freezing, ranging from 28 in Hooker to 44 degrees at the Oklahoma City West Mesonet site. Winds were out of the northwest between 5 and 14mph.
MAY 2-6: As a surface high pressure settled over the area, skies cleared and temperatures began to warm. Temperatures climbed and eventually surpassed the seasonal normals. While the highest maximum temperatures during this period only hit 79 degrees in Hooker and Grady on the 2nd, they rapidly increased to 105 degrees in Altus and Cherokee on the 5th and 6th, respectively. The coolest temperatures occurred in the panhandle and increased from the upper 20s on the 2nd to the mid-40s on the 6th. The highest daily average wind speeds started off at a calm 9mph on Friday and then jumped to roughly 20mph the remaining four days. Rain-free skies, high winds, and hot temperatures created ideal fire conditions by the 4th. This five-day period housed the entire month’s worth of daily record events. A low temperature record was made in McAlester on the 2nd at 35 degrees, and maximum temperature records were set in Oklahoma City (97 degrees) and McAlester (92 degrees) on the 4th,
Copyright © 2014 Board of Regents of the University of Oklahoma. Oklahoma Monthly Climate Summary 3
maximum temperatures actually increased from 49 degrees to 54 degrees in Kenton. Minimum temperatures ranged from 37 degrees (Kenton) to 65 degrees (Broken Bow) on the 12th and 33 degrees (Boise City) to 53 degrees (southeast OK) on the 13th. Average wind speeds were 10mph to 27mph on Monday and less than 18mph on Tuesday. Gusts in the 40s were reported on both days.
MAY 14-16: Temperatures gradually started to warm with the highest maximums climbing from 75 degrees in Grady on the 14th to 82 degrees in Hollis, Tipton, and Grady on the 15th, and finally to 91 degrees in Grady on the 16th. The lowest maximum temperatures increased from 54 degrees in Westville to 62 degrees in Miami and Jay. Minimum temperatures ranged from the low-mid 30s to the low 50s. Light showers passed through northwest, central, and eastern Oklahoma with totals ranging from trace amounts to .61 inches in Clayton on the 14th, .47 inches in Sallisaw on the 15th, and .37 inches in Miami on the 16th. Average wind speeds were mild, measuring less than 13mph on the 14th, less than 10mph on the 15th, and less than 15mph on the 16th. Gusts at 51mph were reported in Woodward that Friday.
MAY 17-20 : Due to an upper-level disturbance, scattered rain fell in northern and east-central Oklahoma. Maximum precipitation amounts were .75 inches in Sallisaw, .61 inches n Webbers Falls, and .49 inches in Cookson. Most areas received around one-tenth of an inch or less. The following days were rain-free and temperatures began to rise once again. Maximum temperatures ranged from 61 to 80 degrees, 70 to 91 degrees, 79 to 101 degrees, and 81 to 103 degrees each consecutive day. The warmest temperatures were all in the northwest and southwest. Minimum temperatures ranged from the 40s to 50s at the beginning of this period, and from the 40s to the 70s by the end. On the 18th, a warm front stalled along the Red River and winds were from the south-southeast. This made for some breezy conditions and instigated a wind advisory on the 19th. The highest daily average wind speeds were clocked at 16mph on the 17th, 18mph on the 18th, 27mph on the 19th, and 23mph on the 20th. Wind gusts peaked in the 40s from the 17ththrough the 19th and in the 50s on the 20th.
MAY 21: An upper low moving across the western US and a stalled cold front in northwest Oklahoma created a slight drop in maximum temperatures. The only Mesonet site to experience any relief from dryness that day was Slapout who received .5 inches of precipitation. Maximum temperatures were between 81 degrees in Jay and Westville and 99 degrees in Freedom. Minimum temperatures were between 49 degrees in Hooker and Goodwell and 74 degrees in Fairview. Average wind speeds were between 5 and 19mph.
MAY 22-27: This period experienced some heavy rain from an east-moving low pressure system as well as some severe wind reports of 70mph in Guymon on the 22nd. The warmest temperatures in the state dropped from 95 degrees in Freedom on Thursday and huddled in the upper 80s the following four days. Some areas only warmed into the 80s on the 22nd, 60s on the 23rd, 70s on the 24th, 25th, and 26th, and upper 60s on the 27th. The highest minimum temperatures remained in the upper 60s for this six-day stretch of time while the lowest minimum temperatures measured in the upper 40s and low 50s. Kenton came in with the coolest temperature every day except on the 24th when it came in second to Boise City. Small hail and thunderstorms spread throughout Oklahoma as a front stalled over the region on the 22nd. The slow, east moving storms produced by the upper level low dropped over one inch of rain on the 22nd and 24th, nearly 3 inches on the 23rd, and just over 2 inches on the 25th, 26th, and 27th. Although Hobart received the most rain at 3.01 inches on the 23rd, flooding was reported in Fort Gibson and Warner on the 26th. The most heavily soaked areas were initially north of the I-44 corridor, but eventually moved east and spread throughout the state. Non-severe wind gusts measured in the 40s, 50s, and 60s, and the highest gusts observed were 67mph in Goodwell (22nd), 64mph in Kenton (22nd), and 60mph in Grady (26th). Average wind speeds were not nearly as bad, however, as they generally measured less than 13mph on all six days.
MAY 28-31: The last four days of May ended with maximum temperatures ranging from the upper 70s and low 80s to the low 90s. Hooker was the warmest Mesonet site from the 28th through the 30th until Grady came in on top on the 31st. Minimum temperatures were primarily in the 50s and 60s. Fog formed in central Oklahoma on the 28th and southeast Oklahoma on the 30th, dropping some visibilities to less than one-quarter mile. The stalled and spinning upper low over southeast Oklahoma aided in the development of showers and thunderstorms in central, north-central, and eastern OK through the end of the month. Although maximum daily rainfall measurements were .32 inches in Hugo (28th), .81 inches in Broken Bow (29th), .72 inches in Kenton (30th), and 1.13 inches in Boise City (31st), most areas received less than .1 inches on the 28th and 29th, and less than a quarter inch on the 30th and 31st. Winds were calm and generally less than 10mph each day.
Copyright © 2014 Board of Regents of the University of Oklahoma. Oklahoma Monthly Climate Summary 4
Hail (2 inches in diameter or greater)
Size (in.) Location County Day
2.50 5 SSW Chattanooga Tillman 7
2.50 2 SW Chattanooga Tillman 7
2.25 1 N Indiahoma Comanche 7
2.25 1 W Taylor Cotton 7
2.75 1 SW Addington Jefferson 7
Flooding
Location County Day
4 E Will Rogers Airport Oklahoma 8
Talihina Le Flore 12
Fort Gibson Muskogee 26
Warner Muskogee 26
MAY 2014 SEVERE WEATHER
Wind Gusts (70 mph or greater)
Speed (m.p.h) Location County Day
71 Fort Cobb Reservoir Caddo 7
82 4 NW Walters Cotton 8
70 2 W Guymon Texas 22
Copyright © 2014 Board of Regents of the University of Oklahoma. Oklahoma Monthly Climate Summary 5
MAY 2014 OBSERVED PRECIPITATION
MAY 2014 DEPARTURE FROM NORMAL PRECIPITATION
Copyright © 2014 Board of Regents of the University of Oklahoma. Oklahoma Monthly Climate Summary 6
MAY 2014 PERCENT OF NORMAL PRECIPITATION
MAY 2014 AVERAGE SOIL MOISTURE AT 25CM
Copyright © 2014 Board of Regents of the University of Oklahoma. Oklahoma Monthly Climate Summary 7
MAY 2014 AVERAGE TEMPERATURE
MAY 2014 DEPARTURE FROM NORMAL TEMPERATURE
Copyright © 2014 Board of Regents of the University of Oklahoma. Oklahoma Monthly Climate Summary 8
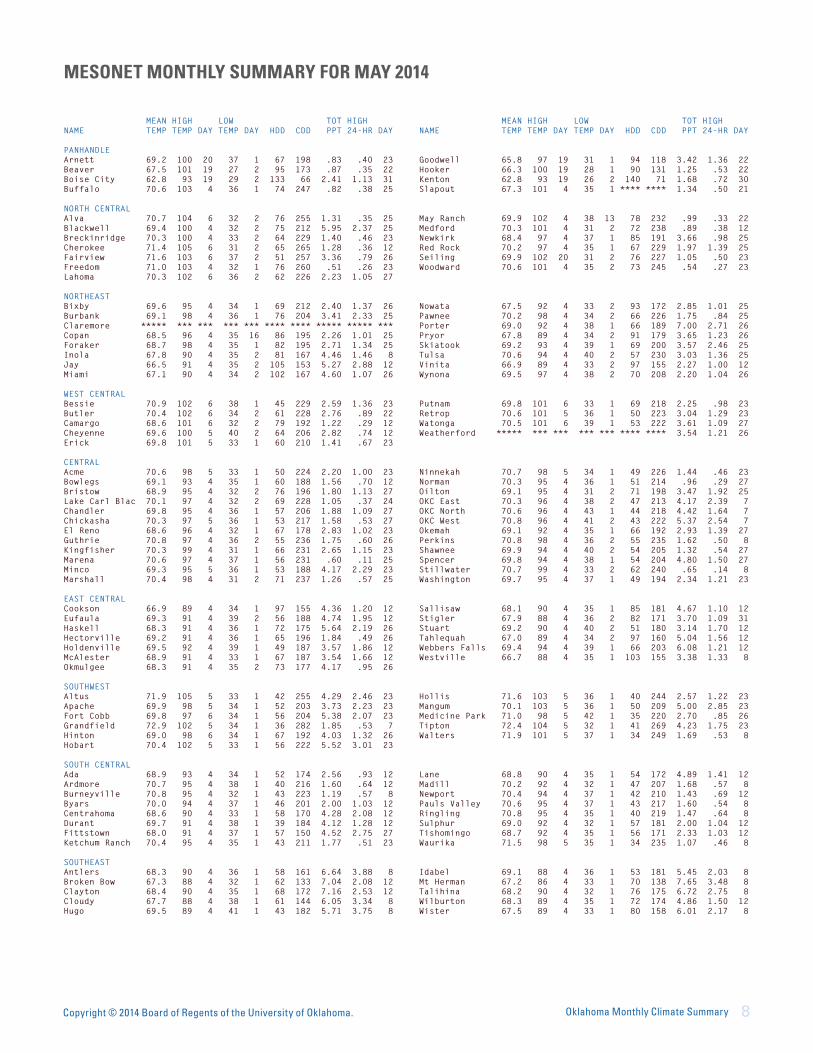
MESONET MONTHLY SUMMARY FOR MAY 2014
MEAN HIGH LOW TOT HIGH MEAN HIGH LOW TOT HIGHNAME TEMP TEMP DAY TEMP DAY HDD CDD PPT 24-HR DAY NAME TEMP TEMP DAY TEMP DAY HDD CDD PPT 24-HR DAY
PANHANDLE Arnett 69.2 100 20 37 1 67 198 .83 .40 23 Goodwell 65.8 97 19 31 1 94 118 3.42 1.36 22Beaver 67.5 101 19 27 2 95 173 .87 .35 22 Hooker 66.3 100 19 28 1 90 131 1.25 .53 22Boise City 62.8 93 19 29 2 133 66 2.41 1.13 31 Kenton 62.8 93 19 26 2 140 71 1.68 .72 30Buffalo 70.6 103 4 36 1 74 247 .82 .38 25 Slapout 67.3 101 4 35 1 **** **** 1.34 .50 21
NORTH CENTRAL Alva 70.7 104 6 32 2 76 255 1.31 .35 25 May Ranch 69.9 102 4 38 13 78 232 .99 .33 22Blackwell 69.4 100 4 32 2 75 212 5.95 2.37 25 Medford 70.3 101 4 31 2 72 238 .89 .38 12Breckinridge 70.3 100 4 33 2 64 229 1.40 .46 23 Newkirk 68.4 97 4 37 1 85 191 3.66 .98 25Cherokee 71.4 105 6 31 2 65 265 1.28 .36 12 Red Rock 70.2 97 4 35 1 67 229 1.97 1.39 25Fairview 71.6 103 6 37 2 51 257 3.36 .79 26 Seiling 69.9 102 20 31 2 76 227 1.05 .50 23Freedom 71.0 103 4 32 1 76 260 .51 .26 23 Woodward 70.6 101 4 35 2 73 245 .54 .27 23Lahoma 70.3 102 6 36 2 62 226 2.23 1.05 27
NORTHEAST Bixby 69.6 95 4 34 1 69 212 2.40 1.37 26 Nowata 67.5 92 4 33 2 93 172 2.85 1.01 25Burbank 69.1 98 4 36 1 76 204 3.41 2.33 25 Pawnee 70.2 98 4 34 2 66 226 1.75 .84 25Claremore ***** *** *** *** *** **** **** ***** ***** *** Porter 69.0 92 4 38 1 66 189 7.00 2.71 26Copan 68.5 96 4 35 16 86 195 2.26 1.01 25 Pryor 67.8 89 4 34 2 91 179 3.65 1.23 26Foraker 68.7 98 4 35 1 82 195 2.71 1.34 25 Skiatook 69.2 93 4 39 1 69 200 3.57 2.46 25Inola 67.8 90 4 35 2 81 167 4.46 1.46 8 Tulsa 70.6 94 4 40 2 57 230 3.03 1.36 25Jay 66.5 91 4 35 2 105 153 5.27 2.88 12 Vinita 66.9 89 4 33 2 97 155 2.27 1.00 12Miami 67.1 90 4 34 2 102 167 4.60 1.07 26 Wynona 69.5 97 4 38 2 70 208 2.20 1.04 26
WEST CENTRAL Bessie 70.9 102 6 38 1 45 229 2.59 1.36 23 Putnam 69.8 101 6 33 1 69 218 2.25 .98 23Butler 70.4 102 6 34 2 61 228 2.76 .89 22 Retrop 70.6 101 5 36 1 50 223 3.04 1.29 23Camargo 68.6 101 6 32 2 79 192 1.22 .29 12 Watonga 70.5 101 6 39 1 53 222 3.61 1.09 27Cheyenne 69.6 100 5 40 2 64 206 2.82 .74 12 Weatherford ***** *** *** *** *** **** **** 3.54 1.21 26Erick 69.8 101 5 33 1 60 210 1.41 .67 23
CENTRAL Acme 70.6 98 5 33 1 50 224 2.20 1.00 23 Ninnekah 70.7 98 5 34 1 49 226 1.44 .46 23Bowlegs 69.1 93 4 35 1 60 188 1.56 .70 12 Norman 70.3 95 4 36 1 51 214 .96 .29 27Bristow 68.9 95 4 32 2 76 196 1.80 1.13 27 Oilton 69.1 95 4 31 2 71 198 3.47 1.92 25Lake Carl Blac 70.1 97 4 32 2 69 228 1.05 .37 24 OKC East 70.3 96 4 38 2 47 213 4.17 2.39 7Chandler 69.8 95 4 36 1 57 206 1.88 1.09 27 OKC North 70.6 96 4 43 1 44 218 4.42 1.64 7Chickasha 70.3 97 5 36 1 53 217 1.58 .53 27 OKC West 70.8 96 4 41 2 43 222 5.37 2.54 7El Reno 68.6 96 4 32 1 67 178 2.83 1.02 23 Okemah 69.1 92 4 35 1 66 192 2.93 1.39 27Guthrie 70.8 97 4 36 2 55 236 1.75 .60 26 Perkins 70.8 98 4 36 2 55 235 1.62 .50 8Kingfisher 70.3 99 4 31 1 66 231 2.65 1.15 23 Shawnee 69.9 94 4 40 2 54 205 1.32 .54 27Marena 70.6 97 4 37 1 56 231 .60 .11 25 Spencer 69.8 94 4 38 1 54 204 4.80 1.50 27Minco 69.3 95 5 36 1 53 188 4.17 2.29 23 Stillwater 70.7 99 4 33 2 62 240 .65 .14 8Marshall 70.4 98 4 31 2 71 237 1.26 .57 25 Washington 69.7 95 4 37 1 49 194 2.34 1.21 23
EAST CENTRAL Cookson 66.9 89 4 34 1 97 155 4.36 1.20 12 Sallisaw 68.1 90 4 35 1 85 181 4.67 1.10 12Eufaula 69.3 91 4 39 2 56 188 4.74 1.95 12 Stigler 67.9 88 4 36 2 82 171 3.70 1.09 31Haskell 68.3 91 4 36 1 72 175 5.64 2.19 26 Stuart 69.2 90 4 40 2 51 180 3.14 1.70 12Hectorville 69.2 91 4 36 1 65 196 1.84 .49 26 Tahlequah 67.0 89 4 34 2 97 160 5.04 1.56 12Holdenville 69.5 92 4 39 1 49 187 3.57 1.86 12 Webbers Falls 69.4 94 4 39 1 66 203 6.08 1.21 12McAlester 68.9 91 4 33 1 67 187 3.54 1.66 12 Westville 66.7 88 4 35 1 103 155 3.38 1.33 8Okmulgee 68.3 91 4 35 2 73 177 4.17 .95 26
SOUTHWEST Altus 71.9 105 5 33 1 42 255 4.29 2.46 23 Hollis 71.6 103 5 36 1 40 244 2.57 1.22 23Apache 69.9 98 5 34 1 52 203 3.73 2.23 23 Mangum 70.1 103 5 36 1 50 209 5.00 2.85 23Fort Cobb 69.8 97 6 34 1 56 204 5.38 2.07 23 Medicine Park 71.0 98 5 42 1 35 220 2.70 .85 26Grandfield 72.9 102 5 34 1 36 282 1.85 .53 7 Tipton 72.4 104 5 32 1 41 269 4.23 1.75 23Hinton 69.0 98 6 34 1 67 192 4.03 1.32 26 Walters 71.9 101 5 37 1 34 249 1.69 .53 8Hobart 70.4 102 5 33 1 56 222 5.52 3.01 23
SOUTH CENTRAL Ada 68.9 93 4 34 1 52 174 2.56 .93 12 Lane 68.8 90 4 35 1 54 172 4.89 1.41 12Ardmore 70.7 95 4 38 1 40 216 1.60 .64 12 Madill 70.2 92 4 32 1 47 207 1.68 .57 8Burneyville 70.8 95 4 32 1 43 223 1.19 .57 8 Newport 70.4 94 4 37 1 42 210 1.43 .69 12Byars 70.0 94 4 37 1 46 201 2.00 1.03 12 Pauls Valley 70.6 95 4 37 1 43 217 1.60 .54 8Centrahoma 68.6 90 4 33 1 58 170 4.28 2.08 12 Ringling 70.8 95 4 35 1 40 219 1.47 .64 8Durant 69.7 91 4 38 1 39 184 4.12 1.28 12 Sulphur 69.0 92 4 32 1 57 181 2.00 1.04 12Fittstown 68.0 91 4 37 1 57 150 4.52 2.75 27 Tishomingo 68.7 92 4 35 1 56 171 2.33 1.03 12Ketchum Ranch 70.4 95 4 35 1 43 211 1.77 .51 23 Waurika 71.5 98 5 35 1 34 235 1.07 .46 8
SOUTHEAST Antlers 68.3 90 4 36 1 58 161 6.64 3.88 8 Idabel 69.1 88 4 36 1 53 181 5.45 2.03 8Broken Bow 67.3 88 4 32 1 62 133 7.04 2.08 12 Mt Herman 67.2 86 4 33 1 70 138 7.65 3.48 8Clayton 68.4 90 4 35 1 68 172 7.16 2.53 12 Talihina 68.2 90 4 32 1 76 175 6.72 2.75 8Cloudy 67.7 88 4 38 1 61 144 6.05 3.34 8 Wilburton 68.3 89 4 35 1 72 174 4.86 1.50 12Hugo 69.5 89 4 41 1 43 182 5.71 3.75 8 Wister 67.5 89 4 33 1 80 158 6.01 2.17 8
Copyright © 2014 Board of Regents of the University of Oklahoma. Oklahoma Monthly Climate Summary 9
May 2014 Mesonet Precipitation Comparison
Climate DivisionPrecipitation
(inches)Departure from Normal (inches) Rank since 1895
Wettest on Record (Year)
Driest on Record (Year) May-13
Panhandle 1.61 -1.76 32nd Driest 6.92 (1902) 0.19 (2004) 0.49
North Central 1.93 -2.79 21st Driest 11.11 (1957) 0.63 (1970) 3.39
Northeast 3.43 -2.05 29th Driest 17.98 (1943) 1.45 (1911) 6.94
West Central 2.58 -2.32 35th Driest 12.10 (1982) 0.42 (1966) 1.89
Central 2.37 -3.26 19th Driest 12.07 (1982) 0.92 (1988) 5.32
East Central 4.14 -1.75 40th Driest 14.80 (1943) 1.56 (1921) 7.00
Southwest 3.73 -1.24 56th Driest 10.68 (1982) 0.44 (1966) 2.52
South Central 2.41 -3.19 13th Driest 12.82 (1982) 0.58 (1988) 7.12
Southeast 6.33 -0.03 51st Wettest 13.78 (1990) 1.21 (1988) 7.20
Statewide 3.06 -2.15 28th Driest 10.54 (1957) 1.23 (1988) 4.72
0.00
1.00
2.00
3.00
4.00
5.00
6.00
7.00
JAN FEB MAR APR MAY JUN JUL AUG SEP OCT NOV DEC
Mon
thly
Pre
cipi
tatio
n (in
ches
)
2012, 2013 and 2014 Statewide Precipitation: Monthly Totals vs. Normal
2014 Precipitation
2013 Precipitation
2012 Precipitation
1971-2000 Normal
2012, 2013 AND 2014 STATEWIDE PRECIPITATION MONTHLY TOTALS VS. NORMAL
Mon
thly
Pre
cipi
tatio
n (in
ches
)
Copyright © 2014 Board of Regents of the University of Oklahoma. Oklahoma Monthly Climate Summary 10
30
35
40
45
50
55
60
65
70
75
80
85
90
JAN FEB MAR APR MAY JUN JUL AUG SEP OCT NOV DEC
Mon
thly
Pre
cipi
tatio
n (in
ches
)
2012, 2013 and 2014 Statewide Temperature: Monthly Totals vs. Normal
2014 Temperature
2013 Temperature
2012 Temperature
1971-2000 Normal
May 2014 Mesonet Temperature Comparison
Climate DivisionAverage Temp (F)
Departure from Normal (F) Rank since 1895
Hottest on Record (Year)
Coldest on Record (Year)
May-13 (F)
Panhandle 65.8 1.3 46th Warmest 71.1 (1896) 58.0 (1907) 66.0
North Central 70.3 3.2 13th Warmest 74.5 (1962) 60.6 (1907) 65.9
Northeast 68.5 1.3 50th Warmest 74.4 (1962) 61.7 (1917) 65.9
West Central 70.0 2.8 22nd Warmest 75.0 (1896) 60.9 (1907) 67.5
Central 70.0 1.5 39th Warmest 74.6 (1962) 62.0 (1907) 66.6
East Central 68.4 0.1 52nd Coolest 74.3 (1962) 63.2 (1917) 67.0
Southwest 71.0 1.4 35th Warmest 76.4 (1996) 63.5 (1907) 69.8
South Central 69.8 0.1 54th Coolest 75.1 (1996) 63.5 (1907) 68.4
Southeast 68.1 -0.7 47th Coolest 73.1 (1899) 62.8 (1917) 67.1
Statewide 69.1 1.2 39th Warmest 74.0 (1962) 61.9 (1907) 67.1
Mai
n Te
mpe
ratu
re (d
egre
es F
)
2012, 2013 AND 2014 STATEWIDE TEMPERATURE MONTHLY TOTALS VS. NORMAL
Copyright © 2014 Board of Regents of the University of Oklahoma. Oklahoma Monthly Climate Summary 11
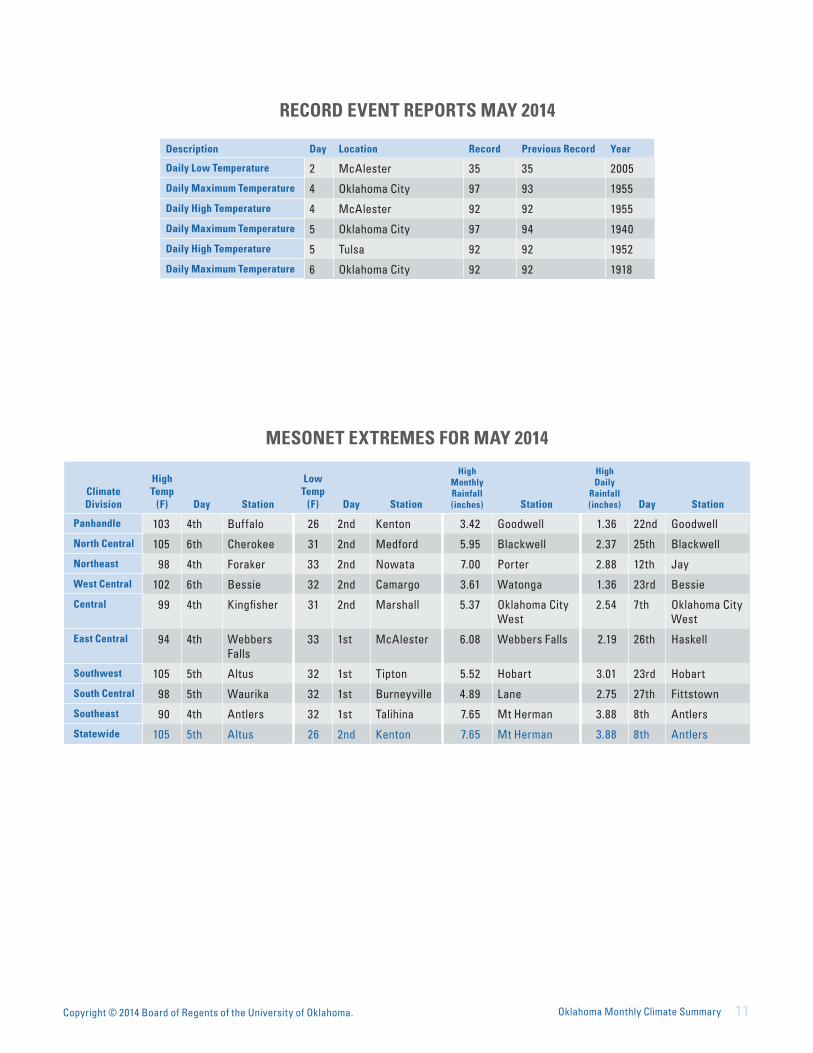
MESONET EXTREMES FOR MAY 2014
Climate Division
High Temp
(F) Day Station
Low Temp
(F) Day Station
High Monthly Rainfall (inches) Station
High Daily
Rainfall (inches) Day Station
Panhandle 103 4th Buffalo 26 2nd Kenton 3.42 Goodwell 1.36 22nd Goodwell
North Central 105 6th Cherokee 31 2nd Medford 5.95 Blackwell 2.37 25th Blackwell
Northeast 98 4th Foraker 33 2nd Nowata 7.00 Porter 2.88 12th Jay
West Central 102 6th Bessie 32 2nd Camargo 3.61 Watonga 1.36 23rd Bessie
Central 99 4th Kingfisher 31 2nd Marshall 5.37 Oklahoma City West
2.54 7th Oklahoma City West
East Central 94 4th Webbers Falls
33 1st McAlester 6.08 Webbers Falls 2.19 26th Haskell
Southwest 105 5th Altus 32 1st Tipton 5.52 Hobart 3.01 23rd Hobart
South Central 98 5th Waurika 32 1st Burneyville 4.89 Lane 2.75 27th Fittstown
Southeast 90 4th Antlers 32 1st Talihina 7.65 Mt Herman 3.88 8th Antlers
Statewide 105 5th Altus 26 2nd Kenton 7.65 Mt Herman 3.88 8th Antlers
RECORD EVENT REPORTS MAY 2014
Description Day Location Record Previous Record Year
Daily Low Temperature 2 McAlester 35 35 2005
Daily Maximum Temperature 4 Oklahoma City 97 93 1955
Daily High Temperature 4 McAlester 92 92 1955
Daily Maximum Temperature 5 Oklahoma City 97 94 1940
Daily High Temperature 5 Tulsa 92 92 1952
Daily Maximum Temperature 6 Oklahoma City 92 92 1918
Copyright © 2014 Board of Regents of the University of Oklahoma. Oklahoma Monthly Climate Summary 12
JUNE OUTLOOKOklahoma Monthly Climate Summary
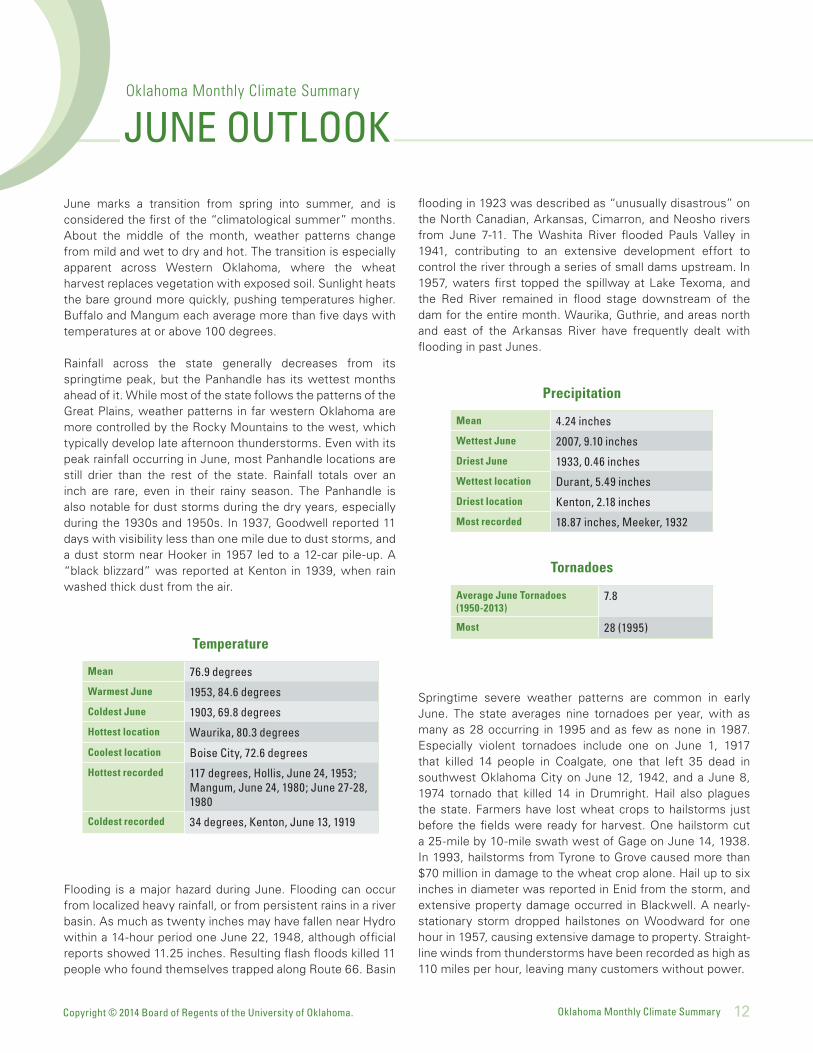
June marks a transition from spring into summer, and is considered the first of the “climatological summer” months. About the middle of the month, weather patterns change from mild and wet to dry and hot. The transition is especially apparent across Western Oklahoma, where the wheat harvest replaces vegetation with exposed soil. Sunlight heats the bare ground more quickly, pushing temperatures higher. Buffalo and Mangum each average more than five days with temperatures at or above 100 degrees.
Rainfall across the state generally decreases from its springtime peak, but the Panhandle has its wettest months ahead of it. While most of the state follows the patterns of the Great Plains, weather patterns in far western Oklahoma are more controlled by the Rocky Mountains to the west, which typically develop late afternoon thunderstorms. Even with its peak rainfall occurring in June, most Panhandle locations are still drier than the rest of the state. Rainfall totals over an inch are rare, even in their rainy season. The Panhandle is also notable for dust storms during the dry years, especially during the 1930s and 1950s. In 1937, Goodwell reported 11 days with visibility less than one mile due to dust storms, and a dust storm near Hooker in 1957 led to a 12-car pile-up. A “black blizzard” was reported at Kenton in 1939, when rain washed thick dust from the air.
Temperature
Mean 76.9 degrees
Warmest June 1953, 84.6 degrees
Coldest June 1903, 69.8 degrees
Hottest location Waurika, 80.3 degrees
Coolest location Boise City, 72.6 degrees
Hottest recorded 117 degrees, Hollis, June 24, 1953; Mangum, June 24, 1980; June 27-28, 1980
Coldest recorded 34 degrees, Kenton, June 13, 1919
Precipitation
Mean 4.24 inches
Wettest June 2007, 9.10 inches
Driest June 1933, 0.46 inches
Wettest location Durant, 5.49 inches
Driest location Kenton, 2.18 inches
Most recorded 18.87 inches, Meeker, 1932
Tornadoes
Average June Tornadoes (1950-2013)
7.8
Most 28 (1995)
Flooding is a major hazard during June. Flooding can occur from localized heavy rainfall, or from persistent rains in a river basin. As much as twenty inches may have fallen near Hydro within a 14-hour period one June 22, 1948, although official reports showed 11.25 inches. Resulting flash floods killed 11 people who found themselves trapped along Route 66. Basin
flooding in 1923 was described as “unusually disastrous” on the North Canadian, Arkansas, Cimarron, and Neosho rivers from June 7-11. The Washita River flooded Pauls Valley in 1941, contributing to an extensive development effort to control the river through a series of small dams upstream. In 1957, waters first topped the spillway at Lake Texoma, and the Red River remained in flood stage downstream of the dam for the entire month. Waurika, Guthrie, and areas north and east of the Arkansas River have frequently dealt with flooding in past Junes.
Springtime severe weather patterns are common in early June. The state averages nine tornadoes per year, with as many as 28 occurring in 1995 and as few as none in 1987. Especially violent tornadoes include one on June 1, 1917 that killed 14 people in Coalgate, one that left 35 dead in southwest Oklahoma City on June 12, 1942, and a June 8, 1974 tornado that killed 14 in Drumright. Hail also plagues the state. Farmers have lost wheat crops to hailstorms just before the fields were ready for harvest. One hailstorm cut a 25-mile by 10-mile swath west of Gage on June 14, 1938. In 1993, hailstorms from Tyrone to Grove caused more than $70 million in damage to the wheat crop alone. Hail up to six inches in diameter was reported in Enid from the storm, and extensive property damage occurred in Blackwell. A nearly-stationary storm dropped hailstones on Woodward for one hour in 1957, causing extensive damage to property. Straight-line winds from thunderstorms have been recorded as high as 110 miles per hour, leaving many customers without power.
Copyright © 2014 Board of Regents of the University of Oklahoma. Oklahoma Monthly Climate Summary 13
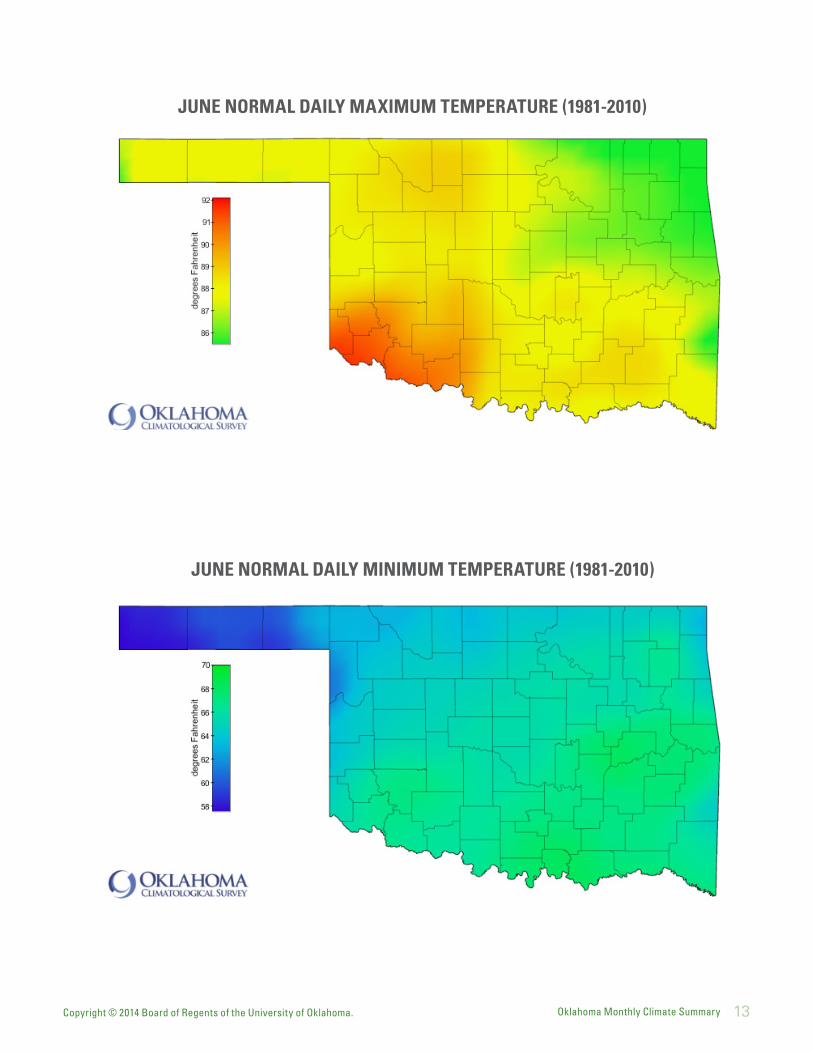
JUNE NORMAL DAILY MAXIMUM TEMPERATURE (1981-2010)
JUNE NORMAL DAILY MINIMUM TEMPERATURE (1981-2010)
Copyright © 2014 Board of Regents of the University of Oklahoma. Oklahoma Monthly Climate Summary 14
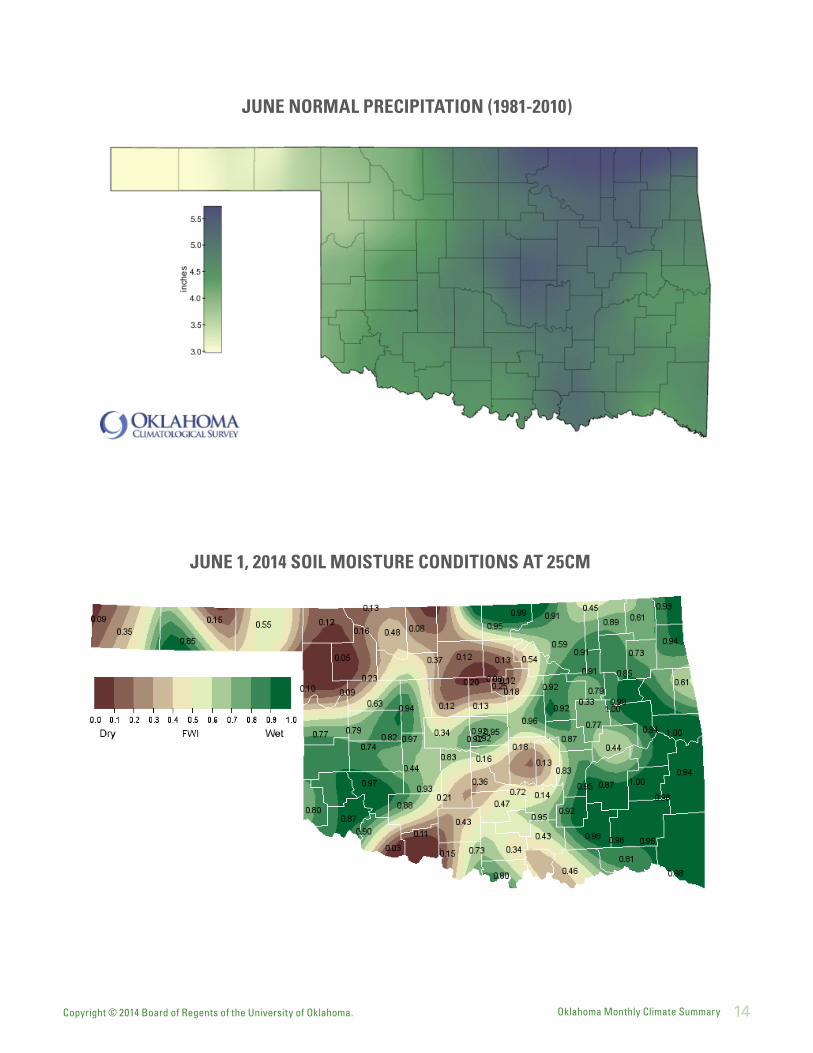
JUNE NORMAL PRECIPITATION (1981-2010)
JUNE 1, 2014 SOIL MOISTURE CONDITIONS AT 25CM
Copyright © 2014 Board of Regents of the University of Oklahoma. Oklahoma Monthly Climate Summary 15
JUNE 2014 DROUGHT INDICES
Copyright © 2014 Board of Regents of the University of Oklahoma. Oklahoma Monthly Climate Summary 16
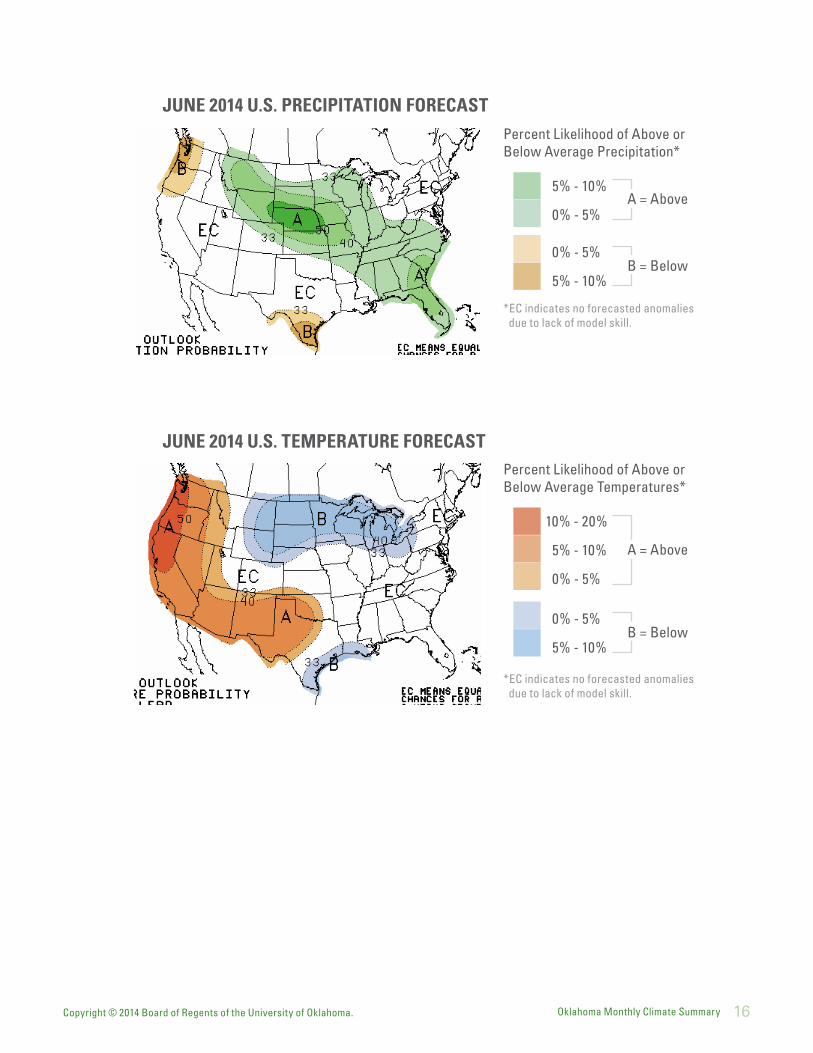
JUNE 2014 U.S. PRECIPITATION FORECAST
JUNE 2014 U.S. TEMPERATURE FORECASTPercent Likelihood of Above or Below Average Temperatures*
*EC indicates no forecasted anomalies due to lack of model skill.
10% - 20%
A = Above
B = Below0% - 5%
5% - 10%
0% - 5%
5% - 10%
Percent Likelihood of Above or Below Average Precipitation*
*EC indicates no forecasted anomalies due to lack of model skill.
5% - 10%A = Above
B = Below0% - 5%
0% - 5%
5% - 10%
Copyright © 2014 Board of Regents of the University of Oklahoma. Oklahoma Monthly Climate Summary 17
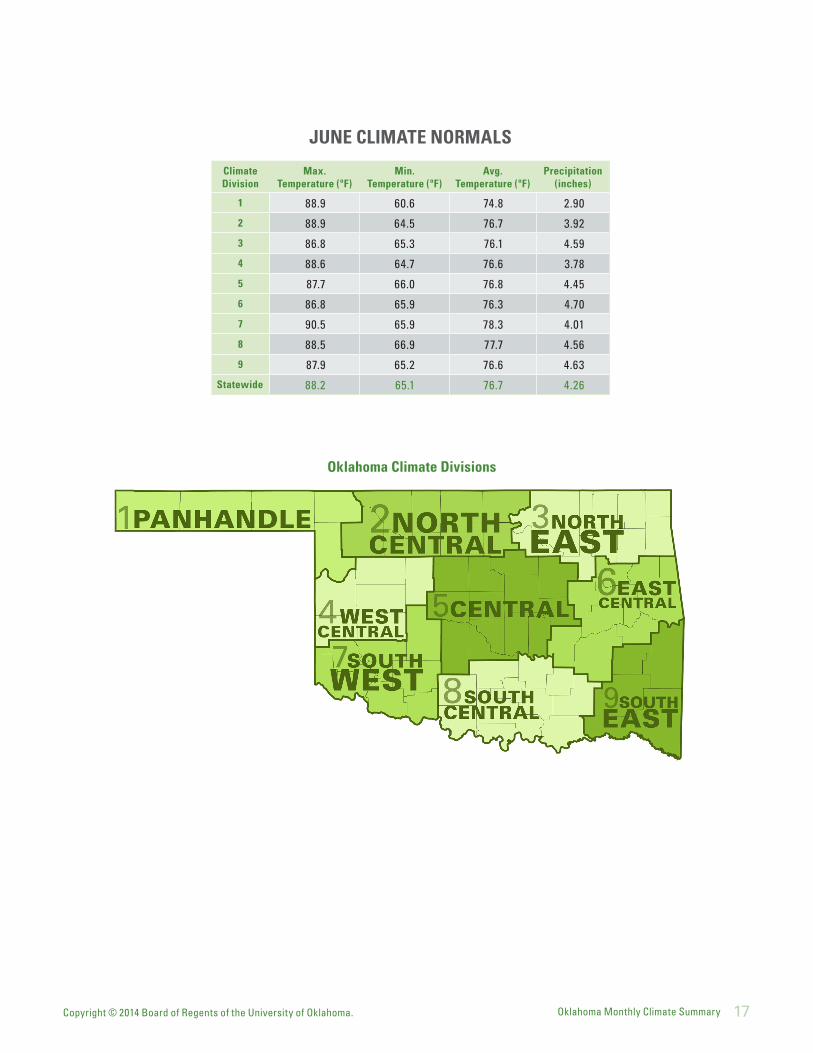
Oklahoma Climate Divisions
JUNE CLIMATE NORMALS
Climate Division
Max. Temperature (ºF)
Min. Temperature (ºF)
Avg. Temperature (ºF)
Precipitation (inches)
1 88.9 60.6 74.8 2.90
2 88.9 64.5 76.7 3.92
3 86.8 65.3 76.1 4.59
4 88.6 64.7 76.6 3.78
5 87.7 66.0 76.8 4.45
6 86.8 65.9 76.3 4.70
7 90.5 65.9 78.3 4.01
8 88.5 66.9 77.7 4.56
9 87.9 65.2 76.6 4.63
Statewide 88.2 65.1 76.7 4.26
Copyright © 2014 Board of Regents of the University of Oklahoma. Oklahoma Monthly Climate Summary 18
Oklahoma Climatological Survey is the State Climate Office for Oklahoma
Dr. Kevin Kloesel Director
EDITOR Gary D. McManus State Climatologist
CONTRIBUTORS Gary D. McManus State ClimatologistDr. Mark A. Shafer Associate State ClimatologistHoward Johnson Associate State Climatologist (Ret.)Monica Deming Service Climatologist
DESIGNNicholas Richardson Graphic Designer Ada Shih Graphic Designer
For more information, contact:Oklahoma Climatological SurveyThe University of Oklahoma120 David L. Boren Blvd., Suite 2900Norman, OK 73072-7305
TEL: 405-325-2541FAX: 405-325-2550E-MAIL: [email protected]: http://climate.ok.gov
OklahomaClimatological Survey
INTERPRETATION INFORMATIONMEAN DAILY TEMPERATURE: Calculated from an average of the daily maximum and minimum temperatures. Daily averages are summed for each day, and then divided by the number of valid data points – typically the number of days in the month. Although this June differ from the “true” daily average, it is consistent with historical methods of observation and comparable to the normals and extremes for stations and regions of the state.
DEGREE DAYS: Degree Days are calculated each day of the month for which there is a temperature report and the mean temperature for the day is less than (Heating Degree Days) or greater than (Cooling Degree Days) 65 degrees. Daily values are summed to arrive at a monthly total. HDD/CDD are qualitative measures of how much heating/cooling was required to maintain a comfortable indoor temperature. Missing observations June result in an artificially high or low value.
SEVERE WEATHER REPORTS: Only the most significant events are listed. Tornadoes of F2 or greater strength (on the 0-5 Fujita scale), hail of two inches diameter or greater, and wind speeds of 70 miles per hour or above are listed. National Weather Service defines storms as severe when they produce a tornado, hail of three-quarters inch or greater, or wind speeds above 57 miles per hour (50 knots). For additional reports, contact the Oklahoma Climatological Survey, Storm Prediction Center, or your local National Weather Service forecast office.
SOIL MOISTURE: The soil moisture variable displayed is the Fractional Water Index (FWI), measured at a depth of 25 cm. This unitless value ranges from very dry soil having a value of 0, to saturated soils having a value of 1.
ADDITIONAL RESOURCESSUNRISE / SUNSET TABLESU.S. Naval Observatory: http://aa.usno.navy.mil/data
SEVERE STORM REPORTSStorm Prediction Center: http://spc.noaa.gov/climo/
National Climatic Data Center (more than about 4-5 months old):http://www4.ncdc.noaa.gov/cgi-win/wwcgi.dll?wwEvent~Storms
SEASONAL OUTLOOKSClimate Prediction Center: http://www.cpc.ncep.noaa.gov/products/OUTLOOKS_index.html
CLIMATE CALENDARS AND OTHER LOCAL WEATHER AND CLIMATE INFORMATIONOklahoma Climatological Survey:http://climate.mesonet.org or http://climate.ok.gov/