Embed Size (px)
Citation preview
OKLAHOMAOILANDGASINDUSTRYTAXATION
ComparativeEffectiveTaxRatesintheMajorProducingStates
January2018
Page|1 RegionTrack,Inc.
OklahomaOilandGasIndustryTaxation
ContentsI. Introduction.........................................................................................................................................2
II. SeveranceTaxes...................................................................................................................................4
RecentTaxLawChanges.................................................................................................................4
OklahomaSeveranceTaxPayments...............................................................................................4
OklahomaEffectiveSeveranceTaxRate.........................................................................................7
OklahomaVersusOtherProducingStates......................................................................................8
StateTrendsinSeveranceTaxRates.............................................................................................10
III. AdValoremTaxes...............................................................................................................................11
IV. MeasuringtheBroaderTaxContributionofOil&Gas......................................................................16
PersonalIncomeTaxesandOilandGasEarnings.........................................................................17
OilandGas-RelatedSalesTax.......................................................................................................22
OverallEffectiveTaxRate.............................................................................................................25
EffectofRecentTaxLawChange..................................................................................................29
HigherSeveranceTaxRateScenarios...........................................................................................29
FurtherStudy................................................................................................................................31
V. SystematicLaborMarketandTaxEffects..........................................................................................32
SystematicLaborMarketEffects...................................................................................................32
SystematicTaxRevenueEffects....................................................................................................32
SystematicOilandGasRiskinOklahoma.....................................................................................33
VI. Appendix............................................................................................................................................36
VII. References.........................................................................................................................................40
VIII. Endnotes............................................................................................................................................41

Page|2 RegionTrack,Inc.
OklahomaOilandGasIndustryTaxation
OklahomaOilandGasIndustryTaxation
I. IntroductionThisreportprovidesestimatesoftheeffectivetaxburdenfacedbytheoilandgasindustryinOklahomaandfifteenothermajorenergy-producingstates.Evaluationsofoilandgastaxburdenaretypicallyrestrictedtotheroleofseverancetaxesandadvaloremtaxesrelatedtooilandgasproduction.Dataisreadilyavailableforthesetaxesandtheycapturemuchofthedirecttaxcontributionfromoilandgasproduction.However,thesetwotaxstreamsdonotcapturethetaxcontributionoftheoilandgasindustrymorebroadly.Theindustryanditsemployeesmakesignificantcontributionstoseveralothermajortaxstreamsaswell.InOklahoma,themostimportantamongthesearepersonalincometaxandsalestax,twoofthelargestsourcesofrevenuetostateandlocalgovernment.Othersmallertaxstreamsincludecorporateincometax,franchisetax,motorvehicletax,andmotorfueltax.
Whendoingcross-statecomparisons,theuseofanarrowsetoftaxescanproduceagrosslymisleadingviewoftheoveralltaxcontributionoftheoilandgasindustry.Themajorenergy-producingstatesassessarangeoftaxesandrelyonthemtovaryingdegrees.Someproducingstatesdonotlevyapersonalincomeorsalestaxandrelymuchmoreheavilyonseveranceandadvaloremtaxestofundstateandlocalgovernmentspending.Evenamongstatesthatdolevyincomeandsalestaxes,theeffectiveratesvarygreatly.Thesizeoftheoilandgasindustryvariesaswell,asstateswithalargeoilandgasemploymentbasereceiverelativelymoretaxrevenuefromtheindustry.Drilling-activestatesalsotendtoreceivesignificantcurrenttaxrevenuefromincreasinglycapital-intensivewellsrelativetoproducingstateswithlittledrillingactivity.
ThepurposeofthisreportistoprovideabroadercomparisonofthetaxburdenfacedbytheoilandgasindustryinOklahoma.Estimatesofthecombinedeffectivetaxrateforseverance,advalorem,personalincome,andsalestaxareprovidedforOklahomaandfifteenothermajorproducingstates.Whilethisdoesnotprovideanexhaustivereviewofthetotaltaxpaymentsmadebytheindustry,thesetaxescomprisethetwolargestsourcesofstateandlocaltaxesinOklahomaandcapturethemajortaxestypicallyderivedfromoilandgasdrillingandproductionactivity.
Inthefirstsectionofthereport,historicalseverancetaxpaymentsinOklahomaareexamined,andupdatedestimatesoftheeffectiverateinOklahomaandotheroilandgas-producingstatesareprovided.TheinfluenceofseverancetaxratechangesandproductionvaluationchangesonseverancetaxpaymentsinOklahomaisalsoexamined.Finally,theprojectedeffectofrecentincreasesinseverancetaxratesonrevenueprojectionsinthecurrentandnextfiscalyearareevaluated.
ThesecondsectionprovidesestimatesofannualadvaloremtaxpaymentsandeffectiveadvaloremtaxratesforOklahomaandthesampleofproducingstates.Acombinedeffectivetaxrateincludingbothseveranceandadvaloremtaxesisthenestimatedforthesixteenstates.

Page|3 RegionTrack,Inc.
OklahomaOilandGasIndustryTaxation
ThethirdsectionbroadenstheanalysisoftheOklahomaoilandgasindustrytaxburdentopersonalincomeandsalestaxes.Anoveralleffectiveratethatincludesseverance,advalorem,personalincome,andsalestaxesisestimatedforOklahomaandtheotherfifteenstatesinthesample.Oklahoma’soveralleffectiverateisthenevaluatedunderboththerecentincreaseintheseverancetaxrateandpotentialadditionalincreasesintherate.
Thefourthandfinalsectionofthereporthighlightstheoverallsensitivityofthetotaltaxbaseinthesixteenstatestofluctuationsintheoilandgasindustryintherecentenergypricecycle.ThisprovidesabetterperspectiveontheoverallsensitivityoftotaltaxrevenueinOklahomarelativetotheotherproducingstates.Italsohighlightsthedirectandindirectinfluenceofoilandgasactivityontheoverallvolatilityofstatetaxrevenue.Producingstateswithanoveralleconomiccyclethatremainshighlysensitivetooilandgasactivitymustgivespecialconsiderationtoboththedirectandindirectactivityinfluencedbytaxpolicydecisions.
ThefindingsofthereporthaveimportantimplicationsforOklahomapolicymakerssettingtaxpolicyinthestate.WhiletheFY2016effectivetaxrateinOklahomaranks12thamongthe16thlargestproducingstatesbasedsolelyonseveranceandadvaloremtaxes,theoveralleffectiveraterisesto8thwhenpersonalincomeandsalestaxesareconsidered.Manyofthemajorproducingstateshaveeithernopersonalincometaxorverylowsalestaxrates,orboth,andareheavilyreliantupontraditionalseveranceandadvaloremtaxestofundstateandlocalgovernment.Oklahoma,ontheotherhand,leviesrelativelylowseveranceandadvaloremtaxesbutreliesheavilyuponabove-averagesalesandpersonalincometaxespaidbytheindustry.
Moreimportantly,therecentlyimplementedincreaseinthestate’sseverancetaxrateispushingthestate’soveralleffectivetaxrateonoilandgasproductionmuchhigherthisfiscalyearandnext.BasedonOklahomaTaxCommissionforecasts,theseverancetaxrateincreaseisprojectedtopushthestate’soveralleffectivetaxrateto5thhighestinthecurrentfiscalyear(FY2018),risingabovetheoverallrateleviedbydominant-producerTexas.
Furtherincreasesinseverancetaxrateswouldraisethestate’soveralleffectivetaxratetoamongthehighestleviedbythemajoroilandgas-producingstates.AscenarioofshiftingallprojectedFY2019productioninthe2%taxbrackettoa4%severancetaxratewouldgiveOklahomathe3rdhighestoveralleffectivetaxrate.AscenarioofshiftingalloilandgasproductioninFY2019toa7%severancetaxratewouldgiveOklahomathe2ndhighestoveralleffectivetaxrateamongthesixteenlargestproducingstates.

Page|4 RegionTrack,Inc.
OklahomaOilandGasIndustryTaxation
II. SeveranceTaxesSeverancetaxeshavelongbeenleviedonoilandgasproductioninOklahomaandareakeysourceoffundingforstateandlocalgovernment.SometimesreferredtoasgrossproductiontaxesinOklahoma,theyareoftenviewedastheprimarytaxpaidbytheoilandgasindustry.1TheanalysisinthissectionexaminesrecentchangesinseverancetaxratesinOklahomaandtheeffectontotalseverancetaxpayments.Theeffectiveannualseverancetaxrateisthencalculatedforthestatethepasttwodecades.Effectiveratesarecalculatedforfifteenadditionaloil-andgas-producingstatesintheFY2012toFY2017period.Finally,effectiveratesinOklahomaareevaluatedunderOklahomaTaxCommissionprojectionsofseverancetaxrevenuebasedonrecentlyincreasedseverancetaxrates.
RecentTaxLawChanges.Historically,Oklahomahasassesseda7percentmarginalseverancetax
rate(beforedeductions,exemptions,andrebates)onmostcrudeoilandnaturalgasproduction.
EffectiveJuly2011,theLegislaturechangedtheincentiveinplaceforhorizontally-drilledwellsandcertaindeepwells.Inlieuofarebate,theseverancetaxratewaschangedto1%for48monthsonproductionfromnewhorizontally-drilledwellsand4%fordeepwells.2
In2014,theLegislaturestreamlinedoilandgastaxationfurther,andseverancetaxrateswerechangedonceagain.AllwellsdrilledafterJuly2015aresubjecttoataxof2%forthefirst36monthsofproduction,withtheraterevertingto7%thereafter.Somedeepwellsarestilltaxedat4%for48months,revertingto7%thereafter.Wellstaxedundertheprevious1%rateforhorizontalwellsretainedtheiroriginaldatetorevertto7%.Asaresult,wellsinOklahomaarecurrentlytaxedateither1%,2%,4%,or7%,withallproductionultimatelytransitioningto7%.
Alongstandingexcisetaxof0.095%ofproductionvalueoncrudeoilandnaturalgasproductionisstillleviedaswell.
OklahomaSeveranceTaxPayments.Figure1providesanoverviewoftotalannualseverancetaxpaymentsmadebyOklahomaoilandgasproducersthepasttwodecades.Severancetaxreceiptsaveragedapproximately$385millionannuallybetweenFY1997andFY2002beforerisingsubstantiallyalongwithbothenergypricesandproductionbeginninginFY2003.Paymentsaveragedalmost$1billionannuallybetweenFY2005andFY2012,boostedbyhighpricesforbothcrudeoilandnaturalgas.
Totalseverancetaxreceiptsaveraged$503millionannuallyfromFY2013throughFY2017.Thelowinreceiptsof$331millioninFY2016reflectsseverancetaxrelieffromtheLegislatureforhorizontally-drilledwellscoupledwithanunusuallyadversesetofindustryconditions.InFY2016,severancetaxreceiptsweredrivendownwardbyacollapseincrudeoilprices($38/bblaverage),anearly20-yearlowinnaturalgasprices($2.26/mBtuaverage),relativelyflatstatenaturalgasproduction,andadeclineinstatecrudeoiloutput.FromFY2014toFY2016,thetotalvalueofcrudeoilandnaturalgasproducedinthestatedeclinedbynearlyhalftothelowestlevelinmorethanadecade.Thestatesimilarlyremainedmiredinanearlytwo-yearstate-levelrecessiontiedtotheoilandgasindustryslowdown.

Page|5 RegionTrack,Inc.
OklahomaOilandGasIndustryTaxation
Totalseverancetaxreceiptsreboundedby28%inFY2017to$425millionasmarketpricesforcrudeoilandnaturalgasrecoveredfromrecentlows.Themostrecenttaxlawchangeisalsoliftingseverancetaxesinthecurrentfiscalyear(FY2018)aswellspreviouslytaxedateitherthe1%,2%,or4%ratearenowmovingintothe7%marginaltaxbracket.Asaresult,currentforecastsbytheOklahomaTaxCommissionsuggestthatseverancetaxreceiptswillreboundmuchfurtherinthenearterm.December2017projectionsbytheOklahomaTaxCommissionsuggestareboundintotalseverancetaxreceiptsto$639millioninthecurrentfiscalyearand$722millioninFY2019.3
TheshiftingshareofproductionateachseverancetaxrateforbothcrudeoilandnaturalgasisdetailedinFigure2.OklahomaTaxCommissionsforecastssuggestthat70.9%oftotalstateproductionwillbetaxedat7%inFY2018,risingto81.5%byFY2019.Relativelysmallsharesofproductionwillbetaxedateitherthe1%or4%legacyratesinFY2018.Noproductionofeithercrudeoilornaturalgasisexpectedtoremainatthe1%or4%ratesinFY2019.
Figure2.OklahomaSeveranceTaxRevenueProjections
TaxRate
CrudeOil NaturalGas Total
FY2018 FY2019 FY2018 FY2019 FY2018 FY2019
1% $3,223,000 $0 $3,662,000 $0 $6,885,000 $0
2% 74,865,000 76,497,000 51,875,000 56,866,000 126,740,000 133,363,000
4% 24,123,000 0 28,269,000 0 52,392,000 0
7% 211,740,000 290,053,000 240,991,000 298,544,000 452,731,000 588,597,000
Total $313,951,000 $366,550,000 $324,797,000 $355,410,000 $638,748,000 $721,960,000Source:OklahomaTaxCommission.StateofOklahomaFY2018-19RevenueCertification.December20,2017.Notes:Petroleumexcisetaxpaymentsof0.095%areincludedintheseprojections.
Figure1.OilandGasSeveranceTaxPayments–Oklahoma(FiscalYear)
Source:OklahomaTaxCommissionNotes:Includesbothseverancetaxesandthe0.095%petroleumexcisetax.
351310
221
389
671
373
582
692
860
1,136
986
1,141
917869
978895
529
686
560
331
425
639722
0
200
400
600
800
1,000
1,200
97 98 99 00 01 02 03 04 05 06 07 08 09 10 11 12 13 14 15 16 17 18 19
$Millions

Page|6 RegionTrack,Inc.
OklahomaOilandGasIndustryTaxation
TaxChangesApportionedtoValueandRateChanges.Itisimportanttounderstandthedegreetowhichtaxlawchangesversusshiftsinthevalueofproductionhavedrivenrecentyear-to-yearchangesinstateseverancetaxpayments.Figure3apportionstheannualchangeinseverancetaxes(panelA)intochangesduetoproductionvalueandchangesduetotaxrate(panelB).
Mostoftheeffectiveshiftfromthetaxratechangein2011wasfullyabsorbedbyFY2013.NosignificantchangesduetotaxrateshavetakenplacesinceFY2014,withweakseverancetaxrevenueinFY2015andFY2016tracedalmostfullytodecliningproductionvalue.
HigherproductionvaluecontributednearlyallthenetgainintaxpaymentsinFY2017.GoingforwardintoFY2018andFY2019,taxratechangesareexpectedtocontributenearlyallnewseverancetaxrevenuegrowth.Approximately$300millioninnetnewannualseverancetaxrevenueisprojectedthroughFY2019relativetoFY2017,mostlyfromtaxrateincreases.
Figure3.OklahomaSeveranceTax–SourceofAnnualChanges(FiscalYears)(A) AnnualSeveranceTaxChange
(B) AnnualChangeApportionedtoProductionValueandEffectiveTaxRateChanges
Source:OklahomaTaxCommissionandRegionTrackcalculations
-41 -89
168
282
-297
208
110168
276
-150
155
-224
-48
109
-83
-366
157
-126
-229
94
214
83
-400
-300
-200
-100
0
100
200
300
400
98 99 00 01 02 03 04 05 06 07 08 09 10 11 12 13 14 15 16 17 18 19
$Millions
-750
-500
-250
0
250
500
98 99 00 01 02 03 04 05 06 07 08 09 10 11 12 13 14 15 16 17 18 19
Millions
ValueofProductionChange
EffectiveSeveranceTaxRateChange

Page|7 RegionTrack,Inc.
OklahomaOilandGasIndustryTaxation
OklahomaEffectiveSeveranceTaxRate.Figure4providesestimatesoftheeffectiveseverance
taxrateinOklahomathepasttwodecades.ProjectionsforFY2018andFY2019areprovidedtoillustratetheexpectedchangeintherateinresponsetorecentlyenactedtaxlawchanges.SeeFigureA1intheAppendixfordetailedcomponentsoftheratecalculations.
Methodology.Theeffectiverateiscalculatedastotalseverancetaxesdividedbythetotalmarketvalueofoilandgasproduction.ThevalueofproductioniscalculatedusingEnergyInformationAdministration(EIA)estimatesofmonthlyproductionwhichareconvertedtofiscalyears.ThepriceofcrudeoilisthefirstpurchasepriceatthestatelevelprovidedbyEIA.Thisprovidespriceestimatesthatcloselytrackstate-levelpricesusedforseverancetaxreportingpurposesandcanbeusedinmakingconsistentcross-statecomparisons.ThevalueofnaturalgasproductionisdeterminedusingtheHenryHubspotpriceofnaturalgas.Thesepricesforcrudeoilandnaturalgasarealsousedinthecalculationofproductionvaluesincross-statecomparisonsforconsistency.4
HistoricalRates.TheeffectiveseverancetaxrateinOklahomafluctuatedaroundanaverageof6.0%betweenFY1997andFY2009.Ratesthenbouncedhighertoanaverageof7.0%betweenFY2010andFY2012beforefallinginresponsetoseverancetaxrelieflegislation.Theratehasaveraged3.0%sinceFY2013,approximatelyhalfthe6.2%averageratefromFY1997toFY2012.ThesteepdeclineintheeffectiveratefromFY2012toFY2013reflects,inpart,theshiftinseverancetaxpolicyfromtheuseofarefundedrebatetoareducedseverancetaxrate.PriortoFY2011,severancetaxeswerecollectedandthenreturnedtotaxpayersinarrearsasrebates,whilethereplacementlegislationcollectsrevenuefromnon-exemptproductiononly.
Themostrecenttaxlawchangeswillproduceasignificantriseinthestate’seffectiveseverancetaxrate
Figure4.EffectiveSeveranceTaxRate–Oklahoma
Source:EnergyInformationAdministration,OklahomaTaxCommission,andRegionTrackcalculations
5.9% 5.7% 5.4%
6.1% 6.2% 6.3% 6.1% 6.4% 6.4%
6.1% 6.2%
5.3% 5.8%
7.0% 7.1% 6.9%
3.2% 3.2% 3.0% 2.9% 3.0%
4.4% 4.8%
0%
1%
2%
3%
4%
5%
6%
7%
8%
97 98 99 00 01 02 03 04 05 06 07 08 09 10 11 12 13 14 15 16 17 18 19
Page|8 RegionTrack,Inc.
OklahomaOilandGasIndustryTaxation
asproductiontransitionstothe7%taxbracket.BasedonOklahomaTaxCommissionforecastsforseverancetaxreceipts,theeffectiverateisprojectedtoriseto4.4%inFY2018and4.8%inFY2019.TheeffectiverateforecastisbasedonestimatesofflatproductionquantitiesforcrudeoilandnaturalgasinbothFY2018andFY2019,oilpricesof$47.49perbarrelinFY2018and$51.08perbarrelinFY2019,andnaturalgaspricesof$2.94inFY2018and$2.99inFY2019.
AsillustratedinFigure3,theprimarycontributortotheriseintheeffectiveseverancetaxrateinFY2018andFY2019willberisingtaxrates,withlittlecontributionfromrisingproductionvalue.
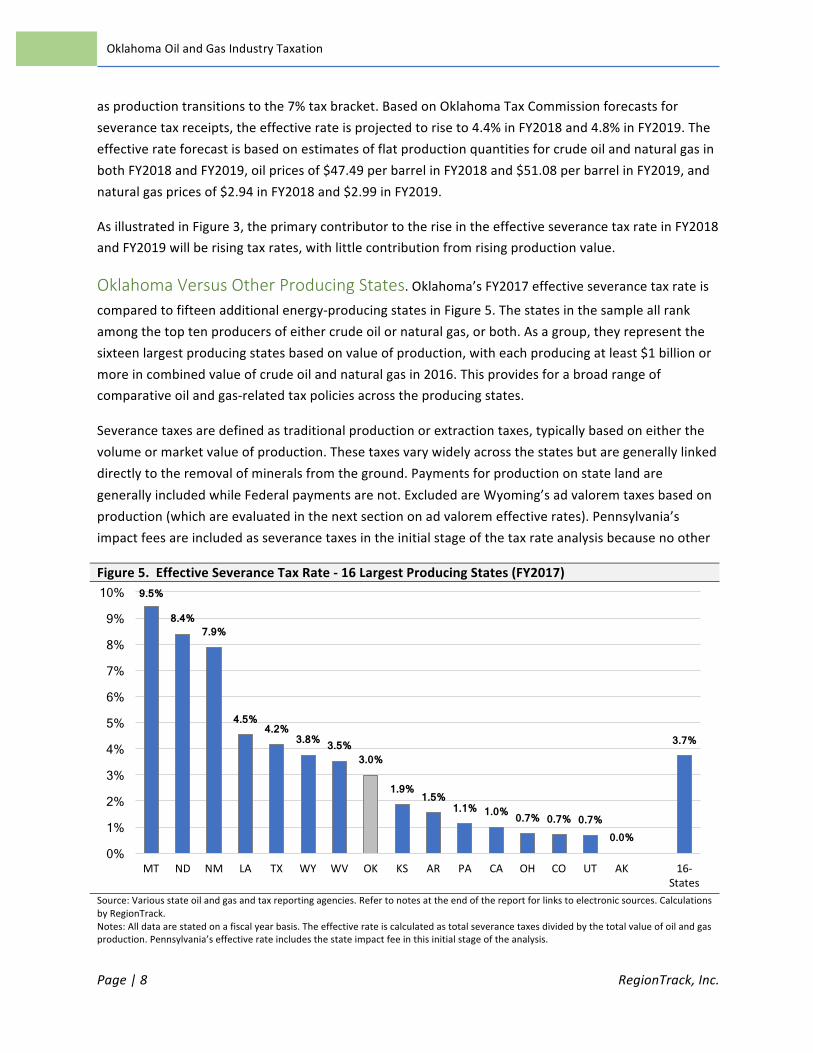
OklahomaVersusOtherProducingStates.Oklahoma’sFY2017effectiveseverancetaxrateis
comparedtofifteenadditionalenergy-producingstatesinFigure5.Thestatesinthesampleallrankamongthetoptenproducersofeithercrudeoilornaturalgas,orboth.Asagroup,theyrepresentthesixteenlargestproducingstatesbasedonvalueofproduction,witheachproducingatleast$1billionormoreincombinedvalueofcrudeoilandnaturalgasin2016.Thisprovidesforabroadrangeofcomparativeoilandgas-relatedtaxpoliciesacrosstheproducingstates.
Severancetaxesaredefinedastraditionalproductionorextractiontaxes,typicallybasedoneitherthevolumeormarketvalueofproduction.Thesetaxesvarywidelyacrossthestatesbutaregenerallylinkeddirectlytotheremovalofmineralsfromtheground.PaymentsforproductiononstatelandaregenerallyincludedwhileFederalpaymentsarenot.ExcludedareWyoming’sadvaloremtaxesbasedonproduction(whichareevaluatedinthenextsectiononadvaloremeffectiverates).Pennsylvania’simpactfeesareincludedasseverancetaxesintheinitialstageofthetaxrateanalysisbecausenoother
Figure5.EffectiveSeveranceTaxRate-16LargestProducingStates(FY2017)
Source:Variousstateoilandgasandtaxreportingagencies.Refertonotesattheendofthereportforlinkstoelectronicsources.CalculationsbyRegionTrack.Notes:Alldataarestatedonafiscalyearbasis.Theeffectiverateiscalculatedastotalseverancetaxesdividedbythetotalvalueofoilandgasproduction.Pennsylvania’seffectiverateincludesthestateimpactfeeinthisinitialstageoftheanalysis.
9.5%
8.4% 7.9%
4.5% 4.2%
3.8% 3.5% 3.0%
1.9% 1.5%
1.1% 1.0% 0.7% 0.7% 0.7% 0.0%
3.7%
0%
1%
2%
3%
4%
5%
6%
7%
8%
9%
10%
MT ND NM LA TX WY WV OK KS AR PA CA OH CO UT AK 16-States

Page|9 RegionTrack,Inc.
OklahomaOilandGasIndustryTaxation
taxesareassessedbythestateeitherdirectlyorindirectlyonproduction.
Avarietyofsourcesareusedtocollectseverancetaxdataforthesixteenstates.Theprimarysourcesarestatetaxreportingagenciesornaturalresourceadministrativeagencies.Sourcesavailableinelectronicformaredetailedinthenotestothereport.5FigureA1intheAppendixprovidessummarymeasuresunderlyingtheeffectiveseverancetaxratecalculationforeachofthesixteenstatesintheFY2012toFY2017period.Taxesarecalculatedbasedonthefiscalyearusedbyeachstate.6
Oklahoma’seffectiveseverancetaxrateis3.0%inFY2017,8thhighestamongthegroupandbelowthegroup’svalue-weightedaverageof3.7%.Thesimpleaverageofratesacrossthestatesis3.3%.Theoveralleffectiveseverancetaxrateforthegroupisalsoroughlyhalfthe6.6%effectiveratereportedinarecentstudyofIdahooilandgastaxation(Covenant,2016)coveringasmallersampleofnineproducingstates.
Threestates(Montana,NorthDakota,andNewMexico)compriseatoptierwithsignificantlyhighereffectiveratesofapproximately8%ormore.Thesestatesarecommonlyincludedincross-statereviewsofseverancetaxratesbutappearmoreasoutlierswhenviewedacrossabroadersetofproducingstates.
Oklahomaandfourotherstates(Louisiana,Texas,Wyoming,andWestVirginia)formamiddletierwitheffectiveratesbetween3%and4.5%.Texas,thenation’slargestproducerofbothcrudeoilandnaturalgas,hasa4.2%effectiverate,1.2%aboveOklahomaandone-halfpercentagepointabovethegroupweightedaverage.
Athirdtierofeightstates–Kansas,Arkansas,Pennsylvania,California,Ohio,Colorado,Utah,andAlaska–hasrelativelyloweffectiveseverancetaxratesbelow2%inFY2017.NeighboringKansasandArkansasbothhaveratesbetween1.5%and2%.Kansasprovidesa3.67%credittowardseverancetaxesforpropertytaxespaid,leavinganetmarginalrateof4.33%butaneffectiverateofonly1.9%.RapidlygrowinggasproducersPennsylvaniaandOhiohaveeffectiveratesofabout1%orless.Pennsylvania,thesecondlargestgasproducingstate,isincludedinthecomparisondespitehavingnodirectseverancetax.Itisincludedintheinitialstageoftheanalysisbasedonitsimpactfeeservingastheonlydirectproductioncostassessedbythestate.
California,thethirdlargestoilproducingstate,hasonlya1.0%effectiveseverancetaxrate.7Thestatehaslongassessednodirectseveranceoradvaloremtaxesatthestatelevel,butdoesallowlocaladvaloremtaxes.Thestateassessesonlyasmallfeebasedonthevolumeofproductionofcrudeoilandnaturalgas.
LargeandrapidlygrowingproducerColoradohasaneffectiveratebelow1.0%duetoanallowedoffsetofseverancetaxesbyadvaloremtaxpayments.Thisfunctionslargelyasanadvaloremtaxinlieuofseverancetaxpayments,oppositetherelationshipinplaceinOklahoma.
Page|10 RegionTrack,Inc.
OklahomaOilandGasIndustryTaxation
Despitehistoricallylargeseverancetaxpayments,Alaska,thefourth-largestoilproducingstate,hasexperiencedamulti-yearcollapseinseverancetaxreceiptsinrecentyears.InAlaska,theseverancetaxisbasedonprofitabilityofthereportingfirmratherthanthepriceofoilorvalueofproduction.8Becauseofbothlowenergypricesanddecliningoilproductioninthestate,theindustryhasexperiencedextremefinancialdistressinrecentyears.WhileafinalestimateisnotyetavailableforFY2017,thestateisexpectedtopostaslightdeclineinseverancetaxes.Becauseoftheuncertaintyandpotentialforanegativeeffectiverate,weassignthestatea0%estimatedeffectiveseverancetaxrateinFY2017.
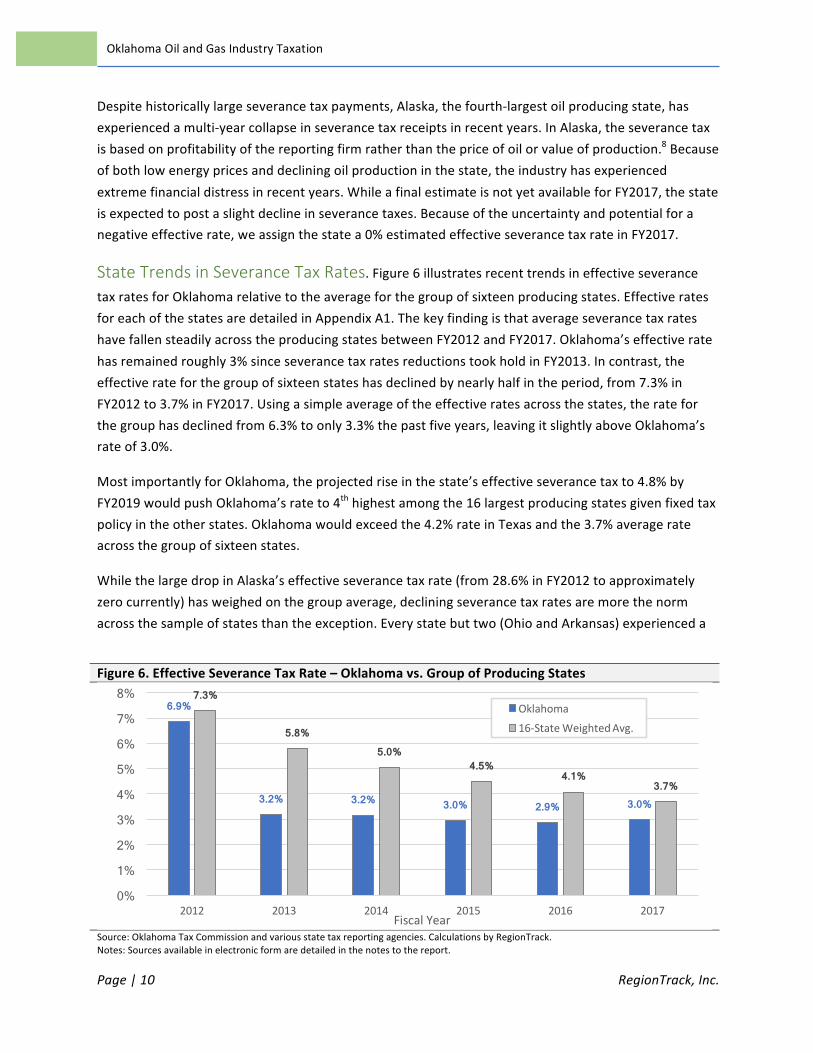
StateTrendsinSeveranceTaxRates.Figure6illustratesrecenttrendsineffectiveseverancetaxratesforOklahomarelativetotheaverageforthegroupofsixteenproducingstates.EffectiveratesforeachofthestatesaredetailedinAppendixA1.ThekeyfindingisthataverageseverancetaxrateshavefallensteadilyacrosstheproducingstatesbetweenFY2012andFY2017.Oklahoma’seffectiveratehasremainedroughly3%sinceseverancetaxratesreductionstookholdinFY2013.Incontrast,theeffectiverateforthegroupofsixteenstateshasdeclinedbynearlyhalfintheperiod,from7.3%inFY2012to3.7%inFY2017.Usingasimpleaverageoftheeffectiveratesacrossthestates,therateforthegrouphasdeclinedfrom6.3%toonly3.3%thepastfiveyears,leavingitslightlyaboveOklahoma’srateof3.0%.
MostimportantlyforOklahoma,theprojectedriseinthestate’seffectiveseverancetaxto4.8%byFY2019wouldpushOklahoma’srateto4thhighestamongthe16largestproducingstatesgivenfixedtaxpolicyintheotherstates.Oklahomawouldexceedthe4.2%rateinTexasandthe3.7%averagerateacrossthegroupofsixteenstates.
WhilethelargedropinAlaska’seffectiveseverancetaxrate(from28.6%inFY2012toapproximatelyzerocurrently)hasweighedonthegroupaverage,decliningseverancetaxratesaremorethenormacrossthesampleofstatesthantheexception.Everystatebuttwo(OhioandArkansas)experienceda
Figure6.EffectiveSeveranceTaxRate–Oklahomavs.GroupofProducingStates
Source:OklahomaTaxCommissionandvariousstatetaxreportingagencies.CalculationsbyRegionTrack.Notes:Sourcesavailableinelectronicformaredetailedinthenotestothereport.
6.9%
3.2% 3.2% 3.0% 2.9% 3.0%
7.3%
5.8% 5.0%
4.5% 4.1%
3.7%
0%
1%
2%
3%
4%
5%
6%
7%
8%
2012 2013 2014 2015 2016 2017FiscalYear
Oklahoma16-StateWeightedAvg.

Page|11 RegionTrack,Inc.
OklahomaOilandGasIndustryTaxation
declineintheeffectiverateinthefive-yearperiodfromFY2012toFY2017.TherateinTexasdeclinedfrom4.6%to4.2%,andwasaslowas3.6%asrecentlyasFY2016.Amongotherlargeproducingstates,theeffectiveratedeclinedfrom5.1%to4.5%inLouisiana,9.9%to8.4%inNorthDakota,1.8%to0.7%inColorado,5.7%to3.8%inWyoming,2.4%to1.0%inCalifornia,and9.8%to7.9%inNewMexico.
III. AdValoremTaxesAlongwithseverancetaxes,mostproducingstatesassesssomeformofadvalorem,orproperty,taxtiedtotheproductionofcrudeoilandnaturalgas.Thetaxistypicallyappliedtothevalueofeithermineralsinthegroundortheequipmentusedabovegroundforextractionandproduction,orboth.AnexceptionisWyoming,whichhasalocaladvaloremtaxbasedonthevalueofproduction.
InOklahoma,theseverancetaxisleviedinlieuofalocalpropertytaxonthevalueofmineralsinthegroundandtheequipmentthatisessentialtotheproductionofawell.Localgovernmentsinthestatedo,however,haveauthoritytoassessthevalueofotheroilandgas-relatedequipmentandinfrastructure.Hence,Oklahomaishistoricallyviewedasalowpropertytaxstateforoilandgasactivity.
OklahomaTaxes.Readilyavailablestate-leveldataonoilandgas-relatedpropertytaxpaymentsinOklahomaissparse.Statewidedataareavailablefor2012,2014,and2016basedonvaluationsasofNovember1forthestatedcalendaryear.9Weinterpolatetaxpaymentsfor2013and2015usingthemidpointbetweenactualpaymentsinthesurroundingyears.Giventhesmoothnessinherentinadvaloremtaxreceiptsovertime,wedonotbelievetheresultsaresensitivetothisapproach.
Twocategoriesofreportedseverancetaxesareusedintheanalysis:1)Refineries,GasPlants,Gathering&Compressionand2)OtherOil,Gas&MiningProperty.RefineriesareviewedasmanufacturingandareremovedfromthetotalforfourcountiesinOklahoma(Kay,Carter,Tulsa,andGarvin).Theadjustedtotal(exrefineries)forthefirstcategoryisaddedtothesecondtoreflecttotaloilandgas-relatedpropertytaxpaymentsinOklahoma.Itisimportanttonotethatthismeasuresubstantiallyunderstatesthetotalpropertytaxpaymentspaidbytheoilandgasindustry.Thetotalincludesonlypropertyusedintheproductionofoilandgasandexcludesbuildingsandotherrealproperty,aswellassignificantpersonalpropertyusedintheoperationsofoilandgasfirmsacrossthestate.Effectivepropertytaxratesarecalculatedasannualpropertytaxesdividedbythetotalvalueofoilandgasproduction.
Figure7illustratesannualOklahomapropertytaxpaymentsrelatedtooilandgasproductionandeffectiveadvaloremtaxratesfromFY2012toFY2016.Paymentstotaled$157.6millioninFY2016,up42%from$110.7millioninFY2012.Theeffectiveratewas1.4%inFY2016basedon$157.6millioninpropertytaxesand$11.51billioninproductionvalue.OvertheFY2012toFY2015period,propertytaxesaveragedslightlylessthan1%ofproductionvalue.TheeffectiverateincreasedsharplyinFY2016becauseofbothhighertaxpaymentsandfallingproductionvalue.
State-LevelReportingChallenges.Wenextexamineestimatedannualpropertytaxpaymentsforthesixteenlargestproducingstates.ThetargetedcomparisonyearisFY2016,themostrecentlyavailable

Page|12 RegionTrack,Inc.
OklahomaOilandGasIndustryTaxation
dataformoststates.Avarietyofsourcesareusedtoformadvaloremtaxestimatesforthesixteenstates.Theprimarysourcesarestatetaxreportingagencies.Sourcesavailableinelectronicformaredetailedinthenotestothereport.10
Numerouschallengesarefacedinassemblingastate-levelcomparativeviewofoilandgas-relatedadvaloremtaxation.Forexample:
1. Propertyvaluationsarenotdeterminedatauniformpointintimeacrossthestates;2. Thedefinitionusedfortheoilandgasindustrydiffersgreatlyacrossthestates;3. Thespecificassetsdeemedoilandgas-relateddiffergreatlyacrossthestates;4. Propertytaxesaregenerallyassessedbylocalgovernmentsratherthanthestateanda
consolidatedsourceoftaxreportingmaynotbeavailable;5. Therearetimingdifferencesassociatedwiththeschedulegoverningwhenpropertytaxesare
calculated,reported,andpaidthatmayaffectthecomparativebaseyearforsomestates;6. Somestatessimplyreportvaluationsandmillageratesthatrequireadirectcalculationor
estimationoftaxes;7. Therearegenerallynofollow-uprevisionstothedatatoreflectvaluationchallenges,rebates,
reassessments,andothersubsequentchangestoactualtaxreceipts.
Amongthe16largestproducingstates,therearenopropertytaxesassessedonoilandgasactivityinNorthDakotaandPennsylvania.TheestimatesforColorado,NewMexico,Texas,andOhioreflectFY2015taxpayments,thelatestdataavailable.TaxesinWestVirginiaforFY2016arebasedonthevalueofproductionfromtwoyearsprior.TaxesreportedforArkansasarefor2016paymentbutbasedonFY2015valuations.Californiapropertytaxesareonlyreportedatthelocallevelandmustbeextrapolatedtothestatelevel.11
Figure7.OilandGas-RelatedAdValoremTaxPaymentsandEffectiveRate-OklahomaPayments EffectiveRate
Source:OklahomaTaxCommissionandRegionTrackcalculations.Notes:Alldataareforfiscalyears.Paymentsin2013and2015areinterpolatedasthemidpointbetweenadjacentyears.Theeffectiverateiscalculatedasadvaloremtaxpaymentsdividedbythetotalvalueofoilandgasproduction.
110.7
128.6
146.6 152.1 157.6
0
20
40
60
80
100
120
140
160
180
2012 2013 2014 2015 2016
$Millions
0.8% 0.8%
0.7% 0.8%
1.4%
0.0%
0.2%
0.4%
0.6%
0.8%
1.0%
1.2%
1.4%
1.6%
2012 2013 2014 2015 2016

Page|13 RegionTrack,Inc.
OklahomaOilandGasIndustryTaxation
Estimatesofoilandgas-relatedadvaloremtaxreceiptsforeachstateandtheunderlyingeffectiveratecalculationsaredetailedinAppendixA2.SeeRaimiandNewell(2016)fordetailedcomparativeestimatesofadvaloremtaxespaidbytheoilandgassectorintheproducingstates.
OklahomaVersusOtherProducingStates.ComparativeestimatesofeffectiveadvaloremtaxratesareshowninFigure8forthe16largestproducingstates.TheratesaretargetedatabaseyearofFY2016,subjecttotheinherentvariabilityinstate-to-statereporting.Giventhehistoricalsmoothnessinaggregatestate-leveladvaloremtaxdataovertime,thisvariationisnotbelievedtoaltertheoverallresultsinanymeaningfulway.
Theaverageeffectiveadvaloremtaxrateis2.7%acrossthegroupofsixteenstates,rangingfrom0%inNorthDakotaandPennsylvaniato5.4%inColorado.
Threestates–Colorado,California,andWyoming–haveeffectiveadvaloremtaxratesabove4.5%.Coloradousesprimarilypropertytaxesbecauseitallowsanoffsetof87.5%ofadvaloremtaxespaidasacredittowardseverancetaxes,leavinglittlenetseverancetaxliabilityformostpayers.Californiaassessesalocaladvaloremtax,withnostatewideorlocalseverancetax.Wyominghasalocaladvaloremtaxleviedonproductionvalueaswellasataxonequipment.
Fouradditionalstates–Texas,WestVirginia,Kansas,andLouisiana–levypropertytaxesbetween3%and4%ofproductionvalue.Texasappliespropertytaxestobothmineralvalueandequipment.
Oklahomafallsinathirdtierofstates–Utah,NewMexico,Alaska,Arkansas,andOklahoma–witheffectiveadvaloremtaxratesbetweenapproximately1.5%and2.5%.AlaskaandNewMexicohavehistoricallyreliedmoreheavilyonseverancetaxes.Utah,Arkansas,andOklahomahavehistoricallyfavoredlimitedrelianceonpropertytaxes.
Figure8.EffectiveAdValoremTaxRate(FY20161)

Page|14 RegionTrack,Inc.
OklahomaOilandGasIndustryTaxation
Thefinalfourstates–Ohio,Montana,NorthDakota,andPennsylvania–haveeffectiveadvaloremtaxratesbelow1%ofproductionvalue.Fast-growinggasproducerOhiocontinuestolevylowoveralloilandgas-relatedtaxes.NorthDakotaandPennsylvaniadonotpermitlocalgovernmentstoassessadvaloremtaxesonoilandgasproductionactivity.
CombinedSeveranceandAdValoremTaxRates.Figure9providesacomparativeviewofcombinedseveranceandadvaloremeffectivetaxrateswithabaseyearofFY2016forseverancetaxesandanapproximatebaseyearofFY2016(subjecttodatalimitations)foradvaloremtaxes.AppendixA2providesdetailsofthecomponentcalculationsforthecombinedeffectiverates.
Oklahoma’scombinedeffectiverateis4.24%,composedofaseverancetaxrateof2.87%andadvaloremrateof1.37%.Thisranks12thamongthesixteenstatesinthesample.
Theaveragecombinedeffectiverateis6.8%acrossallsixteenstates-4.1%forseveranceand2.7%foradvalorem.
Atoptieroffivestates–NewMexico,Wyoming,Montana,Louisiana,andNorthDakota–havecombinedeffectiveratesofapproximately10%.Amongthesestates,allbutWyomingareheavilytiltedtowardhighseverancetaxesandrelativelylowpropertytaxes.Montanalevieslessthan0.5%ineffectivepropertytaxes.Montanaalsohasnoadvaloremtaxesonthevalueofmineralsbutallowslocalpropertytaxesonsomesurfaceequipment.Wyomingisuniqueinthatitassessesarelativelyhighshareofbothseveranceandpropertytaxes.Louisianaassessesalargeseverancetaxinlieuofadvaloremtaxonproductionbutallowslocaladvaloremtaxesonequipment.NorthDakotaallowsnopropertytaxesonoilandgasassetsbutreliesheavilyonhighseverancetaxes.
Notes:Dataarecollectedfromvariousstatereportingagency.Sourcesavailableinelectronicformaredetailedinthenotestothereport.SeeFigure15foradvaloremtaxpaymentsbystate.1TheeffectiverateshaveatargetedbaseyearofFY2016,subjecttotheinherentvariabilityinstate-to-statereporting.
Figure9.CombinedSeverance&AdValoremEffectiveTaxRates(FY2016)
5.4% 5.1%
4.6%
3.5% 3.3% 3.3% 3.1%
2.3% 2.0%
1.7% 1.7% 1.4%
0.8% 0.4%
0.0% 0.0%
2.7%
0%
1%
2%
3%
4%
5%
6%
CO CA WY TX WV KS LA UT NM AK AR OK OH MT ND PA 16-States

Page|15 RegionTrack,Inc.
OklahomaOilandGasIndustryTaxation
Asecondtierofsixstates–WestVirginia,Texas,Colorado,California,Kansas,andAlaska–hascombinedeffectiveratesbetween5%and8%.Thesestatesgenerallyuseamorebalancedcombinationofseveranceandpropertytaxes.LeadingproducerTexashasa7.1%ratethatissplitalmostevenlybetweenthetwotaxes.ColoradoandCaliforniaareheavilyweightedtowardpropertytaxesandhaveamongthelowestseverancetaxratesatapproximately1%.Kansasassessesadvaloremtaxesonbothequipmentandreserves.Alaskahastransitionedfromheavyrelianceonseverancetaxestoamorebalancedshareofeachfollowingacollapseinstateseverancetaxesinrecentyears.
Oklahoma’scombinedrateof4.2%isgroupedamongafinaltieroffivestates–Oklahoma,Utah,Arkansas,Ohio,andPennsylvania–withcombinedeffectiveratesbelow5%.Utahmaintainsalowcombinedrateof3.5%,includingadvaloremtaxesonreservesandaconservationtaxof0.2%.
NeighboringArkansasassessesa3.1%combinedrate.Bothfast-growinggas-producingstatesofOhioandPennsylvaniahaveverylowcombinedeffectiveratesof1.7%and1.5%,respectively.
Forward-LookingCombinedRate.TheexpectedreboundinOklahomaseverancetaxesinresponsetorecenttaxlawchangeswillraisethecombinedseveranceandadvaloremtaxrategoingforward.Figure10providesprojectionsofthecombinedratethroughFY2019.TheseverancetaxoutlookisbasedonOklahomaTaxCommissionprojectionsofseverancetaxpaymentsdescribedinthepriorsection.Theadvaloremtaxassumptionsassumepropertytaxpaymentsincreaseby2%annuallyintheFY2017toFY2019period.Theoilandgasproductionvalueassumptionsarethesameusedtoestimateprojectedseverancetaxratesinthepriorsectionofthereport.FigureA1intheAppendixprovidesdetailsonthecomponentsoftheprojectedeffectiveratecalculations.
Figure10.ProjectedCombinedSeverance&AdValoremEffectiveTaxRate-Oklahoma
8.6%
5.5%
9.6%
6.9%
9.5%
4.2% 3.6%
1.0% 1.1% 2.1%
3.6% 2.87% 1.2% 1.4% 0.9% 1.5%
4.1%
2.0%
4.6%
0.4%
3.1%
0.0%
3.3% 3.5%
5.4% 5.1% 3.3% 1.7%
1.37%
2.3% 1.7% 0.8% 0.0%
2.7%
0%
2%
4%
6%
8%
10%
12%
NM10.6%
WY10.1%
MT10.0%
LA10.0%
ND9.5%
WV7.5%
TX7.1%
CO6.4%
CA6.2%
KS5.4%
AK5.3%
OK4.2%
UT3.5%
AR3.1%
OH1.7%
PA1.5%
16-States6.8%
Severance AdValorem

Page|16 RegionTrack,Inc.
OklahomaOilandGasIndustryTaxation
ThecombinedseveranceandadvaloremeffectivetaxrateinOklahomawillrisetoaprojected5.3%inthecurrentfiscalyear(FY2018)andto5.7%inFY2019.Assumingconstanttaxpolicyinotherstates,thiswouldrankOklahoma10thamongthe16statesbasedonFY2019combinedeffectiveseveranceandadvaloremtaxrates.TheadjustedeffectiveratewouldfalljustaboveKansas(5.4%)andAlaska(5.3%)andjustbelowCalifornia(6.2%).Thestatewouldfall1.4%belowtheeffectiverateof7.1%inTexas.
IV. MeasuringtheBroaderTaxContributionofOil&GasThecombinedeffectiveseveranceandadvaloremtaxrateisoftenusedasameasureofthetaxcontributionofthestate’soilandgasindustry.Cross-statecomparisonsalsofrequentlyusethetwotaxesasabasisforcomparingrelativetaxburdensontheindustry.Forrecentexamplesofmulti-statecomparisonsbasedonthesemeasures,seeCovenant(2017)andRaimiandNewell(2018).ForexamplesofadvocacygroupsusingseveranceandadvaloremtaxesasevidenceofalowoilandgastaxburdeninOklahoma,seeHeadwaters(2013)andBlatt(2017).
Basedsolelyonthesetwotaxes,Oklahomaappearstobearelativelylow-taxstatewithrespecttooilandgasactivity,withacombined4.2%effectiveseveranceandadvaloremtaxrate(seeFigure9).Whilethesetaxestendtocapturethedirecttaxationappliedtoproduction,theyprovideawhollyineffectivemeasureoftheoveralltaxcontributionoftheoilandgasindustrywithinthestate.Alongwithseveranceandadvaloremtaxes,Oklahomaalsoleviesrelativelyhighpersonalincomeandsalestaxes.ThesearealsothetwolargestsourcesoftotalstateandlocalgovernmenttaxrevenueinOklahoma.
Instead,theoverallstructureofastate’staxsystemcanhaveasmuchinfluenceonthetotaltaxburdenoftheoilandgasindustryastheamountofseveranceandadvaloremtaxeslevied.Theotheroilandgas-producingstateslevyawidelyvaryingrangeoftaxes,includingvariouslevelsofpersonalincomeandsalestaxes.Forexample,thethreemajorproducingstatesofAlaska,Texas,andWyominglevyno
Source:OklahomaTaxCommission,EnergyInformationAdministration,andRegionTrackcalculations.Notes:AdvaloremtaxpaymentsinFY2017,FY2018,andFY2019assume2%annualgrowth.SeverancetaxreceiptsinFY2018andFY2019arebasedonestimatesbytheOklahomaTaxCommission.Valueofcrudeoilandnaturaliscalcluatedasthetotalmarketvalueofcrudeoilandnaturalgasproduction.Theeffectiverateisthecalculatedasthesumoftheeffectiveseverancetaxrateandeffectiveadvaloremtaxrateineachperiod.
7.7%
4.0% 3.8% 3.8% 4.2% 4.0%
5.3% 5.7%
0%
1%
2%
3%
4%
5%
6%
7%
8%
9%
2012 2013 2014 2015 2016 2017 f2018 f2019
Severance AdValorem
Page|17 RegionTrack,Inc.
OklahomaOilandGasIndustryTaxation
personalincometax.Householdearningsinthesestatesaccruetowageandsalaryworkers,self-employedproprietors,royaltyowners,andothersintheoilandgassector,buttheseearningsdonotcontributetototalstatetaxrevenuethroughpersonalincometaxpayments.InOklahoma,personalincometaxeshavecomprisedalmostone-thirdoftotalstatetaxrevenuethepasttwodecades.Evenamongenergystatesthatdolevyanincometax,taxratescandiffergreatly.
Notallstatescollectsalestaxeseither,withrateshighlyvariableaswell.AlaskaandMontana,twotraditionallyhighseverancetaxstates,haveonlysmalllocalsalestaxes.Infact,Alaskahaslongreliedpredominatelyonproductiontaxesfromoilandgastofundstategovernmentandistheonlystatethatdoesnotcollectstatesalestaxorlevyanindividualincometaxonpersonalincome.
Reportsproducedbyotherstategovernmentsrecognizethebroaderinfluenceoftheoilandgasindustryonstatewidetaxation.Forexample,Coloradoexaminestheeffectiverateforacombinationofproductiontaxes,propertytaxes,corporateincometaxes,andsalestaxesgeneratedbyfirmsintheoilandgasindustry(Carey,2014).Whilenotincludingpersonalincometaxes,thisapproachprovidesamuchbettermeasureofthe‘corporate’taxcontributionoftheindustrythansimplyusingseveranceandadvaloremtaxes.NewMexicomeasuresstateandlocaltaxrevenuefromproduction,royaltiesandbonuses,grossreceiptsonpurchases,payroll,income,andmanyothertaxes(AnklamandGraeser,2015andClifford,2011).12WhiletheapproachusedinNewMexicoprovidesanall-encompassingviewofoilandgastaxation,limiteddataavailabilitymakesthisexercisecost-prohibitiveacrossmultipleproducingstates.DetailedtaxincidencestudiesthatprovidereliableestimatesoftaxpaymentsbyindustryaresimplynotavailableinOklahomaandmostotherstates.
Webroadenthewidelyusedapproachoffocusingsolelyonseveranceandadvaloremtaxbyexpandingtheeffectivetaxrateanalysistobothpersonalincomeandsalestaxpayments.ThisapproachcapturesthetwolargesttaxsourcesinOklahomaandaccountsforkeydifferenceswithotherproducingstates(e.g.leading-producerTexashasnopersonalincometax).
Whilenotacomprehensiveassessmentofthetotaltaxobligationoftheindustry,thisapproachusesaconsistentmethodologyacrosstheproducingstatestoprovideestimatesthataremuchmorereflectiveofthetruetaxcontributionoftheindustry.ItalsodemonstratesthenecessityofusingabroaderapproachwhenevaluatingthetaxburdenoftheoilandgasindustryinastatelikeOklahomathatleviesrelativelylargepersonalincomeandsalestaxes.
PersonalIncomeTaxesandOilandGasEarnings.Theincometaxcontributionoftheoiland
gasindustryinOklahomaistracedtothesignificantwagespaidtothestate’soilandgasworkersandearningsofself-employedproprietors.Oklahomaisoneofonlyahandfulofproducingstateswithbothaverylargewhite-collaroilandgaslaborforceandsignificantfieldemployment,includingbothproductionandexploration.
Measuredbyaverageannualhouseholdearningsderiveddirectlyfromtheoilandgassector13inthe2015to2016period(forconsistencywiththeFY2016taxyear),Texas($71.4billion),Colorado($10.26
Page|18 RegionTrack,Inc.
OklahomaOilandGasIndustryTaxation
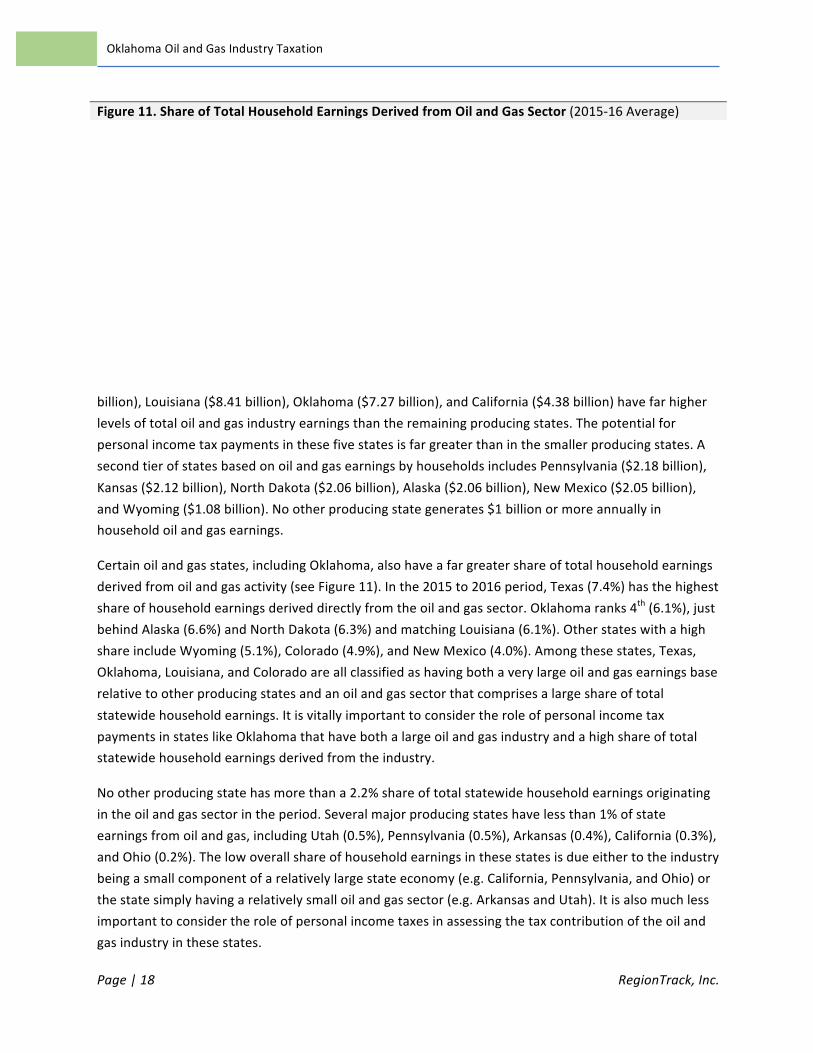
billion),Louisiana($8.41billion),Oklahoma($7.27billion),andCalifornia($4.38billion)havefarhigherlevelsoftotaloilandgasindustryearningsthantheremainingproducingstates.Thepotentialforpersonalincometaxpaymentsinthesefivestatesisfargreaterthaninthesmallerproducingstates.AsecondtierofstatesbasedonoilandgasearningsbyhouseholdsincludesPennsylvania($2.18billion),Kansas($2.12billion),NorthDakota($2.06billion),Alaska($2.06billion),NewMexico($2.05billion),andWyoming($1.08billion).Nootherproducingstategenerates$1billionormoreannuallyinhouseholdoilandgasearnings.
Certainoilandgasstates,includingOklahoma,alsohaveafargreatershareoftotalhouseholdearningsderivedfromoilandgasactivity(seeFigure11).Inthe2015to2016period,Texas(7.4%)hasthehighestshareofhouseholdearningsderiveddirectlyfromtheoilandgassector.Oklahomaranks4th(6.1%),justbehindAlaska(6.6%)andNorthDakota(6.3%)andmatchingLouisiana(6.1%).OtherstateswithahighshareincludeWyoming(5.1%),Colorado(4.9%),andNewMexico(4.0%).Amongthesestates,Texas,Oklahoma,Louisiana,andColoradoareallclassifiedashavingbothaverylargeoilandgasearningsbaserelativetootherproducingstatesandanoilandgassectorthatcomprisesalargeshareoftotalstatewidehouseholdearnings.ItisvitallyimportanttoconsidertheroleofpersonalincometaxpaymentsinstateslikeOklahomathathavebothalargeoilandgasindustryandahighshareoftotalstatewidehouseholdearningsderivedfromtheindustry.
Nootherproducingstatehasmorethana2.2%shareoftotalstatewidehouseholdearningsoriginatingintheoilandgassectorintheperiod.Severalmajorproducingstateshavelessthan1%ofstateearningsfromoilandgas,includingUtah(0.5%),Pennsylvania(0.5%),Arkansas(0.4%),California(0.3%),andOhio(0.2%).Thelowoverallshareofhouseholdearningsinthesestatesisdueeithertotheindustrybeingasmallcomponentofarelativelylargestateeconomy(e.g.California,Pennsylvania,andOhio)orthestatesimplyhavingarelativelysmalloilandgassector(e.g.ArkansasandUtah).Itisalsomuchlessimportanttoconsidertheroleofpersonalincometaxesinassessingthetaxcontributionoftheoilandgasindustryinthesestates.
Figure11.ShareofTotalHouseholdEarningsDerivedfromOilandGasSector(2015-16Average)

Page|19 RegionTrack,Inc.
OklahomaOilandGasIndustryTaxation
Whiletheamountofoilandgasearningsinfluencespersonalincometaxrevenueinmanyproducingstates,ithasnoeffectinstateswithnoincometax.TheseincludeTexas,thenation’slargestproducer,aswellasmajorproducersAlaskaandWyoming.Evenamongtheproducingstatesthatlevyincometaxes,therearelargedifferencesinaverageincometaxrates.Measuredusingtotalpersonalincometaxpaymentsasashareoftotalhouseholdearnings,Oklahomapaid2.62%oftotalhouseholdearningsinincometaxesversus3.06%nationallyand3.02%inthesixteenmajorproducingstatesinFY2016.Amongtheproducingstates,averageincometaxratesrangefrom0%inTexas,Wyoming,andAlaskato5.1%inCalifornia(seeFigure12).
Figure12providescomparativeestimatesofthepersonalincometaxcontributionofoilandgasactivityinOklahomaandtheothermajorproducingstates.Theincometaxestimatesarederivedbymultiplyingthetotalhouseholdearningsofworkersandproprietorsintheoilandgassectorbytheaverageincometaxratewithineachstate.Theuseoftheaveragetaxratewillsubstantiallyunderstatetheamountofoilandgas-relatedincometaxespaidinOklahomaandmostproducingstatesgiventhehighaverageearningsintheoilandgasindustryandprogressivetaxratesinmoststates.Nonetheless,itprovidesaconsistentmeasureforcomparingtaxrelativetaxburdensacrossstates.Earningsintheoilandgassectorareaveragedacrossthe2015to2016periodforconsistencywithFY2016taxdata.
Becauseoilandgasactivityisacomponentofthebroaderminingsector,weremovenon-oilandgasminingactivity.TheshareofearningsineachstatederivedfromoilandgasactivityiscalculatedasthesumofNAICS201(Oilandgasextraction)plusashareofNAICS203(Supportactivitiesformining).TheshareofNAICS203includedisdeterminedbytheratioofNAICS201/(NAICS201+NAICS202(Mining–exceptoilandgas)).
Notes:HouseholdearningsisdefinedbyBureauofEconomicAnalysisasemployeecompensationplusproprietors’income.Proprietor’sincomeconsistsprimarilyoftheincomeofsoleproprietorsandpartnerships.TheshareofhouseholdearningsineachstatederivedfromoilandgasactivityiscalculatedasthesumofNAICS201(Oilandgasextraction)plusashareofNAICS203(Supportactivitiesformining).TheshareofNAICS203includedisdeterminedbytheratioofNAICS201/(NAICS201+NAICS202(Mining–exceptoilandgas)).
Figure12.PersonalIncomeTaxContributionofOil&GasSector(FY2016)
7.4%
6.6% 6.3% 6.1% 6.1%
5.1% 4.9%
4.0%
2.2% 2.1% 1.6%
0.5% 0.5% 0.4% 0.3% 0.2%
0%
1%
2%
3%
4%
5%
6%
7%
8%
TX AK ND OK LA WY CO NM MT KS WV UT PA AR CA OH

Page|20 RegionTrack,Inc.
OklahomaOilandGasIndustryTaxation
InOklahoma,estimatedpersonalincometaxpaymentsbyworkersandproprietorsintheoilandgassectoratthestateaveragetaxratetotal$190.7millioninFY2016.Thisisapproximately6.4%ofthe$3.0billionintotalpersonalincometaxpaymentsmadeinthestateinFY2016.Again,thisprovidesahighlyconservativeestimatebasedontheaverageincometaxrateinthestate,whichunderstatestheactualrateinthehigh-wageoilandgasindustry.
Colorado($316.7million)derivesconsiderablymorepersonalincometaxrevenuefromoilandgasthanOklahoma,dueprimarilytoahigheraverageincometaxrate.California($224.1million)slightlyexceedstheincometaxpaymentsinOklahoma,buthasafarlowerlevelofearningscombinedwithafarhighertaxrate.Louisianaalsoproducessignificantpersonalincometaxrevenueof$178.2million.
Amongtheremainingstates,noneproducesevenone-thirdtheincometaxrevenuereceivedinOklahomafromoilandgasactivity.InFY2016,Oklahomaproducedapproximately$150millionormoreinincometaxrevenuethanArkansas,Kansas,Montana,NorthDakota,NewMexico,Ohio,Pennsylvania,Texas,Utah,WestVirginia,andWyoming.Again,Texas,Alaska,andWyomingderivenopersonalincometaxrevenuefromtheactivityoftheoilandgasindustry.
State
Oil&GasSectorHouseholdEarnings1
(2015-16avg.)
FY2016AverageIncomeTaxRate2
Oil&Gas-RelatedIncomeTaxatAverageRate3
Oil&Gas-RelatedIncomeTaxat
OKRate(2.58%)4
FY2016Oil&GasProduction
Value
EffectiveIncomeTaxRate
Alaska $2,059,141,152 0.00% $0 $54,019,749 $6,704,000,405 0.00%Arkansas 312,181,427 3.73% 11,643,239 8,189,804 2,265,993,926 0.51%California 4,382,463,364 5.11% 224,129,405 114,970,054 7,804,566,938 2.87%Colorado 10,258,354,390 3.09% 316,683,019 269,118,863 8,085,748,405 3.92%Kansas 2,116,304,923 2.28% 48,205,166 55,519,390 2,095,423,520 2.30%Louisiana 8,412,495,955 2.12% 178,176,948 220,694,398 6,422,504,345 2.77%Montana 626,211,317 4.07% 25,459,759 16,428,101 991,287,508 2.57%NorthDakota 2,055,294,361 1.36% 28,008,974 53,918,832 15,546,573,903 0.18%NewMexico 2,048,685,420 2.69% 55,099,020 53,745,452 8,329,094,006 0.66%Ohio 749,459,851 2.30% 17,213,991 19,661,417 3,742,552,340 0.46%Oklahoma 7,269,059,179 2.62% 190,697,345 190,697,345 11,514,670,836 1.66%Pennsylvania 2,175,342,862 2.61% 56,863,547 57,068,198 11,819,866,993 0.48%Texas 71,388,693,090 0.00% 0 1,872,819,284 63,591,098,355 0.00%Utah 450,381,628 3.53% 15,890,641 11,815,364 1,996,888,030 0.80%WestVirginia 673,791,358 4.54% 30,604,998 17,676,321 3,177,522,760 0.96%Wyoming 1,083,658,766 0.00% 0 28,428,830 6,717,027,690 0.00% 16-States $116,061,519,042 3.02% $1,198,676,051 $3,044,771,400 $160,804,819,959 0.75%Source:BureauofEconomicAnalysis,CensusBureau,andRegionTrackcalculations.Notes:1HouseholdearningsisdefinedbyBureauofEconomicAnalysisasemployeecompensationplusproprietors’income.Earningsareaveragedinthe2015-2016periodforconsistencywiththeFY2016taxyear.Proprietor’sincomeconsistsprimarilyoftheincomeofsoleproprietorsandpartnerships.TheshareofhouseholdearningsineachstatederivedfromoilandgasactivityiscalculatedasthesumofNAICS201(Oilandgasextraction)plusashareofNAICS203(Supportactivitiesformining).TheshareofNAICS203includedisdeterminedbytheratioofNAICS201/(NAICS201+NAICS202(Mining–exceptoilandgas)).2Theaverageincometaxrateforeachstateiscalculatedastotalindividualincometaxpaymentsdividedbytotalhouseholdearnings.3Incometaxpaidbytheoilandgasindustryisestimatedasoilandgasearningstimestheaverageincometaxrateinthestate.4Oilandgasearningsineachstatemultipliedbythe2.62%averagerateinOklahoma.
Figure13.EffectiveIncomeTaxRateonOilandGasProduction(FY2016)

Page|21 RegionTrack,Inc.
OklahomaOilandGasIndustryTaxation
Togaugethesignificanceofoilandgas-relatedincometaxpaymentsinOklahomarelativetothestateswithnoincometax,potentialincometaxreceiptsarecalculatedinFigure12foreachstatebasedontheprevailing2.62%averageincometaxrateinOklahoma.Amongthestateswithnopersonalincometax,Texaswouldderive$1.87billioninpersonalincometaxrevenueatOklahoma’saveragerate.Alaskawouldraiseanadditional$54million,whileWyomingwouldcollect$28million.Californiawouldlose$110millioninincometaxduetoitshighaveragetaxrate.Louisianawouldgainmorethan$40millionbecauseofitsloweraverageincometaxrate.
EffectivePersonalIncomeTaxRates.Figure13illustratesthewidevariationineffectiveincometaxratesonoilandgasproductionacrossthesixteenproducingstates.TheeffectiverateiscalculatedasestimatedincometaxpaidonhouseholdearningsfromtheoilandgasindustrydividedbythetotalvalueofoilandgasproductioninFY2016.Acrossallsixteenstates,theeffectiveincometaxraterelativetoproductionis0.84%.Oklahomahasaneffectiveincometaxraterelativetoproductionof1.7%,6thhighestamongthesixteenstatesanddoubletheoverallaveragerate.Coloradohasthehighesteffectiverateat3.9%,morethandoubleOklahoma’srate.CaliforniaandLouisianahaveeffectiveratesjustbelow3%,whileKansasandMontanahaveeffectiveratesofapproximately2.5%.
Allotherstateshaveaneffectiveincometaxrateof1%orless,withAlaska,Texas,andWyominghavingzeropercenteffectiverates.Thegas-producingstatesofOhioandPennsylvaniabothhaveeffectiveincometaxratesofapproximately0.5%.LargeoilproducerNorthDakota(0.2%)hasthelowesteffectiveincometaxrateamongthestatesthathaveanincometaxinplace.
ParticularlynoteworthyisthatmanyofthestateswithacombinedseveranceandadvaloremeffectivetaxratehigherthanOklahoma’shaveverylowpersonalincometaxrates.TheseincludeNorthDakota,NewMexico,andWestVirginia,plusthethreeproducingstateswithnoincometax–Texas,Alaska,and
Notes:Incometaxiscalculatedasaveragehouseholdearningsintheoilandgassectorinthe2015-2016periodtimestheaverageincometaxrateinthestateinFY2016.Theeffectiveincometaxrateisincometaxrelatedtooilandgasactivitydividedbytotalvalueofoilandgasproduction.HouseholdearningsisdefinedbyBureauofEconomicAnalysisasemployeecompensationplusproprietors’income.Proprietor’sincomeconsistsprimarilyoftheincomeofsoleproprietorsandpartnerships.TheshareofhouseholdearningsineachstatederivedfromoilandgasactivityiscalculatedasthesumofNAICS201(Oilandgasextraction)plusashareofNAICS203(Supportactivitiesformining).TheshareofNAICS203includedisdeterminedbytheratioofNAICS201/(NAICS201+NAICS202(Mining–exceptoilandgas)).
3.9%
2.9% 2.8% 2.6%
2.3%
1.7%
1.0% 0.8% 0.7% 0.5% 0.5% 0.5%
0.2% 0.0% 0.0% 0.0%
0.84%
0.0%
0.5%
1.0%
1.5%
2.0%
2.5%
3.0%
3.5%
4.0%
4.5%
CO CA LA MT KS OK WV UT NM AR PA OH ND AK TX WY 16-States

Page|22 RegionTrack,Inc.
OklahomaOilandGasIndustryTaxation
Wyoming.This,again,underscorestheimportanceofincludingpersonalincometaxeswhenusingthesestatestoevaluatetheoilandgas-relatedtaxcontributioninOklahoma.
OilandGas-RelatedSalesTax.Firmsintheoilandgasindustryalsopaysignificantamountsof
salestax,withmanystateandlocalgovernmentshighlydependentuponthesetaxestofundgovernmentactivities.14SalestaxesareanespeciallycriticalsourceofrevenueatthelocallevelinOklahoma,giventhatadvaloremtaxrevenuecannotbeusedtofundgeneralmunicipalexpenditures.
Thedifferentialinbothsalestaxratesandthepropensitytotaxeconomicactivityacrossthestatesresultsingreatvariationinthesalestaxcontributionofoilandgasactivityacrosstheproducingstates.Salestaxratesvaryconsiderablyaswell.BasedontheongoingannualsurveyproducedbytheTaxFoundation,Oklahomahasthe6thhighestaveragestateandlocalsalestaxrateamongallstatesat8.86%in2017,andthe3rdhighestrateamongenergy-producingstates.15
Louisiana(9.98%)andArkansas(9.30%)havethehighestaverageratesamongthemajorenergy-producingstates,aswellasthehighestand3rdhighestrates,respectively,acrossallfiftystates.Otherproducingstateswithratesabove8%includeKansas(8.62%),California(8.25%),andTexas(8.19%).However,otherproducingstateshavemuchlowerrates.Theaveragesalestaxrateisonly7.55%inNewMexico,7.50%inColorado,7.14%inOhio,6.78%inNorthDakota,6.76%inUtah,6.34%inPennsylvania,6.29%inWestVirginia,and5.40%inWyoming.Alaska(1.76%)hasthelowestrate,whileMontanahasnogeneralsalestax.
Incomparingtheoveralleffectivetaxburdenacrosstheproducingstates,manystatesaremuchlessreliantthanOklahomaonsalestaxes.Ofthefivestateswiththehighesteffectiveseveranceandadvaloremtaxrates(NewMexico,Wyoming,Montana,Louisiana,andNorthDakota),fourhavesalestaxratesthatarebetween1.3%and3.3%lowerthaninOklahoma.Leviedacrossthebroadretailbaseofastate,thesesalestaxratedifferentialscanproducesignificantlydifferentamountsofrevenue.
Differencesintheoveralllevelofoilandgasactivityacrossthestatesalsoproducesmuchdifferentsalestaxcontributions.Stateswithlargeroilandgasindustries,ingeneral,tendtogeneraterelativelymoresalestaxrevenuefromoilandgasactivitythanstateswithasmallerindustry.Stateswithmoredrillingactivityalsotendtoproducesignificantlymoresalestaxrevenue.Oklahomahasbothalargeoilandgasindustryandhighlevelsofdrillingactivity.
Collectingcomparablestate-leveldataonsalestaxpaidbytheoilandgasindustryfromstatetaxagenciesisgenerallynotpossible.Differencesintaxlaw,reportingstandards,paymentprocesses,collectingandremittingparties,andtreatmentofout-of-statepurchasesmakesassemblingcomparativesalestaxdatarelatedtooilandgasactivityvirtuallyimpossibleinmoststates.Themostsignificanthurdleisthatitisnotpossibleinmoststatestodifferentiatebetweensalestaxpaymentsremittedbytheoilandgasindustryontheirowntaxablesalesversustaxespaidinconjunctionwiththeirowntaxablepurchases.Asaresult,thesalestaxpayableonmanyofthepurchasesbytheoilandgasindustryareremittedbyfirmsinotherindustriesandcannotbetracked.Thetaxcomparisoninthis

Page|23 RegionTrack,Inc.
OklahomaOilandGasIndustryTaxation
reportismostconcernedwithestimatesofsalestaxespaiddirectlybyoilandgasfirms,notnecessarilytheamountremittedbytheoilandgasindustrybasedonthepurchasesofothers.Thisisacommonmisuseofsalestaxdatareportedattheindustrylevel.Comparativeoverallmeasuresofsalestaxburdenarefurthercomplicatedbydifferencesintheshareofthetaxthatispaidbyresidentsversusnonresidents,particularlybytourists.
Comparativestate-levelestimatesofthesalestaxcontributionoftheoilandgasindustryareformedbyapportioningtotalstateandlocalsalestaxreceiptstoeachindustrybasedonitsaveragecontributiontostateGDPinthe2015to2016period(forconsistencywithFY2016taxdata).Thisfollowstheapproachcommonlyusedtoapportionstateandlocaltaxesattheindustrylevelinwidely-usedeconomicimpactmodels.16ThisisalsoconsistentwiththebasicapproachusedinColorado’soverallassessmentofoilandgasindustrytaxburden(Carey,2014).Theunderlyingassumptionisthatsalestaxpaymentsrelatedtotheoilandgasindustryareproportionaltotheoverallsizeoftheindustry.Hence,theamountofpurchasesmadebytheindustry,incomepaidtoworkers,andearningsofproprietorswhooperateoilandgas-relatedbusinesseswouldbecloselyrelatedtosalestaxespaid.Thisapproachisappliedconsistentlytoeachstatewherebytheoilandgasindustry’sshareoftotalstateeconomicactivitydeterminestheoverallshareofstatesalestaxpaymentsderivedfromtheindustry.17Italsoaccountsforoveralldifferencesinthesizeofthetaxablesalesbaseacrosstheproducingstates.TheoverallestimatesarenothighlysensitivetothechoiceofGDPtoapportionthedata.Therelativesizesofthecross-stateestimatesareessentiallyunchangedwhenusingothermeasuresofeconomicactivitysuchastotalhouseholdearningsshare,wageandsalaryincomeshare,ortotalcompensationshareinplaceofGDP.
AllsalestaxdatausedintheanalysisarederivedfromtheCensusBureau’sStateandLocalGovernmentFinancedatabase.18Thedatabaseprovidesastandardizedmeasureoftaxcollectionsbytypeoftaxatboththestateandlocallevel.TotalsalestaxesatthestateandlocallevelarebasedonFY2016dataatthestatelevelandFY2015dataatthelocallevel.Thesemeasuresreflectthemostrecentlyavailabledataonaconsistentbasisacrossthestates.Onlygeneralsalesandgrossreceiptsareincluded.Targetedsalestaxessuchasalcohol,parimutuel,tobacco,andmotorfueltaxesareexcluded.
Becauseoilandgasactivityisacomponentofthebroaderminingsector,weremovenon-oilandgas-relatedminingactivityfromGDPusingthesameapproachusedwithoilandgas-relatedhouseholdearningsinthepriorsectionofthereport.TheshareofGDPineachstatederivedfromoilandgasactivityiscalculatedasthesumofNAICS201(Oilandgasextraction)plusashareofNAICS203(Supportactivitiesformining).TheshareofNAICS203includedisdeterminedbytheratioofNAICS201/(NAICS201+NAICS202(Mining–exceptoilandgas)).

Page|24 RegionTrack,Inc.
OklahomaOilandGasIndustryTaxation
SalesTaxPayments.Figure13detailsestimatedsalestaxpaymentsforthesixteenproducingstatesinthesample.Texasproducesthelargestamountat$3.14billion.Oklahomaranks2ndwith$536.4millioninestimatedstateandlocalsalestaxpayments(outofatotalof$4.56billionstatewide)inFY2016.Thestate’shighshareofGDPfromoilandgasactivityisreflectedintheestimatedsalestaxtotal.Oklahoma’soilandgassectorcomprisesthesecondlargestshareoftotalstateGDP(11.8%)amongtheproducingstates,trailingonlyAlaska(13.9%),andisconsiderablyhigherthanWyoming(9.7%),NorthDakota(8.9%),Texas(7.9%),andNewMexico(6.8%).
Otherstatesproducingmorethan$200millioninestimatedsalestaxfromoilandgasactivityincludeLouisiana($300.0million),NewMexico($208.6million),andColorado($210.7million).
Figure13.Oil&GasSectorSalesTaxContributionandEffectiveRate(FY2016)
State
Oil&GasShareofGDP(2015-16avg.)1
FY2016TotalStateandLocalSalesTax2
FY2016Oil&Gas-RelatedSalesTax
FY2016Oil&GasProduction
ValueEffectiveRate
Alaska 13.9% $231,195,000 $32,042,117 $6,704,000,405 0.5%Arkansas 1.4% 4,398,654,000 61,395,130 2,265,993,926 2.7%California 0.3% 50,668,814,000 171,938,465 7,804,566,938 2.2%Colorado 3.2% 6,614,809,000 210,727,019 8,085,748,405 2.6%Kansas 0.7% 4,208,361,000 30,226,613 2,095,423,520 1.4%Louisiana 4.1% 7,363,508,000 300,005,145 6,422,504,345 4.7%Montana 1.1% 0 0 991,287,508 0.0%NorthDakota 8.9% 1,239,506,000 110,340,583 15,546,573,903 0.7%NewMexico 6.8% 3,068,551,000 208,579,820 8,329,094,006 2.5%Ohio 1.1% 14,486,920,000 162,944,461 3,742,552,340 4.4%Oklahoma 11.8% 4,564,158,000 536,442,228 11,514,670,836 4.7%Pennsylvania 1.6% 11,079,520,000 182,638,361 11,819,866,993 1.5%Texas 7.9% 39,534,846,000 3,139,486,542 63,591,098,355 4.9%Utah 0.7% 2,837,403,000 19,381,583 1,996,888,030 1.0%WestVirginia 4.3% 1,302,750,000 56,616,453 3,177,522,760 1.8%Wyoming 9.7% 879,911,000 84,967,844 6,717,027,690 1.3%
16-States 3.2% $152,478,906,000 $5,307,732,364 $160,804,819,959 3.3%Source:BureauofEconomicAnalysis,CensusBureau,andRegionTrackcalculations.Notes:Oilandgas-relatedsalestaxiscalculatedbymultiplyingtheshareofGDPintheoilandgassectorbytotalstateandlocalsalestaxes.1TheshareofGDPineachstatederivedfromoilandgasactivityiscalculatedasthesumofNAICS201(Oilandgasextraction)plusashareofNAICS203(Supportactivitiesformining).TheshareofNAICS203includedisdeterminedbytheratioofNAICS201/(NAICS201+NAICS202(Mining–exceptoilandgas)).GDPisaveragedinthe2015-16periodforconsistencywithFY2016taxdata.2Includesbothstateandlocalsalesandusetax,aswellasgeneralgrossreceipts.BasedonthedefinitionintheCensusStateandLocalGovernmentFinancedatabase.StatesalestaxisforFY2016,thelatestyearavailable.LocalsalestaxisforFY2015,thelatestyearavailable.
Oklahoma’sestimatedtotalsalestaxcontributionissecondhighestamongthesixteenstates,behindonlythe$3.14billionestimateforTexas.Louisiana($300.0million),Colorado($210.7million),andNewMexico($208.6million)aretheonlyotherstatesestimatedtocollectmorethan$200million.NorthDakotaisestimatedtogenerateonly$110.3million,roughlyone-fifththetotalinOklahoma,whichreflectsbothasmalleroilandgasindustryandloweraveragesalestaxrates.
Figure14.EffectiveSalesTaxRateonOilandGasProduction(FY2016)

Page|25 RegionTrack,Inc.
OklahomaOilandGasIndustryTaxation
Severalofthekeyproducingstatesgeneratemuchlessestimatedsalestaxrevenue.TheseincludeArkansas($61.4million),WestVirginia($56.6million),Alaska($32.0million),Kansas($30.2million),andUtah($19.4million).Montanaproducednone.Mostofthelowsalestax-producingstateshaverelativelysmalllevelsofoilandgasemploymentandlowaveragestateandlocalsalestaxrates.
EffectiveSalesTaxRates.Figure14ranksthesixteenproducingstatesbyeffectivesalestaxratesonoilandgasproductionintheperiod.Theeffectiverateiscalculatedasestimatedoilandgas-relatedsalestaxdividedbytotalvalueofoilandgasproductioninFY2016.
TheeffectivesalestaxratesvaryfromalowofzeroinMontanatoahighof4.9%inTexas.Oklahoma’seffectivesalestaxrateof4.7%isjustbelowTexas,3rdhighestamongthe16states,and1.4%abovetheaveragerateof3.3%acrossall16states.Louisiana(4.7%)andOhio(4.4%)aretheonlyotherstateswithaneffectivesalestaxrateabove2.7%.
Fourstates–Arkansas,Colorado,NewMexico,andCalifornia–formamiddletierwitheffectivesalestaxratesbetween2.2%and2.7%.Fiveadditionalstates–WestVirginia,Pennsylvania,Kansas,Wyoming,andUtah–haveaneffectiveratebetween1%and2%.Stateswithaneffectivesalestaxratebelow1%includeNorthDakota(0.5%),Alaska(0.3%),andMontana(0.0%).Alaska,Montana,NorthDakota,andWyomingarealltraditionallyviewedashightaxstates,yettheyreceiverelativelylittlecontributionfromoilandgasactivityintheformofsalestaxes.
OverallEffectiveTaxRate.Figure15summarizestotaltaxpaymentsacrossallfourtaxcategories
examined-severance,advalorem,personalincome,andsales–alongwiththecombinedeffectivetaxrateonproductionforthesixteenproducingstates.Oklahoma’soilandgasindustrycontributedanestimated$1.22billioninFY2016acrossthefourtaxesusingthemethodologydescribedineachsection
Notes:Includesbothstateandlocalsalesandusetax,aswellasgrossreceiptstax.BasedonthedefinitionusedintheCensusBureauStateandLocalGovernmentFinanceDatabase.StatesalestaxisforFY2016,thelatestyearavailable.LocalsalestaxisforFY2015,thelatestyearavailable.Theeffectiverateisstateandlocalsalestaxfromoilandgasactivitydividedbytotalvalueofoilandgasproduction.HouseholdearningsisdefinedbyBureauofEconomicAnalysisasemployeecompensationplusproprietors’income.Proprietor’sincomeconsistsprimarilyoftheincomeofsoleproprietorsandpartnerships.TheshareofhouseholdearningsineachstatederivedfromoilandgasactivityiscalculatedasthesumofNAICS201(Oilandgasextraction)plusashareofNAICS203(Supportactivitiesformining).TheshareofNAICS203includedisdeterminedbytheratioofNAICS201/(NAICS201+NAICS202(Mining–exceptoilandgas)).
4.9% 4.7% 4.7%
4.4%
2.7% 2.6% 2.5% 2.2%
1.8% 1.5% 1.4% 1.3%
1.0% 0.7% 0.5%
0.0%
3.3%
0%
1%
2%
3%
4%
5%
6%
TX LA OK OH AR CO NM CA WV PA KS WY UT ND AK MT 16-States

Page|26 RegionTrack,Inc.
OklahomaOilandGasIndustryTaxation
ofthereport.Paymentsinclude$536millioninsalestax,$331millioninseverancetax,$191millioninpersonalincometax,and$158millioninadvaloremtaxes.
Oklahomahasthethirdlargesttotaltaxcontribution,trailingonlyTexas($7.65billion)andNorthDakota($1.62billion).Threeotherstatesproducedmorethan$1billionacrossthefourtaxesincludingNewMexico($1.15billion),Louisiana($1.12billion),andColorado($1.04billion).
Effectivetaxratesonproductionacrossthefourtaxesrangefromalowof3.5%inPennsylvaniatoahighof17.4%inLouisiana.Louisiana’srateismorethan3.5%aboveNewMexico,thestatewiththesecondhighestrate.Oklahoma’seffectiverateof10.6%ranks8thamongthesixteenstates,slightlybelowtheoverallaveragerateof10.8%.Thestate’soverallrateisjustbelowWyoming(11.4%)andCalifornia(11.3%)andjustabovetherateinNorthDakota(10.4%).BothWyomingandNorthDakotaaretraditionallyviewedashightaxstates.TheoverallrateinTexas(12.0%)isfifthhighestand1.4%higherthaninOklahoma.
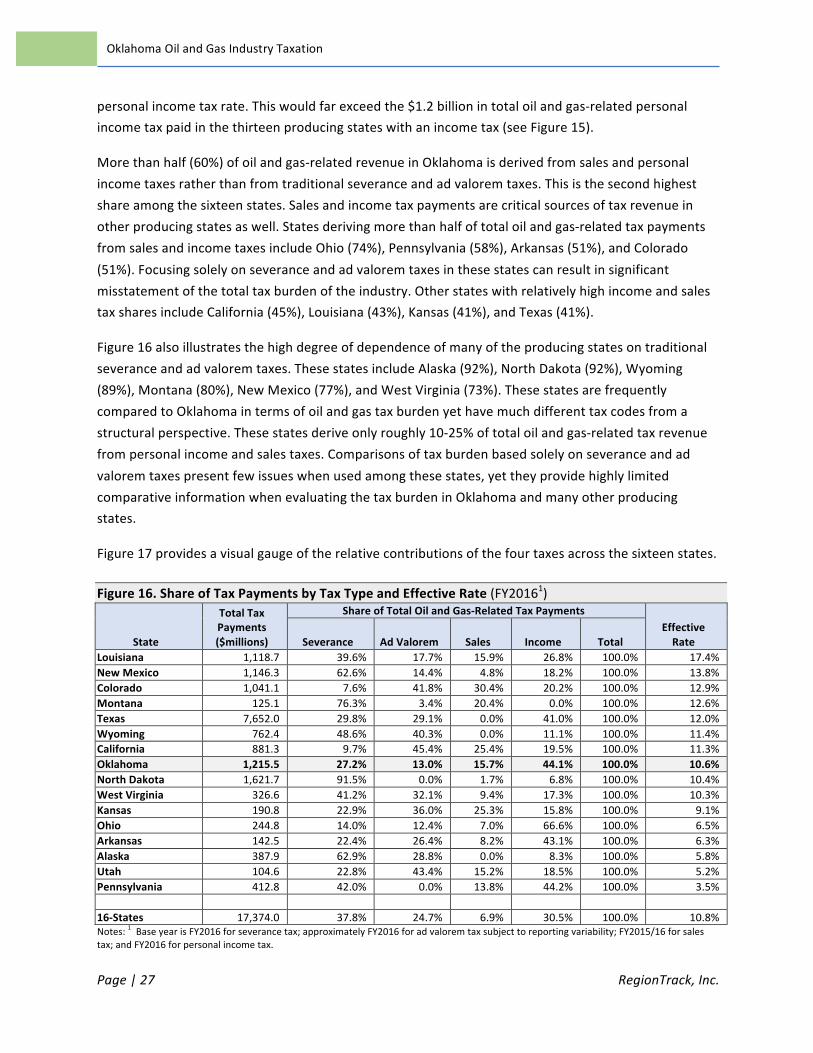
Figure16illustratestherelativecontributionshareofeachtaxcategoryacrossthestates.Oklahoma’staxburdenisdividedinto44%salestax,27%severancetax,16%incometax,and13%advaloremtax.
Thetaxsharesacrossthesixteenstatesarerelativelybalancedinthreeofthefourcategories,witha38%severancetaxshare,a30%salestaxshare,anda25%advaloremtaxshare,alongwithasmaller7%shareforincometax.Thesmallincometaxshareacrossthestatesreflectsinlargepartthelackofapersonalincometaxindominant-producerTexas.Again,anadditional$1.87billioninpersonalincometaxonoilandgas-relatedhouseholdearningswouldbecollectedinTexasatOklahoma’saverage
Figure15.OilandGas-RelatedTaxPaymentsandCombinedEffectiveTaxRate
State
OilandGas-RelatedTaxes($millions) 2016Oil&GasProductionValue($mil.)
CombinedEffectiveRateSeverance
AdValorem
PersonalIncome Sales Total
Louisiana $442.9 $197.6 $178.2 $300.0 $1,118.7 $6,422.5 17.4%NewMexico 717.6 165.0 55.1 208.6 1,146.3 8,329.1 13.8%Colorado 79.0 434.7 316.7 210.7 1,041.1 8,085.7 12.9%Montana 95.4 4.2 25.5 0.0 125.1 991.3 12.6%Texas 2,282.7 2,229.8 0.0 3,139.5 7,652.0 63,591.1 12.0%Wyoming 370.4 307.0 0.0 85.0 762.4 6,717.0 11.4%California 85.2 400.0 224.1 171.9 881.3 7,804.6 11.3%Oklahoma 330.7 157.6 190.7 536.4 1,215.5 11,514.7 10.6%NorthDakota 1,483.3 0.0 28.0 110.3 1,621.7 15,546.6 10.4%WestVirginia 134.4 105.0 30.6 56.6 326.6 3,177.5 10.3%Kansas 43.8 68.6 48.2 30.2 190.8 2,095.4 9.1%Ohio 34.3 30.3 17.2 162.9 244.8 3,742.6 6.5%Arkansas 31.9 37.6 11.6 61.4 142.5 2,266.0 6.3%Alaska 244.1 111.7 0.0 32.0 387.9 6,704.0 5.8%Utah $23.9 $45.4 $15.9 $19.4 $104.6 $1,996.9 5.2%Pennsylvania 173.3 0.0 56.9 182.6 412.8 11,819.9 3.5%
16-States $6,572.9 $4,294.7 $1,198.7 $5,307.7 $17,374.0 $160,804.8 10.8%Notes:BaseyearisFY2016forseverancetax;approximatelyFY2016foradvaloremtaxsubjecttoreportingvariability;FY2015/16forsalestax;andFY2016forpersonalincometax.
Page|27 RegionTrack,Inc.
OklahomaOilandGasIndustryTaxation
personalincometaxrate.Thiswouldfarexceedthe$1.2billionintotaloilandgas-relatedpersonalincometaxpaidinthethirteenproducingstateswithanincometax(seeFigure15).
Morethanhalf(60%)ofoilandgas-relatedrevenueinOklahomaisderivedfromsalesandpersonalincometaxesratherthanfromtraditionalseveranceandadvaloremtaxes.Thisisthesecondhighestshareamongthesixteenstates.Salesandincometaxpaymentsarecriticalsourcesoftaxrevenueinotherproducingstatesaswell.Statesderivingmorethanhalfoftotaloilandgas-relatedtaxpaymentsfromsalesandincometaxesincludeOhio(74%),Pennsylvania(58%),Arkansas(51%),andColorado(51%).Focusingsolelyonseveranceandadvaloremtaxesinthesestatescanresultinsignificantmisstatementofthetotaltaxburdenoftheindustry.OtherstateswithrelativelyhighincomeandsalestaxsharesincludeCalifornia(45%),Louisiana(43%),Kansas(41%),andTexas(41%).
Figure16alsoillustratesthehighdegreeofdependenceofmanyoftheproducingstatesontraditionalseveranceandadvaloremtaxes.ThesestatesincludeAlaska(92%),NorthDakota(92%),Wyoming(89%),Montana(80%),NewMexico(77%),andWestVirginia(73%).ThesestatesarefrequentlycomparedtoOklahomaintermsofoilandgastaxburdenyethavemuchdifferenttaxcodesfromastructuralperspective.Thesestatesderiveonlyroughly10-25%oftotaloilandgas-relatedtaxrevenuefrompersonalincomeandsalestaxes.Comparisonsoftaxburdenbasedsolelyonseveranceandadvaloremtaxespresentfewissueswhenusedamongthesestates,yettheyprovidehighlylimitedcomparativeinformationwhenevaluatingthetaxburdeninOklahomaandmanyotherproducingstates.
Figure17providesavisualgaugeoftherelativecontributionsofthefourtaxesacrossthesixteenstates.
Figure16.ShareofTaxPaymentsbyTaxTypeandEffectiveRate(FY20161)
State
TotalTaxPayments($millions)
ShareofTotalOilandGas-RelatedTaxPaymentsEffectiveRateSeverance AdValorem Sales Income Total
Louisiana 1,118.7 39.6% 17.7% 15.9% 26.8% 100.0% 17.4%NewMexico 1,146.3 62.6% 14.4% 4.8% 18.2% 100.0% 13.8%Colorado 1,041.1 7.6% 41.8% 30.4% 20.2% 100.0% 12.9%Montana 125.1 76.3% 3.4% 20.4% 0.0% 100.0% 12.6%Texas 7,652.0 29.8% 29.1% 0.0% 41.0% 100.0% 12.0%Wyoming 762.4 48.6% 40.3% 0.0% 11.1% 100.0% 11.4%California 881.3 9.7% 45.4% 25.4% 19.5% 100.0% 11.3%Oklahoma 1,215.5 27.2% 13.0% 15.7% 44.1% 100.0% 10.6%NorthDakota 1,621.7 91.5% 0.0% 1.7% 6.8% 100.0% 10.4%WestVirginia 326.6 41.2% 32.1% 9.4% 17.3% 100.0% 10.3%Kansas 190.8 22.9% 36.0% 25.3% 15.8% 100.0% 9.1%Ohio 244.8 14.0% 12.4% 7.0% 66.6% 100.0% 6.5%Arkansas 142.5 22.4% 26.4% 8.2% 43.1% 100.0% 6.3%Alaska 387.9 62.9% 28.8% 0.0% 8.3% 100.0% 5.8%Utah 104.6 22.8% 43.4% 15.2% 18.5% 100.0% 5.2%Pennsylvania 412.8 42.0% 0.0% 13.8% 44.2% 100.0% 3.5%
16-States 17,374.0 37.8% 24.7% 6.9% 30.5% 100.0% 10.8%Notes:1BaseyearisFY2016forseverancetax;approximatelyFY2016foradvaloremtaxsubjecttoreportingvariability;FY2015/16forsalestax;andFY2016forpersonalincometax.

Page|28 RegionTrack,Inc.
OklahomaOilandGasIndustryTaxation
Again,Oklahomaranks8thamongthestatesandfallsjustabovethemidpointofthestatesbetweenWyomingandNorthDakota,twostateswithamuchdifferenttaxstructure.Oklahomahasamorebalanceduseofallfourtaxes,whileNorthDakotaoilandgas-relatedtaxrevenuecomesalmostentirelyfromseverancetaxrevenue.Wyomingderivesalmostallitsrevenuefromacombinationofseveranceandadvaloremtaxes.
Manyofthestateswiththehighestoveralleffectiveratestendtolevyverylargeseverancetaxesrelativetotheothertaxcategories.Threeofthefourstateswiththehighestoveralleffectiverate–Louisiana,NewMexico,andMontana–haveamongthehighesteffectiveseverancetaxrates.
LikeOklahoma,otherstateshavearelativelybalancedshareofallfourtaxes,withatleasta1%effectiverateforeachtaxcategory.ThesestatesincludeLouisiana,Colorado,WestVirginia,California,andKansas.
BycomponentoftheoveralleffectiverateinFigure17,the10.8%averageacrossthesixteenstatesiscomprisedofa4.1%severancetaxrate,a3.3%salestaxrate,a2.7%advaloremtaxrate,anda0.7%personalincometaxrate.Relativetothegroupofsixteenstates,Oklahomahasalowerthanaverageeffectiverateforseveranceandadvaloremtaxesandahigherthanaverageeffectiverateforsalesandincometaxes.
Figure17.EffectiveSeverance,AdValorem,Sales,andIncomeTaxRatebyState(FY2016)
6.9% 8.6%
1.0%
9.6%
3.6% 5.5%
1.1% 2.9%
9.5%
4.2% 2.1% 0.9% 1.4%
3.6% 1.2% 1.5%
4.1%
3.1% 2.0%
5.4%
0.4%
3.5%
4.6%
5.1% 1.4%
0.0%
3.3%
3.3%
0.8% 1.7%
1.7%
2.3% 0.0%
2.7%
2.8% 0.7%
3.9%
2.6%
0.0%
0.0%
2.9%
1.7%
0.2%
1.0% 2.3%
0.5% 0.5%
0.0% 0.8%
0.5%
0.7%
4.7%
2.5% 2.6%
0.0%
4.9% 1.3% 2.2%
4.7%
0.7% 1.8%
1.4%
4.4% 2.7%
0.5% 1.0%
1.5%
3.3%
0%
2%
4%
6%
8%
10%
12%
14%
16%
18%
20%
LA17.4%
NM13.8%
CO12.9%
MT12.6%
TX12.0%
WY11.4%
CA11.3%
OK10.6%
ND10.4%
WV10.3%
KS9.1%
OH6.5%
AR6.3%
AK5.8%
UT5.2%
PA3.5%
16-States10.8%
Severance AdValorem Income Sales

Page|29 RegionTrack,Inc.
OklahomaOilandGasIndustryTaxation
EffectofRecentTaxLawChange.GivenrecentincreasesinseverancetaxratesinOklahoma,
thestate’soveralleffectiveratewillrisesharplyinbothFY2018andFY2019asmoreproducingwellsmoveintothe7%taxbracket.Figure18illustratestheoveralleffectivetaxrateandrelativerankingofOklahomabasedonbothFY2016severancetaxratesandprojectedseverancetaxratesinFY2018andFY2019.Theeffectiveseverancetaxrateforthestateisprojectedtoriseto4.4%inFY2018and4.8%inFY2019.
Whilethestate’sFY2016overalleffectiverateof10.6%ranksjustabovethemidpointofthesixteenstates,theoverallrateisprojectedtoriseto12.1%inthecurrenttaxyear(FY2018)andto12.6%inFY2019.Givenconstanttaxpolicyinotherstates,Oklahomawouldhavethe5thhighestoveralleffectivetaxrateamongthesixteenstatesthisfiscalyearandnext.Thestate’sratewillexceedthe10.8%overallrateacrossthesixteenstatesandmove0.6%abovethe12.0%overalleffectiverateinTexasbyFY2019.
Inshort,basedontaxlawchangesalreadyimplemented,Oklahomaisprojectedtohavethe5thhighestoveralleffectivetaxrateamongthesixteenstatesthisfiscalyear.Ofthefourstateswithahighereffectiverate,onlyLouisianawillexceedOklahoma’sFY2019ratebymorethanapproximately1percentagepoint.TheeffectiverateinOklahomaalreadyexceedstheeffectiverateinNorthDakotaandisprojectedtosoonexceedtherateinWyomingandroughlymatchtherateinMontana.NorthDakota,Wyoming,andMontanaarealltraditionalproducingstateslongviewedashavinghighoilandgastaxes.
HigherSeveranceTaxRateScenarios.GivenrecentpolicydebatesoverthesufficiencyofoveralltaxrevenueinOklahoma,itisimportanttounderstandtheresultingeffectontheoveralleffectivetaxratefacedbytheoilandgasindustryifseverancetaxratesareincreasedfurther.Although
Figure18.ProjectedOverallEffectiveRateinOklahoma–FY2018/FY2019EffectiveSeveranceTaxRates
6.9% 8.6%
1.0%
9.6%
4.8% 4.4% 3.6% 5.5%
1.1% 2.9%
9.5%
4.2% 2.1%
0.9% 1.4% 3.6%
1.2% 1.5% 4.1%
3.1% 2.0%
5.4%
0.4%
1.4% 1.4% 3.5%
4.6%
5.1% 1.4%
0.0%
3.3%
3.3%
0.8% 1.7%
1.7%
2.3% 0.0%
2.7%
2.8% 0.7%
3.9%
2.6%
1.7% 1.7% 0.0%
0.0%
2.9%
1.7%
0.2%
1.0%
2.3%
0.5% 0.5%
0.0%
0.8%
0.5%
0.7%
4.7%
2.5% 2.6%
0.0%
4.7% 4.7% 4.9% 1.3% 2.2%
4.7%
0.7% 1.8%
1.4%
4.4% 2.7%
0.5% 1.0%
1.5%
3.3%
0%
2%
4%
6%
8%
10%
12%
14%
16%
18%
20%
LA17.4% NM13.8% CO12.9% MT12.6% OK12.5% OK12.1% TX12.0% WY11.4%CA11.3% OK10.6% ND10.4% WV10.3% KS9.1% OH6.5%AR6.3% AK5.8%UT5.2% PA3.5% 16-States10.8%
Severance AdValorem Income Sales@FY19EffectiveSeverancetaxRate
@FY18EffectiveSeverancetaxRate
@FY16EffectiveSeverancetaxRate

Page|30 RegionTrack,Inc.
OklahomaOilandGasIndustryTaxation
Oklahomaisoftencastasalow-taxstatewhenviewedsimplybyseveranceandadvaloremtaxes,theoveralleffectiverateinthestateisalreadyabovethemidpointofthemajorproducingstateswhenincomeandsalestaxesareincluded,andtheratewillrisefurtherunderrecenttaxlawchanges.Therecentincreaseinthestate’sseverancetaxratewillpushtheoveralleffectiverateinOklahomato5thhighestamongthemajorproducingstatesthisfiscalyear.
Raisingseverancetaxratesfurtherhasthepotentialtogreatlyshifttheoveralloilandgastaxburdeninthestateevenhigherrelativetocompetingstates.Weexaminetwopotentialscenariosforraisingseverancetaxrates:1)raisingtheseverancetaxrateonproductiontaxedatthe2%rateto4%,and2)taxingallproductionat7%.Figure19providesestimatesoftheoveralleffectiveOklahomaoilandgastaxrateunderthetwoscenariosassumingconstanttaxpolicyinotherproducingstates.TheestimatesassumethechangesareimplementedinFY2019,theupcomingfiscalyear.TheprojectedoveralleffectiverateisbasedonFY2019estimatesforseverancetaxesandFY2016estimatesoftheeffectiveratesforadvalorem,sales,andpersonalincometaxesusedinthepriorcross-statecomparisons.
Bothproposedscenarioswouldproducesignificantincreasesinboththeeffectiveseverancetaxrateandtheoveralleffectivetaxratepaidbythestate’soilandgasindustry.BasedonOklahomaTaxCommissionsestimatesofoilandgasproductionbybracketdetailedinFigure2,adoublingoftheseverancetaxrateonproductioninthe2%bracketto4%wouldraisetotalseverancetaxrevenueby$133.363millioninFY2019.Totalseverancetaxcollectionswouldreach$855.3millioninFY2019.ThistaxrateincreasewouldincreaseOklahoma’seffectiveseverancetaxrateinFY2019to5.46%andthe
Figure19.ProjectedFY2019OverallEffectiveRateinOklahoma–IncreasedSeveranceTaxRates
Notes:AssumesFY2019productioninthe2%taxratebracketistaxedateither4%or7%.Totalprojectedseverancetaxesassuminganincreasedrateon2%productionare$855.3millioninFY2019ata4%severancetaxrateand$1,055.4millioninFY2019ata7%severancetaxrate.
6.9% 6.7% 8.6%
5.5%
1.0%
9.6%
3.6% 5.5%
1.1% 2.9%
9.5%
4.2% 2.1%
0.9% 1.4% 3.6%
1.2% 1.5% 4.1%
3.1% 1.4%
2.0%
1.4%
5.4%
0.4%
3.5%
4.6%
5.1% 1.4%
0.0%
3.3%
3.3%
0.8% 1.7%
1.7%
2.3% 0.0%
2.7%
2.8%
1.7%
0.7%
1.7% 4.1%
2.5%
0.0%
0.0%
2.9%
1.7%
0.2%
1.0%
2.3%
0.5% 0.5%
0.0% 0.8%
0.5%
0.7%
4.7%
4.7% 2.5%
4.7% 2.6%
0.0%
4.9% 1.3% 2.2%
4.7%
0.7% 1.8%
1.4%
4.4% 2.7% 0.5%
1.0%
1.5%
3.3%
0%
2%
4%
6%
8%
10%
12%
14%
16%
18%
20%
LA17.4%
OK14.4%
NM13.8%
OK13.1%
CO13.1%
MT12.6%
TX12.0%
WY11.4%
CA11.3%
OK10.6%
ND10.4%
WV10.3%
KS9.1%
OH6.5%
AR6.3%
AK5.8%
UT5.2%
PA3.5%
16-States10.8%
Severance AdValorem Income SalesFY192%
ProductionTaxed at7%Rate
FY192%ProductionTaxedat4%Rate
@FY16EffectiveSeverancetaxRate

Page|31 RegionTrack,Inc.
OklahomaOilandGasIndustryTaxation
overalleffectivetaxrateto13.1%.Oklahomawouldhavethe3rdhighestoveralltaxrateamongtheproducingstates,trailingonlyLouisiana(17.4%)andNewMexico(13.8%).Severancestaxeswouldbecomethelargestcomponentoftaxcontribution,exceedingthecontributionofsalestaxes.
Inthesecondscenarioofraisingallproductiontoa7%taxrate,totalseverancetaxeswouldincreaseby$333.408millioninFY2019.Totalseverancetaxcollectionswouldreach$1.055billioninFY2019.Thisshiftintaxrateswouldincreasethestate’seffectiveseverancetaxrateinFY2019to6.73%,nearlydoublethecurrenteffectiverateinTexas.Shiftingallproductiontoa7%ratewouldalsoincreasetheoveralleffectivetaxrateinOklahomato14.4%.Underthisscenario,Oklahoma’soilandgassectorwouldhavethesecondhighestoveralleffectivetaxrateamongthesixteenlargestproducingstates,trailingonlyLouisiana.Nearlyhalf(47%)oftheindustry’stotaltaxcontributionacrossthefourtaxeswouldcomefromseverancetaxpayments.
FurtherStudy.Webelievethisanalysispushesforwardthepolicydebateconcerningstate-leveloil
andgasindustrytaxcontributionandoveralleffectivetaxrates.Whilenotanexhaustivereviewofoilandgasindustrytaxation,itdemonstratestherelativeimportanceofexaminingabroadrangeoftaxeswhenmeasuringtheoveralltaxburdenoftheoilandgasindustry,particularlyinOklahoma.Thestate’slargeoilandgassectorcoupledwithastatetaxstructurethatisheavilyreliantuponincomeandsalestaxesmakesabroaderviewoftaxationcriticaltotaxburdenanalysis.Furtherstudyandadditionaldatacollectionwouldundoubtedlyincreasetheprecisionofthestate-levelestimates.Addingadditionaltaxstreamstotheanalysiswouldlikewiseextendtheusefulnessofthefindingsinthisreport.Nevertheless,certainproducingstatesinvariablyhaveuniquecharacteristicsthatwillnotbecapturedwellbythemethodologyinthereport.
MeasuringTotalTaxes.Basedonthestandardizedformatusedinthereporttocalculatetheoveralleffectiverate,Oklahoma’soilandgasindustrycontributedanestimated$1.22billionintaxrevenuefromthesefourtaxsourcesalone.Itisimportanttonotethattheestimatesoftaxespaidaredesignedtofacilitateacross-statecomparisonoftheoilandgasindustrybasedonthefourkeytaxcategories,notserveasafullaccountingofthetaxrevenuepaidbytheindustry.Asaresult,theestimatedtotalacrossthefourcategoriesconsiderablyunderstatesthefulltaxcontributionoftheindustryinseveralways.Thepersonalincometaxcalculationsarebasedontheaveragetaxrateforthestate,whichunderstatesthetruerategiventhattheaverageearningsofoilandgasworkersinOklahomafarexceedthestateaverage.BasedonincometaxpaymentschedulesbyincomebracketprovidedbytheOklahomaTaxCommission,thehighaveragewagesintheoilandgasindustrywouldbetaxedatmarginalrateswellabovethestateaverage.Thetotaltaxcontributioninthereportalsogreatlyunderstatesthefullrangeofadvaloremtaxespaidbytheindustryonrealandpersonalproperty,includingofficebuildingsandotherstructures.Corporateincometaxesandfranchisetaxespaidbytheindustryaresimilarlyexcludedfromtheanalysis.Corporateincometaxesaresubjecttotremendousuncertaintyduetotheongoingrestatementoftaxableincomeovertimeandmustbeestimatedacrossthestates.Thetotalalsoexcludesmotorvehicletaxesandmotorfueltaxes,bothofwhichtheoilandgasindustrypayssignificantsharesofthestatewidetotal.

Page|32 RegionTrack,Inc.
OklahomaOilandGasIndustryTaxation
V. SystematicLaborMarketandTaxEffectsTheoveralleffectivetaxratecalculationsinthereportprovideahighlyusefulbottom-upapproachtoevaluatingthetaxcontributionoftheoilandgasindustry.Acomplementaryapproachisatop-downevaluationoftheoverallsensitivityofthestateeconomyandtotaltaxbasetochangesinoilandgasactivity.Producingstateswithanoveralleconomiccycleinfluencedbyoilandgasactivitymustgivespecialconsiderationtoboththedirectandspilloveractivitygeneratedbyoilandgastaxpolicydecisions.Inthissection,weexaminethesensitivityofboththelabormarketandoveralltaxrevenueduringtherecentenergypricecycleforthesixteenproducingstatesusedinthetaxrateanalysis.
SystematicLaborMarketEffects.Themostrecentenergypricecyclemadeclearthatseveral
producingstatescontinuetohaveanoveralleconomiccyclethatremainscloselytiedtotheoilandgasindustry.Viewedfromthelabormarket,Oklahomaandfourotherstates–NorthDakota,Louisiana,Alaska,andWyoming–experiencedsystematicdownturnsinemploymentthatbeganinearly2015asoilpricescollapsedandextendedthroughatleastlate2016(seeFigure20).
Thesefivestatesallexperiencedmeaningfuloilandgas-drivenrecessionsatthestatelevelandfarunderperformedrelativetothenationinhiring.NorthDakotaexperiencedthelargestjobdownturnamongallstates,followedbyWyoming.Wyoming’sdownturnwasaidedbyanalreadyweakcoalsector.
AsecondgroupconsistingofOklahoma,Louisiana,andAlaskaexperiencedsevere,butsmaller,jobdownturns.Morerecently,noneofthefivestateswiththelargestdownturnshadreboundedbacktotheirpre-2015trendjobgrowthratebylate2017.
Fouradditionalstates–Texas,WestVirginia,Kansas,andNewMexico–showedpossiblesignsofsystematicdragonthestatelaborforce.ForTexas,itwasmerelyaslowingintherapidpaceofjobgrowthinthestate.WestVirginia’sslowingistiedtoslowingoilandgasandcoalactivityandbeganasfarbackas2012.JobgrowthinKansasslowedminimallyin2015and2016beforesofteningin2017asotherproducingstateswererecovering.NewMexicowasalreadyweakentering2015butslowedabitfurtherin2015and2016.Despitepossiblesignsofoilandgas-relatedslowing,noneofthesefourstatesexperiencedamajorshiftinstateeconomicactivitycommensuratewithenergypricemovements.However,Kansas,WestVirginia,andNewMexicounderperformedtheU.S.inhiringgrowthin2015and2016,whileTexasbegantomorecloselytrackthenationalhiringtrend.
Noneoftheremainingproducingstatesinthesample–Utah,Colorado,California,Montana,Ohio,Arkansas,andPennsylvania–showedsignsofasystematiclinkfromenergypricestothelabormarket.
SystematicTaxRevenueEffects.ThepresenceofsystematiclabormarketeffectsinOklahoma
areimportantbecauseitsuggeststhattheinfluenceoftheoilandgasindustryextendstotheoveralltaxbaseofthestate.Figure21illustratesthetrendintotalstatetaxrevenueineachofthesixteenstatesinthesample.Thestateswithsignificantlabormarketweaknessgenerallyreflectasimilardegreeoftaxrevenueweakness.
Page|33 RegionTrack,Inc.
OklahomaOilandGasIndustryTaxation
TaxrevenuereductionsarelargestinNorthDakotaandAlaskaandreflectthewidespreadweaknessacrosstheoilandgasindustryintheperiodinthesestates.
Oklahomaandsixadditionalstates–Texas,NewMexico,Montana,WestVirginia,Louisiana,andWyoming–alsoexperiencedoveralltaxrevenueweaknessinFY2016whichisbelievedtobecloselytiedtooilandgasactivity.Whilenumerousfactorscaninfluencetheoverallleveloftaxrevenueatthestatelevel,thesestatesallexhibitedasystematicreactiontoweaknessintheoilandgassector.WyomingandWestVirginiaweresimultaneouslyexperiencingweaknessfromcontractingcoalactivity.
Sevenadditionalstates–Colorado,California,Utah,Arkansas,Kansas,Ohio,andPennsylvania–didnotexhibitweaknessintaxrevenueintheperiod.Noneexperiencedlabormarketweaknesseither.
SystematicOilandGasRiskinOklahoma.Insummary,Oklahomaremainsatop-tierenergy
statewithanoveralleconomiccyclethatiscloselytiedtooilandgasactivity.Thiswidespreadinfluenceisvisibleinboththelabormarketandtotaltaxrevenue,justasitisinothermajorproducingstates.NorthDakotaandAlaskaremainthemostsensitiveoverall.NorthDakotaismostsensitivefromalabormarketview,whileAlaskaismostsensitivefromataxrevenueperspective.InOklahoma,Louisiana,andWyoming,boththelabormarketandtaxrevenueremaininfluencedinasystematicwaybyoilandgasactivity.NewMexico,Texas,andWestVirginiahaveasmallersystematiclinktotheoilandgasindustrythrougheitherthelabormarketortaxrevenue.Conversely,Utah,Colorado,Pennsylvania,Montana,Kansas,California,Ohio,andArkansasshowedlimitedsystematiceconomicriskoriginatingfromtheoilandgassectorintherecentenergypricecycle.
Figure20.SystematicLaborMarketEffectsinEnergy-ProducingStatesIndexoftotalwageandsalaryemployment(Jan-2010=100.0)
(a) SystematicLaborMarketEffects

Page|34 RegionTrack,Inc.
OklahomaOilandGasIndustryTaxation
(b) PossibleSystematicLaborMarketEffects
(c)NoSystematicLaborMarketEffects
Source:BureauofLaborStatisticsandRegionTrackcalculationsFigure21.SystematicTaxRevenueEffectsinEnergy-ProducingStates
95
100
105
110
115
120
125
130
10 11 12 13 14 15 16 17
ND
U.S.
OK
LA
AK
WY
95
100
105
110
115
120
125
130
10 11 12 13 14 15 16 17
TX
U.S.
KS
NM
WV
95
100
105
110
115
120
125
130
10 11 12 13 14 15 16 17
UTCOCAU.S.MTOHARPA
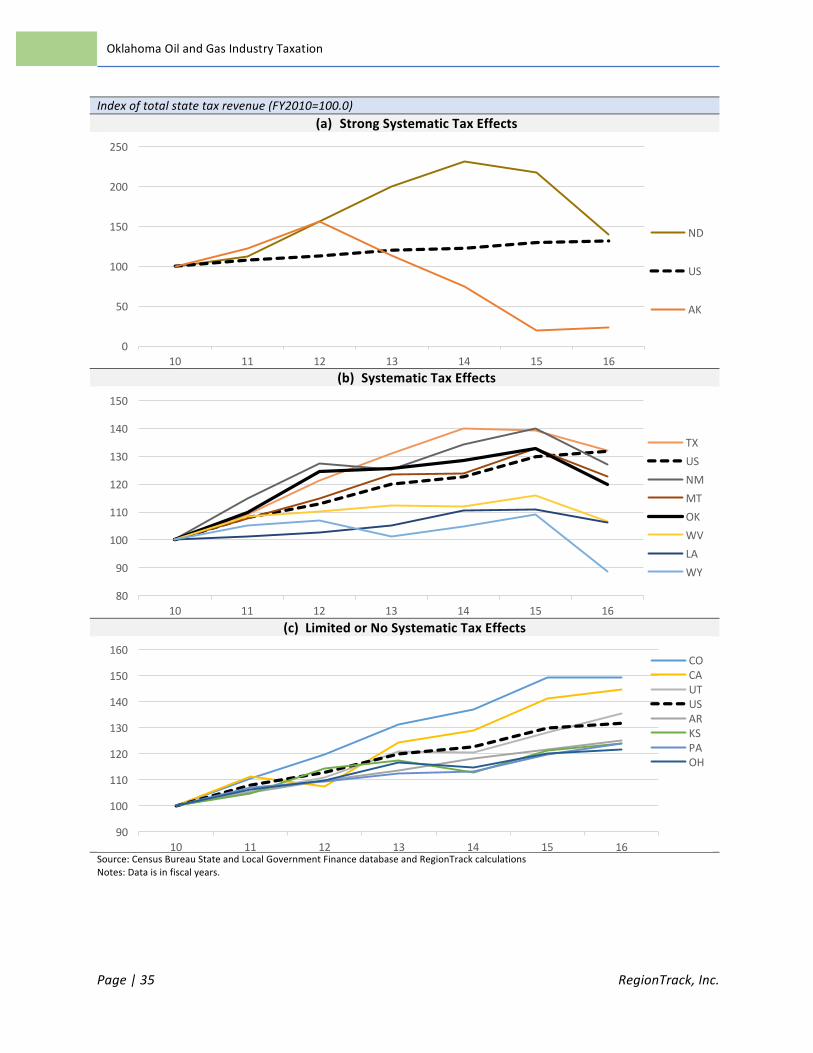
Page|35 RegionTrack,Inc.
OklahomaOilandGasIndustryTaxation
Indexoftotalstatetaxrevenue(FY2010=100.0)(a) StrongSystematicTaxEffects
(b) SystematicTaxEffects
(c)LimitedorNoSystematicTaxEffects
Source:CensusBureauStateandLocalGovernmentFinancedatabaseandRegionTrackcalculationsNotes:Dataisinfiscalyears.
0
50
100
150
200
250
10 11 12 13 14 15 16
ND
US
AK
80
90
100
110
120
130
140
150
10 11 12 13 14 15 16
TXUSNMMTOKWVLAWY
90
100
110
120
130
140
150
160
10 11 12 13 14 15 16
COCAUTUSARKSPAOH
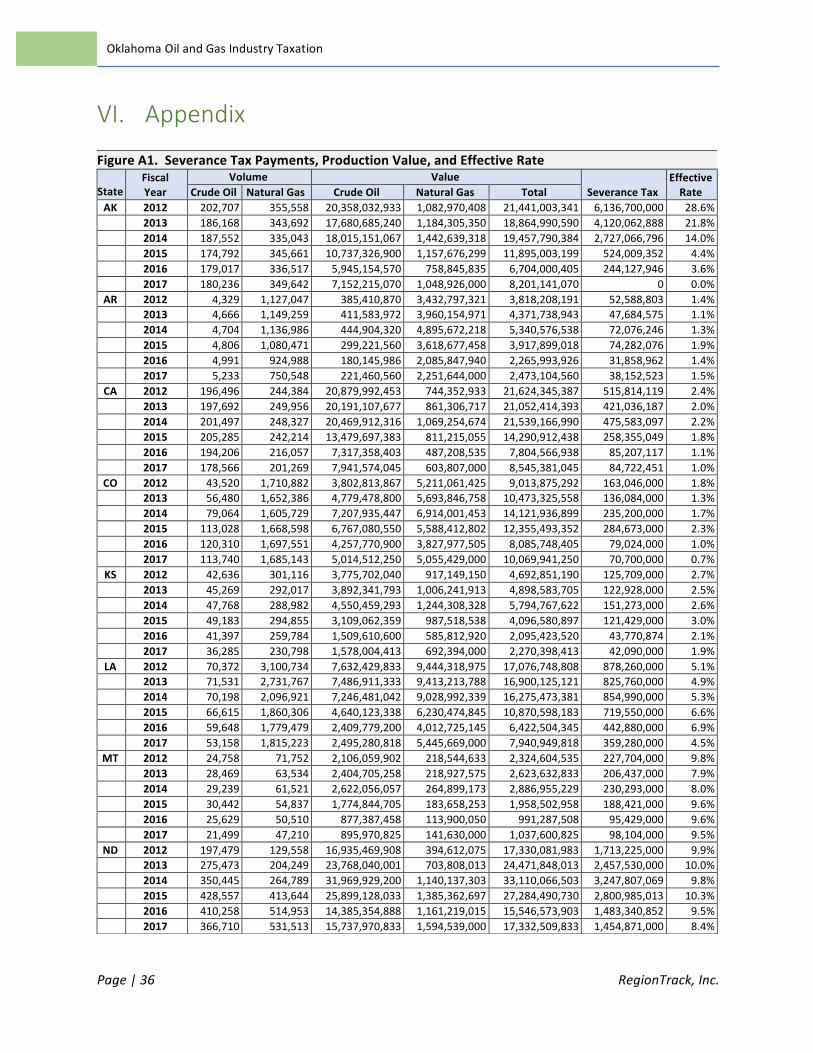
Page|36 RegionTrack,Inc.
OklahomaOilandGasIndustryTaxation
VI. Appendix
FigureA1.SeveranceTaxPayments,ProductionValue,andEffectiveRate
StateFiscalYear
Volume ValueSeveranceTax
EffectiveRateCrudeOil NaturalGas CrudeOil NaturalGas Total
AK 2012 202,707 355,558 20,358,032,933 1,082,970,408 21,441,003,341 6,136,700,000 28.6%
2013 186,168 343,692 17,680,685,240 1,184,305,350 18,864,990,590 4,120,062,888 21.8%
2014 187,552 335,043 18,015,151,067 1,442,639,318 19,457,790,384 2,727,066,796 14.0%
2015 174,792 345,661 10,737,326,900 1,157,676,299 11,895,003,199 524,009,352 4.4%
2016 179,017 336,517 5,945,154,570 758,845,835 6,704,000,405 244,127,946 3.6%
2017 180,236 349,642 7,152,215,070 1,048,926,000 8,201,141,070 0 0.0%
AR 2012 4,329 1,127,047 385,410,870 3,432,797,321 3,818,208,191 52,588,803 1.4%
2013 4,666 1,149,259 411,583,972 3,960,154,971 4,371,738,943 47,684,575 1.1%
2014 4,704 1,136,986 444,904,320 4,895,672,218 5,340,576,538 72,076,246 1.3%
2015 4,806 1,080,471 299,221,560 3,618,677,458 3,917,899,018 74,282,076 1.9%
2016 4,991 924,988 180,145,986 2,085,847,940 2,265,993,926 31,858,962 1.4%
2017 5,233 750,548 221,460,560 2,251,644,000 2,473,104,560 38,152,523 1.5%
CA 2012 196,496 244,384 20,879,992,453 744,352,933 21,624,345,387 515,814,119 2.4%
2013 197,692 249,956 20,191,107,677 861,306,717 21,052,414,393 421,036,187 2.0%
2014 201,497 248,327 20,469,912,316 1,069,254,674 21,539,166,990 475,583,097 2.2%
2015 205,285 242,214 13,479,697,383 811,215,055 14,290,912,438 258,355,049 1.8%
2016 194,206 216,057 7,317,358,403 487,208,535 7,804,566,938 85,207,117 1.1%
2017 178,566 201,269 7,941,574,045 603,807,000 8,545,381,045 84,722,451 1.0%
CO 2012 43,520 1,710,882 3,802,813,867 5,211,061,425 9,013,875,292 163,046,000 1.8%
2013 56,480 1,652,386 4,779,478,800 5,693,846,758 10,473,325,558 136,084,000 1.3%
2014 79,064 1,605,729 7,207,935,447 6,914,001,453 14,121,936,899 235,200,000 1.7%
2015 113,028 1,668,598 6,767,080,550 5,588,412,802 12,355,493,352 284,673,000 2.3%
2016 120,310 1,697,551 4,257,770,900 3,827,977,505 8,085,748,405 79,024,000 1.0%
2017 113,740 1,685,143 5,014,512,250 5,055,429,000 10,069,941,250 70,700,000 0.7%
KS 2012 42,636 301,116 3,775,702,040 917,149,150 4,692,851,190 125,709,000 2.7%
2013 45,269 292,017 3,892,341,793 1,006,241,913 4,898,583,705 122,928,000 2.5%
2014 47,768 288,982 4,550,459,293 1,244,308,328 5,794,767,622 151,273,000 2.6%
2015 49,183 294,855 3,109,062,359 987,518,538 4,096,580,897 121,429,000 3.0%
2016 41,397 259,784 1,509,610,600 585,812,920 2,095,423,520 43,770,874 2.1%
2017 36,285 230,798 1,578,004,413 692,394,000 2,270,398,413 42,090,000 1.9%
LA 2012 70,372 3,100,734 7,632,429,833 9,444,318,975 17,076,748,808 878,260,000 5.1%
2013 71,531 2,731,767 7,486,911,333 9,413,213,788 16,900,125,121 825,760,000 4.9%
2014 70,198 2,096,921 7,246,481,042 9,028,992,339 16,275,473,381 854,990,000 5.3%
2015 66,615 1,860,306 4,640,123,338 6,230,474,845 10,870,598,183 719,550,000 6.6%
2016 59,648 1,779,479 2,409,779,200 4,012,725,145 6,422,504,345 442,880,000 6.9%
2017 53,158 1,815,223 2,495,280,818 5,445,669,000 7,940,949,818 359,280,000 4.5%
MT 2012 24,758 71,752 2,106,059,902 218,544,633 2,324,604,535 227,704,000 9.8%
2013 28,469 63,534 2,404,705,258 218,927,575 2,623,632,833 206,437,000 7.9%
2014 29,239 61,521 2,622,056,057 264,899,173 2,886,955,229 230,293,000 8.0%
2015 30,442 54,837 1,774,844,705 183,658,253 1,958,502,958 188,421,000 9.6%
2016 25,629 50,510 877,387,458 113,900,050 991,287,508 95,429,000 9.6%
2017 21,499 47,210 895,970,825 141,630,000 1,037,600,825 98,104,000 9.5%
ND 2012 197,479 129,558 16,935,469,908 394,612,075 17,330,081,983 1,713,225,000 9.9%
2013 275,473 204,249 23,768,040,001 703,808,013 24,471,848,013 2,457,530,000 10.0%
2014 350,445 264,789 31,969,929,200 1,140,137,303 33,110,066,503 3,247,807,069 9.8%
2015 428,557 413,644 25,899,128,033 1,385,362,697 27,284,490,730 2,800,985,013 10.3%
2016 410,258 514,953 14,385,354,888 1,161,219,015 15,546,573,903 1,483,340,852 9.5%
2017 366,710 531,513 15,737,970,833 1,594,539,000 17,332,509,833 1,454,871,000 8.4%

Page|37 RegionTrack,Inc.
OklahomaOilandGasIndustryTaxation

Page|38 RegionTrack,Inc.
OklahomaOilandGasIndustryTaxation
FigureA1.(Continued)SeveranceTaxPayments,ProductionValue,andEffectiveRate
StateFiscalYear
Volume
Value
SeveranceTaxEffectiveRateCrudeOil NaturalGas CrudeOil NaturalGas Total
NM 2012 77,671 1,232,825 7,016,992,318 3,754,979,479 10,771,971,797 1,051,484,000 9.8%
2013 93,826 1,186,945 8,026,423,358 4,090,014,646 12,116,438,004 942,620,000 7.8%
2014 112,756 1,198,119 10,663,898,700 5,158,900,728 15,822,799,428 1,174,454,000 7.4%
2015 139,394 1,238,619 8,594,801,717 4,148,341,468 12,743,143,184 1,011,872,000 7.9%
2016 145,805 1,242,137 5,528,075,071 2,801,018,935 8,329,094,006 717,572,000 8.6%
2017 154,165 1,253,245 6,947,445,725 3,759,735,000 10,707,180,725 843,200,000 7.9%
OH 2012 4,888 81,701 450,604,353 248,847,629 699,451,983 2,531,325 0.4%
2013 5,599 98,515 507,857,295 339,466,271 847,323,566 3,022,775 0.4%
2014 11,307 295,575 1,072,393,570 1,272,696,688 2,345,090,258 8,520,075 0.4%
2015 20,907 758,070 1,229,488,403 2,538,902,775 3,768,391,178 21,042,450 0.6%
2016 26,993 1,265,427 889,014,455 2,853,537,885 3,742,552,340 34,334,975 0.9%
2017 18,353 1,541,400 797,820,204 4,624,200,000 5,422,020,204 40,370,300 0.7%
OK 2012 77,859 1,959,400 7,090,619,130 5,968,005,833 13,058,624,963 895,066,072 6.9%
2013 109,530 2,017,638 9,667,391,625 6,952,444,275 16,619,835,900 529,365,106 3.2%
2014 128,588 2,128,929 12,540,544,700 9,166,813,453 21,707,358,153 686,092,649 3.2%
2015 164,114 2,463,850 10,724,713,138 8,251,844,292 18,976,557,430 560,102,003 3.0%
2016 154,697 2,501,532 5,873,716,176 5,640,954,660 11,514,670,836 330,738,937 2.9%
2017 153,570 2,425,144 6,980,652,325 7,275,432,000 14,256,084,325 424,763,280 3.0%
f2018 153,570 2,425,144 7,924,212,000 7,469,443,520 15,393,655,520 638,748,000 4.4%
f2019 153,570 2,425,144 8,108,496,000 7,566,449,280 15,674,945,280 721,960,000 4.8%
PA 2012 3,652 1,778,349 324,422,377 5,416,554,663 5,740,977,039 202,472,000 3.5%
2013 4,715 2,742,305 408,456,521 9,449,525,979 9,857,982,500 225,752,000 2.3%
2014 6,249 3,805,016 561,092,503 16,383,764,727 16,944,857,229 223,500,000 1.3%
2015 7,126 4,577,398 399,525,128 15,330,468,802 15,729,993,930 187,712,000 1.2%
2016 6,811 5,131,812 247,630,933 11,572,236,060 11,819,866,993 173,259,000 1.5%
2017 5,899 5,330,850 259,560,916 15,992,550,000 16,252,110,916 181,993,000 1.1%
TX 2012 655,811 7,304,386 60,993,155,546 22,247,942,358 83,241,097,904 3,807,555,500 4.6%
2013 824,780 7,533,112 75,274,921,333 25,957,848,433 101,232,769,767 4,486,090,000 4.4%
2014 1,031,150 7,797,716 99,805,867,792 33,575,665,477 133,381,533,268 5,773,652,000 4.3%
2015 1,248,215 8,076,424 79,856,634,983 27,049,290,047 106,905,925,030 4,159,630,000 3.9%
2016 1,218,694 7,606,547 46,438,334,870 17,152,763,485 63,591,098,355 2,282,701,440 3.6%
2017 1,187,821 6,836,102 53,897,377,875 20,508,306,000 74,405,683,875 3,090,098,096 4.2%
UT 2012 27,915 477,941 2,330,925,763 1,455,728,629 3,786,654,392 65,541,000 1.7%
2013 32,252 480,534 2,588,921,793 1,655,840,075 4,244,761,868 53,164,000 1.3%
2014 38,567 467,910 3,337,684,598 2,014,742,475 5,352,427,073 89,160,000 1.7%
2015 40,686 446,236 2,382,199,205 1,494,518,737 3,876,717,942 69,685,000 1.8%
2016 32,676 385,158 1,128,356,740 868,531,290 1,996,888,030 23,880,583 1.2%
2017 31,384 334,877 1,319,043,367 1,004,631,000 2,323,674,367 15,731,108 0.7%
WV 2012 2,362 464,954 205,062,935 1,416,172,392 1,621,235,327 99,234,290 6.1%
2013 4,107 619,178 353,913,880 2,133,584,192 2,487,498,072 115,014,548 4.6%
2014 7,379 887,938 682,354,578 3,823,313,038 4,505,667,616 229,466,901 5.1%
2015 8,525 1,257,240 463,063,792 4,210,706,300 4,673,770,092 215,361,550 4.6%
2016 7,506 1,315,043 212,100,795 2,965,421,965 3,177,522,760 134,408,900 4.2%
2017 7,985 1,457,173 316,744,988 4,371,519,000 4,688,263,988 165,000,000 3.5%
WY 2012 56,598 2,146,385 4,672,872,375 6,537,530,979 11,210,403,354 635,771,668 5.7%
2013 60,251 1,919,133 4,817,368,705 6,613,012,463 11,430,381,168 522,039,355 4.6%
2014 67,862 1,806,863 6,003,524,933 7,780,050,934 13,783,575,868 597,120,076 4.3%
2015 84,719 1,807,038 4,988,819,513 6,052,071,435 11,040,890,948 682,187,766 6.2%
2016 80,160 1,753,398 2,763,115,200 3,953,912,490 6,717,027,690 370,400,807 5.5%
2017 70,953 1,575,865 3,057,069,133 4,727,595,000 7,784,664,133 292,340,986 3.8%

Page|39 RegionTrack,Inc.
OklahomaOilandGasIndustryTaxation
FigureA2.AdValoremTaxesandEffectiveTaxRates
State
FY2016Severance
TaxRevenue
EffectiveSeveranceTaxRate
FY2016Base1AdValoremTaxRevenue
EffectiveAdValoremTaxRate
FY2016Severance&AdValoremTaxRevenue
FY2016Valueof
OilandGasProduction
EffectiveSeverance
&AdValoremTaxRate
AK $244,127,946 3.6% $111,736,765 1.7% $355,864,711 $6,704,000,405 5.3%AR 31,858,962 1.4% 37,593,551 1.7% 69,452,513 2,265,993,926 3.1%CA 85,207,117 1.1% 400,000,000 5.1% 485,207,117 7,804,566,938 6.2%CO 79,024,000 1.0% 434,700,000 5.4% 513,724,000 8,085,748,405 6.4%KS 43,770,874 2.1% 68,619,000 3.3% 112,389,874 2,095,423,520 5.4%LA 442,880,000 6.9% 197,640,000 3.1% 640,520,000 6,422,504,345 10.0%MT 95,429,000 9.6% 4,194,203 0.4% 99,623,203 991,287,508 10.0%ND 1,483,340,852 9.5% 0 0.0% 1,483,340,852 15,546,573,903 9.5%NM 717,572,000 8.6% 165,000,000 2.0% 882,572,000 8,329,094,006 10.6%OH 34,334,975 0.9% 30,335,573 0.8% 64,670,548 3,742,552,340 1.7%OK 330,738,937 2.9% 157,616,844 1.4% 488,355,781 11,514,670,836 4.2%PA 173,259,000 1.5% 0 0.0% 173,259,000 11,819,866,993 1.5%TX 2,282,701,440 3.6% 2,229,800,000 3.5% 4,512,501,440 63,591,098,355 7.1%UT 23,880,583 1.2% 45,439,000 2.3% 69,319,583 1,996,888,030 3.5%WV 134,408,900 4.2% 105,000,000 3.3% 239,408,900 3,177,522,760 7.5%WY 370,400,807 5.5% 307,016,808 4.6% 677,417,615 6,717,027,690 10.1%
16-States $6,572,935,393 4.1% $4,294,691,744 2.7% $10,867,627,137$160,804,819,959 6.8%
FigureA1.(Continued)EffectiveSeveranceTaxRate-16-StateAverage
Price(avg.) Production ProductionValue
EffectiveRate
FiscalYear
Crude1stPurch. HenryHub CrudeOil NaturalGas CrudeOil NaturalGas Total
SeveranceTax
16-Statesimpleaverage
Value-weightedaverageUnits $/bbl $/milBtu millionbbls bcf $million $million $million $million
2012 91.20 3.05 1,689.1 22,487.0 158,960.6 68,491.6 227,452.1 16,572.7 6.3% 7.3%
2013 88.76 3.45 2,000.8 23,284.2 182,260.1 80,233.5 262,493.7 15,214.6 5.0% 5.8%
2014 93.99 4.31 2,374.3 24,426.4 227,194.2 105,175.9 332,370.0 16,776.3 4.5% 5.0%
2015 61.15 3.35 2,786.4 26,585.5 175,345.7 89,039.1 264,384.9 11,879.3 4.3% 4.5%
2016 35.57 2.26 2,708.8 26,980.9 99,962.9 60,841.9 160,804.8 6,572.9 4.0% 4.1%
2017 43.36 3.00 2,585.6 26,366.0 114,612.7 79,098.0 193,710.7 7,201.4 3.3% 3.7%

Page|40 RegionTrack,Inc.
OklahomaOilandGasIndustryTaxation
VII. ReferencesAnklam,RichardandLairdGraeser.“TheFiscalImpactsofOilandGasProductioninNewMexico.”2015.NewMexicoTaxResearchInstitute.http://c.ymcdn.com/sites/nmtri.site-ym.com/resource/resmgr/Studies_and_Reports/2014_NMTRI_Oil_and_Gas_Study.pdf
Blatt,David.2017.“WeMustEndOilandGasTaxBreakstoSaveOklahomaCommunities.”OklahomaPolicyInstitute.https://okpolicy.org/must-end-oil-gas-tax-breaks-save-oklahoma-communities/
Clifford,Thomas.2011“OverviewofNewMexicoTaxesonOilandGasProduction.”NewMexicoTaxationandRevenueDepartment.https://www.nmlegis.gov/lcs/handouts/rstpjul21.11.oilandgas.pdf
Carey,Marc.2014.“EffectiveSeveranceTaxRates.”ColoradoLegislativeCouncilStaff.http://www.coloradopetroleumassociation.org/wp-content/uploads/2014/04/Total-Effective-Stax-Rates.pdf
CovenantConsultingGroup.2017.“2016OilandGasTaxationComparisonfortheStateofIdaho.AnalysisofSeverance,Production,andAdValoremTaxes.”https://www.idl.idaho.gov/oil-gas/2016-oil-gas-taxation-comparison_rev.pdf
CovenantConsultingGroup.2012.“OilandGasTaxationComparison.AnalysisofSeverance,Production,andAdValoremTaxesinNorthDakotaandOtherOilProducingStates.”http://www.ndnrt.com/image/cache/oil_tax_report_final.pdf
HeadwatersEconomics.2013.“UnconventionalOilandNaturalGasProductionTaxRates:HowDoesOklahomaComparetoPeers?”https://headwaterseconomics.org/wp-content/uploads/State_tax_comparison_study.pdf
LECG.2008.“ComparisonofOilandGasTaxBurdensinTheTenLargestOil-ProducingStates.”http://www.cotce.ca.gov/documents/reports/documents/LECG%20state%20tax%20comparison%20report%2012-08-%20final.pdf
LECG.2008.“ComparisonofOilandGasTaxBurdensinNineProducingStates.”http://www.coloradopetroleumassociation.org/wp-content/uploads/2014/04/Oil-and-gas-taxes-FINAL-V.pdf
Raimi,DanielandRichardG.Newell.2016.“U.S.StateandLocalOilandGasRevenues.”ResourcesfortheFuture.http://www.rff.org/files/document/file/RFF-DP-16-50.pdfandhttp://www.rff.org/files/document/file/RFF-DP-16-50-SI.pdf
Weber,JeremyGlenn,YongshengWang,andMaxwellChomas,2015“HowMuchDoU.S.StateGovernmentsReallyTaxOilandGasExtraction?”USAEEWorkingPaperNo.15-223.

Page|41 RegionTrack,Inc.
OklahomaOilandGasIndustryTaxation
VIII. Endnotes
1InOklahoma,grossproductiontaxesincludetheseverancetaxandthePetroleumExciseTax.2Foradditionaldiscussion,see:OverviewofStateIssues.October2016.OklahomaStateSenateStaff.http://appropriation.oksenate.gov/appropriations/publications/overview_of_state_issues_2016.pdf.Theseverancetaxratechangeisdescribedas:“Duringthe2010legislativesession,HB2432changedtheincentiveforhorizontally-drilledwellsandcertaindeep-drilledwells.Inlieuoftherebateof6/7thsofthetax,thewellsweretaxedatanup-frontreducedrateforaspecifictimeperiod(1%forhorizontaland4%fordeep).HB2432alsoaddressedthen-currentbudgetissuesbysuspendingthepaymentofrebatesdueoncertainproduction.Thatamountwaslaterrepaidoverathree-yearperiodbeginninginFY’13.”3See:MajorOklahomaTaxRevenues,ApportionmentMeeting,OklahomaTaxCommissioners,December14,2017.Estimatesincludetheexcisetax.4TheuseofHenryHubwillslightlyoverstatethevalueofnaturalgasinmoststatesandsubsequentlyproduceaslightunderstatementoftheeffectiverateonnaturalgasproductioninmoststates.5Sourcesforseverancetaxdataforthesixteenproducingstatesare:AK:http://tax.alaska.gov/programs/programs/reports/Annual.aspx?60650&Year=2016AR:http://www.arkleg.state.ar.us/assembly/2017/Summary%20Budget%20Manuals/2016_B_BOOK.PDFCA:http://www.conservation.ca.gov/dog/for_operators/Pages/assessments.aspx;andhttps://castatelands.opengov.com/transparency#/CO:https://www.colorado.gov/pacific/sites/default/files/2016%20Annual%20Report.pdfKS:https://www.ksrevenue.org/pdf/ar16complete.pdfLA:http://assets.dnr.la.gov/TAD/OGTABLES/table28.htmMT:http://revenue.mt.gov/Portals/9/publications/revenuecollections_report/FY-2017/2017-06-RMR.pdfND:https://www.nd.gov/tax/data/upfiles/media/2016-state-and-local-taxes-guide-web.pdf?20171219190905NM:https://www.nmlegis.gov/Entity/LFC/Documents/Revenue_Reports/Monthly_Revenue_Tracking/2017/May%202017%20Revenue%20Report.pdf;andhttps://www.nmlegis.gov/lcs/handouts/rstpjul21.11.oilandgas.pdfOH:https://www.tax.ohio.gov/communications/publications/annual_reports/2016annualreport.aspxOK:https://www.ok.gov/tax/Forms_&_Publications/Publications/Annual_Reports/index.htmlPA:https://www.act13-reporting.puc.pa.gov/Modules/PublicReporting/Overview.aspxTX:https://comptroller.texas.gov/transparency/reports/revenue-by-source/history.phpUT:https://tax.utah.gov/commission/reports/fy16report.pdfWV:https://tax.wv.gov/Documents/Reports/SeveranceTaxes.TaxData.FiscalYears.2004-2016.pdfWY:http://revenue.wyo.gov/dor-annual-reports6AllstatesintheanalysisexceptTexas(Aug.31)haveafiscalyearendedJune30.7Californiadoesnotlevyatraditionalseverancetaxonoilandgasproduction,butdoesapplyanOilandGasProductionAssessmentFeebasedontheproductionofcrudeoilandnaturalgas.ForFY2016thatfeewas$0.3243123perbarrelofoiland10,000cubicfeetofgasproduced.Wealsoincludestatelandrevenueinseverancetaxes.8Seemorediscussionat:https://www.eia.gov/todayinenergy/detail.php?id=245129SeeOklahomaAdValoremStatisticsyearbookspreparedbytheOklahomaTaxCommission.Availableonlineat:https://www.ok.gov/tax/Forms_&_Publications/Publications/Ad_Valorem_Publications/index.html10Sourcesforadvaloremdataforthesixteenproducingstatesare:AK:http://tax.alaska.gov/programs/programs/reports/Annual.aspx?60018&Year=2016AR:https://www.arkansas.gov/acd/statewide_values_rates.htmlCA:http://assessor.co.kern.ca.us/;andftp://ftp.consrv.ca.gov/pub/oil/annual_reports/2016/2016_Annual_Report_Final_Corrected.pdfCO:https://www.coga.org/wp-content/uploads/2015/12/Press-Release-CU-Oil-and-Gas-Economic-Study-Key-Economic-Driver.pdfKS:https://www.ksrevenue.org/pdf/PVDHistoricTax.pdfLA:http://www.latax.state.la.us/Menu_AnnualReports/UploadedFiles/2016%20LOUISIANA%20TAX%20COMMISSION%20ANNUAL%20REPORT.pdfMT:https://revenue.mt.gov/Portals/9/publications/biennial_reports/2014-2016/2016-Biennial-Report-Property-Taxes.pdfND:noneassessedNM:https://www.nmlegis.gov/lcs/handouts/rstpjul21.11.oilandgas.pdfOH:https://energyindepth.org/wp-content/uploads/2017/02/Ohios-Oil-and-Gas-Industry-Property-Tax-Payments2.pdf
Page|42 RegionTrack,Inc.
OklahomaOilandGasIndustryTaxation
OK:https://www.ok.gov/tax/Forms_&_Publications/Publications/Ad_Valorem_Publications/index.htmlPA:noneassessedTX:https://comptroller.texas.gov/taxes/property-tax/reports/index.phpUT:https://propertytax.utah.gov/annual-reports/2016annual.pdfWV:http://www.legis.state.wv.us/legisdocs/2015/committee/interim/TAX/TAX_20150914092710.pdfWY:https://0ebaeb71-a-84cef9ff-s-sites.googlegroups.com/a/wyo.gov/wy-dor/2017AnnualReport.pdf?attachauth=ANoY7cpMYPkbY366ZS0yo9ukGGXL0OkLJ5VraKuwFuydzoGmT8sVsm39KzO50c72e0_44GMmFK9F3Z34LVr7PRClqzvoCO65J8FDQ1ZKYy7vbZiZ3FWaZEfDa3QjxvBGVVMwPCVIhTW4NUmYcC54Pmt7Hfl78D4U05PY01kxAOOxefgIypHKHx6cGS52dq6T6y4INV6jFDDNu72Ket-xfgPjEj9DrMi2mA%3D%3D&attredirects=011KernCountyisthehubofoilandgasproductioninCalifornia,producingslightlymorethan70%ofthetotalon-shorevalueofoilandgas.KernCountytaxesfortheoilandgasindustrytotaledanestimated$285millioninFY2016.Hence,weassumeKernCountycomprises71.25%ofestimatedtotalstatewidetaxesof$400millioninFY2016.12See:https://www.nmlegis.gov/lcs/handouts/rstpjul21.11.oilandgas.pdf13HouseholdearningsisdefinedbyBureauofEconomicAnalysisasemployeecompensationplusproprietors’income.Proprietor’sincomeconsistsprimarilyoftheincomeofsoleproprietorsandpartnerships.TheshareofhouseholdearningsineachstatederivedfromoilandgasactivityiscalculatedasthesumofNAICS201(Oilandgasextraction)plusashareofNAICS203(Supportactivitiesformining).TheshareofNAICS203includedisdeterminedbytheratioofNAICS201/(NAICS201+NAICS202(Mining–exceptoilandgas)).14SalestaxesaredefinedasusedintheCensusBureau’sStateandLocalGovernmentFinancedatabase.Usetaxesaretreatedsynonymouslywithsalestaxes.Grossreceiptstaxesareincludedinmanystates,particularlyNewMexico.15SeeestimatesprovidedbytheTaxFoundation:https://taxfoundation.org/state-and-local-sales-tax-rates-in-2017/16FormoredetailsonthetaxapportionmentapproachusedintheIMPLANinput-outputmodel:seehttps://implanhelp.zendesk.com/hc/en-us/articles/115009674528-Generation-and-Interpretation-of-IMPLAN-s-Tax-Impact-Report17Theaccuracyoftheshareineachstatecanbeaffectedbytheavailabilityofspecialsalestaxexemptionsonthepurchasesofoilandgas-relatedgoodsandservices.AdditionaldataonthepresenceandsizeofpotentialexemptionsinOklahomaandotherstateswouldincreasetheaccuracyoftheestimatedshares.18Availableonlineat:https://www.census.gov/govs/