Embed Size (px)
Citation preview

Oklahoma School Testing Program
Oklahoma State Department of Education Oklahoma City, Oklahoma
Oklahoma Core Curriculum Tests
2011–2012Released Items
Grade 8Science

Copyright © 2011 by the Oklahoma State Department of Education. All rights reserved. Any other use or reproduction of this document, in whole or in part, requires written permission of the Oklahoma State Department of Education.

GO ON
Science
1
DirectionsRead each question and choose the best answer.
GO ON
Science
2
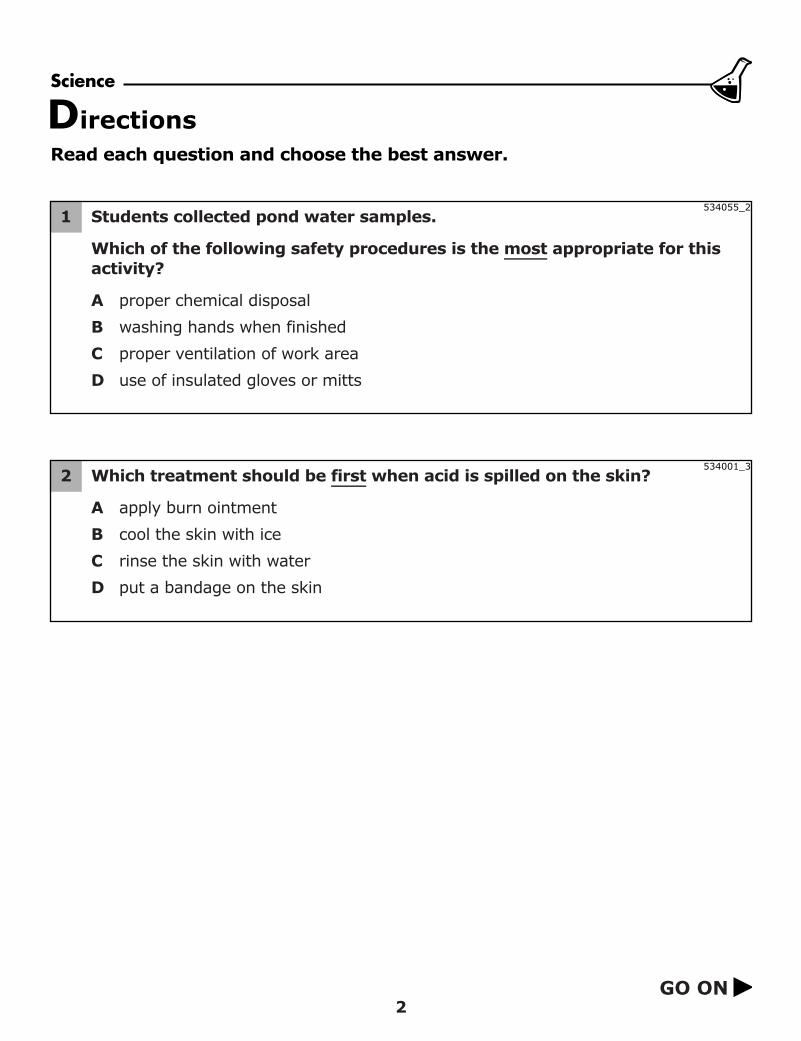
2 Which treatment should be first when acid is spilled on the skin?
A apply burn ointment
B cool the skin with ice
C rinse the skin with water
D put a bandage on the skin
534001_3
1 Students collected pond water samples.
Which of the following safety procedures is the most appropriate for thisactivity?
A proper chemical disposal
B washing hands when finished
C proper ventilation of work area
D use of insulated gloves or mitts
534055_2
GO ON
Science
3
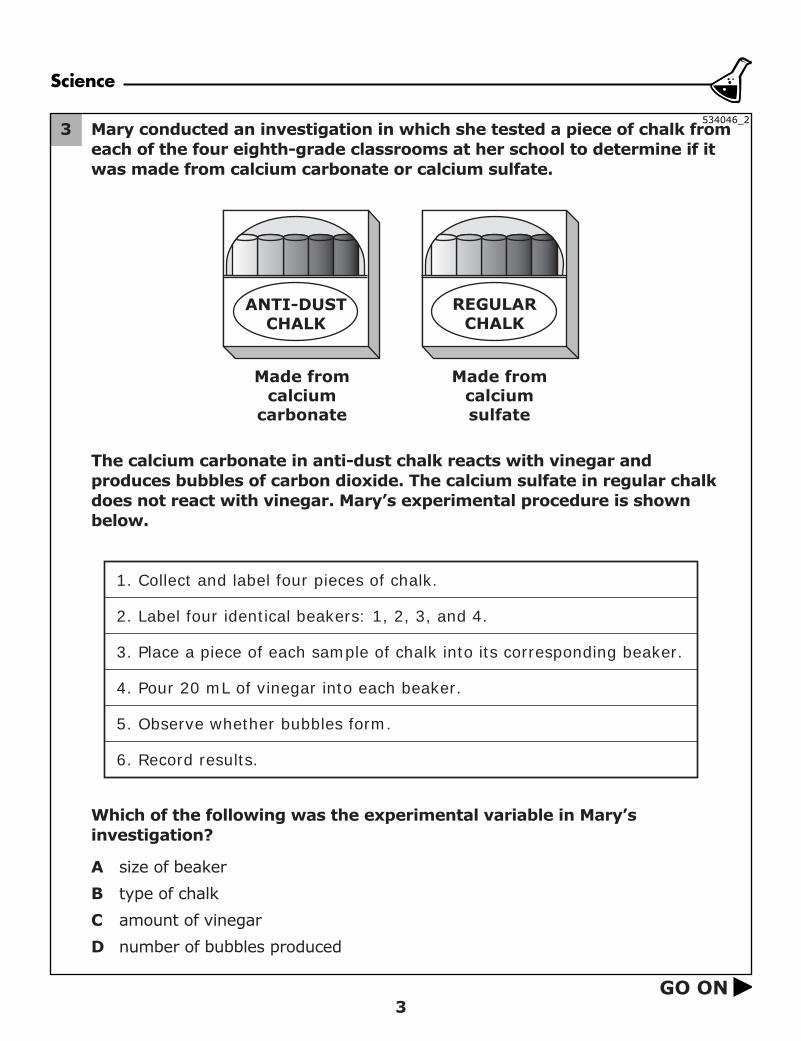
3 Mary conducted an investigation in which she tested a piece of chalk fromeach of the four eighth-grade classrooms at her school to determine if itwas made from calcium carbonate or calcium sulfate.
The calcium carbonate in anti-dust chalk reacts with vinegar andproduces bubbles of carbon dioxide. The calcium sulfate in regular chalkdoes not react with vinegar. Mary’s experimental procedure is shownbelow.
Which of the following was the experimental variable in Mary’sinvestigation?
A size of beaker
B type of chalk
C amount of vinegar
D number of bubbles produced
ANTI-DUSTCHALK
Made fromcalcium
carbonate
Made fromcalciumsulfate
REGULARCHALK
1. Collect and label four pieces of chalk.
2. Label four identical beakers: 1, 2, 3, and 4.
3. Place a piece of each sample of chalk into its corresponding beaker.
4. Pour 20 mL of vinegar into each beaker.
5. Observe whether bubbles form.
6. Record results.
534046_2
GO ON
Science
4
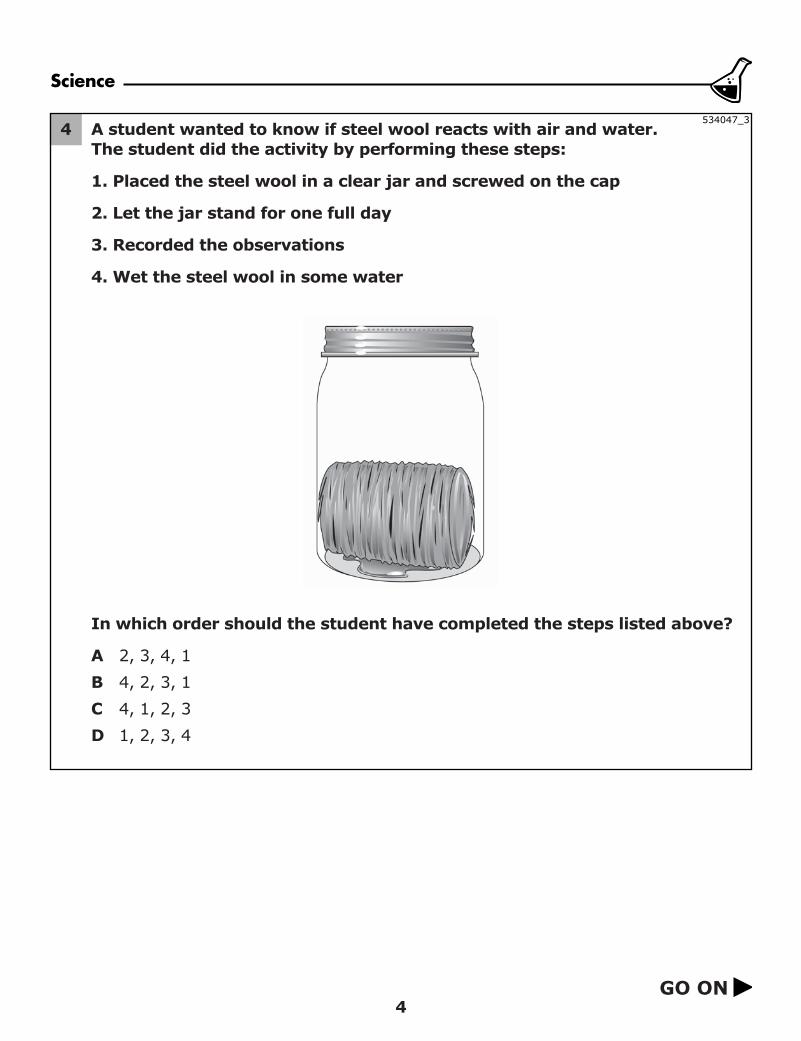
4 A student wanted to know if steel wool reacts with air and water.The student did the activity by performing these steps:
1. Placed the steel wool in a clear jar and screwed on the cap
2. Let the jar stand for one full day
3. Recorded the observations
4. Wet the steel wool in some water
In which order should the student have completed the steps listed above?
A 2, 3, 4, 1
B 4, 2, 3, 1
C 4, 1, 2, 3
D 1, 2, 3, 4
534047_3
GO ON
Science
5
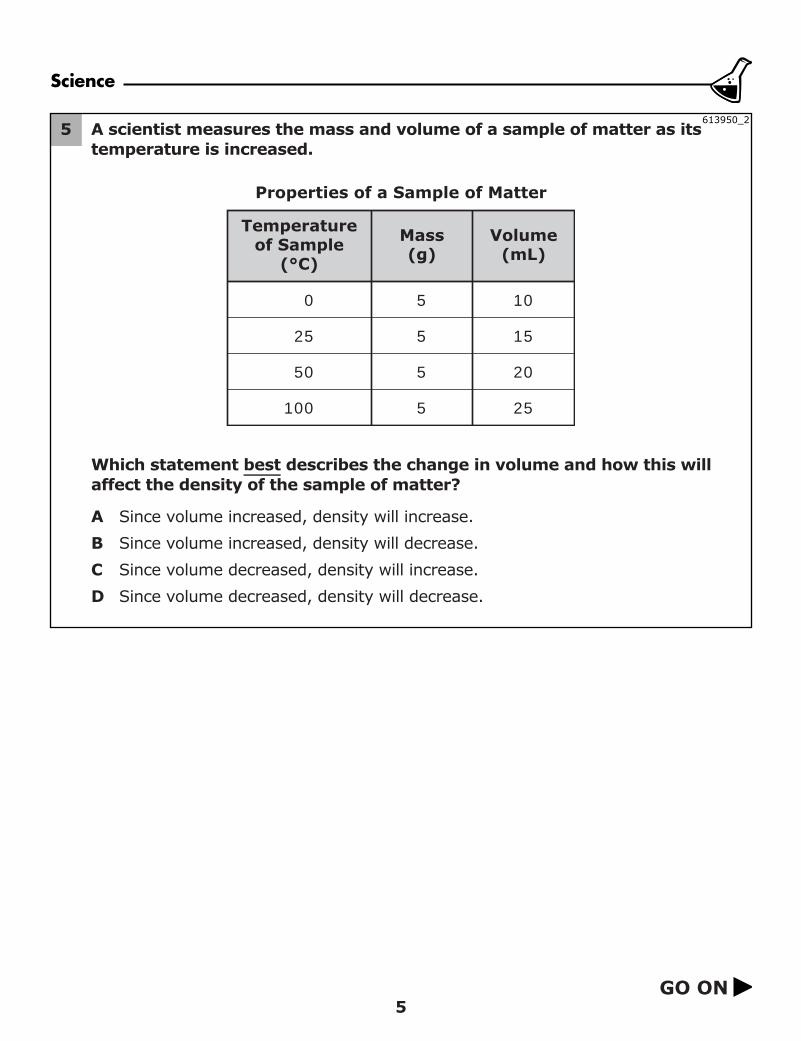
5 A scientist measures the mass and volume of a sample of matter as itstemperature is increased.
Which statement best describes the change in volume and how this willaffect the density of the sample of matter?
A Since volume increased, density will increase.
B Since volume increased, density will decrease.
C Since volume decreased, density will increase.
D Since volume decreased, density will decrease.
Properties of a Sample of Matter
Temperatureof Sample
(°C)
Mass(g)
Volume(mL)
0
25
50
100
5
5
5
5
10
15
20
25
613950_2
GO ON
Science
6
6 A student wanted to see if two brands of carbonated drink contained thesame amount of dissolved gas. She performed the following steps in herexperiment.
A. Recorded the price of each bottle of soda
B. Opened soda bottles and put empty balloons over the bottle mouths
C. Set bottles in a sunny place for 2 hours
D. Compared the size of the full balloons
Which step would not help her find out if the hypothesis is correct?
A A
B B
C C
D D
534036_1

GO ON
Science
7
7 Which piece of equipment would accurately measure 50 milliliters ofliquid?
534058_1
100mL
908070605040302010
500400300200100100100
mL
A B
C D
GO ON
Science
8
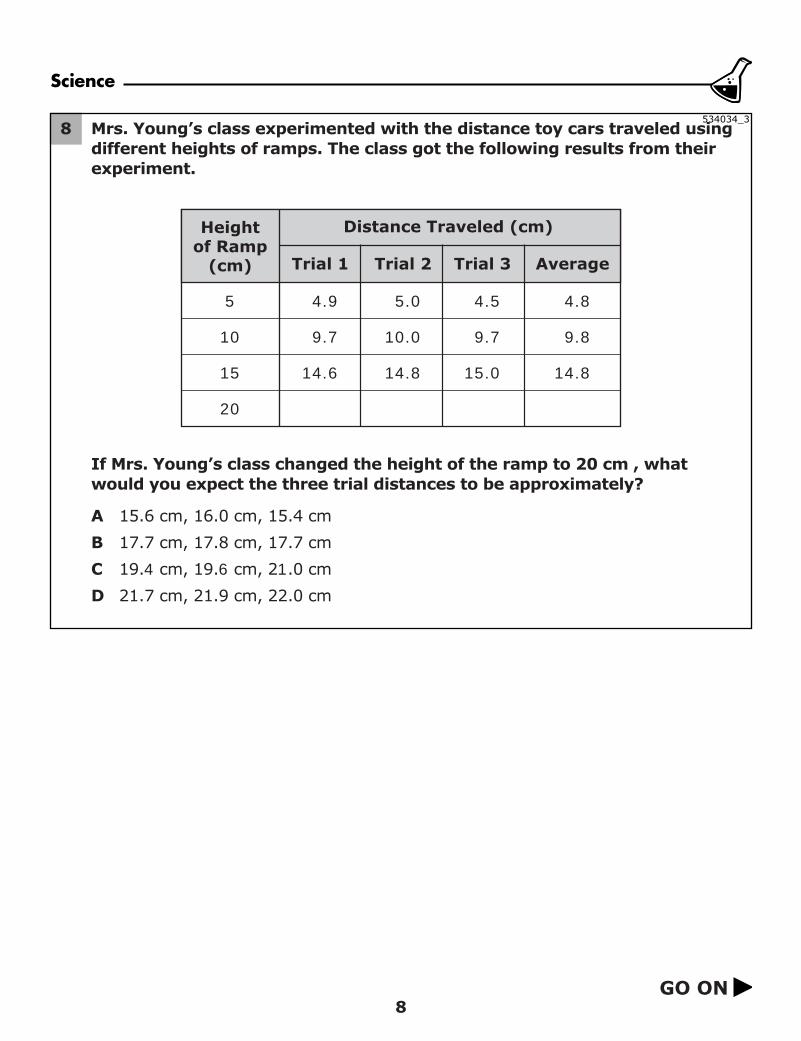
8 Mrs. Young’s class experimented with the distance toy cars traveled usingdifferent heights of ramps. The class got the following results from theirexperiment.
If Mrs. Young’s class changed the height of the ramp to 20 cm , whatwould you expect the three trial distances to be approximately?
A 15.6 cm, 16.0 cm, 15.4 cm
B 17.7 cm, 17.8 cm, 17.7 cm
C 19.4 cm, 19.6 cm, 21.0 cm
D 21.7 cm, 21.9 cm, 22.0 cm
Heightof Ramp
(cm)
5
10
15
20
Trial 3
4.5
9.7
15.0
Average
4.8
9.8
14.8
4.9
9.7
14.6
5.0
10.0
14.8
Trial 1 Trial 2
Distance Traveled (cm)
534034_3
GO ON
Science
9
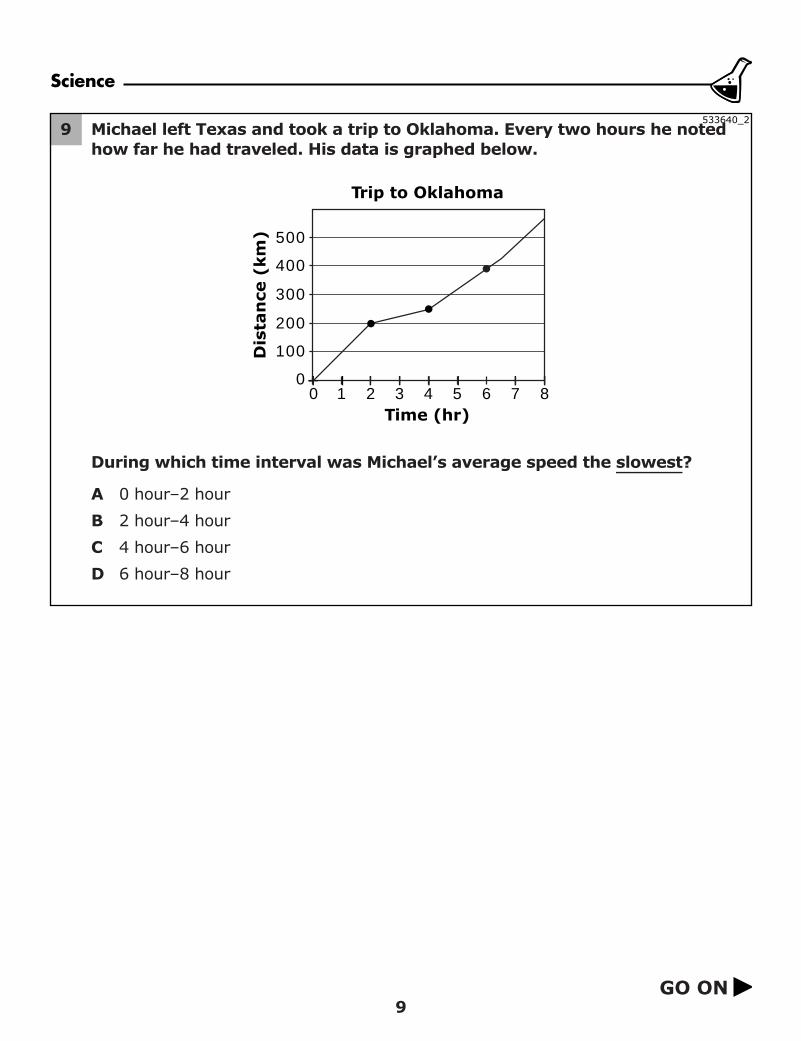
9 Michael left Texas and took a trip to Oklahoma. Every two hours he notedhow far he had traveled. His data is graphed below.
During which time interval was Michael’s average speed the slowest?
A 0 hour–2 hour
B 2 hour–4 hour
C 4 hour–6 hour
D 6 hour–8 hour
Trip to Oklahoma
Time (hr)
Dis
tan
ce (
km)
200
300
400
500
100
00 1 2 3 4 5 6 7 8
533640_2
GO ON
Science
10
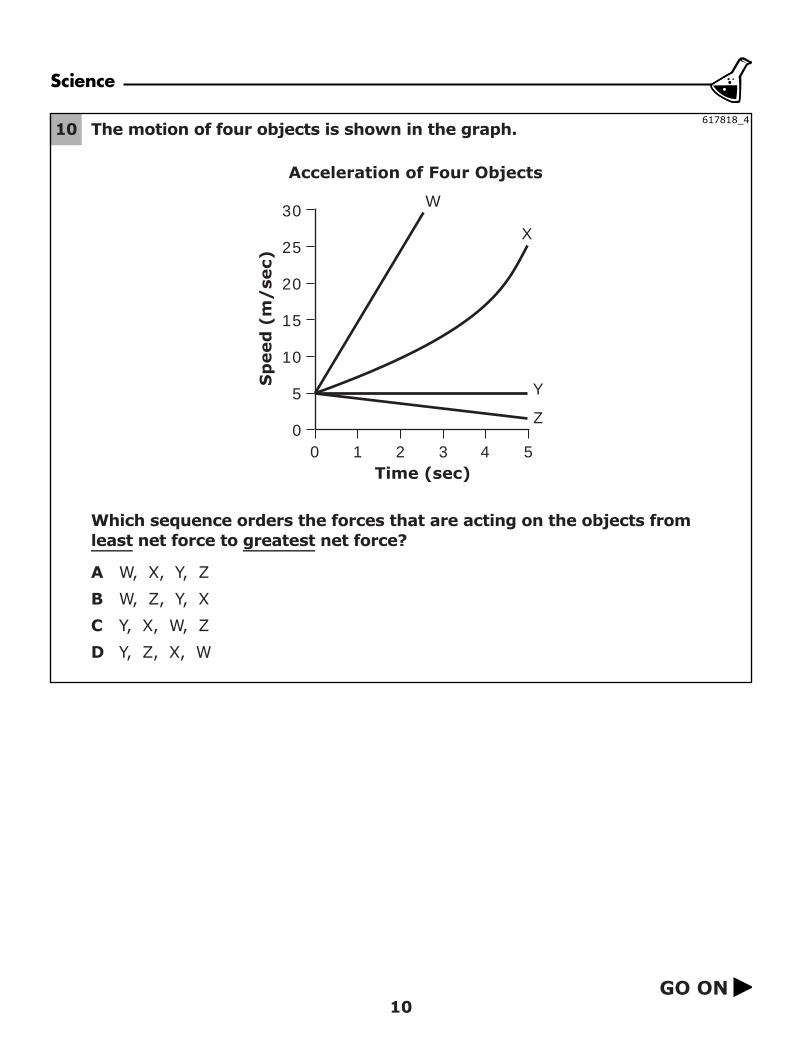
10 The motion of four objects is shown in the graph.
Which sequence orders the forces that are acting on the objects fromleast net force to greatest net force?
A W, X, Y, Z
B W, Z, Y, X
C Y, X, W, Z
D Y, Z, X, W
Acceleration of Four Objects
Time (sec)0
30
25
20
15
10
5
01 2 3 4 5
Sp
eed
(m
/se
c)
W
X
Y
Z
617818_4
GO ON
Science
11
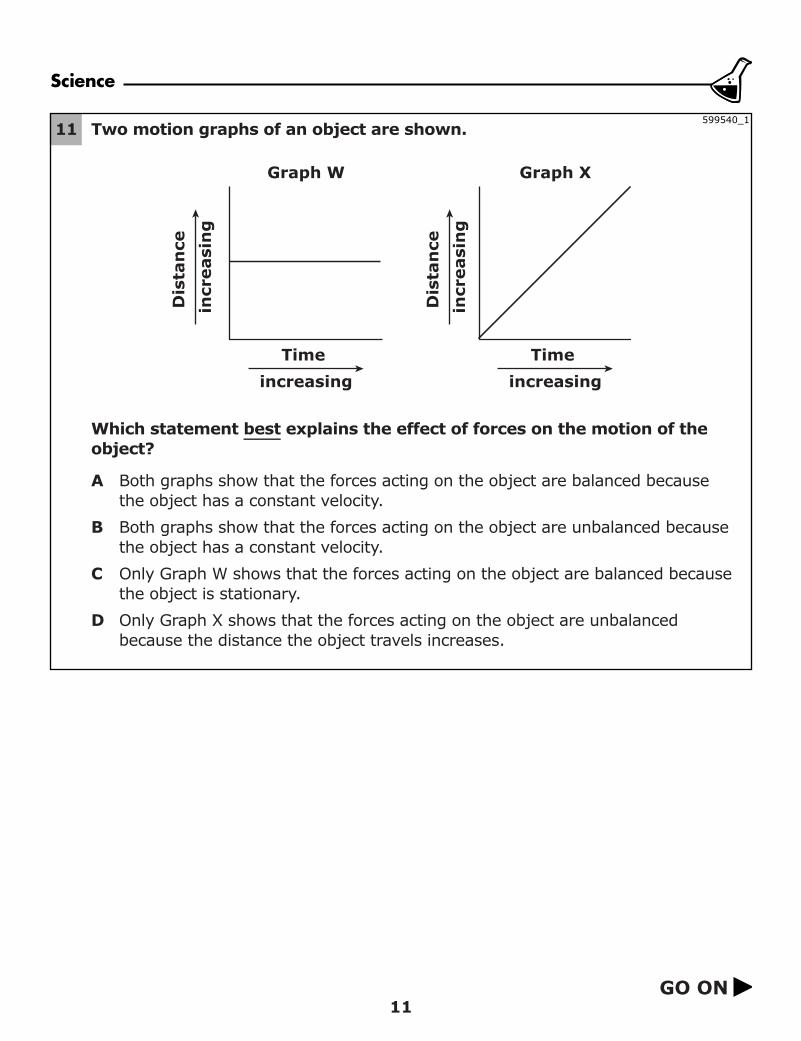
11 Two motion graphs of an object are shown.
Which statement best explains the effect of forces on the motion of theobject?
A Both graphs show that the forces acting on the object are balanced becausethe object has a constant velocity.
B Both graphs show that the forces acting on the object are unbalanced becausethe object has a constant velocity.
C Only Graph W shows that the forces acting on the object are balanced becausethe object is stationary.
D Only Graph X shows that the forces acting on the object are unbalancedbecause the distance the object travels increases.
Graph W
Time increasing
Dis
tan
ce
incr
easi
ng
Dis
tan
ce
incr
easi
ng
Graph X
Time increasing
599540_1

GO ON
Science
12
12 Warren conducted the experiment shown below to test the effect of masson time traveled by carts down a ramp. He added different masses to thefour carts and let each cart roll down the ramp. The distance each onetraveled was recorded.
Which of these would most improve the design of the experiment?
A Use carts that are the same color.
B Use ramps that have different heights.
C Use carts that are exactly the same.
D Use ramps that have different surfaces.
10g
50g 50g 50g
5g
Cart A Cart B
Cart DCart C
Start
534060_3
GO ON
Science
13
13
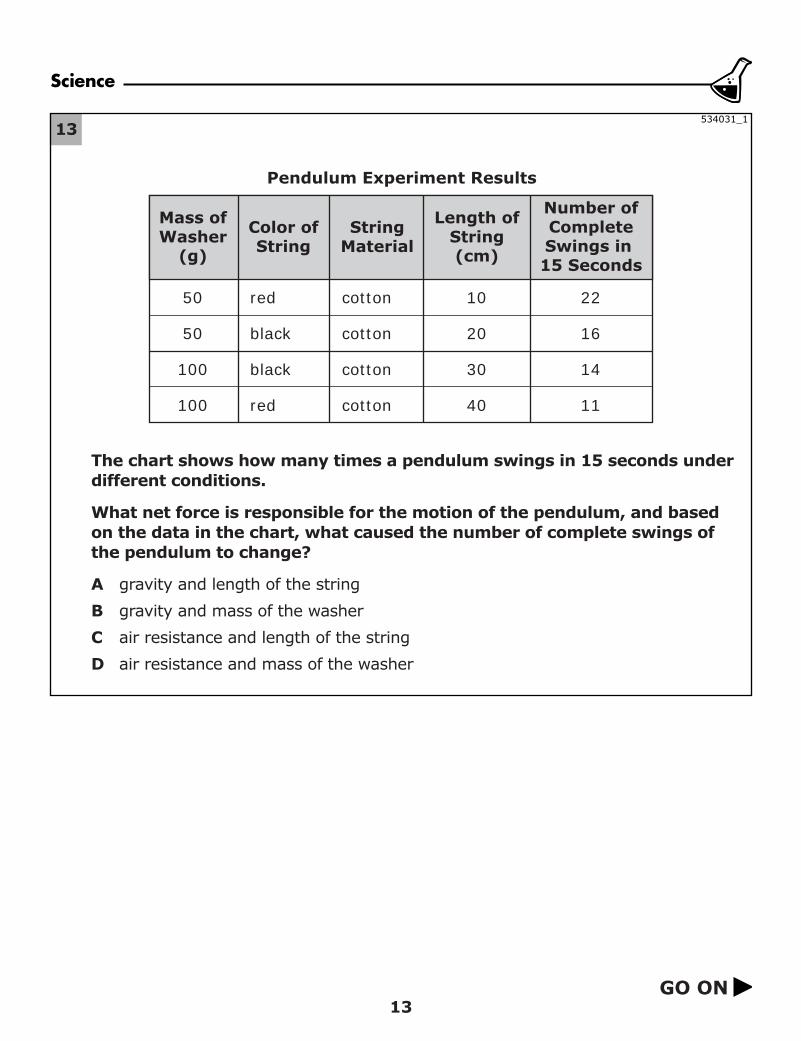
The chart shows how many times a pendulum swings in 15 seconds underdifferent conditions.
What net force is responsible for the motion of the pendulum, and basedon the data in the chart, what caused the number of complete swings ofthe pendulum to change?
A gravity and length of the string
B gravity and mass of the washer
C air resistance and length of the string
D air resistance and mass of the washer
Pendulum Experiment Results
Mass ofWasher
(g)
50
50
100
100
Length ofString(cm)
10
20
30
40
Number ofCompleteSwings in 15 Seconds
22
16
14
11
red
black
black
red
cotton
cotton
cotton
cotton
Color ofString
StringMaterial
534031_1
GO ON
Science
14
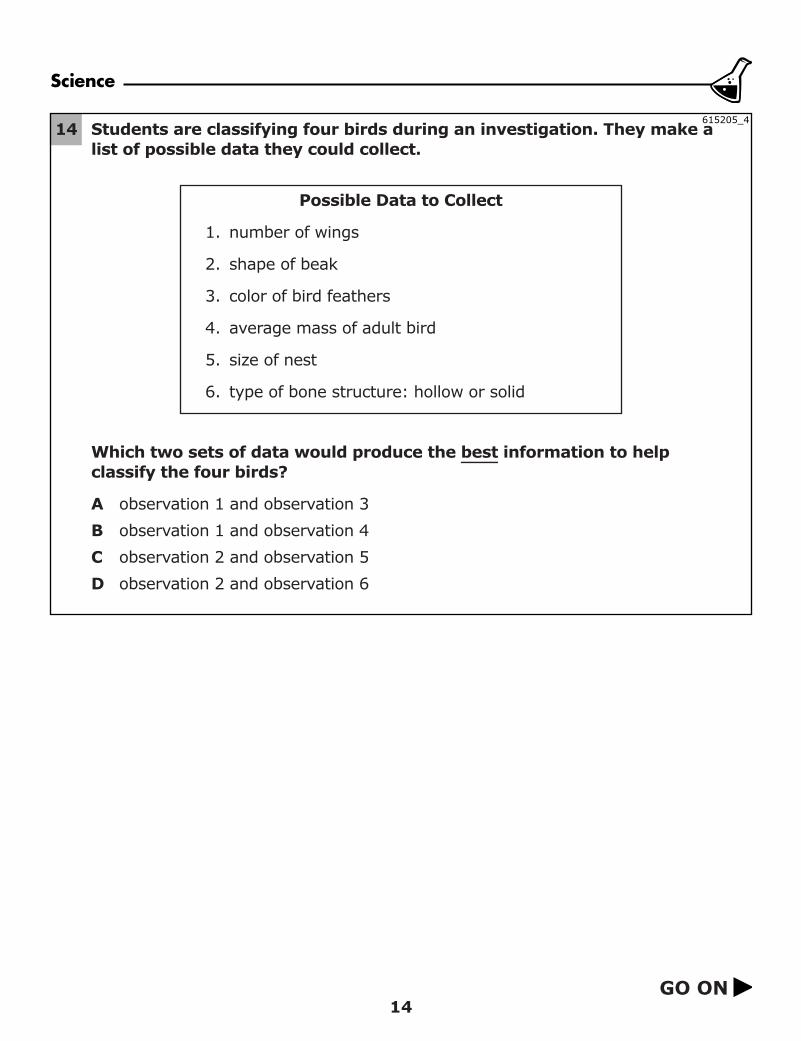
14 Students are classifying four birds during an investigation. They make alist of possible data they could collect.
Which two sets of data would produce the best information to helpclassify the four birds?
A observation 1 and observation 3
B observation 1 and observation 4
C observation 2 and observation 5
D observation 2 and observation 6
Possible Data to Collect
1. number of wings
2. shape of beak
3. color of bird feathers
4. average mass of adult bird
5. size of nest
6. type of bone structure: hollow or solid
615205_4
GO ON
Science
15
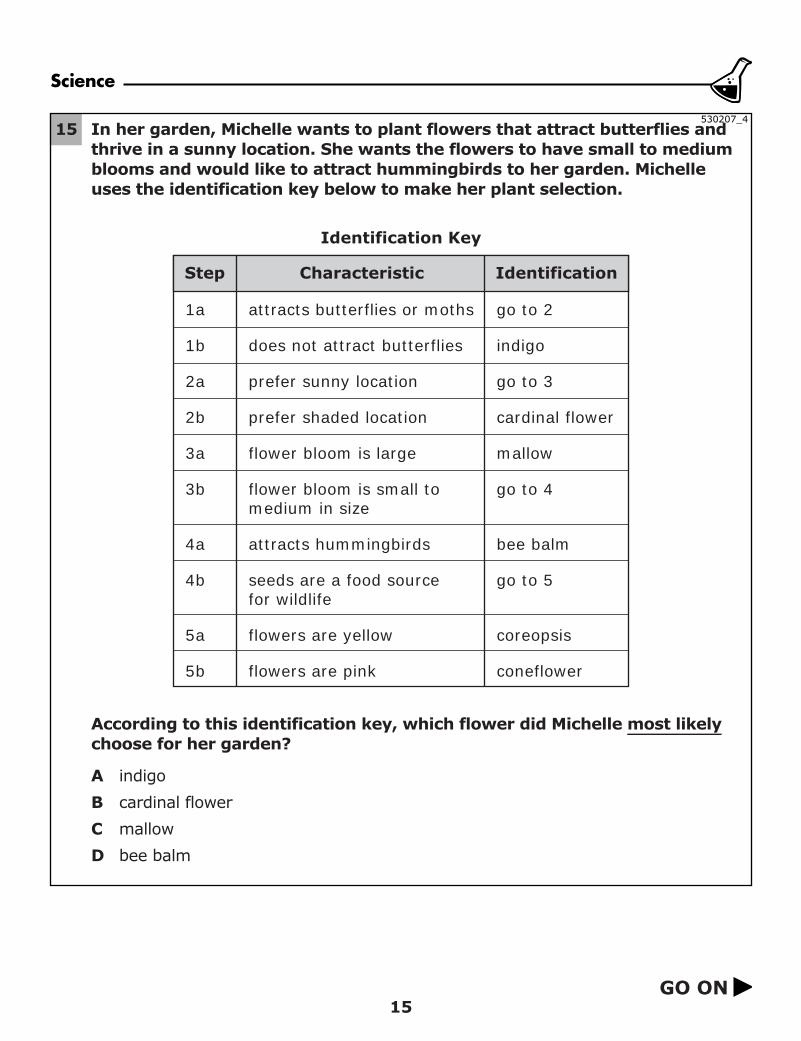
15 In her garden, Michelle wants to plant flowers that attract butterflies andthrive in a sunny location. She wants the flowers to have small to mediumblooms and would like to attract hummingbirds to her garden. Michelleuses the identification key below to make her plant selection.
According to this identification key, which flower did Michelle most likelychoose for her garden?
A indigo
B cardinal flower
C mallow
D bee balm
Identification Key
Step
1a
1b
2a
2b
3a
3b
4a
4b
5a
5b
attracts butterflies or moths
does not attract butterflies
prefer sunny location
prefer shaded location
flower bloom is large
flower bloom is small tomedium in size
attracts hummingbirds
seeds are a food sourcefor wildlife
flowers are yellow
flowers are pink
go to 2
indigo
go to 3
cardinal flower
mallow
go to 4
bee balm
go to 5
coreopsis
coneflower
Characteristic Identification
530207_4
GO ON
Science
16
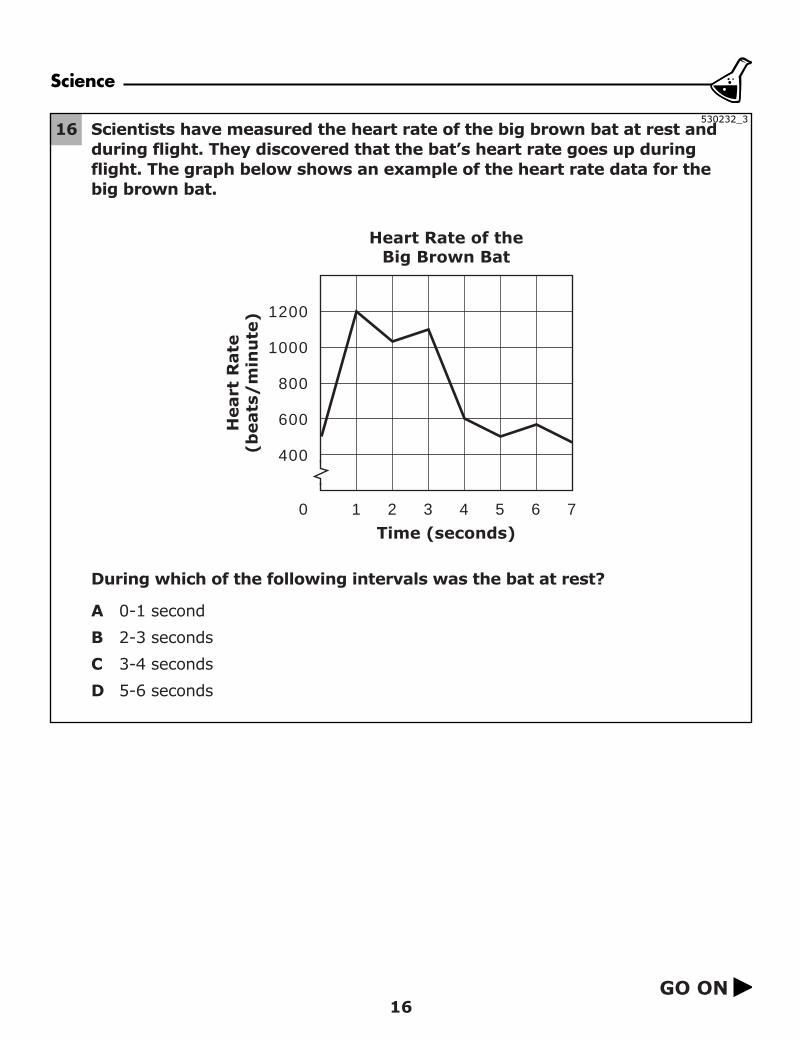
16 Scientists have measured the heart rate of the big brown bat at rest andduring flight. They discovered that the bat’s heart rate goes up duringflight. The graph below shows an example of the heart rate data for thebig brown bat.
During which of the following intervals was the bat at rest?
A 0-1 second
B 2-3 seconds
C 3-4 seconds
D 5-6 seconds
1200
1000
800
600
400
0
Heart Rate of theBig Brown Bat
Time (seconds)1 2 3 4 5 6 7
Hea
rt R
ate
(bea
ts/
min
ute
)
530232_3
GO ON
Science
17
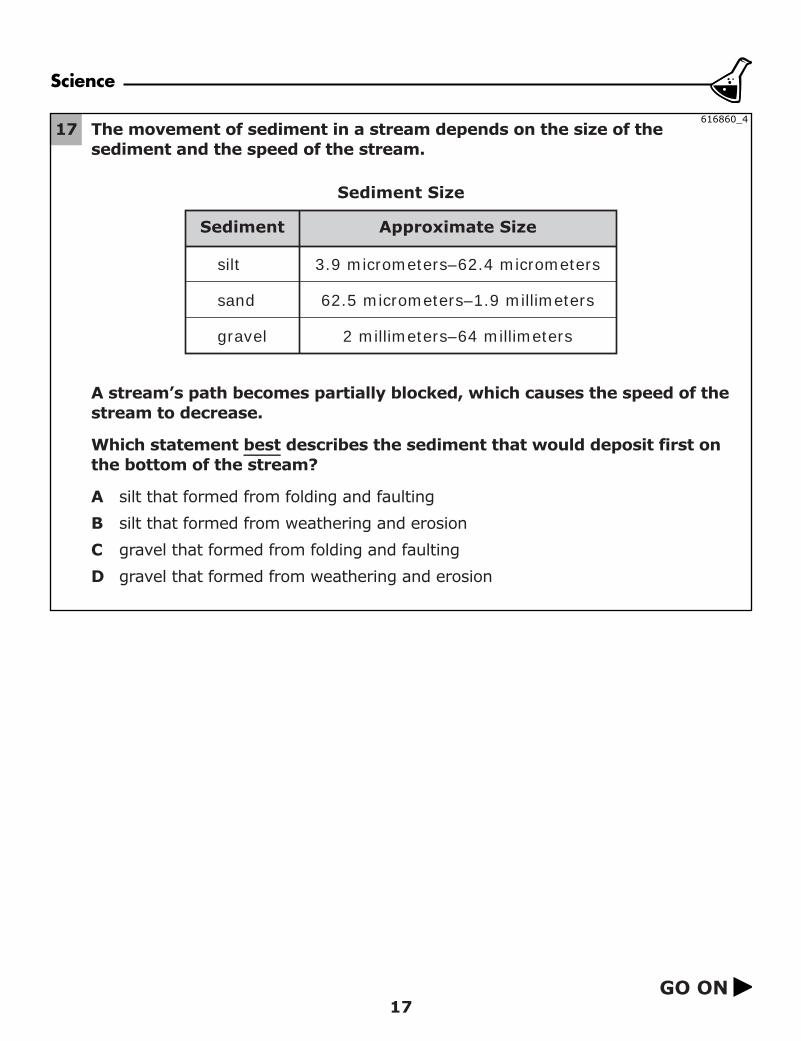
17 The movement of sediment in a stream depends on the size of thesediment and the speed of the stream.
A stream’s path becomes partially blocked, which causes the speed of thestream to decrease.
Which statement best describes the sediment that would deposit first onthe bottom of the stream?
A silt that formed from folding and faulting
B silt that formed from weathering and erosion
C gravel that formed from folding and faulting
D gravel that formed from weathering and erosion
Sediment Size
Sediment Approximate Size
silt
sand
gravel
3.9 micrometers–62.4 micrometers
62.5 micrometers–1.9 millimeters
2 millimeters–64 millimeters
616860_4
GO ON
Science
18
18
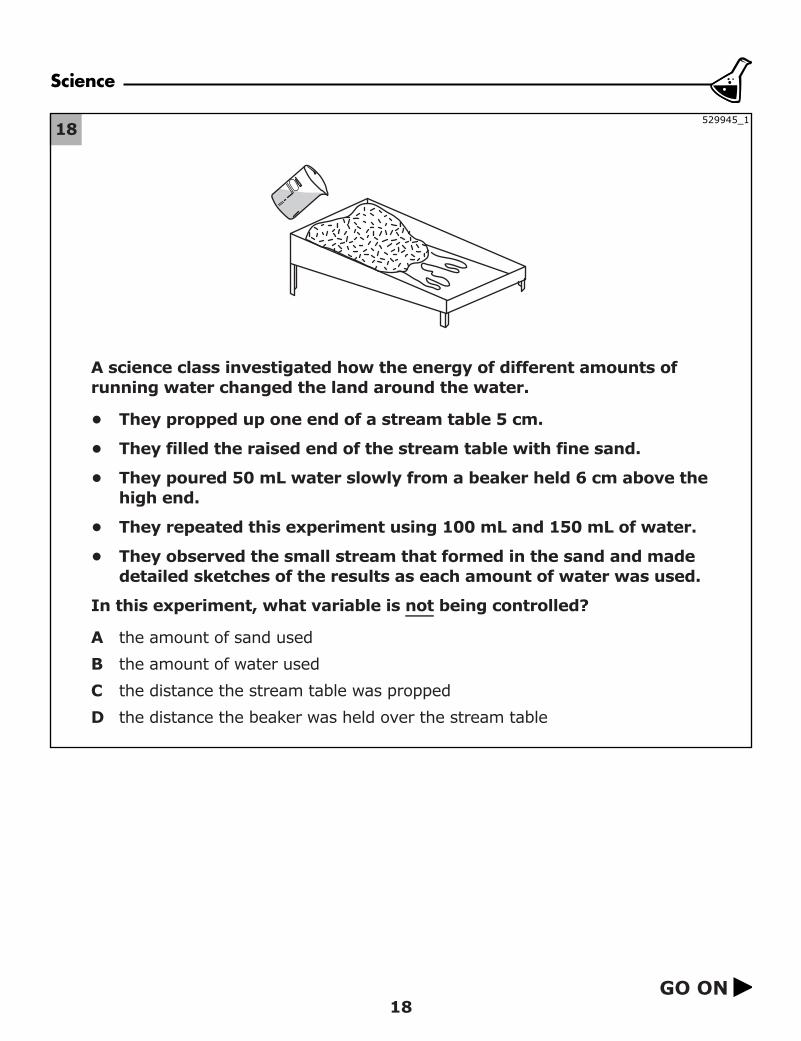
A science class investigated how the energy of different amounts ofrunning water changed the land around the water.
• They propped up one end of a stream table 5 cm.
• They filled the raised end of the stream table with fine sand.
• They poured 50 mL water slowly from a beaker held 6 cm above thehigh end.
• They repeated this experiment using 100 mL and 150 mL of water.
• They observed the small stream that formed in the sand and madedetailed sketches of the results as each amount of water was used.
In this experiment, what variable is not being controlled?
A the amount of sand used
B the amount of water used
C the distance the stream table was propped
D the distance the beaker was held over the stream table
529945_1
GO ON
Science
19
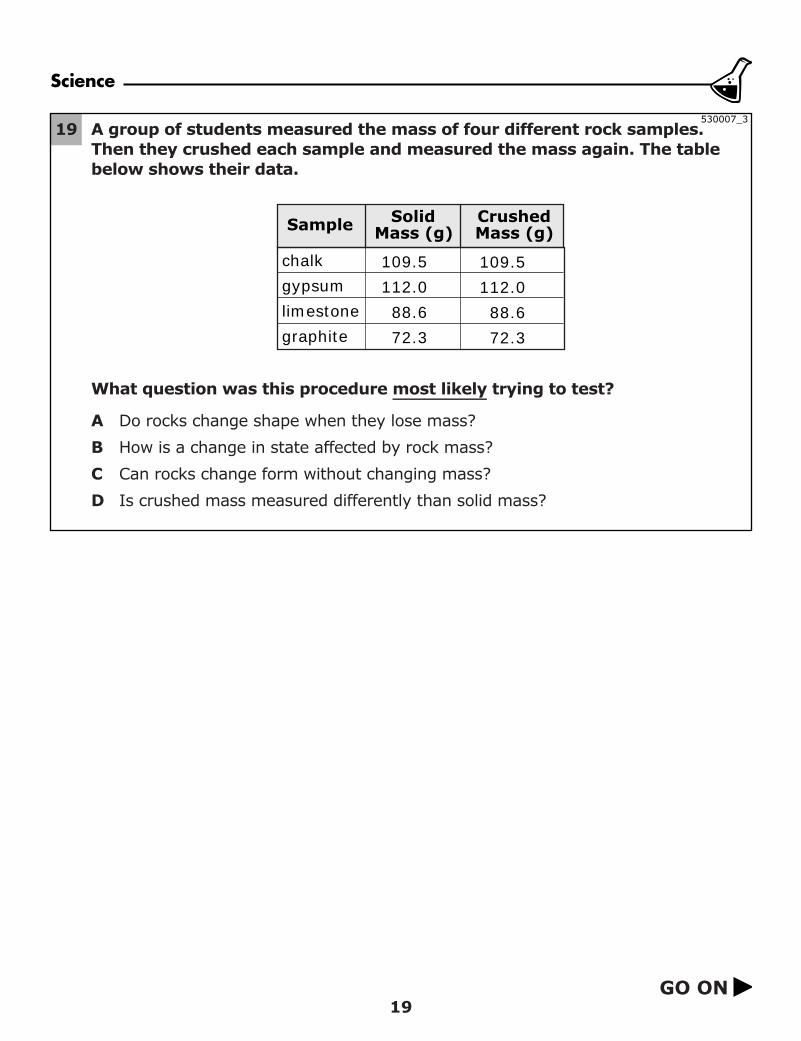
19 A group of students measured the mass of four different rock samples.Then they crushed each sample and measured the mass again. The tablebelow shows their data.
What question was this procedure most likely trying to test?
A Do rocks change shape when they lose mass?
B How is a change in state affected by rock mass?
C Can rocks change form without changing mass?
D Is crushed mass measured differently than solid mass?
Sample
chalkgypsumlimestonegraphite
SolidMass (g)
CrushedMass (g)
109.5112.088.672.3
109.5112.088.672.3
530007_3
GO ON
Science
20
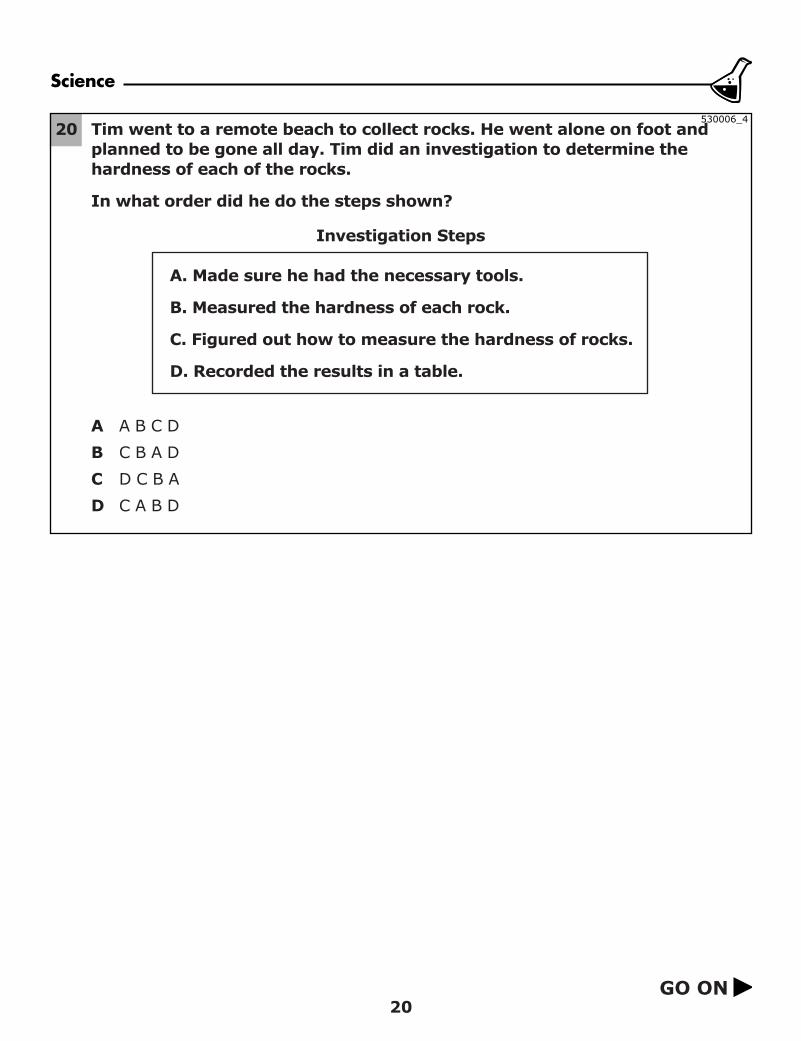
20 Tim went to a remote beach to collect rocks. He went alone on foot andplanned to be gone all day. Tim did an investigation to determine thehardness of each of the rocks.
In what order did he do the steps shown?
Investigation Steps
A. Made sure he had the necessary tools.
B. Measured the hardness of each rock.
C. Figured out how to measure the hardness of rocks.
D. Recorded the results in a table.
A A B C D
B C B A D
C D C B A
D C A B D
530006_4
Science
21GO ONGO ON
21
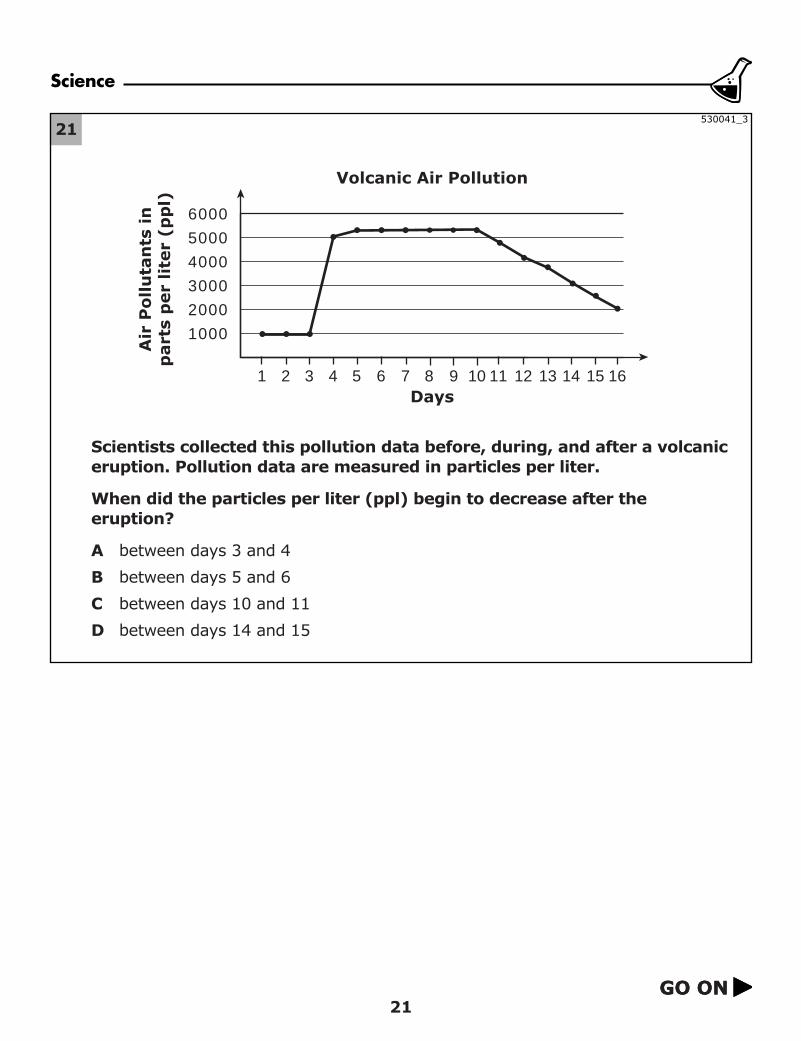
Scientists collected this pollution data before, during, and after a volcaniceruption. Pollution data are measured in particles per liter.
When did the particles per liter (ppl) begin to decrease after theeruption?
A between days 3 and 4
B between days 5 and 6
C between days 10 and 11
D between days 14 and 15
600050004000300020001000
Days
Volcanic Air Pollution
Air
Pol
luta
nts
inp
arts
per
lite
r (p
pl)
1 2 3 4 5 6 7 8 9 1011 12 13 14 15 16
530041_3
Science
22GO ONGO ON
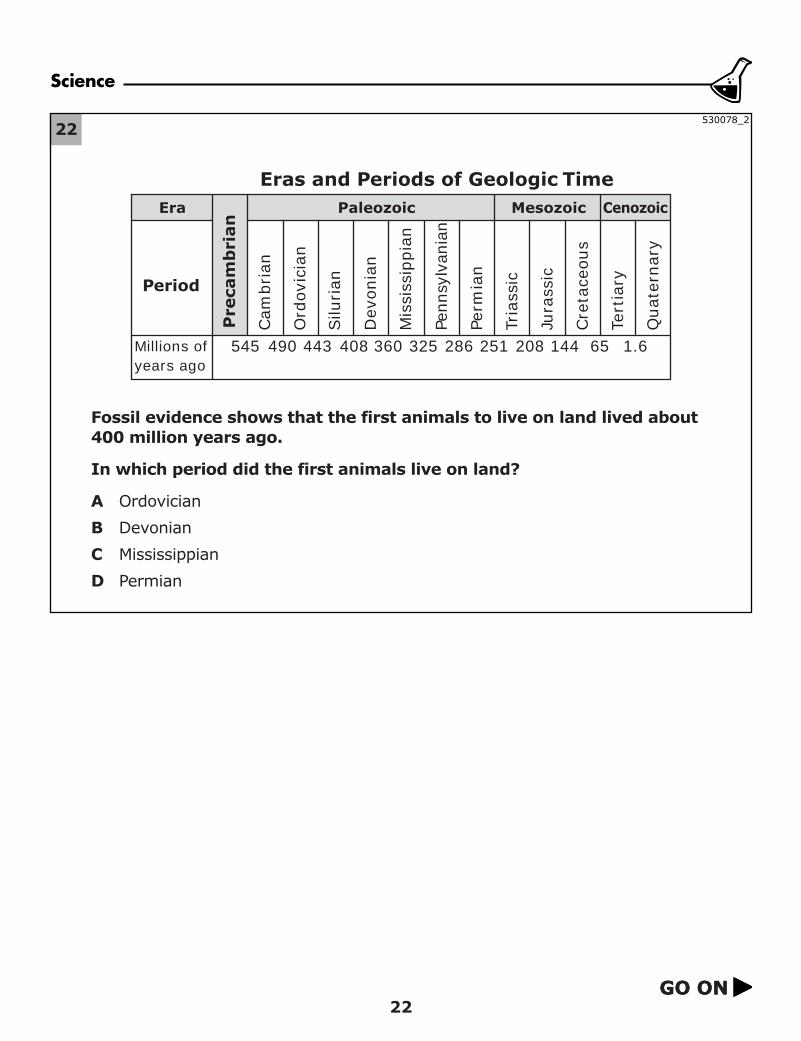
22
Fossil evidence shows that the first animals to live on land lived about400 million years ago.
In which period did the first animals live on land?
A Ordovician
B Devonian
C Mississippian
D Permian
Pre
cam
bri
an
Qua
tern
ary
Tert
iary
Cre
tace
ous
Jura
ssic
Tria
ssic
Perm
ian
Penn
sylv
ania
n
Mis
siss
ippi
an
Dev
onia
n
Silu
rian
Ord
ovic
ian
Cam
bria
nPeriod
Millions ofyears ago
545
Eras and Periods of Geologic TimeCenozoicMesozoicPaleozoicEra
490 443 408 360 325 286 251 208 144 65 1.6
530078_2
Science
23GO ONGO ON
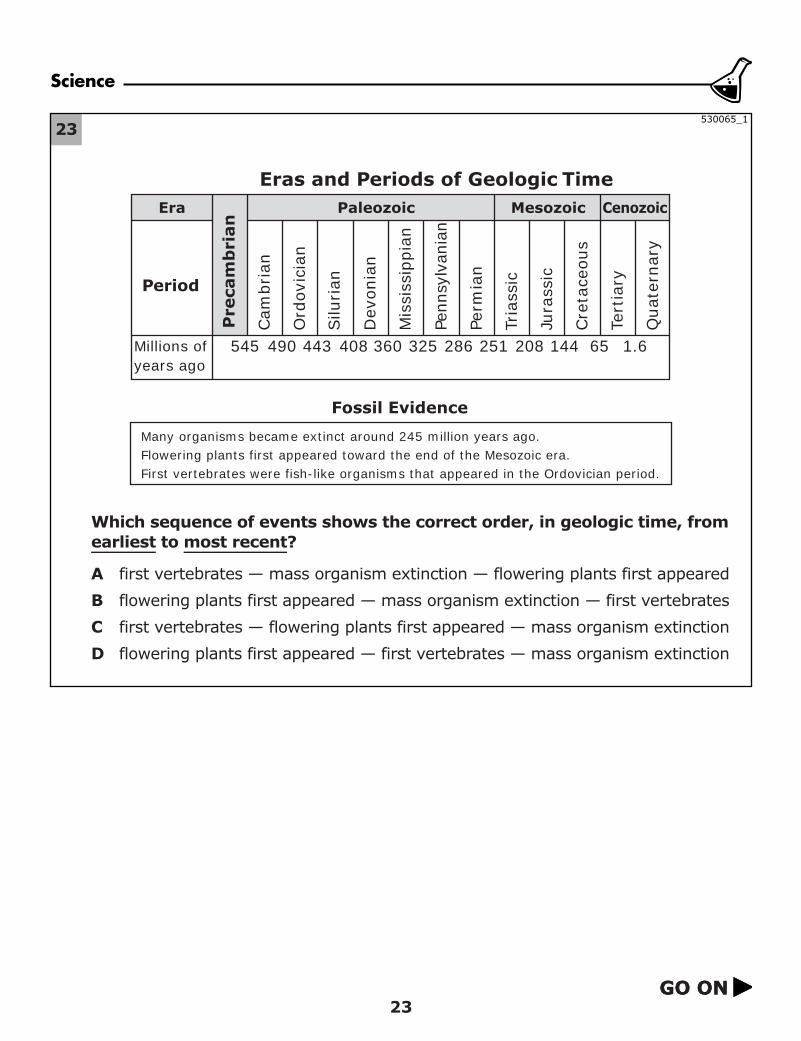
23
Which sequence of events shows the correct order, in geologic time, fromearliest to most recent?
A first vertebrates — mass organism extinction — flowering plants first appeared
B flowering plants first appeared — mass organism extinction — first vertebrates
C first vertebrates — flowering plants first appeared — mass organism extinction
D flowering plants first appeared — first vertebrates — mass organism extinction
Pre
cam
bri
an
Qua
tern
ary
Tert
iary
Cre
tace
ous
Jura
ssic
Tria
ssic
Perm
ian
Penn
sylv
ania
n
Mis
siss
ippi
an
Dev
onia
n
Silu
rian
Ord
ovic
ian
Cam
bria
nPeriod
Millions ofyears ago
545
Eras and Periods of Geologic TimeCenozoicMesozoicPaleozoicEra
490 443 408 360 325 286 251 208 144 65 1.6
Fossil Evidence
Many organisms became extinct around 245 million years ago.Flowering plants first appeared toward the end of the Mesozoic era.First vertebrates were fish-like organisms that appeared in the Ordovician period.
530065_1
Science
24GO ONGO ON
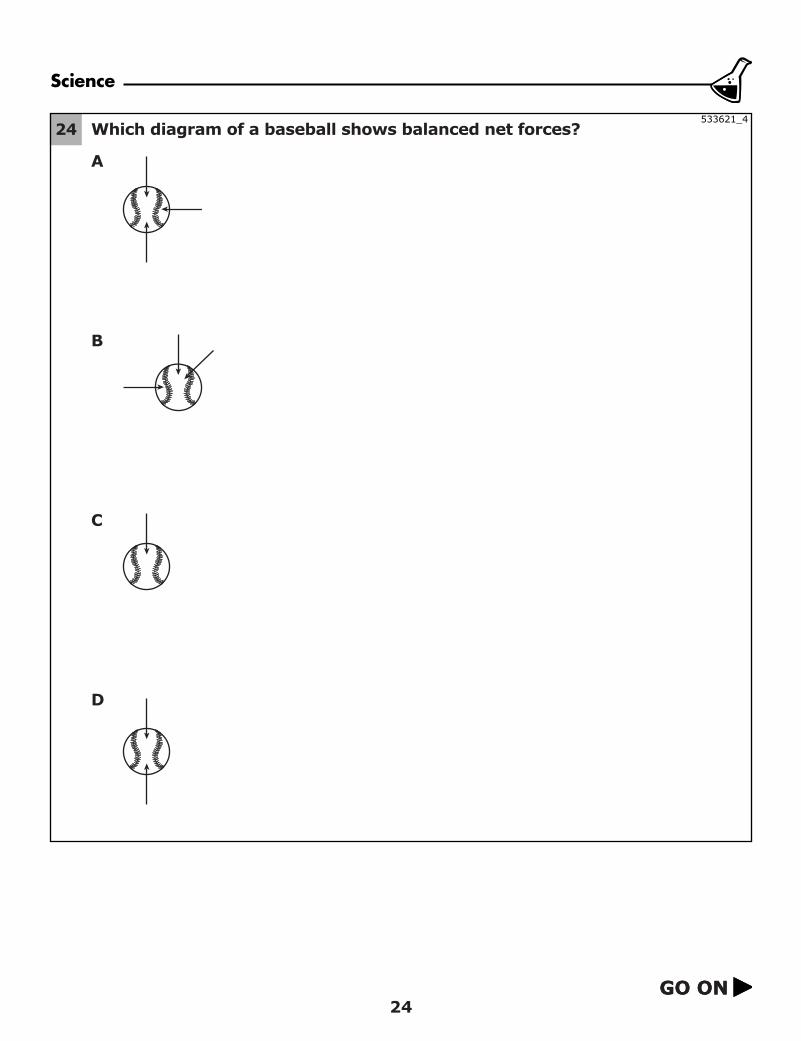
24 Which diagram of a baseball shows balanced net forces?
A
B
C
D
533621_4
Science
25STOP
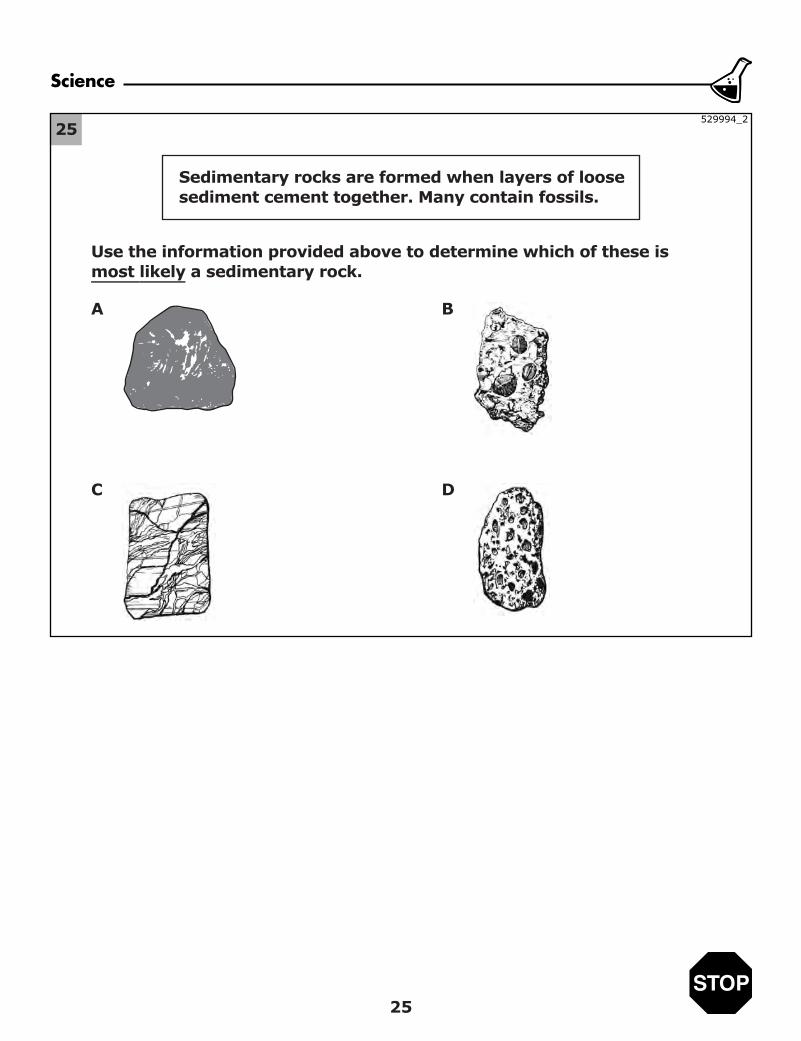
25
Sedimentary rocks are formed when layers of loosesediment cement together. Many contain fossils.
Use the information provided above to determine which of these ismost likely a sedimentary rock.
529994_2
A B
C D

ISD3602538263 1 2 3 4 5 A B C D E Printed in the USA1 2 3 4 5 A B C D E Printed in the USA