Embed Size (px)
Citation preview
Milliman Report
Chase Center/Circle 111 Monument Circle Suite 601 Indianapolis, IN 46204 USA Tel +1 317 639 1000 Fax +1 317 639 1001
milliman.com
Oklahoma State Innovation Model
Insurance Market Analysis
Discussion Draft
Prepared for
Oklahoma State Department of Health
Center for Health Innovation and Effectiveness
August 31, 2015
Prepared by: Jeremy D. Palmer FSA, MAAA Principal and Consulting Actuary Paul R. Houchens FSA, MAAA Principal and Consulting Actuary Jason A. Clarkson FSA, MAAA Consulting Actuary
Milliman Report
Oklahoma State Department of Health Oklahoma State Innovation Model Insurance Market Analysis – Discussion Draft August 31, 2015
Table of Contents
I. Executive Summary ........................................................................................................... 1
II. Background ........................................................................................................................ 5
III. Insurance Market Overview............................................................................................... 6
A. Enrollment Trends and Uninsured Rates .................................................................................... 6 B. Population Demographic Breakdown .......................................................................................... 9 C. Population Morbidity Analysis .................................................................................................... 13 D. Insurance Market Characteristics ................................................................................................ 16
IV. Federally Facilitated Marketplace Analysis ..................................................................... 27
A. Individual Marketplace .................................................................................................................. 27 B. SHOP Marketplace ........................................................................................................................ 50
V. Insurance Carrier Market Share and Financial Performance ......................................... 54
A. Individual, Small Group, and Large Group Insurance ............................................................ 55 B. Medicare Advantage ...................................................................................................................... 59
VI. Alternatives for Reducing the Uninsured Rate ............................................................... 62
A. Basic Health Plan ........................................................................................................................... 62 B. State Innovation Waiver ............................................................................................................... 64
VII. Methodology and Assumptions ....................................................................................... 66
A. Population Projection Modeling .................................................................................................. 66 B. Insurance Carrier Financial Information .................................................................................... 68 C. Population Health Status Analysis .............................................................................................. 69
VIII.Data Reliance .................................................................................................................. 70
IX. Limitations and Qualifications ........................................................................................ 71
X. Glossary ............................................................................................................................ 72
XI. List of Acronyms .............................................................................................................. 76
Appendix 1: Uninsured Estimates – Discussion of Variance among Data Sources Appendix 2: Summary of Insurance Carrier Financial Results in the Oklahoma Health Insurance Market for Calendar Years 2012 through 2014
1 Oklahoma State Department of Health Oklahoma State Innovation Model Insurance Market Analysis – Discussion Draft August 31, 2015
Milliman Report
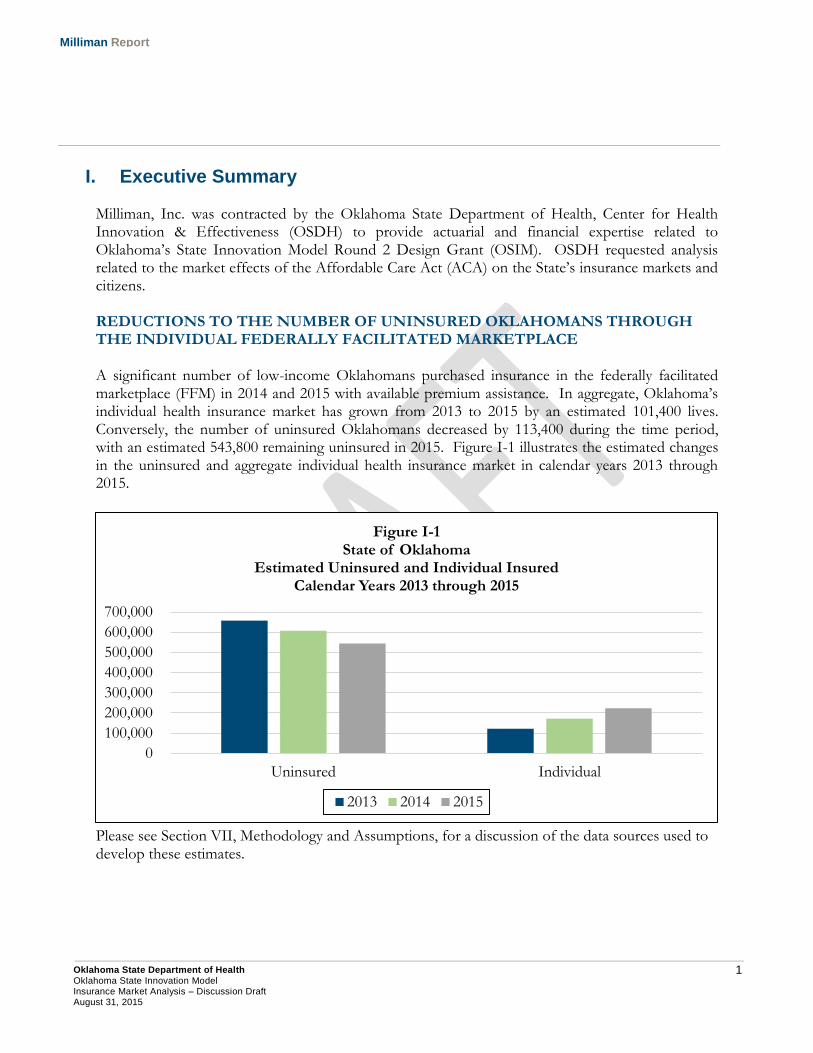
I. Executive Summary Milliman, Inc. was contracted by the Oklahoma State Department of Health, Center for Health Innovation & Effectiveness (OSDH) to provide actuarial and financial expertise related to Oklahoma’s State Innovation Model Round 2 Design Grant (OSIM). OSDH requested analysis related to the market effects of the Affordable Care Act (ACA) on the State’s insurance markets and citizens. REDUCTIONS TO THE NUMBER OF UNINSURED OKLAHOMANS THROUGH THE INDIVIDUAL FEDERALLY FACILITATED MARKETPLACE A significant number of low-income Oklahomans purchased insurance in the federally facilitated marketplace (FFM) in 2014 and 2015 with available premium assistance. In aggregate, Oklahoma’s individual health insurance market has grown from 2013 to 2015 by an estimated 101,400 lives. Conversely, the number of uninsured Oklahomans decreased by 113,400 during the time period, with an estimated 543,800 remaining uninsured in 2015. Figure I-1 illustrates the estimated changes in the uninsured and aggregate individual health insurance market in calendar years 2013 through 2015.
Please see Section VII, Methodology and Assumptions, for a discussion of the data sources used to develop these estimates.
0
100,000
200,000
300,000
400,000
500,000
600,000
700,000
Uninsured Individual
Figure I-1 State of Oklahoma
Estimated Uninsured and Individual Insured Calendar Years 2013 through 2015
2013 2014 2015
2 Oklahoma State Department of Health Oklahoma State Innovation Model Insurance Market Analysis – Discussion Draft August 31, 2015
Milliman Report
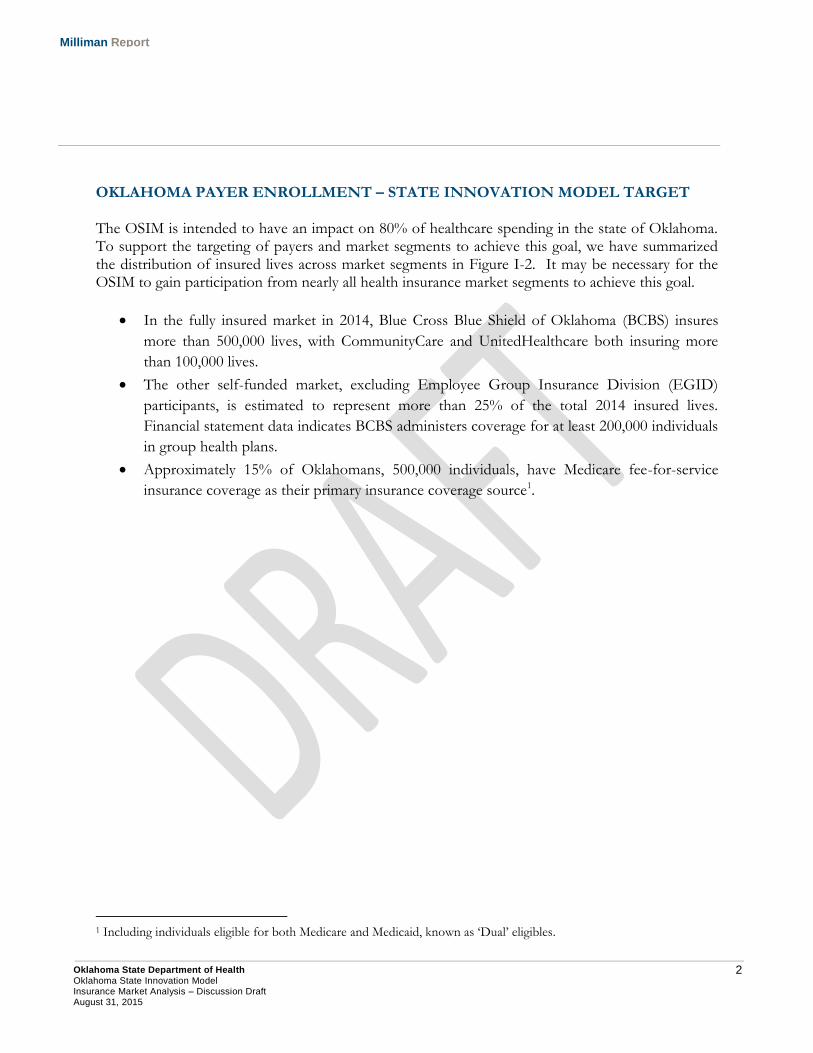
OKLAHOMA PAYER ENROLLMENT – STATE INNOVATION MODEL TARGET The OSIM is intended to have an impact on 80% of healthcare spending in the state of Oklahoma. To support the targeting of payers and market segments to achieve this goal, we have summarized the distribution of insured lives across market segments in Figure I-2. It may be necessary for the OSIM to gain participation from nearly all health insurance market segments to achieve this goal.
In the fully insured market in 2014, Blue Cross Blue Shield of Oklahoma (BCBS) insures
more than 500,000 lives, with CommunityCare and UnitedHealthcare both insuring more
than 100,000 lives.
The other self-funded market, excluding Employee Group Insurance Division (EGID)
participants, is estimated to represent more than 25% of the total 2014 insured lives.
Financial statement data indicates BCBS administers coverage for at least 200,000 individuals
in group health plans.
Approximately 15% of Oklahomans, 500,000 individuals, have Medicare fee-for-service
insurance coverage as their primary insurance coverage source1.
1 Including individuals eligible for both Medicare and Medicaid, known as ‘Dual’ eligibles.
3 Oklahoma State Department of Health Oklahoma State Innovation Model Insurance Market Analysis – Discussion Draft August 31, 2015
Milliman Report
Notes: 1. Fully insured values include enrollment in both the individual and group health insurance markets, as well as
Medicare Advantage. 2. EGID (Employee Group Insurance Division). 3. Please see Section VII, Methodology and Assumptions, for an explanation of the process and data sources used
to develop the above values.
CONCERNS EXIST RELATED TO 2016 INSURER COMPETITION AND PREMIUM RATES IN THE INDIVIDUAL FEDERALLY FACILITATED MARKETPLACE While Blue Cross and Blue Shield of Oklahoma (BCBS) insured the majority of lives in the commercial health insurance market prior to 2014, BCBS’ 2015 market share in the FFM has likely exceeded 90%2. While many states have seen additional insurers enter the commercial market through the FFM, Oklahoma may see insurers exit the market after offering coverage in 2014 or 2015. BCBS may face increased competition in 2016 as a major national health insurer may enter the market3.
BCBS is requesting preliminary 2016 rate increases in excess of 20% for its individual ACA market business as a result of poor financial experience in 20144.
2 Please see Figure III-10 on page 17 for additional information on this estimate. 3 See http://journalrecord.com/2015/07/02/up-ahead-turnover-of-insurers-on-health-market-health-care/ for additional information. 4 Requested rate increases greater than 10% may be viewed at https://ratereview.healthcare.gov/.
4 Oklahoma State Department of Health Oklahoma State Innovation Model Insurance Market Analysis – Discussion Draft August 31, 2015
Milliman Report
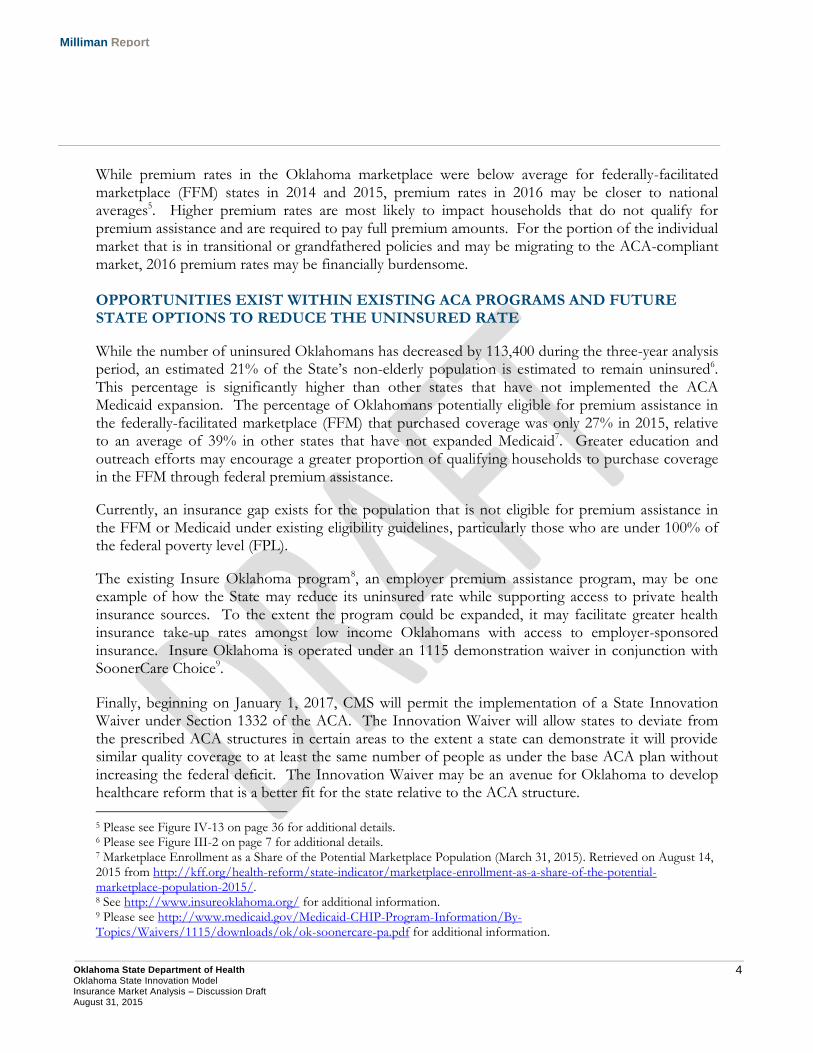
While premium rates in the Oklahoma marketplace were below average for federally-facilitated marketplace (FFM) states in 2014 and 2015, premium rates in 2016 may be closer to national averages5. Higher premium rates are most likely to impact households that do not qualify for premium assistance and are required to pay full premium amounts. For the portion of the individual market that is in transitional or grandfathered policies and may be migrating to the ACA-compliant market, 2016 premium rates may be financially burdensome. OPPORTUNITIES EXIST WITHIN EXISTING ACA PROGRAMS AND FUTURE STATE OPTIONS TO REDUCE THE UNINSURED RATE
While the number of uninsured Oklahomans has decreased by 113,400 during the three-year analysis period, an estimated 21% of the State’s non-elderly population is estimated to remain uninsured6. This percentage is significantly higher than other states that have not implemented the ACA Medicaid expansion. The percentage of Oklahomans potentially eligible for premium assistance in the federally-facilitated marketplace (FFM) that purchased coverage was only 27% in 2015, relative to an average of 39% in other states that have not expanded Medicaid7. Greater education and outreach efforts may encourage a greater proportion of qualifying households to purchase coverage in the FFM through federal premium assistance.
Currently, an insurance gap exists for the population that is not eligible for premium assistance in the FFM or Medicaid under existing eligibility guidelines, particularly those who are under 100% of the federal poverty level (FPL).
The existing Insure Oklahoma program8, an employer premium assistance program, may be one example of how the State may reduce its uninsured rate while supporting access to private health insurance sources. To the extent the program could be expanded, it may facilitate greater health insurance take-up rates amongst low income Oklahomans with access to employer-sponsored insurance. Insure Oklahoma is operated under an 1115 demonstration waiver in conjunction with SoonerCare Choice9.
Finally, beginning on January 1, 2017, CMS will permit the implementation of a State Innovation Waiver under Section 1332 of the ACA. The Innovation Waiver will allow states to deviate from the prescribed ACA structures in certain areas to the extent a state can demonstrate it will provide similar quality coverage to at least the same number of people as under the base ACA plan without increasing the federal deficit. The Innovation Waiver may be an avenue for Oklahoma to develop healthcare reform that is a better fit for the state relative to the ACA structure.
5 Please see Figure IV-13 on page 36 for additional details. 6 Please see Figure III-2 on page 7 for additional details. 7 Marketplace Enrollment as a Share of the Potential Marketplace Population (March 31, 2015). Retrieved on August 14, 2015 from http://kff.org/health-reform/state-indicator/marketplace-enrollment-as-a-share-of-the-potential-marketplace-population-2015/. 8 See http://www.insureoklahoma.org/ for additional information. 9 Please see http://www.medicaid.gov/Medicaid-CHIP-Program-Information/By-Topics/Waivers/1115/downloads/ok/ok-soonercare-pa.pdf for additional information.
5 Oklahoma State Department of Health Oklahoma State Innovation Model Insurance Market Analysis – Discussion Draft August 31, 2015
Milliman Report
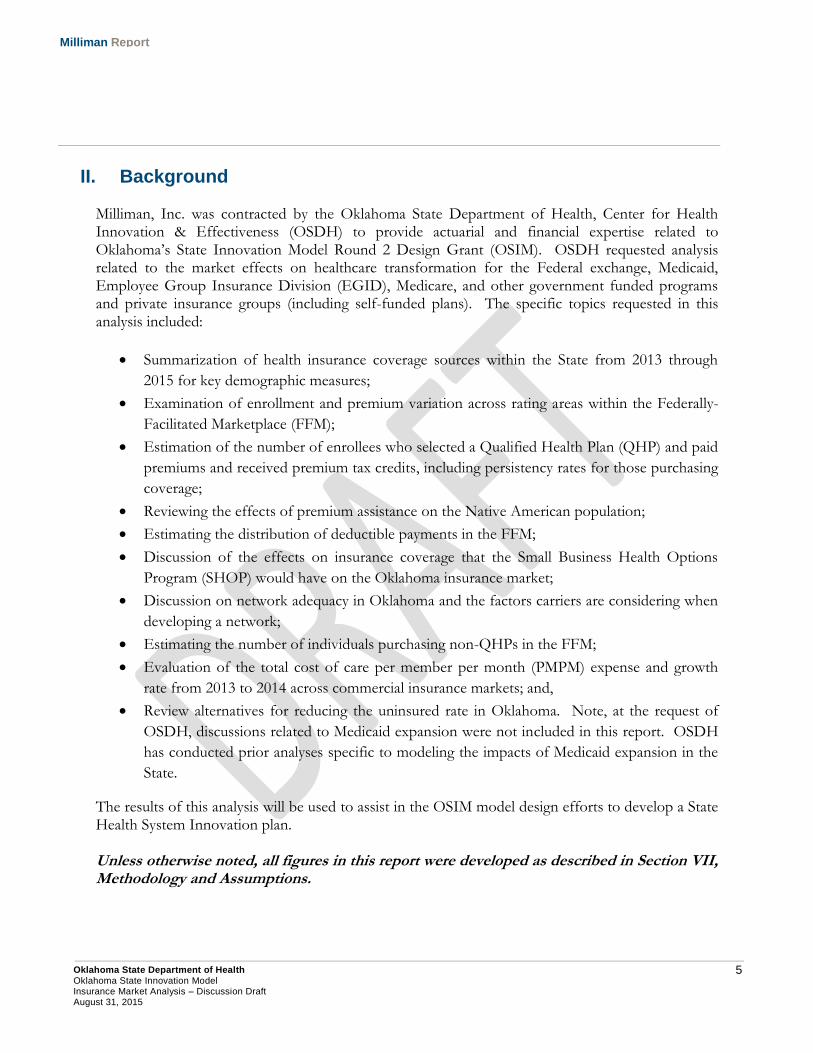
II. Background Milliman, Inc. was contracted by the Oklahoma State Department of Health, Center for Health Innovation & Effectiveness (OSDH) to provide actuarial and financial expertise related to Oklahoma’s State Innovation Model Round 2 Design Grant (OSIM). OSDH requested analysis related to the market effects on healthcare transformation for the Federal exchange, Medicaid, Employee Group Insurance Division (EGID), Medicare, and other government funded programs and private insurance groups (including self-funded plans). The specific topics requested in this analysis included:
Summarization of health insurance coverage sources within the State from 2013 through
2015 for key demographic measures;
Examination of enrollment and premium variation across rating areas within the Federally-
Facilitated Marketplace (FFM);
Estimation of the number of enrollees who selected a Qualified Health Plan (QHP) and paid
premiums and received premium tax credits, including persistency rates for those purchasing
coverage;
Reviewing the effects of premium assistance on the Native American population;
Estimating the distribution of deductible payments in the FFM;
Discussion of the effects on insurance coverage that the Small Business Health Options
Program (SHOP) would have on the Oklahoma insurance market;
Discussion on network adequacy in Oklahoma and the factors carriers are considering when
developing a network;
Estimating the number of individuals purchasing non-QHPs in the FFM;
Evaluation of the total cost of care per member per month (PMPM) expense and growth
rate from 2013 to 2014 across commercial insurance markets; and,
Review alternatives for reducing the uninsured rate in Oklahoma. Note, at the request of
OSDH, discussions related to Medicaid expansion were not included in this report. OSDH
has conducted prior analyses specific to modeling the impacts of Medicaid expansion in the
State.
The results of this analysis will be used to assist in the OSIM model design efforts to develop a State Health System Innovation plan. Unless otherwise noted, all figures in this report were developed as described in Section VII, Methodology and Assumptions.
6 Oklahoma State Department of Health Oklahoma State Innovation Model Insurance Market Analysis – Discussion Draft August 31, 2015
Milliman Report
III. Insurance Market Overview
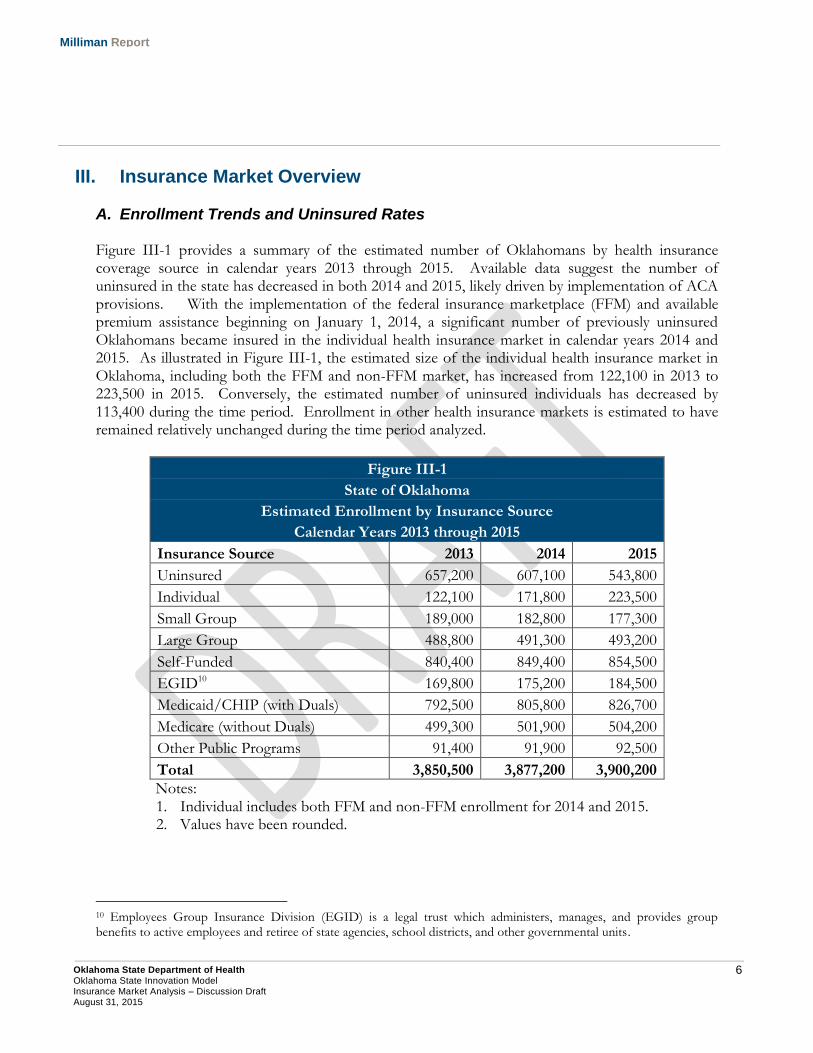
A. Enrollment Trends and Uninsured Rates Figure III-1 provides a summary of the estimated number of Oklahomans by health insurance coverage source in calendar years 2013 through 2015. Available data suggest the number of uninsured in the state has decreased in both 2014 and 2015, likely driven by implementation of ACA provisions. With the implementation of the federal insurance marketplace (FFM) and available premium assistance beginning on January 1, 2014, a significant number of previously uninsured Oklahomans became insured in the individual health insurance market in calendar years 2014 and 2015. As illustrated in Figure III-1, the estimated size of the individual health insurance market in Oklahoma, including both the FFM and non-FFM market, has increased from 122,100 in 2013 to 223,500 in 2015. Conversely, the estimated number of uninsured individuals has decreased by 113,400 during the time period. Enrollment in other health insurance markets is estimated to have remained relatively unchanged during the time period analyzed.
Figure III-1
State of Oklahoma
Estimated Enrollment by Insurance Source
Calendar Years 2013 through 2015
Insurance Source 2013 2014 2015
Uninsured 657,200 607,100 543,800
Individual 122,100 171,800 223,500
Small Group 189,000 182,800 177,300
Large Group 488,800 491,300 493,200
Self-Funded 840,400 849,400 854,500
EGID10 169,800 175,200 184,500
Medicaid/CHIP (with Duals) 792,500 805,800 826,700
Medicare (without Duals) 499,300 501,900 504,200
Other Public Programs 91,400 91,900 92,500
Total 3,850,500 3,877,200 3,900,200
Notes: 1. Individual includes both FFM and non-FFM enrollment for 2014 and 2015. 2. Values have been rounded.
10 Employees Group Insurance Division (EGID) is a legal trust which administers, manages, and provides group benefits to active employees and retiree of state agencies, school districts, and other governmental units.
7 Oklahoma State Department of Health Oklahoma State Innovation Model Insurance Market Analysis – Discussion Draft August 31, 2015
Milliman Report
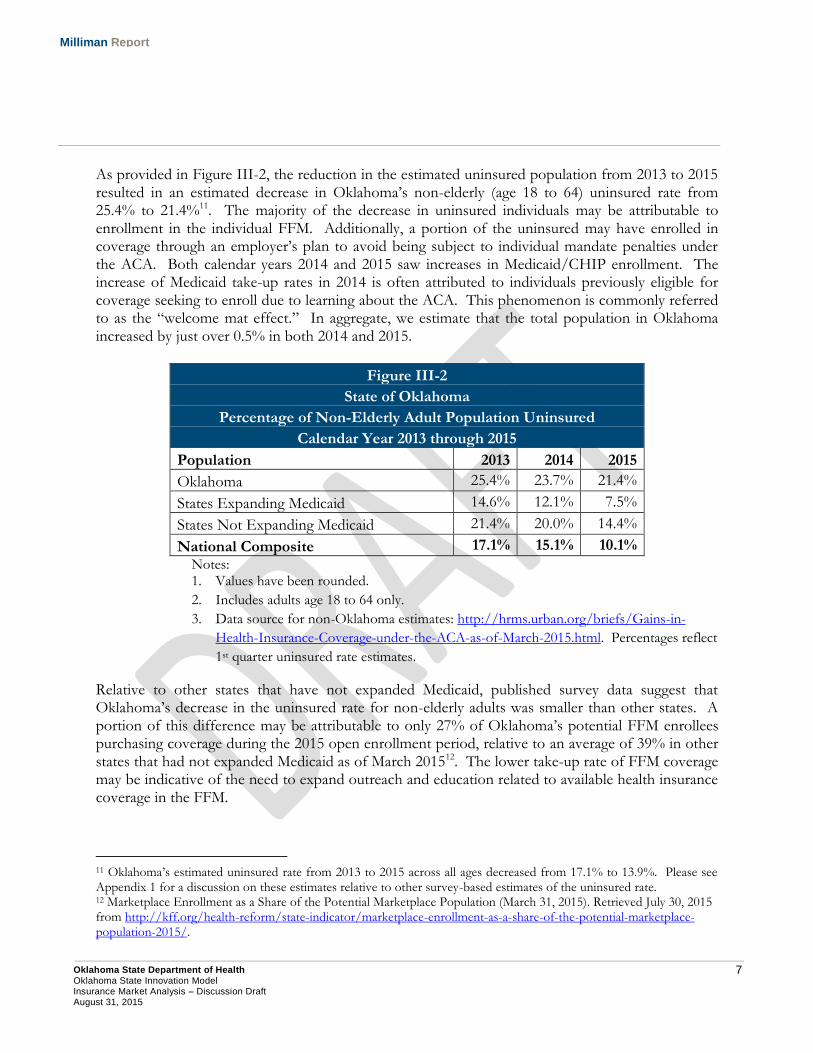
As provided in Figure III-2, the reduction in the estimated uninsured population from 2013 to 2015 resulted in an estimated decrease in Oklahoma’s non-elderly (age 18 to 64) uninsured rate from 25.4% to 21.4%11. The majority of the decrease in uninsured individuals may be attributable to enrollment in the individual FFM. Additionally, a portion of the uninsured may have enrolled in coverage through an employer’s plan to avoid being subject to individual mandate penalties under the ACA. Both calendar years 2014 and 2015 saw increases in Medicaid/CHIP enrollment. The increase of Medicaid take-up rates in 2014 is often attributed to individuals previously eligible for coverage seeking to enroll due to learning about the ACA. This phenomenon is commonly referred to as the “welcome mat effect.” In aggregate, we estimate that the total population in Oklahoma increased by just over 0.5% in both 2014 and 2015.
Figure III-2
State of Oklahoma
Percentage of Non-Elderly Adult Population Uninsured
Calendar Year 2013 through 2015
Population 2013 2014 2015
Oklahoma 25.4% 23.7% 21.4%
States Expanding Medicaid 14.6% 12.1% 7.5%
States Not Expanding Medicaid 21.4% 20.0% 14.4%
National Composite 17.1% 15.1% 10.1%
Notes: 1. Values have been rounded.
2. Includes adults age 18 to 64 only.
3. Data source for non-Oklahoma estimates: http://hrms.urban.org/briefs/Gains-in-
Health-Insurance-Coverage-under-the-ACA-as-of-March-2015.html. Percentages reflect
1st quarter uninsured rate estimates.
Relative to other states that have not expanded Medicaid, published survey data suggest that Oklahoma’s decrease in the uninsured rate for non-elderly adults was smaller than other states. A portion of this difference may be attributable to only 27% of Oklahoma’s potential FFM enrollees purchasing coverage during the 2015 open enrollment period, relative to an average of 39% in other states that had not expanded Medicaid as of March 201512. The lower take-up rate of FFM coverage may be indicative of the need to expand outreach and education related to available health insurance coverage in the FFM.
11 Oklahoma’s estimated uninsured rate from 2013 to 2015 across all ages decreased from 17.1% to 13.9%. Please see Appendix 1 for a discussion on these estimates relative to other survey-based estimates of the uninsured rate. 12 Marketplace Enrollment as a Share of the Potential Marketplace Population (March 31, 2015). Retrieved July 30, 2015 from http://kff.org/health-reform/state-indicator/marketplace-enrollment-as-a-share-of-the-potential-marketplace-population-2015/.
8 Oklahoma State Department of Health Oklahoma State Innovation Model Insurance Market Analysis – Discussion Draft August 31, 2015
Milliman Report
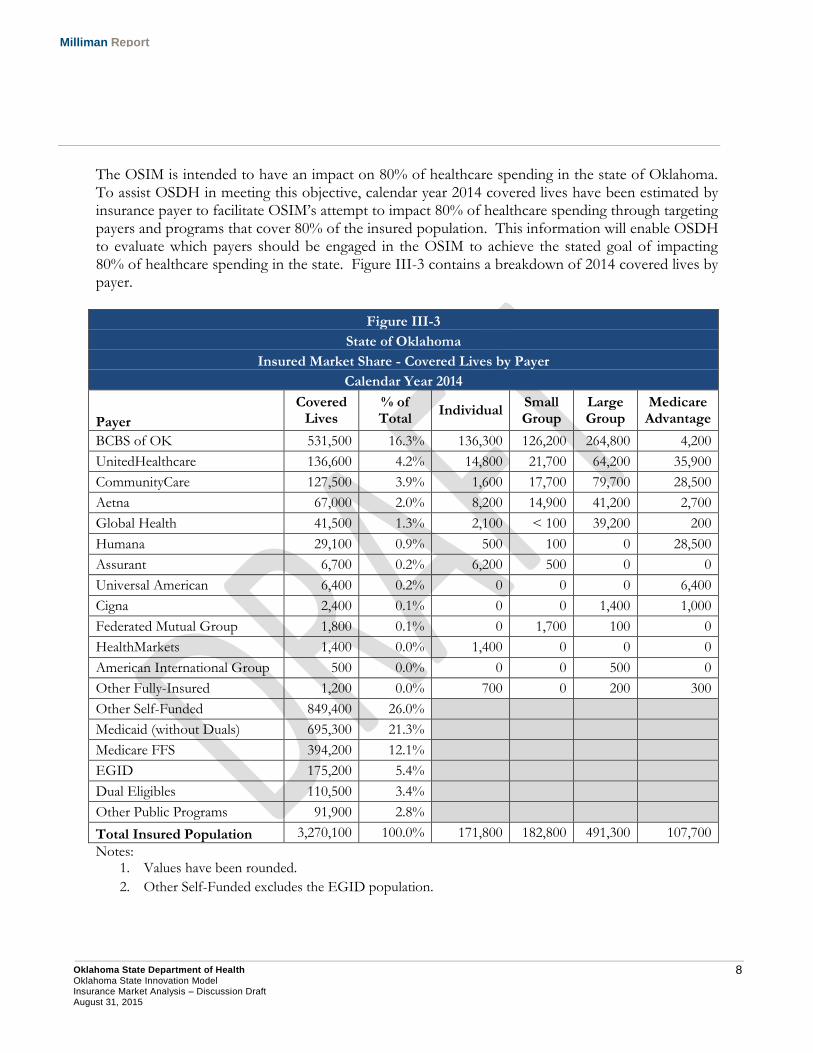
The OSIM is intended to have an impact on 80% of healthcare spending in the state of Oklahoma. To assist OSDH in meeting this objective, calendar year 2014 covered lives have been estimated by insurance payer to facilitate OSIM’s attempt to impact 80% of healthcare spending through targeting payers and programs that cover 80% of the insured population. This information will enable OSDH to evaluate which payers should be engaged in the OSIM to achieve the stated goal of impacting 80% of healthcare spending in the state. Figure III-3 contains a breakdown of 2014 covered lives by payer.
Figure III-3
State of Oklahoma
Insured Market Share - Covered Lives by Payer
Calendar Year 2014
Payer
Covered Lives
% of Total
Individual Small Group
Large Group
Medicare Advantage
BCBS of OK 531,500 16.3% 136,300 126,200 264,800 4,200
UnitedHealthcare 136,600 4.2% 14,800 21,700 64,200 35,900
CommunityCare 127,500 3.9% 1,600 17,700 79,700 28,500
Aetna 67,000 2.0% 8,200 14,900 41,200 2,700
Global Health 41,500 1.3% 2,100 < 100 39,200 200
Humana 29,100 0.9% 500 100 0 28,500
Assurant 6,700 0.2% 6,200 500 0 0
Universal American 6,400 0.2% 0 0 0 6,400
Cigna 2,400 0.1% 0 0 1,400 1,000
Federated Mutual Group 1,800 0.1% 0 1,700 100 0
HealthMarkets 1,400 0.0% 1,400 0 0 0
American International Group 500 0.0% 0 0 500 0
Other Fully-Insured 1,200 0.0% 700 0 200 300
Other Self-Funded 849,400 26.0%
Medicaid (without Duals) 695,300 21.3%
Medicare FFS 394,200 12.1%
EGID 175,200 5.4%
Dual Eligibles 110,500 3.4%
Other Public Programs 91,900 2.8%
Total Insured Population 3,270,100 100.0% 171,800 182,800 491,300 107,700
Notes: 1. Values have been rounded.
2. Other Self-Funded excludes the EGID population.
9 Oklahoma State Department of Health Oklahoma State Innovation Model Insurance Market Analysis – Discussion Draft August 31, 2015
Milliman Report
As illustrated in Figure III-3, approximately 25% of 2014 covered lives were insured through other self-funded employer-sponsored health plans. Based on carrier financial data, we estimate that at least 30% of the other self-funded employer plans in the state of Oklahoma are administered by BCBS or Cigna. With this in mind, OSDH can achieve its engagement goal by including the top six insurance carriers, Medicaid, Medicare, EGID, and public programs in the OSIM.
B. Population Demographic Breakdown The next series of figures provides a breakdown of 2013 through 2015 health insurance coverage sources by key demographic variables, including:
Geographic location (rural vs. urban);
Age group;
Household income (measured as a percentage of the federal poverty level (FPL)); and,
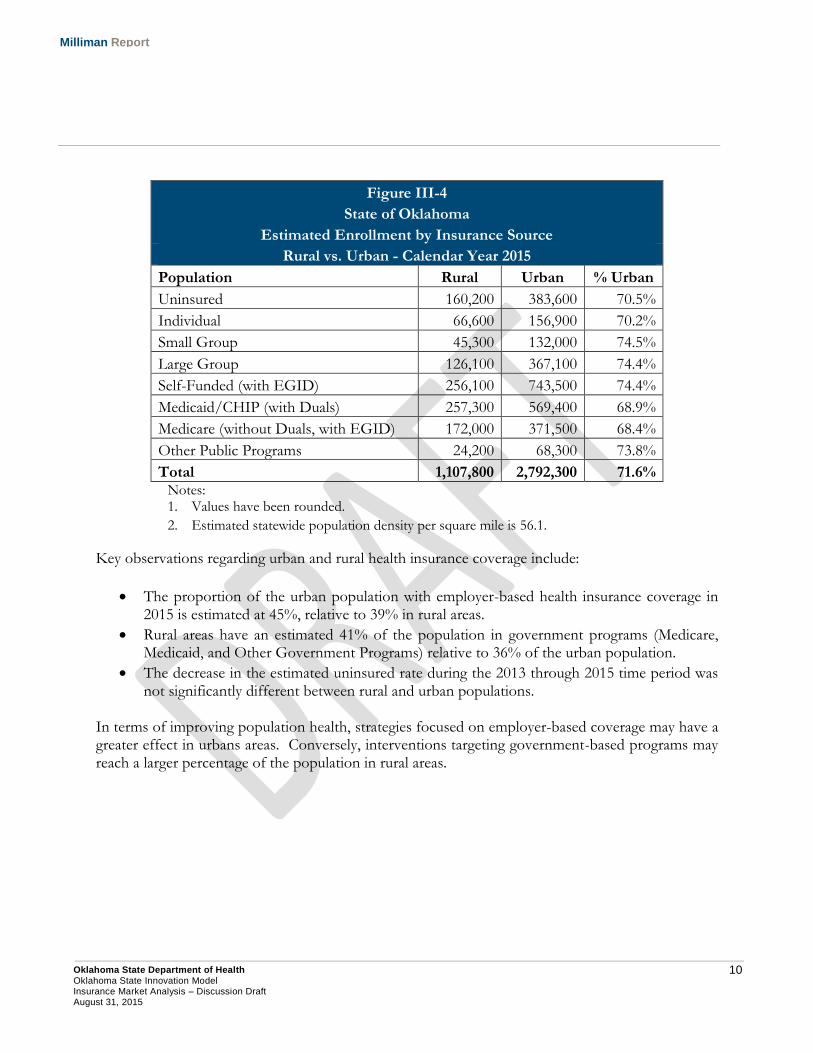
Self-reported health status. This information is helpful in understanding the demographic characteristics of each health insurance market as well as the uninsured population. Such an understanding will assist OSDH in developing population health initiatives that are most appropriate for each insurance market. Geographic Location We estimated enrollment by source of health insurance coverage in 2015 between urban and rural areas. A county was defined as urban to the extent its population density was above the statewide average for Oklahoma. Figure III-4 provides a comparison of the rural vs. urban health insurance coverage sources in 2015.
10 Oklahoma State Department of Health Oklahoma State Innovation Model Insurance Market Analysis – Discussion Draft August 31, 2015
Milliman Report
Figure III-4
State of Oklahoma
Estimated Enrollment by Insurance Source
Rural vs. Urban - Calendar Year 2015
Population Rural Urban % Urban
Uninsured 160,200 383,600 70.5%
Individual 66,600 156,900 70.2%
Small Group 45,300 132,000 74.5%
Large Group 126,100 367,100 74.4%
Self-Funded (with EGID) 256,100 743,500 74.4%
Medicaid/CHIP (with Duals) 257,300 569,400 68.9%
Medicare (without Duals, with EGID) 172,000 371,500 68.4%
Other Public Programs 24,200 68,300 73.8%
Total 1,107,800 2,792,300 71.6% Notes:
1. Values have been rounded.
2. Estimated statewide population density per square mile is 56.1.
Key observations regarding urban and rural health insurance coverage include:
The proportion of the urban population with employer-based health insurance coverage in 2015 is estimated at 45%, relative to 39% in rural areas.
Rural areas have an estimated 41% of the population in government programs (Medicare, Medicaid, and Other Government Programs) relative to 36% of the urban population.
The decrease in the estimated uninsured rate during the 2013 through 2015 time period was not significantly different between rural and urban populations.
In terms of improving population health, strategies focused on employer-based coverage may have a greater effect in urbans areas. Conversely, interventions targeting government-based programs may reach a larger percentage of the population in rural areas.
11 Oklahoma State Department of Health Oklahoma State Innovation Model Insurance Market Analysis – Discussion Draft August 31, 2015
Milliman Report
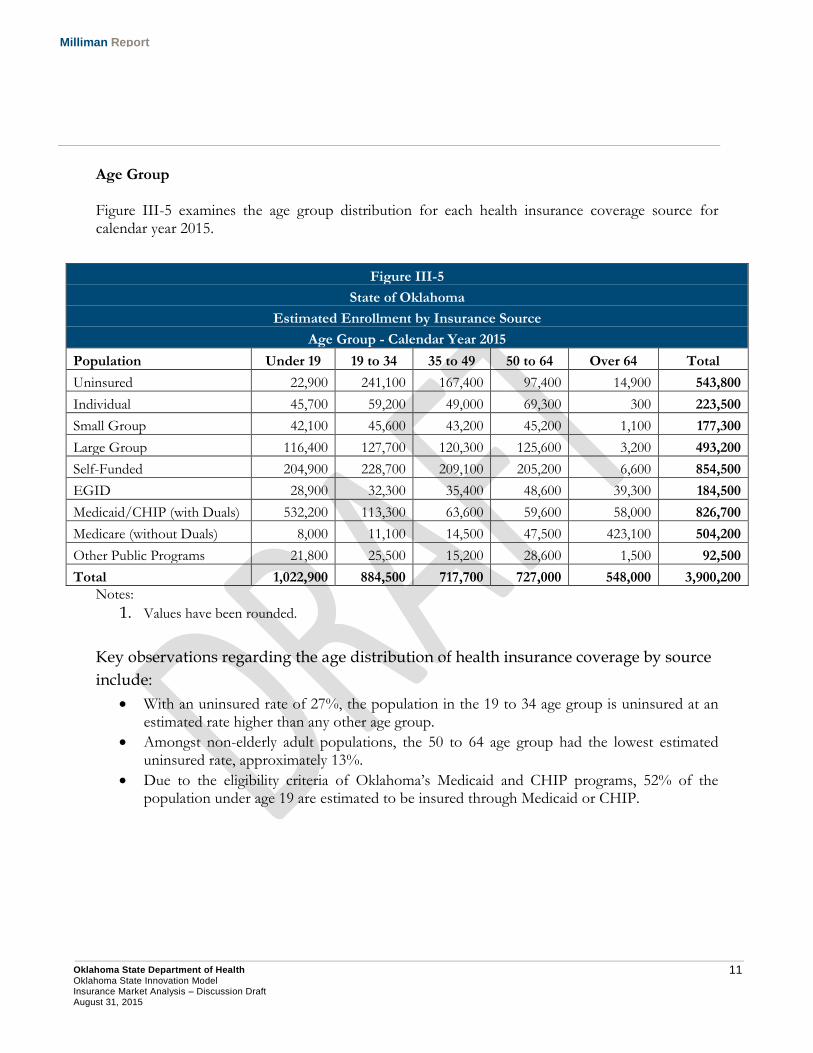
Age Group Figure III-5 examines the age group distribution for each health insurance coverage source for calendar year 2015.
Notes:
1. Values have been rounded.
Key observations regarding the age distribution of health insurance coverage by source
include:
With an uninsured rate of 27%, the population in the 19 to 34 age group is uninsured at an estimated rate higher than any other age group.
Amongst non-elderly adult populations, the 50 to 64 age group had the lowest estimated uninsured rate, approximately 13%.
Due to the eligibility criteria of Oklahoma’s Medicaid and CHIP programs, 52% of the population under age 19 are estimated to be insured through Medicaid or CHIP.
Figure III-5
State of Oklahoma
Estimated Enrollment by Insurance Source
Age Group - Calendar Year 2015
Population Under 19 19 to 34 35 to 49 50 to 64 Over 64 Total
Uninsured 22,900 241,100 167,400 97,400 14,900 543,800
Individual 45,700 59,200 49,000 69,300 300 223,500
Small Group 42,100 45,600 43,200 45,200 1,100 177,300
Large Group 116,400 127,700 120,300 125,600 3,200 493,200
Self-Funded 204,900 228,700 209,100 205,200 6,600 854,500
EGID 28,900 32,300 35,400 48,600 39,300 184,500
Medicaid/CHIP (with Duals) 532,200 113,300 63,600 59,600 58,000 826,700
Medicare (without Duals) 8,000 11,100 14,500 47,500 423,100 504,200
Other Public Programs 21,800 25,500 15,200 28,600 1,500 92,500
Total 1,022,900 884,500 717,700 727,000 548,000 3,900,200
12 Oklahoma State Department of Health Oklahoma State Innovation Model Insurance Market Analysis – Discussion Draft August 31, 2015
Milliman Report
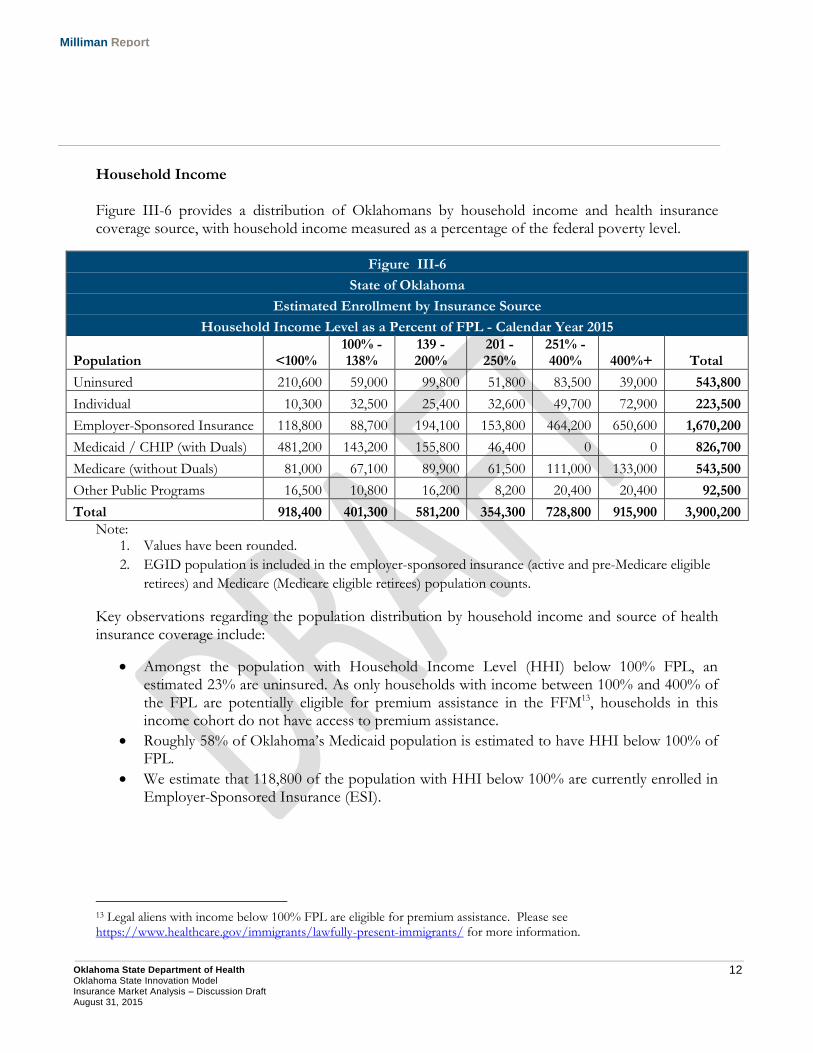
Household Income Figure III-6 provides a distribution of Oklahomans by household income and health insurance coverage source, with household income measured as a percentage of the federal poverty level.
Note: 1. Values have been rounded.
2. EGID population is included in the employer-sponsored insurance (active and pre-Medicare eligible
retirees) and Medicare (Medicare eligible retirees) population counts.
Key observations regarding the population distribution by household income and source of health insurance coverage include:
Amongst the population with Household Income Level (HHI) below 100% FPL, an estimated 23% are uninsured. As only households with income between 100% and 400% of the FPL are potentially eligible for premium assistance in the FFM13, households in this income cohort do not have access to premium assistance.
Roughly 58% of Oklahoma’s Medicaid population is estimated to have HHI below 100% of FPL.
We estimate that 118,800 of the population with HHI below 100% are currently enrolled in Employer-Sponsored Insurance (ESI).
13 Legal aliens with income below 100% FPL are eligible for premium assistance. Please see https://www.healthcare.gov/immigrants/lawfully-present-immigrants/ for more information.
Figure III-6
State of Oklahoma
Estimated Enrollment by Insurance Source
Household Income Level as a Percent of FPL - Calendar Year 2015
Population <100% 100% - 138%
139 - 200%
201 - 250%
251% - 400% 400%+ Total
Uninsured 210,600 59,000 99,800 51,800 83,500 39,000 543,800
Individual 10,300 32,500 25,400 32,600 49,700 72,900 223,500
Employer-Sponsored Insurance 118,800 88,700 194,100 153,800 464,200 650,600 1,670,200
Medicaid / CHIP (with Duals) 481,200 143,200 155,800 46,400 0 0 826,700
Medicare (without Duals) 81,000 67,100 89,900 61,500 111,000 133,000 543,500
Other Public Programs 16,500 10,800 16,200 8,200 20,400 20,400 92,500
Total 918,400 401,300 581,200 354,300 728,800 915,900 3,900,200
13 Oklahoma State Department of Health Oklahoma State Innovation Model Insurance Market Analysis – Discussion Draft August 31, 2015
Milliman Report
At higher income levels, ESI accounts for a greater proportion of health insurance coverage. For individuals with HHI above 250% FPL, 68% of the population are enrolled in ESI. ESI enrollment in 2015 relative to 2013 suggests that there has not been any material erosion of employer-sponsored coverage as the result of the ACA. As premium subsidies are phased out at higher income levels, ESI plans should maintain their appeal to higher income households and maintain their status as an attractive benefit offered by employers.
C. Population Morbidity Analysis Using self-reported health status from the U.S. Census Bureau’s Current Population Survey, we summarized the population count by health insurance coverage source for self-reported health status categories. We summarized the estimated 2015 Oklahoma population by health insurance coverage source and self-reported health status categories. Within a given demographic cohort, the distribution of self-reported health status within the U.S. Census Bureau’s Current Population Survey (CPS) was applied to population counts from the American Community Survey (ACS). The ACS represents a much larger national household sample size (approximately 3.5 million households in 201314) relative to the CPS (national sample of approximately 60,000 households15). However, the ACS does not contain self-reported health status. The availability of self-reported health status makes the CPS a valuable component of the population modeling process. Blending the CPS health status information with the much larger sample size of the ACS data creates a process that improves the credibility of the estimated self-reported health status within a demographic cohort. Due to a low number of observations in the CPS data, we combined population counts with self-reported health status of Fair or Poor. Additional details can be found in Section VII, Methodology and Assumptions.
14 See http://www.census.gov/programs-surveys/acs/methodology/sample-size-and-data-quality/sample-size-definitions.html for additional information. 15 See http://www.census.gov/cps/methodology/sampling.html for additional information.
14 Oklahoma State Department of Health Oklahoma State Innovation Model Insurance Market Analysis – Discussion Draft August 31, 2015
Milliman Report
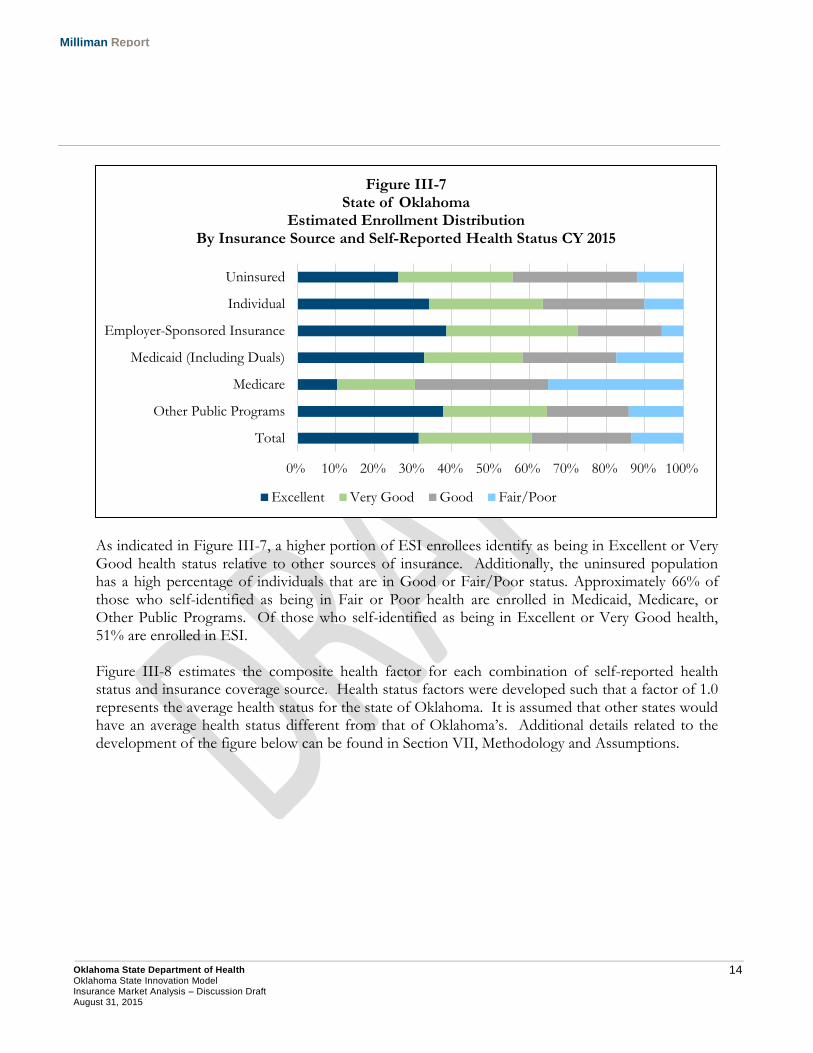
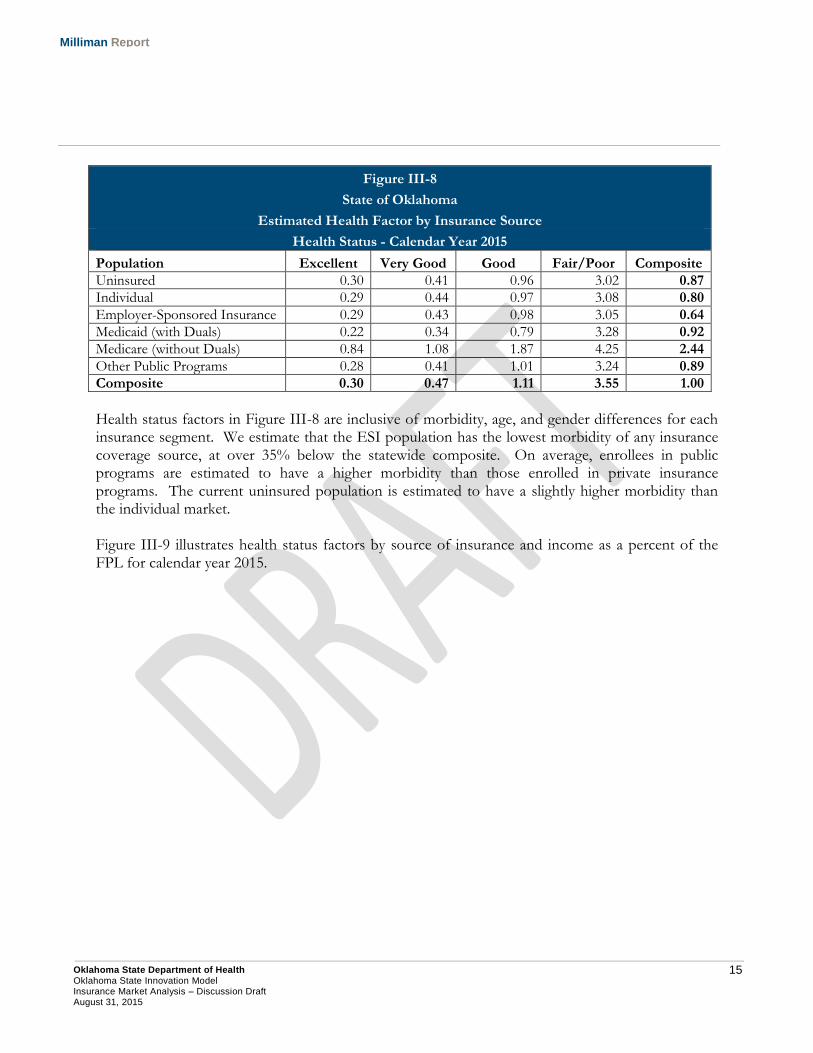
As indicated in Figure III-7, a higher portion of ESI enrollees identify as being in Excellent or Very Good health status relative to other sources of insurance. Additionally, the uninsured population has a high percentage of individuals that are in Good or Fair/Poor status. Approximately 66% of those who self-identified as being in Fair or Poor health are enrolled in Medicaid, Medicare, or Other Public Programs. Of those who self-identified as being in Excellent or Very Good health, 51% are enrolled in ESI. Figure III-8 estimates the composite health factor for each combination of self-reported health status and insurance coverage source. Health status factors were developed such that a factor of 1.0 represents the average health status for the state of Oklahoma. It is assumed that other states would have an average health status different from that of Oklahoma’s. Additional details related to the development of the figure below can be found in Section VII, Methodology and Assumptions.
0% 10% 20% 30% 40% 50% 60% 70% 80% 90% 100%
Total
Other Public Programs
Medicare
Medicaid (Including Duals)
Employer-Sponsored Insurance
Individual
Uninsured
Figure III-7 State of Oklahoma
Estimated Enrollment Distribution By Insurance Source and Self-Reported Health Status CY 2015
Excellent Very Good Good Fair/Poor
15 Oklahoma State Department of Health Oklahoma State Innovation Model Insurance Market Analysis – Discussion Draft August 31, 2015
Milliman Report
Figure III-8
State of Oklahoma
Estimated Health Factor by Insurance Source
Health Status - Calendar Year 2015
Population Excellent Very Good Good Fair/Poor Composite
Uninsured 0.30 0.41 0.96 3.02 0.87
Individual 0.29 0.44 0.97 3.08 0.80
Employer-Sponsored Insurance 0.29 0.43 0.98 3.05 0.64
Medicaid (with Duals) 0.22 0.34 0.79 3.28 0.92
Medicare (without Duals) 0.84 1.08 1.87 4.25 2.44
Other Public Programs 0.28 0.41 1.01 3.24 0.89
Composite 0.30 0.47 1.11 3.55 1.00
Health status factors in Figure III-8 are inclusive of morbidity, age, and gender differences for each insurance segment. We estimate that the ESI population has the lowest morbidity of any insurance coverage source, at over 35% below the statewide composite. On average, enrollees in public programs are estimated to have a higher morbidity than those enrolled in private insurance programs. The current uninsured population is estimated to have a slightly higher morbidity than the individual market. Figure III-9 illustrates health status factors by source of insurance and income as a percent of the FPL for calendar year 2015.
16 Oklahoma State Department of Health Oklahoma State Innovation Model Insurance Market Analysis – Discussion Draft August 31, 2015
Milliman Report
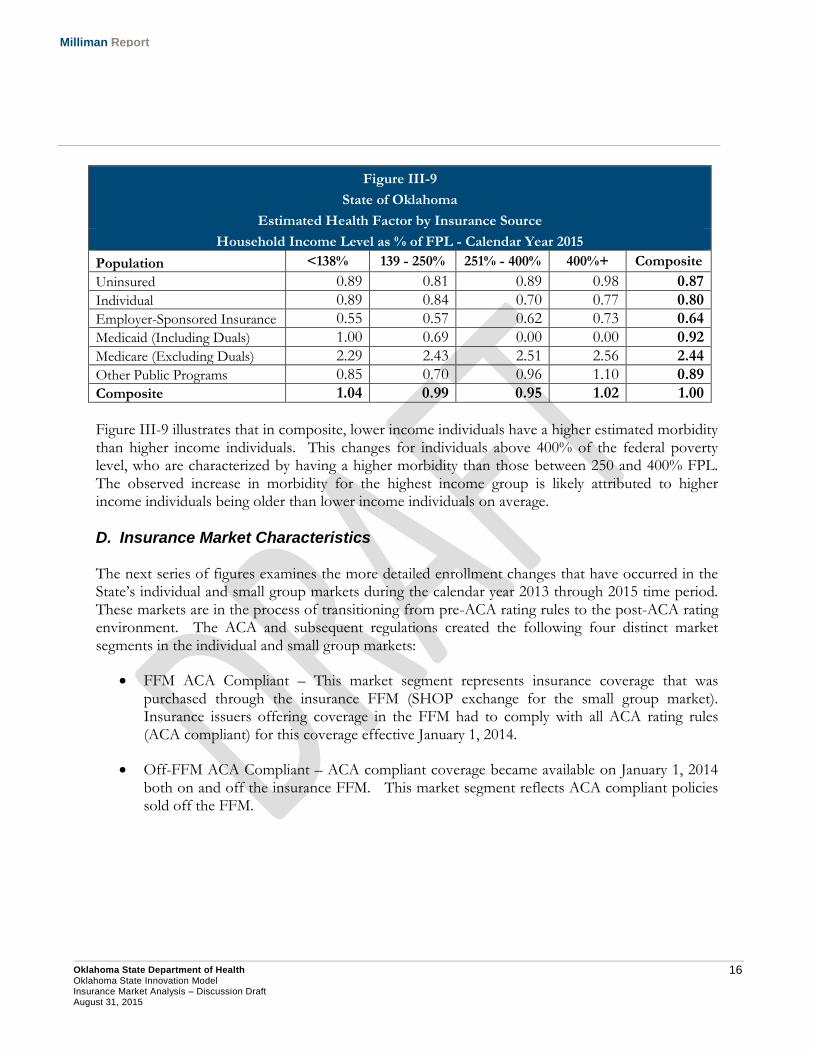
Figure III-9
State of Oklahoma
Estimated Health Factor by Insurance Source
Household Income Level as % of FPL - Calendar Year 2015
Population <138% 139 - 250% 251% - 400% 400%+ Composite
Uninsured 0.89 0.81 0.89 0.98 0.87
Individual 0.89 0.84 0.70 0.77 0.80
Employer-Sponsored Insurance 0.55 0.57 0.62 0.73 0.64
Medicaid (Including Duals) 1.00 0.69 0.00 0.00 0.92
Medicare (Excluding Duals) 2.29 2.43 2.51 2.56 2.44
Other Public Programs 0.85 0.70 0.96 1.10 0.89
Composite 1.04 0.99 0.95 1.02 1.00
Figure III-9 illustrates that in composite, lower income individuals have a higher estimated morbidity than higher income individuals. This changes for individuals above 400% of the federal poverty level, who are characterized by having a higher morbidity than those between 250 and 400% FPL. The observed increase in morbidity for the highest income group is likely attributed to higher income individuals being older than lower income individuals on average.
D. Insurance Market Characteristics The next series of figures examines the more detailed enrollment changes that have occurred in the State’s individual and small group markets during the calendar year 2013 through 2015 time period. These markets are in the process of transitioning from pre-ACA rating rules to the post-ACA rating environment. The ACA and subsequent regulations created the following four distinct market segments in the individual and small group markets:
FFM ACA Compliant – This market segment represents insurance coverage that was purchased through the insurance FFM (SHOP exchange for the small group market). Insurance issuers offering coverage in the FFM had to comply with all ACA rating rules (ACA compliant) for this coverage effective January 1, 2014.
Off-FFM ACA Compliant – ACA compliant coverage became available on January 1, 2014 both on and off the insurance FFM. This market segment reflects ACA compliant policies sold off the FFM.
17 Oklahoma State Department of Health Oklahoma State Innovation Model Insurance Market Analysis – Discussion Draft August 31, 2015
Milliman Report
Grandfathered – Individuals and small businesses that purchased insurance on or before March 23, 2010 have the ability to maintain these plans using the ACA’s ‘grandfathered’ coverage clause. Plans purchased on or before March 23, 2010 can only maintain grandfathered status to the extent the insurer does not make significant changes to cost sharing or covered benefits16. Grandfathered plans do not have to conform to ACA rating practices and are referred to in this report as ‘Non-ACA Compliant’ plans.
Transitional – Under the original guidance in the ACA, plans that were purchased after March 23, 2010 could not be renewed after January 1, 2014 and policyholders would need to convert to insurance coverage that was in compliance with ACA rating practices. However, this conversion process has been twice delayed. First, it was announced in November 2013 by CMS that individual and small group coverage that was not grandfathered could be renewed through October 1, 2014. In March 2014, CMS announced that existing non-ACA compliant coverage could be renewed through October 1, 2016. In both instances, states were permitted to make a decision regarding whether the CMS transitional policy would be implemented in the state. Oklahoma was one of 40 states that elected to implement the transitional policy17. Transitional plans do not have to conform to ACA rating practices and are referred to in this report as ‘Non-ACA Compliant’ plans, grouped together with grandfathered policies.
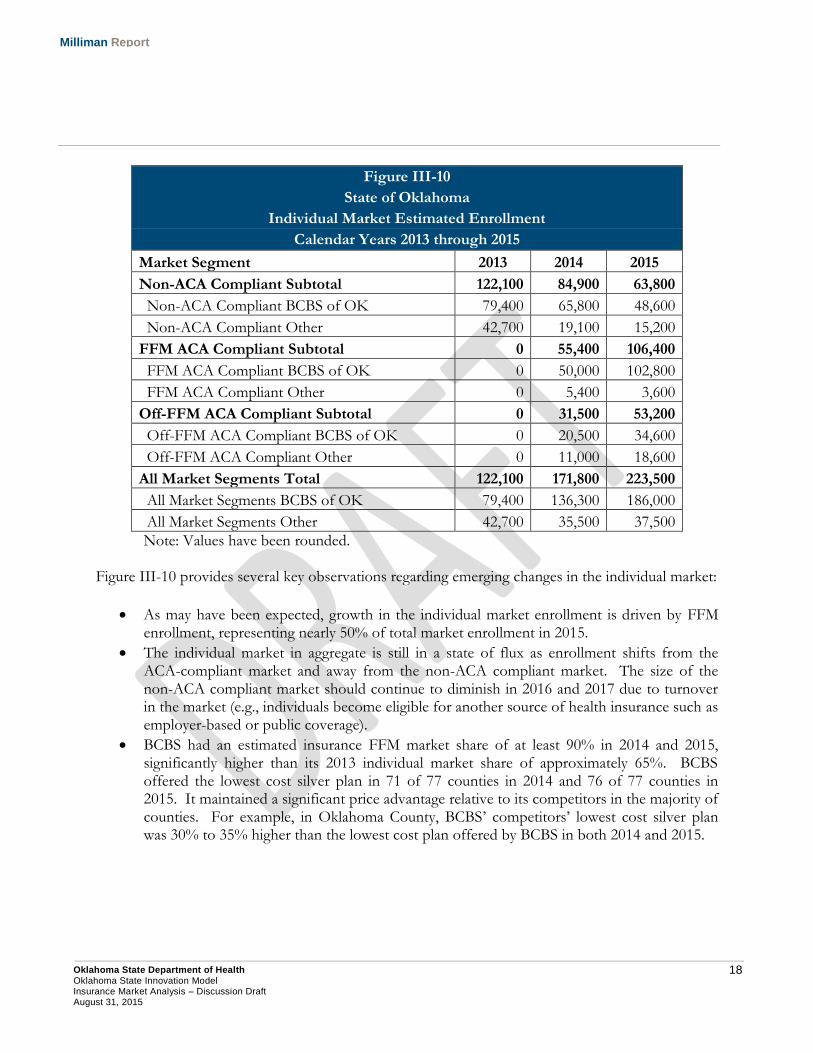
Figure III-10 provides a summary of estimated enrollment in the State’s individual insurance market during the three year period. In Figure III-10, the ‘Non-ACA Compliant’ market segment reflects the sum of grandfathered and transitional policies. We have separately illustrated BCBS enrollment in each market segment due to its position as the dominant commercial health insurer in the State. It should be noted that many of the values shown in Figure III-10 are estimates. These estimates were developed from using a combination of federal insurance marketplace reports and data, insurer financial statement data, rate review information submitted to CMS by insurers18, and publicly reported enrollment data by employees of BCBS. Enrollment values represent estimated effectuated enrollment (coverage that is active and in-force). Actual values are certain to vary from the estimates provided.
16 Healthcare.gov: Grandfathered Health Plan. Retrieved July 30, 2015 from https://www.healthcare.gov/glossary/grandfathered-health-plan/ . 17 Corlette, S., Lucia, K., Williams, A. The Extended Fix for Canceled Health Insurance Policies: Latest State Action (November 21, 2014). Retrieved July 30, 2015 from http://www.commonwealthfund.org/publications/blog/2014/jun/adoption-of-the-presidents-extended-fix. 18 Healthcare.gov: Rate Review. Retrieved July 30, 2015 from https://ratereview.healthcare.gov/.
18 Oklahoma State Department of Health Oklahoma State Innovation Model Insurance Market Analysis – Discussion Draft August 31, 2015
Milliman Report
Figure III-10
State of Oklahoma
Individual Market Estimated Enrollment
Calendar Years 2013 through 2015
Market Segment 2013 2014 2015
Non-ACA Compliant Subtotal 122,100 84,900 63,800
Non-ACA Compliant BCBS of OK 79,400 65,800 48,600
Non-ACA Compliant Other 42,700 19,100 15,200
FFM ACA Compliant Subtotal 0 55,400 106,400
FFM ACA Compliant BCBS of OK 0 50,000 102,800
FFM ACA Compliant Other 0 5,400 3,600
Off-FFM ACA Compliant Subtotal 0 31,500 53,200
Off-FFM ACA Compliant BCBS of OK 0 20,500 34,600
Off-FFM ACA Compliant Other 0 11,000 18,600
All Market Segments Total 122,100 171,800 223,500
All Market Segments BCBS of OK 79,400 136,300 186,000
All Market Segments Other 42,700 35,500 37,500
Note: Values have been rounded. Figure III-10 provides several key observations regarding emerging changes in the individual market:
As may have been expected, growth in the individual market enrollment is driven by FFM enrollment, representing nearly 50% of total market enrollment in 2015.
The individual market in aggregate is still in a state of flux as enrollment shifts from the ACA-compliant market and away from the non-ACA compliant market. The size of the non-ACA compliant market should continue to diminish in 2016 and 2017 due to turnover in the market (e.g., individuals become eligible for another source of health insurance such as employer-based or public coverage).
BCBS had an estimated insurance FFM market share of at least 90% in 2014 and 2015, significantly higher than its 2013 individual market share of approximately 65%. BCBS offered the lowest cost silver plan in 71 of 77 counties in 2014 and 76 of 77 counties in 2015. It maintained a significant price advantage relative to its competitors in the majority of counties. For example, in Oklahoma County, BCBS’ competitors’ lowest cost silver plan was 30% to 35% higher than the lowest cost plan offered by BCBS in both 2014 and 2015.
19 Oklahoma State Department of Health Oklahoma State Innovation Model Insurance Market Analysis – Discussion Draft August 31, 2015
Milliman Report
For 2016, BCBS will only have one existing competitor in the FFM, CommunityCare, with UnitedHealthcare expected to begin offering plans in the FFM19. It should be noted that in federal rate review information, BCBS indicated a loss of 35% of premium (after application of ACA federal risk mitigation provisions) on its ACA-compliant business in 201420. BCBS has requested a 2016 premium rate increase of 23% to 44% for its individual ACA-compliant business. To the extent BCBS cannot maintain its price advantage in the FFM moving forward, its market share may erode.
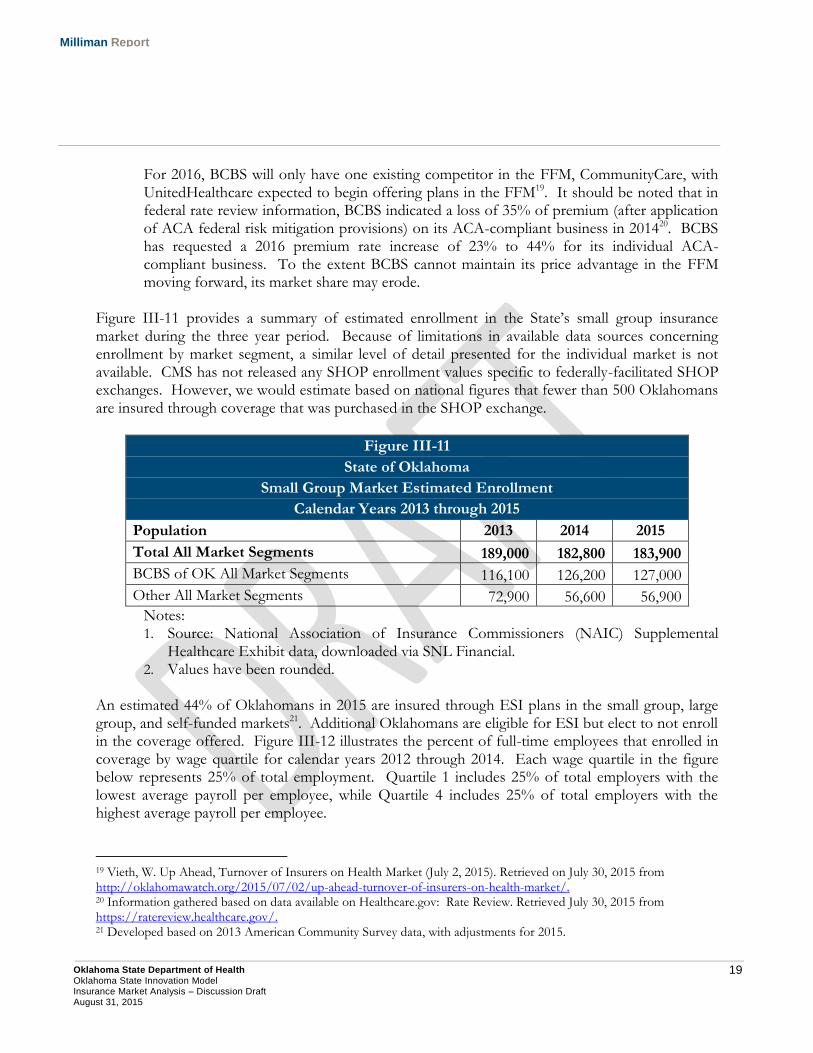
Figure III-11 provides a summary of estimated enrollment in the State’s small group insurance market during the three year period. Because of limitations in available data sources concerning enrollment by market segment, a similar level of detail presented for the individual market is not available. CMS has not released any SHOP enrollment values specific to federally-facilitated SHOP exchanges. However, we would estimate based on national figures that fewer than 500 Oklahomans are insured through coverage that was purchased in the SHOP exchange.
Figure III-11
State of Oklahoma
Small Group Market Estimated Enrollment
Calendar Years 2013 through 2015
Population 2013 2014 2015
Total All Market Segments 189,000 182,800 183,900
BCBS of OK All Market Segments 116,100 126,200 127,000
Other All Market Segments 72,900 56,600 56,900
Notes: 1. Source: National Association of Insurance Commissioners (NAIC) Supplemental
Healthcare Exhibit data, downloaded via SNL Financial. 2. Values have been rounded.
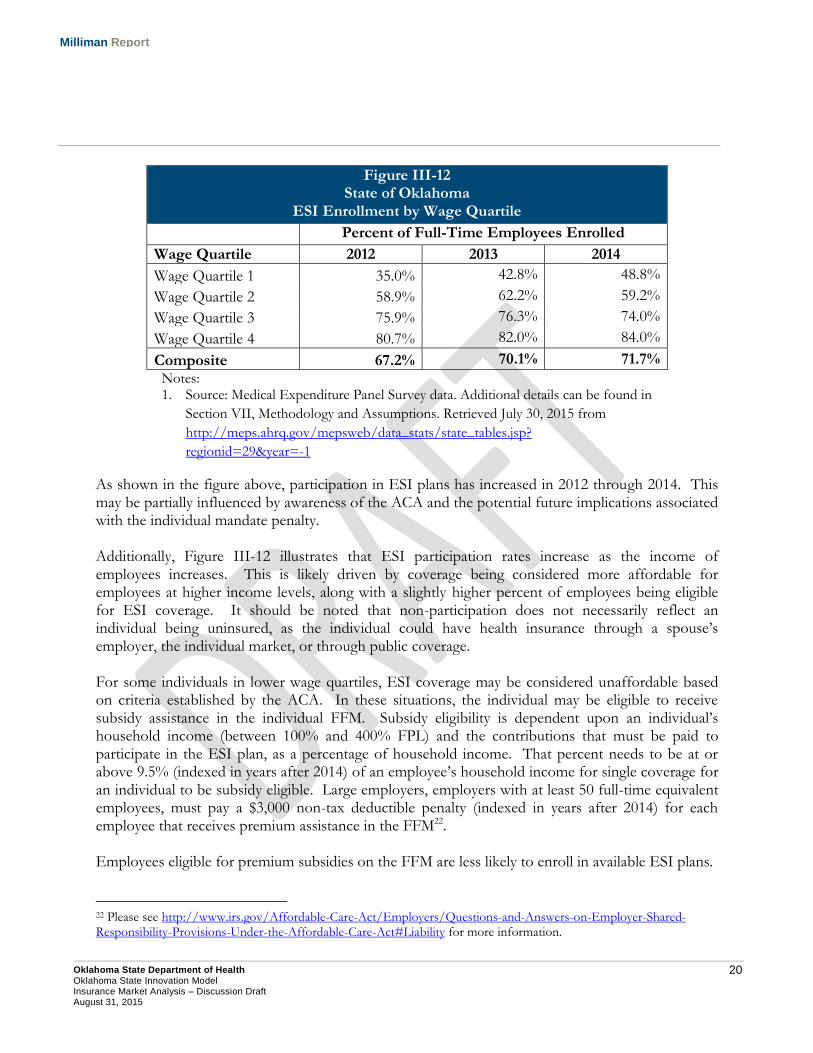
An estimated 44% of Oklahomans in 2015 are insured through ESI plans in the small group, large group, and self-funded markets21. Additional Oklahomans are eligible for ESI but elect to not enroll in the coverage offered. Figure III-12 illustrates the percent of full-time employees that enrolled in coverage by wage quartile for calendar years 2012 through 2014. Each wage quartile in the figure below represents 25% of total employment. Quartile 1 includes 25% of total employers with the lowest average payroll per employee, while Quartile 4 includes 25% of total employers with the highest average payroll per employee.
19 Vieth, W. Up Ahead, Turnover of Insurers on Health Market (July 2, 2015). Retrieved on July 30, 2015 from http://oklahomawatch.org/2015/07/02/up-ahead-turnover-of-insurers-on-health-market/. 20 Information gathered based on data available on Healthcare.gov: Rate Review. Retrieved July 30, 2015 from https://ratereview.healthcare.gov/. 21 Developed based on 2013 American Community Survey data, with adjustments for 2015.
20 Oklahoma State Department of Health Oklahoma State Innovation Model Insurance Market Analysis – Discussion Draft August 31, 2015
Milliman Report
Figure III-12 State of Oklahoma
ESI Enrollment by Wage Quartile
Percent of Full-Time Employees Enrolled
Wage Quartile 2012 2013 2014
Wage Quartile 1 35.0% 42.8% 48.8%
Wage Quartile 2 58.9% 62.2% 59.2%
Wage Quartile 3 75.9% 76.3% 74.0%
Wage Quartile 4 80.7% 82.0% 84.0%
Composite 67.2% 70.1% 71.7%
Notes: 1. Source: Medical Expenditure Panel Survey data. Additional details can be found in
Section VII, Methodology and Assumptions. Retrieved July 30, 2015 from
http://meps.ahrq.gov/mepsweb/data_stats/state_tables.jsp?
regionid=29&year=-1
As shown in the figure above, participation in ESI plans has increased in 2012 through 2014. This may be partially influenced by awareness of the ACA and the potential future implications associated with the individual mandate penalty. Additionally, Figure III-12 illustrates that ESI participation rates increase as the income of employees increases. This is likely driven by coverage being considered more affordable for employees at higher income levels, along with a slightly higher percent of employees being eligible for ESI coverage. It should be noted that non-participation does not necessarily reflect an individual being uninsured, as the individual could have health insurance through a spouse’s employer, the individual market, or through public coverage. For some individuals in lower wage quartiles, ESI coverage may be considered unaffordable based on criteria established by the ACA. In these situations, the individual may be eligible to receive subsidy assistance in the individual FFM. Subsidy eligibility is dependent upon an individual’s household income (between 100% and 400% FPL) and the contributions that must be paid to participate in the ESI plan, as a percentage of household income. That percent needs to be at or above 9.5% (indexed in years after 2014) of an employee’s household income for single coverage for an individual to be subsidy eligible. Large employers, employers with at least 50 full-time equivalent employees, must pay a $3,000 non-tax deductible penalty (indexed in years after 2014) for each employee that receives premium assistance in the FFM22. Employees eligible for premium subsidies on the FFM are less likely to enroll in available ESI plans.
22 Please see http://www.irs.gov/Affordable-Care-Act/Employers/Questions-and-Answers-on-Employer-Shared-Responsibility-Provisions-Under-the-Affordable-Care-Act#Liability for more information.
21 Oklahoma State Department of Health Oklahoma State Innovation Model Insurance Market Analysis – Discussion Draft August 31, 2015
Milliman Report
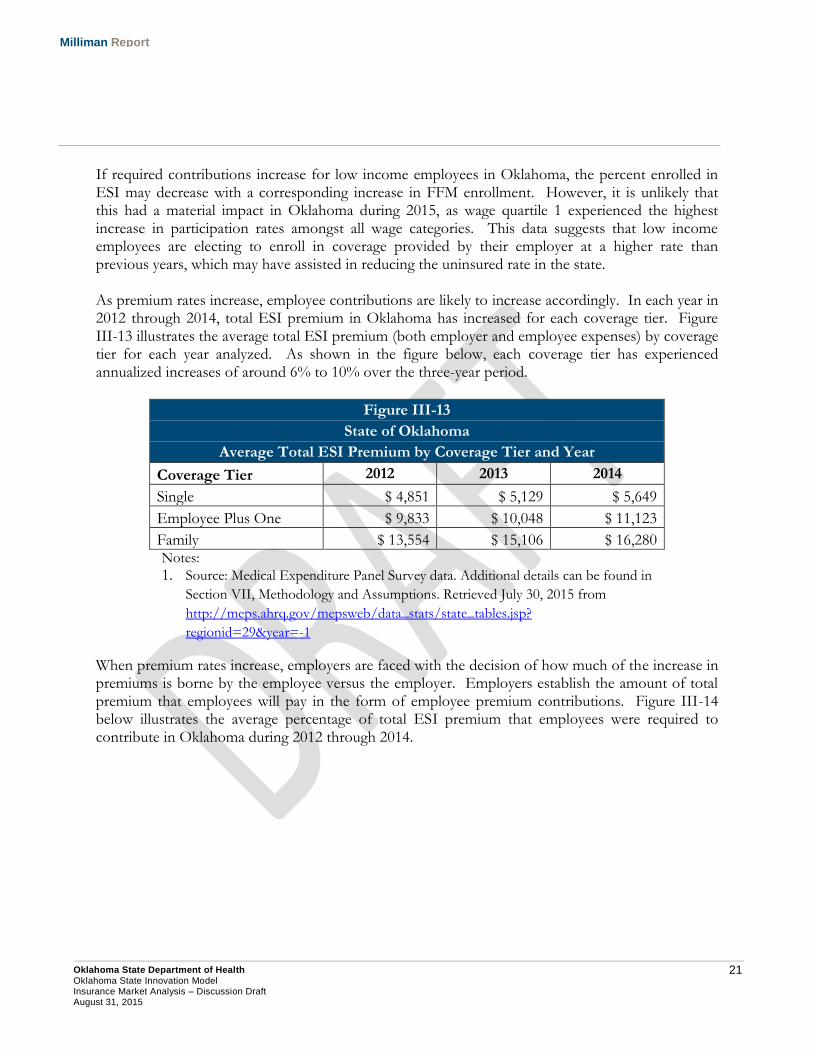
If required contributions increase for low income employees in Oklahoma, the percent enrolled in ESI may decrease with a corresponding increase in FFM enrollment. However, it is unlikely that this had a material impact in Oklahoma during 2015, as wage quartile 1 experienced the highest increase in participation rates amongst all wage categories. This data suggests that low income employees are electing to enroll in coverage provided by their employer at a higher rate than previous years, which may have assisted in reducing the uninsured rate in the state. As premium rates increase, employee contributions are likely to increase accordingly. In each year in 2012 through 2014, total ESI premium in Oklahoma has increased for each coverage tier. Figure III-13 illustrates the average total ESI premium (both employer and employee expenses) by coverage tier for each year analyzed. As shown in the figure below, each coverage tier has experienced annualized increases of around 6% to 10% over the three-year period.
Figure III-13
State of Oklahoma
Average Total ESI Premium by Coverage Tier and Year
Coverage Tier 2012 2013 2014
Single $ 4,851 $ 5,129 $ 5,649
Employee Plus One $ 9,833 $ 10,048 $ 11,123
Family $ 13,554 $ 15,106 $ 16,280 Notes:
1. Source: Medical Expenditure Panel Survey data. Additional details can be found in
Section VII, Methodology and Assumptions. Retrieved July 30, 2015 from
http://meps.ahrq.gov/mepsweb/data_stats/state_tables.jsp?
regionid=29&year=-1
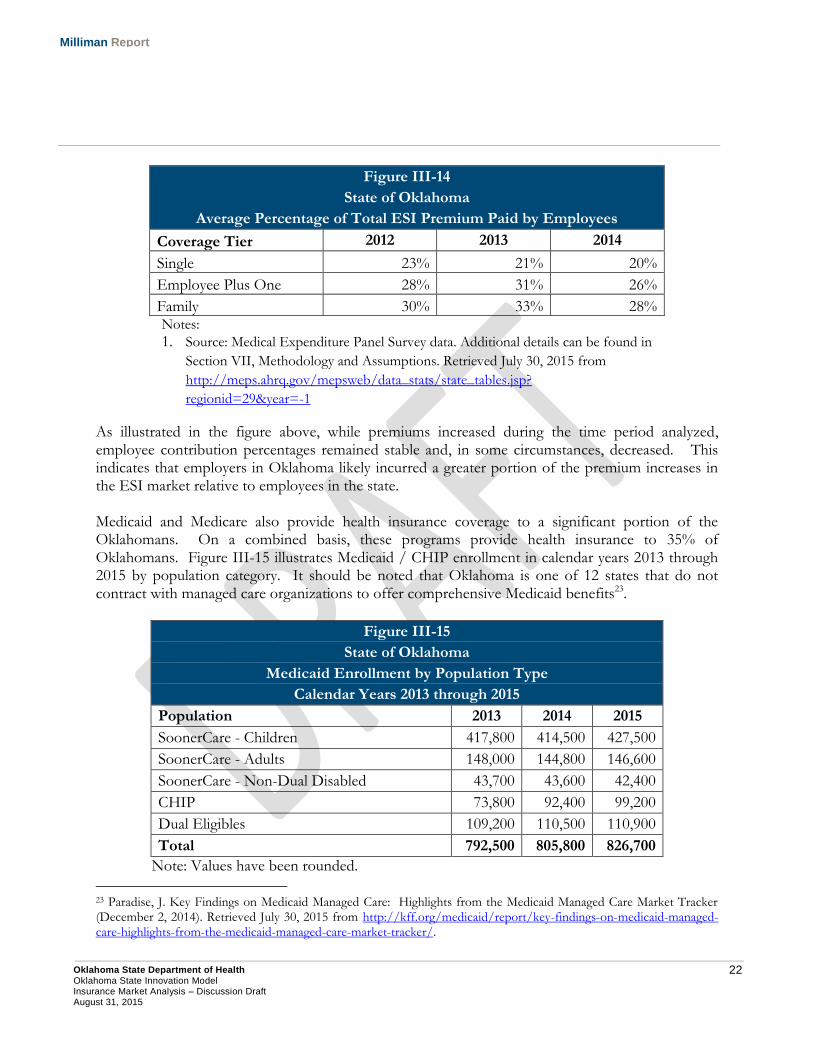
When premium rates increase, employers are faced with the decision of how much of the increase in premiums is borne by the employee versus the employer. Employers establish the amount of total premium that employees will pay in the form of employee premium contributions. Figure III-14 below illustrates the average percentage of total ESI premium that employees were required to contribute in Oklahoma during 2012 through 2014.
22 Oklahoma State Department of Health Oklahoma State Innovation Model Insurance Market Analysis – Discussion Draft August 31, 2015
Milliman Report
Figure III-14
State of Oklahoma
Average Percentage of Total ESI Premium Paid by Employees
Coverage Tier 2012 2013 2014
Single 23% 21% 20%
Employee Plus One 28% 31% 26%
Family 30% 33% 28% Notes:
1. Source: Medical Expenditure Panel Survey data. Additional details can be found in
Section VII, Methodology and Assumptions. Retrieved July 30, 2015 from
http://meps.ahrq.gov/mepsweb/data_stats/state_tables.jsp?
regionid=29&year=-1
As illustrated in the figure above, while premiums increased during the time period analyzed, employee contribution percentages remained stable and, in some circumstances, decreased. This indicates that employers in Oklahoma likely incurred a greater portion of the premium increases in the ESI market relative to employees in the state. Medicaid and Medicare also provide health insurance coverage to a significant portion of the Oklahomans. On a combined basis, these programs provide health insurance to 35% of Oklahomans. Figure III-15 illustrates Medicaid / CHIP enrollment in calendar years 2013 through 2015 by population category. It should be noted that Oklahoma is one of 12 states that do not contract with managed care organizations to offer comprehensive Medicaid benefits23.
Figure III-15
State of Oklahoma
Medicaid Enrollment by Population Type
Calendar Years 2013 through 2015
Population 2013 2014 2015
SoonerCare - Children 417,800 414,500 427,500
SoonerCare - Adults 148,000 144,800 146,600
SoonerCare - Non-Dual Disabled 43,700 43,600 42,400
CHIP 73,800 92,400 99,200
Dual Eligibles 109,200 110,500 110,900
Total 792,500 805,800 826,700
Note: Values have been rounded.
23 Paradise, J. Key Findings on Medicaid Managed Care: Highlights from the Medicaid Managed Care Market Tracker (December 2, 2014). Retrieved July 30, 2015 from http://kff.org/medicaid/report/key-findings-on-medicaid-managed-care-highlights-from-the-medicaid-managed-care-market-tracker/.
23 Oklahoma State Department of Health Oklahoma State Innovation Model Insurance Market Analysis – Discussion Draft August 31, 2015
Milliman Report
Medicaid enrollment has had minimal changes during the three-year period, with the exception of SoonerCare Children increasing by 13,000 participants from 2014 to 2015, and CHIP enrollment increasing by nearly 35% from 2013 to 2015. The increases observed in CHIP may have been driven by two factors:
“Welcome mat effect” – Children eligible for CHIP are not eligible for premium assistance in the federal marketplace. When families applied for premium assistance for FFM coverage in 2014, some households may have learned that their children are eligible for health insurance through CHIP. Additionally, enrolling their children in CHIP would enable certain families to avoid individual mandate penalties. A similar effect may have also driven the increase in SoonerCare-Children enrollment.
Change in Medicaid eligibility for pregnant women – Under the CHIP program and specifically under a new option made available under the Children’s Health Insurance Program Reauthorization Act of 2009 (CHIPRA), eligibility for pregnant women was extended to 185% FPL (excluding the 5% income disregard)24. Healthcare benefits for pregnant women under CHIP are limited to pregnancy-related services. Effective January 1, 2014, Oklahoma modified Medicaid eligibility for pregnant women from a 185% FPL Medicaid eligibility limit to a 133% FPL eligibility limit (excluding the 5% income disregard), as these individuals are covered under CHIP. For reference, Medicaid eligibility for children has a 205% FPL limit, while parents have existing Medicaid eligibility up to 42% FPL25.
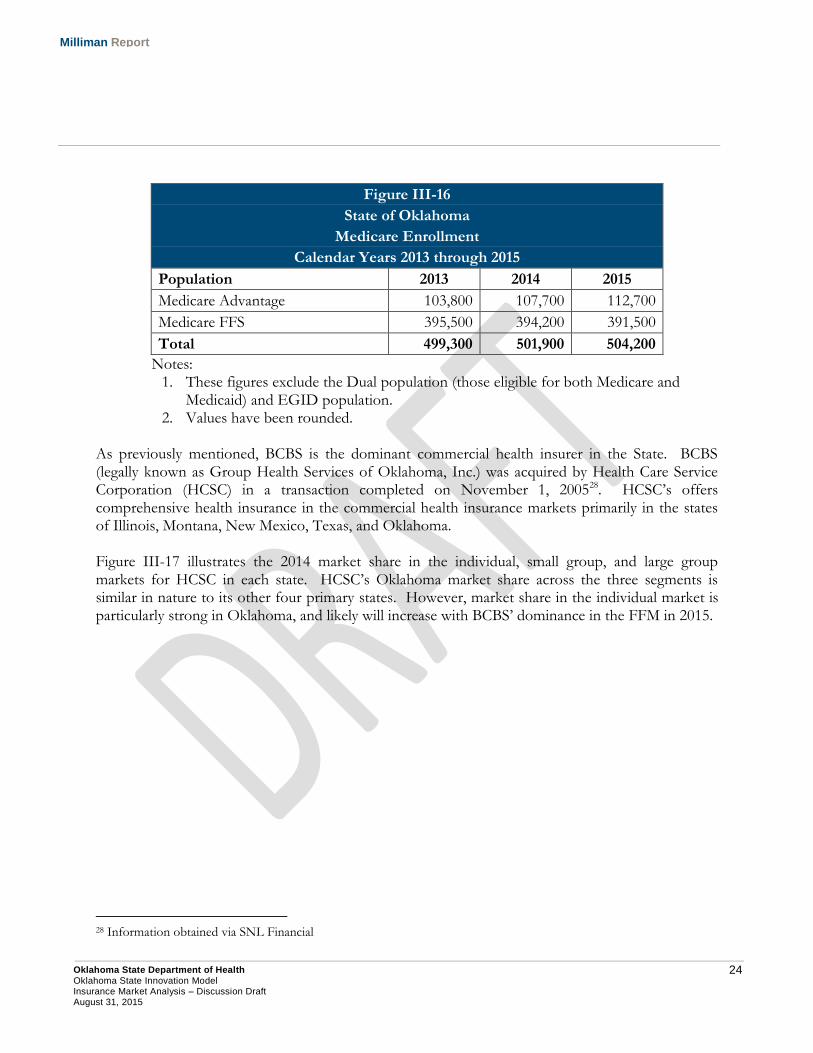
Figure III-16 provides a breakdown of Medicare enrollment between the fee-for-service delivery system and Medicare Advantage. Medicare Advantage enrollment is based on contract statistics published by CMS26. Medicare Advantage is operated by private health plans that provide Medicare Part A and Part B benefits and in most cases Part D benefits as well27. The proportion of Medicare enrollees in Medicare Advantage plans has grown slightly during the three year period. As a greater proportion of the baby boomer population reaches age 65 in the upcoming years, Medicare Advantage may represent a growth opportunity for insurers. Additionally, it may be important to incorporate population health initiatives developed in the OSIM for this market.
24 Medicaid and CHIP Income Eligibility Limits for Pregnant Women as a Percent of the Federal Poverty Level (January 1, 2015). Retrieved July 30, 2015 from http://kff.org/health-reform/state-indicator/medicaid-and-chip-income-eligibility-limits-for-pregnant-women-as-a-percent-of-the-federal-poverty-level/. 25 State Medicaid and CHIP Income Eligibility Standards. Retrieved August 14, 2015 from http://www.medicaid.gov/medicaid-chip-program-information/program-information/downloads/medicaid-and-chip-eligibility-levels-table.pdf. 26 CMS: MA Enrollment by SCC. Retrieved on July 30, 2015 from http://www.cms.gov/Research-Statistics-Data-and-Systems/Statistics-Trends-and-Reports/MCRAdvPartDEnrolData/Monthly-MA-Enrollment-by-State-County-Contract-Items/MA-Enrollment-by-SCC-2015-07.html?DLPage=1&DLEntries=10&DLSort=1&DLSortDir=descending. 27 Medicare Advantage Plans. Retrieved July 30, 2015 from https://www.medicare.gov/sign-up-change-plans/medicare-health-plans/medicare-advantage-plans/medicare-advantage-plans.html.
24 Oklahoma State Department of Health Oklahoma State Innovation Model Insurance Market Analysis – Discussion Draft August 31, 2015
Milliman Report
Figure III-16
State of Oklahoma
Medicare Enrollment
Calendar Years 2013 through 2015
Population 2013 2014 2015
Medicare Advantage 103,800 107,700 112,700
Medicare FFS 395,500 394,200 391,500
Total 499,300 501,900 504,200
Notes: 1. These figures exclude the Dual population (those eligible for both Medicare and
Medicaid) and EGID population. 2. Values have been rounded.
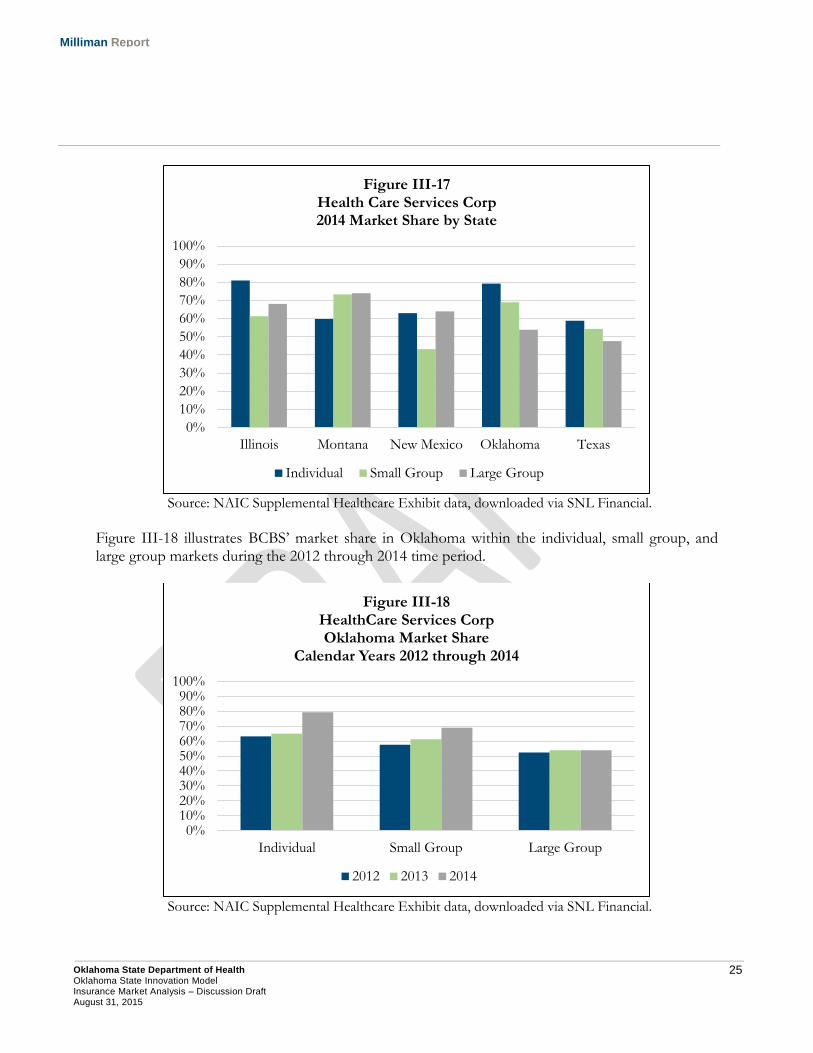
As previously mentioned, BCBS is the dominant commercial health insurer in the State. BCBS (legally known as Group Health Services of Oklahoma, Inc.) was acquired by Health Care Service Corporation (HCSC) in a transaction completed on November 1, 200528. HCSC’s offers comprehensive health insurance in the commercial health insurance markets primarily in the states of Illinois, Montana, New Mexico, Texas, and Oklahoma. Figure III-17 illustrates the 2014 market share in the individual, small group, and large group markets for HCSC in each state. HCSC’s Oklahoma market share across the three segments is similar in nature to its other four primary states. However, market share in the individual market is particularly strong in Oklahoma, and likely will increase with BCBS’ dominance in the FFM in 2015.
28 Information obtained via SNL Financial
25 Oklahoma State Department of Health Oklahoma State Innovation Model Insurance Market Analysis – Discussion Draft August 31, 2015
Milliman Report
Source: NAIC Supplemental Healthcare Exhibit data, downloaded via SNL Financial.
Figure III-18 illustrates BCBS’ market share in Oklahoma within the individual, small group, and large group markets during the 2012 through 2014 time period.
Source: NAIC Supplemental Healthcare Exhibit data, downloaded via SNL Financial.
0%
10%
20%
30%
40%
50%
60%
70%
80%
90%
100%
Illinois Montana New Mexico Oklahoma Texas
Figure III-17 Health Care Services Corp 2014 Market Share by State
Individual Small Group Large Group
0%10%20%30%40%50%60%70%80%90%
100%
Individual Small Group Large Group
Figure III-18 HealthCare Services Corp Oklahoma Market Share
Calendar Years 2012 through 2014
2012 2013 2014
26 Oklahoma State Department of Health Oklahoma State Innovation Model Insurance Market Analysis – Discussion Draft August 31, 2015
Milliman Report
Significant market share gains were made by BCBS in 2014 in both the individual and small group markets, with market share in the large group market remaining steady. As stated previously, BCBS’ market share gains in the individual market were attributable to having a significant pricing advantage in the FFM relative to competing insurers, albeit with significant underwriting losses. To the extent BCBS needs to raise premiums materially to maintain a financially sustainable block of business, its market share may erode as competing insurers products become more price competitive. Additionally, we have seen Medicaid plans competing well with historically dominant insurers in several states within the FFM. To the extent Oklahoma contracted with managed care organizations for comprehensive Medicaid benefits, the same insures may elect to begin competing in the FFM and provide additional competition to BCBS.
27 Oklahoma State Department of Health Oklahoma State Innovation Model Insurance Market Analysis – Discussion Draft August 31, 2015
Milliman Report
IV. Federally Facilitated Marketplace Analysis
A. Individual Marketplace The federal individual insurance marketplace began offering coverage to Oklahomans beginning on January 1, 2014. Prior to the implementation of market reforms under the ACA, individual insurance policies were often medically underwritten and there was little financial assistance available to the uninsured population not eligible for Medicaid. For individuals between 100% and 400% of the federal poverty level, premium and cost sharing assistance may be available on the individual FFM for those that do not have other affordable sources of minimum essential coverage available. Because of this, a significant number of previously uninsured Oklahomans became insured in the individual health insurance market in calendar years 2014 and 2015. ACA PREMIUM RATING REQUIREMENTS The ACA standardized the underwriting and premium rate development process in the individual and small group health insurance markets for new coverage written on or after January 1, 2014. Under the ACA, individual and small group premium rates, both on and off the FFM, may only vary by the following:
Age (limited to a 3:1 ratio);
Tobacco Usage (limited to a 1.5:1 ratio);
Geographic Region;
Benefit Design; and,
Family Size.
These rating rules are referred to as ‘adjusted community rating’, as they do not allow premiums to vary by an individual’s health status. Prior to the implementation of the ACA, insurers were permitted to vary premiums based on other factors, such as an individual’s gender or health status. Because of this, the ACA’s impact on premium rates in the individual market varies greatly based on an individual’s gender, age, and health status. The ACA rating requirements introduced three different subsidies into the development of individual premium rates. 1. Gender: Young males, on average, paid a significantly lower premium rate compared to young
females prior to the ACA because of lower expected healthcare costs. This was in large part due to maternity, family planning, and reproductive health costs, although even without these costs included, there are still cost differences by gender. The elimination of gender rating resulted in premium increases for young males, which subsidized the premium rates for young females. At older ages, this disparity between male and female claim cost is less significant.
2. Age: Although the ACA permits premiums to vary by age, the adjustment is limited to a 3:1
ratio. Actual unisex claim cost variation between the youngest and oldest adult individuals in the insured risk pool is estimated to be approximately 4:1. Because of this, the implementation of
28 Oklahoma State Department of Health Oklahoma State Innovation Model Insurance Market Analysis – Discussion Draft August 31, 2015
Milliman Report
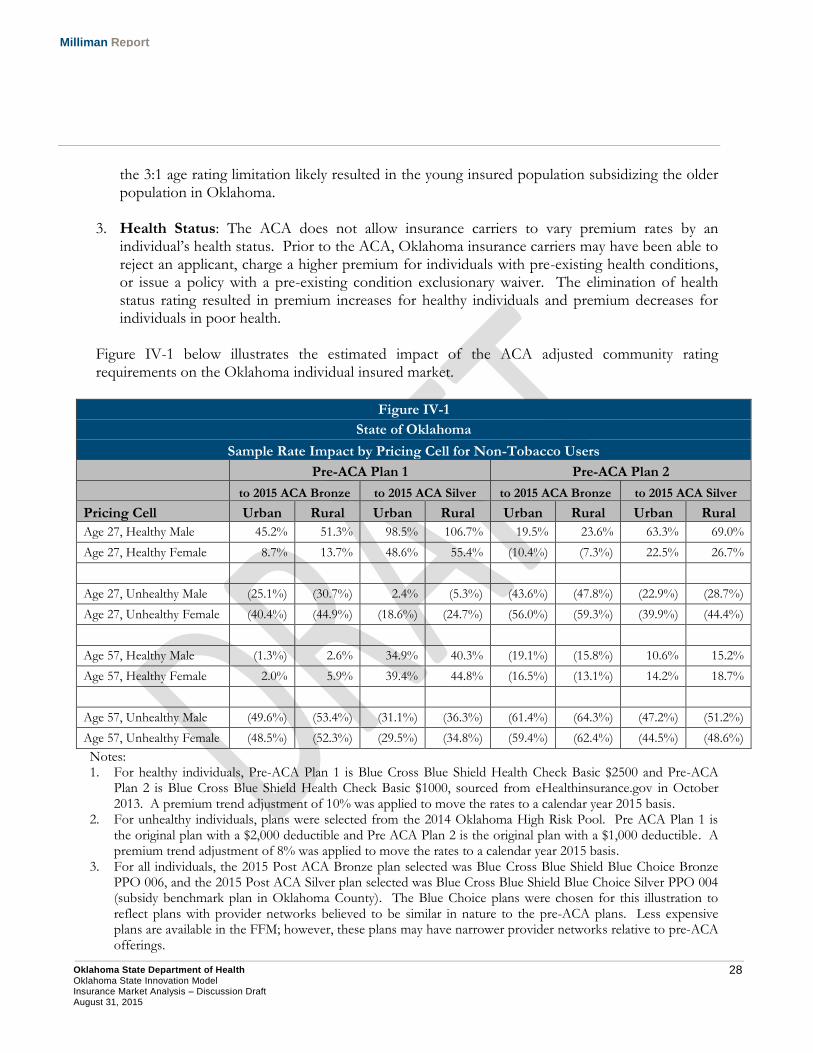
the 3:1 age rating limitation likely resulted in the young insured population subsidizing the older population in Oklahoma.
3. Health Status: The ACA does not allow insurance carriers to vary premium rates by an
individual’s health status. Prior to the ACA, Oklahoma insurance carriers may have been able to reject an applicant, charge a higher premium for individuals with pre-existing health conditions, or issue a policy with a pre-existing condition exclusionary waiver. The elimination of health status rating resulted in premium increases for healthy individuals and premium decreases for individuals in poor health.
Figure IV-1 below illustrates the estimated impact of the ACA adjusted community rating requirements on the Oklahoma individual insured market.
Figure IV-1
State of Oklahoma
Sample Rate Impact by Pricing Cell for Non-Tobacco Users
Pre-ACA Plan 1 Pre-ACA Plan 2
to 2015 ACA Bronze to 2015 ACA Silver to 2015 ACA Bronze to 2015 ACA Silver
Pricing Cell Urban Rural Urban Rural Urban Rural Urban Rural
Age 27, Healthy Male 45.2% 51.3% 98.5% 106.7% 19.5% 23.6% 63.3% 69.0%
Age 27, Healthy Female 8.7% 13.7% 48.6% 55.4% (10.4%) (7.3%) 22.5% 26.7%
Age 27, Unhealthy Male (25.1%) (30.7%) 2.4% (5.3%) (43.6%) (47.8%) (22.9%) (28.7%)
Age 27, Unhealthy Female (40.4%) (44.9%) (18.6%) (24.7%) (56.0%) (59.3%) (39.9%) (44.4%)
Age 57, Healthy Male (1.3%) 2.6% 34.9% 40.3% (19.1%) (15.8%) 10.6% 15.2%
Age 57, Healthy Female 2.0% 5.9% 39.4% 44.8% (16.5%) (13.1%) 14.2% 18.7%
Age 57, Unhealthy Male (49.6%) (53.4%) (31.1%) (36.3%) (61.4%) (64.3%) (47.2%) (51.2%)
Age 57, Unhealthy Female (48.5%) (52.3%) (29.5%) (34.8%) (59.4%) (62.4%) (44.5%) (48.6%)
Notes: 1. For healthy individuals, Pre-ACA Plan 1 is Blue Cross Blue Shield Health Check Basic $2500 and Pre-ACA
Plan 2 is Blue Cross Blue Shield Health Check Basic $1000, sourced from eHealthinsurance.gov in October 2013. A premium trend adjustment of 10% was applied to move the rates to a calendar year 2015 basis.
2. For unhealthy individuals, plans were selected from the 2014 Oklahoma High Risk Pool. Pre ACA Plan 1 is the original plan with a $2,000 deductible and Pre ACA Plan 2 is the original plan with a $1,000 deductible. A premium trend adjustment of 8% was applied to move the rates to a calendar year 2015 basis.
3. For all individuals, the 2015 Post ACA Bronze plan selected was Blue Cross Blue Shield Blue Choice Bronze PPO 006, and the 2015 Post ACA Silver plan selected was Blue Cross Blue Shield Blue Choice Silver PPO 004 (subsidy benchmark plan in Oklahoma County). The Blue Choice plans were chosen for this illustration to reflect plans with provider networks believed to be similar in nature to the pre-ACA plans. Less expensive plans are available in the FFM; however, these plans may have narrower provider networks relative to pre-ACA offerings.
29 Oklahoma State Department of Health Oklahoma State Innovation Model Insurance Market Analysis – Discussion Draft August 31, 2015
Milliman Report
4. For all plans, urban premiums are those quoted in Oklahoma County; whereas rural premiums reflect those offered in Woodward County.
As illustrated in the figure above, the impact of adjusted community rating under the ACA in the sampled counties varied greatly based on an individual insured’s age, gender, health status, and geographic location. In developing these estimates, we trended 2013 and 2014 premium rates to 2015 for the purpose of removing the impact of normal premium growth on the illustrated impact of ACA premium rating requirements. Premium rate impacts do not reflect the financial impact of premium assistance available for qualifying households. Premium rate impacts for 2016 and beyond may change significantly from the values illustrated in Figure IV-1. ACA PLAN DESIGN REQUIREMENTS Plan designs offered on the individual FFM must meet actuarial value cost sharing requirements29. Actuarial value (AV) is a metric that estimates the portion of healthcare expenses paid by the plan. For example, a 70% actuarial value plan would cover an estimated 70% of healthcare expenses with the member paying the remaining 30% through cost sharing such as deductibles, copayments, and coinsurance. Actuarial value calculations do not take into account other plan design characteristics such as provider networks, out-of-network benefits, administrative expenses, or premiums paid to enroll in the plan. Four different levels of coverage (also known as “metal levels”) can be offered through the individual FFM. Each has a separate actuarial value so that enrollees can have a choice with respect to how much the plan will cost and what level of benefits will be provided. The individual FFM plan metal levels are as follows:
Platinum – Actuarial value of 90%
Gold – Actuarial value of 80%
Silver – Actuarial value of 70%
Bronze – Actuarial value of 60% In addition to metal level plans, individuals under 30 or those meeting the individual mandate’s affordability exemption are eligible to enroll in “Catastrophic” plans. These plans do not cover any services other than preventive care and three primary care visits until a deductible is met30. In 2015, the single deductible for catastrophic plans in Oklahoma was $6,600. These plans are not defined in terms of actuarial value, and typically have cost sharing similar to a lean Bronze plan. Premium assistance may not be applied to the purchase of a Catastrophic plan.
29 Cost sharing requirements apply to all ACA-compliant coverage in the individual and small group markets. 30 Catastrophic health insurance plans. Retrieved on August 15, 2015 from https://www.healthcare.gov/choose-a-plan/catastrophic-plans/.
30 Oklahoma State Department of Health Oklahoma State Innovation Model Insurance Market Analysis – Discussion Draft August 31, 2015
Milliman Report
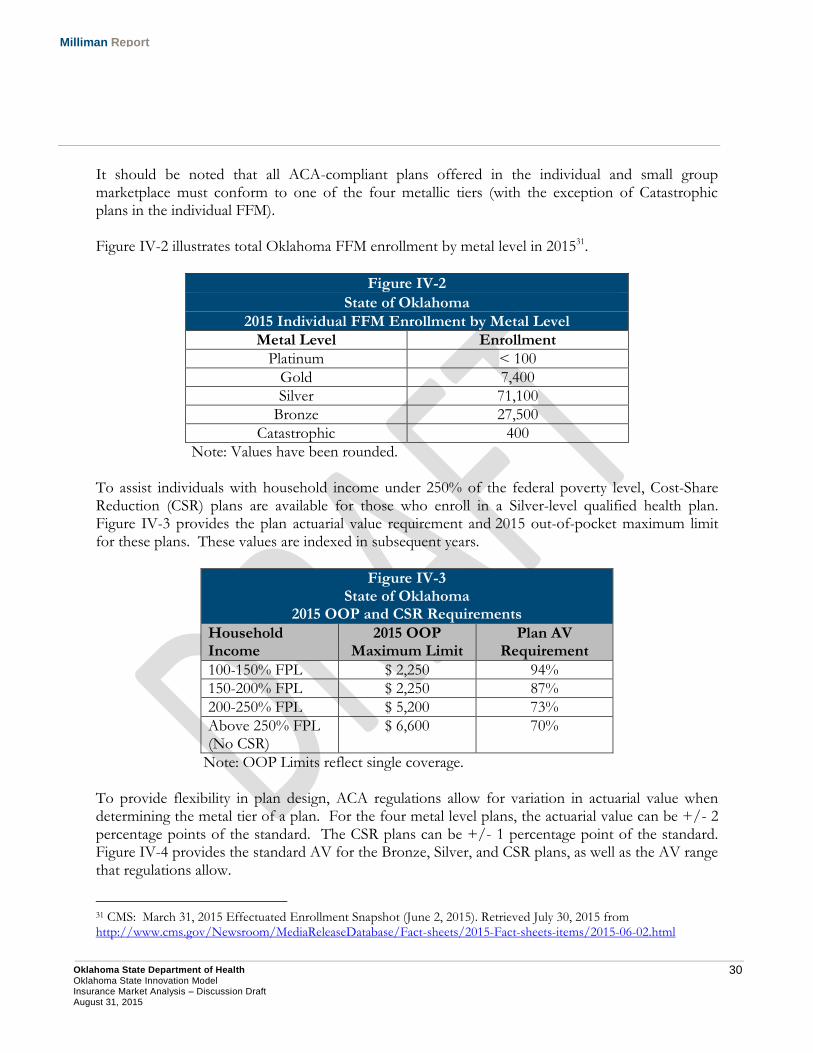
It should be noted that all ACA-compliant plans offered in the individual and small group marketplace must conform to one of the four metallic tiers (with the exception of Catastrophic plans in the individual FFM). Figure IV-2 illustrates total Oklahoma FFM enrollment by metal level in 201531.
Figure IV-2
State of Oklahoma
2015 Individual FFM Enrollment by Metal Level
Metal Level Enrollment
Platinum < 100
Gold 7,400
Silver 71,100
Bronze 27,500
Catastrophic 400
Note: Values have been rounded. To assist individuals with household income under 250% of the federal poverty level, Cost-Share Reduction (CSR) plans are available for those who enroll in a Silver-level qualified health plan. Figure IV-3 provides the plan actuarial value requirement and 2015 out-of-pocket maximum limit for these plans. These values are indexed in subsequent years.
Figure IV-3 State of Oklahoma
2015 OOP and CSR Requirements
Household Income
2015 OOP Maximum Limit
Plan AV Requirement
100-150% FPL $ 2,250 94%
150-200% FPL $ 2,250 87%
200-250% FPL $ 5,200 73%
Above 250% FPL (No CSR)
$ 6,600 70%
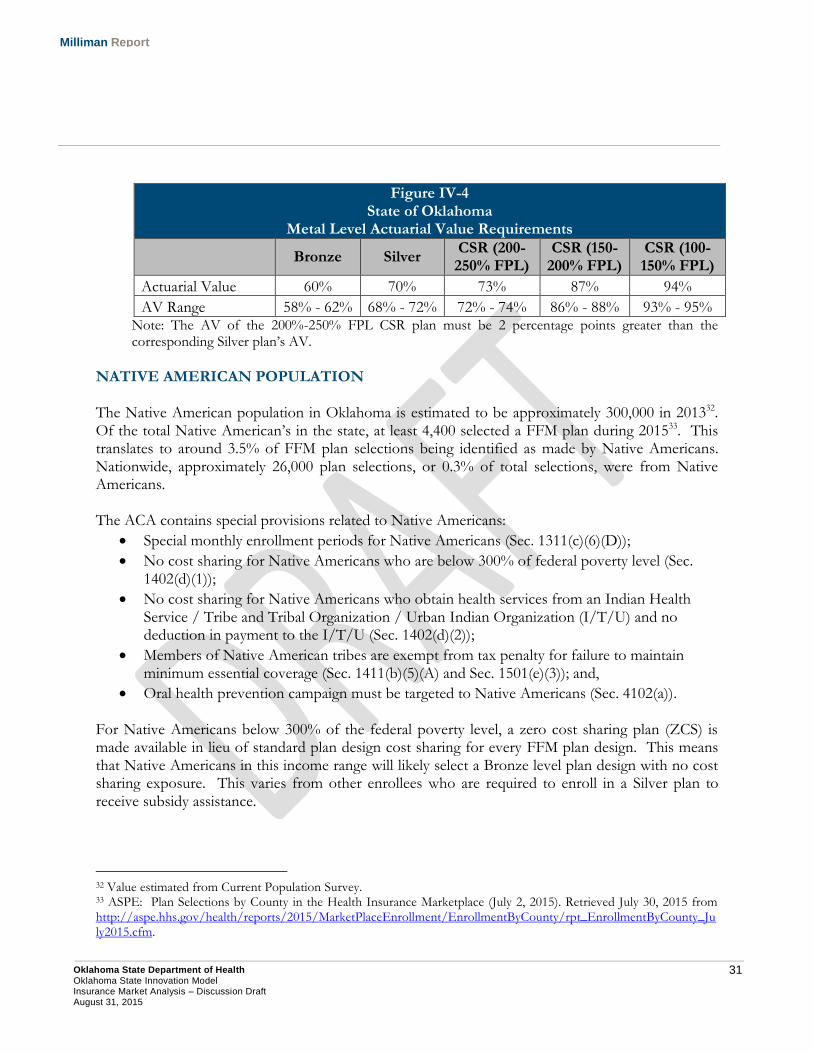
Note: OOP Limits reflect single coverage. To provide flexibility in plan design, ACA regulations allow for variation in actuarial value when determining the metal tier of a plan. For the four metal level plans, the actuarial value can be +/- 2 percentage points of the standard. The CSR plans can be +/- 1 percentage point of the standard. Figure IV-4 provides the standard AV for the Bronze, Silver, and CSR plans, as well as the AV range that regulations allow.
31 CMS: March 31, 2015 Effectuated Enrollment Snapshot (June 2, 2015). Retrieved July 30, 2015 from http://www.cms.gov/Newsroom/MediaReleaseDatabase/Fact-sheets/2015-Fact-sheets-items/2015-06-02.html
31 Oklahoma State Department of Health Oklahoma State Innovation Model Insurance Market Analysis – Discussion Draft August 31, 2015
Milliman Report
Figure IV-4 State of Oklahoma
Metal Level Actuarial Value Requirements
Bronze Silver CSR (200-250% FPL)
CSR (150-200% FPL)
CSR (100-150% FPL)
Actuarial Value 60% 70% 73% 87% 94%
AV Range 58% - 62% 68% - 72% 72% - 74% 86% - 88% 93% - 95% Note: The AV of the 200%-250% FPL CSR plan must be 2 percentage points greater than the corresponding Silver plan’s AV.
NATIVE AMERICAN POPULATION The Native American population in Oklahoma is estimated to be approximately 300,000 in 201332. Of the total Native American’s in the state, at least 4,400 selected a FFM plan during 201533. This translates to around 3.5% of FFM plan selections being identified as made by Native Americans. Nationwide, approximately 26,000 plan selections, or 0.3% of total selections, were from Native Americans. The ACA contains special provisions related to Native Americans:
Special monthly enrollment periods for Native Americans (Sec. 1311(c)(6)(D));
No cost sharing for Native Americans who are below 300% of federal poverty level (Sec. 1402(d)(1));
No cost sharing for Native Americans who obtain health services from an Indian Health Service / Tribe and Tribal Organization / Urban Indian Organization (I/T/U) and no deduction in payment to the I/T/U (Sec. 1402(d)(2));
Members of Native American tribes are exempt from tax penalty for failure to maintain minimum essential coverage (Sec. 1411(b)(5)(A) and Sec. 1501(e)(3)); and,
Oral health prevention campaign must be targeted to Native Americans (Sec. 4102(a)). For Native Americans below 300% of the federal poverty level, a zero cost sharing plan (ZCS) is made available in lieu of standard plan design cost sharing for every FFM plan design. This means that Native Americans in this income range will likely select a Bronze level plan design with no cost sharing exposure. This varies from other enrollees who are required to enroll in a Silver plan to receive subsidy assistance.
32 Value estimated from Current Population Survey. 33 ASPE: Plan Selections by County in the Health Insurance Marketplace (July 2, 2015). Retrieved July 30, 2015 from http://aspe.hhs.gov/health/reports/2015/MarketPlaceEnrollment/EnrollmentByCounty/rpt_EnrollmentByCounty_July2015.cfm.
32 Oklahoma State Department of Health Oklahoma State Innovation Model Insurance Market Analysis – Discussion Draft August 31, 2015
Milliman Report
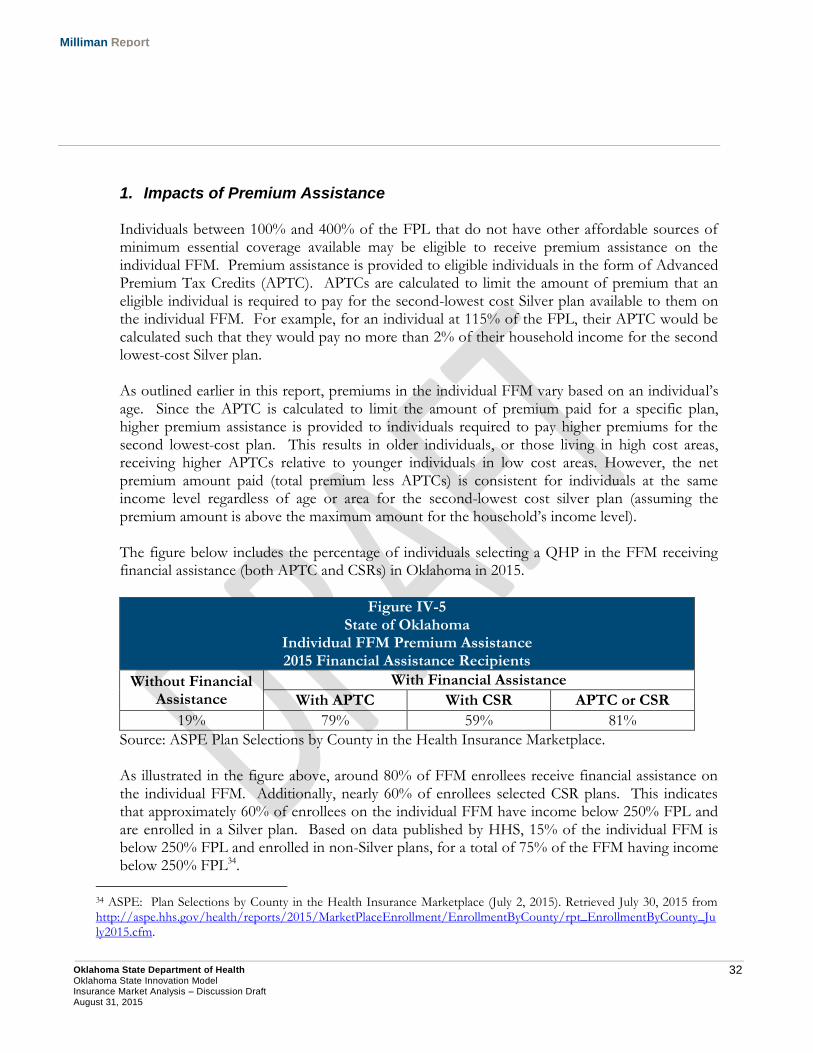
1. Impacts of Premium Assistance Individuals between 100% and 400% of the FPL that do not have other affordable sources of minimum essential coverage available may be eligible to receive premium assistance on the individual FFM. Premium assistance is provided to eligible individuals in the form of Advanced Premium Tax Credits (APTC). APTCs are calculated to limit the amount of premium that an eligible individual is required to pay for the second-lowest cost Silver plan available to them on the individual FFM. For example, for an individual at 115% of the FPL, their APTC would be calculated such that they would pay no more than 2% of their household income for the second lowest-cost Silver plan. As outlined earlier in this report, premiums in the individual FFM vary based on an individual’s age. Since the APTC is calculated to limit the amount of premium paid for a specific plan, higher premium assistance is provided to individuals required to pay higher premiums for the second lowest-cost plan. This results in older individuals, or those living in high cost areas, receiving higher APTCs relative to younger individuals in low cost areas. However, the net premium amount paid (total premium less APTCs) is consistent for individuals at the same income level regardless of age or area for the second-lowest cost silver plan (assuming the premium amount is above the maximum amount for the household’s income level). The figure below includes the percentage of individuals selecting a QHP in the FFM receiving financial assistance (both APTC and CSRs) in Oklahoma in 2015.
Figure IV-5 State of Oklahoma
Individual FFM Premium Assistance 2015 Financial Assistance Recipients
Without Financial Assistance
With Financial Assistance
With APTC With CSR APTC or CSR
19% 79% 59% 81%
Source: ASPE Plan Selections by County in the Health Insurance Marketplace. As illustrated in the figure above, around 80% of FFM enrollees receive financial assistance on the individual FFM. Additionally, nearly 60% of enrollees selected CSR plans. This indicates that approximately 60% of enrollees on the individual FFM have income below 250% FPL and are enrolled in a Silver plan. Based on data published by HHS, 15% of the individual FFM is below 250% FPL and enrolled in non-Silver plans, for a total of 75% of the FFM having income below 250% FPL34.
34 ASPE: Plan Selections by County in the Health Insurance Marketplace (July 2, 2015). Retrieved July 30, 2015 from http://aspe.hhs.gov/health/reports/2015/MarketPlaceEnrollment/EnrollmentByCounty/rpt_EnrollmentByCounty_July2015.cfm.
33 Oklahoma State Department of Health Oklahoma State Innovation Model Insurance Market Analysis – Discussion Draft August 31, 2015
Milliman Report
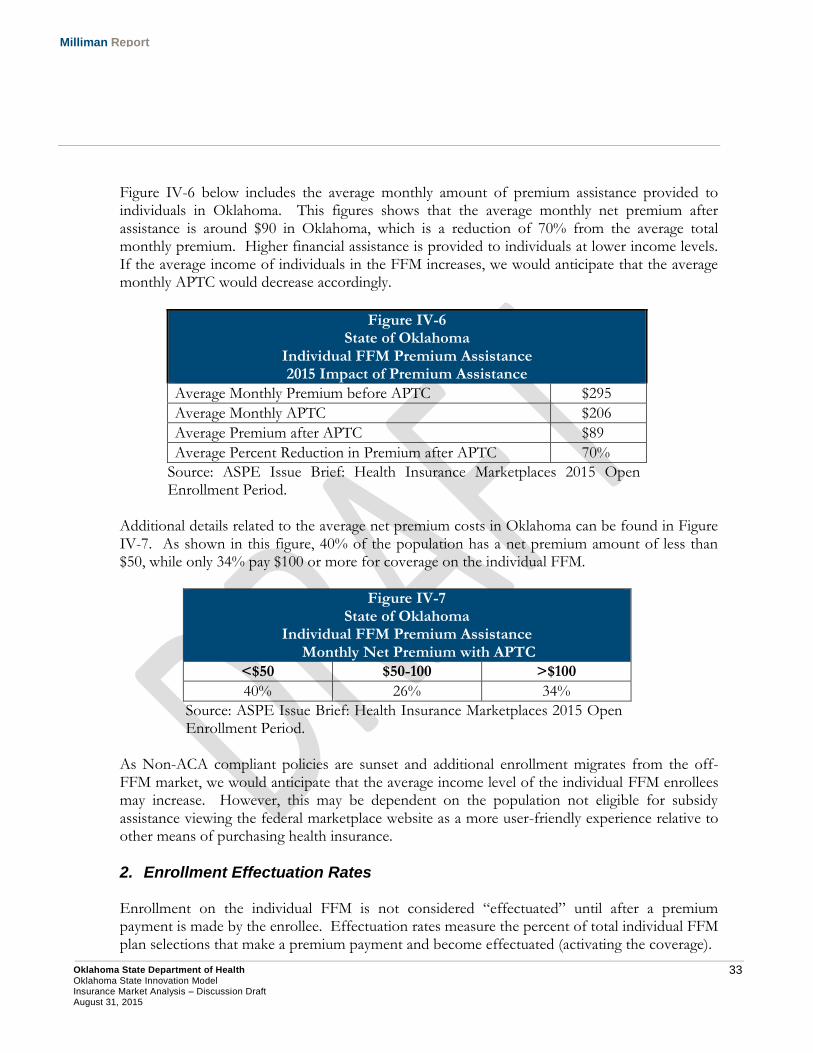
Figure IV-6 below includes the average monthly amount of premium assistance provided to individuals in Oklahoma. This figures shows that the average monthly net premium after assistance is around $90 in Oklahoma, which is a reduction of 70% from the average total monthly premium. Higher financial assistance is provided to individuals at lower income levels. If the average income of individuals in the FFM increases, we would anticipate that the average monthly APTC would decrease accordingly.
Figure IV-6 State of Oklahoma
Individual FFM Premium Assistance 2015 Impact of Premium Assistance
Average Monthly Premium before APTC $295
Average Monthly APTC $206
Average Premium after APTC $89
Average Percent Reduction in Premium after APTC 70%
Source: ASPE Issue Brief: Health Insurance Marketplaces 2015 Open Enrollment Period.
Additional details related to the average net premium costs in Oklahoma can be found in Figure IV-7. As shown in this figure, 40% of the population has a net premium amount of less than $50, while only 34% pay $100 or more for coverage on the individual FFM.
Figure IV-7 State of Oklahoma
Individual FFM Premium Assistance Monthly Net Premium with APTC
<$50 $50-100 >$100
40% 26% 34%
Source: ASPE Issue Brief: Health Insurance Marketplaces 2015 Open Enrollment Period.
As Non-ACA compliant policies are sunset and additional enrollment migrates from the off-FFM market, we would anticipate that the average income level of the individual FFM enrollees may increase. However, this may be dependent on the population not eligible for subsidy assistance viewing the federal marketplace website as a more user-friendly experience relative to other means of purchasing health insurance.
2. Enrollment Effectuation Rates Enrollment on the individual FFM is not considered “effectuated” until after a premium payment is made by the enrollee. Effectuation rates measure the percent of total individual FFM plan selections that make a premium payment and become effectuated (activating the coverage).
34 Oklahoma State Department of Health Oklahoma State Innovation Model Insurance Market Analysis – Discussion Draft August 31, 2015
Milliman Report
Individuals receiving APTCs, 82% of Oklahoma FFM enrollees, are allowed a 90-day grace period with which to make premium payments to avoid having coverage terminated. After this grace period, if the amount owed for insurance premiums is not fully paid, the insurance carrier has the ability to terminate coverage, which results in the insurance coverage no longer being effectuated35. Based on data reported by HHS and relative to total open enrollment period plan selections 36, the Oklahoma individual FFM experienced an effectuation rate of 80.0% and 84.4% during 2014 (year-end) and 2015 (March 31st), respectively. For all FFMs, the effectuation rate for 2014 was 78.5% and was 85.1% in 2015. This data implies that Oklahoma experienced a higher effectuation rate on average in 2014, yet year-to-date has seen a lower effectuation rate than the FFM composite. Insurer rate increases and the FFM auto-enrollment methodology have the potential to impact the effectuation rates of individual FFM enrollment. In FFM states, 2014 individual FFM enrollees had the option to auto-enroll in coverage or go through a redetermination process in 2015. The redetermination process consists of enrolling in the same manner as new enrollees, with plan selections and APTCs being determined based on the 2015 data and information. The FFM auto-enrollment methodology permits a qualifying individual to be automatically enrolled in their current QHP for the upcoming coverage year. The APTC amount is set equal to the dollar amount of monthly subsidy a household is receiving in the current year. For example, if the 2015 monthly APTC was $200 per month, the 2016 APTC amount will also be $200 per month (note, final subsidy amounts are reconciled to those prescribed by the ACA when the household files taxes). The formula for the FFM auto-enrollment APTC may lead to significant net cost changes for some consumers. For example, if an individual selected a $300 monthly premium plan in 2015 and applied a $200 subsidy, the net monthly cost would be $100. To the extent an insurer increased their premium rates by 10% in 2016, the new monthly premium would be $330. Under the FFM auto-enrollment process, the $200 monthly APTC amount from 2015 would be applied to the 2016 premium, resulting in a 2016 net cost to the consumer of $130 (a 30% increase in costs relative to 2015).
35 Please see http://healthaffairs.org/blog/2014/11/17/how-consumers-might-game-the-90-day-grace-period-and-what-can-be-done-about-it/ for more information concerning the 90 day grace period provisions. 36 CMS: March 31, 2015 Effectuated Enrollment Snapshot (June 2, 2015). Retrieved July 30, 2015 from http://www.cms.gov/Newsroom/MediaReleaseDatabase/Fact-sheets/2015-Fact-sheets-items/2015-06-02.html. ASPE: Health Insurance Marketplace: Summary Enrollment Report for the Initial Annual Enrollment Period (May 1, 2014). Retrieved July 30, 2015 from http://aspe.hhs.gov/health/reports/2014/marketplaceenrollment/apr2014/ib_2014apr_enrollment.pdf. ASPE: Health Insurance Marketplaces 2015 Open Enrollment Period: March Enrollment Report (March 10, 2015). Retrieved July 30, 2015 from http://aspe.hhs.gov/health/reports/2015/MarketPlaceEnrollment/Mar2015/ib_2015mar_enrollment.pdf.
35 Oklahoma State Department of Health Oklahoma State Innovation Model Insurance Market Analysis – Discussion Draft August 31, 2015
Milliman Report
To the extent the consumer did not actively purchase a new plan or the same plan in 2016, the higher monthly net cost in 2016 may lead to greater chance of non-premium payment. Therefore, from a consumer education perspective, it is important to address that increases in net cost resulting from the FFM auto-enrollment process may be mitigated by actively purchasing a plan during the open enrollment period37. By reviewing insurance carrier quarterly financial statement information, we can gain insight into quarterly changes in an insurer’s reported individual market covered lives and estimated effectuation rates. Due to the open enrollment period for the individual FFM, most of the population is anticipated to enroll during the first two quarters of the year. During the third and fourth quarters, enrollment that does not effectuate will result in observed decreases in a carriers covered lives. Based on quarterly financial statement information for insurance carriers in Oklahoma and nearby states, carriers generally experience enrollment increases in the first and second quarter of 2014 followed by decreases in the third and fourth quarter. Between the first and second quarter, carriers experienced significant enrollment increases in the observed states. This is likely driven by the extended open enrollment period that occurred during 2014. A majority of the enrollment decrease observed in the third and fourth quarter of 2014 may be driven by individual FFM members not effectuating their enrollment. However, there is a wide variation in the enrollment decreases observed in 2014. Some carriers experienced high enrollment decrease in the third quarter, with much lower decreases in the fourth quarter. This would imply that they had a large number of enrollees that did not make their first premium payment, and as a result did not effectuate their enrollment by the end of the 90 day grace period. Other carriers experienced much greater enrollment decreases in the fourth quarter compared to the third quarter of 2014. In these situations, either the carrier may have been more relaxed in enforcing the 90 day grace period, or may have had a large number of members stop paying premiums after making an initial payment. It should be noted that the presence of off-FFM and transitional policies dampens the observed enrollment changes for some carriers.
3. Carrier Competition and Consumer Choice The number of carriers offering coverage on the individual FFM, along with the number of available benefit plans, varies by county within Oklahoma. Within each county, there is also variation in the premium rates for plans offered by carriers. Figures IV-8 and IV-9 summarize these key statistics for both 2014 and 2015. Additionally, Figures IV-10 and IV-11 contain maps of the number of carriers offering coverage by county for both 2014 and 2015.
37 Please see http://us.milliman.com/uploadedFiles/insight/2014/federal-exchange-auto-enrollment.pdf for more information concerning the FFM auto-enrollment process.
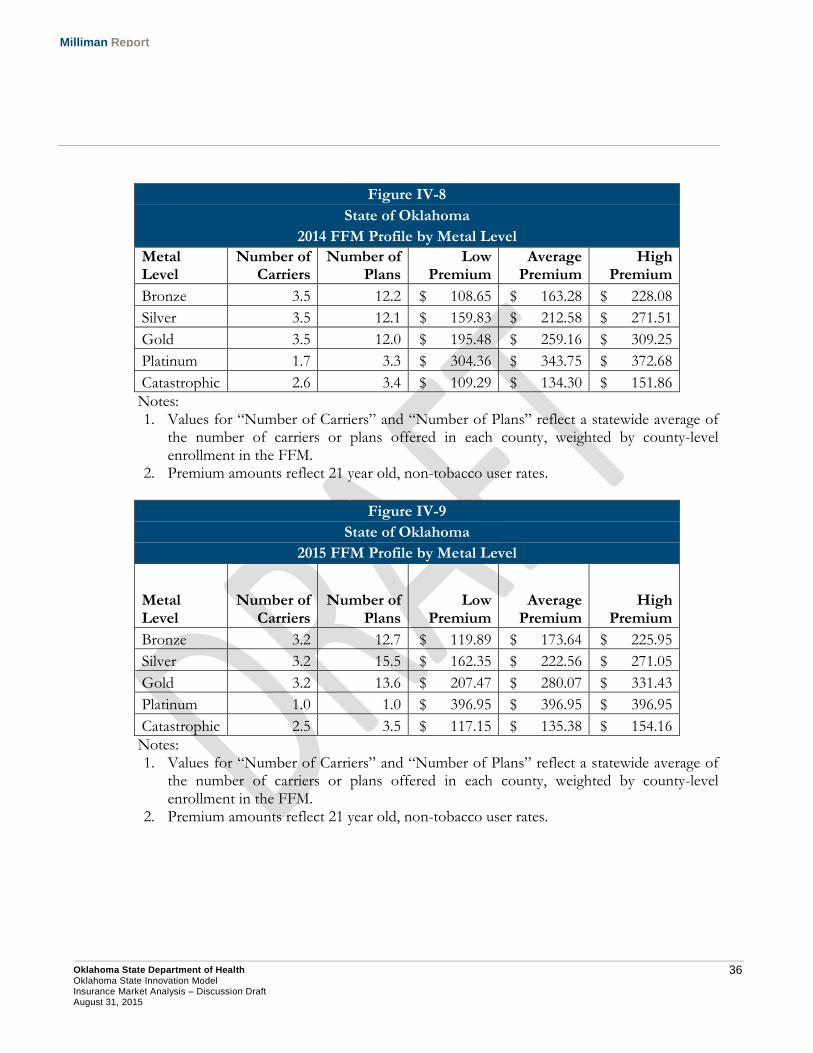
36 Oklahoma State Department of Health Oklahoma State Innovation Model Insurance Market Analysis – Discussion Draft August 31, 2015
Milliman Report
Figure IV-8
State of Oklahoma
2014 FFM Profile by Metal Level
Metal Level
Number of Carriers
Number of Plans
Low Premium
Average Premium
High Premium
Bronze 3.5 12.2 $ 108.65 $ 163.28 $ 228.08
Silver 3.5 12.1 $ 159.83 $ 212.58 $ 271.51
Gold 3.5 12.0 $ 195.48 $ 259.16 $ 309.25
Platinum 1.7 3.3 $ 304.36 $ 343.75 $ 372.68
Catastrophic 2.6 3.4 $ 109.29 $ 134.30 $ 151.86
Notes: 1. Values for “Number of Carriers” and “Number of Plans” reflect a statewide average of
the number of carriers or plans offered in each county, weighted by county-level enrollment in the FFM.
2. Premium amounts reflect 21 year old, non-tobacco user rates.
Figure IV-9
State of Oklahoma
2015 FFM Profile by Metal Level
Metal Level
Number of Carriers
Number of Plans
Low Premium
Average Premium
High Premium
Bronze 3.2 12.7 $ 119.89 $ 173.64 $ 225.95
Silver 3.2 15.5 $ 162.35 $ 222.56 $ 271.05
Gold 3.2 13.6 $ 207.47 $ 280.07 $ 331.43
Platinum 1.0 1.0 $ 396.95 $ 396.95 $ 396.95
Catastrophic 2.5 3.5 $ 117.15 $ 135.38 $ 154.16
Notes: 1. Values for “Number of Carriers” and “Number of Plans” reflect a statewide average of
the number of carriers or plans offered in each county, weighted by county-level enrollment in the FFM.
2. Premium amounts reflect 21 year old, non-tobacco user rates.
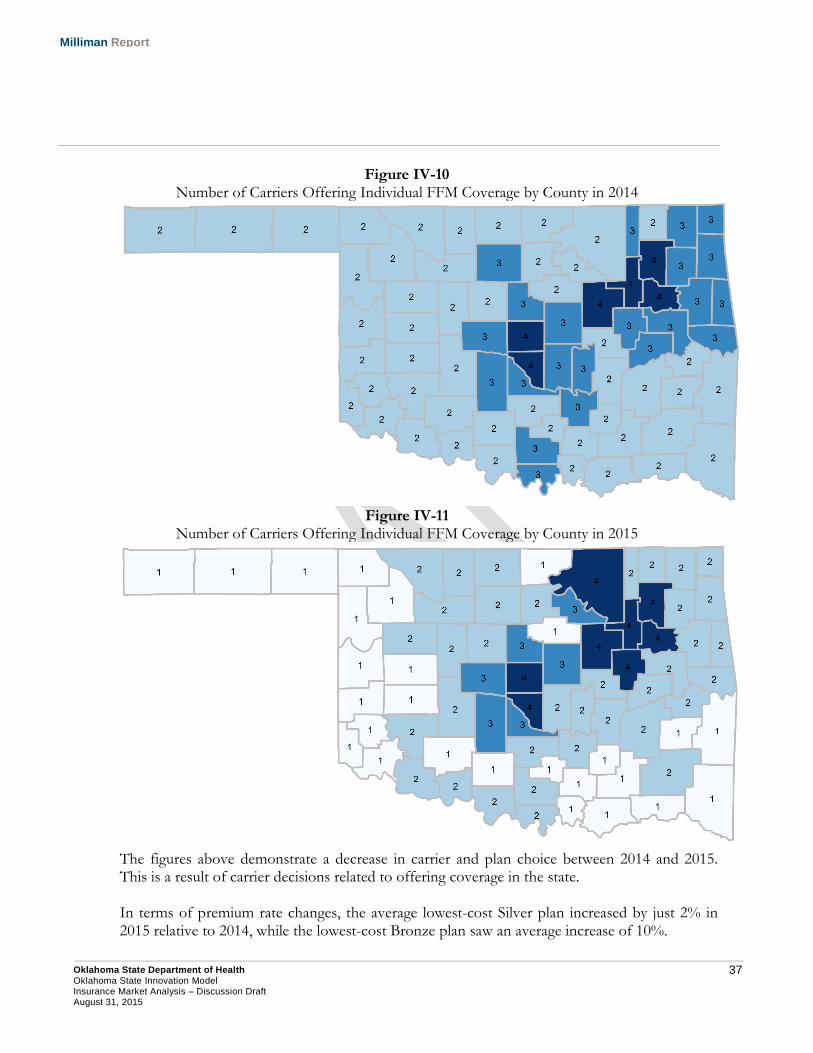
37 Oklahoma State Department of Health Oklahoma State Innovation Model Insurance Market Analysis – Discussion Draft August 31, 2015
Milliman Report
Figure IV-10 Number of Carriers Offering Individual FFM Coverage by County in 2014
Figure IV-11
Number of Carriers Offering Individual FFM Coverage by County in 2015
The figures above demonstrate a decrease in carrier and plan choice between 2014 and 2015. This is a result of carrier decisions related to offering coverage in the state. In terms of premium rate changes, the average lowest-cost Silver plan increased by just 2% in 2015 relative to 2014, while the lowest-cost Bronze plan saw an average increase of 10%.
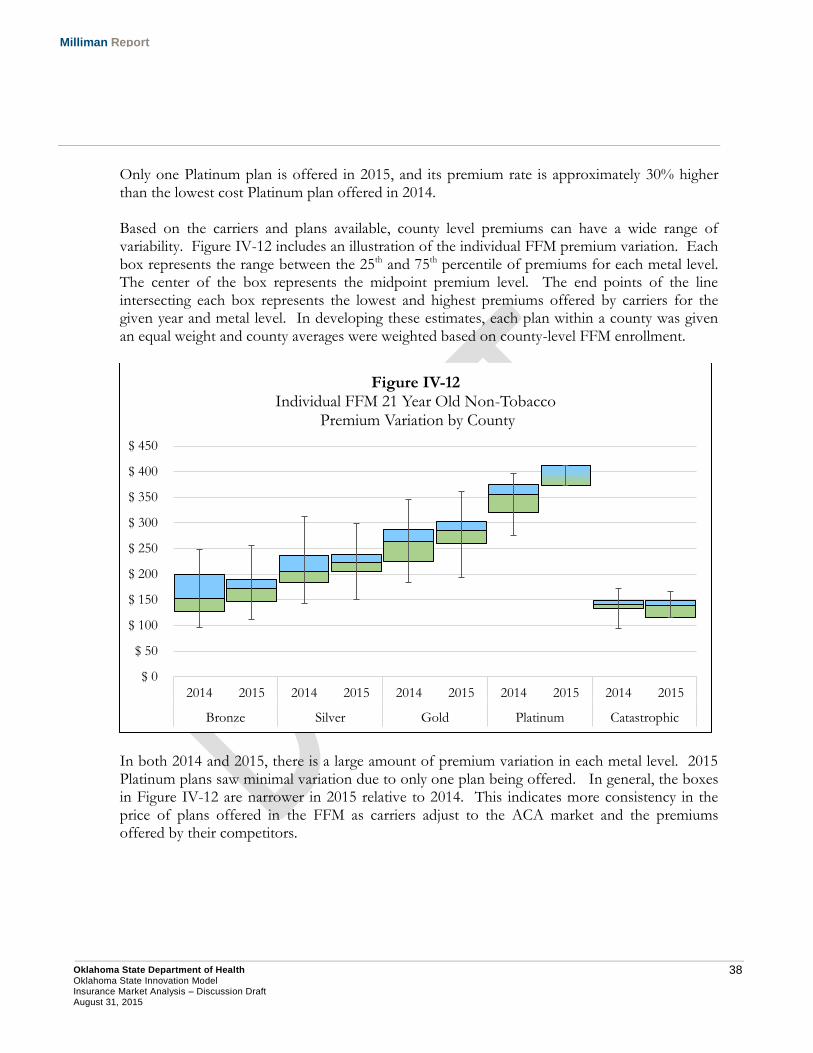
38 Oklahoma State Department of Health Oklahoma State Innovation Model Insurance Market Analysis – Discussion Draft August 31, 2015
Milliman Report
Only one Platinum plan is offered in 2015, and its premium rate is approximately 30% higher than the lowest cost Platinum plan offered in 2014. Based on the carriers and plans available, county level premiums can have a wide range of variability. Figure IV-12 includes an illustration of the individual FFM premium variation. Each box represents the range between the 25th and 75th percentile of premiums for each metal level. The center of the box represents the midpoint premium level. The end points of the line intersecting each box represents the lowest and highest premiums offered by carriers for the given year and metal level. In developing these estimates, each plan within a county was given an equal weight and county averages were weighted based on county-level FFM enrollment.
In both 2014 and 2015, there is a large amount of premium variation in each metal level. 2015 Platinum plans saw minimal variation due to only one plan being offered. In general, the boxes in Figure IV-12 are narrower in 2015 relative to 2014. This indicates more consistency in the price of plans offered in the FFM as carriers adjust to the ACA market and the premiums offered by their competitors.
$ 0
$ 50
$ 100
$ 150
$ 200
$ 250
$ 300
$ 350
$ 400
$ 450
2014 2015 2014 2015 2014 2015 2014 2015 2014 2015
Bronze Silver Gold Platinum Catastrophic
Figure IV-12 Individual FFM 21 Year Old Non-Tobacco
Premium Variation by County
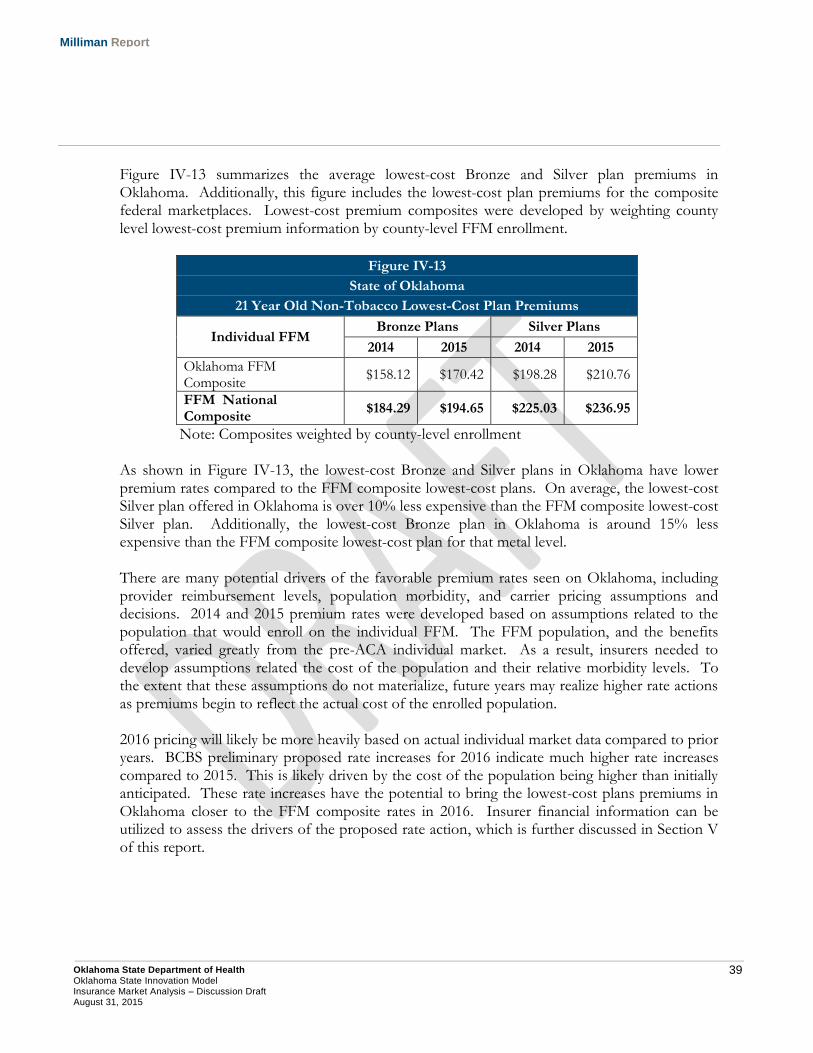
39 Oklahoma State Department of Health Oklahoma State Innovation Model Insurance Market Analysis – Discussion Draft August 31, 2015
Milliman Report
Figure IV-13 summarizes the average lowest-cost Bronze and Silver plan premiums in Oklahoma. Additionally, this figure includes the lowest-cost plan premiums for the composite federal marketplaces. Lowest-cost premium composites were developed by weighting county level lowest-cost premium information by county-level FFM enrollment.
Figure IV-13
State of Oklahoma
21 Year Old Non-Tobacco Lowest-Cost Plan Premiums
Individual FFM Bronze Plans Silver Plans
2014 2015 2014 2015
Oklahoma FFM Composite
$158.12 $170.42 $198.28 $210.76
FFM National Composite
$184.29 $194.65 $225.03 $236.95
Note: Composites weighted by county-level enrollment As shown in Figure IV-13, the lowest-cost Bronze and Silver plans in Oklahoma have lower premium rates compared to the FFM composite lowest-cost plans. On average, the lowest-cost Silver plan offered in Oklahoma is over 10% less expensive than the FFM composite lowest-cost Silver plan. Additionally, the lowest-cost Bronze plan in Oklahoma is around 15% less expensive than the FFM composite lowest-cost plan for that metal level. There are many potential drivers of the favorable premium rates seen on Oklahoma, including provider reimbursement levels, population morbidity, and carrier pricing assumptions and decisions. 2014 and 2015 premium rates were developed based on assumptions related to the population that would enroll on the individual FFM. The FFM population, and the benefits offered, varied greatly from the pre-ACA individual market. As a result, insurers needed to develop assumptions related the cost of the population and their relative morbidity levels. To the extent that these assumptions do not materialize, future years may realize higher rate actions as premiums begin to reflect the actual cost of the enrolled population.
2016 pricing will likely be more heavily based on actual individual market data compared to prior years. BCBS preliminary proposed rate increases for 2016 indicate much higher rate increases compared to 2015. This is likely driven by the cost of the population being higher than initially anticipated. These rate increases have the potential to bring the lowest-cost plans premiums in Oklahoma closer to the FFM composite rates in 2016. Insurer financial information can be utilized to assess the drivers of the proposed rate action, which is further discussed in Section V of this report.
40 Oklahoma State Department of Health Oklahoma State Innovation Model Insurance Market Analysis – Discussion Draft August 31, 2015
Milliman Report
4. FFM Network Analysis As a result of the standardization of rating practices and benefit design, as well as the increased price sensitivity and transparency in the individual and small group markets, insurers competing in the FFM have placed an increased emphasis on provider network design to develop more price competitive products. This section begins with a description of how the ACA has increased the importance of provider networks strategy for insurers in the individual and small group markets, and then discusses key considerations for insurers in developing networks. We end with an illustration of the variance in availability of primary care physicians in QHPs offered on the individual FFM. ACA CHANGES TO THE RATE DEVELOPMENT PROCESS The ACA standardized the underwriting, premium rate development process, and product offerings in the individual and small group health insurance markets for new coverage written on or after January 1, 2014. This standardization has the potential to create an increased emphasis on network strategy. Examples of such standardization, which apply only to individual and small group markets, include:
Implementing adjusted community rating to both markets, permitting insurers to only vary premiums by age (limited to a 3:1 ratio), tobacco usage, geographic region, and family size.
Requiring insurers to offer coverage for the State’s essential health benefits (EHB).
Risk adjustment between insurers to limit the ability for an insurer to gain financially by covering healthier individuals relative to the aggregate market.
Requiring coverage to be offered in one of four38 metallic benefit tiers (bronze, silver, gold, and platinum) that correspond respectively to actuarial values of 60%, 70%, 80%, and 90%.
In the pre-ACA market, an insurer may have created a product with a lower premium by adjusting benefit design, underwriting practices, or another variable that has been standardized or removed as a permissible rating factor by the ACA. In addition to standardizing the coverage offered by insurers in the individual and small group markets, the ACA also allows consumers to view all coverage offered in the FFM on a single website. Consumers can easily see the price differences between insurers and QHPs by the four metallic tiers. In addition to price transparency, the structure of available premium assistance to qualifying individuals with household income between 100% and 400% FPL creates a very price sensitive market.
38 Insurers in the individual market may also offer a catastrophic plan for individuals under age 30 or who do not have an affordable metallic-level plan.
41 Oklahoma State Department of Health Oklahoma State Innovation Model Insurance Market Analysis – Discussion Draft August 31, 2015
Milliman Report
While households or individuals qualifying for premium assistance can apply their premium subsidy amount to any QHP offered in the FFM, they are exposed to the full premium differences between plans. For example, assume an individual qualifies for a $250 monthly premium subsidy. There are two QHPs available to purchase:
Plan A is $300 per month
Plan B is $350 per month After applying the $250 premium subsidy to both plans, the net cost to the individual will be:
Plan A is $50 per month
Plan B is $100 per month Given that more than 60% of Oklahomans selecting plans in the individual FFM had household income below 200% FPL39, consumers in the FFM are likely to be very sensitive to out-of-pocket premium changes, such as the $50 price differential between Plan A and B illustrated above. This is supported by data on 2014 federal marketplace selections that indicated 64% of consumers selected either the lowest or second-lowest cost plan in a given metallic tier40. For insurers, this translates into a need to have coverage priced favorably relative to their competition. FACTORS INSURERS CONSIDER WHEN DEVELOPING NETWORKS In a report for America’s Health Insurance Plans (AHIP), Milliman detailed four factors in the development of provider networks41:
Network Access and Adequacy Regardless of other factors, a necessary requirement in the development of a provider network is to ensure that it has the capacity to provide the covered services under the insurance benefit plan to its insured members. In evaluating provider networks, CMS uses the term “reasonable access” to evaluate provider networks42. In practice, reasonable access may be measured by two measures43:
39 ASPE: 2015 Qualified Health Plan Selections in the Health Insurance Marketplace (February 22, 2015). Retrieved July 30, 2015 from http://aspe.hhs.gov/health/reports/2015/MarketPlaceEnrollment/EnrollmentByCounty/County%20Level%20Data%202%2022%202015.XLSX. 40 Burke, A., Misra, A., & Sheingold, S. ASPE: Premium Affordability, Competition, and Choice in the Health Insurance Marketplace, 2014 (June 18, 2014). Retrieved July 30, 2015 from http://aspe.hhs.gov/health/reports/2014/premiums/2014mktplaceprembrf.pdf, Table 4, page 8. 41 O’Connor, J. and Spector, J. High-Value Healthcare Provider Networks (July 2, 2014). Retrieved July 30, 2015 from http://www.ahip.org/Workarea/DownloadAsset.aspx?id=2147497736. 42 CMS: 2016 Letter to Issuers (February 20, 2015). Retrieved July 30, 2015 from http://www.cms.gov/CCIIO/Resources/Regulations-and-Guidance/Downloads/2016-Letter-to-Issuers-2-20-2015-R.pdf, p23. 43 O’Connor, J. and Spector, J. High-Value Healthcare Provider Networks (July 2, 2014). Retrieved July 30, 2015 from http://www.ahip.org/Workarea/DownloadAsset.aspx?id=2147497736., page 9-10.
42 Oklahoma State Department of Health Oklahoma State Innovation Model Insurance Market Analysis – Discussion Draft August 31, 2015
Milliman Report
1. Access – As measured by distance or time, access measures evaluate the distance between provider offices and member locations. For example, an access measure may require a primary care physician to be located within 10 miles of each member.
2. Adequacy – These measures typically evaluate the ratio of the number of providers in a specific practice area relative to the covered population. For example, if a network had only 1 primary care physician per 10,000 members, this would be considered inadequate to serve the needs of the covered population. Regardless of the distance to the physician’s office, covered members would be unlikely to be able to make a timely appointment.
Based on a review of existing state laws related to provider network access and adequacy by the National Conference of State Legislatures (NCSL), 28 states and the District of Columbia have existing statutes in place44. However, within these existing statutes, there is a large degree of variance concerning the specificity of network standards. The NCSL report indicated that Oklahoma did not have any existing statutes related to provider network adequacy. With regard to requirements in the federal marketplace, a QHP issuer must ensure that its provider network for each of its QHPs meets the following standards for network adequacy45:
1. Include essential community providers to ensure reasonable and timely access to a broad range of such providers for low-income medically underserved individuals in the QHP’s service area46.
2. Maintains a network that is sufficient in number and type of providers, including providers that specialize in mental health and substance abuse services, to assure that all services will be accessible without unreasonable delay.
3. Is consistent with network adequacy provisions of section 2702(c)47 of the Public Health Services Act, which permit an insurer in the individual or group insurance market to close insurance coverage to additional employers or individuals to the extent it does not have the network capacity to serve new members.
4. Insurers must provide a provider directory for QHP consumers. All insurance carriers in the federal marketplace are required to complete the Network Adequacy Template48, which requires an insurer to submit the physicians, facilities, and pharmacies in each network associated with a QHP.
44 See http://www.ncsl.org/research/health/insurance-carriers-and-access-to-healthcare-providers-network-adequacy.aspx for additional information. 45 Network adequacy standards. Retrieved July 30, 2015 from https://www.law.cornell.edu/cfr/text/45/156.230. 46 Essential community providers. Retrieved July 30, 2015 from https://www.law.cornell.edu/cfr/text/45/156.235. 47 Guaranteed availability of coverage. Retrieved July 30, 2015 from https://www.law.cornell.edu/uscode/text/42/300gg-1. 48 CMS: Instructions for the Network Adequacy Application Section. Retrieved July 30, 2015 from https://www.cms.gov/CCIIO/Programs-and-Initiatives/Health-Insurance-Marketplaces/Downloads/Chapter06NetworkAdequacy-Ver21-040115.pdf.
43 Oklahoma State Department of Health Oklahoma State Innovation Model Insurance Market Analysis – Discussion Draft August 31, 2015
Milliman Report
In its instructions to insurers in the federally-facilitated marketplace for the 2016 coverage year, CMS states that it will assess provider networks using a “reasonable access” standard, focusing on hospital systems, mental health providers, oncology providers, primary care providers, and dental providers (if applicable)49. To meet requirements concerning essential community providers, insurers must contract with at least 30% of such providers in a QHP’s service area50. It should be noted that provider network standards in the FFM are likely to evolve over the near future. CMS has stated that it will be using information gathered from the Network Adequacy Template and QHP certification process to “assist in its articulation of future network adequacy standards in future rule making”51. Provider Cost Efficiency As discussed above, the nature of the FFM creates a very price competitive market, with insurers using network strategies as a means to lower premiums. A more cost effective network may be established by focusing on both unit cost and provider efficiency in developing the network. Insurers may establish a more cost effective network by negotiating lower reimbursement with providers. For example, an insurer may design a provider network that pays physicians at 120% of Medicare reimbursement relative to the normal 130%. Some physicians may opt not to participate in the network due to lower reimbursement. However, to the extent the insurer could contract with enough physicians at the lower rate to meet network adequacy standards, the premium rate for the product is likely to be lower. An insurer may also evaluate its historical utilization and cost data to evaluate which providers operate in a more cost efficient manner. For example, one hospital system may be more successful in reducing potentially unnecessary emergency room and inpatient admissions relative to its competitors in a service area. The insurer may elect to design a product in the FFM with the hospital system as its only in-network provider, while covering services from other hospital systems only on an out-of-network basis. Assuming such a product met network adequacy standards, the benefit expense for the product may be lower relative to competitors with broader networks.
49 CMS: 2016 Letter to Issuers (February 20, 2015). Retrieved July 30, 2015 from http://www.cms.gov/CCIIO/Resources/Regulations-and-Guidance/Downloads/2016-Letter-to-Issuers-2-20-2015-R.pdf, p23. 50 CMS: 2016 Letter to Issuers (February 20, 2015). Retrieved July 30, 2015 from http://www.cms.gov/CCIIO/Resources/Regulations-and-Guidance/Downloads/2016-Letter-to-Issuers-2-20-2015-R.pdf, p25. 51 CMS: 2016 Letter to Issuers (February 20, 2015). Retrieved July 30, 2015 from http://www.cms.gov/CCIIO/Resources/Regulations-and-Guidance/Downloads/2016-Letter-to-Issuers-2-20-2015-R.pdf, p23.
44 Oklahoma State Department of Health Oklahoma State Innovation Model Insurance Market Analysis – Discussion Draft August 31, 2015
Milliman Report
Quality Measures Healthcare payers, particularly Medicare and state Medicaid programs, are increasingly linking provider and insurer performance payments to quality measures. When developing or maintaining networks, insurers will evaluate providers on quality measures such as:
Healthcare Effectiveness Data and Information Set (HEDIS) – HEDIS statistics include the measuring the percentage of members receiving recommend preventive care, proper medication management, and chronic condition specific measures52.
Agency for Healthcare Research and Quality (AHRQ) Quality Indicators – AHRQ Quality Indicators may identify inpatient hospital admissions that may have been avoidable with better ambulatory care53.
Other clinical factors – These measures may be internally developed by an insurer to measure quality. Additionally, many state Medicaid agencies have created quality measures to assess system or health plan performance.
In some cases, these quality measures may be linked to greater cost efficiency. Providers that are not meeting quality measures may be removed from the product’s network to provide the insurer a greater chance of meeting quality standards. Brand Names Certain physician groups or hospital systems may have high brand recognition that may result in consumers making a purchasing decision simply based on whether or not such a provider is in the insurance product’s network. As many employers offer coverage to attract and retain employees, brand power may have greater leverage with insurers in the employer-based market as many employees may value provider choice and the ability to have services covered by well recognized providers. In the FFM, provider brand power may have less leverage with insurers, as the consumers will generally have lower incomes than the employer-based market and have shown a preference to the lowest cost plans in the market.
52 See http://www.ncqa.org/Portals/0/HEDISQM/HEDIS2016/HEDIS%202016%20List%20of%20Measures.pdf for additional information. 53 See http://www.qualityindicators.ahrq.gov/Default.aspx for additional information.
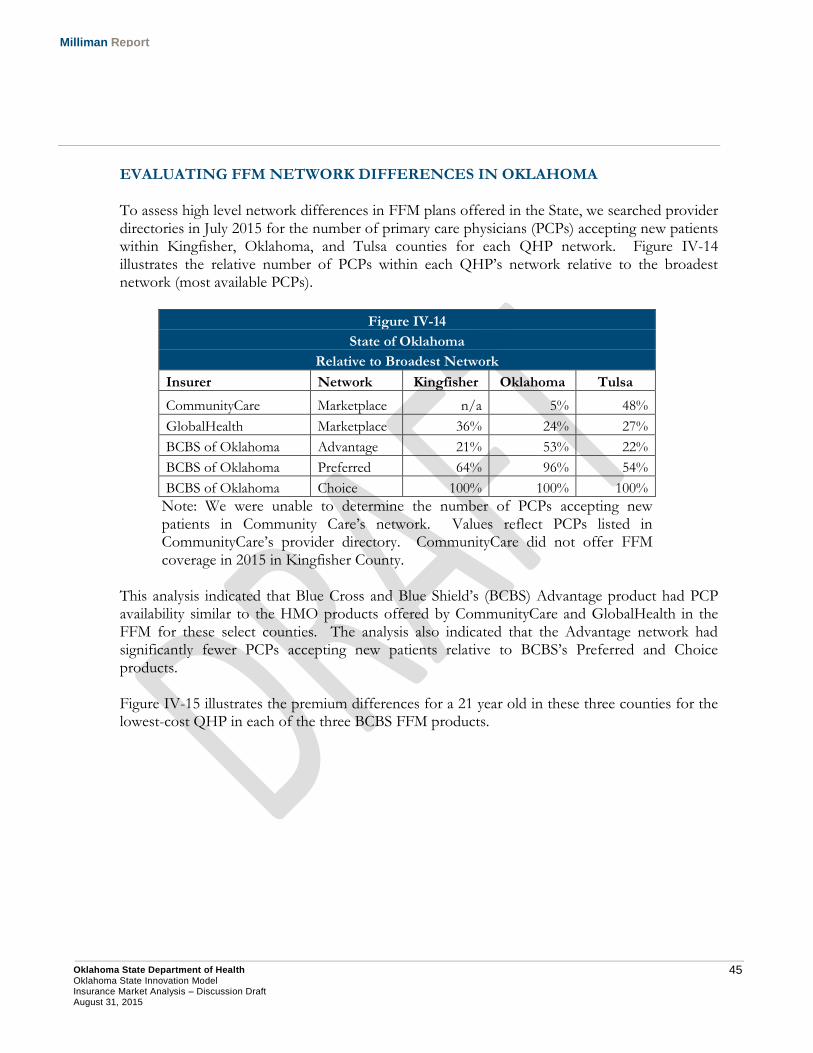
45 Oklahoma State Department of Health Oklahoma State Innovation Model Insurance Market Analysis – Discussion Draft August 31, 2015
Milliman Report
EVALUATING FFM NETWORK DIFFERENCES IN OKLAHOMA To assess high level network differences in FFM plans offered in the State, we searched provider directories in July 2015 for the number of primary care physicians (PCPs) accepting new patients within Kingfisher, Oklahoma, and Tulsa counties for each QHP network. Figure IV-14 illustrates the relative number of PCPs within each QHP’s network relative to the broadest network (most available PCPs).
Figure IV-14
State of Oklahoma
Relative to Broadest Network
Insurer Network Kingfisher Oklahoma Tulsa
CommunityCare Marketplace n/a 5% 48%
GlobalHealth Marketplace 36% 24% 27%
BCBS of Oklahoma Advantage 21% 53% 22%
BCBS of Oklahoma Preferred 64% 96% 54%
BCBS of Oklahoma Choice 100% 100% 100%
Note: We were unable to determine the number of PCPs accepting new patients in Community Care’s network. Values reflect PCPs listed in CommunityCare’s provider directory. CommunityCare did not offer FFM coverage in 2015 in Kingfisher County.
This analysis indicated that Blue Cross and Blue Shield’s (BCBS) Advantage product had PCP availability similar to the HMO products offered by CommunityCare and GlobalHealth in the FFM for these select counties. The analysis also indicated that the Advantage network had significantly fewer PCPs accepting new patients relative to BCBS’s Preferred and Choice products. Figure IV-15 illustrates the premium differences for a 21 year old in these three counties for the lowest-cost QHP in each of the three BCBS FFM products.
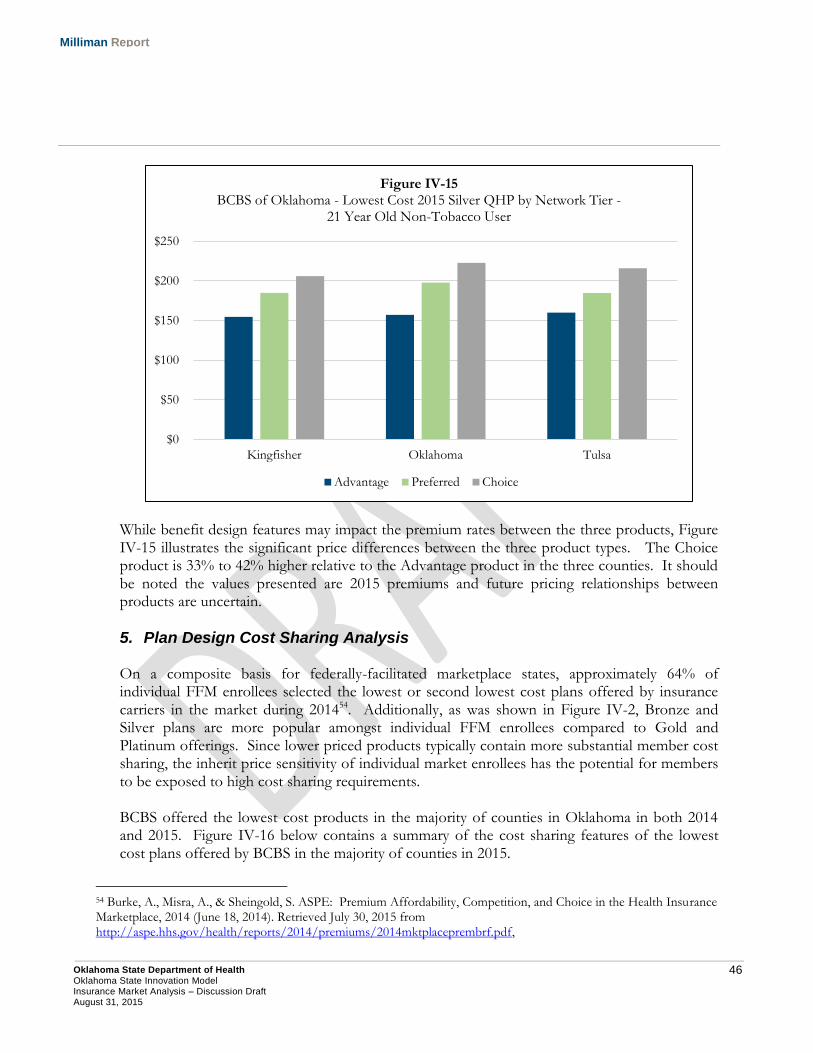
46 Oklahoma State Department of Health Oklahoma State Innovation Model Insurance Market Analysis – Discussion Draft August 31, 2015
Milliman Report
While benefit design features may impact the premium rates between the three products, Figure IV-15 illustrates the significant price differences between the three product types. The Choice product is 33% to 42% higher relative to the Advantage product in the three counties. It should be noted the values presented are 2015 premiums and future pricing relationships between products are uncertain.
5. Plan Design Cost Sharing Analysis
On a composite basis for federally-facilitated marketplace states, approximately 64% of individual FFM enrollees selected the lowest or second lowest cost plans offered by insurance carriers in the market during 201454. Additionally, as was shown in Figure IV-2, Bronze and Silver plans are more popular amongst individual FFM enrollees compared to Gold and Platinum offerings. Since lower priced products typically contain more substantial member cost sharing, the inherit price sensitivity of individual market enrollees has the potential for members to be exposed to high cost sharing requirements. BCBS offered the lowest cost products in the majority of counties in Oklahoma in both 2014 and 2015. Figure IV-16 below contains a summary of the cost sharing features of the lowest cost plans offered by BCBS in the majority of counties in 2015.
54 Burke, A., Misra, A., & Sheingold, S. ASPE: Premium Affordability, Competition, and Choice in the Health Insurance Marketplace, 2014 (June 18, 2014). Retrieved July 30, 2015 from http://aspe.hhs.gov/health/reports/2014/premiums/2014mktplaceprembrf.pdf,
$0
$50
$100
$150
$200
$250
Kingfisher Oklahoma Tulsa
Figure IV-15 BCBS of Oklahoma - Lowest Cost 2015 Silver QHP by Network Tier -
21 Year Old Non-Tobacco User
Advantage Preferred Choice
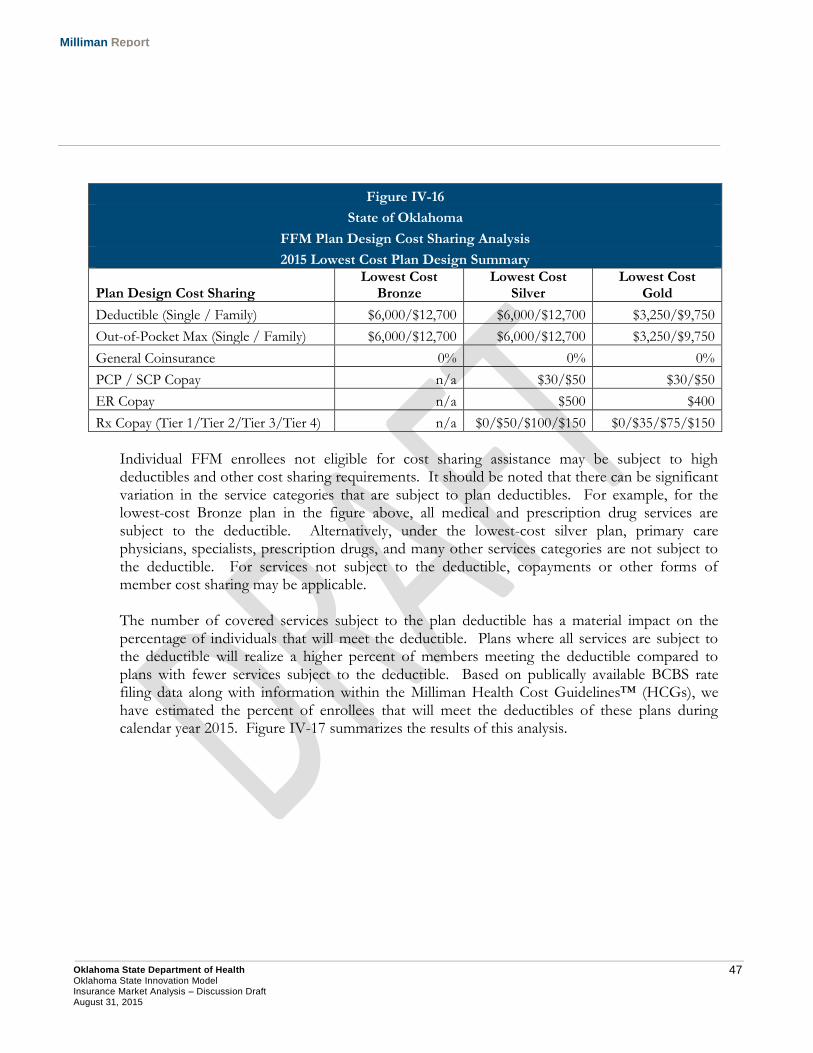
47 Oklahoma State Department of Health Oklahoma State Innovation Model Insurance Market Analysis – Discussion Draft August 31, 2015
Milliman Report
Figure IV-16
State of Oklahoma
FFM Plan Design Cost Sharing Analysis
2015 Lowest Cost Plan Design Summary
Plan Design Cost Sharing Lowest Cost
Bronze Lowest Cost
Silver Lowest Cost
Gold
Deductible (Single / Family) $6,000/$12,700 $6,000/$12,700 $3,250/$9,750
Out-of-Pocket Max (Single / Family) $6,000/$12,700 $6,000/$12,700 $3,250/$9,750
General Coinsurance 0% 0% 0%
PCP / SCP Copay n/a $30/$50 $30/$50
ER Copay n/a $500 $400
Rx Copay (Tier 1/Tier 2/Tier 3/Tier 4) n/a $0/$50/$100/$150 $0/$35/$75/$150
Individual FFM enrollees not eligible for cost sharing assistance may be subject to high deductibles and other cost sharing requirements. It should be noted that there can be significant variation in the service categories that are subject to plan deductibles. For example, for the lowest-cost Bronze plan in the figure above, all medical and prescription drug services are subject to the deductible. Alternatively, under the lowest-cost silver plan, primary care physicians, specialists, prescription drugs, and many other services categories are not subject to the deductible. For services not subject to the deductible, copayments or other forms of member cost sharing may be applicable. The number of covered services subject to the plan deductible has a material impact on the percentage of individuals that will meet the deductible. Plans where all services are subject to the deductible will realize a higher percent of members meeting the deductible compared to plans with fewer services subject to the deductible. Based on publically available BCBS rate filing data along with information within the Milliman Health Cost Guidelines™ (HCGs), we have estimated the percent of enrollees that will meet the deductibles of these plans during calendar year 2015. Figure IV-17 summarizes the results of this analysis.
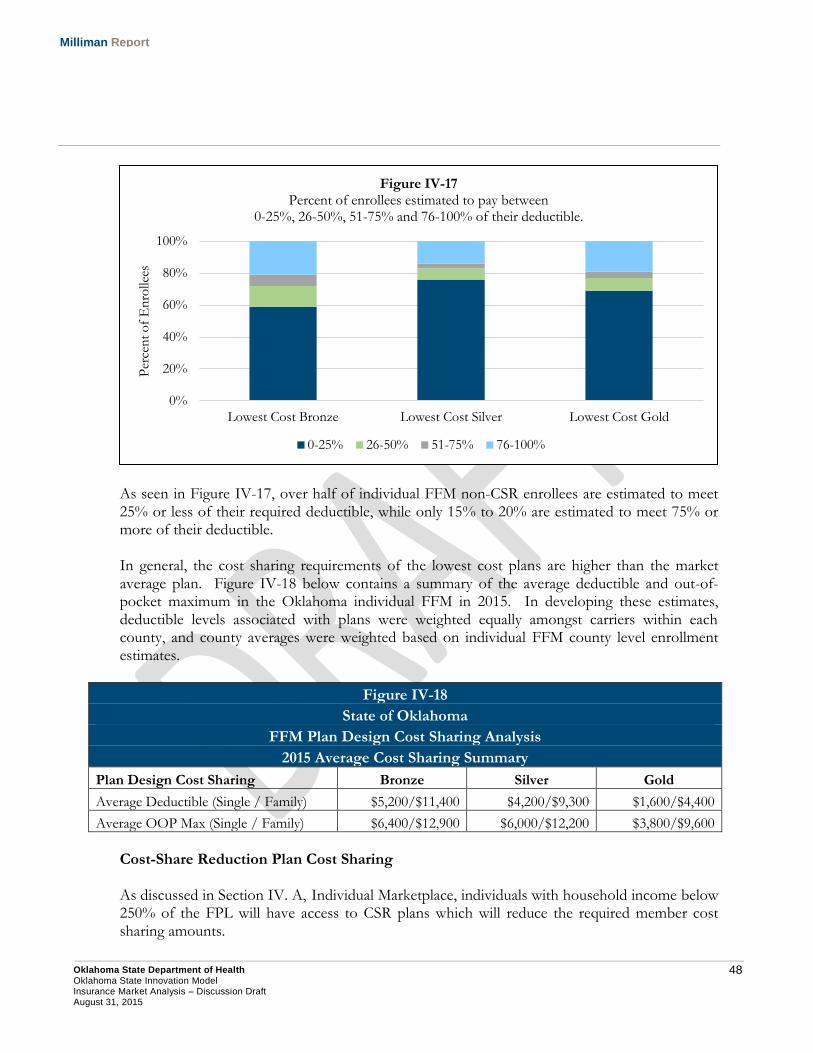
48 Oklahoma State Department of Health Oklahoma State Innovation Model Insurance Market Analysis – Discussion Draft August 31, 2015
Milliman Report
As seen in Figure IV-17, over half of individual FFM non-CSR enrollees are estimated to meet 25% or less of their required deductible, while only 15% to 20% are estimated to meet 75% or more of their deductible. In general, the cost sharing requirements of the lowest cost plans are higher than the market average plan. Figure IV-18 below contains a summary of the average deductible and out-of-pocket maximum in the Oklahoma individual FFM in 2015. In developing these estimates, deductible levels associated with plans were weighted equally amongst carriers within each county, and county averages were weighted based on individual FFM county level enrollment estimates.
Figure IV-18
State of Oklahoma
FFM Plan Design Cost Sharing Analysis
2015 Average Cost Sharing Summary
Plan Design Cost Sharing Bronze Silver Gold
Average Deductible (Single / Family) $5,200/$11,400 $4,200/$9,300 $1,600/$4,400
Average OOP Max (Single / Family) $6,400/$12,900 $6,000/$12,200 $3,800/$9,600
Cost-Share Reduction Plan Cost Sharing As discussed in Section IV. A, Individual Marketplace, individuals with household income below 250% of the FPL will have access to CSR plans which will reduce the required member cost sharing amounts.
0%
20%
40%
60%
80%
100%
Lowest Cost Bronze Lowest Cost Silver Lowest Cost Gold
Per
cen
t o
f E
nro
llees
Figure IV-17 Percent of enrollees estimated to pay between
0-25%, 26-50%, 51-75% and 76-100% of their deductible.
0-25% 26-50% 51-75% 76-100%
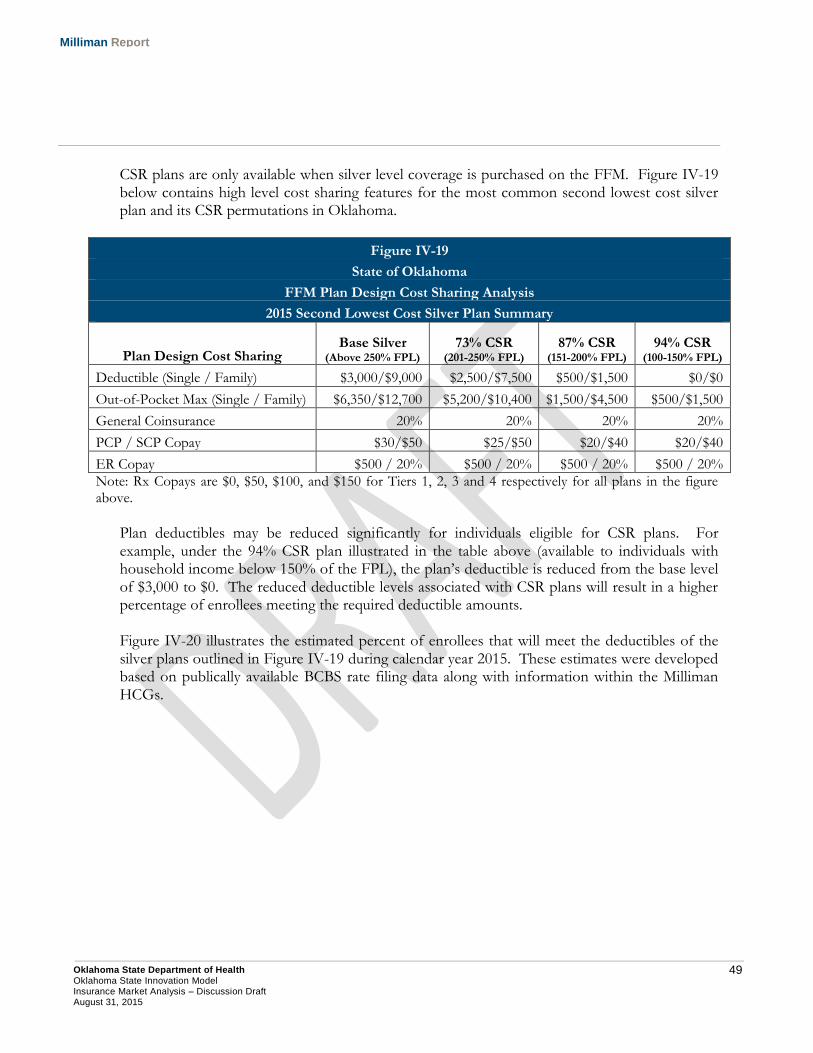
49 Oklahoma State Department of Health Oklahoma State Innovation Model Insurance Market Analysis – Discussion Draft August 31, 2015
Milliman Report
CSR plans are only available when silver level coverage is purchased on the FFM. Figure IV-19 below contains high level cost sharing features for the most common second lowest cost silver plan and its CSR permutations in Oklahoma.
Figure IV-19
State of Oklahoma
FFM Plan Design Cost Sharing Analysis
2015 Second Lowest Cost Silver Plan Summary
Plan Design Cost Sharing Base Silver
(Above 250% FPL) 73% CSR
(201-250% FPL) 87% CSR
(151-200% FPL) 94% CSR
(100-150% FPL)
Deductible (Single / Family) $3,000/$9,000 $2,500/$7,500 $500/$1,500 $0/$0
Out-of-Pocket Max (Single / Family) $6,350/$12,700 $5,200/$10,400 $1,500/$4,500 $500/$1,500
General Coinsurance 20% 20% 20% 20%
PCP / SCP Copay $30/$50 $25/$50 $20/$40 $20/$40
ER Copay $500 / 20% $500 / 20% $500 / 20% $500 / 20%
Note: Rx Copays are $0, $50, $100, and $150 for Tiers 1, 2, 3 and 4 respectively for all plans in the figure above.
Plan deductibles may be reduced significantly for individuals eligible for CSR plans. For example, under the 94% CSR plan illustrated in the table above (available to individuals with household income below 150% of the FPL), the plan’s deductible is reduced from the base level of $3,000 to $0. The reduced deductible levels associated with CSR plans will result in a higher percentage of enrollees meeting the required deductible amounts. Figure IV-20 illustrates the estimated percent of enrollees that will meet the deductibles of the silver plans outlined in Figure IV-19 during calendar year 2015. These estimates were developed based on publically available BCBS rate filing data along with information within the Milliman HCGs.
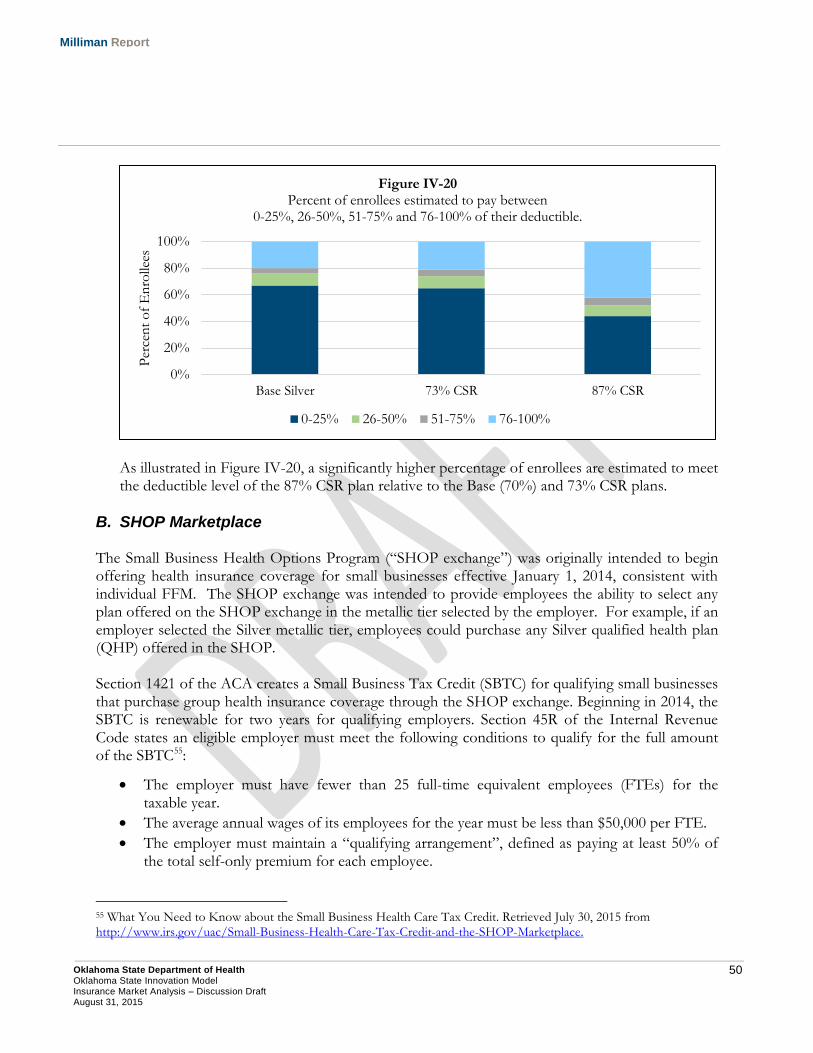
50 Oklahoma State Department of Health Oklahoma State Innovation Model Insurance Market Analysis – Discussion Draft August 31, 2015
Milliman Report
As illustrated in Figure IV-20, a significantly higher percentage of enrollees are estimated to meet the deductible level of the 87% CSR plan relative to the Base (70%) and 73% CSR plans.
B. SHOP Marketplace The Small Business Health Options Program (“SHOP exchange”) was originally intended to begin offering health insurance coverage for small businesses effective January 1, 2014, consistent with individual FFM. The SHOP exchange was intended to provide employees the ability to select any plan offered on the SHOP exchange in the metallic tier selected by the employer. For example, if an employer selected the Silver metallic tier, employees could purchase any Silver qualified health plan (QHP) offered in the SHOP. Section 1421 of the ACA creates a Small Business Tax Credit (SBTC) for qualifying small businesses that purchase group health insurance coverage through the SHOP exchange. Beginning in 2014, the SBTC is renewable for two years for qualifying employers. Section 45R of the Internal Revenue Code states an eligible employer must meet the following conditions to qualify for the full amount of the SBTC55:
The employer must have fewer than 25 full-time equivalent employees (FTEs) for the taxable year.
The average annual wages of its employees for the year must be less than $50,000 per FTE.
The employer must maintain a “qualifying arrangement”, defined as paying at least 50% of the total self-only premium for each employee.
55 What You Need to Know about the Small Business Health Care Tax Credit. Retrieved July 30, 2015 from http://www.irs.gov/uac/Small-Business-Health-Care-Tax-Credit-and-the-SHOP-Marketplace.
0%
20%
40%
60%
80%
100%
Base Silver 73% CSR 87% CSR
Per
cen
t o
f E
nro
llees
Figure IV-20 Percent of enrollees estimated to pay between
0-25%, 26-50%, 51-75% and 76-100% of their deductible.
0-25% 26-50% 51-75% 76-100%
51 Oklahoma State Department of Health Oklahoma State Innovation Model Insurance Market Analysis – Discussion Draft August 31, 2015
Milliman Report
The tax credit amount is reduced from its maximum levels to the extent the employer has more than 10 FTEs or average annual wages exceeding $25,000.
Beginning in 2014, the maximum credit is 50% of premiums paid for non-tax exempt small businesses, and 35% for small tax-exempt employers. Beginning in 2014, the tax credit is only available for two-consecutive taxable years56. For example, if a small business received the tax credit in 2014, it would be able to receive the tax credit again in 2015, but not thereafter.
1. Implementation and Initial Enrollment
The federal SHOP exchange has experienced two delays:
First, CMS announced in November 2013 that online SHOP enrollment would be delayed until November 2014. For 2014 insurance coverage, enrollment in the SHOP had to be facilitated through an agent or broker57.
Second, CMS announced in June 2014 that employee choice, the ability for an employee to select any QHP offered in a metallic tier, would not be available for the 2015 coverage year in the federal SHOP exchange in 18 states, including Oklahoma58.
Nationally, CMS has announced that approximately 85,000 Americans had health insurance coverage through the SHOP as of May 201559. Figure IV-21 below illustrates 2014 SHOP exchange enrollment as a percentage of the national small group market, as well as a percentage of state-specific small group markets for state-based SHOP exchanges in 2014.
56 Small Business Health Care Tax Credit Questions and Answers: Who Gets the Tax Credit. Retrieved July 30, 2015 from http://www.irs.gov/uac/Small-Business-Health-Care-Tax-Credit-Questions-and-Answers:-Who-Gets-the-Tax-Credit. 57 Kliff, S. Obamacare’s online SHOP enrollment delayed by one year (November 27, 2013). Retrieved July 30, 2015 from http://www.washingtonpost.com/blogs/wonkblog/wp/2013/11/27/obamacares-online-exchange-for-small-businesses-is-delayed-by-one-year/. 58 CMS: Small Business Health Options Program. Retrieved July 30, 2015 from http://www.cms.gov/CCIIO/Programs-and-Initiatives/Health-Insurance-Marketplaces/2015-Transition-to-Employee-Choice-.html. 59 Counihan, K. Update on SHOP Marketplaces for Small Businesses (July 2, 2015). Retrieved July 30, 2015 from http://blog.cms.gov/2015/07/02/update-on-shop-marketplaces-for-small-businesses/.
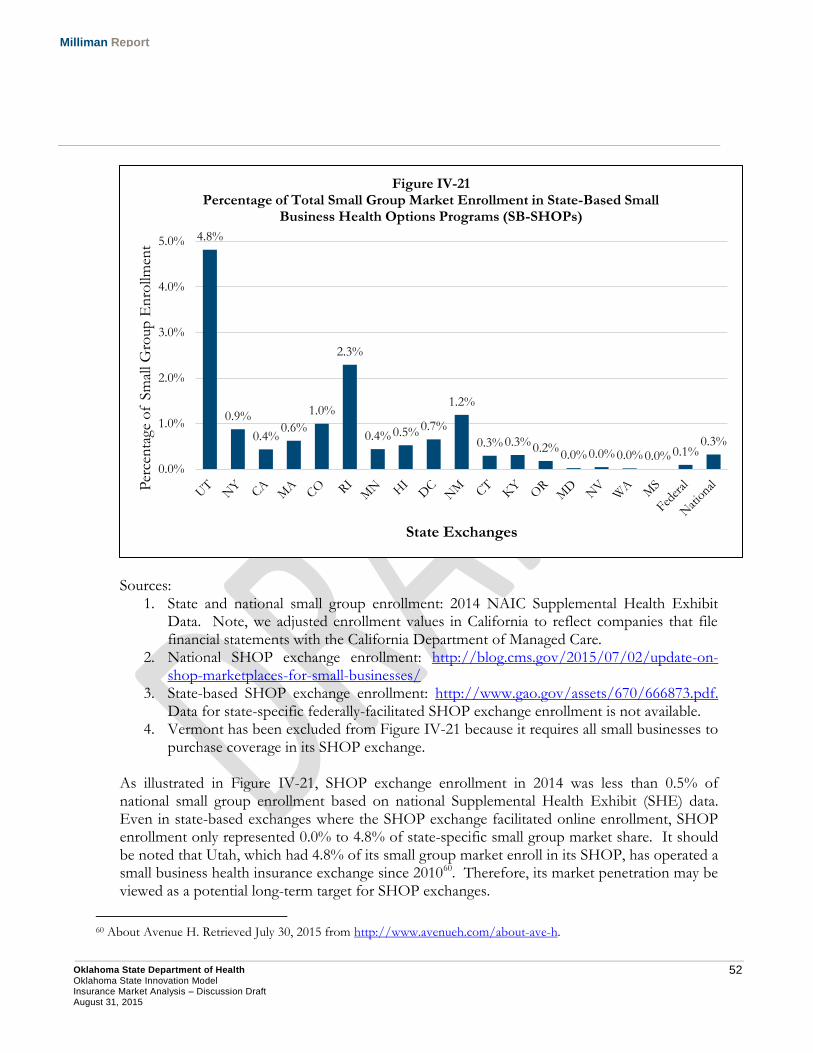
52 Oklahoma State Department of Health Oklahoma State Innovation Model Insurance Market Analysis – Discussion Draft August 31, 2015
Milliman Report
Sources:
1. State and national small group enrollment: 2014 NAIC Supplemental Health Exhibit Data. Note, we adjusted enrollment values in California to reflect companies that file financial statements with the California Department of Managed Care.
2. National SHOP exchange enrollment: http://blog.cms.gov/2015/07/02/update-on-shop-marketplaces-for-small-businesses/
3. State-based SHOP exchange enrollment: http://www.gao.gov/assets/670/666873.pdf. Data for state-specific federally-facilitated SHOP exchange enrollment is not available.
4. Vermont has been excluded from Figure IV-21 because it requires all small businesses to purchase coverage in its SHOP exchange.
As illustrated in Figure IV-21, SHOP exchange enrollment in 2014 was less than 0.5% of national small group enrollment based on national Supplemental Health Exhibit (SHE) data. Even in state-based exchanges where the SHOP exchange facilitated online enrollment, SHOP enrollment only represented 0.0% to 4.8% of state-specific small group market share. It should be noted that Utah, which had 4.8% of its small group market enroll in its SHOP, has operated a small business health insurance exchange since 201060. Therefore, its market penetration may be viewed as a potential long-term target for SHOP exchanges.
60 About Avenue H. Retrieved July 30, 2015 from http://www.avenueh.com/about-ave-h.
4.8%
0.9%
0.4% 0.6%
1.0%
2.3%
0.4% 0.5% 0.7%
1.2%
0.3% 0.3% 0.2% 0.0% 0.0% 0.0% 0.0% 0.1%
0.3%
0.0%
1.0%
2.0%
3.0%
4.0%
5.0%
Per
cen
tage
of
Sm
all G
roup
En
rollm
ent
State Exchanges
Figure IV-21 Percentage of Total Small Group Market Enrollment in State-Based Small
Business Health Options Programs (SB-SHOPs)
53 Oklahoma State Department of Health Oklahoma State Innovation Model Insurance Market Analysis – Discussion Draft August 31, 2015
Milliman Report
2. Outlook for Future SHOP Exchange Enrollment As stated previously, we estimate that fewer than 500 Oklahomans are insured through coverage that was purchased on the SHOP exchange in 201561. Enrollment growth in Oklahoma’s federally-facilitated SHOP exchange may be limited for several reasons:
Limited Financial Incentive. First, unlike the individual FFM that provides the sole source of premium assistance for consumers, the SHOP exchange does not provide consumers a financial benefit for purchasing insurance through it versus the traditional small group market. While small businesses can only receive the SBTC through the SHOP exchange, limited take-up rate of the SBTC suggests that it is viewed as an insufficient financial incentive as well as having an overly complex application process62.
Broker-Driven Market. Small businesses rely on the broker/insurance agent distribution channel to purchase group health insurance. Unless the SHOP exchange provides this distribution channel with an opportunity to provide better products, more services, or reduced administrative costs to its small business clients, the SHOP exchange is unlikely to grow in popularity with broker/insurance agent community.
Private Exchange Competition. Private insurance exchanges (PIE), insurance exchanges not affiliated with a state or federal entity, are increasing in popularity in the group health insurance market. PIE’s may be operated by health insurers or insurance brokers. PIE, in additional to traditional health insurance, may offer ancillary products such as dental, vision, disability, and life insurance products. Because of its limited scope, the SHOP exchange may be at a competitive disadvantage to PIEs that offer small businesses the opportunity to offer a greater range of benefits and choices to their employees.
Initial SHOP exchange enrollment as well as the above factors suggest that SHOP exchange may have a limited impact on the small group health insurance market on a national level, as well as in Oklahoma.
61 Estimate developed based on reviewing national SHOP enrollment figures. 62 GAO: Small Business Health Insurance Exchanges (November 2014). Retrieved July 30, 2015 from http://www.gao.gov/assets/670/666873.pdf, p19.
54 Oklahoma State Department of Health Oklahoma State Innovation Model Insurance Market Analysis – Discussion Draft August 31, 2015
Milliman Report
V. Insurance Carrier Market Share and Financial Performance We reviewed commercial health insurance market financial results from 2012 to 2014 for business in the state of Oklahoma. This data provides insight into insurance carrier premium, claims expense, administrative expense, and enrollment information. The following data has been summarized at the market (individual, small group, large group, and Medicare Advantage) and insurer level:
Covered Lives – The number of members covered by insurance contracts at the end of the reporting year.
Earned Premium PMPM – The average premium expense per member per month (PMPM). These amounts include applicable fees and assessments paid by insurers such as premium taxes, public exchange user fees, licensing fees, ACA health insurer fee, ACA transitional reinsurance assessment, and other similar items. Earned premium amounts illustrated have not been adjusted for paid reinsurance premiums.
Incurred Claims PMPM – The average paid incurred claim expense PMPM. This amount may include provider incentive payments, retrospective rating refunds, and pharmacy rebates.
Administrative expenses, fees, taxes, reinsurance and other expenses PMPM – These values reflect the combined costs associated with general administrative expenses, claim adjustment expenses, quality improvement expenses, various fees and taxes, reinsurance premiums and recoveries, and payment of medical loss ratio rebates.
Underwriting Margin PMPM – The remaining premium surplus (deficit) after incurred claims and administrative expenses and taxes are deducted from earned premium revenue. A positive value indicates the insurer collected premium revenue in excess of expenses, while a negative value indicates expense items exceeded premium revenue.
Medical Loss Ratio (MLR) – Incurred claims PMPM divided by earned premium PMPM. Note, this calculation differs from the formula prescribed by the Affordable Care Act (ACA) used to determine medical loss ratio rebates in the commercial health insurance market in the following manner:
o Numerator: Incurred claims PMPM illustrated in this report excludes quality improvement expenses and allowable fraud reduction expenses. In the ACA MLR calculation, quality improvement expenses and allowable fraud reduction expenses are included in the MLR numerator.
o Denominator: Earned premium PMPM includes premium revenue that is attributable to applicable fees, assessments, and taxes. In the ACA MLR calculation, fees and taxes are deducted from the premium value used in the denominator of the MLR calculation.
Non-Incurred Claims Expense Loss Ratio (NLR) – Administrative expenses, fees, taxes, reinsurance, and other expenses PMPM divided by the earned premium PMPM.
Underwriting Margin Percentage – The premium percentage excess (deficit) relative to the sum of claim and administrative expenses.
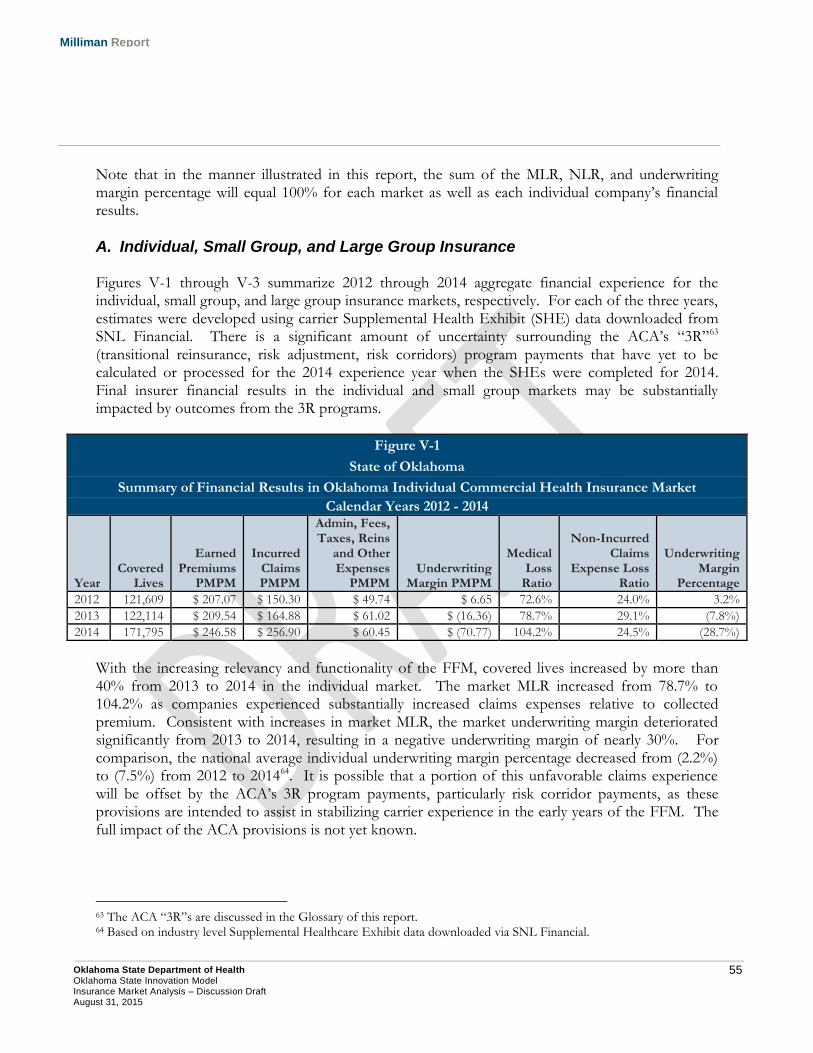
55 Oklahoma State Department of Health Oklahoma State Innovation Model Insurance Market Analysis – Discussion Draft August 31, 2015
Milliman Report
Note that in the manner illustrated in this report, the sum of the MLR, NLR, and underwriting margin percentage will equal 100% for each market as well as each individual company’s financial results.
A. Individual, Small Group, and Large Group Insurance Figures V-1 through V-3 summarize 2012 through 2014 aggregate financial experience for the individual, small group, and large group insurance markets, respectively. For each of the three years, estimates were developed using carrier Supplemental Health Exhibit (SHE) data downloaded from SNL Financial. There is a significant amount of uncertainty surrounding the ACA’s “3R”63 (transitional reinsurance, risk adjustment, risk corridors) program payments that have yet to be calculated or processed for the 2014 experience year when the SHEs were completed for 2014. Final insurer financial results in the individual and small group markets may be substantially impacted by outcomes from the 3R programs.
Figure V-1
State of Oklahoma
Summary of Financial Results in Oklahoma Individual Commercial Health Insurance Market
Calendar Years 2012 - 2014
Year Covered
Lives
Earned Premiums
PMPM
Incurred Claims PMPM
Admin, Fees, Taxes, Reins
and Other Expenses
PMPM Underwriting
Margin PMPM
Medical Loss
Ratio
Non-Incurred Claims
Expense Loss Ratio
Underwriting Margin
Percentage
2012 121,609 $ 207.07 $ 150.30 $ 49.74 $ 6.65 72.6% 24.0% 3.2%
2013 122,114 $ 209.54 $ 164.88 $ 61.02 $ (16.36) 78.7% 29.1% (7.8%)
2014 171,795 $ 246.58 $ 256.90 $ 60.45 $ (70.77) 104.2% 24.5% (28.7%)
With the increasing relevancy and functionality of the FFM, covered lives increased by more than 40% from 2013 to 2014 in the individual market. The market MLR increased from 78.7% to 104.2% as companies experienced substantially increased claims expenses relative to collected premium. Consistent with increases in market MLR, the market underwriting margin deteriorated significantly from 2013 to 2014, resulting in a negative underwriting margin of nearly 30%. For comparison, the national average individual underwriting margin percentage decreased from (2.2%) to (7.5%) from 2012 to 201464. It is possible that a portion of this unfavorable claims experience will be offset by the ACA’s 3R program payments, particularly risk corridor payments, as these provisions are intended to assist in stabilizing carrier experience in the early years of the FFM. The full impact of the ACA provisions is not yet known.
63 The ACA “3R”s are discussed in the Glossary of this report. 64 Based on industry level Supplemental Healthcare Exhibit data downloaded via SNL Financial.
56 Oklahoma State Department of Health Oklahoma State Innovation Model Insurance Market Analysis – Discussion Draft August 31, 2015
Milliman Report
Incurred Claims PMPM increased by over 50% in 2014 relative to 2013 in the Individual market. However, during this same time period Earned Premium PMPM increased by only around 18%. This contributed to insurance carrier medical loss ratios increasing by over 25%. Due to available premium and cost sharing assistance provided by the ACA, the individual market enrollment experienced many changes between 2013 and 2014.
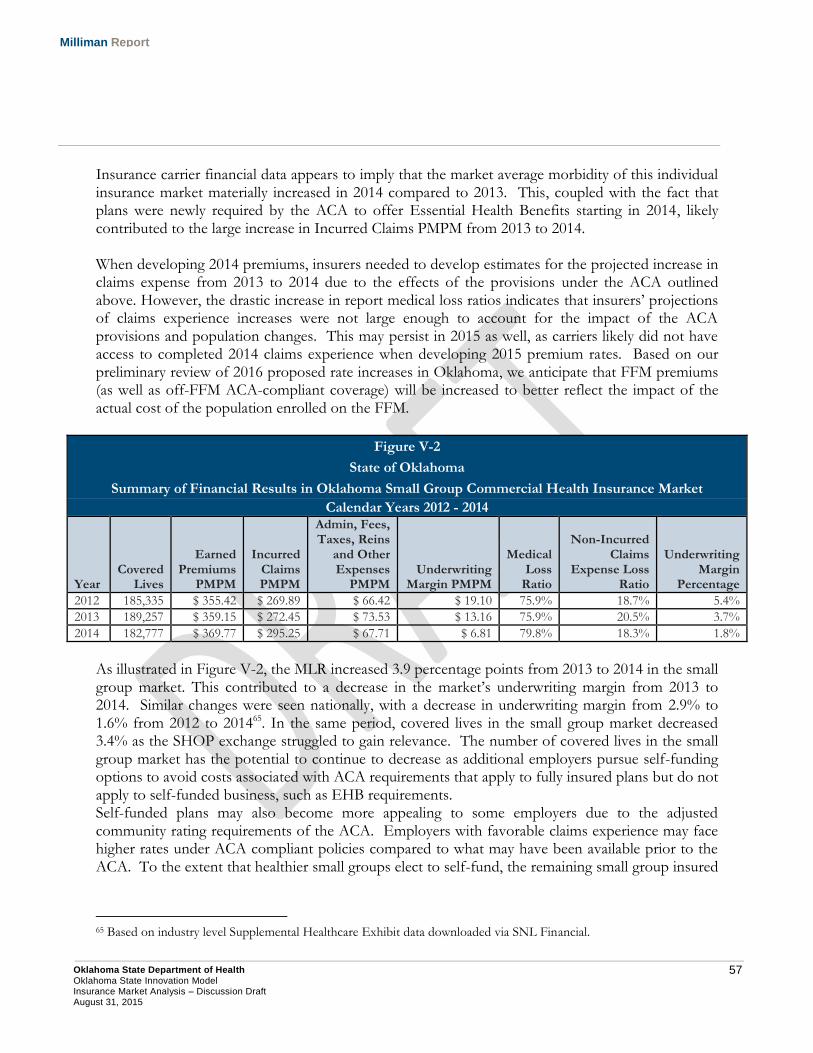
57 Oklahoma State Department of Health Oklahoma State Innovation Model Insurance Market Analysis – Discussion Draft August 31, 2015
Milliman Report
Insurance carrier financial data appears to imply that the market average morbidity of this individual insurance market materially increased in 2014 compared to 2013. This, coupled with the fact that plans were newly required by the ACA to offer Essential Health Benefits starting in 2014, likely contributed to the large increase in Incurred Claims PMPM from 2013 to 2014. When developing 2014 premiums, insurers needed to develop estimates for the projected increase in claims expense from 2013 to 2014 due to the effects of the provisions under the ACA outlined above. However, the drastic increase in report medical loss ratios indicates that insurers’ projections of claims experience increases were not large enough to account for the impact of the ACA provisions and population changes. This may persist in 2015 as well, as carriers likely did not have access to completed 2014 claims experience when developing 2015 premium rates. Based on our preliminary review of 2016 proposed rate increases in Oklahoma, we anticipate that FFM premiums (as well as off-FFM ACA-compliant coverage) will be increased to better reflect the impact of the actual cost of the population enrolled on the FFM.
Figure V-2
State of Oklahoma
Summary of Financial Results in Oklahoma Small Group Commercial Health Insurance Market
Calendar Years 2012 - 2014
Year Covered
Lives
Earned Premiums
PMPM
Incurred Claims PMPM
Admin, Fees, Taxes, Reins
and Other Expenses
PMPM Underwriting
Margin PMPM
Medical Loss
Ratio
Non-Incurred Claims
Expense Loss Ratio
Underwriting Margin
Percentage
2012 185,335 $ 355.42 $ 269.89 $ 66.42 $ 19.10 75.9% 18.7% 5.4%
2013 189,257 $ 359.15 $ 272.45 $ 73.53 $ 13.16 75.9% 20.5% 3.7%
2014 182,777 $ 369.77 $ 295.25 $ 67.71 $ 6.81 79.8% 18.3% 1.8%
As illustrated in Figure V-2, the MLR increased 3.9 percentage points from 2013 to 2014 in the small group market. This contributed to a decrease in the market’s underwriting margin from 2013 to 2014. Similar changes were seen nationally, with a decrease in underwriting margin from 2.9% to 1.6% from 2012 to 201465. In the same period, covered lives in the small group market decreased 3.4% as the SHOP exchange struggled to gain relevance. The number of covered lives in the small group market has the potential to continue to decrease as additional employers pursue self-funding options to avoid costs associated with ACA requirements that apply to fully insured plans but do not apply to self-funded business, such as EHB requirements. Self-funded plans may also become more appealing to some employers due to the adjusted community rating requirements of the ACA. Employers with favorable claims experience may face higher rates under ACA compliant policies compared to what may have been available prior to the ACA. To the extent that healthier small groups elect to self-fund, the remaining small group insured
65 Based on industry level Supplemental Healthcare Exhibit data downloaded via SNL Financial.
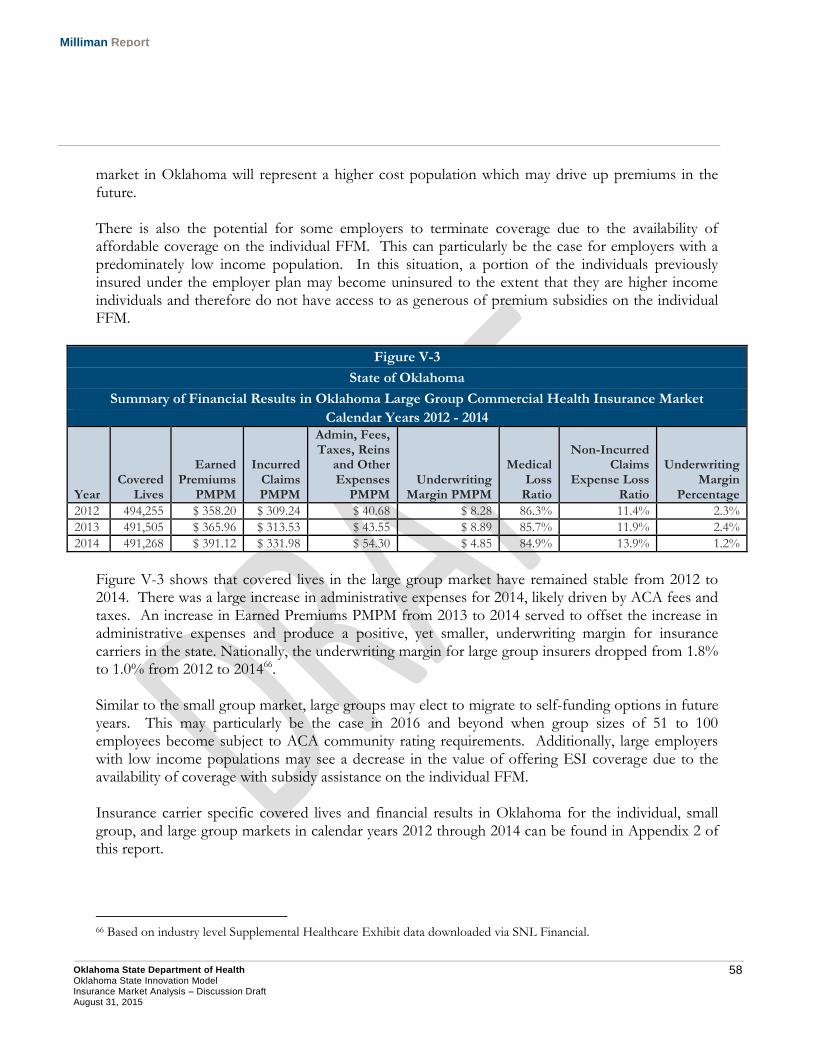
58 Oklahoma State Department of Health Oklahoma State Innovation Model Insurance Market Analysis – Discussion Draft August 31, 2015
Milliman Report
market in Oklahoma will represent a higher cost population which may drive up premiums in the future. There is also the potential for some employers to terminate coverage due to the availability of affordable coverage on the individual FFM. This can particularly be the case for employers with a predominately low income population. In this situation, a portion of the individuals previously insured under the employer plan may become uninsured to the extent that they are higher income individuals and therefore do not have access to as generous of premium subsidies on the individual FFM.
Figure V-3
State of Oklahoma
Summary of Financial Results in Oklahoma Large Group Commercial Health Insurance Market
Calendar Years 2012 - 2014
Year Covered
Lives
Earned Premiums
PMPM
Incurred Claims PMPM
Admin, Fees, Taxes, Reins
and Other Expenses
PMPM Underwriting
Margin PMPM
Medical Loss
Ratio
Non-Incurred Claims
Expense Loss Ratio
Underwriting Margin
Percentage
2012 494,255 $ 358.20 $ 309.24 $ 40.68 $ 8.28 86.3% 11.4% 2.3%
2013 491,505 $ 365.96 $ 313.53 $ 43.55 $ 8.89 85.7% 11.9% 2.4%
2014 491,268 $ 391.12 $ 331.98 $ 54.30 $ 4.85 84.9% 13.9% 1.2%
Figure V-3 shows that covered lives in the large group market have remained stable from 2012 to 2014. There was a large increase in administrative expenses for 2014, likely driven by ACA fees and taxes. An increase in Earned Premiums PMPM from 2013 to 2014 served to offset the increase in administrative expenses and produce a positive, yet smaller, underwriting margin for insurance carriers in the state. Nationally, the underwriting margin for large group insurers dropped from 1.8% to 1.0% from 2012 to 201466. Similar to the small group market, large groups may elect to migrate to self-funding options in future years. This may particularly be the case in 2016 and beyond when group sizes of 51 to 100 employees become subject to ACA community rating requirements. Additionally, large employers with low income populations may see a decrease in the value of offering ESI coverage due to the availability of coverage with subsidy assistance on the individual FFM. Insurance carrier specific covered lives and financial results in Oklahoma for the individual, small group, and large group markets in calendar years 2012 through 2014 can be found in Appendix 2 of this report.
66 Based on industry level Supplemental Healthcare Exhibit data downloaded via SNL Financial.
59 Oklahoma State Department of Health Oklahoma State Innovation Model Insurance Market Analysis – Discussion Draft August 31, 2015
Milliman Report
B. Medicare Advantage Figure V-4 includes a summary of covered lives by carrier in the Medicare Advantage market in Oklahoma for years 2013 through 2015.
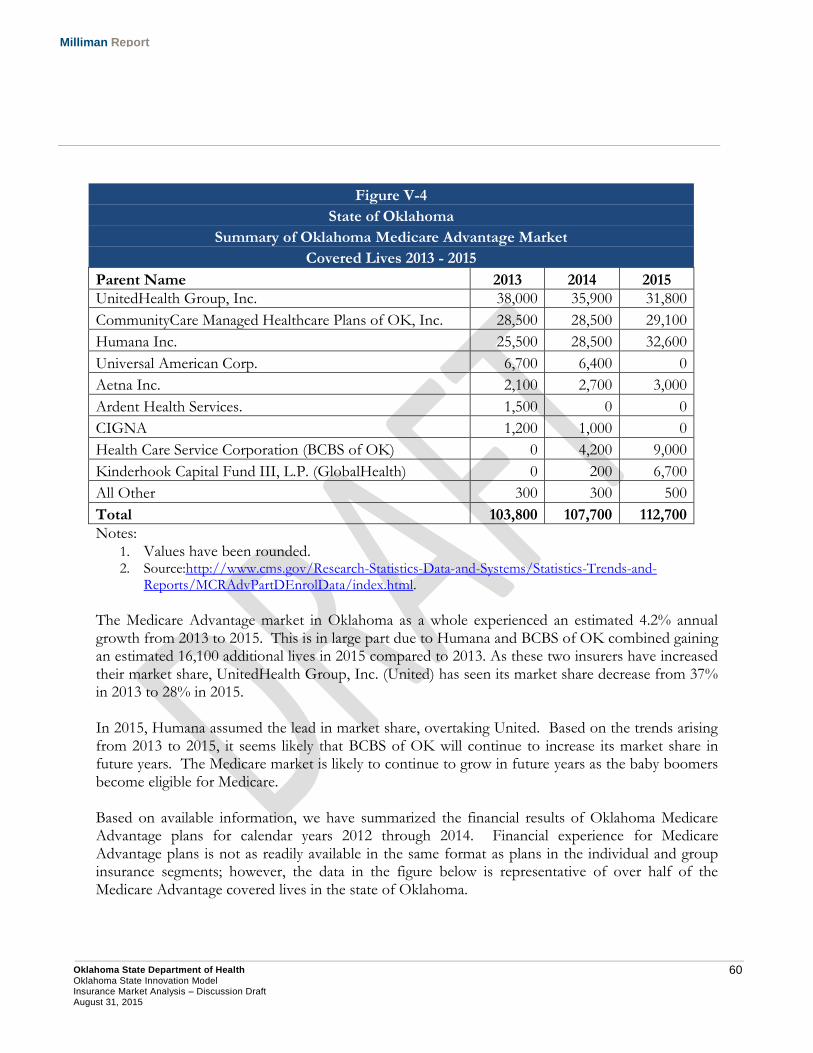
60 Oklahoma State Department of Health Oklahoma State Innovation Model Insurance Market Analysis – Discussion Draft August 31, 2015
Milliman Report
Figure V-4
State of Oklahoma
Summary of Oklahoma Medicare Advantage Market
Covered Lives 2013 - 2015
Parent Name 2013 2014 2015
UnitedHealth Group, Inc. 38,000 35,900 31,800
CommunityCare Managed Healthcare Plans of OK, Inc. 28,500 28,500 29,100
Humana Inc. 25,500 28,500 32,600
Universal American Corp. 6,700 6,400 0
Aetna Inc. 2,100 2,700 3,000
Ardent Health Services. 1,500 0 0
CIGNA 1,200 1,000 0
Health Care Service Corporation (BCBS of OK) 0 4,200 9,000
Kinderhook Capital Fund III, L.P. (GlobalHealth) 0 200 6,700
All Other 300 300 500
Total 103,800 107,700 112,700
Notes: 1. Values have been rounded. 2. Source:http://www.cms.gov/Research-Statistics-Data-and-Systems/Statistics-Trends-and-
Reports/MCRAdvPartDEnrolData/index.html. The Medicare Advantage market in Oklahoma as a whole experienced an estimated 4.2% annual growth from 2013 to 2015. This is in large part due to Humana and BCBS of OK combined gaining an estimated 16,100 additional lives in 2015 compared to 2013. As these two insurers have increased their market share, UnitedHealth Group, Inc. (United) has seen its market share decrease from 37% in 2013 to 28% in 2015. In 2015, Humana assumed the lead in market share, overtaking United. Based on the trends arising from 2013 to 2015, it seems likely that BCBS of OK will continue to increase its market share in future years. The Medicare market is likely to continue to grow in future years as the baby boomers become eligible for Medicare. Based on available information, we have summarized the financial results of Oklahoma Medicare Advantage plans for calendar years 2012 through 2014. Financial experience for Medicare Advantage plans is not as readily available in the same format as plans in the individual and group insurance segments; however, the data in the figure below is representative of over half of the Medicare Advantage covered lives in the state of Oklahoma.
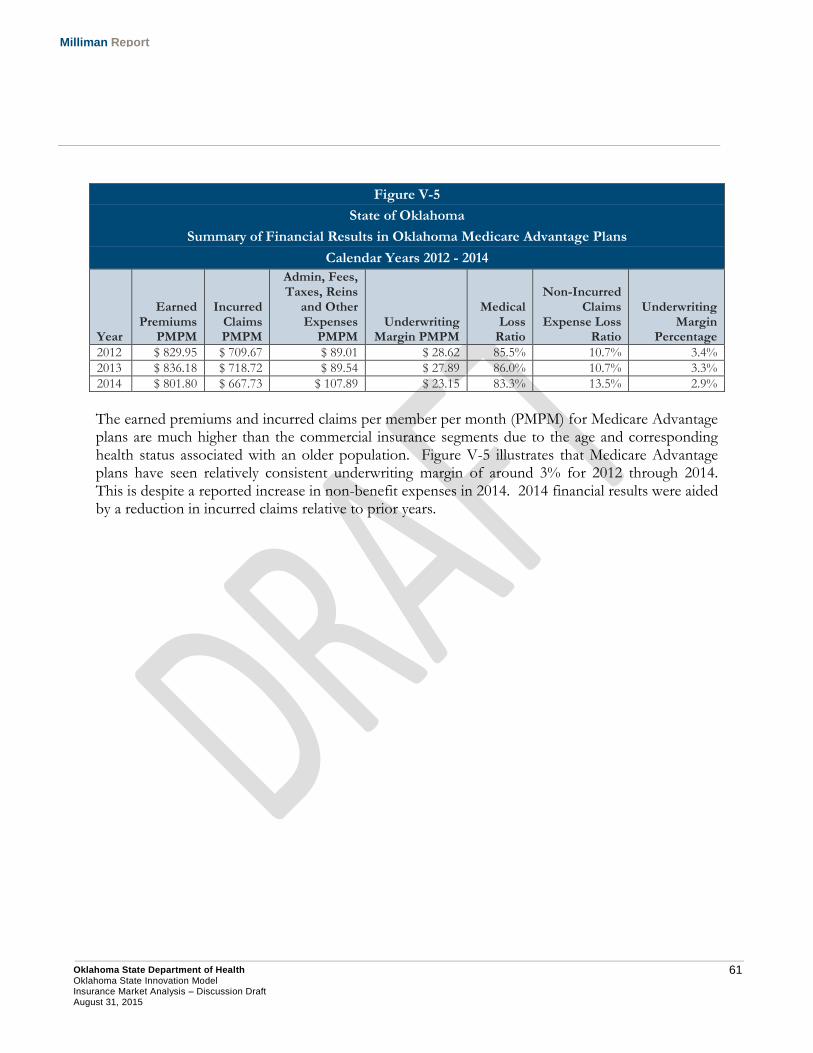
61 Oklahoma State Department of Health Oklahoma State Innovation Model Insurance Market Analysis – Discussion Draft August 31, 2015
Milliman Report
Figure V-5
State of Oklahoma
Summary of Financial Results in Oklahoma Medicare Advantage Plans
Calendar Years 2012 - 2014
Year
Earned Premiums
PMPM
Incurred Claims PMPM
Admin, Fees, Taxes, Reins
and Other Expenses
PMPM Underwriting
Margin PMPM
Medical Loss
Ratio
Non-Incurred Claims
Expense Loss Ratio
Underwriting Margin
Percentage
2012 $ 829.95 $ 709.67 $ 89.01 $ 28.62 85.5% 10.7% 3.4%
2013 $ 836.18 $ 718.72 $ 89.54 $ 27.89 86.0% 10.7% 3.3%
2014 $ 801.80 $ 667.73 $ 107.89 $ 23.15 83.3% 13.5% 2.9%
The earned premiums and incurred claims per member per month (PMPM) for Medicare Advantage plans are much higher than the commercial insurance segments due to the age and corresponding health status associated with an older population. Figure V-5 illustrates that Medicare Advantage plans have seen relatively consistent underwriting margin of around 3% for 2012 through 2014. This is despite a reported increase in non-benefit expenses in 2014. 2014 financial results were aided by a reduction in incurred claims relative to prior years.
62 Oklahoma State Department of Health Oklahoma State Innovation Model Insurance Market Analysis – Discussion Draft August 31, 2015
Milliman Report
VI. Alternatives for Reducing the Uninsured Rate
There are several alternatives that OSDH could purse to achieve the goal of reducing the uninsured rate in the state of Oklahoma. Some of the available alternatives to meet this goal include implementing increasing enrollment in programs currently available, introducing a Basic Health Program, or designing a Section 1332 State Innovation Waiver. Each of these alternatives are discussed in their respective sections below.
A. Insure Oklahoma
Insure Oklahoma (IO) is a program developed by the Oklahoma Health Care Authority which provides low income Oklahomans with premiums assistance for the purchase of employer-sponsored insurance (ESI) plans67. This program also includes an Individual Plan (IP) component, which allows self-employed or unemployed individuals to purchase insurance coverage from the state. As of July 2015, over 13,000 Oklahomans received ESI premium assistance through IO, with another 4,000 enrolled in the IP68. IO is a well-received program in the state and is operated under a Section 1115 demonstration waiver in conjunction with SoonerCare Choice69. To the extent the program could be expanded, it may facilitate greater health insurance take-up rates amongst low income Oklahomans with access to ESI coverage through their employer. The population modeling work completed suggests that there is the opportunity for this program to grow, as a portion of the low-income uninsured in the state are employed on a full-time basis (defined as 30 hours per week or more under the ACA) and likely have access to ESI coverage that they currently waive.
B. Basic Health Plan OVERVIEW Section 1331 of the ACA gives states the flexibility to offer a Basic Health Program (BHP) to certain low-income individuals not eligible for Medicaid. This primarily impacts individuals with household income between 139% and 200% of FPL, as well as unqualified legal aliens with income under 138% of FPL who are not eligible for Medicaid. A BHP is funded by the federal government by applying 95% of federal marketplace premium and cost sharing subsidies that would have otherwise been spent on the BHP’s operation70.
67 See http://www.insureoklahoma.org/ for additional information. 68 Insure Oklahoma Fast Facts, July 2015. Retrieved August 14, 2015 from http://www.insureoklahoma.org/IOaboutus.aspx?id=4096 69 Please see http://www.medicaid.gov/Medicaid-CHIP-Program-Information/By-Topics/Waivers/1115/downloads/ok/ok-soonercare-pa.pdf for additional information. 70 See http://www.medicaid.gov/basic-health-program/basic-health-program.html for additional information.
63 Oklahoma State Department of Health Oklahoma State Innovation Model Insurance Market Analysis – Discussion Draft August 31, 2015
Milliman Report
By potentially offering health insurance coverage that is more affordable than available in the FFM, a BHP may reduce the number of uninsured individuals within a state. However, the decision about whether (and how) to implement a BHP is a complex issue that impacts many stakeholders. The following paragraphs focus on the potential impact a BHP could have on a state’s individual health insurance market and the federal marketplace. The details of the BHP (administrative, financial, and policy) are outside the scope of this analysis. Additionally, the implementation of a BHP without implementing the ACA Medicaid expansion may be viewed as impractical, as it would provide premium assistance in the federal marketplace to the population with income between 100% and 138% FPL, while enrolling the population with income between 139% and 200% into the BHP. ESTIMATED IMPACTS TO INDIVIDUAL HEALTH INSURANCE MARKET AND FEDERAL MARKETPLACE OF OFFERING A BASIC HEALTH PROGRAM The ACA explicitly precludes members from joining the FFM and receiving federal subsidies if they are eligible for a BHP. Based on household income of Oklahomans selecting a FFM plan in 2015, we would estimate the population with income between 139% and 200% FPL represents between 40% and 50% of the FFM population with income above 139% FPL71. To some extent, implementing a BHP may result in the federal marketplace being less attractive to insurers, as enrollment growth opportunities may be diminished. PROVIDER REIMBURSEMENT The ability for a State to operate a financially self-sustaining BHP that provides more affordable coverage is largely dependent on provider reimbursement differences between insurers in the federal marketplace and the BHP. To the extent the reimbursement levels were significantly higher in the federal marketplace relative to the BHP, it may be less fiscally challenging to provide enhanced benefits or lower required premium contributions to BHP participants. There is a significant amount of uncertainty regarding future provider reimbursement in the FFM; however there is anecdotal evidence on a national level that reimbursement levels are in some cases materially below normal commercial reimbursement levels72. This evidence may suggest that it could be difficult for a State to operate a BHP that provides enhanced benefits and/or lower participant premium requirements relative to FFM coverage.
71 CMS did not specifically provide the number of marketplace enrollees with household income above and below 139% FPL. 72 Beck, M. and Weaver, C. Insurers Cut Doctors’ Fees in New Health-Care Plans (November 21, 2013). Retrieved July 30, 2015 from http://www.wsj.com/articles/SB10001424052702304607104579212450545926912.
64 Oklahoma State Department of Health Oklahoma State Innovation Model Insurance Market Analysis – Discussion Draft August 31, 2015
Milliman Report
RISK POOL In general, health status for comparable age groups has been observed to improve with income level, which would indicate that the BHP-eligible population (income between 139% and 200% FPL) is likely to be a higher cost population compared to those with incomes at 201% FPL and greater. To the extent the BHP population shifted out of FFM coverage, the average cost profile of individuals in the FFM and aggregate individual risk pool (including the market outside of the FFM) may decrease. If resulting premiums decreased, more affordable coverage may encourage additional individuals to purchase health insurance. STATES CURRENTLY OPERATING A BHP In 2015, Minnesota was the only state that elected to operate a BHP73. New York has announced that it will begin operating a BHP in 201674. It should be noted that both of these states elected to operate their own insurance marketplace. It may be more difficult to implement a BHP without also operating a state-based insurance marketplace.
C. State Innovation Waiver Under Section 1332 of the ACA, a state can apply for a State Innovation Waiver (Innovation Waiver). The Innovation Waiver allows states greater flexibility in certain areas such as establishing QHPs, benefit designs and consumer choice in the insurance marketplace, adjustments to the structure of premium tax credits and cost sharing reductions in the FFM, ACA-related employer penalties, and the individual mandate. CMS will require that a state’s Innovation Waiver meeting the following criteria regarding the provision of health insurance coverage within the state75:
At least as comprehensive and affordable as would be provided absent the waiver;
Provide coverage to a comparable number of residents of the state as would be provided coverage absent a waiver; and,
Does not increase the federal deficit relative to the standard ACA requirements.
73 Basic Health Program-State Background Information. Retrieved July 30, 2015 from http://familiesusa.org/sites/default/files/documents/MN_BHP_Blueprint_Clean.pdf. 74 NY State of Health Announces the Expansion of Private Health Insurance Coverage through Innovative New Program (April 17, 2015). Retrieved July 30, 2015 from http://info.nystateofhealth.ny.gov/news/press-release-ny-state-health-announces-expansion-private-health-insurance-coverage-through. 75 CMS: Section 1332: State Innovation Waivers. Retrieved July 30, 2015 from https://www.cms.gov/CCIIO/Programs-and-Initiatives/State-Innovation-Waivers/Section_1332_State_Innovation_Waivers-.html#Frequently%20Asked%20Questions%20about%201332%20State%20Innovation%20Waivers.
65 Oklahoma State Department of Health Oklahoma State Innovation Model Insurance Market Analysis – Discussion Draft August 31, 2015
Milliman Report
CMS has stated that critical elements of an application include the following:
The list of provisions the state seeks to waive, including the rationale for the specific requests;
Data, assumptions, targets, and other information sufficient to determine that the proposed waiver will provide coverage that is at least as comprehensive as would be provided absent the waiver, will provide coverage and cost sharing protections that keep care at least as affordable as would be provided absent the waiver, will provide coverage to at least a comparable number of residents as would be provided coverage absent the waiver, and will not increase the Federal deficit;
Actuarial analyses and actuarial certifications to support State estimates that the waiver will comply with the comprehensive coverage requirement, the affordability requirement, and the scope of coverage requirement;
A detailed 10-year budget plan that is deficit neutral to the Federal government; A detailed analysis of the impact of the waiver on health insurance coverage in the state; A description and copy of the enacted state legislation providing the state authority to
implement the proposed waiver; and, A detailed plan as to how the state will implement the waiver, including a timeline.
To the extent Oklahoma pursued a State Innovation Waiver, it must allow for public input and comment on the proposed waiver application.
66 Oklahoma State Department of Health Oklahoma State Innovation Model Insurance Market Analysis – Discussion Draft August 31, 2015
Milliman Report
VII. Methodology and Assumptions
A. Population Projection Modeling Population projections were developed through the use of a population model (Model) which utilized calendar year 2013 insurance market population data and assumptions to project the developed population to future years. Estimated population counts were divided into cohorts that represent a combination of age, gender, insurance status, household income (measured as percent of the Federal Poverty Level), location (urban vs. rural), and self-reported health status. Insurance coverages incorporated in the analysis include Direct (individual on and off FFM), Employer (small group, large group, EGID, and other self-funded employer sponsored insurance), Medicaid/CHIP (Healthy Children/Adults, Disabled (ABD), and Other), Government, Medicare, and Uninsured. Additionally, for each type of insurance coverage, population counts are estimated by percent of federal poverty level (FPL), age, gender, location, and health status. Model Data Sources The Model uses the latest data available from multiple public and proprietary sources to understand the current market population by insurance coverage, age, gender, percent of FPL, location, and health status. The data utilized by the Model is comprised of public data sources outlined below.
Current Population Survey (CPS) data – This data, which is updated monthly, provides us with demographic information by insurance coverage, age, FPL, and health status. While a smaller sample size relative to other sources of population survey data, CPS data includes self-report health status information which is critical in understanding the Oklahoma population. To obtain a credible sample size, CPS data from 2011 through 2013 is summarized. In situations where CPS sample size credibility is a concern, state data is blended with the corresponding HHS regional data to further enhance credibility in modeling results.
American Community Survey (ACS) data – Due to including a large sample size, 2013 ACS data is used to provide enrollment counts by insurance coverage, age, gender, FPL, and county. The ACS represents a much larger national household sample size (approximately 3.5 million households in 201376) relative to the CPS (national sample of approximately 60,000 households77). However, ACS data does not contain self-reported health status. For this reason, ACS population count data is merged with the CPS data by health status to obtain a detailed picture of the current population.
76 See http://www.census.gov/programs-surveys/acs/methodology/sample-size-and-data-quality/sample-size-definitions.html for more information. 77 See http://www.census.gov/cps/methodology/sampling.html for more information.
67 Oklahoma State Department of Health Oklahoma State Innovation Model Insurance Market Analysis – Discussion Draft August 31, 2015
Milliman Report
Medical Loss Ratio Reporting Form data (MLR) data – MLR data is required to be submitted by carriers offering fully-insured commercial products for the purpose of complying with federal MLR reporting requirements. Publically available 2013 MLR is used to determine the current number of covered lives by insurance segment. Due to ACA reporting requirements, this source of information includes a more credible source of insured lives relative to population survey data. This data also provides insight on claim expenditures and premium revenue for these insurance segments.
Marketplace Enrollment Reports – We utilize publically available data provided by the Department of Health and Human Services (HHS) to understand the enrollment of the Individual Health Insurance Marketplace during 2014 and 2015 at the county level. While the total size of the individual market can be observed using carrier financial reporting information, HHS marketplace enrollment reports include information related to the size of the FFM. Combining this with insurer financial data enables us to understand the portion of the individual market that is on-FFM vs. off-FFM.
Oklahoma Healthcare Authority SoonerCare Reports – We utilized publically available SoonerCare Fast Facts enrollment reports to understand monthly Medicaid enrollment by qualifying group. This provides a more reliable source of total Oklahoma Medicaid enrollment compared to population survey data.
Financial data downloaded from SNL Financial – We utilized SNL Financial data to gain additional insight into enrollment in the individual, small group, and large group markets. SNL is updated on a quarterly basis, whereas MLR data is reported in the fall of each year. For this reason, SNL Financial data provides insight into the size of the insured markets before similar data is available from the MLR data.
Medicare Advantage penetration rate data made publically available by CMS was utilized to understand the percent of Medicare enrollees enrolled in Medicare Advantage plans. This was used in conjunction with population survey data to assess the portion of Medicare enrollees that enroll in Medicare Advantage plans.
EGID enrollment provided by State personnel. This data enabled us to determine the number of total self-funded lives in the state represented by the EGID population.
In addition to the data sources described above, data available within the Milliman Health Cost Guidelines™ (HCGs) and Milliman Medical Underwriting Guidelines (MUGs) are utilized. Greater description concerning the MUG data and how we used the HCGs to develop population health status estimates is described in section C below. Model Methodology Each of the data sources previously outlined plays a specific role in understanding the current insurance market landscape. The methodology implemented within the Model is outlined below.
The CPS data is utilized to estimate the percent of the population in Excellent, Very Good, Good, and Fair/Poor Health Status.
68 Oklahoma State Department of Health Oklahoma State Innovation Model Insurance Market Analysis – Discussion Draft August 31, 2015
Milliman Report
ACS data is utilized to estimate the population breakdown by insurance coverage, age, gender, FPL, and county.
MLR data and SNL Financial are used to understand the size of the insured markets (individual, small group, large group).
Marketplace Enrollment Reports are used to adjust insured market enrollment estimates for changes that occurred in 2014 and 2015 as a result of the availability of coverage on the Individual FFM beginning in 2014, as well as estimated FFM take up rates.
The Oklahoma Healthcare Authority SoonerCare Reports are used to better estimate Medicaid enrollment by qualifying group as well as uninsured rates in Oklahoma over time.
Medicare Advantage data is used to better estimate the portion of Medicare enrollment that is enrolled in Medicare Advantage rather than traditional fee-for-service Medicare.
Results from these data sources are aggregated to capture the desired current insurance market characteristics. By using population data in conjunction with these other sources, population estimates for insurance category, age, gender, location, and health status can be estimated for each of the projection years. In developing profiles of the employer market, we utilized data available from the U.S. Census Bureau. Additionally, our analysis relied on data and other information available within Medical Expenditure Panel Survey (MEPS). MEPS data, which began in 1996, is publically available data from a large survey of households, providers, and employers78. One component of the MEPS, referred to as the Insurance Component or the Health Insurance Cost Study, surveys employers on the coverage provided to employees. This information was used to analyze the private sector health insurance information with respect to employee participation rates by wage quartile and average premium rates by coverage tier. Population estimates for 2014 and 2015 assumed that the distribution of household income as a percentage of the federal poverty level remains constant in the future by age and gender.
B. Insurance Carrier Financial Information In developing insurance carrier financial information for 2012 through 2014, we used SNL data to aggregate the commercial health market Supplemental Health Exhibit (SHE) data. Details of our method for calculating the various statistics are as follows:
Earned Premiums PMPM: Health Premiums Earned/Member Months
Incurred Claims PMPM: Total Incurred Claims/Member Months
78 See http://meps.ahrq.gov/mepsweb/about_meps/survey_back.jsp for more information.
69 Oklahoma State Department of Health Oklahoma State Innovation Model Insurance Market Analysis – Discussion Draft August 31, 2015
Milliman Report
Admin, taxes, reins, and other expenses PMPM: (General and Admin Expenses + Claims Adjustment Expenses + Total Defined Expenses for Improving Quality + (Net Incurred Claims After Reinsurance – Total Incurred Claims) + (Health Premiums Earned – Net Adjusted Premiums Earned After Reinsurance))/Member Months
Underwriting Margin PMPM: Underwriting Gain (Loss)/Member Months
Medical Loss Ratio: Incurred Claims/Earned Premiums
Non-Incurred Claims Expense Loss Ratio: Admin, taxes, reinsurance, and other expenses/Earned Premiums
Underwriting Margin Percentage: Underwriting Margin/ Earned Premiums
C. Population Health Status Analysis The Milliman Medical Underwriting Guidelines (MUGs) are guidelines that use information gathered while medically underwriting individuals for enrollment in a health insurance plan to estimate the relative cost of the population. Individuals are given debit points based on conditions and prescription information, which represent estimated cost for the upcoming year’s coverage period. An individual with low or no debits points would be someone in excellent health, while an individual with a large number of debit points would be in poor health. Based on information in the HCGs, separate distributions of debit points were assumed for each age and gender cohort. The developed debit point distribution for the population was then paired with the self-reported health status from CPS data. The debit class percentages for the lowest number of debit points (lowest relative costs) was allocated to the CPS health status distribution for the Excellent category. Remaining debit class percentages were then allocated to the Very Good health status. This process was continued until 100% of the debit class percentages were allocated to one of the health statuses included in the CPS data. By using this approach, we developed health status factors using the MUG relative cost information for each reported health status by age and gender that represent the average relative cost (or morbidity) for that cohort of this population. The health status factors developed from this methodology were assigned to each individual in our population modeling, allowing us to develop relative health cost estimates segmented by insurance status, FPL, and age. Figures III-8 and III-9 illustrate the average health status factor for the displayed cohort, normalized to the statewide average. A health status factor of 1.0 reflects the average health status for the state of Oklahoma. This allows for comparisons between insurance status, age, and FPL within the state.
70 Oklahoma State Department of Health Oklahoma State Innovation Model Insurance Market Analysis – Discussion Draft August 31, 2015
Milliman Report
VIII. Data Reliance In preparing this report, we relied on data, information, and assumptions provided by OSDH along with public data sources. Data sources utilized in our analysis include, but are not limited to, the following:
Health plan financial information downloaded from SNL Financial;
2011 through 2013 Current Population Survey (CPS) data;
2013 American Community Survey data;
2013 Medical Loss Ratio Reporting Form data;
2012 through 2014 Medical Expenditure Panel Survey data;
HHS Marketplace Enrollment reports;
2013 through 2014 Oklahoma Healthcare Authority SoonerCare Reports; and,
EGID member counts. We have not audited or verified this data and other information. If the underlying data or information is inaccurate or incomplete, the results of our analysis may likewise be inaccurate or incomplete. We performed a limited review of the data used directly in our analysis for reasonableness and consistency and have not found material defects in the data. If there are material defects in the data, it is possible that they would be uncovered by a detailed, systematic review and comparison of the data to search for data values that are questionable or for relationships that are materially inconsistent. Such a review was beyond the scope of the assignment.
71 Oklahoma State Department of Health Oklahoma State Innovation Model Insurance Market Analysis – Discussion Draft August 31, 2015
Milliman Report
IX. Limitations and Qualifications This report is intended to analyze the current Oklahoma insurance market both inside and outside of the newly established FFM. It is our understanding that the State will use this report to help key decision makers plan and implement a health innovation plan for the State in compliance with the Federal SIM grant awarded to Oklahoma in December of 2014. The report may not be suitable for other purposes. This report has been prepared solely for the internal use of, and is only to be relied upon by, the Oklahoma State Department of Health (OSDH). Milliman makes no representations or warranties regarding the contents of this correspondence to third parties. Likewise, third parties are instructed that they are to place no reliance upon this correspondence prepared for OSDH by Milliman that would result in the creation of any duty or liability under any theory of law by Milliman or its employees to third parties. If this report is distributed to third parties, it should be distributed only in its entirety. The results in this report are technical in nature and dependent upon specific assumptions and methods. No party should rely upon this report without a thorough understanding of those assumptions and methods. Milliman’s consultants are not attorneys and are not qualified to give legal advice. We recommend that users of this report consult with their own legal counsel regarding interpretation of legislation and administrative rules, possible implications of specific ACA-required features, or other legal issues related to implementation of an ACA-compliant entity. Differences between our projections and actual amounts depend on the extent to which future experience conforms to the assumptions made for this analysis. It is certain that actual experience will not conform exactly to the assumptions used in this analysis. Actual amounts will differ from projected amounts to the extent that actual experience deviates from expected experience. The services provided for this project were performed under the signed Contract between Milliman, Inc. (Milliman) and the Oklahoma State Department of Health (OSDH) signed March 27, 2015. Guidelines issued by the American Academy of Actuaries require actuaries to include their professional qualifications in all actuarial communications. The authors of this report are members of the American Academy of Actuaries and meet the qualification standards for performing the analyses contained herein.
72 Oklahoma State Department of Health Oklahoma State Innovation Model Insurance Market Analysis – Discussion Draft August 31, 2015
Milliman Report
X. Glossary The Glossary provides definitions for terminology commonly used in this report. ACA “3R”s: The ACA “3R”s are intended to assist in stabilizing premium rates in the initial years of the post-ACA individual health insurance market. These provisions include transitional reinsurance, risk corridors, and risk adjustment.
Transitional reinsurance is a temporary program (sunsets in 2016) which provides insurers with funding for a portion of the claims expense for individual insured members that have claims expense above a predetermined threshold. The program is funded through assessments payed on insured lives in the individual, small group, and large group, and self-funded markets. This program is limited to the ACA compliant market, both on and off the FFM.
Risk corridors is another temporary program (ends in 2016) in which carriers with high profits are required to pay into a pool that is paid out to carriers with high losses. This program is intended to be administered in a budget-neutral manner. This program is limited to insurance coverage that is offered in the FFM.
Risk adjustment is a permanent program where the health status of an insurance carrier’s risk pool is evaluated, and carriers either pay into or receive funds based on whether the health status of their members is above or below the average for their market. This program is intended to be budget neutral within the individual and small group ACA compliant markets of each state.
Actuarial Value (AV): Actuarial value is a metric that estimates the portion of healthcare expenses paid by a health insurance plan. For example, a 70% actuarial value plan would cover an estimated 70% of healthcare expenses with the member paying the remaining 30% through cost sharing such as deductibles, copayments, and coinsurance. Benefit Design: Benefit design refers to the member cost sharing features and other structural characteristics of health insurance coverage. This could include items such as deductibles, copayments, coinsurance, and out-of-pocket limits. Additionally, benefit design can include a health insurance plan’s network, pre-authorization requirements, or other key characteristics. Community Rating: Community rating is a premium rating structure where premiums are developed based on the cost of a risk pool, or community, rather than the specific characteristics of an individual policyholder or group. Under the ACA’s adjusted community rating requirements, insurers are only allowed to vary premium rates based on an insured individual’s age, family status, tobacco usage, plan selection, and geographic region. ACA community rated premiums cannot be based on other factors, such as an insured individual’s health status or the size of a small employer.
73 Oklahoma State Department of Health Oklahoma State Innovation Model Insurance Market Analysis – Discussion Draft August 31, 2015
Milliman Report
Cost-Sharing Reduction (CSR): To provide additional assistance to low income individuals, Cost-Share Reduction plans are available to those who enroll in a Silver level qualified health plan with income under 250% FPL (defined below). CSR plans include lower cost sharing requirements compared to standard Silver plans and have higher AV requirements accordingly. Earned Premium: For the purposes of this report, earned premium is calculated as the average premium expense per member per month (PMPM). These amounts include applicable fees and assessments paid by insurers such as premium taxes, public exchange user fees, licensing fees, ACA health insurer fee, ACA transitional reinsurance assessment, and other similar items. Earned premium amounts illustrated have not been adjusted for paid reinsurance premiums. Effectuation: Enrollment on the individual FFM is not considered “effectuated” until after a premium payment is made by the enrollee. Effectuation rates measure the percent of total individual FFM plan selections that make a premium payment and become effectuated. Essential Community Providers: An essential community provider is a healthcare provider which predominantly serves individuals with a high level of healthcare need (typically a low-income medically underserved population). Essential Health Benefits (EHB): The EHB package is a list of ten benefit categories that must be covered by all policies compliant with ACA requirements. The ten EHB categories include Outpatient, Emergency Room, Hospitalization, Maternity, Mental Health and Substance Abuse, Prescription Drugs, Habilitative and Rehabilitative, Laboratory, Preventative, and Pediatric services. The specifics of the covered services in each of these categories is established at the state level. Federal Poverty Level (FPL): Subsidy assistance under the ACA is provided to individuals based on their total annual household income as a percentage of the federal poverty level. In 2015, the federal poverty level for is $11,770 for a single person and $24,250 for a family of four. Federally Facilitated Marketplace (FFM): In states that do not establish an individual market health insurance marketplace, a federally facilitated marketplace was established and began offering coverage to individuals beginning in 2014. FFM may also be referred to as the ‘federal exchange’. Fully-Insured: Fully-insured refers to health insurance products where the risk of claims expense is held by a health insurance company. Individuals or employers make premium payments to these companies, and in turn the insurance company administers the plan and is responsible for claims expense covered by the policy. Grandfathered: A group health plan that was created, or an individual health insurance policy that was purchased, on or before March 23, 2010. Grandfathered plans are exempted from many changes required under the Affordable Care Act. Plans or policies may lose their “grandfathered” status if they make certain significant changes that reduce benefits or increase costs to consumers.
74 Oklahoma State Department of Health Oklahoma State Innovation Model Insurance Market Analysis – Discussion Draft August 31, 2015
Milliman Report
A health plan must disclose in its plan materials whether it considers itself to be a grandfathered plan and must also advise consumers how to contact the U.S. Department of Labor or the U.S. Department of Health and Human Services with questions79. Incurred Claims: For the purposes of this report, incurred claims is calculated as the average paid incurred claim expense PMPM. This amount may include provider incentive payments, retrospective rating refunds, and pharmacy rebates. Large Group: The large group market consists of fully-insured employer-sponsored health insurance plans with over 50 employees (over 100 beginning in 2016). Medical Loss Ratio (MLR): For the purposes of this report, MLR is calculated as incurred claims PMPM divided by earned premium PMPM. Note, this calculation differs from the formula prescribed by the ACA used to determine medical loss ratio rebates in the commercial health insurance market. Metal Level: Four different levels of coverage known as metal levels can be offered through the ACA-compliant individual and small group markets. Each has a separate AV so that enrollees can have a choice with respect to how much the plan will cost and what level of benefits will be provided. The plan metal levels are Bronze, Silver, Gold, and Platinum corresponding to AVs of 60%, 70%, 80%, and 90%, respectively. Minimum Essential Coverage: The type of coverage an individual needs to have to meet the individual responsibility requirement under the Affordable Care Act. This includes individual market policies, job-based coverage, Medicare, Medicaid, CHIP, TRICARE and certain other coverage80. Morbidity: The term morbidity is used to represent the health of one individual relative to others. An individual with a low morbidity would be someone with low healthcare needs. Morbidity tends to increase with an individual’s age and the presence of medical conditions. Section 1115 Waiver81: Section 1115 of the Social Security Act gives the Secretary of Health and Human Services authority to approve experimental, pilot, or demonstration projects that promote the objectives of the Medicaid and CHIP programs. The purpose of these demonstrations, which give states additional flexibility to design and improve their programs, is to demonstrate and evaluate policy approaches such as:
Expanding eligibility to individuals who are not otherwise Medicaid or CHIP eligible; Providing services not typically covered by Medicaid; or
79 See https://www.healthcare.gov/glossary/grandfathered-health-plan/ for additional information. 80 See https://www.healthcare.gov/glossary/minimum-essential-coverage/ for additional information. 81 See http://www.medicaid.gov/medicaid-chip-program-information/by-topics/waivers/1115/section-1115-demonstrations.html for additional information.
75 Oklahoma State Department of Health Oklahoma State Innovation Model Insurance Market Analysis – Discussion Draft August 31, 2015
Milliman Report
Using innovative service delivery systems that improve care, increase efficiency, and reduce costs.
The State is currently authorized to operate the SoonerCare Choice and Insure Oklahoma programs under a Section 1115 waiver82. Self-Funded: Self-funded refers to when a health plan sponsor in liable for the claims expense of the population provided coverage, rather than the insurer in the case of a fully-insured arrangement.. In these situations, a third party is typically engaged to administer the plan. For this reason, self-funded health insurance plans are often referred to as Administrative Services Only policies, or ASO. Self-Reported Health Status: Publically available data from the Current Population Survey (CPS) contains information related to individual’s self-reported health status. When completing survey information, individuals indicate whether they identify as being in Excellent, Very Good, Good, Fair, or Poor health status. Small Group: The small group market consists of fully-insured employer-sponsored health insurance plans with 50 or fewer employees (100 of fewer beginning in 2016). Transitional: Non-grandfathered health insurance coverage in the individual or small group market that is allowed to be renewed through September 30, 2016 as permitted by CMS transitional policies and the Oklahoma Department of Insurance. Transitional coverage may also be referred to as ‘grandmothered’ health insurance.
82 See http://www.medicaid.gov/Medicaid-CHIP-Program-Information/By-Topics/Waivers/1115/downloads/ok/ok-soonercare-pa.pdf for additional information.
76 Oklahoma State Department of Health Oklahoma State Innovation Model Insurance Market Analysis – Discussion Draft August 31, 2015
Milliman Report
XI. List of Acronyms ACA – Patient Protection and Affordable Care Act ACS – American Community Survey AHRQ – Agency for Healthcare Research and Quality APTC – Advanced Premium Tax Credits AV – Actuarial Value BCBS – Blue Cross and Blue Shield of Oklahoma CHIP – Children’s Health Insurance Program CMS – Center for Medicare and Medicaid Services CPS – Current Population Survey CSR – Cost-Sharing Reduction EGID – Employee Group Insurance Division ESI – Employer-Sponsored Insurance FFS – Fee for Service FFM – Federally Facilitated Marketplace FPL – Federal Poverty Level HEDIS – Healthcare Effectiveness Data and Information Set HCG – Milliman Health Cost Guidelines™ HCSC – Health Care Service Corporation HHS – Department of Health and Human Services KFF – Kaiser Family Foundation MEPS – Medical Expenditure Panel Survey MLR – Medical Loss Ratio MUG – Milliman Medical Underwriting Guidelines OOP – Out of Pocket Maximum OSIM – Oklahoma State Innovation Model OSDH – Oklahoma State Department of Health QHP – Qualified Health Plan PCP – Primary Care Physician PIE – Private Insurance Exchange PMPM – Per Member Per Month SBTC – Small Business Tax Credit SHE – Supplemental Health Exhibit SHOP – Small Business Health Options Program ZCS – Zero Cost Sharing

1 Oklahoma State Department of Health Oklahoma State Innovation Model Insurance Market Analysis – Discussion Draft August 31, 2015
Milliman Report
Appendix 1
1 Oklahoma State Department of Health Oklahoma State Innovation Model Insurance Market Analysis – Discussion Draft August 31, 2015
Milliman Report
Appendix 1: Uninsured Estimates DISCUSSION OF VARIANCE AMONG DATA SOURCES Our process for estimating the number of uninsured Oklahomans relies on a number of data sources, including:
American Community Survey;
Insurer financial statements;
State and federal government reports concerning enrollment in public health insurance programs; and,
Market dynamics and government policies impacting insurance enrollment. Additionally, we validate our population projections by reviewing a number of external data sources that provide estimates on the number of Oklahomans without health insurance. A sample of these external data sources include:
National Health Interview Survey83;
Gallup-Healthways Well-Being Index84;
Oklahoma Behavioral Risk Factor Surveillance System85; and,
Urban Institute Health Reform Monitoring Survey86.
While none the above data sources match our estimates exactly, they are consistent in indicating that the number of uninsured Oklahomans decreased from 2013 to 2014. Variation relative to our estimates may be attributable to a variety of factors such as survey sample size, the wording of survey questions related to health insurance, what types of healthcare coverage are considered health insurance coverage, and other factors.
83 See http://www.cdc.gov/nchs/data/nhis/earlyrelease/insur201506.pdf for additional information. 84 See http://www.gallup.com/poll/184514/uninsured-rates-continue-drop-states.aspx for additional information. 85 See http://www.ok.gov/health/Data_and_Statistics/Center_For_Health_Statistics/Health_Care_Information /Behavioral_Risk_Factor_Surveillance_System/BRFSS_Data/index.html for additional information. 86 See http://hrms.urban.org/briefs/Gains-in-Health-Insurance-Coverage-under-the-ACA-as-of-March-2015.html for additional information.

1 Oklahoma State Department of Health Oklahoma State Innovation Model Insurance Market Analysis – Discussion Draft August 31, 2015
Milliman Report
Appendix 2