Embed Size (px)
Citation preview

Oladokun, Olayide and Tarrega, Amparo and James, Sue and Smart, Katherine and Hort, Joanne and Cook, David (2016) The impact of hop bitter acid and polyphenol profiles on the perceived bitterness of beer. Food Chemistry, 205 . pp. 212-220. ISSN 0308-8146
Access from the University of Nottingham repository: http://eprints.nottingham.ac.uk/32898/1/Oladokun%20et%20al_Perceived%20bitterness%20of%20beer_Manuscript_Revised%20for%20eprints.pdf
Copyright and reuse:
The Nottingham ePrints service makes this work by researchers of the University of Nottingham available open access under the following conditions.
This article is made available under the Creative Commons Attribution Non-commercial No Derivatives licence and may be reused according to the conditions of the licence. For more details see: http://creativecommons.org/licenses/by-nc-nd/2.5/
A note on versions:
The version presented here may differ from the published version or from the version of record. If you wish to cite this item you are advised to consult the publisher’s version. Please see the repository url above for details on accessing the published version and note that access may require a subscription.
For more information, please contact [email protected]

1
The impact of hop bitter acid and polyphenol profiles on1
the perceived bitterness of beer.2
Olayide Oladokuna, Amparo Tarregaa, Sue Jamesb, Katherine Smartb, Joanne Horta,3
David Cook§a4
5
aInternational Centre for Brewing Science, Bioenergy and Brewing Science Building,6
University of Nottingham, School of Biosciences, Division of Food Science, Sutton7
Bonington Campus, Loughborough, LE12 5RD, UK.8
9
bSABMiller Plc, SABMiller House, Church Street West, Woking, Surrey, GU21 6HS.10
11
12
Abbreviated running title: Impact of bitter congener profiles on perceived bitterness of13
beer14
15
16
17
18
19
20
21
22
§ Corresponding author23

2
e-mail: [email protected]
Tel: +44 (0)115 951624525
Abstract26
Thirty-four commercial lager beers were analysed for their hop bitter acid, phenolic acid27
and polyphenol contents. Based on analytical data, it was evident that the beers had28
been produced using a range of different raw materials and hopping practices. Principal29
Components Analysis was used to select a sub-set of 10 beers that contained diverse30
concentrations of the analysed bitter compounds. These beers were appraised sensorially31
to determine the impacts of varying hop acid and polyphenolic profiles on perceived32
bitterness character. Beers high in polyphenol and hop acid contents were perceived as33
having ‘harsh’ and ‘progressive’ bitterness, whilst beers that had evidently been34
conventionally hopped were ‘sharp’ and ‘instant' in their bitterness. Beers containing35
light-stable hop products (tetrahydro-iso--acids) were perceived as ‘diminishing’,36
‘rounded’ and ‘acidic’ in bitterness. The hopping strategy adopted by brewers impacts on37
the nature, temporal profile and intensity of bitterness perception in beer.38
39
Keywords: Beer, phenolic acids, total polyphenol content, hop acids, humulinones,40
tetrahydro-iso-humulones, bitterness quality.41
42
Chemical compounds studied in this article43
Protocatechuic acid (PubChem CID:72); Catechin (PubChem CID:73160); Epicatechin44
(PubChem CID:72276); Caffeic acid (PubChem CID:689043); Vanillic acid (PubChem45
CID:8468); Ferulic acid (PubChem CID:445858); p-coumaric acid (PubChem46
CID:637542); Cinnamic acid (PubChem CID:444539); 4-hydroxyphenylacetic acid47
(PubChem CID:127); Sinapic acid (PubChem CID:637775).48

3
49
50
1. Introduction51
Bitterness is an important flavour character of foods and beverages such as coffee, nuts,52
fruits and beer (Lesschaeve & Noble, 2005). Whereas the bitterness flavour of tea and53
red wine have been attributed mainly to flavonoid phenols, approximately 80% of beer54
bitterness is derived from the addition of hops (Humulus lupulus) during the ‘boiling55
stage’ of the brewing process (Arrieta, Rodríguez-Méndez, De Saja, Blanco, & Nimubona,56
2010; Caballero, Blanco, & Porras, 2012). The lupulin glands of female hop cones57
contain soft resins rich in phloroglucinol derivatives, namely -acids (cohumulone,58
humulone, adhumulone) and β-acids (colupulone, lupulone, adlupulone). These acids 59
undergo thermal isomerisation to give iso--acids, the major bitter compounds in beer60
(Haseleu et al., 2010). Upon isomerisation, each iso--acid congener is present as61
trans/cis stereoisomers with a ratio of approximately 3:7 in conventionally hopped beers62
(Ch Schönberger & Kostelecky, 2011). In recent years beer-bittering practice has63
diversified, with the development and usage of hop products in a variety of different64
forms, and with varied points of addition to the brewing process (e.g. kettle addition,65
post-fermentation bittering products, or dry hopping, which is feasible at a number of66
different points). One such product is pre-isomerised iso--acids, widely available as an67
aqueous extract or in pellet form, which are prepared from the chemical isomerisation of68
-acids outside of the brewhouse. These hop products usually have higher levels of cis-69
isomers relative to trans-isomers thus, giving a lower trans/cis ratio (Schmidt et al.,70
2014). Bitterness can also be achieved by the use of chemically reduced derivatives of71
iso--acids, so called light stable hop products such as tetrahydro-iso-humulones (tetra)72
and hexahydro-iso-humulones (hexa) which are prepared by hydrogenation and73
reduction reactions, respectively. Advanced hop products are popular among brewers74

4
because they offer added flexibility in terms of their usage, and can be added75
downstream of the brewing process (De Keukeleire, 2000).76
Furthermore, hops available in various forms (cones, pellets, plugs) can be added at77
different stages of the brewing process. Some brewers also soak hops in beer during78
fermentation or conditioning to improve beer aroma in a technique known as ‘dry-79
hopping’. Dry-hopping imparts oxidised -acids (known as humulinones) to beer.80
Humulinones levels of 0.2 – 0.5% w/w have been reported in hop leaves and pellets81
(Cocuzza & Mitter, 2008; Negri, di Santi, & Tabach, 2010; Wolfe, 2012). In addition to -82
acids, hops are also a source of polyphenols in beer although the amount of polyphenols83
present in beer will depend on hop variety, form and the point at which the hops are84
added during the brewing process. Furthermore, depending on hopping levels, brewing85
malt usually represents the major source of polyphenols in beer (Aron & Shellhammer,86
2010; Callemien & Collin, 2009).87
Polyphenols contribute to bitterness, colour, body, and astringency in beer and other88
beverages such as tea and wine, (Collin, Jerkovic, Bröhan, & Callemien, 2013) and have89
been recognised to influence the acceptance of beverages (Drewnowski & Gomez-90
Carneros, 2000). In beer they act as antioxidants, preventing oxidative degradation of91
beer whilst also providing potential health benefits to consumers through their inhibitory92
activity on certain mutagens and carcinogens (Floridi, Montanari, Marconi, & Fantozzi,93
2003). These compounds are diverse in chemical structure and can be divided into94
groups consisting of simple hydroxycinnamic and hydroxybenzoic acid derivatives95
(phenolic acids), flavanols, flavanol glycosides and prenylated flavonoids (Goiris et al.,96
2014). Flavanols are of particular interest to brewers because they form protein-97
polyphenol complexes, leading to the formation of haze or turbidity in beer - brewers98
consequently remove them by cold filtration or polypvinylpyrrolidine (PVPP) treatment99
(Garcia, Grande, & Gándara, 2004). However, PVPP treatment is not selective for the100
removal of haze active polyphenols only - leading to losses of other polyphenols that are101
potentially beneficial to the flavour and stability of beer (Aron & Shellhammer, 2010;102
Mikyška, Hrabak, Hašková, & Šrogl, 2002).103

5
The oral sensation of astringency is perceived as a drying, puckering or rough mouth-104
feel, resulting from the precipitation of proline-rich proteins in saliva by polyphenols105
(McLaughlin, Lederer, & Shellhammer, 2008). Several phenolics including ferulic acid, p-106
coumaric acid and protocatechuic acid have also been noted to elicit astringency107
(Callemien & Collin, 2009). Flavanol monomers such as catechin and epicatechin were108
found to be more bitter than astringent (Drewnowski & Gomez-Carneros, 2000; Peleg,109
Gacon, Schlich, & Noble, 1999).110
It is widely accepted within the brewing industry that the bitterness characteristics of111
beers differ due to factors not determined using the simplistic analytical measurement of112
bitterness units (BU). It is anticipated that this might relate to the diversity of hop113
products and hopping strategies employed across the industry and the impacts which114
this has on the relative concentrations of the array of compounds contributing to115
bitterness perception. Whilst there is some knowledge of the individual bitterness116
qualities which hop acid isomers impart to beer (Fritsch & Shellhammer, 2009), the links117
between hopping practice, bittering congener profile and the perceived bitterness118
characteristics of beers remains poorly understood. In this study we analysed the major119
hop acid isomers and polyphenolic compounds present in 34 commercially significant120
lager beers sourced from around the world. Having thus established the analytical121
bittering profiles of these beers, 10 beers, which varied significantly in the congeners122
present, were selected for sensory evaluation. A sensory lexicon for beer bitterness was123
developed to adequately reflect the diversity of bitterness experienced by the panel and124
was used to rate beer bitterness characteristics. Finally, correspondence analysis of the125
sensory data set was used to explore links between the bitterness congener profiles and126
perceived bitterness character of beers. This study thus represents a significant step127
towards understanding how to control this important flavour attribute of beers.128

6
2. Materials and methods129
2.1 Materials130
34 fresh commercial lager beers were sourced from 17 countries over 4 continents and131
analysed within 8 weeks of production. For reasons of confidentiality the beers are not132
identified but the countries from which they were sourced are as follows: Australia (2),133
Belgium (1), Cuba (1), Czech Republic (6), Denmark (1), France (1), Germany (2),134
Hungary (1), Italy (2), Netherlands (3), Poland (2), Peru (1), Romania (1), South Africa135
(3), Turkey (1), UK (2) and USA (4).136
2.2 Chemicals and reagents137
Hydroquinone (99%), catechin (99%), epicatechin (98%), 4-hydroxybenzoic acid (99%),138
caffeic acid (95%), vanillic acid (97%), syringic acid (95%), p-coumaric acid (98%),139
sinapic acid (98%), ferulic acid (99%), 2,5-dihydroxybenzoic acid (98%), gallic acid140
(98%), cinnamic acid (98%), salicylic acid (99%), 1,2-didydroxybenzene (99%),141
homovanillic (99%), gentisic acid (98%) and chlorogenic acid (99%) were all purchased142
from Sigma-Aldrich (UK). Protocatechuic acid (99.6%) was acquired from HWI analytic143
(Germany). Ethyl benzoate, isooctane and methanol (all HPLC grade) as well as144
orthophosphoric acid 85% (ASC grade) were purchased from VWR (UK). Reverse145
osmosis (RO) water was obtained from a Milli-Q water purification system by Millipore.146
Carboxymethylcellulose (CMC), ethylenediamine tetraacetic acid (EDTA), ammonia and147
ferric reagent solutions were all technical grade chemicals from VWR (UK). For148
humulinone synthesis, CO2 extract of -acid resin (86%) was kindly donated by Botanix,149
Paddock Wood, Kent. Cumene hydroperoxide (80% technical grade), diethyl ether,150
sodium bicarbonate, hexane, phosphoric acid and hydrochloric acid (HCl) were all from151
Sigma-Aldrich (UK) and of ASC reagent grades.152
Iso-α-acid standard (ICE-3) containing trans-isocohumulone, trans-isohumulone, trans-153
isoadhumulone (62.3% w/w), - & β-acid (44.64%, 24.28% w/w), and tetra standard 154
(99.3% w/w) were purchased from Labor Veritas Co. (Switzerland).155

7
2.3 Instrumentation156
HPLC analysis was carried out on a Waters Alliance 2695 instrument equipped with a157
column heater and a membrane degasser. Detection was achieved with a UV detector158
and peak areas were processed with the operating HPLC software (Empower 2).159
Separation of polyphenols and hop acids was achieved with a Purospher STAR rp-18160
endcapped column (250 X 4.6 mm, 3 µm) from Merck Millipore (UK) coupled with a C18161
guard cartridge from Phenomenex (UK).162
2.3 Analysis of hop bitter acids in beer163
2.4.1 Extraction of hop bitter acids from beer164
Cold beer was degassed by stirring for 1 h followed by the transfer of an aliquot (5 ml)165
into a 50 ml centrifuge tube, the degassed beer was acidified with orthophosphoric acid166
(100 µl) and an internal standard (benzoic acid) was added (0.003 mg/L). The mixture167
was then extracted into isooctane (10 ml) on a roller bed for 30 min. The isooctane168
extract was transferred into a glass tube and evaporated under a controlled flow of169
Nitrogen with a Visidry attachment coupled to a solid phase extraction manifold170
(Supelco). The residue was dissolved in acetonitrile (2 ml) to give the HPLC sample.171
2.4.2 HPLC-UV analysis of hop bitter acids172
Hop acid separation was achieved with a binary mixture of (A) 1% v/v acetic acid and173
(B) 0.1% v/v orthophosphoric acid in acetonitrile. The gradient elution was: 0-5 min:174
30% A, 70% B; 15-24 min: 20% A, 80% B; 25 min: 10% A, 90% B; 30 min: 10% A,175
90% B; 35 min: 0% A, 100% B; 44 min: 0% A, 100% B; 46 min: 30% A, 70% B; 55176
min: 30% A, 70% B over a 55 min run time. Injection volume was 10 µl, flow rate was177
0.5 ml/min and column temperature was 25°C. The peak area of iso--acids,178
humulinones were extracted at 270 nm and at 310 nm for tetrahydro-iso--acids.179
2.4.3 Determination of bitterness units180

8
Bitterness unit was determined according to ASBC method Beer-23A (ASBC Method of181
Analysis, 2011). Beer (5 ml) was transferred into a 50 ml centrifuge tube and acidified182
with 3N HCl (0.5 ml). Isooctane (10 ml) was added and the mixture was shaken by hand183
three times before extraction on a rolled bed for 15 min. The mixture was subsequently184
centrifuged at 400 x g twice for 5 min each time to aid phase separation. An aliquot of185
the clear isooctane layer was transferred into a cuvette and absorbance was measured186
with a spectrophotometer at 275 nm against a blank of orthophosphoric acid and187
isooctane. The recorded absorbance was multiplied by an empirical factor of 50 to give188
BU values in mg/L.189
2.5 Analysis of phenolic/ polyphenol compounds in beer190
2.5.1 Extraction of beer phenolic compounds191
The phenolic compounds listed in section 2.2 were extracted from beer using liquid-liquid192
extraction. Degassed beer (5 ml) was transferred into a 50 ml centrifuge tube before193
acidification with orthophosphoric acid (250 µl). Ethyl acetate (10 ml) was then added194
before extraction on a roller bed for 30 min. After extraction, the residual beer from the195
bilayer mixture was discarded and RO water (5 ml) was added and further extracted on196
the roller bed for 15 min. The water layer was removed and discarded while the extract197
in ethyl acetate was transferred into a glass tube and dried down under controlled flow198
of Nitrogen using a Visidry attachment coupled to a SPE manifold (Supelco). The residue199
was reconstituted in a fixed volume of methanol (2 ml) prior to HPLC analysis.200
2.5.2 HPLC-UV analysis of beer phenolic compounds201
The chromatographic method used a binary solvent system consisting of (A) 1.25 % v/v202
acetic acid and (B) 0.1% v/v orthophosphoric acid in acetonitrile. The gradient elution203
protocol was as follows: 0-25 min: 98% A, 2% B; 25-30 min: 76% A, 24% B; 35-40204
min: 55% A, 45% B; 45 min: 15% A, 85% B; 50 min: 0% A, 100% B; 55-65 min: 98%205
A, 2% B. Injection volume was 10 µl, flow rate was 0.5 ml/min and column temperature206
was set at 30°C. Peak areas were extracted at 280 nm and total run time was 65 min.207
9
2.5.3 Determination of beer total polyphenol content208
Beer total polyphenol content (TPC) was determined according to ASBC method Beer-35209
(ASBC Method of Analysis, 1978), involving the reaction of polyphenols with ferric ion in210
an alkaline solution. Beer (10 ml) was mixed with a preparation of211
carboxymethylcellulose (CMC, 1%) and ethylenediamine tetraacetic acid (EDTA, 0.2%)212
(8 ml) in a 25 ml volumetric flask. Ferric acid (0.5 ml) was added, followed by ammonia213
(0.5 ml) with mixing after each addition. The solution was then made up to mark with214
RO water and left to stand at room temperature for 10 min before an absorption215
measurement was taken at 600 nm. The recorded absorbance was multiplied by 820 to216
give total polyphenol values in mg/L.217
2.6 Synthesis of humulinones from humulones218
Humulinones were synthesised from humulone resin prepared from CO2 extract of hops219
(86.3% -acids) using a modified version of a reported method (Taniguchi, Matsukura,220
Ozaki, Nishimura, & Shindo, 2013). Humulone (1.41 g) and cumene hydroperoxide (0.7221
ml) were dissolved in diethyl ether (7 ml). A solution of saturated sodium bicarbonate222
(NaHCO3, 6 g dissolved slowly in 40 ml RO water) was added to the solution and kept at223
room temperature in a sealed vessel for 5 days, after which the sodium salt of224
humulinones was generated. The salt was filtered and washed with water (150 ml x 2)225
and diethyl ether (150 ml x 2) under vacuum in a Buchner flask and funnel. The crude226
extract (1.45 g) was subsequently dissolved in methanol (100 ml) containing 1% v/v227
phosphoric acid before the addition of a 0.5 N HCl solution (800 ml). The mixture was228
partitioned with hexane (1 L x 2) before the hexane layer was evaporated to dryness229
with a rotary evaporator to yield humulinones (0.95 g) of 99% purity (by HPLC).230
2.7 Sensory evaluation of bitterness231
Ethical approval for the sensory element of this investigation was obtained from the232
University of Nottingham Medical Ethics Committee (J12022015) and all participants233
gave written informed consent to participate in the study.234

10
The qualitative aspects of bitterness were evaluated by experienced panellists from the235
University of Nottingham trained beer panel (n=6) using descriptive analysis. First,236
panellists were presented with a subset of 10 of the 34 beers to generate and define a237
bitterness lexicon. These beers represented extreme variation in analytical variables and238
were selected based on a PCA plot from the analytical concentration of their hop acid and239
polyphenol contents. Panellists then attended a further 2 2h sessions during which they240
tasted and described the bitterness of 10 ml samples of each beer and participated in241
group discussions to agree a final list of clearly defined bitterness related terms. Beer242
samples (10 ml) were then evaluated in 2 further sessions using a Check–All-That-Apply243
(CATA) technique, (Dooley, Lee, & Meullenet, 2010) where panellists were asked to244
indicate which of the terms in the lexicon were relevant to each sample. Data was245
collected with Fizz software (Biosystèmes, France). Each sample was presented246
individually and assessed in triplicate following a randomised balanced order based on a247
partial latin square design and served at 4±1°C. During sample evaluation, panellists248
were given 5 min to evaluate each sample followed by a 3 min break in order to249
minimise bitterness carry over. Water (Evian, Danone, France) and crackers (Rakusen’s,250
UK) were provided for palate cleansing.251
2.8 Quantitation and statistical analysis252
External standard solutions of α-acids (0.5, 1, 2, 4 and 8 mg/L), iso--acids (1, 10, 20,253
40 and 60 mg/L), tetra (0.5, 1, 2, 4 and 8 mg/L) and humulinones (0.5, 1, 2, 4 and 8254
mg/L) were all prepared in acetonitrile. The mean values of triplicate injections were255
used to plot calibration curves for the quantification of hop bitter acids in beers. A stock256
solution (20 mg/L) of standard grade phenolic compounds was prepared by dissolving257
(0.01 g) of the standards in a 500 ml volumetric flask containing a mixture of RO water258
and methanol (~200 ml), before making up to mark with the same solvent mixture.259
Serial dilution was made from the stock solution to achieve external standards of 10, 5,260
2.5, 1 and 0.5 mg/L levels. Quantification was achieved from the standard calibration261
curves. Statistical analysis including Cochran’s Q test was used to determine which of262

11
the attributes were significantly different between the beers. Correspondence analysis263
was used to process the frequency data of bitterness attributes for each beers. Principal264
component analysis (PCA) was used to aid the selection of beers samples for sensory265
analysis based on analytical measurements of hop acid and polyphenol contents. All266
statistical analyses were performed with the XLSTAT, v2015 package.267
12
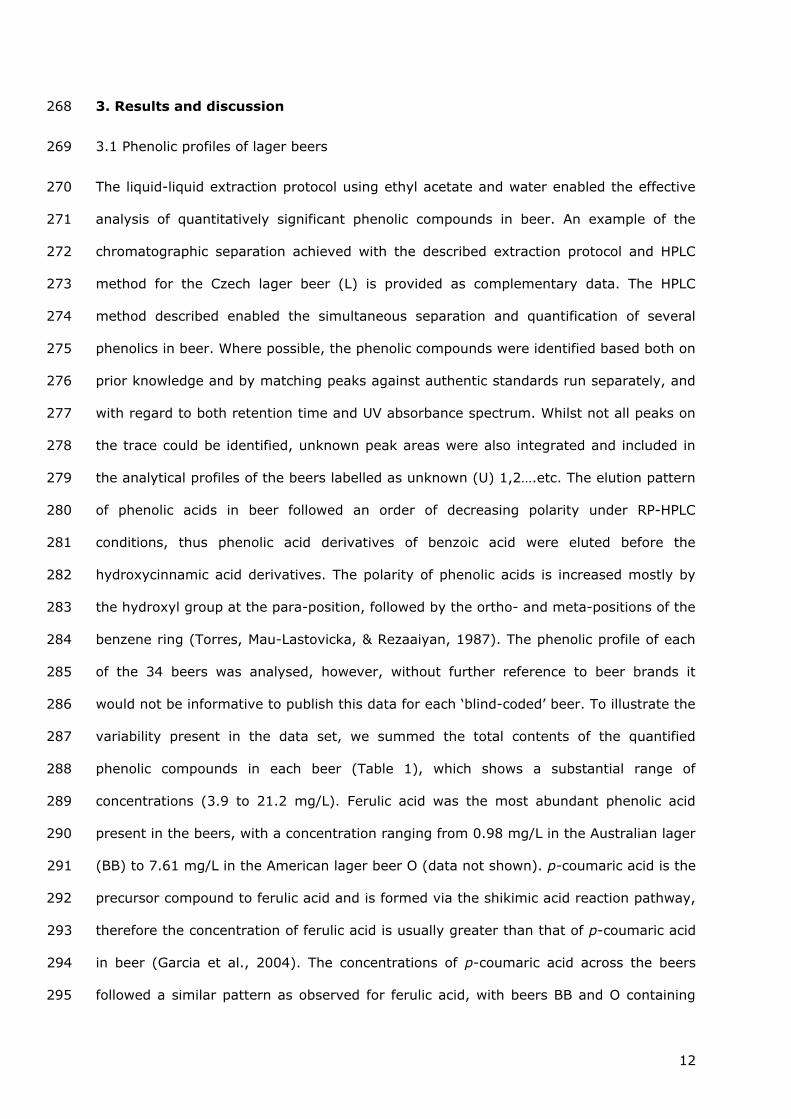
3. Results and discussion268
3.1 Phenolic profiles of lager beers269
The liquid-liquid extraction protocol using ethyl acetate and water enabled the effective270
analysis of quantitatively significant phenolic compounds in beer. An example of the271
chromatographic separation achieved with the described extraction protocol and HPLC272
method for the Czech lager beer (L) is provided as complementary data. The HPLC273
method described enabled the simultaneous separation and quantification of several274
phenolics in beer. Where possible, the phenolic compounds were identified based both on275
prior knowledge and by matching peaks against authentic standards run separately, and276
with regard to both retention time and UV absorbance spectrum. Whilst not all peaks on277
the trace could be identified, unknown peak areas were also integrated and included in278
the analytical profiles of the beers labelled as unknown (U) 1,2….etc. The elution pattern279
of phenolic acids in beer followed an order of decreasing polarity under RP-HPLC280
conditions, thus phenolic acid derivatives of benzoic acid were eluted before the281
hydroxycinnamic acid derivatives. The polarity of phenolic acids is increased mostly by282
the hydroxyl group at the para-position, followed by the ortho- and meta-positions of the283
benzene ring (Torres, Mau-Lastovicka, & Rezaaiyan, 1987). The phenolic profile of each284
of the 34 beers was analysed, however, without further reference to beer brands it285
would not be informative to publish this data for each ‘blind-coded’ beer. To illustrate the286
variability present in the data set, we summed the total contents of the quantified287
phenolic compounds in each beer (Table 1), which shows a substantial range of288
concentrations (3.9 to 21.2 mg/L). Ferulic acid was the most abundant phenolic acid289
present in the beers, with a concentration ranging from 0.98 mg/L in the Australian lager290
(BB) to 7.61 mg/L in the American lager beer O (data not shown). p-coumaric acid is the291
precursor compound to ferulic acid and is formed via the shikimic acid reaction pathway,292
therefore the concentration of ferulic acid is usually greater than that of p-coumaric acid293
in beer (Garcia et al., 2004). The concentrations of p-coumaric acid across the beers294
followed a similar pattern as observed for ferulic acid, with beers BB and O containing295

13
0.37 mg/L and 3.07 mg/L respectively (data not shown). Beer O was also found to296
contain the highest amount of phenolic compounds overall (Table 1; 21.17 mg/L), while297
beer F a South African lager beer had the lowest concentration at 3.91 mg/L. Beers298
brewed in Germany (J, P), South Africa (F, C, D), Denmark (S) and Australia (BB, DD)299
all had phenolic compound concentrations below 8 mg/L whilst the Czech beers (I, E, L,300
HH) and American lagers (O, T, Q) all had phenolic compound concentrations of >10301
mg/L. These values represent the total free phenolic acid content of beer which is302
reported to be approximately 10 - 20% of total beer polyphenol content, since a303
significant portion of beer phenolics are suggested to exist in bound form (Floridi et al.,304
2003). The Czech beer (HH) was the only sample that contained gallic acid whilst305
catechol, chlorogenic, salicylic, homovanillic and gentisic acids were not detected in the306
beers, in agreement with reports from other studies (Garcia et al., 2004; Jandera et al.,307
2005).308
3.2 The relationship between phenolic acid and total polyphenol content of beer309
The TPC of the beers was found to range between 74 and 256 mg/L. Similar values (70 –310
240 mg/L) were reported by Dvorakova et al. (2007). The lowest concentration was311
found in the Hungarian lager beer (G) whilst beers O and T, both American lagers and312
the British lager beer (AA) all had polyphenol contents greater than 250 mg/L. Beer O313
contained the highest amount of phenolic compounds and total polyphenol content. A314
plot of total phenolic compound concentration versus TPC is displayed in Fig. 1. The plot315
has been annotated to show three main clusters. The first cluster is of beers316
characterised by TPC values of approximately 74 – 180 mg/L and phenolic compound317
contents ranging between 3 and 15 mg/L. Beers AA and T formed a separate cluster,318
due to the high TPC in these beers (>250 mg/L). In the last cluster, consisting of beers319
E, O and HH, TPC ranged from 145 – 253 mg/L and phenolic compounds were in excess320
of 15 mg/L. Interestingly, this data shows that there was no linear relationship between321
TPC and the sum of phenolic compounds quantified. This is most likely due to the highly322
varied brewing techniques and ingredients employed in the industry. The observed323

14
higher TPC concentrations (>250 mg/L) in beers T, AA and O indicates that these beers324
were dry-hopped products.325
3.3 Hop bitter acid profile of lager beers326
For the bitterness profiles of these beers, the bitter tasting hop acids present in the lager327
beers were evaluated using two separate analytical methods; firstly by HPLC as328
described in section 2.4.2 and secondly by bitterness unit method (2.4.3). The latter329
method has been suggested to yield inflated bitterness values due its susceptibility to330
interference from other compounds present in beer that absorb light at the wavelength331
of measurement (Schönberger, 2006; Tomlinson, Ormrod, & Sharpe, 1995). In contrast,332
HPLC measurements are agreed to provide a better assessment of beer bitterness333
because they allow for the selective quantification of iso--acids, the major bittering334
principles in beer (Ting, Kay, & Ryder, 2007). A comparison of the hop bitter acid335
concentrations in the beers by BU and HPLC methods is presented in Fig. 2. The results336
showed that the BU of the lager beers ranged from 8 - 36 mg/L, although bitterness was337
overestimated by the BU method in comparison to HPLC values in around 60% of the338
samples. The sum of analysed iso--acid hop acid concentrations (HPLC) was between 8339
and 41 mg/L. The average bitterness across all 34 beers in both methods was ~23 mg/L340
and the most bitter beers had concentrations >30 mg/L (GG, AA and L). The latter beers341
each had lower BU values in comparison to HPLC values, e.g. beer AA had a BU value of342
34 mg/L but the HPLC value was 41 mg/L. Around 7 of the beers including U, J, I, E, C343
and T had similar bitterness concentrations according to both methods. The American344
light lager beer R contained the lowest amount of hop acids (8 mg/L) and did not contain345
any reduced iso--acid products.346
Inspection of the HPLC chromatograms revealed that both iso--acids and tetrahydro-347
iso--acids were present in beers K, S, V, N, as well as the presence of humulinones at348
up to 3 mg/L in beers O, Q, AA, T and V. The presence of tetrahydro-iso--acids in beers349
K, S, V, N explains the lower BU values attained in these beers relative to the values350

15
determined by HPLC, since BU absorbance is taken at a lower wavelength (275 nm) to351
the absorption maxima of tetrahydro-iso--acids (310 nm). Significantly, of these four352
beers the BU value of beer V which contained humulinones was the only one greater353
than the attained HPLC value. This was also the case in the other beers containing354
humulinones (O, Q and T) except for beer AA. This perhaps suggests that humulinones355
contribute to the bitterness values attained with BU method as has been previously356
observed (Parkin, 2014), although the contribution of beer polyphenols to BU values357
cannot be totally excluded either. The presence of humulinones as well as relatively high358
polyphenol content in beers O, Q, AA, T and V further supports the hypothesis that these359
beers were dry-hopped. The low TPC observed in beer Q in comparison to the other dry-360
hopped beers could be explained by a lower rate of dry-hopping or dry-hopping with361
different hop products, i.e. hop pellets which contain relatively lower polyphenol content362
instead of whole hop cones. Beers that contained tetra hop products (K, S, N, V) and363
those dry-hopped (Q, AA, T, O) both displayed distinctive polyphenol and bitter acid364
profiles. The highly dry-hopped beers (T, AA, Q) and high bitterness Czech lagers (E and365
L) all had correspondingly high contents of phenolic compounds (see Table 1 and Figure366
2).367
3.4 Selection of exemplar beers for sensory assessment368
In order to understand how the varying contents of hop acid isomers and phenolic369
compounds impact on perceived sensory bitterness, a sub-set of ‘exemplar beers’ were370
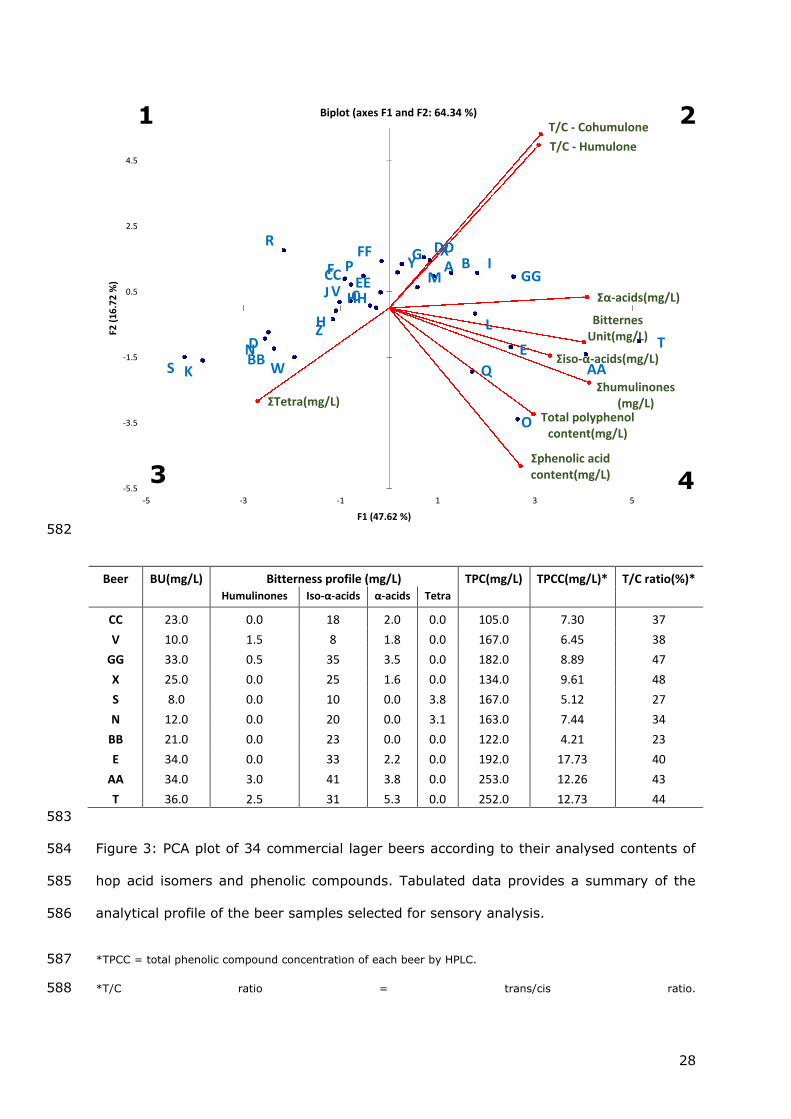
selected with the aid of a PCA plot of the analytical data. The PCA bi-plot shown in Fig. 3371
accounted for about 65% of variation within the data set. A negative loading on PC 1372
(47.6% of variation) was associated with the use of tetrahydro-iso--acids, whilst373
positive loadings on this axis were related to high levels of iso--acids, -acids,374
humulinones and phenolic compounds. A positive loading on PC2 identified beers with a375
high trans/cis ratio and residual -acids – i.e. those which had used conventional376
hopping practice as opposed to pre-isomerised or light stable products. Negative377

16
loadings on this axis were driven largely by phenolic compounds (quadrant 4) or378
tetrahydro-iso--acids (quadrant 3).379
Beers in quadrant 1 were generally lower in hop acid and polyphenol content compared380
to beers in quadrant 4 which were characterised by high levels of these compounds. The381
beers in quadrant 2 were correlated with high trans/cis ratio and residual -acids which,382
as noted, is indicative of conventional hopping techniques. Beers in quadrant 3 had lower383
trans/cis ratios, (indicative of the use of pre-isomerised hops) as well as containing384
tetrahydro-iso--acids. A total of 10 beers were selected from the 4 quadrants to385
represent the diversity amongst the 34 beers: beers CC and V from quadrant 1, X and386
GG from quadrant 2, S, N and BB from quadrant 3 and beers E, AA and T from quadrant387
4.388
3.5 Beer bitterness lexicon389
A total of 13 bitterness descriptors were generated by the trained panel of beer tasters390
following concept alignment. These attributes as well as their definitions are presented in391
Table 2, with some of the attributes e.g. instant, diminishing and progressive notably392
related to the temporal character of bitterness. Cochran’s Q test analysis of the CATA393
frequency data showed that only 4 of the 13 bitterness attributes (acidic, tart, astringent394
and artificial) did not significantly differentiate across the sample set (p> 0.05) (Table395
2). The temporal descriptors as well as descriptors such as harsh, rounded, metallic and396
smooth were all rated significantly differently amongst the 10 beers (p< 0.05).397
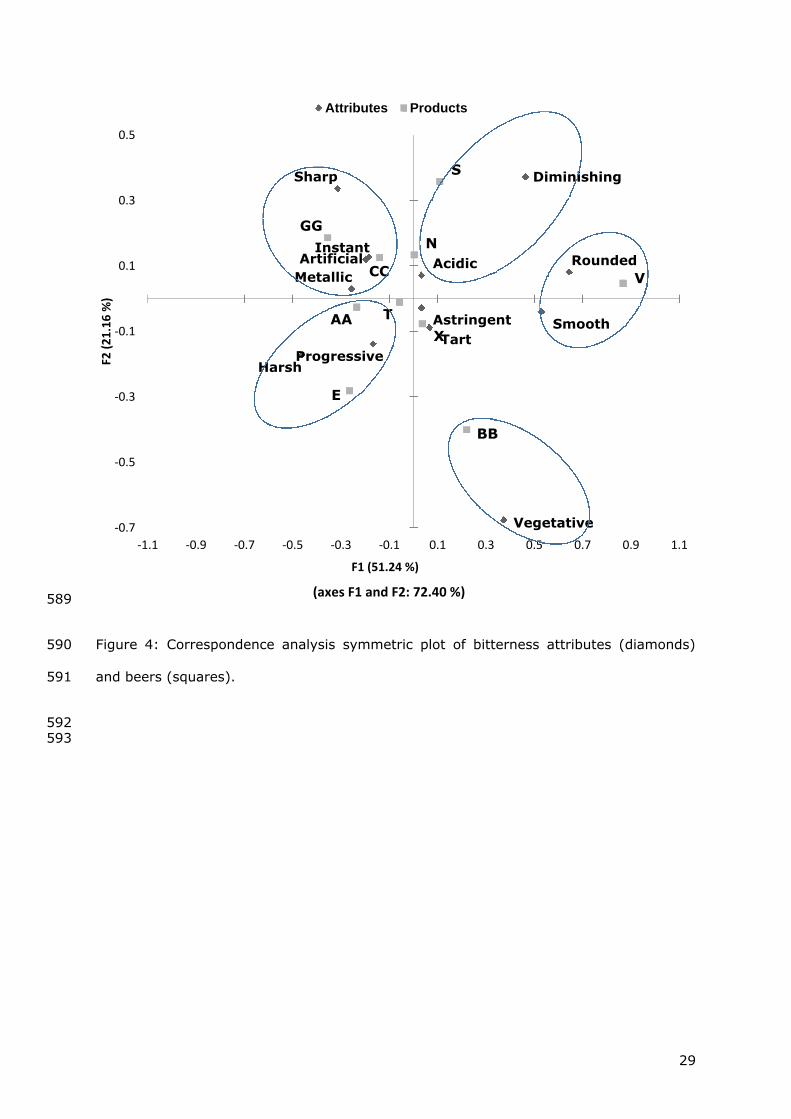
3.6 Perceived bitterness character and correlation to bitterness and polyphenolic profile398
The correspondence analysis of the sensory data is presented in Fig. 4. This revealed399
that beer CC, selected from quadrant 1 of the PCA in figure 3, which had relatively low400
hop bitter acid and polyphenol contents, was perceived as having an ‘artificial’, ‘metallic’401
and ‘instant’ bitterness. Beer V from the same quadrant (figure 3), but deduced to have402
been dry-hopped from the presence of humulinones, had a ‘rounded’ and ‘smooth’403
bitterness character; temporally this beer was ‘diminishing’ in bitterness. Conventionally404

17
bittered beer GG with a high trans/cis ratio (selected from quadrant 2 of the PCA) was405
perceived as having a ‘sharp’ and ‘instant’ bitterness. Beers N and S from quadrant 3 of406
the PCA which were bittered with a blend of tetra as well as iso--acids were described407
as ‘diminishing’ and somewhat ‘acidic’ in bitterness. Considering the trained panel was408
not aware of the analytical bitterness fingerprint of these beers, it is interesting that all409
the beers containing tetra (S, N, and V) are grouped together based on their sensory410
bitterness character in the upper right quadrant of Fig. 4. Furthermore, they were411
negatively correlated in this plot with beers AA, T and E which were relatively high in412
levels of humulinones, iso--acids and polyphenols. This further supports the notion that413
besides the intensity of bitterness, the character of bitterness in beer is also impacted by414
the type of hop product used for bittering. The contribution of humulinones to beer415
bitterness character is not yet fully understood. They were first thought not to contribute416
significantly to bitterness (Verzele, 1986) but recent publications have associated the417
presence of humulinones in beer with an increased sensation of bitterness and418
potentially the source of harsh bitterness character often present in dry-hopped beers419
(McLaughlin et al., 2008; Parkin, 2014). A recent report by Hopsteiner suggested that420
humulinones are approximately 65% as bitter as iso--acids, thus representing a421
significant additional source of bitterness in beer (Steiner, 2015).422
The third beer selected from quadrant 3 (BB) which was exclusively bittered with pre-423
isomerised products (based on the analytical profile and lower trans/cis ratio) was424
described as being ‘vegetative’ in bitterness. Beers AA, E and T from quadrant 4 of the425
PCA, containing the highest concentrations of hop acids, humulinones and polyphenols426
were described as having a ‘harsh’ and ‘progressive’ bitterness character. A study of the427
interaction between iso--acids and hop polyphenols by time-intensity (TI) and free428
choice profiling (FCP) as reported by McLaughlin et al. (2008) found a significant effect429
of polyphenols on perceived intensity, as well as character, of bitterness. In the study,430
samples high in polyphenols were higher in intensities of ‘harsh’, ‘medicinal’, and431

18
‘metallic’ (McLaughlin et al., 2008). Our results for the bitterness characters of beers AA,432
E and T in particular are in agreement with those findings.433

19
4. Conclusions434
The phenolic acid and total polyphenol contents of 34 lager beers brewed in different435
geographical locations were determined. The former was achieved by a combination of436
LLE and HPLC analysis while the latter was accomplished with an international global437
assay method. Phenolic compound concentrations ranged from 3 – 12 mg/L and TPC was438
between 74 - 256 mg/L, with the highest values identified in dry-hopped beers. No linear439
relationship was found between total phenolic compound concentration and TPC although440
dry-hopped beers were found to contain a greater amount of polyphenols in comparison441
to beers that had not been dry-hopped (N.B. the usage of dry hopping was deduced442
from the presence of significant concentrations of humulinones in the beer, but was not443
verified by the manufacturers in all instances). Sensory analysis showed that beers with444
varying profiles of bitter congeners (hop acids and phenolics) had distinctive bitterness445
characters. These differences are believed to be driven by the selective usage of various446
hop products and points of addition in the brewing process. Since the present work used447
a survey of international lager brands, these factors are largely deduced, albeit logically448
and based on obvious analytical differences between the finished beers; however, it449
should be borne in mind that the manufacturing processes were not disclosed, nor were450
they independent variables in the study. Dry-hopped beers generally contained more451
polyphenol compounds and humulinones, and were sensorially perceived as having a452
‘harsh’ and ‘progressive’ bitterness. In comparison, beers which had evidently been453
conventionally bittered and as such contained relatively high residual amount of -acids454
and trans/cis ratio were perceived as having an ‘instant’ and ‘sharp’ bitterness. Beers455
containing tetrahydro-iso--acids were rated as having a ‘diminishing’ temporal456
character of bitterness. These results support the hypothesis that the production457
processes employed by brewers in terms of hopping strategy, and the raw materials458
used, give beers a distinct polyphenolic and bitterness fingerprint which influences the459
overall bitterness impression of beer. Understanding the sensory character of bitterness460
in beers, and how that relates to their analytical bitterness fingerprint is of significant461

20
value in order to both understand consumer response to beer bitterness and to optimise462
production processes in this regard.463
Acknowledgement:464
We gratefully acknowledge the financial support of SABMiller plc and the University of465
Nottingham in sponsoring this research.466

21
References467
Aron, Patricia M, & Shellhammer, Thomas H. (2010). A discussion of polyphenols in beer468
physical and flavour stability. Journal of the Institute of Brewing, 116(4), 369-380.469
Arrieta, Álvaro A, Rodríguez-Méndez, María L, De Saja, Jose A, Blanco, Carlos A, &470
Nimubona, Dieudonné. (2010). Prediction of bitterness and alcoholic strength in beer471
using an electronic tongue. Food Chemistry, 123(3), 642-646.472
ASBC Method of Analysis. (1978). American Society of Brewing Chemists. Total473
Polyphenol, Beer-35. The Society: St Paul, MN, U.S.A.474
ASBC Method of Analysis. (2011). American Society of Brewing Chemists. Beer Bitterness,475
Beer-23A. The Society: St Paul, MN, U.S.A.476
Caballero, Isabel, Blanco, Carlos A, & Porras, María. (2012). Iso-α-acids, bitterness and loss 477
of beer quality during storage. Trends in Food Science & Technology, 26(1), 21-30.478
Callemien, Delphine, & Collin, Sonia. (2009). Structure, organoleptic properties,479
quantification methods, and stability of phenolic compounds in beer - A review. Food480
Reviews International, 26(1), 1-84.481
Cocuzza, Sandro, & Mitter, Willi. (Personal Communication). Dry Hopping - A Study Of482
Various Parameters. Hopsteiner Technical Publications.483
Collin, Sonia, Jerkovic, Vesna, Bröhan, M, & Callemien, D. (2013). Polyphenols and Beer484
Quality Natural Products: Springer. (pp. 2333-2359).485
De Keukeleire, Denis. (2000). Fundamentals of beer and hop chemistry. Quimica nova,486
23(1), 108-112.487
Dooley, Lauren, Lee, Young-seung, & Meullenet, Jean-François. (2010). The application of488
check-all-that-apply (CATA) consumer profiling to preference mapping of vanilla ice489
cream and its comparison to classical external preference mapping. Food Quality and490
Preference, 21(4), 394-401.491
Drewnowski, Adam, & Gomez-Carneros, Carmen. (2000). Bitter taste, phytonutrients, and492
the consumer: a review. The American Journal of Clinical Nutrition, 72(6), 1424-493
1435.494
Floridi, Simona, Montanari, Luigi, Marconi, Ombretta, & Fantozzi, Paolo. (2003).495
Determination of free phenolic acids in wort and beer by coulometric array detection.496
Journal of Agricultural and Food Chemistry, 51(6), 1548-1554.497
Fritsch, Annette, & Shellhammer, Thomas H. (2009). The Bitter Qualities of Reduced and498
Nonreduced Iso-α-acids. Journal of the American Society of Brewing Chemists, 67(1),499
8-13.500
Garcia, A Alonso, Grande, B Cancho, & Gándara, J Simal. (2004). Development of a rapid501
method based on solid-phase extraction and liquid chromatography with ultraviolet502
absorbance detection for the determination of polyphenols in alcohol-free beers.503
Journal of Chromatography A, 1054(1), 175-180.504
Goiris, Koen, Jaskula-Goiris, Barbara, Syryn, Evelien, Van Opstaele, Filip, De Rouck, Gert,505
Aerts, Guido, & De Cooman, Luc. (2014). The flavoring potential of hop polyphenols506
in beer. Journal of the American Society of Brewing Chemists, 72(2), 135-142.507

22
Haseleu, Gesa, Lagemann, Annika, Stephan, Andreas, Intelmann, Daniel, Dunkel, Andreas,508
& Hofmann, Thomas. (2010). Quantitative sensomics profiling of hop-derived bitter509
compounds throughout a full-scale beer manufacturing process. Journal of510
Agricultural and Food Chemistry, 58(13), 7930-7939.511
Jandera, Pavel, Škeříková, Veronika, Řehová, Lucie, Hájek, Tomáš, Baldrianová, Lucie, 512
Škopová, Gabriela, . . . Horna, Aleš. (2005). RP-HPLC analysis of phenolic513
compounds and flavonoids in beverages and plant extracts using a CoulArray514
detector. Journal of Separation Science, 28(9-10), 1005-1022.515
Lesschaeve, Isabelle, & Noble, Ann C. (2005). Polyphenols: factors influencing their sensory516
properties and their effects on food and beverage preferences. The American Journal517
of Clinical Nutrition, 81(1), 330S-335S.518
McLaughlin, Ian R, Lederer, Cindy, & Shellhammer, Thomas H. (2008). Bitterness-519
modifying properties of hop polyphenols extracted from spent hop material. Journal520
of the American Society of Brewing Chemists, 66(3), 174-183.521
Mikyška, A, Hrabak, M, Hašková, D, & Šrogl, J. (2002). The role of malt and hop522
polyphenols in beer quality, flavour and haze stability. Journal of the Institute of523
Brewing, 108(1), 78-85.524
Negri, Giuseppina, di Santi, Daniel, & Tabach, Ricardo. (2010). Bitter acids from525
hydroethanolic extracts of Humulus lupulus L., Cannabaceae, used as anxiolytic.526
Revista Brasileira de Farmacognosia, 20(6), 850-859.527
Parkin, Ellen Jane. (Unpublished results). The influence of polyphenols and humulinones on528
bitterness in dry-hopped beer.529
Peleg, Hanna, Gacon, Karine, Schlich, Pascal, & Noble, Ann C. (1999). Bitterness and530
astringency of flavan-3-ol monomers, dimers and trimers. Journal of the Science of531
Food and Agriculture, 79(8), 1123-1128.532
Schmidt, Christina, Biendl, Martin, Lagemann, Annika, Stettner, Georg, Vogt, Christian,533
Dunkel, Andreas, & Hofmann, Thomas. (2014). Influence of Different Hop Products534
on the cis/trans Ratio of Iso-α-Acids in Beer and Changes in Key Aroma and Bitter 535
Taste Molecules During Beer Ageing. Journal of the American Society of Brewing536
Chemists,72(2), 116-125.537
Schönberger, Ch, & Kostelecky, T. (2011). 125th Anniversary Review: the role of hops in538
brewing. Journal of the Institute of Brewing, 117(3), 259-267.539
Schönberger, Christina. (2006). Bitter is better. Monatsschrift für Brauwissenschaft, 3(4), 56-540
65.541
Steiner, S. (Personal Communication). Humulinone Utilization In Dry-Hopped Beers.542
Hopsteiner Newsletter.543
Taniguchi, Yoshimasa, Matsukura, Yasuko, Ozaki, Hiromi, Nishimura, Koichi, & Shindo,544
Kazutoshi. (2013). Identification and quantification of the oxidation products derived545
from α-acids and β-acids during storage of hops (Humulus lupulus L.). Journal of546
Agricultural and Food Chemistry, 61(12), 3121-3130.547
Ting, Patrick L, Kay, Susan, & Ryder, David. (2007). Separation and identification of548
stereoisomers of isomerized α-acid derivatives by HPLC/DAD and electrospray 549
HPLC/MS. Journal of the American Society of Brewing Chemists, 65(1), 9-14.550

23
Tomlinson, JB, Ormrod, IHL, & Sharpe, FR. (1995). A novel method for bitterness551
determination in beer using a delayed fluorescence technique. Journal of the Institute552
of Brewing, 101(2), 113-118.553
Torres, Andrew M, Mau-Lastovicka, Terry, & Rezaaiyan, Ruhi. (1987). Total phenolics and554
high-performance liquid chromatography of phenolic acids of avocado. Journal of555
Agricultural and Food Chemistry, 35(6), 921-925.556
Verzele, M. (1986). 100 years of hop chemistry and its relevance to brewing. Journal of the557
Institute of Brewing, 92(1), 32-48.558
Wolfe, Peter Harold. (Unpublished results). A study of factors affecting the extraction of559
flavor when dry hopping beer.560
561

24
Table 1: Variation in the total analysed concentrations of phenolic compounds in 34562
commercal lager beers.563
564
TPCC* (mg/L)
BEER COUNTRY SUM SE
O USA 21.17 1.5
Q USA 13.12 0.8
HH Czech republic 18.25 1.5
E Czech republic 17.73 1.8
L Czech republic 13.87 1.1
AA UK 12.26 1.1
T USA 12.73 0.6
I Czech republic 12.05 1.0
W Belgium 11.39 0.4
G Hungary 11.26 0.8
X Czech republic 9.61 0.2
M Italy 9.17 1.0
K Czech republic 9.28 1.5
Y Netherlands 8.45 0.7
Z Turkey 8.18 0.4
GG Romania 8.89 0.5
A Poland 8.47 0.4
EE Peru 8.26 0.8
N France 7.44 0.7
CC Italy 7.30 0.5
B Poland 7.67 0.5
R USA 6.55 1.0
DD Australia 5.75 0.5
V UK 6.45 0.5
FF Cuba 6.32 0.7
S Denmark 5.12 0.2
P Germany 6.10 0.2
J Germany 5.75 0.6
H Netherlands 4.79 0.5
U Netherlands 5.84 1.0
C South Africa 5.59 0.2
BB Australia 4.21 0.5
D South Africa 4.42 0.3
F South Africa 3.91 0.1
565
* TPCC = total phenolic compound concentration of gallic acid, hydroquinone, protocatechuic acid, catechin,566
epicatechin, 4-hydroxybenzoic acid, 4-hydroxyphenylacetic acid, caffeic acid, vanillic acid, sinapic acid, syrignic567
acid, p-coumaric acid, ferulic acid and cinnamic acid quantified in beer by HPLC.568
SE is standard error of three independent replicate analyses.569

25
Table 2: Beer bitterness descriptors (and their definitions) which were used for sensory570
evaluation.571
Attribute Definition p-value
Harsh
Acidic
Tart
Rounded
Metallic
Sharp
Smooth
Astringent
Artificial
Vegetative
Progressive
Instant
Diminishing
Tingly, painful, irritating, raspy
Vinegary, fruit-like acidity
Acidic with sour notes
Pleasant, not spiky, not harsh
Tin/metal taste, silver coin taste
Instant, bitterness taste at tip of tongue
Velvety
Dry, causing drying of the mouth
Chemically, unnatural beer taste
Cabbage, sprout-like bitterness, hop-tea
Bitterness perception increases gradually
Instantaneous bitterness
Bitterness perception decreases quickly after ingestion
0.000*
0.491
0.219
0.000*
0.041*
0.008*
0.006*
0.659
0.517
0.000*
0.009*
0.020*
0.002*
p-values are from Cochran’s Q-test. *P<0.05 indicates that the term was scored significantly572differently amongst the 10 lager beers used for sensory bitterness characterisation.573

576
579
580
577
581
582
578
583
584
Figure 1
content
Figure 1
content
Figure 1
content
Figure 1:
content (according to ASBC method Beer
: Plot of total phenolic compound concentrations (HPLC)
(according to ASBC method Beer
Plot of total phenolic compound concentrations (HPLC)
(according to ASBC method Beer
Plot of total phenolic compound concentrations (HPLC)
(according to ASBC method Beer
Plot of total phenolic compound concentrations (HPLC)
(according to ASBC method Beer
Plot of total phenolic compound concentrations (HPLC)
(according to ASBC method Beer
Plot of total phenolic compound concentrations (HPLC)
(according to ASBC method Beer
Plot of total phenolic compound concentrations (HPLC)
(according to ASBC method Beer
Plot of total phenolic compound concentrations (HPLC)
(according to ASBC method Beer
Plot of total phenolic compound concentrations (HPLC)
(according to ASBC method Beer
Plot of total phenolic compound concentrations (HPLC)
(according to ASBC method Beer
Plot of total phenolic compound concentrations (HPLC)
(according to ASBC method Beer
Plot of total phenolic compound concentrations (HPLC)
(according to ASBC method Beer-
Plot of total phenolic compound concentrations (HPLC)
-35)
Plot of total phenolic compound concentrations (HPLC)
35) for 34
Plot of total phenolic compound concentrations (HPLC)
for 34
Plot of total phenolic compound concentrations (HPLC)
for 34
Plot of total phenolic compound concentrations (HPLC)
commercial
Plot of total phenolic compound concentrations (HPLC)
commercial
Plot of total phenolic compound concentrations (HPLC)
commercial
Plot of total phenolic compound concentrations (HPLC)
commercial
Plot of total phenolic compound concentrations (HPLC)
commercial lager beers.
versus
lager beers.
versus
lager beers.
versus total polyphenol
lager beers.
total polyphenol
lager beers.
total polyphenol
lager beers.
total polyphenoltotal polyphenol
26
total polyphenol
26
total polyphenoltotal polyphenol

27
577
Figure 2: A comparison of the bitterness of 34 commercial lager beers as determined both by spectrophotometric BU values (striped578bars) and the sum of iso-humulones determined by HPLC analysis (black bars).579
Data are ordered by increasing sum of iso--acids; error bars represent standard error values of 3 independent replicate analyses.580*Signifies beers containing tetrahydro-iso--acids.581
0
5
10
15
20
25
30
35
40
45
50
V R S HH EE FF CC H F Z N A U D O Y C J P BB K DD B W Q X G M I T E GG L AA
Beers
Sum(iso-α-acids) BU
28
582
Beer BU(mg/L) Bitterness profile (mg/L) TPC(mg/L) TPCC(mg/L)* T/C ratio(%)*Humulinones Iso-α-acids α-acids Tetra
CC 23.0 0.0 18 2.0 0.0 105.0 7.30 37
V 10.0 1.5 8 1.8 0.0 167.0 6.45 38
GG 33.0 0.5 35 3.5 0.0 182.0 8.89 47
X 25.0 0.0 25 1.6 0.0 134.0 9.61 48
S 8.0 0.0 10 0.0 3.8 167.0 5.12 27
N 12.0 0.0 20 0.0 3.1 163.0 7.44 34
BB 21.0 0.0 23 0.0 0.0 122.0 4.21 23
E 34.0 0.0 33 2.2 0.0 192.0 17.73 40
AA 34.0 3.0 41 3.8 0.0 253.0 12.26 43
T 36.0 2.5 31 5.3 0.0 252.0 12.73 44
583
Figure 3: PCA plot of 34 commercial lager beers according to their analysed contents of584
hop acid isomers and phenolic compounds. Tabulated data provides a summary of the585
analytical profile of the beer samples selected for sensory analysis.586
*TPCC = total phenolic compound concentration of each beer by HPLC.587
*T/C ratio = trans/cis ratio.588
O
K
CC
BB
AGG
DD
JM
NAA
IEE
S
G
E
L
F
W
Y
C
H
FFP
T
HH
R
B
Z
Q
D
X
V
Σphenolic acid content(mg/L)
Total polyphenolcontent(mg/L)
Σhumulinones (mg/L)
Σiso-α-acids(mg/L)
Σα-acids(mg/L)
ΣTetra(mg/L)
T/C - Cohumulone
T/C - Humulone
BitternesUnit(mg/L)
-5.5
-3.5
-1.5
0.5
2.5
4.5
-5 -3 -1 1 3 5
F2(1
6.7
2%
)
F1 (47.62 %)
Biplot (axes F1 and F2: 64.34 %) 2
3 4
1
29
589
Figure 4: Correspondence analysis symmetric plot of bitterness attributes (diamonds)590
and beers (squares).591
592593
Harsh
Acidic
Tart
Rounded
Metallic
Sharp
SmoothAstringent
Artificial
Vegetative
Progressive
Instant
Diminishing
AA
BB
CC
E
GG
N
S
T
V
X
-0.7
-0.5
-0.3
-0.1
0.1
0.3
0.5
-1.1 -0.9 -0.7 -0.5 -0.3 -0.1 0.1 0.3 0.5 0.7 0.9 1.1
F2(2
1.1
6%
)
F1 (51.24 %)
(axes F1 and F2: 72.40 %)
Attributes Products