Embed Size (px)
Citation preview
OLAP for Trajectories ∗
O. Baltzer † F. Dehne ‡ S. Hambrusch § A. Rau-Chaplin ¶
Abstract
In this paper, we present an OLAP framework for trajectories of moving objects. We in-troduce a new operator GROUP TRAJECTORIES for group-by operations on trajectories andpresent three implementation alternatives for computing groups of trajectories for group-by ag-gregation: group by overlap, group by intersection, and group by overlap and intersection. Wealso present an interactive OLAP environment for resolution drill-down/roll-up on sets of tra-jectories and parameter browsing. Using generated and real life moving data sets, we evaluatethe performance of our GROUP TRAJECTORIES operator.
1 Introduction
Global positioning (GPS) and RFID systems are creating vast amounts of spatio-temporal datafor moving objects. A set of moving objects is typically stored as a relational table objects whereeach record contains a value trajectory = [(x1, y1, t1), (x2, y2, t2), . . . (xm, ym, tm)] representing themovement of the respective object as a sequence of positions at time t1, t2, . . . tm. The developmentof spatio-temporal databases for storing and manipulating spatio-temporal data is well advanced(see Section 2 below). However, in order to efficiently analyze large scale data sets representingmoving objects, it is also important to have available the well established set of tools for OLAPanalysis. In order to apply OLAP tools towards moving object datasets, it is necessary to aggregatewith respect to trajectory as a feature dimension as well as a measure dimension.
7
8
6
69
76
8
7
8
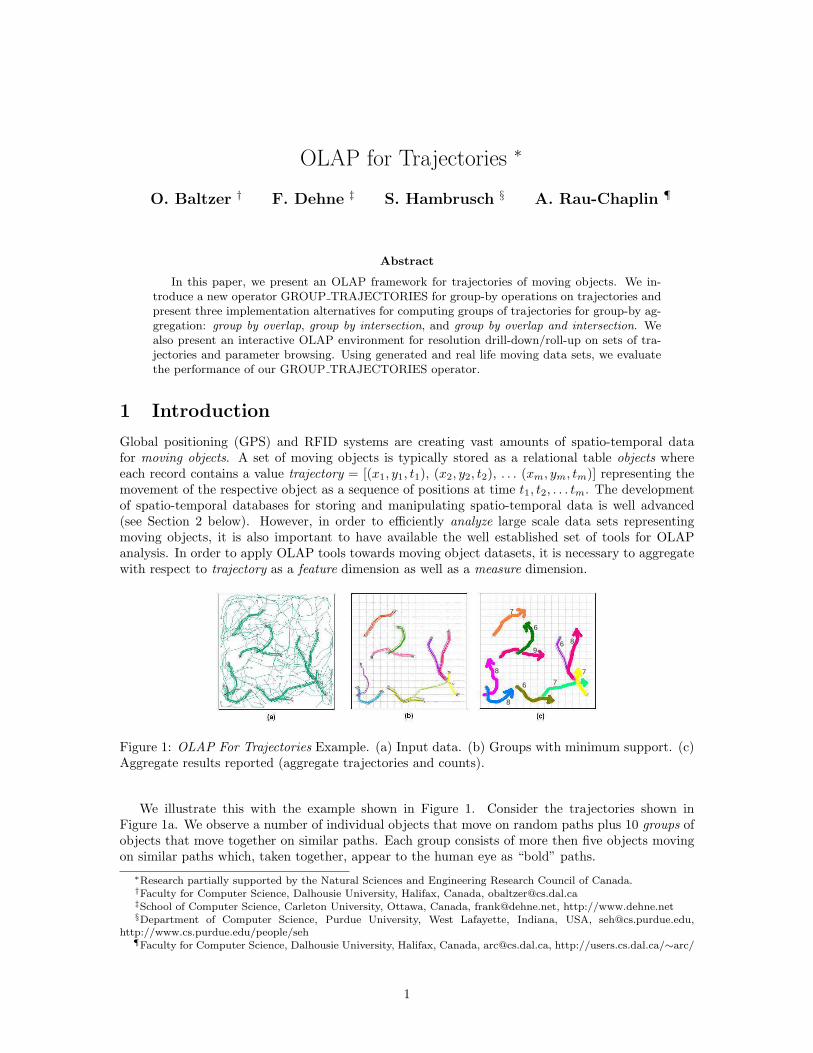
Figure 1: OLAP For Trajectories Example. (a) Input data. (b) Groups with minimum support. (c)Aggregate results reported (aggregate trajectories and counts).
We illustrate this with the example shown in Figure 1. Consider the trajectories shown inFigure 1a. We observe a number of individual objects that move on random paths plus 10 groups ofobjects that move together on similar paths. Each group consists of more then five objects movingon similar paths which, taken together, appear to the human eye as “bold” paths.
∗Research partially supported by the Natural Sciences and Engineering Research Council of Canada.†Faculty for Computer Science, Dalhousie University, Halifax, Canada, [email protected]‡School of Computer Science, Carleton University, Ottawa, Canada, [email protected], http://www.dehne.net§Department of Computer Science, Purdue University, West Lafayette, Indiana, USA, [email protected],
http://www.cs.purdue.edu/people/seh¶Faculty for Computer Science, Dalhousie University, Halifax, Canada, [email protected], http://users.cs.dal.ca/∼arc/
1
Consider the following SQL query where trajectory is both, a feature dimension as well as ameasure dimension:
SELECT AGGREGATE(trajectory) AS trajectoryCOUNT(trajectory) as count
FROM objectsGROUP BY GROUP_TRAJECTORIES(trajectory,
resolution)HAVING COUNT(*) >= 5
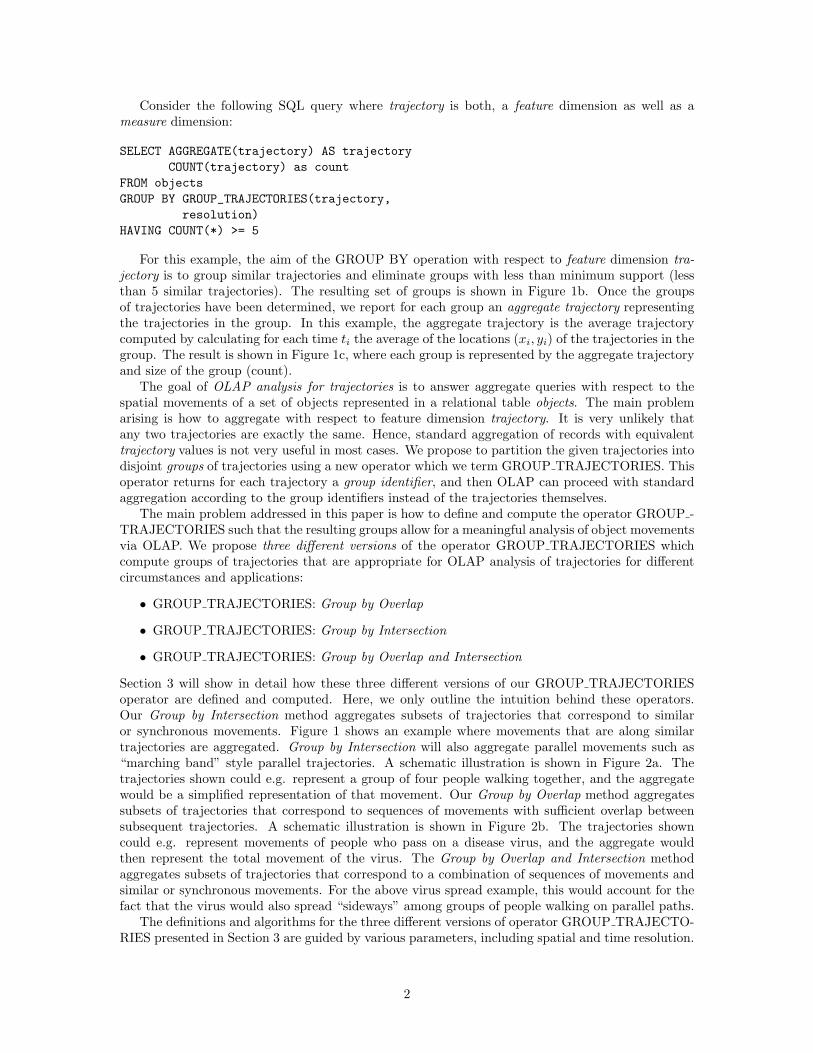
For this example, the aim of the GROUP BY operation with respect to feature dimension tra-jectory is to group similar trajectories and eliminate groups with less than minimum support (lessthan 5 similar trajectories). The resulting set of groups is shown in Figure 1b. Once the groupsof trajectories have been determined, we report for each group an aggregate trajectory representingthe trajectories in the group. In this example, the aggregate trajectory is the average trajectorycomputed by calculating for each time ti the average of the locations (xi, yi) of the trajectories in thegroup. The result is shown in Figure 1c, where each group is represented by the aggregate trajectoryand size of the group (count).
The goal of OLAP analysis for trajectories is to answer aggregate queries with respect to thespatial movements of a set of objects represented in a relational table objects. The main problemarising is how to aggregate with respect to feature dimension trajectory. It is very unlikely thatany two trajectories are exactly the same. Hence, standard aggregation of records with equivalenttrajectory values is not very useful in most cases. We propose to partition the given trajectories intodisjoint groups of trajectories using a new operator which we term GROUP TRAJECTORIES. Thisoperator returns for each trajectory a group identifier, and then OLAP can proceed with standardaggregation according to the group identifiers instead of the trajectories themselves.
The main problem addressed in this paper is how to define and compute the operator GROUP -TRAJECTORIES such that the resulting groups allow for a meaningful analysis of object movementsvia OLAP. We propose three different versions of the operator GROUP TRAJECTORIES whichcompute groups of trajectories that are appropriate for OLAP analysis of trajectories for differentcircumstances and applications:
• GROUP TRAJECTORIES: Group by Overlap
• GROUP TRAJECTORIES: Group by Intersection
• GROUP TRAJECTORIES: Group by Overlap and Intersection
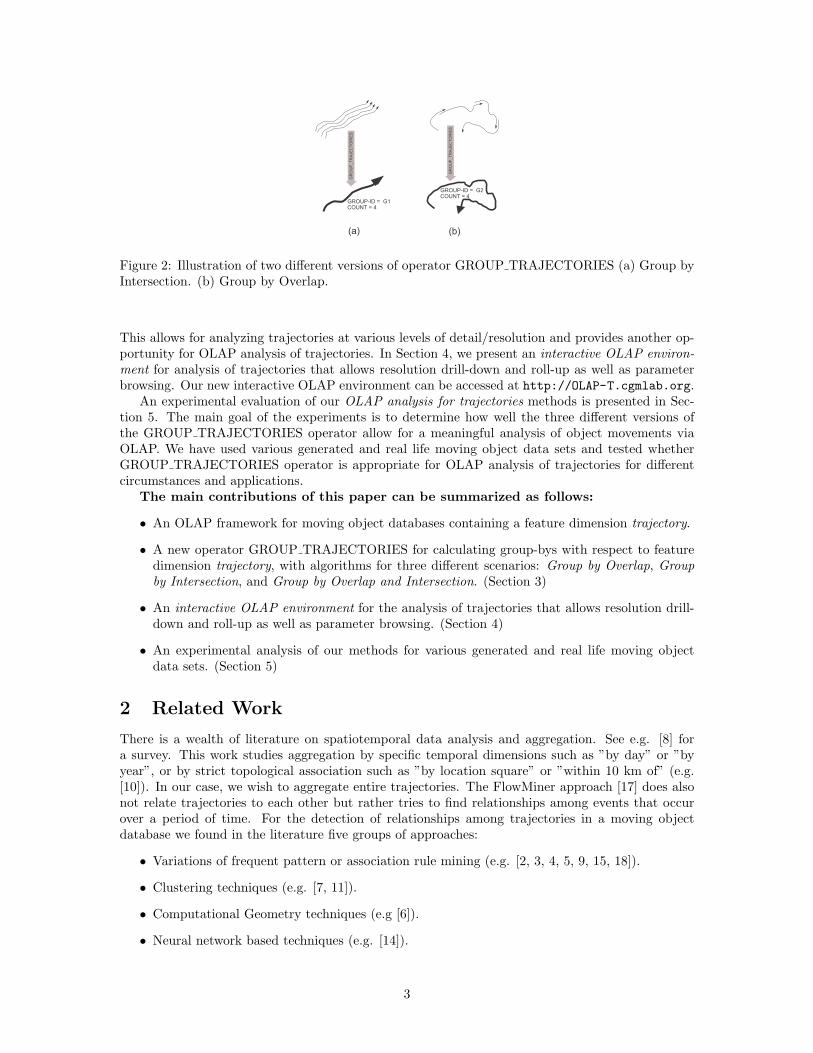
Section 3 will show in detail how these three different versions of our GROUP TRAJECTORIESoperator are defined and computed. Here, we only outline the intuition behind these operators.Our Group by Intersection method aggregates subsets of trajectories that correspond to similaror synchronous movements. Figure 1 shows an example where movements that are along similartrajectories are aggregated. Group by Intersection will also aggregate parallel movements such as“marching band” style parallel trajectories. A schematic illustration is shown in Figure 2a. Thetrajectories shown could e.g. represent a group of four people walking together, and the aggregatewould be a simplified representation of that movement. Our Group by Overlap method aggregatessubsets of trajectories that correspond to sequences of movements with sufficient overlap betweensubsequent trajectories. A schematic illustration is shown in Figure 2b. The trajectories showncould e.g. represent movements of people who pass on a disease virus, and the aggregate wouldthen represent the total movement of the virus. The Group by Overlap and Intersection methodaggregates subsets of trajectories that correspond to a combination of sequences of movements andsimilar or synchronous movements. For the above virus spread example, this would account for thefact that the virus would also spread “sideways” among groups of people walking on parallel paths.
The definitions and algorithms for the three different versions of operator GROUP TRAJECTO-RIES presented in Section 3 are guided by various parameters, including spatial and time resolution.
2
GR
OU
P_
TR
AJE
CT
OR
IES
GROUP-ID = G1 COUNT = 4
GR
OU
P_
TR
AJE
CT
OR
IES
(a) (b)
GROUP-ID = G2 COUNT = 4
Figure 2: Illustration of two different versions of operator GROUP TRAJECTORIES (a) Group byIntersection. (b) Group by Overlap.
This allows for analyzing trajectories at various levels of detail/resolution and provides another op-portunity for OLAP analysis of trajectories. In Section 4, we present an interactive OLAP environ-ment for analysis of trajectories that allows resolution drill-down and roll-up as well as parameterbrowsing. Our new interactive OLAP environment can be accessed at http://OLAP-T.cgmlab.org.
An experimental evaluation of our OLAP analysis for trajectories methods is presented in Sec-tion 5. The main goal of the experiments is to determine how well the three different versions ofthe GROUP TRAJECTORIES operator allow for a meaningful analysis of object movements viaOLAP. We have used various generated and real life moving object data sets and tested whetherGROUP TRAJECTORIES operator is appropriate for OLAP analysis of trajectories for differentcircumstances and applications.
The main contributions of this paper can be summarized as follows:
• An OLAP framework for moving object databases containing a feature dimension trajectory.
• A new operator GROUP TRAJECTORIES for calculating group-bys with respect to featuredimension trajectory, with algorithms for three different scenarios: Group by Overlap, Groupby Intersection, and Group by Overlap and Intersection. (Section 3)
• An interactive OLAP environment for the analysis of trajectories that allows resolution drill-down and roll-up as well as parameter browsing. (Section 4)
• An experimental analysis of our methods for various generated and real life moving objectdata sets. (Section 5)
2 Related Work
There is a wealth of literature on spatiotemporal data analysis and aggregation. See e.g. [8] fora survey. This work studies aggregation by specific temporal dimensions such as ”by day” or ”byyear”, or by strict topological association such as ”by location square” or ”within 10 km of” (e.g.[10]). In our case, we wish to aggregate entire trajectories. The FlowMiner approach [17] does alsonot relate trajectories to each other but rather tries to find relationships among events that occurover a period of time. For the detection of relationships among trajectories in a moving objectdatabase we found in the literature five groups of approaches:
• Variations of frequent pattern or association rule mining (e.g. [2, 3, 4, 5, 9, 15, 18]).
• Clustering techniques (e.g. [7, 11]).
• Computational Geometry techniques (e.g [6]).
• Neural network based techniques (e.g. [14]).
3
• Edit distance, warping techniques and longest common subsequence (LCSS) extraction (e.g.[12, 13, 16, 19]).
The closest work to our proposed OLAP framework for trajectories is Gidofalvi and Pedersen’swork [3] on detecting shareable patterns in trajectories of moving objects for applications like ridesharing (and similar work in [9, 2]). They use frequent itemsets to detect long shareable pathsand cover a special case of our approach where one only wants to aggregate trajectories that arevery similar and have a very large overlap. In this paper, we present algorithms that cover variouskinds of grouping and aggregation that are important in an OLAP setting. In particular, we canalso detect and aggregate groups of trajectories that correspond to “marching band” style parallelmovements as well as groups of trajectories corresponding to sequences of movements that arelinked to each other. None of these types of group movements can be detected by Gidofalvi andPedersen’s methods. Algorithmically, their work is based exclusively on analyzing frequent itemsets, whereas our methods consist of three phases: frequent itemset mining, reverse matching, andgroup merging. Our additional reverse matching and group merging phases are, to our knowledge,novel approaches. They lead to more meaningful and more flexible aggregation of trajectories andthey also lead to a much smaller number of groups which results in more OLAP aggregation. It isgenerally the case that for frequent pattern mining and edit distance derived approaches, the numberof patterns that are detected can be very large resulting in a very large number of groups, whichcan lead to very little OLAP aggregation. For example, [18, 4] define equivalence regions aroundlocations and line segments, and propose modified version of Apriori and FP-growth for frequentpattern mining. [9, 5] approximate the locations of trajectories by regions and performs frequentpattern mining across those regions. [2] approximates the segments of a trajectory with coarser linesegments and performs frequent pattern mining over those line segments. Similar arguments applyto clustering techniques (e.g. [7, 11]), Computational Geometry techniques (e.g [6]), and NeuralNetwork based techniques (e.g. [14]) which focus on finding similarity between paths but do notcover the various kinds of grouping and aggregation that are important in an OLAP setting. The editdistance, warping technique or longest common subsequence based methods listed above do performtrajectory comparisons but are designed for entirely different types of applications and input data.The methods in [12] use LCSS for matching and identifying motion from video. Similarly, [16] usesLCSS for matching similar multi-dimensional trajectories for sign-language recognition, and [13] usesk-warping algorithms to index soccer games recorded on video.
3 Computing Groups Of Trajectories
Consider N moving objects on a 2D spatial grid. Each object is identified by a unique tag number(similar to EPC in RFID). Object movements are recorded through a set of readings ((x, y), i, t)indicating that object (tag) i was detected at time t within the grid cell located at (x, y). The Nmoving objects are represented by a relational table objects with N records. Each record containsvalues tag, name, size, color, etc. describing one object according to a star schema. Among themis a value trajectory representing the movement of the respective object as a sequence [(x1, y1, t1),(x2, y2, t2), . . . (xm, ym, tm)] of positions at time t = t1, t2, . . . tm. Our goal is to aggregate withrespect to dimension trajectory. For this purpose, we define a new operator GROUP TRAJECTO-RIES which returns for each trajectory a group identifier, and then proceed with standard OLAPaggregation according to the group identifiers instead of the trajectories themselves.
In this section we present three different implementations of the operator GROUP TRAJECTO-RIES which compute groups of trajectories that are appropriate for OLAP analysis of trajectoriesfor different circumstances and applications: Group by Overlap, Group by Intersection, and Groupby Overlap and Intersection.
Algorithm 1 outlines our high level framework for the three implementations of operator GROUP -TRAJECTORIES. We first apply a time and space resolution mapping of our initial set T of tra-jectories (Line 1). This allows for the resolution drill-down and roll-up within our interactive OLAPframework for trajectories discussed in Section 4. Here, we want to allow the OLAP user to switchbetween different levels of resolution. For example, time granularity “day” may be sufficient for a
4
high level analysis of GPS data for the movement of a fleet of ships. However, a drill-down to theset of paths taken by a group of ships entering a port may require a time granularity “minute”.Next, we compute frequent itemsets for the mapped set of trajectories (Line 2) and then apply areverse mapping step (Lines 3-7). Here, we determine for each frequent itemset f , the correspondingoriginal group c of trajectories and create a set C of resulting (f, c) pairs.
The most important part of our method is the group merging phase (Line 8). Here, we presentthree different methods: (a) Group by Overlap (Algorithm 2), (b) Group by Intersection (Algo-rithm 3), and (c) Group by Overlap and Intersection (Algorithm 4). These three methods arediscussed in detail in the following Sections 3.1, 3.2 and 3.3, respectively.
Algorithm 1 High-level Trajectory Aggregation FrameworkInput:
1. set T of trajectories,2. space resolution rspace,3. time resolution rtime,4. minimum support s,5. minimum length l.
Output: set of groups G1: map T to resolution (rspace, rtime) resulting in T ′
2: compute frequent itemsets F in T ′ with minimum support s and minimum length l
Reverse matching
3: C ← ∅4: for all f ∈ F do5: determine the subset c of T that corresponds to f6: C ← C ∪ {(f, c)}7: end for
Group merging
8: select one of(a) Group by Overlap (Algorithm 2)(b) Group by Intersection (Algorithm 3)(c) Group by Overlap and Intersection (Algorithm 4)
9: return the resulting set of groups G
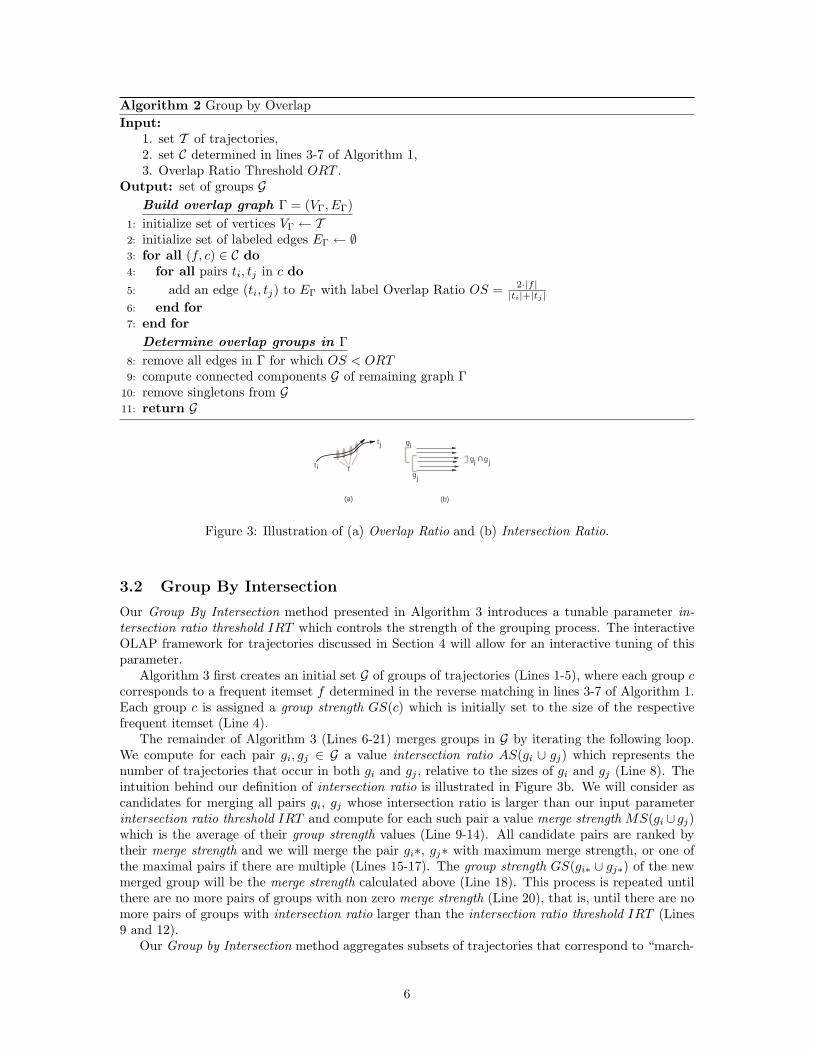
3.1 Group By Overlap
Our Group By Overlap method presented in Algorithm 2 introduces a tunable parameter overlapratio threshold ORT which controls the strength of the grouping process. The interactive OLAPframework for trajectories discussed in Section 4 will allow for an interactive tuning of this parameter.
Algorithm 2 is based on an overlap graph Γ, where each vertex corresponds to a trajectory (Lines1 and 2). For each frequent item set f and corresponding set c of trajectories, we consider all pairsof trajectories ti, tj ∈ c and add for each pair an edge (ti, tj) with label overlap ratio OS = 2·|f |
|ti|+|tj |(Lines 3-7). The intuition behind the definition of overlap ratio is illustrated in Figure 3a. Itmeasures the size of the overlap relative to the sizes of the trajectories. We then remove all edgeswhere the overlap ratio OS is smaller than the chosen overlap ratio threshold ORT (Line 8) andcompute the connected components of the remaining graph (Line 9). These components correspondto the groups of trajectories that are reported.
The nature of the obtained groups of trajectories is determined by two factors. (1) The overlapratio threshold ORT determines how much two neighboring trajectories within a group have tooverlap. (2) The graph connected component construction (Line 9) allows for an “adding up” oftrajectories corresponding to a “relay” type of movement. Depending on the chosen overlap ratiothreshold ORT , the “relay” parties will have to move in unison for more or less of their own individualmovements.
5
Algorithm 2 Group by OverlapInput:
1. set T of trajectories,2. set C determined in lines 3-7 of Algorithm 1,3. Overlap Ratio Threshold ORT .
Output: set of groups GBuild overlap graph Γ = (VΓ, EΓ)
1: initialize set of vertices VΓ ← T2: initialize set of labeled edges EΓ ← ∅3: for all (f, c) ∈ C do4: for all pairs ti, tj in c do5: add an edge (ti, tj) to EΓ with label Overlap Ratio OS = 2·|f |
|ti|+|tj |6: end for7: end for
Determine overlap groups in Γ8: remove all edges in Γ for which OS < ORT9: compute connected components G of remaining graph Γ
10: remove singletons from G11: return G
ti
tj
f
(a) (b)
gi
gj
g g U
i j
Figure 3: Illustration of (a) Overlap Ratio and (b) Intersection Ratio.
3.2 Group By Intersection
Our Group By Intersection method presented in Algorithm 3 introduces a tunable parameter in-tersection ratio threshold IRT which controls the strength of the grouping process. The interactiveOLAP framework for trajectories discussed in Section 4 will allow for an interactive tuning of thisparameter.
Algorithm 3 first creates an initial set G of groups of trajectories (Lines 1-5), where each group ccorresponds to a frequent itemset f determined in the reverse matching in lines 3-7 of Algorithm 1.Each group c is assigned a group strength GS(c) which is initially set to the size of the respectivefrequent itemset (Line 4).
The remainder of Algorithm 3 (Lines 6-21) merges groups in G by iterating the following loop.We compute for each pair gi, gj ∈ G a value intersection ratio AS(gi ∪ gj) which represents thenumber of trajectories that occur in both gi and gj , relative to the sizes of gi and gj (Line 8). Theintuition behind our definition of intersection ratio is illustrated in Figure 3b. We will consider ascandidates for merging all pairs gi, gj whose intersection ratio is larger than our input parameterintersection ratio threshold IRT and compute for each such pair a value merge strength MS(gi ∪ gj)which is the average of their group strength values (Line 9-14). All candidate pairs are ranked bytheir merge strength and we will merge the pair gi∗, gj∗ with maximum merge strength, or one ofthe maximal pairs if there are multiple (Lines 15-17). The group strength GS(gi∗ ∪ gj∗) of the newmerged group will be the merge strength calculated above (Line 18). This process is repeated untilthere are no more pairs of groups with non zero merge strength (Line 20), that is, until there are nomore pairs of groups with intersection ratio larger than the intersection ratio threshold IRT (Lines9 and 12).
Our Group by Intersection method aggregates subsets of trajectories that correspond to “march-
6
ing band” style parallel movements. The nature of the obtained groups of trajectories is determinesby two factors. (1) The intersection ratio threshold IRT determines how many shared trajectoriesbetween two groups is “sufficient” for them to be merged. (2) The merging process in Lines 6 to21 which is similar in nature to a minimum spanning tree calculation. We merge first the largestgroups with sufficient shared trajectories and then work our way down to the smaller groups. Unlikethe Group by Overlap method which combines sequences of movements, the Group by Intersectionmethod combines parallel of movements.
Algorithm 3 Group by IntersectionInput:
1. set C determined in lines 3-7 of Algorithm 1,2. Intersection Ratio Threshold IRT .
Output: set of groups GCreate initial set of intersection groups
1: G ← ∅2: for all (f, c) ∈ C do3: G ← G ∪ {c}4: set initial Group Strength GS(c) = |f |5: end for
Merge intersection groups
6: repeat7: for all gi, gj ∈ G, gi 6= gj do8: set Intersection Ratio
AS(gi ∪ gj) = min(
|gi∩gj ||g1| ,
|gi∩gj ||g2|
)9: if AS(gi ∪ gj) > IRT then
10: set Merge StrengthMS(gi ∪ gj) = GS(gi)+GS(gj)
211: else12: set Merge Strength MS(gi ∪ gj) = 013: end if14: end for15: find gi∗ ∪ gj∗ for which MS(gi∗ ∪ gj∗) is maximal16: if MS(gi∗ ∪ gj∗) 6= 0 then17: G ← (G \ {gi∗, gj∗}) ∪ {gi∗ ∪ gj∗}18: set Group Strength
GS(gi∗ ∪ gj∗) = MS(gi∗ ∪ gj∗)19: end if20: until MS(gi∗ ∪ gj∗) = 021: return G
3.3 Group By Intersection and Overlap
The goal of our Group by Intersection and Overlap method is to group both, sequences of movementsand parallel movements. Algorithm 4 is a combination of Algorithm 2 and Algorithm 3. In Lines1-20, we create the same set G′ of groups of trajectories as in Algorithm 3. In Lines 21-28, we createthe same overlap graph Γ as in Algorithm 2. The combination occurs in Line 29, where we add to Γa clique for each g ∈ G′ (i.e. edges between all pairs of trajectories t1, t2 ∈ g). Line 30 then computesthe connected components of the modified graph Γ. Each connected component corresponds to agroup of trajectories.
The resulting groups are strings of overlapping trajectories as in our Group by Overlap methodto which we add parallel trajectories as in our Group by Intersection method. The aggregation isguided by two parameters, the intersection strength threshold IRT and the overlap ratio threshold
7
ORT , which control the width and length, respectively, of the generated groups.
Algorithm 4 Group by Intersection and OverlapInput:
1. set T of trajectories,2. set C determined in lines 3-7 of Algorithm 1,3. Intersection Ratio Threshold IRT ,4. Overlap Ratio Threshold ORT .
Output: set of groups GGroup by Intersection:Create initial set of intersection groups
1: Lines 1-5 of Algorithm 3Group by Intersection:Merge intersection groups
2: Lines 6-20 of Algorithm 3Group by Overlap:Build overlap graph Γ = (VΓ, EΓ)
3: Lines 1-7 of Algorithm 2Group by Overlap:Determine overlap groups in Γ
4: Lines 8 of Algorithm 2Combine groupings
5: For each g ∈ G, add a clique connecting all t ∈ g to the graph Γ6: compute the connected components G′ of Γ7: remove all singletons from G′8: return G′
4 Interactive OLAP For Trajectories
The algorithms for the three different versions of operator GROUP TRAJECTORIES presentedin Section 3 are guided by the following parameters: space resolution, time resolution, minimumsupport, intersection ratio threshold and overlap ratio threshold. This allows to analyze groups oftrajectories for various levels of resolution or connectedness, and provides another opportunity forOLAP analysis of trajectories. For example, for a high level analysis of GPS data for the movementof a fleet of ships, time granularity “day” may be sufficient. However, a drill-down to viewing thepaths taken by a group of ships when entering a port may require a time granularity “minute”.As an example for browsing a parameter like overlap ratio threshold, consider a set of trajectoriesrepresenting movements of people who pass on a disease virus. The aggregate, using our Groupby Overlap method, could be used to analyze the total movement of the virus. In this example,our parameter overlap ratio threshold would represent to amount of interaction between individualsrequired to pass on the virus. Changing the threshold value allows to evaluate how far the virus willspread based on different assumption about its transmission.
We have built a prototype interactive environment for the analysis of trajectories that allowsresolution drill-down and roll-up as well as parameter browsing. It can be accessed at http://OLAP-T.cgmlab.org. A screen image is shown in Figure 4. At this point, our system visualizes animplementation of the operator GROUP TRAJECTORIES presented in this paper. It does not yetinclude other OLAP functionality. Our system allows to explore the results of operator GROUP -TRAJECTORIES depending on different resolution and threshold values for several synthetic andreal life data sets.
8
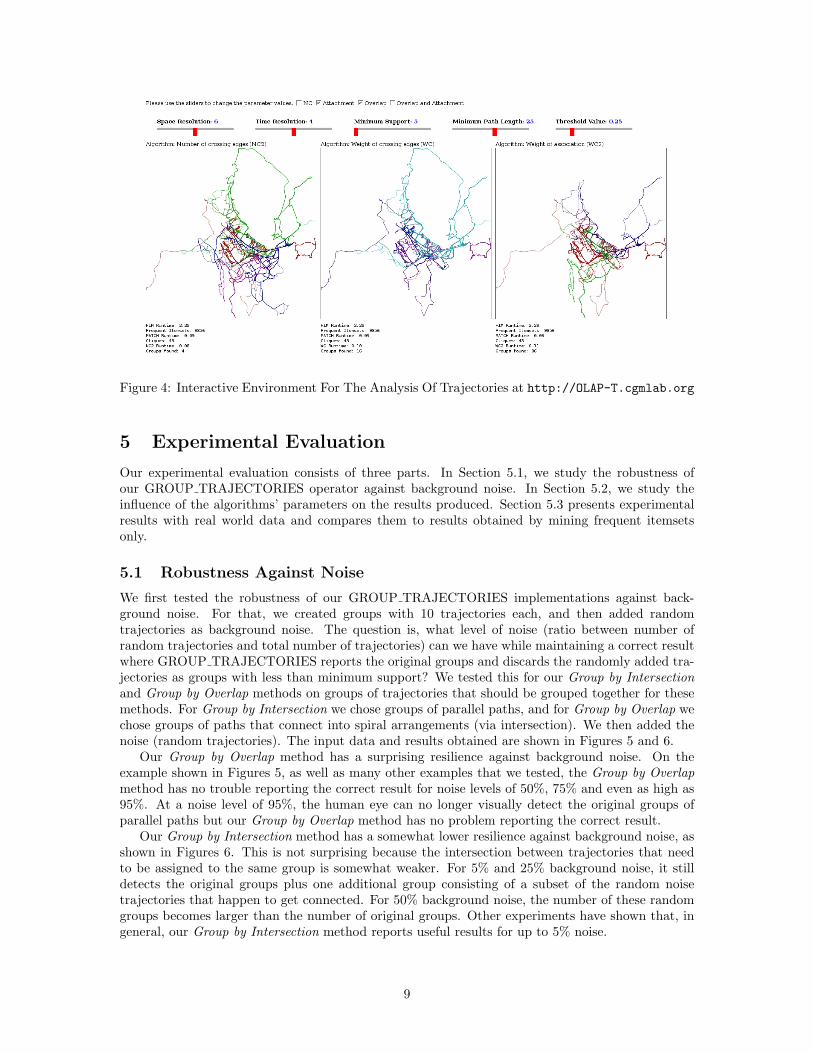
Figure 4: Interactive Environment For The Analysis Of Trajectories at http://OLAP-T.cgmlab.org
5 Experimental Evaluation
Our experimental evaluation consists of three parts. In Section 5.1, we study the robustness ofour GROUP TRAJECTORIES operator against background noise. In Section 5.2, we study theinfluence of the algorithms’ parameters on the results produced. Section 5.3 presents experimentalresults with real world data and compares them to results obtained by mining frequent itemsetsonly.
5.1 Robustness Against Noise
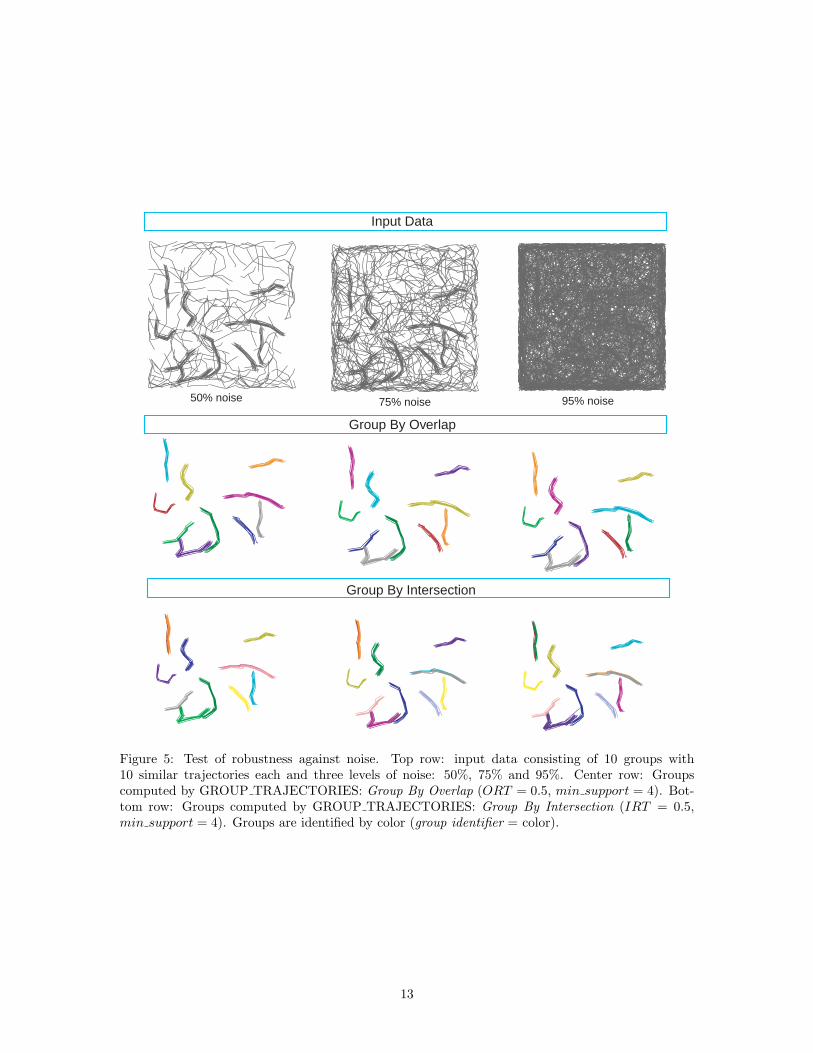
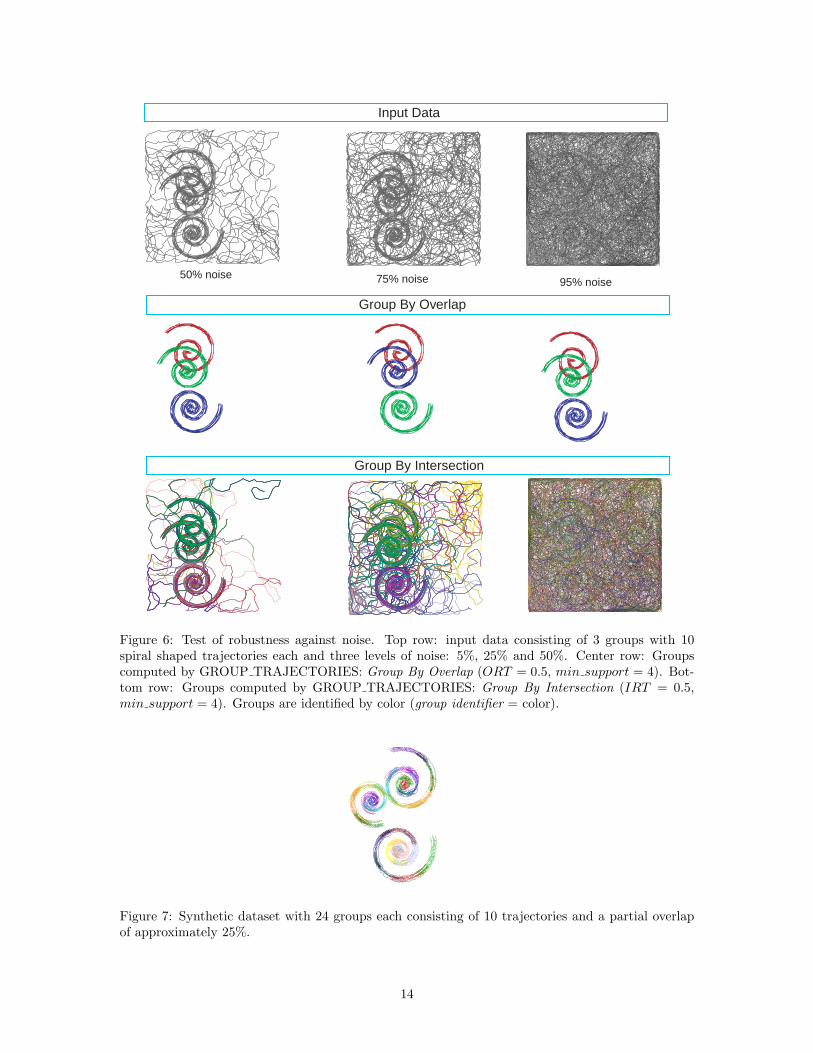
We first tested the robustness of our GROUP TRAJECTORIES implementations against back-ground noise. For that, we created groups with 10 trajectories each, and then added randomtrajectories as background noise. The question is, what level of noise (ratio between number ofrandom trajectories and total number of trajectories) can we have while maintaining a correct resultwhere GROUP TRAJECTORIES reports the original groups and discards the randomly added tra-jectories as groups with less than minimum support? We tested this for our Group by Intersectionand Group by Overlap methods on groups of trajectories that should be grouped together for thesemethods. For Group by Intersection we chose groups of parallel paths, and for Group by Overlap wechose groups of paths that connect into spiral arrangements (via intersection). We then added thenoise (random trajectories). The input data and results obtained are shown in Figures 5 and 6.
Our Group by Overlap method has a surprising resilience against background noise. On theexample shown in Figures 5, as well as many other examples that we tested, the Group by Overlapmethod has no trouble reporting the correct result for noise levels of 50%, 75% and even as high as95%. At a noise level of 95%, the human eye can no longer visually detect the original groups ofparallel paths but our Group by Overlap method has no problem reporting the correct result.
Our Group by Intersection method has a somewhat lower resilience against background noise, asshown in Figures 6. This is not surprising because the intersection between trajectories that needto be assigned to the same group is somewhat weaker. For 5% and 25% background noise, it stilldetects the original groups plus one additional group consisting of a subset of the random noisetrajectories that happen to get connected. For 50% background noise, the number of these randomgroups becomes larger than the number of original groups. Other experiments have shown that, ingeneral, our Group by Intersection method reports useful results for up to 5% noise.
9
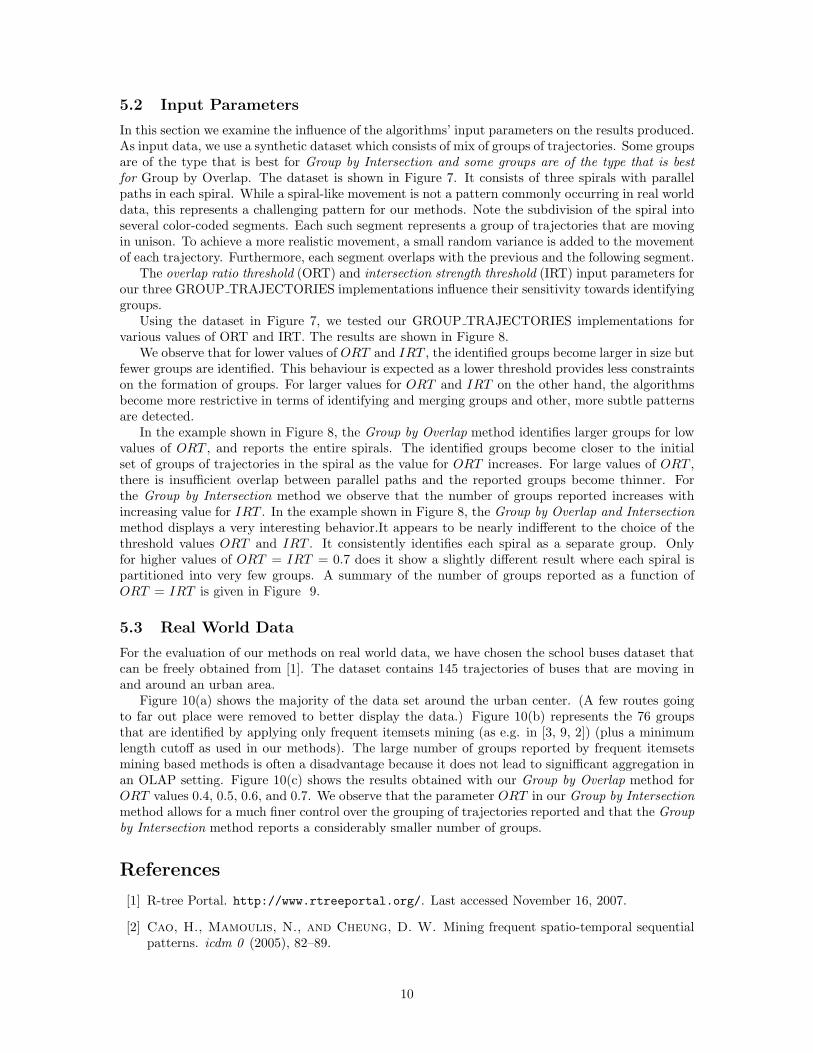
5.2 Input Parameters
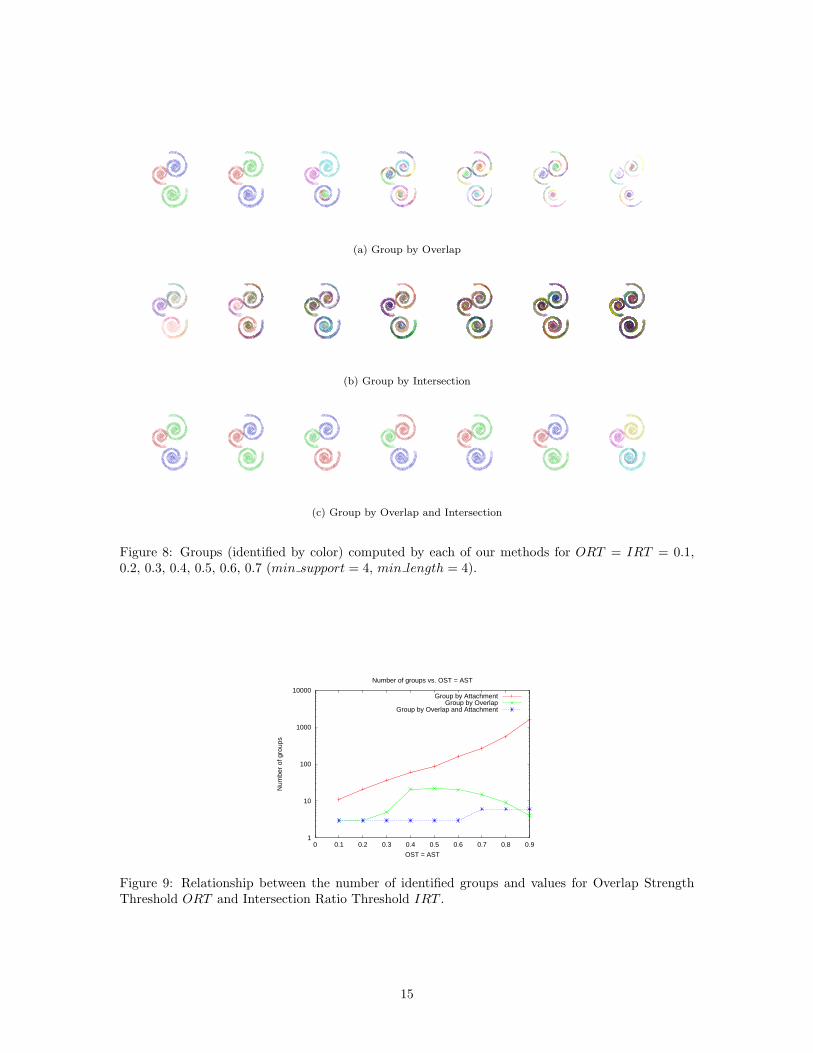
In this section we examine the influence of the algorithms’ input parameters on the results produced.As input data, we use a synthetic dataset which consists of mix of groups of trajectories. Some groupsare of the type that is best for Group by Intersection and some groups are of the type that is bestfor Group by Overlap. The dataset is shown in Figure 7. It consists of three spirals with parallelpaths in each spiral. While a spiral-like movement is not a pattern commonly occurring in real worlddata, this represents a challenging pattern for our methods. Note the subdivision of the spiral intoseveral color-coded segments. Each such segment represents a group of trajectories that are movingin unison. To achieve a more realistic movement, a small random variance is added to the movementof each trajectory. Furthermore, each segment overlaps with the previous and the following segment.
The overlap ratio threshold (ORT) and intersection strength threshold (IRT) input parameters forour three GROUP TRAJECTORIES implementations influence their sensitivity towards identifyinggroups.
Using the dataset in Figure 7, we tested our GROUP TRAJECTORIES implementations forvarious values of ORT and IRT. The results are shown in Figure 8.
We observe that for lower values of ORT and IRT , the identified groups become larger in size butfewer groups are identified. This behaviour is expected as a lower threshold provides less constraintson the formation of groups. For larger values for ORT and IRT on the other hand, the algorithmsbecome more restrictive in terms of identifying and merging groups and other, more subtle patternsare detected.
In the example shown in Figure 8, the Group by Overlap method identifies larger groups for lowvalues of ORT , and reports the entire spirals. The identified groups become closer to the initialset of groups of trajectories in the spiral as the value for ORT increases. For large values of ORT ,there is insufficient overlap between parallel paths and the reported groups become thinner. Forthe Group by Intersection method we observe that the number of groups reported increases withincreasing value for IRT . In the example shown in Figure 8, the Group by Overlap and Intersectionmethod displays a very interesting behavior.It appears to be nearly indifferent to the choice of thethreshold values ORT and IRT . It consistently identifies each spiral as a separate group. Onlyfor higher values of ORT = IRT = 0.7 does it show a slightly different result where each spiral ispartitioned into very few groups. A summary of the number of groups reported as a function ofORT = IRT is given in Figure 9.
5.3 Real World Data
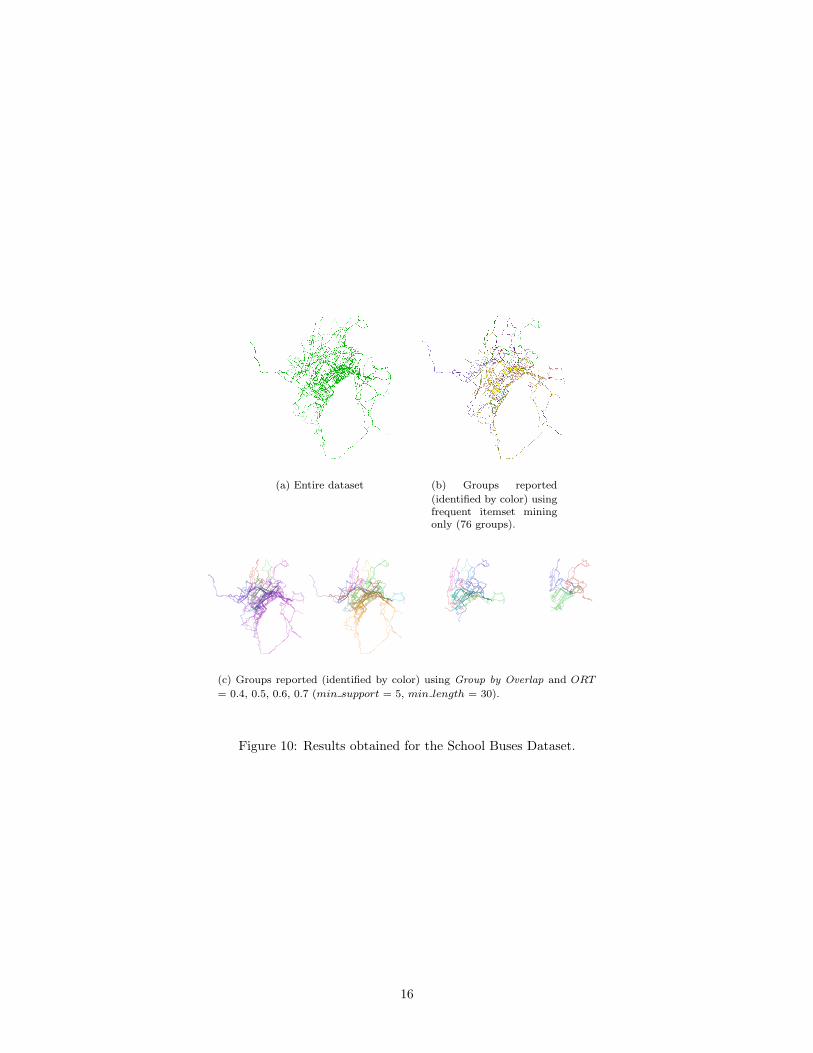
For the evaluation of our methods on real world data, we have chosen the school buses dataset thatcan be freely obtained from [1]. The dataset contains 145 trajectories of buses that are moving inand around an urban area.
Figure 10(a) shows the majority of the data set around the urban center. (A few routes goingto far out place were removed to better display the data.) Figure 10(b) represents the 76 groupsthat are identified by applying only frequent itemsets mining (as e.g. in [3, 9, 2]) (plus a minimumlength cutoff as used in our methods). The large number of groups reported by frequent itemsetsmining based methods is often a disadvantage because it does not lead to signifficant aggregation inan OLAP setting. Figure 10(c) shows the results obtained with our Group by Overlap method forORT values 0.4, 0.5, 0.6, and 0.7. We observe that the parameter ORT in our Group by Intersectionmethod allows for a much finer control over the grouping of trajectories reported and that the Groupby Intersection method reports a considerably smaller number of groups.
References
[1] R-tree Portal. http://www.rtreeportal.org/. Last accessed November 16, 2007.
[2] Cao, H., Mamoulis, N., and Cheung, D. W. Mining frequent spatio-temporal sequentialpatterns. icdm 0 (2005), 82–89.
10
[3] Gidofalvi, G., and Pedersen, T. B. Mining Long, Sharable Patterns in Trajectories ofMoving Objects. In STDBM ’06: Proceedings of the 3rd Workshop on Spatio-Temporal DatabaseManagement (2006).
[4] Hwang, S., Liu, Y., Chiu, J., and Lim, E. Mining mobile group patterns: A trajectory-based approach. Proceedings of PAKDD05 (2005), 713–718.
[5] Kim, D., Kang, H., Hong, D., Yun, J., and Han, K. STMPE: An Efficient MovementPattern Extraction Algorithm for Spatio-temporal Data Mining. LECTURE NOTES IN COM-PUTER SCIENCE 3981 (2006), 259.
[6] Laube, P., van Kreveld, M., and Imfeld, S. Finding REMO–detecting relative motionpatterns in geospatial lifelines. Developments in Spatial Data Handling: Proceedings of the 11thInternational Symposium on Spatial Data Handling (2004), 201–214.
[7] Li, Y., Han, J., and Yang, J. Clustering moving objects. In KDD ’04: Proceedings of thetenth ACM SIGKDD international conference on Knowledge discovery and data mining (NewYork, NY, USA, 2004), ACM, pp. 617–622.
[8] Lopez, I. F. V., Snodgrass, R. T., and Moon, B. Spatiotemporal Aggregate Computation:A Survey. IEEE Transactions on Knowledge and Data Engineering 17, 2 (2005), 271–286.
[9] Mamoulis, N., Cao, H., Kollios, G., Hadjieleftheriou, M., Tao, Y., and Cheung,D. Mining, indexing, and querying historical spatiotemporal data. Proceedings of the 2004 ACMSIGKDD international conference on Knowledge discovery and data mining (2004), 236–245.
[10] Marchand, P., Brisebois, A., Bedard, Y., and Edwards, G. Implementation andevaluation of a hypercube-based method for spatiotemporal exploration and analysis. ISPRSJournal of Photogrammetry and Remote Sensing 59, 1-2 (2004), 6–20.
[11] Nanni, M., and Pedreschi, D. Time-focused clustering of trajectories of moving objects. J.Intell. Inf. Syst. 27, 3 (2006), 267–289.
[12] Sclaroff, S., Kollios, G., and Betke, M. Motion mining: discovering spatio-temporalpatterns in databases of human motion. Proceedings of the ACM SIGMOD Workshop on Re-search Issues in Data Mining and Knowledge Discovery (2001).
[13] Shim, C., and Chang, J. A new similar trajectory retrieval scheme using k-warping distancealgorithm for moving objects. Proceedings of the 4th International Conference on Advances inWeb-Age Information Management,(WAIM 2003), 433–444.
[14] Sumpter, N., and Bulpitt, A. Learning spatio-temporal patterns for predicting objectbehaviour, 1998.
[15] Verhein, F., and Chawla, S. Mining spatio-temporal patterns in object mobility databases.Data Mining and Knowledge Discovery (2007).
[16] Vlachos, M., Kollios, G., and Gunopulos, D. Discovering similar multidimensionaltrajectories. Data Engineering, 2002. Proceedings. 18th International Conference on (2002),673–684.
[17] Wang, J., Hsu, W., and Lee, M. FlowMiner: finding flow patterns in spatio-temporaldatabases. Tools with Artificial Intelligence, 2004. ICTAI 2004. 16th IEEE International Con-ference on (2004), 14–21.
[18] Wang, Y., Lim, E.-P., and Hwang, S.-Y. On Mining Group Patterns of Mobile Users.In DEXA (2003), V. Marık, W. Retschitzegger, and O. Stepankova, Eds., vol. 2736 of LectureNotes in Computer Science, Springer, pp. 287–296.
11
[19] Zeinalipour-Yazti, D., Lin, S., and Gunopulos, D. Distributed spatio-temporal similaritysearch. In CIKM ’06: Proceedings of the 15th ACM international conference on Informationand knowledge management (New York, NY, USA, 2006), ACM, pp. 14–23.
12
50% noise 75% noise 95% noise
Group By Overlap
Group By Intersection
Input Data
Figure 5: Test of robustness against noise. Top row: input data consisting of 10 groups with10 similar trajectories each and three levels of noise: 50%, 75% and 95%. Center row: Groupscomputed by GROUP TRAJECTORIES: Group By Overlap (ORT = 0.5, min support = 4). Bot-tom row: Groups computed by GROUP TRAJECTORIES: Group By Intersection (IRT = 0.5,min support = 4). Groups are identified by color (group identifier = color).
13
50% noise 75% noise 95% noise
Group By Overlap
Group By Intersection
Input Data
Figure 6: Test of robustness against noise. Top row: input data consisting of 3 groups with 10spiral shaped trajectories each and three levels of noise: 5%, 25% and 50%. Center row: Groupscomputed by GROUP TRAJECTORIES: Group By Overlap (ORT = 0.5, min support = 4). Bot-tom row: Groups computed by GROUP TRAJECTORIES: Group By Intersection (IRT = 0.5,min support = 4). Groups are identified by color (group identifier = color).
Figure 7: Synthetic dataset with 24 groups each consisting of 10 trajectories and a partial overlapof approximately 25%.
14
(a) Group by Overlap
(b) Group by Intersection
(c) Group by Overlap and Intersection
Figure 8: Groups (identified by color) computed by each of our methods for ORT = IRT = 0.1,0.2, 0.3, 0.4, 0.5, 0.6, 0.7 (min support = 4, min length = 4).
1
10
100
1000
10000
0 0.1 0.2 0.3 0.4 0.5 0.6 0.7 0.8 0.9
Num
ber
of g
roup
s
OST = AST
Number of groups vs. OST = AST
Group by AttachmentGroup by Overlap
Group by Overlap and Attachment
Figure 9: Relationship between the number of identified groups and values for Overlap StrengthThreshold ORT and Intersection Ratio Threshold IRT .
15
(a) Entire dataset (b) Groups reported
(identified by color) usingfrequent itemset miningonly (76 groups).
(c) Groups reported (identified by color) using Group by Overlap and ORT
= 0.4, 0.5, 0.6, 0.7 (min support = 5, min length = 30).
Figure 10: Results obtained for the School Buses Dataset.
16
![Designing and Implementing OLAP Systems - IRITTournier-08] AOIS Design process.pdf · Designing and Implementing OLAP ... information for actual OLAP sys-tems. Moreover, the implementation](https://img.pdfslide.net/doc/110x75/5ac2b5567f8b9aae1b8b74ed/designing-and-implementing-olap-systems-irit-tournier-08-aois-design-and-implementing.jpg)


![Algebraic and graphic languages for OLAP manipulationsTournier-08] ijDWM OLAP model and algebra.pdf · Algebraic and graphic languages for OLAP manipulations ABSTRACT This paper deals](https://img.pdfslide.net/doc/110x75/5e3f2bb37a6df05ded393d38/algebraic-and-graphic-languages-for-olap-manipulations-tournier-08-ijdwm-olap-model.jpg)