Embed Size (px)
Citation preview

Olav Jones, Deputy Director General
Rome, 13 December 2014
2
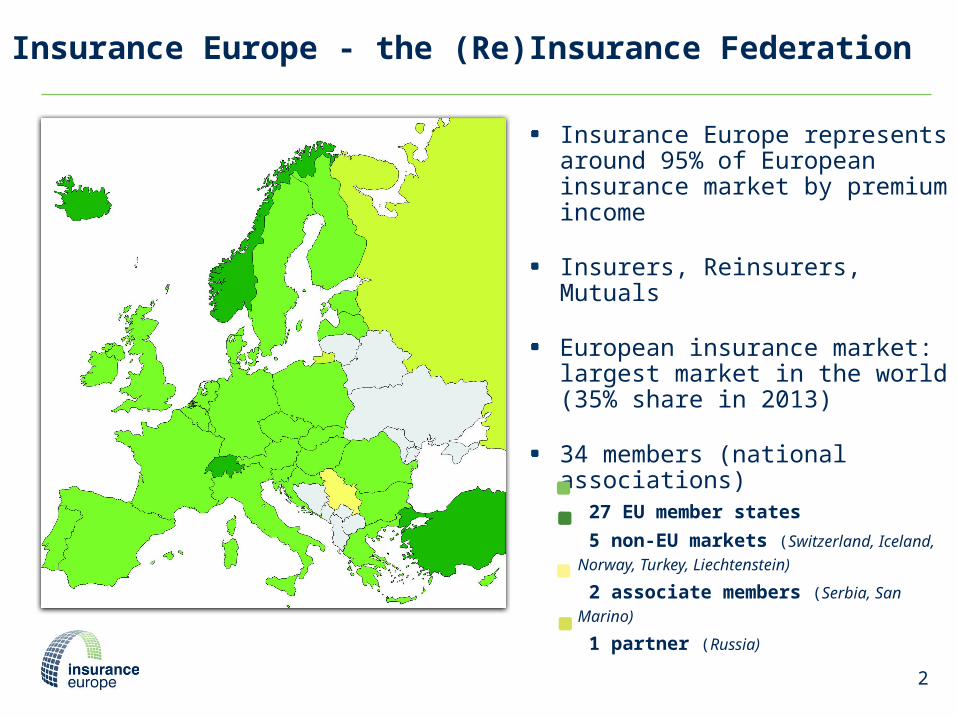
Insurance Europe - the (Re)Insurance Federation
Insurance Europe represents around 95% of European insurance market by premium income
Insurers, Reinsurers, Mutuals
European insurance market: largest market in the world (35% share in 2013)
34 members (national associations)
27 EU member states
5 non-EU markets (Switzerland,
Iceland, Norway, Turkey, Liechtenstein)
2 associate members (Serbia, San
Marino)
1 partner (Russia)
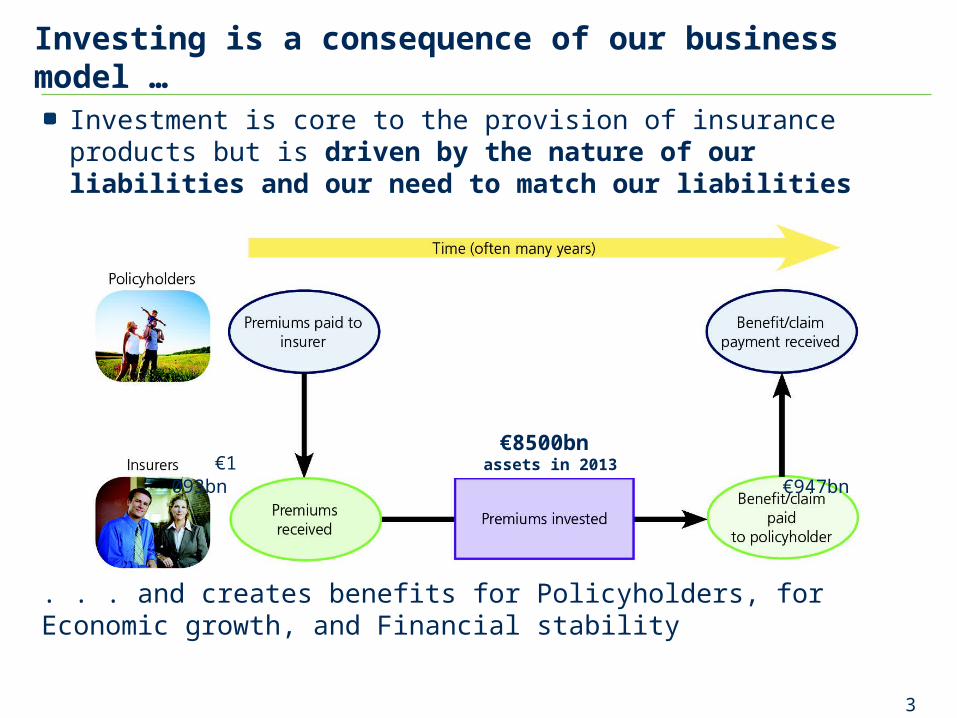
Investing is a consequence of our business model …
Investment is core to the provision of insurance products but is driven by the nature of our liabilities and our need to match our liabilities
. . . and creates benefits for Policyholders, for Economic growth, and Financial stability
3
€1 093bn €947bn€8500bn
assets in 2013
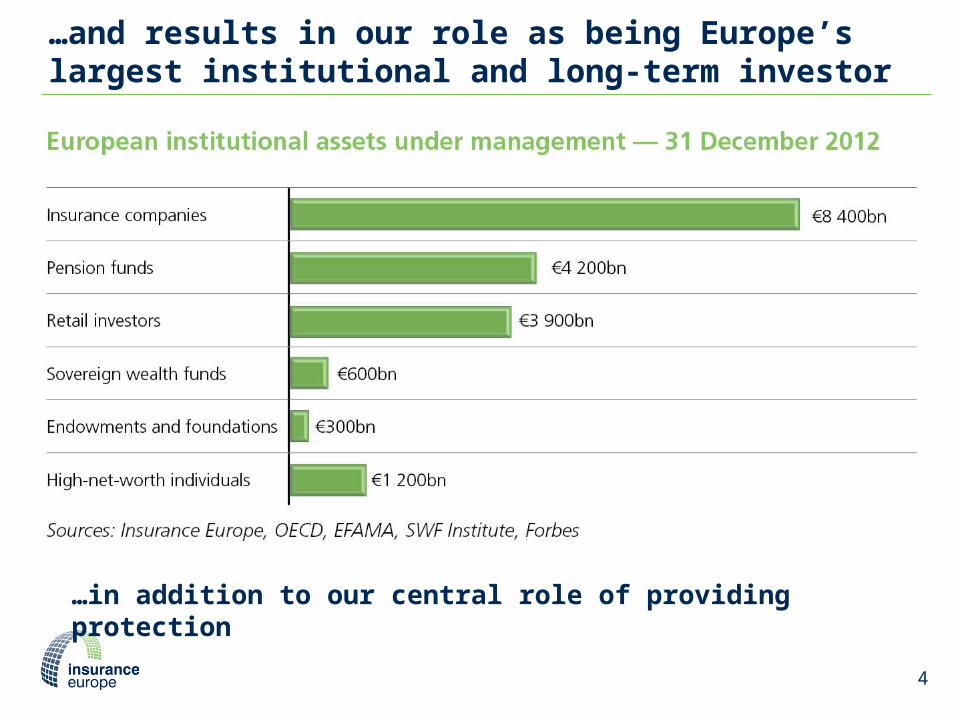
…and results in our role as being Europe’s largest institutional and long-term investor
4
…in addition to our central role of providing protection
. . . and creates benefits for Policyholders, for Economic growth, Financial stability
5
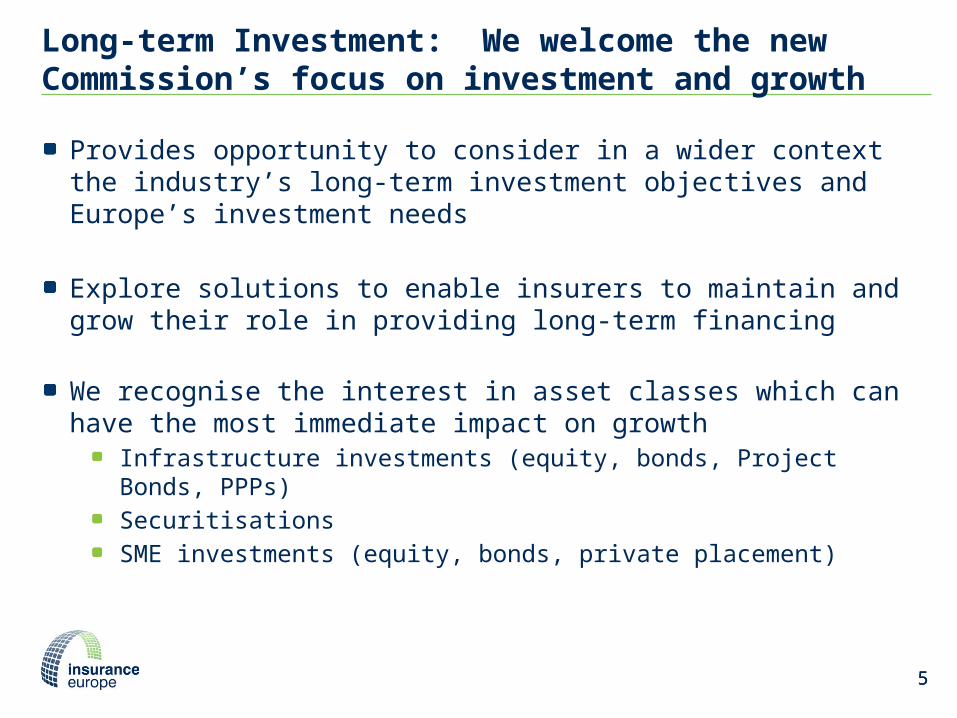
Long-term Investment: We welcome the new Commission’s focus on investment and growth
5
Provides opportunity to consider in a wider context the industry’s long-term investment objectives and Europe’s investment needs
Explore solutions to enable insurers to maintain and grow their role in providing long-term financing
We recognise the interest in asset classes which can have the most immediate impact on growth
Infrastructure investments (equity, bonds, Project Bonds, PPPs)SecuritisationsSME investments (equity, bonds, private placement)
6
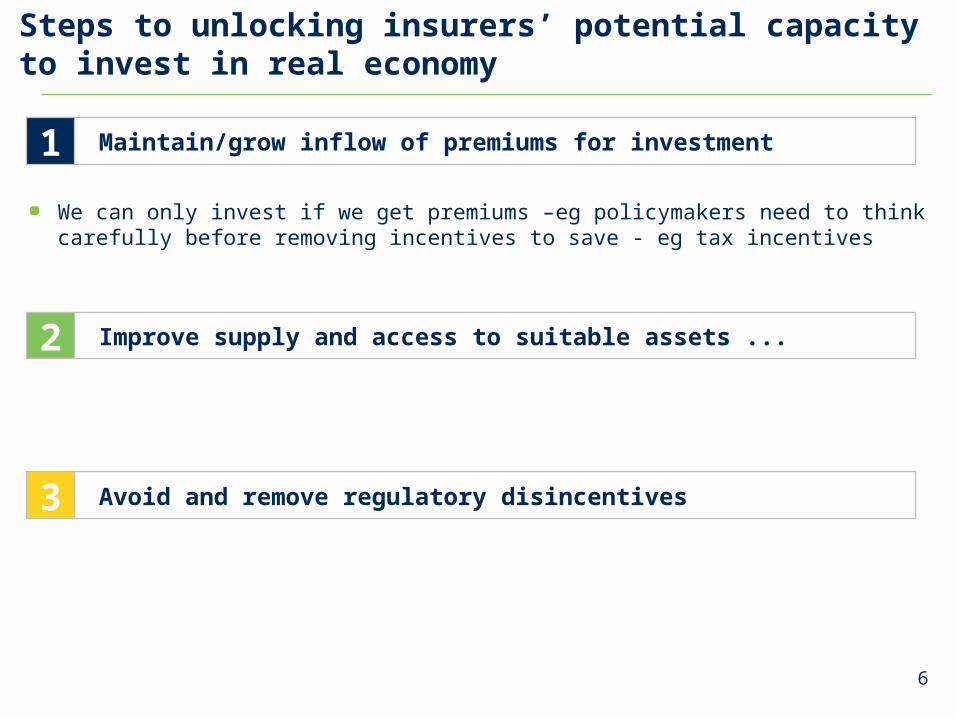
We can only invest if we get premiums –eg policymakers need to think carefully before removing incentives to save - eg tax incentives
Steps to unlocking insurers’ potential capacity to invest in real economy
Maintain/grow inflow of premiums for investment1
Improve supply and access to suitable assets ...2
Avoid and remove regulatory disincentives3
7
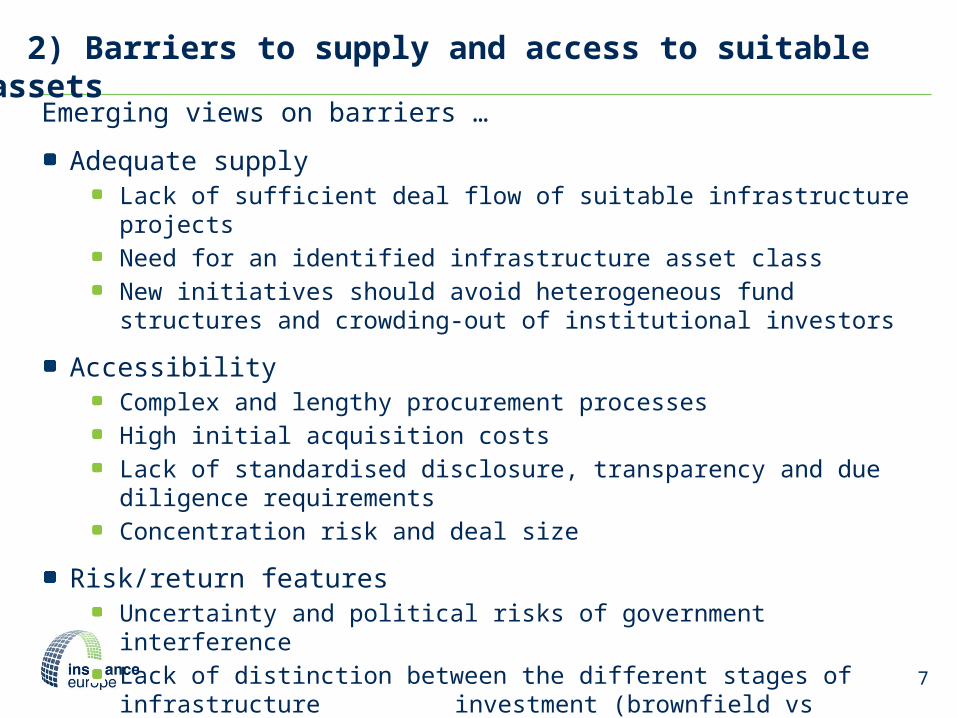
2) Barriers to supply and access to suitable assets
Emerging views on barriers …
Adequate supplyLack of sufficient deal flow of suitable infrastructure projectsNeed for an identified infrastructure asset classNew initiatives should avoid heterogeneous fund structures and crowding-out of institutional investors
AccessibilityComplex and lengthy procurement processesHigh initial acquisition costsLack of standardised disclosure, transparency and due diligence requirementsConcentration risk and deal size
Risk/return featuresUncertainty and political risks of government interferenceLack of distinction between the different stages of infrastructure
investment (brownfield vs greenfield)
8
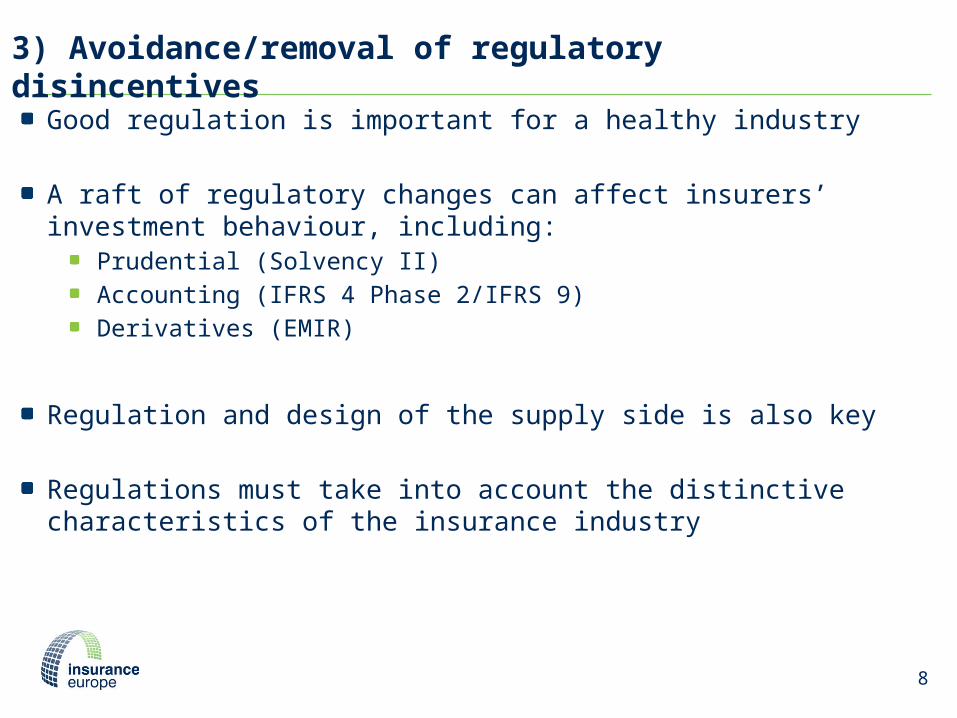
3) Avoidance/removal of regulatory disincentives
Good regulation is important for a healthy industry
A raft of regulatory changes can affect insurers’ investment behaviour, including:
Prudential (Solvency II)Accounting (IFRS 4 Phase 2/IFRS 9)Derivatives (EMIR)
Regulation and design of the supply side is also key
Regulations must take into account the distinctive characteristics of the insurance industry
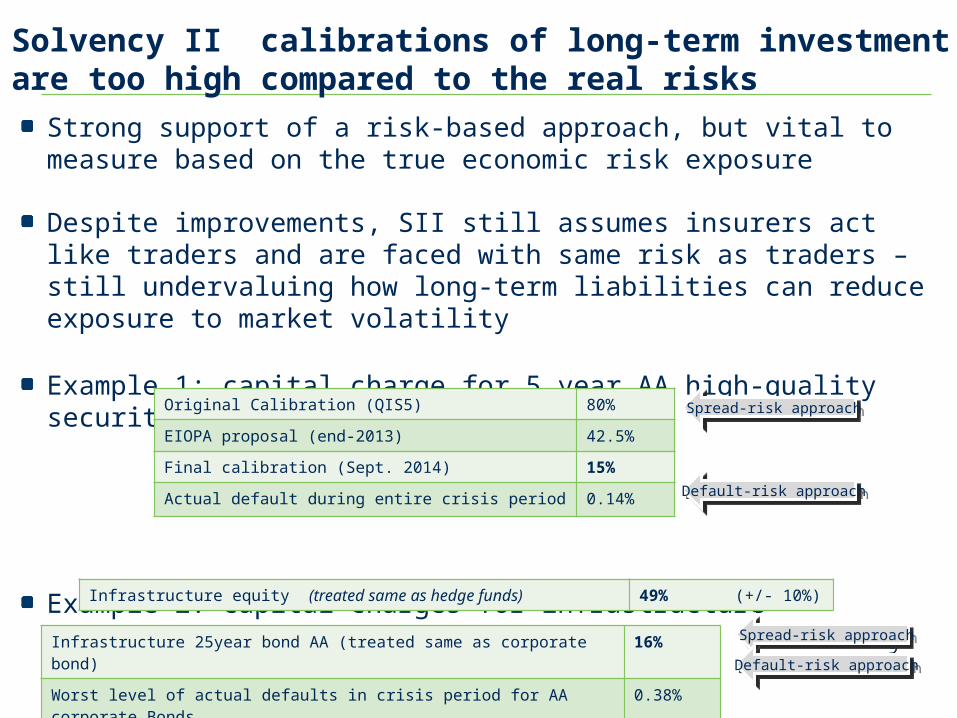
Solvency II calibrations of long-term investment are too high compared to the real risks
Strong support of a risk-based approach, but vital to measure based on the true economic risk exposure
Despite improvements, SII still assumes insurers act like traders and are faced with same risk as traders – still undervaluing how long-term liabilities can reduce exposure to market volatility
Example 1: capital charge for 5 year AA high-quality securitisation
Example 2: capital charges for infrastructure
9
Original Calibration (QIS5) 80%
EIOPA proposal (end-2013) 42.5%
Final calibration (Sept. 2014) 15%
Actual default during entire crisis period 0.14%
Spread-risk approachSpread-risk approach
Default-risk approachDefault-risk approach
Infrastructure equity (treated same as hedge funds) 49% (+/- 10%)
Infrastructure 25year bond AA (treated same as corporate bond) 16%
Worst level of actual defaults in crisis period for AA corporate Bonds 0.38%
Spread-risk approachSpread-risk approach
Default-risk approachDefault-risk approach