Embed Size (px)
Citation preview

Advanced stand age
Diversity of tree sizes from sapling to large sawtimber
Presence of very old and large trees
Presence of large standing dead trees
Increased amounts of dead stumps and coarse woody debris
An estimation of “old growth” acres in Wisconsin
“Old growth” compared to “old stands”
Old growth forests are natural stands that have developed over a period of time, generally at
least 120 years, without experiencing a stand-replacing disturbance. Typical traits of old
growth in Wisconsin include:
Advanced stand age
Diversity of tree sizes from saplings to large sawtimber
Presence of very old and large trees
Presence of large, standing dead trees
Increased amounts of dead stumps and coarse woody debris
Pit and mound topography and presence of canopy gaps
Several of these characteristics are measured in the Forest Inventory and Analysis database
and can be used to identify forests with old growth characteristics. In this report, we present
one methodology for estimating old growth acreage across several inventories.
Division of Forestry WI Dept of Natural Resources 8/2014

Advanced Stand Age
Wisconsin’s forests are aging as almost half of all
timberland is over 60 years of age (Figure 1). The
amount of very old forest (over 120 years) is far less than
what it was in 1983, but has increased 60% in the last
decade.
In 1983, over 4% of timberland was at least 120 years of
age, and 80% of this was in the oak / hickory or maple /
beech / birch forest types (Figure 2). Thirty years later, in
2013, only 1.2% of timberland is this old and less than
50% is in either oak / hickory or maple / beech / birch
type.
Forest Inventory and Analysis (FIA) approximates stand
age by weighting the cored age of several canopy trees of
differing sizes by the proportion of that size class in the
canopy. This procedure may underestimate the age of
very old stands that have trees in many size classes.
In this analysis, we will see that many stands with old
growth characteristics do not have an advanced stand
age in the FIA inventory and many stands with advanced
ages do not have typical features of old growth.
Figure 1. Area of timberland by stand age class (Forest Inventory and Analysis).
Figure 2. Acreage of timberland over 120 years old by forest type group (forest Inventory and Analysis).
-
1
2
3
4
5
0-20 21-40 41-60 61-80 81-100 101-120 121+
Mill
ion
acr
es
Stand age class (yrs)
Area of timberland by stand age class 1983 1996 2004 2013
0
50
100
150
200
250
300
350
Oak / hickory White / red /jack pine
Maple / beech /birch
Spruce / fir Elm / ash /cottonwood
Tho
usa
nd
acr
es
Area in timberland over 120 yrs of age 1983 1996 2004 2013

As a forest ages, large trees die and fall over. They
open canopy gaps for saplings and poles to fill in and
the stand becomes a mix of trees of various sizes and
ages creating a layered canopy.
In the FIA database, tree ages are not measured but
tree diameters are and in general correlate well with
tree age. One measure of the evenness of distribution
of tree diameters is the Shannon’s index of diversity*.
The index increases when the number of trees in each
diameter class up to 21+ inches is more evenly
distributed. As stands age, the distribution becomes
flatter and the value of the diversity index increases
(Figure 3).
As mentioned, the diversity index increases with age
(Figure 4). Between 1996 and 2013, however, the
average value of the index decreased in all age classes.
The forest types with the highest average diversity
index are maple/beech/birch, oak/hickory and white
/red/jack pine. These types have higher numbers of
large diameter trees in old stands.
*For an explanation see: http://en.wikipedia.org/wiki/Diversity_index
0
50
100
150
200
5-6.9 7-8.9 9-10.9 11-12.9 13-14.9 15-16.9 17-18.9 19-20.9 21.0+
tre
es
pe
r a
cre
Daimeter class (in)
Diameter distribution and diversity index: pine forest type
0-40 yrs (Index: 1.23)
41-80 yrs (Index: 1.85)
81-120 yrs (Index: 2.05)
>120 yr (Index: 2.11)
Figure 3. The relationship between diameter distribution and diversity index (Forest Inventory and Analysis, 2013).
Figure 4. Average value of Shannon’s index of diversity by stand age, 1996 and 2013 (Forest Inventory and Analysis).
-
0.3
0.5
0.8
1.0
1.3
1.5
0-20 yrs 21-40 yrs 41-60 yrs 61-80 yrs 81-100 yrs >100 yrs
Average diversity of canopy
1996
2013
Diversity of tree sizes from sapling to large sawtimber
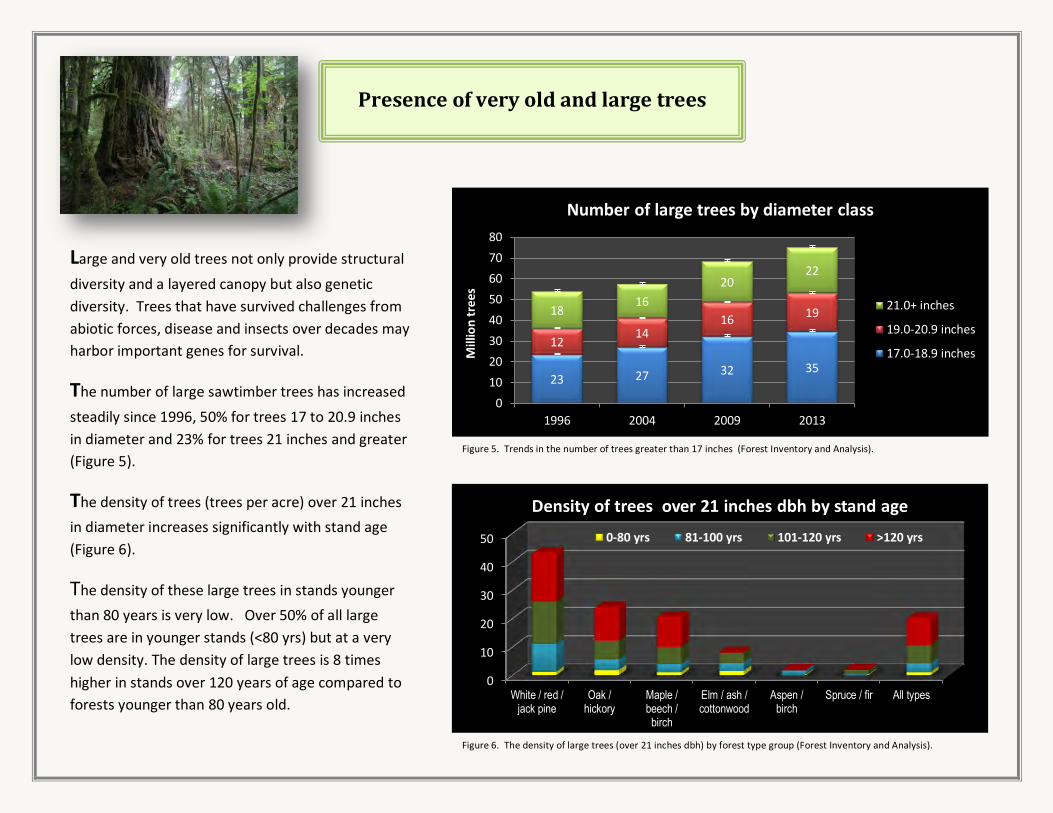
Large and very old trees not only provide structural
diversity and a layered canopy but also genetic
diversity. Trees that have survived challenges from
abiotic forces, disease and insects over decades may
harbor important genes for survival.
The number of large sawtimber trees has increased
steadily since 1996, 50% for trees 17 to 20.9 inches
in diameter and 23% for trees 21 inches and greater
(Figure 5).
The density of trees (trees per acre) over 21 inches
in diameter increases significantly with stand age
(Figure 6).
The density of these large trees in stands younger
than 80 years is very low. Over 50% of all large
trees are in younger stands (<80 yrs) but at a very
low density. The density of large trees is 8 times
higher in stands over 120 years of age compared to
forests younger than 80 years old.
Presence of very old and large trees
sawtimber
0
10
20
30
40
50
White / red /jack pine
Oak /hickory
Maple /beech /birch
Elm / ash /cottonwood
Aspen /birch
Spruce / fir All types
Density of trees over 21 inches dbh by stand age
0-80 yrs 81-100 yrs 101-120 yrs >120 yrs
23 27 32 35
12 14
16 19 18
16
20 22
0
10
20
30
40
50
60
70
80
1996 2004 2009 2013
Mill
ion
tre
es
Number of large trees by diameter class
21.0+ inches
19.0-20.9 inches
17.0-18.9 inches
Figure 5. Trends in the number of trees greater than 17 inches (Forest Inventory and Analysis).
Figure 6. The density of large trees (over 21 inches dbh) by forest type group (Forest Inventory and Analysis).

Presence of large standing dead trees
Large standing dead trees or snags provide
vital nesting, foraging and denning sites for
many species of forest birds and mammals.
The density of large standing dead trees (over
17 inches dbh) increases dramatically after a
stand age of 100 years (Figure 7). Snag
density decreased between 1996 and 2013 for
stands less than 120 years of age.
The highest density of large standing dead
trees occurs on the white / red / jack pine
types which also has the highest density of
large living trees.
The major species of large snags in the
database were red oaks and eastern white
pine.
0.0
1.0
2.0
3.0
4.0
Maple / beech /birch group
Oak / hickorygroup
White / red /jack pine group
All types
0.4
1.7 2.7
1.6 0.4
0.7
0.7
0.6
Tre
es p
er a
cre
Density of standing dead trees in stands over 120 yrs old
21+ inches
17-21 inches
Figure 7. The density of large standing dead trees (Forest Inventory and Analysis, 2013).
Figure 8. The density of large standing dead trees in stands over 120 yrs old by forest type group (Forest Inventory and
Analysis, 2013).
0.7
1.0
1.7 1.9
0.5 0.8
1.0
2.0
0.00
0.50
1.00
1.50
2.00
2.50
0-20 21-40 41-60 61-80 81-100 101-120 >120
Tre
es p
er a
cre
Stand age (yrs)
Density of standing dead trees over 17 inches
1996
2013

.
Without intervention as stands become older they
accumulate greater amounts of carbon in non-living
material such as coarse woody debris (CWD),
standing dead trees, stumps and litter. These
components are a major contributor to old growth
ecosystems not only serving as a reservoir of stored
carbon but also supporting a diversity of species.
Carbon in dead material accumulates steadily with
age and then levels off after about stand age 140
due to a decrease in litter density in older stands
(Figure 9). Carbon, however, continues to
accumulate in stumps, coarse woody debris and
standing dead trees past 180 years (sampling error
is extremely high as there are only five stands in the
database older than 180 years).
The forest type group which has the greatest
density of carbon is spruce / fir due to the large
amount of litter (Figure 10). The white / red / jack
pine type has the highest density of carbon in
coarse woody debris and stumps.
Increased amounts of dead stumps and coarse woody debris
0
5
10
15
20
25
30
Spruce / fir Maple /beech /birch
White / red /jack pine
Oak /hickory
Elm / ash /cottonwood
All foresttypes
Sho
rt t
on
s p
er a
cre
Carbon by component in stands over 120 yrs
Litter
Standing dead
CWD
0
5
10
15
20
0 - 20 21 -40
41 -60
61 -80
81 -100
101 -120
121 -140
141 -160
161 -180
181+
sho
rt t
on
s p
er
acre
Stand age class (yrs)
Carbon density in dead wood and litter
Litter
Standing dead trees
Stumps & CWD
Figure 10. The density of carbon by forest type in stands over 120 years of age (Forest Inventory and Analysis, 2013).
Figure 9. The density of carbon in coarse woody debris, stumps and litter (Forest Inventory and Analysis, 2013).

An estimation of “old growth” acres in Wisconsin
-
10
20
30
40
50
60
70
80
90
1996 2004 2013
Tho
usa
nd
acr
es
Forested acres meeting old growth criteria
White / red / jack pine
Oak / hickory
Maple / beech / birch
Elm / ash / cottonwood
* Frelich, Lee and Reich, Peter. 1996. Eastern Old Growth Forests: Prospects for Rediscovery and Recovery. Island Press. Chapter 11 pg 24.
Figure 11. An estimation of forested acreage meeting old growth criteria.
is not solely a function of stand age. A given stand must meet several criteria such as the presence of many large trees (at least 21 inches
dbh) plus a few very large trees (at least 30 inches dbh), the presence of large standing dead trees (at least 17 inches dbh), a diversity of
canopy tree sizes ranging from sapling to large sawtimber (high diversity index) and a large amount of coarse woody debris.
In order to approximate the acreage of forest having these old growth characteristics, in this analysis we used the average value from the FIA
database for all stands over 120 years of age as a
minimum criterion for these five features. By summing
the acreage of stands which met four of the five
criteria, we were able to estimate the acreage in old
growth as follows: 60,330 acres in 1996, 60,811 in 2004
and 77,205 acres in 2013 (Figure 11). Interestingly, 40%
of old growth acreage is located in southern Wisconsin.
Whereas only 2% of all forest in the state is on Native
American land, 15% of old growth acreage is in
Menominee County, presumably on reservation land.
This is only an estimate based on undocumented
criteria but the estimate for 1996, 60,330 acres, is very
close to the approximation of 57,000 acres by Frelich
and Reich (1996*). Based on this analysis, old growth
forests, as opposed to old forests may actually have
increased since 1996. One of the reasons is the large
increase in trees over 17 inches (Figure 5).
In order to define old growth forests, stand age alone is not very helpful since many very old
stands have been harvested or disturbed multiple times. For this reason “old growth” status

6.6
4.4
0
3
6
9
Maple / beech / birch Oak / hickory White / red / jackpine
All types
Sho
rt t
on
s p
er a
cre
Carbon in stumps and coarse woody debris Old Growth Stands >120 yrs
5.5
1.9
0.0
2.0
4.0
6.0
8.0
Maple / beech / birch Oak / hickory White / red / jackpine
All types
Snag
s p
er a
cre
Dead standing trees over 17 inches Old Growth Stands >120 yrs
The charts on this page (Figure 12) show the difference between old stands (at least 120 years old in the FIA inventory) and “old growth”
as estimated in this analysis. The number of large trees is 2 ½ times higher on old growth. The number of very large trees is over five
times higher and the number of large snags is almost three times higher on old growth stands compared to stands which are over 120
years old. Many of these old growth stands are not listed as having an advanced stand age in the FIA inventory: almost 50% of “old
growth” stands have a designated stand age of less than 100 years.
1.5
1.2
0.0
0.3
0.6
0.9
1.2
1.5
1.8
Maple / beech /birch
Oak / hickory White / red / jackpine
All types
Canopy diversity
Old Growth Stands >120 yrs
-
10
20
30
40
50
9-12.9 13-16.9 17-20.9 21-24.9 25-29.9 >30 in
Tree
s p
er a
cre
Diameter class (in)
Number of trees per acre by diameter class Old Growth Stands >120 yrs
Old growth compared to old stands
Figure 12. Diameter distribution (top left), canopy diversity (top right), density of standing dead trees (bottom left) and carbon density in CWD (bottom right) on estimated old growth vs. stands which
are over 120 years of age in the FIA database.