Embed Size (px)
Citation preview

GROWINGASSETSAnnual Report and Accounts 2007

Front coverJohannesburg, South AfricaThandi (aged 9)Thandi would like to have a job looking after animals – but whatever her dream, it will be easier to realise with the education policy her parents have taken out for her with Old Mutual.
Highlights of the year
> Excellent investment performance across the Group
> Total funds under managementincreased 18% to £279 billion
> Strong net client cash flows of £23.4 billion, 10% of opening funds under management
> Group established solid foundations for the future– Nedbank recovery targets met– US Life returned cash to Group– Synergies at Skandia well on track
> Adjusted operating earnings per share up 12% to 16.9p on an IFRS basis
Old Mutual is an international savings and wealth managementgroup focusing on asset gathering and asset management. We arethe largest and one of the most trusted financial services brands in South Africa, and operate life and asset management businessesin the USA, Latin America, the UK, Europe, India, China and Australia.
Cover shows total funds under management for the relevant years ended 31 December. The Skandia figure for 2006 has been restated to exclude the Spanish Vida business sold in 2007.
26'19" S 28'03" E
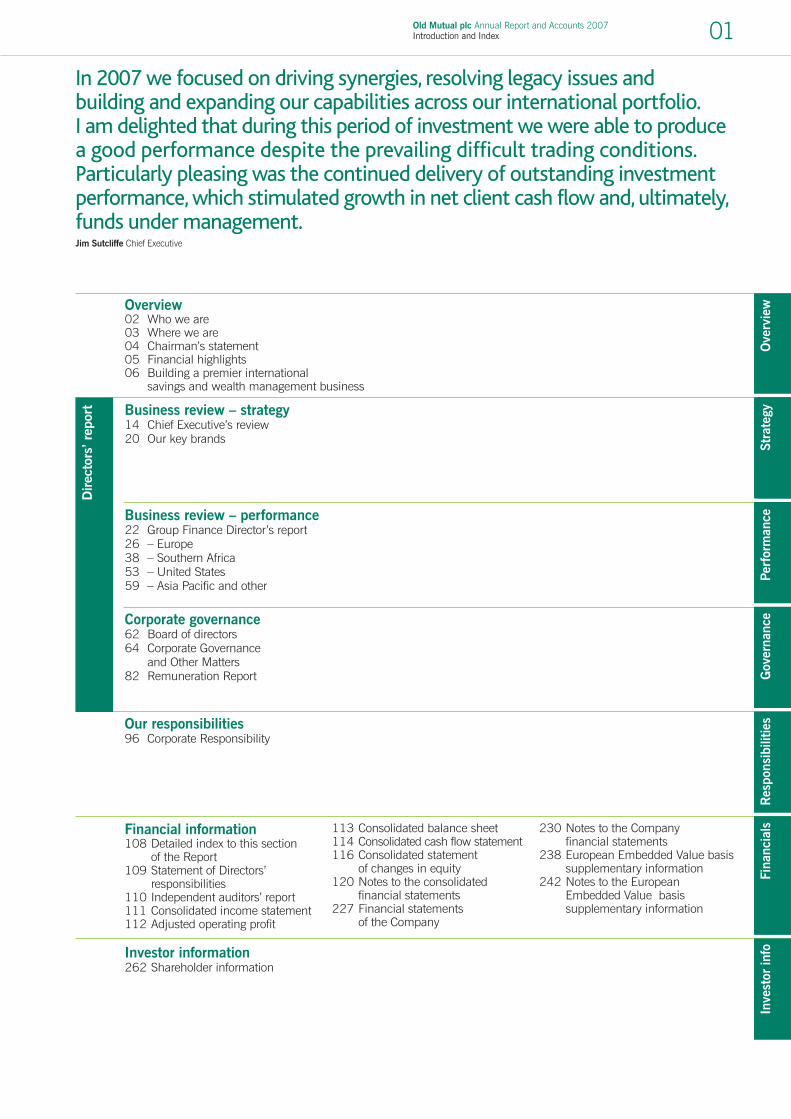
Old Mutual plc Annual Report and Accounts 2007Introduction and Index 01
Business review – performance 22 Group Finance Director’s report26 – Europe38 – Southern Africa53 – United States59 – Asia Pacific and other
Corporate governance62 Board of directors64 Corporate Governance
and Other Matters82 Remuneration Report
Overview02 Who we are03 Where we are04 Chairman’s statement05 Financial highlights 06 Building a premier international
savings and wealth management business
Our responsibilities96 Corporate Responsibility
Financial information108 Detailed index to this section
of the Report109 Statement of Directors’
responsibilities110 Independent auditors’ report111 Consolidated income statement112 Adjusted operating profit
113 Consolidated balance sheet114 Consolidated cash flow statement116 Consolidated statement
of changes in equity120 Notes to the consolidated
financial statements227 Financial statements
of the Company
230 Notes to the Company financial statements
238 European Embedded Value basissupplementary information
242 Notes to the European Embedded Value basissupplementary information
Investor information262 Shareholder information
Direc
tors
’ rep
ort
Ove
rvie
wSt
rate
gyPe
rfor
man
ceG
over
nanc
eR
espo
nsib
ilitie
sFi
nanc
ials
Inve
stor
info
Stra
tegyBusiness review – strategy
14 Chief Executive’s review20 Our key brands
In 2007 we focused on driving synergies, resolving legacy issues and building and expanding our capabilities across our international portfolio.I am delighted that during this period of investment we were able to producea good performance despite the prevailing difficult trading conditions.Particularly pleasing was the continued delivery of outstanding investmentperformance, which stimulated growth in net client cash flow and, ultimately,funds under management.Jim Sutcliffe Chief Executive

Old Mutual plc Annual Report and Accounts 2007Overview02
Our vision is to be a premier international savings and wealth management business
Who we are
Well positioned for growth
High-share marketsSouthern Africa and NordicOur operations in these markets are characterised by strong brands and market shares, and continue to deliver a highcontribution to returns. Our focus here is to consolidate our market share by enhancing our product range and increasing customer satisfaction and loyalty.
High-growth marketsUSA, UK and EuropeWe have a strong position in these markets and their contributionto the business is growing rapidly. Our aim is to increase ourmarket share by the development of innovative products andservices and by strong brand differentiation.
High-potential marketsAsia Pacific and Latin AmericaThese are rapidly growing markets where we are sowing the seeds for future returns.They are typically underserved, and we are increasing our footprint by introducing world-class products and building brand awareness.
What we do
Asset managementThe heart of our business is growing our clients’ savings andwealth, whether through active and direct asset management, or the selection of funds and managers for our clients to invest in. Our South African and US asset management business model,together with our market-leading Skandia open-architecture model, position us to respond to the growing demand for choice,transparency and flexibility.
Life assuranceOur innovative life assurance product solutions, addressing bothprotection and retirement savings needs, are developed in ourSouth African business, as well as in our US Life operations.
BankingNedbank is one of South Africa’s leading bank franchises and serves all levels of the local market. The Group also has bankingoperations in other countries in Southern Africa and in Sweden.Bancassurance is a key part of our asset gathering strategy.
General insuranceOld Mutual’s interest in the general insurance sector is through its majority shareholding in Mutual & Federal, which providesgeneral insurance services to the personal and corporate markets in South Africa, Namibia, Botswana and Zimbabwe.
Group valuesDespite our geographic and cultural diversity, we are bound together by our Group values:
IntegrityAct honestly and openly and be trustworthy and consistent in all that we do. Act inaccordance with the highestethical standards.
RespectTreat others as we would like to be treated – value and learnfrom the strength of our diversity.Actively listen to others andrecognise that everyone has a contribution to make.
AccountabilityTake responsibility for thecommitment that we make,actions we perform andproblems that occur. Accept thatwe will be judged on these.
Pushing BeyondBoundariesStrive as individuals, as a teamand as an organisation to breaknew ground and achieve higherlevels of performance, reachingto the depth of our abilities.

Old Mutual plc Annual Report and Accounts 2007Overview 03
Where we are
Main areas of operation
Southern Africa
£41.7bn*
Asia Pacific
£6.5bn*
*Funds under management
Europe and Latin America
£60.6bn*
North America
£170.1bn*
Ove
rvie
w
AfricaKenyaMalawiNamibiaSouth AfricaZimbabwe
North AmericaBermudaCanadaUSA
AustriaChileColombiaCzech RepublicDenmarkFinlandFranceGermanyHungaryItaly
MexicoNetherlandsNorwayPolandPortugalSpainSwedenSwitzerlandUnited Kingdom
Asia PacificAustraliaChinaHong KongIndia
Europe and Latin America

Old Mutual plc Annual Report and Accounts 2007Overview04
Overview of 2007Old Mutual made good progress during 2007, boosting fundsunder management significantly and integrating the Skandiaoperations acquired during 2006.
Our adjusted operating earnings per share on an IFRS basis were16.9p, an increase of 12% over 2006. On behalf of shareholders, I would like to thank everyone around the Group for their hardwork in achieving this result.
DividendWe are recommending a final dividend of 4.55p per share, an increase of 10% over 2006, making a total dividend for theyear of 6.85p per share.
BoardNorman Broadhurst is retiring at the Annual General Meeting inMay. We are extremely grateful to him for his immense contribution,both as Chairman of the Group Audit and Risk Committee sincedemutualisation in 1999 and as Senior Independent Director. He will be succeeded as Chairman of the Group Audit and Risk Committee by Richard Pym, who joined the Board as a non-executive director in September 2007, and as SeniorIndependent Director by Rudi Bogni.
We were also pleased to welcome to the Board during the year Bongani Nqwababa, who is Finance Director of the South African electricity group, Eskom.
Annual General Meeting 2008Our Annual General Meeting will be held at our offices in Londonon 8 May 2008. We have a longer agenda this year. It includesproposals for changes to our Articles of Association as a result ofthe UK Companies Act 2006 and for new employee share schemesto replace those adopted in 1999. I have therefore written toshareholders about the business of the Meeting in the enclosedseparate document. This contains the Notice of AGM andexplanatory notes.
FutureThe relatively benign economic conditions of the past few yearshave now been replaced by a period of uncertainty. However, withits geographical diversity and strong market positions, Old Mutualis well placed to weather any storms that may lie ahead.
Christopher CollinsChairman27 February 2008
Chairman’s statement
Overview
Christopher CollinsChairman

Old Mutual plc Annual Report and Accounts 2007Overview 05
Financial highlights
Net client cash flows were strong and, coupled with superior investmentperformance, resulted in growth in funds under management of 18%.
Wherever the items asterisked in the highlights are used, whether in the Chief Executive’s review or the Group Finance Director’s report, the followingdefinitions apply:
*For long-term and general insurance business, adjusted operating profit is basedon a long-term investment return, includes investment returns on life funds’investments in Group equity and debt instruments and is stated net of income tax attributable to policyholder returns. For the US Asset Management business it includes compensation costs in respect of certain long-term incentive schemesdefined as minority interests in accordance with IFRS. For all businesses, adjustedoperating profit excludes goodwill impairment, the impact of acquisition accounting,revaluations of put options related to long-term incentive schemes, the impact ofclosure of unclaimed shares trusts, profit/(loss) on disposal of subsidiaries,associated undertakings and strategic investments, dividends declared to holdersof perpetual preferred callable securities and fair value (profits)/losses on certainGroup debt movements.
Adjusted operating earnings per ordinary share is calculated on the same basis as adjusted operating profit. It is stated after tax attributable to adjusted operatingprofit and minority interests. It excludes income attributable to Black EconomicEmpowerment (BEE) trusts of listed subsidiaries. The calculation of the adjustedweighted average number of shares includes own shares held in policyholders’funds and BEE trusts.
Numbers for currencies other than Sterling are translated at average rate for profit and loss items and at closing rates for year-end balances.
Ove
rvie
w
+11%
06
1,4591,624
07
Adjusted operating profit*(IFRS basis) £m
+12%
06
15.116.9
07
Adjusted operating earningsper share* (IFRS basis) p
-4%
06
1,687 1,621
07
Adjusted operating profit(EEV basis) £m
-3%
06
17.8 17.2
07
Adjusted operating earningsper share (EEV basis) p
+13%
06
17.019.2
07
Basic earnings per share(IFRS basis) p
+5%
06
22.3 23.4
07
Net client cash flows£bn
+18%
06
237
279
07
Funds under management£bn
+10%
06
4.154.55
07
Final dividendp
Old Mutual plc Annual Report and Accounts 2007Overview06
Building a premierinternational savings and wealthmanagement business

1Gathering assets
Understanding ourcustomers andproviding innovative,value-for-moneyproduct solutions and services
Old Mutual plc Annual Report and Accounts 2007Overview 07
➔
We are building a premier international savings and wealth management business…
by targeting the global trends driving our industry...
Demographic andeconomic changes
Increased demandfor transparency,freedom of choiceand flexibility
Active and indexasset managementdifferentiation
Outsourcing
2Managing assets
Focused investmentcapability through an independentboutique model
3Delivering returns
Constantly striving for top-quartile growthon a sustained basis
Ove
rvie
w

1.Gathering assets
…by recognising demographic and economic opportunitiesWe operate in a wide range of markets around the world, and thisdiversity gives us opportunities and choices as economies grow and demographics shift. In many of our territories our customers are living longer, with greater demands for retirement provision.The trends affecting our asset gathering strategies encompass:
> Developing economies in India, China and Australia: we are well placed to benefit from the world’s fastest-growing economies
> Emerging middle classes in Africa and Asia: growing generations of more affluent and investment-aware consumers
> Baby-boomers in North America and Europe: flexible prolongedgradual retirement
> Global economic growth driving asset growth: equities offering longer-term returns
> In the US, 83% of our assets had outperformed their benchmarks and 83% were ranked above the median of their peer group over the trailing three-year period
Old Mutual plc Annual Report and Accounts 2007Overview08
Shanghai, ChinaLiying and Tao (aged 26 and 28)Liying and Tao are looking forward to their future together – a future which could well be brighter as a result of regular investment in their Old Mutual unit-linked savings policy.
31'22" N 121'47" E

Old Mutual plc Annual Report and Accounts 2007Overview 09

2.Managing assets
…by providing superior customer serviceWe realise that there is an abundance of options available to ourcustomers and that they are becoming increasingly investment-literateand have more information to inform their choices. We monitor andreport on service levels, recognising that excellent service is a competitiveadvantage in a world of commoditised solutions. Our philosophy ofdecentralisation allows each of our businesses to react quickly andeffectively to local conditions, and we aim to respond to the needs ofour customers with superior service irrespective of market conditions.Therefore we must remain aware of the increasingly complex factorsaffecting the way we manage our customers’ assets:
> Strong demand for simplicity, transparency, flexibility and fairness in terms of service and product offerings
> Active participation by regulators, leading to greater need forresponsibility and clarity from suppliers
> Effective emergence of e-commerce and personal financial “DIY”,giving consumers greater choice and access
Atlanta, United StatesBradley Jnr. and Snr. (aged 12 and 38)Bradley Snr. wants to make sure that his family is well protected, so the mortgage-term insurance policy that he has with Old Mutual means he has one less thing to worry about.
33'75" N 84'39" W
Old Mutual plc Annual Report and Accounts 2007Overview10

Old Mutual plc Annual Report and Accounts 2007Overview 11

3.Delivering returns
…by developing innovative products and solutionsWe aim for top-quartile returns on a sustainable basis and this requiresthe application of strong product-development expertise and consistentinvestment performance. We have moved away from the model ofbeing a life assurer to one where our chief aim is to provide investmentsolutions through a range of innovative products and asset classes. Our leading open-architecture platform allows customers range andflexibility, and gives us the opportunity to maximise returns. Our productdevelopment focuses on:
> Open-architecture and wrap platforms> Lower front-end charges> Guarantees only where explicitly required and paid for> Shift from life products to unit trusts and mutual funds
Oxford, United KingdomCaroline and Michael (aged 50 and 52)Caroline and Michael want to take the fullest advantage from their working lives, and the Skandia open-architecture wrap platform gives them the flexibility to do this and enjoy life to the full.
51'75" N 01'25" W
Old Mutual plc Annual Report and Accounts 2007Overview12

Old Mutual plc Annual Report and Accounts 2007Overview 13

Review of our strategy
Old Mutual plc Annual Report and Accounts 2007Directors’ report – Business review14
Chief Executive’s review
Our visionOur vision is to be a premier international savings and wealthmanagement business. This vision is built on a solid foundation of asset management and asset gathering expertise for which we have a heritage of over 150 years in both South Africa and Sweden.
Our primary objective as a Group is to look after people’s moneywell. Our value proposition is built on offering our customers and their advisers access to top-quartile investment returns andexcellent service through business models that offer choice and value for money.
Our strategyOur strategy is based on growing value through diversified productofferings and operations. Our decentralised operating model allowsa quick, relevant and effective response to changing customerneeds, as well as industry regulation, at a local level. Centralisedcapital management and disciplined risk control bind together apowerful set of engines designed to deliver consistent growth forcustomers and shareholders.
The nature of the savings industry – and the Company’sphilosophy – is a long-term one. The transformation of theCompany from a dominant South African life assurer to aninternationally competitive, customer-focused financial servicesorganisation has been a purposeful and thought-through journeythat is by no means finished. As we continue along this path,the growing diversity of our business allows us to draw widely on our own experience and transfer solutions from one part of the Group to another, quickly and efficiently.
Following our acquisition of Skandia in 2006, our portfolio ofbusinesses is now well placed to take advantage of four globaltrends that are shaping financial services markets internationally.
Transparency, choice and flexibilityThe first of these is the move to greater choice, transparency andlower costs for customers. More than ever, customers are facedwith a wide array of alternative investment products. The power of consumer choice for financial services puts pressure on us torespond appropriately with solutions most relevant to our customers’needs. The purchase of Skandia has given us access to itspioneering and leading open-architecture platform, specifically in the UK, Europe and Latin America, which strategically andtechnologically provides us with a competitive advantage.
Jim SutcliffeChief Executive

Old Mutual plc Annual Report and Accounts 2007Directors’ report – Business review 15
Our strategy is based on disciplinedorganic and acquisitive growth,building value through diversity.
Changing demographicsThese consumer needs are being driven predominantly by a second trend, which is the increasing longevity of manypopulations and the growing proportion of older people withinthose populations – the so-called “baby-boomers”. Strategies for savings and wealth accumulation are changing globally ascustomers prepare for different lifestyles resulting from longerretirements. Old Mutual aspires to meet these changing needs and continues to offer new and innovative products to addressthese requirements.
Shifting investment philosophyThe third trend is the move away from traditional life productstowards other investment solutions. Our affiliate model in theUnited States and our boutique asset management structure inSouth Africa (which has adopted the US approach) position us well to respond this trend. Increasingly, Old Mutual sees itself as an asset manager – looking after and growing clients’ money,whether in the form of life-wrapped or straight investmentproducts. Our experience across all product lines enables us to respond quickly and imaginatively and to manage margins effectively.
OutsourcingPressure on margins has reinforced the fourth trend, which is towards outsourcing. The Company has a strategy of “being the best or buying the best”. If we are not able to deliver a coreservice or product at a competitive price, we will either build thatcapability internally (if that makes economic sense) or outsourcethe service or product concerned in order to benefit from scale and competence provided by best-of-breed third party suppliers.
Investment performanceThese trends, while challenging, provide us with opportunities.Asset gathering and management increasingly depend on solutionsthat best serve the needs of customers. The essential ingredientthat underpins our asset management business, is the delivery of market-beating investment performance. Old Mutual dedicatestime and capital to creating environments that encourage andreward performance excellence. The result is positive net clientcash flow – in our view the key measure of growth within our industry.
The combined effect of positive net client cash flow and goodinvestment performance is a rise in the level of assets undermanagement. Our business profits are produced as a result of thelevel of assets under management multiplied by margins on thoseassets less our expenses.
Our declared strategy when we listed on the London StockExchange in 1999 was to diversify our business geographically to avoid over-reliance on any one region. Life sales in Europe nowaccount for 61% of our volumes, while 76% of our funds undermanagement are today located in the United States and the UK.Although earnings are still predominantly generated in SouthAfrica, profit streams from the United States and the UK arebeginning to reflect our strategy.
We are not pursuing geographic diversity at any cost and we work constantly to identify those markets that are growing andprofitable, and where demographics and the propensity to save are clearly evident.
Our Group strategy is expressed through five main themes thatserve to rally our diverse businesses towards our vision of buildinga premier international savings and wealth management business:
1. Growth in assetsOur growth aspiration is underpinned by a belief that size is not a prerequisite for success, but rather an outcome that isultimately aimed at benefitting our customers. By growing ourassets we aim to be able to provide our customers with the bestinvestment returns, as growth provides a larger base for spreadingcorporate costs. Our shareholders should also benefit, since greaterfunds under management allow us to borrow capital more cheaply.Superior investment performance is crucial for achieving strong net client cash flows, which in turn build our funds undermanagement, the cornerstone of our performance metrics.
This sequence becomes the driver of our profit model: profit is generated through revenue (assets times our margins) lessexpenses. This simple yet effective model is starting to berecognised by analysts as an effective way of understanding the Group. It also keeps our management focused on what we believe our key drivers to be.
Stra
tegy

Old Mutual plc Annual Report and Accounts 2007Directors’ report – Business review16
Over the past four years we have achieved strong internationalgrowth. We are confident that we can continue along this path overthe long term by a combination of organic growth and acquisitionsin current and new geographies. We have a solid base and strongbrands in South Africa and the Nordic region on which to build. In the United Kingdom, Europe and the United States we arebuilding robust and high-growth businesses by applying our strong investment management capabilities.
We are also investing in emerging markets that we believe willbecome substantial contributors to future growth and in particular are looking to grow our presence in Asia.
2. Business performanceOur shareholders require a fair return for their investment, so webalance growth in assets with a focus on our capital allocation and profitability. Enhancing our business performance also entailsimproved risk management and a drive to raise individualbusinesses’ performance.
3. Knowledge-sharingAs indicated above, the world in which we operate is characterisedby rapid change, both in economic terms and in terms of ourcustomers’ needs. We are responding to this by sharing knowledge,technologies and best practice across the Group. This allows ourlocal businesses to adapt quickly to our clients’ emerging needsand changes in the local and global environment.
Our Group is well positioned in terms of capabilities in bothboutique and proprietary asset management and asset gatheringmodels. It also has expertise in a diverse range of distributionapproaches, many of which are reusable in different markets in which we do business.
4. Reputation Our reputation is built upon our desire to be respected members of the communities in which we live and work. We express thisdesire through our corporate values, through the way we interactwith our customers, investors, regulators, suppliers and each other. This is further supported through our active investment in theupliftment of our communities and care and preservation of ournatural environments. These activities take place at a local levelwhere we operate and in many cases actively involve our staff in their personal capacities.
Chief Executive’s reviewcontinued
In addition to the Chief Executive and the Group Finance Director, there arefour other members of the GroupExecutive, who are shown on the right. The Group Executive meets regularly to address strategic issues, to review the Group’s progress against its businessplan for the year and to discuss otherhigh-level matters affecting the Group’sperformance or prospects.
From left to rightJim SutcliffeChief ExecutiveJonathan NichollsGroup Finance DirectorRosie HarrisGroup Risk DirectorBob HeadGroup Director, Southern AfricaScott PowersChief Executive, Old Mutual USJulian RobertsChief Executive, Skandia
Group Executive
£266mValue of new business2007
Europe and Latin America 50%USA 27%South Africa 23%
Adjusted operating profit(IFRS basis) 2007 £1,624m*
Continuing Southern African business 65%Europe and Latin America 15%USA 15%Mutual & Federal 5%
*Including corporate costs

Old Mutual plc Annual Report and Accounts 2007Directors’ report – Business review 17
Mindful of our role and responsibilities in the communities inwhich we do business, we have sharpened our focus on CorporateResponsibility and see this as a key area for further progress during2008. For example, we launched the Masisizane (helping eachother) Trust under the stewardship of Old Mutual South Africaduring 2007. The Trust was funded with some of the proceeds of the sale of shares unclaimed after the demutualisation in 1999and is aimed at supporting small and women-led businesses.
There is increasing interest in the Group’s approach to theenvironment, human rights and social responsibility and it is clearthat these factors are starting to play a growing role in our clients’investment decisions. We are putting in place practices andprocesses to ensure that our product solutions and managementactivities with respect to these critical environmental issues arerelevant and appropriate. We describe our 2007 programme in more detail in the Corporate Responsibility section later in this report.
Locally, we monitor customer satisfaction in our operating businessesto ensure that we are providing proper levels of service. Our productsare also regularly assessed to ensure that clients are receiving valuefor money.
5. LearningOur business is built on the strength of our staff. We aim to employ, develop and retain the best people available in each of our markets. We invest in our people and particularly focus on building a deep and wide pipeline of management andleadership talent that reflects the diversity of our geographies.
Business performanceFull details of the Group’s financial performance during the year are contained in the Group Finance Director’s report, whichfollows, but let me highlight some of the key developments and achievements of the past year.
Old Mutual implemented a programme of investment during 2007to develop the Group and place the business on a sound footing forfuture growth. A significant amount was achieved in building scaleand market share, and steps were taken to remain at the forefrontof innovation and competitive within our markets.
Strong net client cash flow, a key indicator of business performanceand a measure being increasingly adopted as a reporting yardstick by the financial services industry, was a feature of each of ourbusinesses in 2007, in particular at US Asset Management.
While mutual fund sales were adversely affected by unfavourablemarket conditions in the second half, life sales overall were good.
Notwithstanding planned infrastructural investment, tight controlon costs continued, leading to an increase in IFRS adjustedoperating profit of 11%. Earnings per share grew by 12% and we produced a solid return on equity of 13.2%.
Our end-2008 target of £300 billion in funds under managementremains firmly on track, with Group funds under managementincreasing by 18% to £279 billion during 2007 despite theproblems that beset the markets toward the end of the year.
Regional reviewOur European businesses showed impressive growth, and 2008will mark the conclusion of the programme to integrate Skandia.The platform business in the UK continued to go from strength tostrength, continuing to attract assets through its well-establishedIndependent Financial Adviser (IFA) network. Skandia Europe andLatin America (ELAM) also benefitted from its portfolio approachdesigned to share practices across like regions, which resulted instrong unit-linked sales. While the competitive environment inSweden continued to hamper margins, the latter part of the yearsaw a positive turnaround in sales. Overall, we believe that, withsynergy targets on track, Skandia has been a very successful,value-accretive investment for the Group.
Investment in the retail distribution system, improvements in ourretail offering and new marketing initiatives all helped drive sales at Old Mutual South Africa. With a strong stock market in the earlypart of the year, IFRS adjusted operating profit at this businessgrew by a healthy 23%. Corporate sales dropped slightly aftersome large single outflows relating to changing client investmentmandates and some hesitancy over the introduction of the newboutique asset management model.
2007 was a milestone year for Nedbank. Managementsuccessfully achieved the company’s four-year recovery targets in the first half, and established a revitalised working environmentthrough investment in people, culture and values. This hasprovided Nedbank with a solid foundation on which to sustain its business performance and its credit and expense management in the more difficult trading conditions that are likely to prevailduring the current year.
Stra
tegy

Old Mutual plc Annual Report and Accounts 2007Directors’ report – Business review18
Mutual & Federal (M&F) suffered from a downturn in theunderwriting cycle and a reduction in investment income. AlthoughM&F is a solid business, we have stated that it is not core to ourasset gathering and asset management strategy in South Africaand, toward the end of 2007 we announced that the Group was in discussions with Royal Bafokeng Holdings to sell Old Mutual’s75% stake in the company. The discussions continue and we hope to conclude them during the course of 2008.
Strong investment performance in the USA again delivered powerfulnet client cash flow, and asset management earnings grew strongly.Acadian Asset Management led the way, but there were also strongperformances from Barrow, Hanley, Mewhinney & Strauss, DwightAsset Management Company and Rogge Global Partners, andperformance fees were particularly good at Campbell. The US Lifebusiness enjoyed exceptionally strong variable annuity sales in the second half at its Bermuda business and earnings showed a pleasing increase on the underlying trend in the first half. The US business was cash generative as planned.
Our Asia Pacific businesses continue to reflect the impressivegrowth of the region. Sales, the value of new business and the level of funds under management have grown strongly, and ourincreased focus on the region, including the recent establishmentof a regional headquarters in Hong Kong, stands us in good stead for the medium term.
Our operating model Our strategy is executed as near to the customer as possible, but within the guidelines of common Group-wide themes. Our businesses are empowered to decide the products, pricing and distribution options that best meet local customers’ needs.They are also encouraged to grow strong local brands whereappropriate, but aligned to and endorsed by the Old Mutual brand and its values.
At the centre we identify and facilitate cross-business synergies and knowledge-sharing opportunities and provide a Group-wideframework for governance, capital allocation, risk management,brand and talent management which sets common parameters for the local businesses.
Our valuesAll our businesses subscribe to the Group values of Integrity,Respect, Accountability and Pushing Beyond Boundaries. Thesevalues form the glue that helps to bind the Group together and we also expect all our employees to practise and be judged bythese values.
Summary and outlookDuring 2007, in conditions that became very challenging duringthe second half of the year, we focused on building our capabilitiesacross our international portfolio. I am delighted that during thisperiod of investment we were able to produce strong earningsgrowth. Particularly pleasing was the continued delivery ofexcellent investment performance across the Group. Thisstimulated good growth in net client cash flows and funds undermanagement, which will stand us in good stead going forward.
Looking ahead, while currency movements and the continuedturbulent state of global markets will have an impact on earnings,diversity in product mix and geography, coupled with our robustcapital position and operating momentum in our businesses, giveme confidence that we will deliver a resilient performance in 2008.
Jim SutcliffeChief Executive27 February 2008
Total funds under management – breakdown by geography
1999Funds under management£45 billion
2001Funds under management£143 billion
2007Funds under management£279 billion
Rest of the World 40%Southern Africa 60%
Rest of the World 23%Southern Africa 10%United States 67%
Rest of the World 2%Southern Africa 15%United States 61%Europe 22%
Chief Executive’s reviewcontinued

Old Mutual plc Annual Report and Accounts 2007Directors’ report – Business review 19
Stra
tegy
Our vision is to be a premier international savings and wealth management business. We are wellpositioned in attractive markets and, with a sharpfocus on delivery, we aim to capitalise on theexcellent growth opportunities that lie ahead of us.
> Aim to strengthen investment performance> Keep building distribution channels and relationships> Add ground-breaking product solutions> Continue to develop our leading open-architecture platforms
> Benchmark against the best> Reduce the number of capital-intensive products> Re-use skills across the regions and businesses where applicable
> Additional opportunities have been identified and expansion plans developed for existing countries in which we do business
> Further countries have been identified and market-entry plans developed> A new regional office has been established by the Company in Hong Kong
> Accelerate the implementation of the Group-wide management development programme
> Share and apply knowledge across the Group
> Report carbon footprint and aim to reduce this within Group targets
Organic growth
Reduce expenses
Asia Pacific
People
Corporate Responsibility
Strategy priorities Actions

Old Mutual plc Annual Report and Accounts 2007Directors’ report – Business review20
Strong brands worldwide
Our key brands
South Africa Europe
General Insurance
Banking
Banking
Asset ManagementAsset Management
Life
Life

Old Mutual plc Annual Report and Accounts 2007Directors’ report – Business review 21
We have developed a broad range of brandsacross the world. Some are international, someare local; however all are driven by our Groupvalues of Integrity, Respect,Accountability andPushing Beyond Boundaries. It is what makes ourbrands unique and keeps our customers comingback to us.
Stra
tegy
Asia Pacific and otherUnited States
2100 CAPITALGROUP
Life
Asset Management Life

How we are performing
Old Mutual plc Annual Report and Accounts 2007Directors’ report – Business review22
Group results
Group Highlights (£m) 2007 2006 % change
Adjusted operating profit (IFRS basis) (pre-tax) 1,624 1,459 11%
Profit before tax (IFRS) 1,750 1,714 2%Adjusted operating earnings per share
(IFRS basis) 16.9p 15.1p 12%Basic earnings per share (IFRS basis) 19.2p 17.0p 13%Adjusted operating profit (EEV basis)
(pre-tax) 1,621 1,687 (4%)Adjusted operating earnings per share
(EEV basis) 17.2p 17.8p (3%)Basic earnings per ordinary share from
continuing operations 18.3p 15.8p 16%Basic earnings per ordinary share from
discontinued operations1 0.9p 1.2p (25%)Adjusted Group embedded value (£bn) 9.4 8.9 6%Adjusted Group embedded value
per share 173.3p 161.1p2 8%Value of new business 266 2533 5%Present value of new business premiums 13,878 12,1853,4 14%Life assurance sales (APE) 1,760 1,5763,4 12%Unit trust/mutual funds sales 8,268 8,4083 (2%)Net client cash flows (£bn) 23.4 22.3 5%Funds under management (£bn) 278.9 237.15 18%Return on equity (%)6 13.2% 12.0%Return on Embedded Value (%) 13.2% 13.8%Full dividend in respect of the financial
year 2007 6.85p 6.25p 10%
1 The results of the Group’s South African general insurance business, Mutual & Federal, are shown as a discontinued operation in these financial statements. The Group is currently in discussions with the investment group, Royal BafokengHoldings (Proprietary) Limited (RBH), which may or may not result in the sale to RBH of a controlling interest in Mutual & Federal.
2 The 2006 comparative has been restated from 157.2p as published at 31 December 2006 to reflect the value of own shares held in Employee ShareOwnership Plans (ESOPs).
3 2006 comparatives restated to include acquired Skandia businesses on a pro forma12 month basis.
4 Restated due to change in the calculation of US Life APE calculation to align withthe value of new business calculation.
5 Restated to exclude Spanish Vida business sold in 2007.6 Return on equity is calculated using adjusted operating profit after tax and minority
interests on an IFRS basis with allowance for accrued coupon payments on theGroup’s hybrid capital. The average shareholders’ equity used in the calculationexcludes hybrid capital.
Group Finance Director’s report
Jonathan NichollsGroup Finance Director

Old Mutual plc Annual Report and Accounts 2007Directors’ report – Business review 23
Net client cash flows delivered through sustained investment performanceDuring 2007 the Group’s net client cash flows were a very healthy £23.4 billion, representing 9.9% of opening funds undermanagement, with good contributions resulting from business unit investment performance. Our US Asset Management businessdelivered excellent net inflows of £17.6 billion, while the Skandiabusinesses achieved £5.3 billion of net inflows. For OMSA, net client cash flows remained a challenge.
Solid salesIn Europe we continued to benefit from being the open-architectureleader in the UK with strong life assurance sales, whilst growthcontinued in ELAM with excellent unit trust sales. In Nordic,investment in the sales channel led to a turnaround from thedecline in Annual Premium Equivalent (APE) sales experiencedduring the first half of the year. In the second half, sales in thatregion recovered, resulting in a 3% year-on-year increase overall. In the US, APE sales were up by 47% in US Dollar terms, drivenby exceptional growth in Bermuda. South African life sales were7% higher in Rand terms although 5% lower in Sterling.
Value of new business up 5%The value of new business (VNB) grew to £266 million, driven by excellent sales in US Life and strong sales in the UK. The APEprofit margin increased to 21% for the US Life business, comparedwith 18% in 2006. The UK APE margin of 10% was sustainedduring the period and it is expected that this business will meet its 11-12% target in 2008. In Nordic, the APE margin declinedmainly due to increased costs from the new Liv-Link agreement,strengthened lapse assumptions, lowered charges and a differentbusiness mix, whereas in ELAM we exceeded our margin target. In OMSA, the margin declined slightly from the 2006 result largelydue to operating assumptions and the VNB decreased slightly in local currency terms.
IFRS adjusted operating earnings per share 16.9pIn spite of the significant impact of Rand and US Dollar currencydepreciation, and the full impact of additional shares issued inrelation to the acquisition of Skandia, the Group produced a 12% increase over 2006 in its overall earnings per share.
Assuming constant exchange rates, 2006 adjusted operating EPSwould have been 13.1p, with the currency impact being 1.5p andthe impact of the increase in issued shares being 0.5p. 2007 EPSincreased on this basis by 29%.
Our results reflect a healthy overall performance fromaround the Group. Funds under management grew by 18%, with operating profit benefitting from both a better than expected result from our Skandiaacquisition and good progress in our other businesses.
Perf
orm
ance
2006 restated at
Group Highlights (£m) 2007 2006 2007 rates
Adjusted operating profitAfrica 1,254 1,118 988United States 260 264 244Europe 268 239 239Other 2 1 1
1,784 1,622 1,472Other shareholders’ expenses (41) (33) (33)Finance costs (119) (130) (130)
Adjusted operating profit before tax and minority interests 1,624 1,459 1,309
Tax (418) (395) (354)Minority interests (292) (274) (247)
Adjusted operating profit after tax and minority interests 914 790 708
Adjusted operating EPS (pence) 16.9 15.1 13.1
Adjusted Embedded Value per share 173.3pThe adjusted Group embedded value (EV) per share was 173.3pand Adjusted Group EV was £9.4 billion at 31 December 2007(31 December 2006: £8.9 billion). This represents an increasefrom 161.1p7 at 31 December 2006. The movement in EV pershare has largely been driven by the net impact of profit flows,particularly from non-covered business, strong investment marketmovements and a slight impact of currency appreciation. The EVper share is after dividend payments and has also been affected bya reduction in the share price of the listed subsidiaries. The sharebuyback programme to 31 December 2007 increased the EV pershare by 0.2p.
7 Following the adjustment for the value of ESOP shares and furthermore allowing for the opening adjustment calculated now as part of the fair value balance sheetexercise, the adjusted Group EV at 1 January 2007 was £8.8 billion and the EV per share at 1 January 2007 was 159.9p.
Return on Equity continued to improveReturn on Equity for the Group improved to 13% from 12%,reflecting the improvement in the earnings run-rate compared to2006, particularly for OMSA, Nedbank, US Asset Management and the UK. In addition, the long-term investment return improved,partly due to strong investment performance of the shareholders’equity in South Africa.

Old Mutual plc Annual Report and Accounts 2007Directors’ report – Business review24
The Group has continued to develop its Economic Capital programmeand a comfortable surplus exists within each of our South African,US and European regions, meaning that the Group is not reliant for its economic solvency on the need to transfer capital between geographies.
The Group is in compliance with the Financial Groups Directive(FGD) capital requirements, which apply to all EU-based financial conglomerates. Our FGD surplus was £1.7 billion at 31 December 2007 and we seek to maintain a FGD surplusof around £750 million to £1 billion.
Capital requirements are set by the Board, while recognising theneed to maintain appropriate credit ratings and to meet regulatoryrequirements at both the Group and local business level.
OtherOur £350 million share buyback programme was announced at the beginning of October 2007 and we have so far repurchasedapproximately 184 million shares through the London andJohannesburg markets at a total sterling equivalent cost of £282 million.
Holding company cash generationThe table below shows the cash flows of the Old Mutual plcholding company and its satellite holding companies. We believethis provides a clear picture of the cash receipts and payments of the holding companies.
Highlights (£m) 2007 2006
Total net debt at start of period 2,407 1,278Operational flowsOperational receipts 868 535Operational expenses (152) (156)Other expenses (71) 645 – 379
Capital flowsCapital receipts 69 356Acquisitions (66) (1,287)Organic investment (220) (217) (214) (1,145)
Debt and equity movementsOld Mutual plc dividend paid (333) (281)Share repurchase (177) –New equity issuance 12 14Other movements 57 (441) (96) (363)
Total net debt at end of period 2,420 2,407
Group Highlights
Long-term Asset General 2007 (£m) business Management Banking Insurance Other
Adjusted operating profit (IFRS basis) (pre-tax) 771 288 636 89 (160)
Adjusted operating profit (EEV basis) (pre-tax) 758 288 636 89 (150)
Profit before tax (IFRS) 822 299 650 82 (103)Value of new business 266 – – – –Life assurance sales (APE) 1,760 – – – –Unit trust/mutual
funds sales – 8,268 – – –Net client cash flows (£bn) 4.4 19.0 – – –Funds under
management (£bn) 82.0 193.3 – – 3.6
2006 (£m)Adjusted operating profit
(IFRS basis) (pre-tax) 759 236 545 82 (163)Adjusted operating profit
(EEV basis) (pre-tax) 981 236 545 82 (157)Profit before tax (IFRS) 742 294 555 132 (9)Value of new business 244 – – – –Life assurance sales (APE) 1,520 – – – –Unit trust/mutual
funds sales – 8,408 – – –Net client cash flows (£bn) 5.3 17.0 – – –Funds under
management (£bn) 72.8 163.1 – – 3.5
Robust capital positionThe Group’s gearing level remains comfortably within our targetrange, with senior debt gearing at 31 December 2007 of 1.9%(5.9% at 31 December 2006) and total gearing, including hybridcapital, of 20.5% (21.4% at 31 December 2006).
In January 2007, the Group issued €750 million of Lower Tier 2Preferred Callable Securities, the proceeds of which were used, inpart, to finance the repayment of a €400 million senior Eurobondthat matured in April 2007.
Group Finance Director’s reportcontinued

Comparative informationThe reporting format for Old Mutual plc for the 2007 reportingperiod is as follows:
> All Group comparative reporting information on earnings includesSkandia from the date of acquisition of 1 February 2006 (unlessindicated otherwise).
> Within the financial statements the Europe division comparativeinformation is from the date of acquisition of 1 February 2006.
> Where Europe information is shown within the Business Review,this has been adjusted on a pro-forma basis to reflect ownershipfrom 1 January 2006.
Old Mutual plc Annual Report and Accounts 2007Directors’ report – Business review 25
Total net debt within the holding company at the end of 2006 was £2,407 million. A total of £937 million of operational andcapital receipts was received from business units during 2007.£220 million was invested in the businesses and £333 million was used to pay the 2006 final and 2007 interim dividends. In 2007, £177 million was spent on repurchasing shares. Total net debt at the end of 2007 was £2,420 million.
TaxationThe Group’s effective IFRS adjusted operating profit tax rate hasdecreased to 26% from 27% in 2006. This reflects Mutual & Federalpaying a lower special dividend in 2007 and reductions in the taxrates in the UK and Germany, partially offset by a changed profitmix in South Africa.
DividendThe directors of Old Mutual plc are recommending a final dividendof 4.55p per share8 for the year ended 31 December 2007, to be paid on 30 May 2008. Together with the interim dividend of2.3p per share paid in November 2007, this makes a total of6.85p per share for the year, which represents an increase of 10%over 2006. The indicative Rand equivalent of this final dividend9
is 68.92c, making a total of 103.75c, an increase of 17%. TheBoard’s policy on dividends is to seek to achieve steadily increasingreturns to shareholders over time, reflecting the underlying rate ofprogress and cash flow requirements of Old Mutual’s businesses.
8 The record date for this dividend payment is the close of business on Friday, 9 May2008 for all the Exchanges where the Company’s shares are listed. The last day totrade cum-dividend on the JSE and on the Namibian, Zimbabwe and Malawi StockExchanges will be Friday, 2 May 2008 and on the London Stock Exchange, Tuesday,6 May 2008. The shares will trade ex-dividend from the opening of business onMonday, 5 May 2008 on the JSE and the Namibian, Zimbabwe and Malawi StockExchanges, and from the opening of business on Wednesday, 7 May 2008 on theLondon Stock Exchange. Shareholders on the South African, Zimbabwe and Malawibranch registers and the Namibian section of the principal register will be paid thelocal currency equivalents of the dividend under the dividend access trust arrangementsestablished in each country. Shareholders who hold their shares through VPC AB, theSwedish nominee, will be paid the equivalent of the dividend in Swedish Kronor (SEK).Local currency equivalents of the dividend for all five territories will be determined by the Company using exchange rates prevailing at close of business on Thursday, 17 April 2008 and will be announced by the Company on Friday, 18 April 2008.Share certificates may not be dematerialised or rematerialised on the South Africanbranch register between Monday, 5 May and Friday, 9 May 2008, both datesinclusive, and transfers between the registers may not take place during that period.
9 Based on rates at 25 February 2008 (R15.1467 = £1).
The Group’s Return on Equity improved to 13% from 12%, reflecting an improvement in the earnings run-ratecompared to 2006, particularly at OMSA, Nedbank,US Asset Management and the UK.
Perf
orm
ance
+5%
06
253 266
07
Value of new business3
£m
+10%
06
12.013.2
07
Return on Equity%
+12%
06
1,5761,760
07
Life assurance sales (APE)3
£m
- 2%
06
8,408 8,268
07
Unit trust/ mutual fund sales3
£m
Old Mutual plc Annual Report and Accounts 2007Directors’ report – Business review26
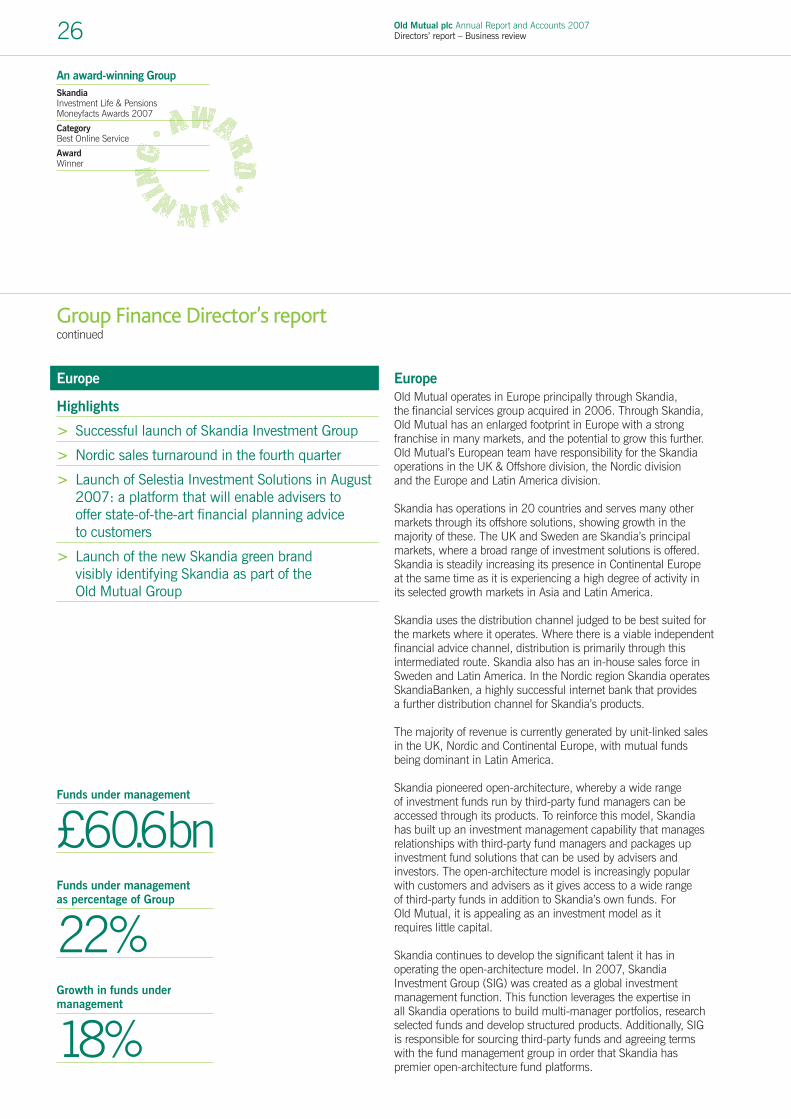
EuropeOld Mutual operates in Europe principally through Skandia, the financial services group acquired in 2006. Through Skandia, Old Mutual has an enlarged footprint in Europe with a strongfranchise in many markets, and the potential to grow this further.Old Mutual’s European team have responsibility for the Skandiaoperations in the UK & Offshore division, the Nordic division and the Europe and Latin America division.
Skandia has operations in 20 countries and serves many othermarkets through its offshore solutions, showing growth in themajority of these. The UK and Sweden are Skandia’s principalmarkets, where a broad range of investment solutions is offered.Skandia is steadily increasing its presence in Continental Europe at the same time as it is experiencing a high degree of activity in its selected growth markets in Asia and Latin America.
Skandia uses the distribution channel judged to be best suited forthe markets where it operates. Where there is a viable independentfinancial advice channel, distribution is primarily through thisintermediated route. Skandia also has an in-house sales force inSweden and Latin America. In the Nordic region Skandia operatesSkandiaBanken, a highly successful internet bank that provides a further distribution channel for Skandia’s products.
The majority of revenue is currently generated by unit-linked salesin the UK, Nordic and Continental Europe, with mutual fundsbeing dominant in Latin America.
Skandia pioneered open-architecture, whereby a wide range of investment funds run by third-party fund managers can beaccessed through its products. To reinforce this model, Skandia has built up an investment management capability that managesrelationships with third-party fund managers and packages upinvestment fund solutions that can be used by advisers andinvestors. The open-architecture model is increasingly popular with customers and advisers as it gives access to a wide range of third-party funds in addition to Skandia’s own funds. For Old Mutual, it is appealing as an investment model as it requires little capital.
Skandia continues to develop the significant talent it has inoperating the open-architecture model. In 2007, SkandiaInvestment Group (SIG) was created as a global investmentmanagement function. This function leverages the expertise in all Skandia operations to build multi-manager portfolios, researchselected funds and develop structured products. Additionally, SIG is responsible for sourcing third-party funds and agreeing termswith the fund management group in order that Skandia haspremier open-architecture fund platforms.
Europe
Highlights
> Successful launch of Skandia Investment Group
> Nordic sales turnaround in the fourth quarter
> Launch of Selestia Investment Solutions in August2007: a platform that will enable advisers to offer state-of-the-art financial planning advice to customers
> Launch of the new Skandia green brand visibly identifying Skandia as part of the Old Mutual Group
Group Finance Director’s reportcontinued
Funds under management
£60.6bnFunds under managementas percentage of Group
22%Growth in funds undermanagement
18%
An award-winning GroupSkandiaInvestment Life & Pensions Moneyfacts Awards 2007
CategoryBest Online Service
AwardWinner

Old Mutual plc Annual Report and Accounts 2007Directors’ report – Business review 27
ProtectionSkandia has decided not to participate in the mass-market, price-driven protection market, and instead offers solutions forthe premium protection market. In this market, Skandia offers two main solutions: unit-linked whole life and critical illness cover.Average premium sizes are high and Skandia has a significantmarket share in these segments. Typical customers include the self-employed and entrepreneurs and also clients seekingprotection linked to efficient inheritance tax solutions. Protectionaccounts for approximately 3% of SLAC’s APE sales.
Selestia Investment Solutions Business profileSelestia Investment Solutions is the newly developed investmentplatform (often referred to as a fund supermarket) that combinesthe reputation and strengths of the Selestia business (owned by Old Mutual prior to the Skandia acquisition) and Skandia’sMultiFUNDS platform. The investment platform gives advisers and their customers access to Individual Savings Accounts (ISA),PEP and Collective Investment Accounts, which are provided bySkandia MultiFUNDS Limited, Collective Retirement Accounts and Collective Investment Bonds which are provided by SelestiaLife & Pensions Limited and an Offshore Collective InvestmentBond, distributed by Skandia MultiFUNDS Limited for Old MutualInternational (Guernsey) Limited.
Selestia Investment Solutions offers a choice of over 900 fundsfrom third party fund managers and from a suite of in-housemanager-of-managers funds. It achieved solid performance in2007, with net client cash flows of £1.4 billion. Growth was drivenby a record ISA season, increased use of platforms across theindustry and Skandia's strong proposition in e-commerce solutions.Platforms are increasingly core to advisers’ business models andSelestia Investment Solutions is well placed to benefit from thistransformation of the UK financial services industry.
Once the Selestia Investment Solutions platform has beencompleted, the Skandia MultiFUNDS business will be migrated on to the new platform. This is expected to be in the second half of 2008. In the interim, Skandia MultiFUNDS remains a stand-alone offer, primarily for existing customers.
UK & OffshoreSkandia UK includes three business units: UK (Skandia Life andSelestia Investment Solutions), Skandia Investment Management(SIML), and Skandia International. With over a million customersand £42 billion of funds under management, Skandia is one of thefastest growing UK savings companies.
Skandia UK focuses on long-term savings. It offers unit-linkedinvestments through an open-architecture fund platform enablingaccess to over 900 external funds and manager-of-managerssolutions developed through SIML. In the UK, it distributes its products via independent financial advisers (IFAs), targeting affluent customers.
Skandia’s success in the UK has been framed around a few key attributes: it has established a strong IFA franchise throughexcellent service and a distinctive proposition; it has excelled in the high-growth open-architecture segment of the UK market and it has consistently brought innovative ideas to market. In 2007,Skandia developed a new investment platform, Selestia InvestmentSolutions, and in doing so, has continued to set the industrystandard in the UK savings market.
Skandia Life (SLAC)Business profileSLAC is the core of Skandia UK, accounting for approximately45% (£19 billion) of Skandia UK’s £42 billion of funds undermanagement. SLAC operates in three product segments: pensions,investment bonds, and protection. Pensions and investment bondscomprise 97% of SLAC’s sales on an APE basis.
PensionsSLAC provides a range of pensions to meet the retirement-planningneeds of individuals, employers and trustees, and also distributes a self-invested personal pension (SIPP). All of its pension productsoffer wide investment choice in funds, on a unit-linked basis. 80% of client assets are invested with third-party fund managersand 20% with Skandia’s own manager-of-managers solutions.Approximately £10.5 billion is invested in pensions.
Investment BondsSLAC’s MultiBond range comprises single premium investmentswhich are tax-efficient for certain consumer segments. Theyprovide unit-linked investments with the opportunity to make tax-efficient withdrawals of capital.
Perf
orm
ance
Skandia Cowes WeekSkandia has been title sponsor ofSkandia Cowes Week, the world’soldest and largest regatta of its type,since 1995. With over 8,500competitors, around 100,000spectators and a media audience ofmillions, the sponsorship has been anexcellent way of promoting the Skandiabrand to our target audience. As well as providing significant brand exposurethe sponsorship has also been highlysuccessful in delivering on customerrelationship-building and employeeengagement objectives.

Old Mutual plc Annual Report and Accounts 2007Directors’ report – Business review28
Skandia Investment Management (SIML)Business profileSIML is a dynamic asset management company focused on providing innovative multi-manager funds to professionalintermediaries. These leverage the investment research capabilityby creating “blended” solutions of third-party managers withdifferent styles and processes. Since SIML’s launch in March2003, funds under management have grown from around £750 million (including funds held on behalf of other Groupcompanies) to £5.1 billion. The number of funds has expandedfrom ten to 42 within four years, leading to greater diversificationand appeal to a wider client base.
The key to success has been innovation and fund quality. Since2003, the business has been at the forefront of the UK fundmanagement industry, introducing a number of innovative newfunds to the market that have proven popular with advisers and investors. This focus on advisers and their clients has ledSkandia to be named Best MultiManager at the prestigious Money Marketing Awards 2007 for the third consecutive year.
With the launch of the Global Best Ideas Fund in 2006, SIML’sfund proposition has been taken to a new level. The funds, whichare run by ten of the industry’s best fund managers, who eachselect their ten best stock ideas, have continued to be positivelyreceived by the marketplace. In 2007, the launch of the UKStrategic Best Ideas Fund, which allows managers to benefit fromboth rising and falling share prices, was also well received.
SIML continues to work closely with advisers to stay at the forefrontof the multi-manager industry and continues to explore furtheropportunities, particularly within the Best Ideas concept, to deliverinnovative investment solutions to the market.
Group Finance Director’s reportcontinued
Skandia InternationalBusiness profileSkandia International includes Royal Skandia, based in the Isle of Man, Skandia Life Ireland based in Dublin, Skandia Lebenin Liechtenstein and Old Mutual International based in Guernsey.
Operating across the borders of over 20 countries, SkandiaInternational is the offshore and cross-border function for the SkandiaGroup. Skandia International creates real value for Old Mutual, with2007 results exceeding expectations. Significant growth during2007 resulted in funds under management exceeding £12 billion by the year end.
The business has high growth potential and achieves better marginsthan domestic UK businesses. There is also further growth potentialfor this business through improved co-operation with Skandia’soperations across Europe and the Nordic region and, longer term,across the wider Old Mutual Group.
Royal Skandia, based in the Isle of Man, provides products that allowUK and non-UK investors to enjoy tax-free growth. The Isle of Manis a leading offshore investment location with valuable clientprotection through tight regulation and policyholder compensationprovision. Skandia Life International division also provides productsinto the Finnish domestic market.
In line with all Skandia UK products, the International range offersmulti-manager choice and flexibility, with access to a range offunds run by third-party managers and through SIML. The flexibilityof products and services enables clients not only to invest invirtually any fund in the market, but also via different currenciesand trust arrangements.
BankhallBankhall is a stand-alone business that reports into Skandia UK. It provides support services to directly-regulated financialadvisers. The Compliance Consultancy element of the propositionis designed to deliver support to these advisers to meet ever-changing regulatory requirements. Business Development Support,a business-to-business web-based portal, assists advisers toachieve profitable business growth. Bankhall has a clear model todemonstrate the value it provides for the advisers it serves, and this has enabled it to maintain a market-leading position and toimprove its profitability during 2007.
An award-winning GroupSkandiaInternational Investment – InternationalFund and Product Awards 2007
CategoryBest Commitment to Service
AwardWinner

Old Mutual plc Annual Report and Accounts 2007Directors’ report – Business review 29
International business increased in the year, benefitting from strongportfolio bond sales into the UK in the first half and single premiumbusiness in Latin America and the Far East. A tail-off in offshoreinstitutional short-term business following a tax change in the UK Budget was offset by higher regular premium business in thelatter part of the year. Although this business has experiencedincreased competition, we believe the offshore market has goodpotential for growth.
Unit trust performance impacted by revised business mixAlthough the year started very positively, the latter part of 2007reflected the influence of increased uncertainty and volatility inequity markets. Unit trust sales were 30% down on 2006. This islargely accounted for by the low-margin institutional mutual fundbusiness being significantly down in the year, with no recurrence ofthe exceptional business volumes experienced in the third quarterof 2006. The year concluded with Selestia Investment Solutions,our new market-leading open-architecture platform, experiencingincreasing volumes and providing a solid base for future growth.
Strong growth in IFRS adjusted operating profitIFRS adjusted operating profit increased by 29% to £173 millionfor the year. The improvement was driven by a significantly higherlevel of funds under management throughout the year as a result ofpositive net client cash flows being sustained well into 2007 aswell as improved rebate terms. The effect of both of these factorswas a rise in asset-based fees. In addition, there was a positiveimpact from growth in investment income. Both revenue and costbenefits continue to be derived from increased scale and synergies.
Higher EV adjusted operating profit (covered business)EV adjusted operating profit before tax increased by 18% to £266 million. The value of new business improved 18% to £77 million. Expense synergies and improved mix across thebusiness helped sustain the new business margin of 10%, withsales of single premium pensions being especially strong.
The EV adjusted operating profit includes £43 million post-tax of positive impact from operating assumption changes, largely due to a reduction in corporation tax assumptions from 30% to 28%.Operating experience for persistency and expenditure continued in line with expectations. Modest offsetting revisions were required,with positive impacts arising from improvement in the allowance for fee income following continuous commercial negotiations andincreasing purchasing power.
Performance during 2007
Pro forma1
Highlights (£m) 2007 2006 % change
IFRS adjusted operating profit (pre-tax)2 173 134 29%EV adjusted operating profit
(covered business) (pre-tax) 266 226 18%Life assurance sales (APE) 740 646 15%UK life assurance sales (APE) 468 396 18%Unit trust sales 2,275 3,227 (30%)Value of new business (post-tax) 77 65 18%New business margin (post-tax) 10% 10%Present value of new business premiums 6,297 5,350 18%Net client cash flows (£bn) 3.9 4.9 (20%)Funds under management (£bn) 41.9 36.0 16%
1 The 2006 numbers are stated on a pro-forma basis assuming ownership for 12 months rather than 11 months and have been restated to include the results of Old Mutual International.
2 From 2007 the treatment of Selestia deferred fee income has been harmonised with Skandia MultiFUNDS, reducing the 2007 result. The impact of policyholder tax has been smoothed from 2007.
Positive net client cash flows and strong growth in funds under management Net client cash flows were £3.9 billion for the year, representing11% of opening funds under management. While net client cashflows were down on 2006, they remained strongly positive, with 2006 being inflated by the post-A-Day effect and the exceptionalinstitutional mutual fund business mentioned below. Good inflows,combined with favourable market movements during the first half of the year, drove an increase in funds under management during2007 as a whole. In the second half, growth was constrained by volatile markets which affected investment performance andinvestor sentiment. This was partially offset by continued positivenet client cash flows.
Pension sales higher The increase in life assurance sales APE for 2007 was largelydriven by UK pensions. Single premiums were the key driver, with sales of both Selestia’s Collective Retirement Account andSkandia’s Monocharge pension up by over 25%.
Perf
orm
ance
Tour de Pologne, PolandAs sponsor of the Tour de Pologne,Poland's largest cycling event, Skandia’s campaign promoted a new communication style based on the association of savings andinvestment with cycling. The main slogan in Polish expressed a connection to changing gear. The campaign was well received in the Polish market and the Skandiabrand was further strengthened thanksto strong public recognition of thiscycling event.

Old Mutual plc Annual Report and Accounts 2007Directors’ report – Business review30
Further innovative investment solutionsSkandia Investment Management (SIML)’s unconstrained Best Ideas range was expanded in September 2007 with thelaunch of UK Strategic Best Ideas. UK Strategic Best Ideas is thefirst multi-manager UK UCITS III fund to use long and short equitypositions, and has gathered over £90 million in assets since itslaunch, despite the difficult market environment.
Skandia's risk-focused multi-manager funds have delivered strongabsolute returns, typically with volatility far lower than that of itspeers and, consequently, the majority of these funds have deliveredbetter risk-adjusted returns.
Continued progress with integration activityIntegration activities remain on target to deliver the committedsavings as well as providing significant revenue potential. TheSelestia Investment Solutions platform was launched in August2007, and its full benefits will flow through following migration of Skandia MultiFUNDS investors on to the new platform in thesecond half of 2008. We launched the Skandia Investment Groupduring the course of the year. This brings sharper focus and energyto investment product manufacturing and strengthens our multi-manager business in a rapidly growing industry. It also improvesrevenue for divisions and shareholders through broadened andstrengthened investment products and greater leverage of buyingpower with fund groups.
Market environment and outlookFollowing regulatory changes in April 2006 designed to simplifythe UK pensions regime (A-Day), the pensions market grew stronglyduring the first half of 2007, and was dominated by single premiumtransfers, an area of the market where Skandia is dominant. Salesdid, however, slow in the second half of the year as the A-Dayeffect began to unwind.
Industry sales growth is likely to be more modest in 2008 asinvestor confidence continues to be affected by volatile equitymarkets. In addition, competition is intensifying as traditionalplayers build their own open-architecture offerings. This isespecially evident in the new partnerships that are being formedbetween fund platforms and traditional life companies. Lookingforward, Skandia should marginally outperform the UK industrythrough its strong IFA franchise and multi-manager proposition.
Group Finance Director’s reportcontinued
Skandia responded positively to the FSA’s review of the retaildistribution market, supporting the proposal that there should betwo types of distribution: an “advice channel” and a “no-advicechannel”. Skandia has also supported the concept of “customer-agreed remuneration” and has suggested that individualsinterfacing with consumers should have appropriate qualificationsand be members of appropriate professional bodies that requirecommitment to a code of ethics.
The Pre-Budget Report of October 2007 proposed a reduction in UK capital gains tax (CGT) to 18% for unit trust investments,without a similar reduction in CGT for insurance bonds. Investment bonds will continue to be tax-advantageous for certain consumersegments and there will continue to be demand for such solutions.However, total bond demand is likely to soften and we havealready seen a material reduction in bond sales since November2007. It is likely that such demand will switch towards collectiveinvestments, outside an insurance tax-wrapper, where it should be noted that Skandia UK has a market-leading position, albeitwith lower margins than for investment bonds.
Skandia International’s business is geographically diversified, withsales in Europe, the Middle East, the Far East, Africa and LatinAmerica, as well as in the UK. Historically, non-UK business hasbeen sourced predominantly from English-speaking expatriates,with some local nationals on a selective basis. Expatriate businessis expected to continue, with higher growth from local nationals as economies develop and Skandia becomes an increasingly “local” brand.
Risk managementSkandia UK’s risk framework is common across all its businessunits. Risks are considered in the context of our business plan and are managed in accordance with Old Mutual Group’s riskgovernance principles, which are described in more detail in theDirectors’ Report on Corporate Governance and Other Matters later in this document.
An award-winning GroupSkandiaInternational Investment – InternationalFund and Product Awards 2007
CategoryBest International Life Product Range
AwardWinner

Old Mutual plc Annual Report and Accounts 2007Directors’ report – Business review 31
Skandia Liv offers life and pension insurance in the traditional lifemarket. The company is a wholly-owned subsidiary of Skandia,but is a mutual company. It operates within a strict local legalframework that does not provide its holding company with powerto control it in such a way as to access the benefits usuallyassociated with share ownership (which instead accrue to Skandia Liv’s policyholders). Consequently, Skandia Liv is notconsolidated in the Group’s accounts.
Unit-linkedWithin unit-linked, Skandia offers a wide range of funds in variousclasses and with varying risk profiles. Funds, including thoseoffered by Skandia’s own fund companies, are managed externallyand managers are selected and monitored using our uniqueevaluation process. In 2007, in order to be more responsive toclient needs, we offered new investment opportunities whichfollowed a more streamlined evaluation process. Client funds in the Nordic unit-linked business amounted to SEK96.8 billion at the end of 2007, of which 82% was invested in equities. We willcontinue to work with new investment portfolio products during2008. During 2007 the Swedish unit-linked business received an award for the best three-year fund returns of all Swedish unit-linked companies. The Danish unit-linked business has had thebest fund returns of all unit-linked companies in Denmark eightquarters in a row.
Traditional lifeAs the market’s largest life company, Skandia Liv is active in both the private and occupational pensions segments of theSwedish traditional life market. Skandia Liv provides insuranceproducts with a security profile featuring long-term savings with a guaranteed yield plus protection coverage. Traditional lifeproducts are an important part of the integrated product offering inthe Swedish market. Skandia Liv has one of the highest solvencylevels of any life company in the Swedish market. At 31 December2007, this was 179% and funds under management amounted to SEK303 billion. During 2007 Skandia Liv was ranked toptraditional life assurer by independent Swedish consultants and distributors.
NordicSkandia has operated in the Swedish market for over 150 years and its Swedish business offers a full set of financial products.Skandia and its mutual subsidiary, Skandia Liv, hold a leadingposition in the local life assurance market measured by newbusiness, with a combined customer base of 1.9 million customersin their Nordic operations. We also have a growing unit-linked and life business, as well as a healthcare business, in Denmark. In Norway, we have a successful banking operation and also offer healthcare products. With a full range of product offerings –traditional life, unit-linked, banking, financial advisory, mutualfunds and healthcare – we are well positioned in a growing savings market.
Business profileOur vision is to have the most satisfied customers and to be theleading savings provider in the long-term savings market. The keychallenge going forward is to build an offering that provides bothend customers and distributors with advisory tools and top qualityadvice, innovative products, top-quartile returns and the market’sbest client service. The integration between Skandia, Skandia Livand SkandiaBanken has continued during 2007. There are strongpotential synergies in terms of scale, brand, cross-selling andadministration. Skandia’s products are widely distributed inSweden, with sales through IFAs, brokers, its own sales force and online via the internet. During the coming years we will beimproving and developing our customer interface, enriching ourproduct offering and making our products available to customersvia different channels.
Swedes are avid savers and 31% of net savings are invested in unit-linked products. Corporate pensions are the dominantsegment of the Swedish life market, a sector where Skandia hastraditionally been very strong. However, the corporate market is changing, with pressure on prices and collective agreementprocurements which we have to take into consideration when wedevelop our strategies to increase sales in this segment. Strategiesare in place to increase new sales in the private segment as well.Especially within unit-linked, we have seen mounting competitionfrom online product providers, among others.
Perf
orm
ance
Skandia, SwedenSwedish campaign to promote ourpension offering, the translation reads:Would you choose Skandia if youreceived SEK1.7 million more inpension capital?

Old Mutual plc Annual Report and Accounts 2007Directors’ report – Business review32
Mutual fundsSkandia also offers mutual fund products via its banking subsidiary,SkandiaBanken. Skandia Fund Products’ offering is accessible forunit-linked savings, direct savings, individual pension savings viaSkandiaBanken and for premium pension savings via the nationalPremiePensionMyndigheten (PPM) system. Individuals decidepersonally how they wish their money to be managed by choosingfrom PPM’s range of funds.
BankingFrom having been a niche player in the Nordic banking market,SkandiaBanken is now established as a full-range online bank and is well positioned to take advantage of the growing demand for direct self-service solutions in the Nordic savings market. Itsfocus is to sell the division’s non-insurance products and hencestrengthen the offering to small enterprises and private individuals.The bank also serves as Nordic’s direct distribution channel,targeting self-service clients with a full range of savings productsthrough a new online platform. The bank has won several awardsin Norway and Sweden for its outstanding service. During 2007the savings offering was strengthened by widening the fund range and introducing discounted share trading. This was a majorshift in strategic direction from a mortgage bank dependent on the capital market to a bank focused on long-term finance and day-to-day transactions.
Private HealthcareSkandia offers companies and their employees private healthcaresolutions as an adjunct to the national healthcare systems. Interest in complementary and alternative solutions to nationalhealthcare systems remains great in the Nordic countries. However, competition in this area has intensified considerably. The healthcare business in Skandia is also a powerful supportbusiness to the unit-linked and traditional life business in Swedenand Denmark, adding value to the pension scheme products andalso providing an opening to further business.
Group Finance Director’s reportcontinued
Performance during 2007
Pro forma1
Highlights (SEKm) 2007 2006 % change
IFRS adjusted operating profit (pre-tax) 874 1,075 (19%)EV adjusted operating profit
(covered business) (pre-tax) 700 1,589 (56%)Life assurance sales (APE) 1,992 1,942 3%Mutual funds sales 3,474 2,940 18%Value of new business (post-tax) 254 529 (52%)New business margin (post-tax) 13% 27%Present value of new business premiums 8,700 9,675 (10%)Net client cash flows (SEK bn) 2.7 3.5 (23%)Funds under management (SEK bn) 116.7 107.1 9%
1 The 2006 numbers are a pro-forma result assuming ownership for 12 monthsrather than 11 months.
Strong market performance contributed to funds under management Funds under management increased to SEK116.7 billion due tosolid investment performance and continued positive net clientcash flows. Volatile equity markets during the latter part of 2007slowed asset growth, but closing funds under management werestill up by 9% compared to 2006.
An award-winning GroupSkandiaBankenInternetWorld Magazine
CategoryBest Internet Bank 2007
AwardWinner

Old Mutual plc Annual Report and Accounts 2007Directors’ report – Business review 33
Underlying IFRS adjusted operating profit solidIFRS adjusted operating profit decreased by 19% for the yearprimarily due to the introduction of the Liv-Link agreement, whichdeals with the administration and distribution costs associated withjointly-marketed products.
EV adjusted operating profit impacted by market pressure EV adjusted operating profit was down 56% on 2006 mainlydriven by a net negative effect from assumption changes andrecalibration of risk margin of SEK735 million in 2007. There wasstrong price pressure in the Swedish market and, in order to adaptto market conditions, fees were reduced for “tick-the-box” collectiveagreements and tendered corporate business during 2007.Persistency assumptions have also been strengthened, offset bycapitalisation of future waiver of premium business profits, whichwas previously not valued. The drop in value of new business wasanother cause of the lower EV adjusted operating profit in 2007compared to 2006.
Continued growth in banking business and increased focus Both deposit and loan books at SkandiaBanken continued toincrease in 2007. The growth in loans has slowed down, but thenet interest margin was maintained at prior-year levels, despite stiffcompetition. Lending increased to SEK52.7 billion, up 20% on2006, mainly due to good growth in Norway in both mortgagelending and car financing. The number of customers increased by 3% over 2006. SkandiaBanken’s operating profit for 2007 was SEK191 million, 31% higher than 2006.
During 2007, SkandiaBanken started a major shift in strategicdirection to focus on a broader range of long-term savings andclient offerings. In October we announced the sale ofSkandiaBanken Bilfinans, the vehicle finance business, to DnBNOR. The total book profit expected to be realised is SEK1 billion.The Danish banking operations were also sold during the thirdquarter of 2007 to strengthen profitability and to bring focus to the remaining businesses.
Sales performance improvingLife sales on an APE basis exceeded the prior year by 3%. Thenegative sales trend experienced in the first half of 2007 wasfinally reversed in the third quarter and continued to improvesignificantly during the fourth quarter with a consequentturnaround in market share. The unit-linked business in Denmark also contributed to this turnaround with a strong salesperformance. The improvement achieved in Sweden was the resultof broadening the product and fund ranges and a refocus of our sales initiatives through our tied sales force (up 47% comparingthe fourth quarter of 2007 to the fourth quarter of 2006) and thebroker channel (up 15% comparing the fourth quarter of 2007 tothe fourth quarter of 2006). The tied sales force performance wasdriven by a greater focus on unit-linked products. From 1 February2007 the tax advantages of the Swedish Kapitalpension productwere removed following a change in regulations. This negativelyimpacted sales as Kapitalpension products accounted for 10% of sales in 2006.
Margins under pressure in the short termLife new business margin was down from an exceptional 27% in2006 to 13% in 2007. The decline can be attributed to a changein arrangements between Skandia AB and Skandia Liv (the Liv-Link agreement), the strengthened lapse assumptions, loweredcharges (due to market competition), and a change in businessmix in Sweden, particularly since Kapitalpension product taxadvantages were removed.
In the medium term, the new business margin is expected toimprove to reach the high teens. This will be achieved throughcontinued growth in sales leading to economies of scale, productdevelopment and the introduction of a new more cost-efficient IT platform and other expense-led initiatives. During 2007,investment in IT commenced with the development of the new Investment Portfolio system, which enables an enhancedproduct offering.
Perf
orm
ance

Old Mutual plc Annual Report and Accounts 2007Directors’ report – Business review34
Putting the business on a sound footing for the future The focus during the year was on improving operational efficiencyand marketing activities and these efforts will be continuing in2008. The investment programme and restructuring activitieswithin Nordic reduced IFRS adjusted operating profit for the year by SEK81 million. However, we strengthened the savings offeringduring 2007 by widening the fund range of both Skandia AB andSkandiaBanken. The unit-linked products have been improved,with several new product offerings introduced during 2007 andfurther improvement underway.
Market environment and outlookThe Nordic economic environment was turbulent during the year,with increased inflation rates and a volatile equity market thatdelivered a negative performance in 2007. During the year, interestrates increased, albeit from low levels. This environment helpedincrease volumes in the banking business, but at the same timealso increased pressure on interest margins.
In future years, the Nordic savings market is likely to be affected by a number of legislative changes that will affect tax neutralitybetween savings with and without an insurance wrapper, transfer rights, market competition and collective pensions agreements. The new pensions agreement is likely to bring an increased level of uncertainty about further development of the corporate segmentamong brokers, employers and insurance companies. However,with a full range of product offerings – traditional life, unit-linked,banking, financial advisory, mutual funds and healthcare –Skandia Nordic is well positioned to respond to any changes thatdo come about.
Group Finance Director’s reportcontinued
There is a growing need for intelligent savings solutions in theNordic savings market. With the introduction of a new statepension (PPM) in 1999 as a starting point, public social securitysystems are now gradually changing. There is also a continuingtrend to reduce the positive tax discrimination of insurances therebyreducing the incentive to save through insurance vehicles. Thesetax incentives have been a critical component in the privateproduct offering. Transfer rights will be reinstated on the Swedishmarket on 1 May 2008, which will also impact the existingbusiness, both in the private and corporate segment.
In 2006 a new ITP agreement was finalised, resulting in a pure‘tick-the-box’ solution. The ITP agreement is a collective agreementfor corporate pension savings for white-collar workers and includesapproximately 700,000 salaried employees within the privatesector. Strong focus on price pressure and collectively agreedsolutions from the labour market parties in designing the newagreement have led to exclusion of all financial advisory servicesfrom external parties such as brokers or other advisers. Brokers andinsurance providers are looking to shift their attention to solutionsoutside the collective agreements. Fierce competition, resultingfrom these changes is forcing Swedish brokers to shift their focus to individuals and investment returns. Brokers will now refocus on the individual segment with a more holistic advisory approachand strengthen their presence within small and medium-sizedcompanies. To succeed, brokers are demanding improved advisorytools, with a core focus on financial allocation and expandedinvestment product ranges from insurance companies.
Skandia will strengthen its position with a strong investment offeringaimed at delivering market-leading returns. These will be offeredboth with and without an insurance wrapper for individuals throughdirect, advised external and internal channels. Within the corporatesegment an alternative to the collective agreements targetingcorporate clients is key to success. This offering will consist of lifeassurance, health insurance and transaction services, among otherthings. The increased focus on savings, investment returns andopen architecture gives Skandia an excellent opportunity to capitalisefurther on its banking platform to target the individual market.
An award-winning GroupELAM, AustriaFONDS Professionell Service Award
CategoryService
Award3rd Place

Old Mutual plc Annual Report and Accounts 2007Directors’ report – Business review 35
Europe and Latin America (ELAM)Our Europe and Latin America division (ELAM) is a high-growthbusiness providing market-leading long-term savings products,both unit-linked and mutual funds, through open-architectureplatforms. We continue to implement our strategy as we focus on growing each business to scale and increased profit in the 13 markets in which we operate. Our approach is one of stronglocal focus, while benefitting from the combined scale of the Old Mutual Group, through cost containment and revenue-enhancing activities.
Business profileELAM has operations in ten European countries (Germany, Austria, Italy, Spain, Switzerland, France, Poland, Portugal, the Czech Republic and Hungary) and three Latin Americancountries (Colombia, Mexico and Chile), while our portfolio alsoincludes two asset management businesses, Palladyne (whichoperates in the Netherlands and the Middle East and North Africaregions) and Skandia Global Funds (which operates in Asia, Latin America and Europe).
We are a niche player in the long-term savings market in these countries and our positioning is based on service levels and innovation.
The entrepreneurial approach and leadership style has seen thebusiness achieve strong growth since start-up in the late 1990s,with increased momentum over the last four years. Our businessesare in different phases of maturity, from true start-ups (Portugal and Chile) to more mature businesses (Germany and Colombia).The management challenges are therefore diverse and reflect theneeds and environments of each business.
In Europe there is a strong dominance of unit-linked life productsdistributed via IFAs as well as via sales organisations and networks,while in Latin America most of the business is focused onindividual and corporate pension savings, distributed via Skandia’stied financial planners. We follow a segmentation approach todistribution, understanding that each of these distribution channelshas different needs, objectives and drivers.
Our client base consists largely of mid-to-high income retail clients in various life stages who are saving on a long-term basis.In addition, we also have a base of corporate clients through our pensions business. Our aim is to focus continuously onunderstanding our client base in order to provide products that fit its needs.
Individuals in Nordic countries are mature internet users comparedto most other European countries. Since the end of the 1990s,Nordic countries have been at the forefront of internet usage and in2007 the trend was stronger than ever, with the number ofservices being placed on the internet increasing. Skandia’s bankplatform will pave the way for Skandia Nordic to offer products withand without an insurance wrapper both direct and to brokers andis thus a key component in Skandia Nordic’s future success.
The increasing demand for advice and self-directed solutions,combined with strong growth in the individual market, are themajor business opportunities that Skandia Nordic will focus on in the coming years. This approach includes a transition from thecurrent position as a product supplier mainly offering insuranceproducts to becoming a financial solutions provider.
The key focus going forward is building an offering which providesboth end customers and distributors with advisory tools and topquality advice, innovative products, top-quartile returns and themarket’s best client service. There are strong synergies in terms ofscale, brand and cross-selling and administration. The second halfof 2007 marked a watershed for Skandia Nordic, particularly inSweden, with renewed optimism founded on the appointment of a new Chief Executive, Bertie Hult, sales increases, productlaunches and much improved relations with Skandia Liv, themedia and customers.
Risk managementFinancial market riskThe unit-linked business model transfers most of the financialmarket risk to the policyholder and guarantees are low. However,the risks for Skandia consist of lower asset-based fees, lowerretrocessions and lower new sales due to market sentiment. Oneway of managing this risk has been the introduction of the newcommission model that is designed to reward policy persistency.
Perf
orm
ance
Skandia Life Time, AustriaCampaign promoting Skandia’s new flagship product within our unit-linked offering in Austria. The maincharacteristic of “Skandia Life Time” is its flexibility where different elementsof the policy can be adapted accordingto various stages of the customer’s life.

Old Mutual plc Annual Report and Accounts 2007Directors’ report – Business review36
Unit-linkedOur product offerings include a wide range of funds in various asset classes. All funds are managed externally, with managersselected and their performance tracked by Skandia, using our “4P”(Philosophy, Process, People, Performance) process. We provideasset allocation through our managed funds in line with clients’ risk profiles.
Unit-linked is sold both as regular premium products with optionaltop-ups (for example in Austria, Germany and Poland) and assingle premium products (for example in France and Italy), basedon demand factors. Regular premium products create a steady flowof lower-value premium amounts with a high embedded value,while single premium products create larger, albeit more volatile,net client cash flows.
Mutual fundsThe mutual funds business is similar in approach to the unit-linked business, with product development undertaken Skandia and fund management occurring externally. The mutual fundsbusiness includes long-term pension business, which is similar to unit-linked in principle, but without an insurance wrapper. In addition, we offer medium-term savings products to complementthe offering.
Performance during 2007
Pro forma1
Highlights (€m) 2007 2006 % change
IFRS adjusted operating profit (pre-tax) 43 42 2%EV adjusted operating profit
(covered business) (pre-tax) 48 121 (60%)Life assurance sales (APE) 276 252 10%Mutual fund sales 3,071 2,188 40%Value of new business (post-tax) 54 52 4%New business margin (post-tax) 20% 21%Present value of new business premiums 2,139 2,062 4%Net client cash flows (€bn) 1.8 1.7 6%Funds under management (€bn) 13.0 10.8 20%
1 The 2006 numbers are restated on a pro-forma basis assuming ownership for 12 months and exclude the Skandia Vida business sold in 2007, except EVadjusted operating profit, which includes Vida.
Group Finance Director’s reportcontinued
Funds under management growing significantlyNet client cash flows during the year represented 17% of openingfunds under management, or 23% of opening funds undermanagement when adjusted for the divestiture of the Spanishinstitutional business, reflecting the continued growth of thebusiness. Market movements for ELAM were positive for the first six months of the year, but experienced a downturn in thesecond half of the year following market trends across the world, to end the year broadly flat. Despite the market volatility created by the sub-prime mortgage crisis and credit crunch, as well as theclosure of the Spanish institutional asset management business(which resulted in a €0.6 billion reduction in net client cash flowsagainst 2006), funds under management increased 20% from the start of the year as a result of strong inflows.
Continuing growth in life sales (APE)2007 was generally a tougher year for sales than 2006 in themajority of the ELAM countries. In many of the markets, unit-linked sales slowed down, recording negative net cash flows, andthe tax-driven incentives which positively impacted some of themarkets in 2006 were not repeated in 2007. Life sales on an APEbasis rose 10% over the prior year, with strong growth in regularpremium sales in Central Europe, partially offset by lower singlepremium sales in Southern Europe. Overall, we are satisfied withthe progress that the business made in the ELAM territories, withincreased market share evident in the majority of instances.
Mutual fund sales up strongly and margins improvedMutual fund sales were up 40% over 2006, with strongcontributions from our discretionary asset manager, Skandia Global Funds, and from Palladyne. Our Latin American pensionsbusiness performed well, supplemented by strong institutionalinflows. Average margins on mutual fund business improved asfunds placed in the low-margin institutional asset managementbusiness in Spain were replaced by funds in the higher margindiscretionary asset management and long-term businesses. Thisled to a significantly improved adjusted operating result for themutual fund portion of the business.
Value of new business increasing with profit margins exceeding the target range at 20%The value of new business for the year was up slightly against theprior year. The post-tax new business margin of 20% achieved forthe year exceeded the medium-term target range of 16-18%.During 2007, we reduced our margins on key products to maintainour competitive position and we expect that pricing pressure willcontinue in the future.
An award-winning GroupELAM, SpainExpansion’s Fund Portfolio competition
CategoryFund Portfolio Management
AwardFirst place in the two categoriesAggressive and Conservative

Old Mutual plc Annual Report and Accounts 2007Directors’ report – Business review 37
The last 12 months have seen significant market volatility with falls in the first, third and fourth quarters of 2007, interspersedwith upward creep. Impacts to the US and global economy arelikely to continue to cause uncertainty among investors.
As far as distribution is concerned, the European IFA marketcontinues to increase in relative importance, generally at theexpense of tied sales forces. Proof of our business model is seenthrough traditional life insurance providers increasing focus onindependently-advised offerings.
We continue to work on increasing transparency for customers,while implementing updated regulatory requirements as they areintroduced, such as the Insurance Contract Law in Germany andthe Markets in Financial Instruments Directive throughout Europe.
ELAM continues to be well placed to achieve further growth, as evidenced by rising market shares in most of the countries inwhich we operate. Product development and innovation remain at the heart of our offering, with close to 40 new products andproduct enhancements launched during 2007. Early indicationsare that innovative major new product launches in Austria andSwitzerland have been well received in their local markets.
Our positioning of independently-advised, open-architectureprovider in the long-term savings market remains valid, with our chosen market continuing to grow. This should result in furtherpositive market development over the medium term.
In the short term, our outlook remains cautious as the effects of the sub-prime mortgage crisis and the credit crunch plays out in the market.
Risk managementFinancial markets riskThe unit-linked and mutual fund business model transfers most of the financial market risk and reward to the policyholder. Whilethis is our favoured model, some guarantees are offered, generallymanaged by external providers. Our risk mainly lies in lower asset-based fees, lower retrocession and lower new sales or surrendersdue to market sentiment. ELAM's response to this risk lies inoffering innovative and flexible products as well as investmentoptions and asset allocation tools, to suit different demandpatterns, thereby ensuring lower volatility in revenue streams.
Continued strong underlying adjusted operating profit resultIFRS adjusted operating profit was in line with 2006, with theresults for 2007 being constrained by costs of €7 million that wereincurred to realise synergies. Growth was driven by the larger in-force book of business and by healthy net client cash flows. As a consequence, fund-based fees were up on the prior year,while premium-based fees were at approximately the same level.
Poland has grown strongly over the last 18 months and was asignificant contributor to both new sales and ELAM’s overall result.This reflects the efforts put into this business over recent years,with particular emphasis on growing distribution. In our Italianbusiness, we renegotiated commercial terms with key distributorgroups in order to secure the business model for the future.Colombia performed well in very difficult market conditions,growing market share considerably, while new business sales in Mexico increased markedly on the back of an increase in thefinancial planner distribution force.
EV adjusted operating profit impacted by assumption changesEV adjusted operating profit was impacted by three main itemsduring the year. Firstly, net unfavourable assumption changes of€70 million were recorded in 2007. As reported during the year,we reassessed the operating assumptions in Italy, in particular thesurrender assumptions, following unexpected surrender experienceduring the first half of the year. This review resulted in anadjustment to EV adjusted operating profit of €49 million, andchanges to persistency assumptions in other countries were alsoundertaken that contributed further to a net unfavourable impact.Secondly, there were changes to divisional overhead capitalisationduring 2007 following the changes made to the operatingstructures within Skandia since the acquisition. Finally, the currentyear EV adjusted operating profit result was positively impacted by changes to the tax rate in Germany.
Market environment and outlookIn Europe, ageing populations are placing strain on the publicpension system, which provides strong opportunities for personallong-term savings. At the same time, there is a transfer of wealth to the next generation that creates further opportunities as peoplehave surplus funds to invest. While market and governmentpension reforms are increasing the need for private savings, thereare strong indications that tax benefits associated with long-termsavings will decrease over time. The Latin American economiescontinue to grow and the additional personal income that thisgenerates provides a strong opportunity for long-term savings.
Perf
orm
ance
Skandia Green, ColombiaThis internal advert to our tied salesforce relates to the launch of theinnovative investment productSkandia Green in Colombia. It encourages the sales force tobring their clients to the “SkandiaGreen Lounge” in Skandia’s officein Bogotá in order to present them the new product in an exclusiveand green environment.

Old Mutual plc Annual Report and Accounts 2007Directors’ report – Business review38
Group Finance Director’s reportcontinued
Old Mutual South Africa (OMSA)Business profileOMSA’s financial services business, comprising life and assetmanagement operations, has at its core one of the largest advice-based distribution capabilities in the South African industry. Thisuses a combination of tied agents, independent financial advisers,bank broker distribution, corporate advisers and direct distributionto ensure that the business is accessible to a full spectrum ofpotential clients. OMSA’s investment and risk products, as well as its strong links with other Group companies, position thebusiness to meet a full array of client needs.
The business is supported by strong branding and a provenreputation for providing competitive long-term returns to customers.The Old Mutual brand enjoys a very high level of awareness, trustand loyalty among South African consumers across all marketsegments. Historically the most powerful life assurance brand inthe country, it is now increasingly perceived as a leading savingsand investment brand.
The breadth of this business, incorporating life, health anddisability assurance, and investment and asset management in the retail, corporate and institutional markets, positions us well to extract value from our large number of well established clientrelationships in these sectors. Through the productive and growingtied distribution force in the high-, middle- and low-incomemarkets, as well as through its relationships with independentbrokers, OMSA is well positioned for future growth.
Retail businessOur Retail business covers both the Affluent Market and the MassMarket (formerly Group Schemes), offering life, disability andhealth insurance, retirement annuities, savings and investmentproducts. We distribute our products through independent brokers(IFAs), bank brokers, tied distribution (personal financial advisersfor the Retail Affluent segment and salaried sales force for the Retail Mass segment), a direct distribution channel, bank brokersand other retail partnerships. Our distribution through bankfinancial advisers and staff within Nedbank constitutes animportant channel.
Our key Retail product offerings include Greenlight, a flexible andcomprehensive range of life, disability, and future-needs cover.Flexible healthcare schemes for individuals are offered under theOxygen brand. A range of retirement savings plans, annuities,investment and income products are provided through differentwrappers – which include the Max, Investments Frontiers andGalaxy product ranges. Our customers in the Mass segment areoffered savings, retirement and funeral cover products.
An award-winning GroupOld Mutual South AfricaSunday Times Top Brands 2007
CategoryLong-Term Insurance
AwardWinner
Southern Africa
Highlights
> Launch of the Masisizane Trust
> Nedbank financial targets delivered
> Launch of the boutique structure, transition complete
Funds under management
£41.7bnFunds under managementas percentage of Group
15%Growth in funds undermanagement
4%

Old Mutual plc Annual Report and Accounts 2007Directors’ report – Business review 39
The investment boutiques provide a range of investmentcapabilities designed to meet the various needs of customers.
They include:
> a number of specialist equity and fixed-interest boutiques;> an index-tracker capability in Umbono Fund Managers;> a multi-manager capability through SYmmETRY, which creates
portfolios for institutional investors blending best of breed assetmanagers across multiple asset classes, using sophisticatedportfolio construction methods. The portfolios aim to maximisereturns while controlling risk and diversifying managers;
> Old Mutual Property Group, which provides propertymanagement and property-related asset management serviceswithin OMSA; and
> Old Mutual Specialised Finance (OMSFIN), which is active in corporate advisory, corporate lending, securities lending and structured products.
Client serviceWe run a single back office to provide technology, administrationand client service to all market segments. We continue to drive costs lower and service levels higher as we adopt LEANmanufacturing approaches to process re-engineering and exploittechnology. Unit costs are being driven lower in real terms and for the Retail markets are lower than local and internationalbenchmarks. Corporate unit costs are also being driven downaggressively in anticipation of future retirement fund reformlegislation requirements. An increasing number of clients and mostintermediaries are being serviced via the internet and call centres,although we have maintained a large national branch network.
Corporate CitizenshipOld Mutual has reported its “triple bottom line” in South Africathrough its Corporate Citizenship Report since 2001. In 2007, oursocial investment programme was boosted significantly by thelaunch of a number of new initiatives aimed at supporting smalland medium enterprises, and delivery of infrastructure.
In line with international trends and the need to ensure productsare appropriate for today’s environment, a key feature of morerecent investment and savings products is significantly lowercharges (and capital requirements) and increased flexibility.
Our investment offering is open-architecture, but Old Mutualmanaged funds form a large part of the underlying assets managed on behalf of retail customers.
Corporate businessOur Corporate business sells investment, retirement, insurance and structured products, and advisory services to corporate,institutional and parastatal customers. Under a life wrapper, weprovide underwritten investment products for retirement funds, andgroup life and disability insurance to retirement funds establishedby employers for the benefit of their employees and by trade unionsfor the benefit of their members.
Group assurance products provide life cover to employees in theevent of death, funeral cover and funeral support services and a full range of disability solutions.
Investment products are customised depending on the investor’srequirements. These include smoothed bonus portfolios, absolutereturn portfolios, structured solutions and annuity products, as wellas third-party asset management. We offer other multi-managedasset management solutions and administer a range of retirementschemes for corporates and umbrella arrangements. Many of theseschemes are defined contribution and open architecture.
Asset managementIn response to the changing factors driving investment successworldwide, and in particular the demand for core and specialistasset management capabilities, Old Mutual Asset Managers (South Africa) was restructured in January 2007 into a new multi-boutique model under the renamed Old Mutual InvestmentGroup (South Africa) (OMIGSA). This follows the success of thesame model in Old Mutual’s US Asset Management business. We believe this will assist us in delivering improved investmentperformance to customers and in gathering assets. In addition,links to Group businesses outside South Africa enable OMIGSA to offer international investment services to the corporate andinstitutional markets.
Perf
orm
ance
Old Mutual South AfricaOMSA launched its new brand line“Invest in your success” reflecting thefundamental change in strategy andphilosophy implemented by thebusiness over the past few years.

Old Mutual plc Annual Report and Accounts 2007Directors’ report – Business review40
Performance during 2007
Highlights (Rm) 2007 2006 % change
Long-term business adjusted operating profit 3,082 3,077 –
Asset management adjusted operating profit 946 874 8%
Long-term investment return (LTIR) 2,988 1,773 69%
IFRS adjusted operating profit 7,016 5,724 23%
Return on Allocated Capital 24% 23%EV adjusted operating profit
(covered business) 4,769 5,752 (17%)EV (covered business) 34,678 33,274 4%Return on EV (covered business) 11.2% 13.5%Life assurance sales (APE) 4,699 4,416 6%Unit trust sales 15,547 14,833 5%Value of new business (post-tax) 756 781 (3%)APE margin (post-tax) 16% 18%Present value of new business premiums 31,380 30,004 5%Net client cash flows (Rbn) (18.7) (29.1) 36%SA client funds under
management (Rbn) 445 424 5%
OMSA net client cash flows remained a challenge in 2007,primarily due to net outflows from institutional clients, notably fromtwo multi-managers, following changes of portfolio managers andconcerns about short-term performance in 2006. Inflows werelower as consultants and investors adopted a “wait and see”approach because of uncertainty over the implications of the newboutique structure on performance. Investment performance for2007 remained disappointing, with figures for the year showing24% of funds outperforming benchmarks and achievement of the positions four and six in the Alexander Forbes Large ManagerWatch over one and three years respectively. We deliberately took defensive positions in most portfolios in 2007 anticipating a market correction and this cost us performance for the year.
Group Finance Director’s reportcontinued
Life sales on an APE basis increased by 6% over 2006. Recurring premium sales grew strongly, up 14% on the back of an increased sales force in the Retail Mass Market business as well as competitive risk product and credit life sales in the RetailAffluent market. Life single premium sales were down 7% on 2006primarily due to competitor margin pressure, and also, because we had a significant deal in our SYmmETRY multi-managerbusiness at the end of 2006 which was non-recurring. The launchof the Absolute Return Fund and enhancements to the fixed bondrates on the lnvestment Frontiers product at mid-year helpedimprove sales in the second half of the year. We continued to gainmarket share in the Life retail sector.
Unit trust sales were up after including sales through MarriottIncome Specialists (Marriott) for the full year in 2007. ExcludingMarriott, sales were down 10% on 2006 because of residualconcerns over portfolio manager changes and short-terminvestment performance on certain core funds (Dynamic Floorand Enhanced Income Funds). The new Stable Growth Fundwas launched in July 2007 and has had good early sales.
IFRS adjusted operating profit was 23% higher than in 2006.Within this result, our long-term business adjusted operating profitincreased marginally and the LTIR increased 69% after changes in calculation method to recognise the value of the shareholders’funds and the higher asset base more appropriately. The marginalincrease in long-term business profit was a result of a continuedswitch to less capital-intensive, lower margin products. Positivecontributions arose from an increase in the average level ofpolicyholders’ funds under management, driven by higher marketlevels and a significantly lower IFRS 2 share-based paymentscharge. These were offset by an increase in the investmentguarantee reserve, which resulted from the adoption of a market-consistent basis for the valuation of these reserves as well as theapplication of a discretionary margin.
Asset management adjusted operating profit was up 8% due tohigher market levels. The good returns achieved also led to a goodflow of performance-related fees, and higher property profits afterthe first full-year contribution from Marriott. However, the profitgrowth was tempered by additional advertising costs associatedwith the launch of the new boutique structure in OMIGSA, a reviewof incentive levels for fund managers and loss of fee income as a result of the withdrawal of client funds.
An award-winning GroupOld Mutual South AfricaAlexander Forbes Asset Consultants’Multi-manager survey
CategorySYmmETRY produced the best returns in all the equity brands in which itcompeted over three years in the fixed asset allocation category
AwardWinner

Old Mutual South AfricaArelia, a client story that was used as part of the OMSA’s “Invest in yoursuccess” campaign. Arelia used her policy to invest in her business.
Old Mutual plc Annual Report and Accounts 2007Directors’ report – Business review 41
In 2007, we continued innovating and delivering financial solutionsrelevant to our customers. In October we launched the DomesticWorkers Fund, in collaboration with the Presidential Working Groupon Women, a fund targeted at extending retirement provisioningand risk benefits for domestic workers. In November we launchedPay-When-You-Can, an innovative flexible premium funeral productfor the entry-level market, in Shoprite stores nationwide. In Decemberwe launched Zimele-compliant funeral plans (contributing toFinancial Sector Charter scores), which also address the need foraffordable products for the previously untapped entry-level market.
Retail Affluent
(Rm) 2007 2006 % change
Life sales (APE) Savings 1,321 1,278 3%Protection 1,056 897 18%Annuity 197 193 2%
Total 2,574 2,368 9%
Life sales (APE)Single 868 838 4%Recurring 1,706 1,530 12%
Non-life sales1 1,821 1,949 (7%)Life VNB 330 289 14%Life APE margin (post-tax) 13% 12%Net client cash flow (Rbn) (2.7) 0.9
1 Includes non-life flows in respect of OMUT, Galaxy and Linked Investment ServiceProvider (LISP) sales on an APE basis.
Life recurring premium sales were 11% higher than for the prior year,driven by continued good sales of risk business, leveraged fromenhancements to our Greenlight risk product range (17% higher)and good credit life sales (26% higher), reflecting the extension of personal credit through Nedbank. Recurring premium Max Investment savings business (both life and non-life wrappers)performed well, ending the year up 17% with significant growth(62%) in the non-life recurring option, but from a relatively low base.
We declared strong bonuses in February 2008 on many of ourwith-profits products in spite of market volatility in early 2008. This reflects the good returns these products have generated. Our portfolios’ bonus smoothing accounts remain in very strongpositions following these strong bonus declarations.
Embedded Value (EV) was impacted by net capital transfers to Old Mutual plc of R5.9 billion during the year. Excluding thesecapital transfers, EV increased by 22% over the year and waspositively impacted by market levels. However, the EV adjustedoperating profit is lower than in 2006 because the prior year profitwas boosted by the recalibration of the risk margin in the discountrate of R1,093 million (R711 million post-tax), while the 2007profit was reduced by a substantial increase in the investmentguarantee reserve to reflect the use of a market-consistentmethodology, the switch to lower margin business of certain liabilities(which has resulted in lower capital requirements and improvedROC), and the reduction of certain margins in the Corporatesegment aimed at providing better value for our customers.
Retail Mass Market
(Rm) 2007 2006 % change
Life sales (APE)Savings 613 476 29%Protection 477 411 16%
Total 1,090 887 23%
Life VNB 322 263 22%Life APE margin (post-tax) 30% 30%Net client cash flow (Rbn) 1.9 1.7 12%
Retail Mass Market sales were up 23% on 2006. This resultreflects the continued focus on growing the sales force, which at 31 December 2007 was 11% higher than at the beginning ofthe year. Excellent growth was also achieved in sales through thebroker channel, which were up 106% on the prior year. There was,however, a small swing to lower-margin savings business.
VNB was 22% higher than 2006, with the new business APE margin constant at 30%, the latter benefitting from improvedburial society results and a lower secondary tax on companiesoffset by an increase in the proportion of low-margin savingsbusiness. We responded to the shift in mix and the lower marginson savings business following the Statement of Intent, which setsminimum standards for surrender and paid-up values, byimplementing changes to adviser remuneration and increasingminimum premiums for savings business. This had a negligibleimpact on mix, but did improve the profitability of the savingsbusiness slightly.
Perf
orm
ance

An award-winning GroupOld Mutual Investment GroupProperty Investments (OMIGPI)Golden Arrow Awards 2007
CategoryProfessional Management Review
AwardBest Shopping Centre 2007
Old Mutual plc Annual Report and Accounts 2007Directors’ report – Business review42
Single premium life sales were 4% up on 2006. Single premiuminvestment sales were flat as a result of perceptions about OMIGSArestructuring, key staff losses and OMIGSA investment performancein some of the flagship funds, principally our Dynamic Floor andEnhanced Income funds. These effects were offset by improvedinvestment performance, the new Absolute Return Fund launchand enhancements to the fixed bond rates of the life product. In thelast quarter there were large non-recurring inflows into the privateequity fund of Investment Frontiers. Single premium sales of theoffshore investment product through Old Mutual Internationalcontinued to accelerate and were 56% up over 2006.
Life VNB was 14% higher than 2006, with the new business APE margin improving from 12% to 13%. The biggest driver of theimprovement was the impact of increased volumes, particularly onthe recurring premium book on the absorption of initial distributioncosts, both at a product level and in the distribution channels.
Bancassurance sales through Nedbank continued to grow and wereup 16% over 2006. The launch of a new, low cost, simple savingsproduct through Nedbank branches was very well received. Creditlife sales slowed following the introduction of the National CreditAct, but were offset by the new savings and risk product flows.
Corporate Segment
(Rm) 2007 2006 % change
Life sales (APE) Savings 597 629 (5%)Protection 145 99 46%Annuity 111 193 (42%)Healthcare 183 239 (23%)
Total 1,036 1,160 (11%)
Life sales (APE) Single 644 788 (18%)Recurring 392 372 5%
Non-life sales2 755 1,678 (55%)Life VNB 104 229 (55%)APE margin (post-tax) 10% 20%Net client cash flows (Rbn)3 (17.9) (31.7) 44%
2 Includes non-life sales in respect of OMIGSA and Old Mutual Properties on an APE basis.
3 Includes net client cash flows for OMIGSA.
Group Finance Director’s reportcontinued
Net client cash flows in the Corporate market, although still strongly negative, were less severe than in 2006, and EmployeeBenefits net client cash flow was significantly better than in 2006.Termination experience, in particular, was very good and theimpacts of the launch of the Absolute Growth Portfolios, as well as strong bonuses, were factors in this regard. Net client cash flowsat OMIGSA were adversely affected by withdrawals following theloss of two key portfolio managers, clients switching from core and balanced mandates and residual concerns about short-termperformance in 2006.
Total Corporate sales were lower than in 2006, driven by lowersales of SYmmETRY (which had a very large deal in 2006),Annuities and Healthcare. There was strong performance in thesecond half of 2007 in the Guaranteed Products, where the launchof the Absolute Growth Portfolios was successful and has started to attract good new sales. Risk sales were also strong in 2007compared to the prior year. Although Annuity sales were lower thanin 2006, the pipeline for 2008 is strong and business was securedat the end of 2007 that should flow through in 2008.
Healthcare sales were below 2006 due to a declining market, withgovernment employees moving to GEMS, and a somewhat reducedfocus on Oxygen within the distribution channels. Appointmentshave been made to drive the distribution of Healthcare moreeffectively, especially in the Retail distribution channels.
The decrease in new business margins and VNB relative to 2006was mainly a result of a reduction in the Platinum Pensions 2003capital charge which was made so as to offer better value tocustomers and drive future sales, as well as lower volumes of high-margin annuity business towards smoothed bonus products. Lowersales volume in SYmmETRY and Healthcare also contributed. Thishad a knock-on effect, reducing the overall life new business margin.

Old Mutual plc Annual Report and Accounts 2007Directors’ report – Business review 43
In 2007, half of the key unit trust funds, representing 69% of unittrust assets, were first and second quartile performers over oneyear, 69% were first and second quartile over three years and 64% over five years to the end of December 2007.
The boutiques with the most notable performance for the threeyears ending 2007 were the Absolute Return, Macro StrategyInvestments, Fixed Income and Select Equity boutiques, with100%, 99%, 95% and 76% respectively of their funds undermanagement beating their benchmarks.
During the year, Marriott Income Specialists launched the MarriottInternational Income Growth Fund, OMIGSA Property launchedTriangle, an industry-defining direct property fund, Umbono FundManagers launched the RAFI 40 Index Fund and OMUT launchedits Stable Growth Funds.
Market environment and outlookDespite recent inflationary pressures, a tightening of monetarypolicy and the current electricity shortage, the South Africaneconomy remains robust, with prudent fiscal management andinvestment in infrastructure ensuring a continuation of the growthexperienced in the past few years. This economic growth continuesto drive demand for financial products, particularly those withexposure to the market rather than traditional smoothed bonusinvestments. However, the overall savings rate in South Africaremains low, with an increasing proportion of savings beingchannelled into non-financial investment vehicles such asresidential property. This increases the competitive pressuresbetween market participants.
The distribution of economic growth is also fuelling growth in theemerging middle and lower income market segments. OMSAcontinues to focus on improving the value offered to customers and the overall customer experience to meet the needs of theseemerging segments. Its market-leading position in the middle and lower income market through its Retail Mass Market divisionmakes it well placed to grow in this market segment.
OMSA is also working proactively with intermediaries to helptransition them through the significant changes in commissionregulations expected to come into effect during 2008.
Old Mutual Investment Group South Africa (OMIGSA)
Sources of FUM (Rbn) 2007 2006 % change
Life 319 283 13%Unit trusts 48 40 20%Third party 88 95 (7%)
Total OMIGSA managed assets 455 418 9%
Managed by external fund managers 34 30 13%
Total OMSA FUM 489 448 9%
Less: managed by Group companies for OMSA (44) (24) (83%)
Total OMSA client funds managed in SA 445 424 5%
The implementation of the boutique structure in OMIGSA was a keyfeature of 2007. We continue to focus on stabilising the structureand increasing investors’ confidence in individual boutiqueinvestment philosophies.
Non-life sales (OMIGSA) were significantly lower than the prior yearas a result of the non-repetition of two very large deals in the firsthalf of 2006 (R11.1 billion), and the smaller pipeline at the start of 2007. The investor and consultant concerns relating to OMIGSA’srestructuring into a multi-boutique business and some areas ofinvestment performance also contributed to lower sales. These have,however, started to improve.
2007 ended on a highly volatile note as the unravelling global sub-prime crisis dented investor confidence and global financialmarkets. Against this uncertain backdrop, the investmentperformance across our different boutiques was satisfactory.Although three-year performance slipped as poorer short-termequity performance fed through to the longer-term performancenumbers, we had anticipated a market correction and generally theportfolios were defensively positioned. Overall, just over half of thefunds outperformed their benchmarks over one and three yearsrespectively to the end of December. For the peer cognisantinstitutional funds, 45% and 9% of mandates were above theindustry median over one and three years respectively. More thanhalf of institutional mandates outperformed their benchmarks overthese same periods. The Macro Strategy Investments boutique’sProfile Balanced Fund was ranked fourth over one year, sixth overthree years and third over five years ended 31 December 2007 in the Alexander Forbes Global Large Manager Watch survey.
ResearchOld Mutual Investment Group SouthAfrica’s advertising campaign wasdesigned to communicate its philosophyof Performance through Focus.
Perf
orm
ance

Old Mutual plc Annual Report and Accounts 2007Directors’ report – Business review44
The long-term outlook for savings and wealth management in South Africa remains positive, with the following points as key contributors:
> prudent fiscal and monetary policy is expected to return theeconomy to a robust growth path in the latter half of 2008;
> continued growth of black middle class and affluent marketsarising from a growing economy and Black EconomicEmpowerment efforts;
> Government is formulating policy that would create a frameworkfor mandatory retirement savings;
> strong growth in household incomes, enabling more people to start or increase savings for retirement;
> improvements in financial education and transparency offinancial products enhancing accessibility.
In the short term, a slowdown in growth rates of both the economyand disposable incomes is expected as monetary policy istightened to contain inflationary pressures and as global economicgrowth slows. Increased competition is expected for the flows intothe market, and also for existing assets, especially for retirementannuities that have been transferable between funds from October2007. In this environment distribution, superior investmentperformance and coverage of all asset classes will be crucial forsuccess. Old Mutual is well placed to compete in this environmentwith our investment boutiques continuing to grow and the coverageof asset classes increasing, and we have the ability to leverage our large distribution network to deliver financial solutions to our advantage.
Risk managementLife Assurance OMSA’s overriding business objective is to create long-termcustomer and shareholder value. The business is actively focusedon enterprise-wide risk management to take on agreed levels of risk and to mitigate risk outside agreed limits wherever possible.
OMSA operates a risk management framework that contains a robust risk governance structure, group-wide risk policies andmethodologies that focus on identification, assessment, response,action and control plans, and the monitoring and reporting of risks.
Group Finance Director’s reportcontinued
The potential impact of HIV/AIDS is well managed in respect oflives assured, as demonstrated by the positive mortality experiencevariances that have been achieved as a consequence of prudentrisk selection and product pricing. This is despite the highprevalence of infection within the general population. The businessconducts HIV and other tests for voluntary cover above certainlevels and, where there is no testing, generally has the ability to reprice regularly should experience be different to assumptions.Based on the models currently in use, calibrated against observed experience, it is believed that the prevalence of infectionhas peaked.
In line with other life assurers, OMSA manages underwriting riskthrough strictly controlled underwriting principles governingproduct-pricing procedures, which take appropriate account ofactual and prospective mortality, morbidity and expense experience.
Certain products are underpinned by minimum guaranteedinvestment returns. Guaranteed annuity options were alsopreviously offered on a book that is now closed to new business.The cost of minimum investment guarantees increases wheninvestment markets decline, while the cost of guaranteed annuityoptions increases with declining interest rates. The risks posed bythese guarantees are regularly quantified using appropriateactuarial models calibrated to market-derived assumptions. Wehave quantified the cost of minimum investment guarantees andguaranteed annuity options and have established adequatereserves to cover the expected cost in full. We are still evaluatingthe optimal asset allocation strategy for the assets backing thisreserve, given that there are few financial instruments that providea perfect hedge.
In respect of fixed annuities, market risks are managed by holdingassets with appropriate duration and convexity to match liabilitiesto the fullest extent possible. Market risks on policies where the terms and conditions are guaranteed in advance and theinvestment risk is carried by the shareholders principally reside inthe guaranteed non-profit annuity book. Other non-profit policiesare also suitably matched through specific investment mandates.Market risks on with-profit policies, where investment risk isshared, are managed by appropriate investment mandates andbonus declaration practices.
Equity price risk and interest rate risk (on the value of securities)are modelled in line with the Group’s risk-based capital practices,which require sufficient capital to be held in excess of the statutory minimum to allow the Group to manage significant equity exposures.
An award-winning GroupNedbankBanking Awards
CategoryEmerging Markets Corporate SocialResponsibility Bank of the Year
AwardWinner

Old Mutual plc Annual Report and Accounts 2007Directors’ report – Business review 45
as through branches and representative offices in London and in the Isle of Man, to meet the international banking requirementsof Nedbank Group’s South African-based multinational and private clients. OMSA’s full-time agents also distribute certainNedbank products.
Nedbank CorporateNedbank Corporate comprises the client-focused businesses ofBusiness Banking, Corporate Banking, Property Finance, NedbankAfrica and the specialist businesses of Transactional Banking andCorporate Shared Services. These businesses focus mainly onproviding lending, deposit-taking and transactional bankingexecution services to the wholesale banking client base of Nedbank.
Nedbank Corporate has a strong client base and is well placed togrow and optimise business opportunities, both internally throughcross-selling services offered by other divisions of Nedbank as wellas the wider Old Mutual Group, and externally in the private andpublic sector markets.
Nedbank CapitalNedbank Capital is Nedbank Group’s investment bankingbusiness. It consists of a number of divisions that together managestructuring, lending, underwriting, corporate finance, private equityand trading operations. It provides a full product spectrum in theSouth African market, with an offering that stretches from equityresearch to long-term project financing, enabling Nedbank Capitalto compete effectively in the southern African market and in nicheareas of specialisation throughout Africa. The division seeks toprovide seamless specialist advice, debt and equity raising andexecution and trading capability in all the major South Africanbusiness sectors. Principal clients include a significant number ofthe top 200 domestic corporates, as well as parastatals, leadingfinancial institutions, non-South African multinational corporatesand clients undertaking major infrastructure and mining projects in Africa, and emerging BEE consortia.
Nedbank Retail Nedbank Retail serves the financial needs of individuals and small businesses by providing transactional, credit card, lending,investment and insurance products and services. The divisionservices the needs of clients grouped into five primary clientsegments, being high net worth, affluent, middle, mass and small business.
The division is further organised around the following key productareas: card, home loans, personal loans, bancassurance andwealth, vehicle and asset-based finance and transactional banking.
Credit risk is monitored across OMSA’s activities by the OMSACredit Committee, which has established appropriate exposurelimits to individual issuers and within various segments of the business.
Asset managementThe revenue of OMIGSA’s asset management businesses variesproportionally to fluctuations in values of the assets managed on behalf of clients (both in-house and third-party). This isaccentuated where performance fees apply if minimumperformance hurdles are not met. Investment risk is borne byclients, due to the agency nature of the business. Compliance risks faced by these businesses are monitored and reviewed bycompliance and risk committees established for this purpose. Therisk of loss of key employees is managed by the use of appropriateremuneration policies including long-term incentive schemesaligned with shareholder value targets, and by competitionrestrictions in employment agreements.
Nedbank Group (Banking)Business profileNedbank Group Limited, which is 53% owned by the Group, is a bank holding company that is one of the four largest bankinggroups in South Africa. It operates through its principal bankingsubsidiaries, Nedbank Limited (wholly-owned) and Imperial BankLimited, in which Nedbank Group Limited has a 50.1% interest.Nedbank Group Limited’s shares are publicly listed on the JSE.
Nedbank Group offers a wide range of wholesale and retail bankingservices through three main business clusters: Nedbank Corporate,Nedbank Capital and Nedbank Retail, as well as Imperial Bank, a joint venture with Imperial Holdings. Nedbank Group focuses on operating in southern Africa, with Nedbank positioned to be a bank for all – both from a retail and a wholesale bankingperspective. The principal services offered by Nedbank arecorporate and retail banking, property finance, investment banking,private banking, foreign exchange and securities trading. NedbankGroup also generates income from private equity, credit cardacquiring and processing services, custodial services, collectiveinvestments, trust administration, asset management services and bancassurance.
Nedbank Group’s head office is in Sandton, Johannesburg, withlarge operational centres in Durban and Cape Town. These arecomplemented by an extensive branch and support networkthroughout South Africa and facilities in Lesotho, Malawi, Namibia,Swaziland and Zimbabwe. These facilities are operated throughNedbank Group’s eight subsidiary or affiliated banks, as well
Nedbank FoundationAs part of the repositioning ofNedbank’s brand, a campaign was run to draw attention to the valuablework done by the Nedbank Foundationwith funds sourced from Nedbank’sAffinity Programmes.
Perf
orm
ance

Old Mutual plc Annual Report and Accounts 2007Directors’ report – Business review46
The Shared Services Division provides support services includinghuman resources, finance, projects, strategic planning and productand client analytics. Retail Risk is responsible for the monitoring ofcompliance, credit and operational risk and providing legal servicesto the cluster. Retail marketing provides marketing support to thebusiness divisions and assists in co-ordinating marketing activitiesacross the broader Nedbank Group.
Imperial BankImperial Bank Limited is an independently regulated bank, ofwhich Nedbank owns 50.1%, with the remainder held by ImperialBank Holdings Limited. Imperial Bank focuses mostly on motorvehicle finance. In addition, it also offers property, medical andaviation finance.
Performance during 20072007 financial targets achieved
Highlights (Rm) 2007 2006 % change
IFRS adjusted operating profit 9,220 6,973 32%Headline earnings1 5,921 4,435 34%Net interest income1 14,146 10,963 29%Non-interest revenue1 10,445 9,468 10%Net interest margin1 3.94% 3.94%Cost to income ratio1 54.9% 58.2%RoE1 21.4% 18.6%RoE1 (excluding goodwill) 24.8% 22.1%
1 As reported by Nedbank.
We are pleased with the balance we have achieved betweendelivering on our short-term performance targets and investing to build a platform for long-term growth. Although the financialperformance is now benchmarking closer to that of Nedbank’speers, we aspire to improve further.
Headline earnings increased by 34% to R5,921 million. Basicearnings grew by 33% to R6,025 million.
Nedbank Group’s headline earnings per share (EPS) increased by34% to 1,485 cents (2006: 1,110 cents). Diluted headline EPSincreased by 33% from 1,076 cents to 1,429 cents. Basic EPSgrew by 33% from 1,135 cents in 2006 to 1,511 cents in 2007.
Nedbank Group’s return on average ordinary shareholders’ equity(RoE) improved from 18.6% to 21.4% for the year, exceeding the target of 20% that was set in 2004 at the start of its recoveryprogramme. RoE, excluding goodwill, improved from 22.1% to 24.8%.
Group Finance Director’s reportcontinued
Net interest income (NII) NII grew 29% to R14,146 million (2006: R10,963 million) due to strong growth in average interest-earning banking assets of 29%.
Nedbank’s net interest margin for the year was 3.94%, unchangedfrom 2006. The margin benefitted from the endowment impact ofinterest rate increases on capital and current and savings accountsof 0.4%, and decreased from liability margin compression of 0.1%as deposit interest rates continued to price in upside risk and as the sector had to source a higher proportion of funding from thewholesale deposit market. In addition, the NII margin decreasedfrom asset margin compression of 0.3% mainly as a result ofstrategic changes in the product mix of personal loans andcompetitive pricing behaviour particularly in home loans andcommercial mortgages.
Impairments charge on loans and advances The credit loss ratio increased from 0.52% in 2006 to 0.62% in2007. The growth in advances and the increase in the credit lossratio are reflected in a 46% increase in the impairments charge toR2,164 million. Impairment levels have risen in Nedbank Retail andImperial Bank, while the credit loss ratios in Nedbank Capital andNedbank Corporate have remained at lower than expected levels,assisted by active credit management and unusually high levels of recoveries. The effect of the deteriorating retail environment hasbeen mitigated to some extent through tighter credit policies and an early focus on collection processes and systems. Nedbank hascontinued to apply stringent credit management policies and hastightened credit-granting requirements in the retail areas mostaffected by the worsening credit cycle over the last two years.
Nedbank has no direct exposure to US sub-prime mortgages. The group is indirectly exposed in that it does have some bankingrelationships with institutions with sub-prime exposure. These arerelatively small and are not currently expected to lead to any lossesin the Nedbank Group.
Nedbank Retail raised an additional Incurred But Not Reported(IBNR) provision of R167 million in December 2007 to anticipatethe effect of the current higher interest rates not yet evident in thehistoric data used for provisioning calculations.
An award-winning GroupNedbank2007 Financial Times SustainableBanking Awards
CategoryEmerging Markets
AwardRegional Emerging Market SustainableBank of the Year Mid-East and Africa

Old Mutual plc Annual Report and Accounts 2007Directors’ report – Business review 47
to a reduction in international liquidity, which has traditionally notbeen a large portion of the funding base, and an increase in thecost of capital market debt. This has had a small negative impacton the cost of rolling over conduit paper and new subordinated-debt issues.
During 2007 Nedbank successfully launched its inaugural auto loans and residential mortgage-backed securitisationprogrammes, raising R1.7 billion and R1.87 billion respectively.These programmes have diversified the funding base and addedtenor to the bank's existing funding profile. In addition, Nedbankissued a further foreign syndicated loan of $500 million inFebruary 2007, raising additional foreign funding and creatingfurther funding diversification.
Market environment and outlookThe slowdown in consumer spending, the increase in consumercredit stress, continuing electricity shortages and sustaineddislocation in credit and equity markets are likely to make the year ahead significantly more challenging for the South Africaneconomy and the banking sector.
Nedbank Group’s management currently believes that performancein 2008 is likely to be influenced by:
> growth in retail advances remaining robust, but slowing,together with ongoing growth in wholesale advances;
> continued market pressure on retail funding volumes;> an endowment benefit in the margin from historic interest
rate increases;> a slight worsening of the impairment charge following signs
of increased levels of credit stress in parts of the retailenvironment, together with fewer impairment recoveries from Nedbank Capital and Nedbank Corporate;
> continuing effects of the Nedbank Retail price reductions and industry fee pressure;
> pressure on revenues and costs associated with the introductionof the National Credit Act;
> momentum from transactional banking mandates received by Nedbank Corporate and a strong pipeline built up byNedbank Capital;
> lower positive property private equity revaluations;> additional operating efficiencies;> investment in retail distribution and continued marketing
spend on the new brand position;> finalisation of Basel II; and> asset securitisation and continuing capital management activities.
Non-interest revenue (NIR)NIR for the year increased by 10% to R10,445 million.
This growth in NIR was driven primarily by commission and fee income growth of 15% and an increase in private equityrevaluations, realisations and dividend income.
This growth was partially offset by weak trading results as reportedin the first half. This was mainly due to poor trading within thebusiness alliance with Macquarie, the competitive pricing structurefor transactional products adopted in Nedbank Retail, where fees have been reduced by an average of 19% since mid-2006, and a continuing move from cheques to electronic channels bybusiness banking clients.
ExpensesExpenses continue to be tightly managed, increasing by 14% to R13,489 million. The “jaws” ratio continued to improvethroughout the year, with total revenue growth of 20% being 6% above expense growth of 14%, resulting in the efficiency ratioimproving from 58.2% for 2006 to 54.9%.
Growth in operating expenses slowed, as anticipated, while staffexpenses increased, reflecting the investment Nedbank has made in client-facing staff and an increase in variable pay as a result ofthe continued improvement in operating performance. Marketingcosts increased as planned as Nedbank continued to invest inrepositioning the Nedbank brand.
Expenses included the costs for the integration of Old Mutual Bankinto Nedbank, Bond Choice’s expenses and the IFRS 2 charge inrespect of Nedbank Group’s BEE transactions.
Advances and depositsDuring 2007 advances grew 21% to R374 billion, with averageinterest-earning banking assets increasing by 29% to R359 billion.
As a result of the strong advances growth, total assets increased15% to R489 billion. Growth in higher risk areas, such as personalloans, slowed as the group tightened credit criteria and focused onhigher quality, lower margin personal loans. Deposits increased by18% from December 2006 to R385 billion at December 2007.
Nedbank’s liquidity remains sound in an overall liquidityenvironment that was made more challenging by negativeinternational liquidity developments. Contagion of South Africanmarkets has been limited, with little direct exposure by local banksto the US sub-prime markets. The primary impact has been limited
Nedbank The repositioning of the Nedbankbrand. The key message of thiscampaign is “personal achievement” by banking with Nedbank.
Perf
orm
ance

Old Mutual plc Annual Report and Accounts 2007Directors’ report – Business review48
While the general banking environment will be much tougher thanin previous years, Nedbank is confident of continuing to improve its performance based on the solid platform built over the past fouryears. Nedbank’s focus is now on working towards its vision ofbecoming southern Africa’s most highly rated and respected bank.
The main focus areas for Nedbank in 2008 include building on itstransformation journey, and growing its retail distribution network,transactional banking market share, relevance in the public sector,business banking franchise and mass-market strategy.
In addition, Nedbank is focused on being involved in social and community projects, managing the credit cycle, disciplinedexpense management, ongoing capital management activities,continuous improvement in all operations and applying economic-value-based management. From 2008 economic profit (EP)replaces RoE as the primary internal financial performancemeasure in the Nedbank Group. EP is a best-practice measuresince it incentivises an appropriate balance between return andgrowth, and better aligns with shareholder value creation.
Risk and capital management Risk management has been a major component of NedbankGroup’s transformation over the past few years, using itscomprehensive Basel II programme as a major catalyst. A vision to be “world-class at managing risk” has been engrained in theorganisational risk culture of the group together with a clearunderstanding that Nedbank’s core business activities involvetaking financial risks and that these and other key risks, forexample operational risk, must be measured, managed andoptimised as a core competency.
Nedbank has successfully implemented its Basel II blueprint. This is in line with the revisions to the South African Banks Act and the new internationally-based Basel II banking regulationsintroduced by the South African Reserve Bank (SARB), which were effective from 1 January 2008. The main purpose of Basel IIis to promote significant enhancement and sophistication of riskand capital measurement and management, thereby furtherstrengthening the safety and soundness of the banking industry.
Nedbank has received formal approval from SARB for an AdvancedInternal Ratings-Based (AIRB) approach to credit risk for itsprincipal operations in South Africa, while Imperial Bank and theAfrican subsidiaries have adopted the standardised approach.Nedbank’s risk and capital management capabilities allow it tooptimise the risk/return trade-offs equation and grow thebusinesses profitably within a clearly established risk appetite.
Group Finance Director’s reportcontinued
During the year Nedbank continued to actively manage its capital:
> the expensive NED2 R4 billion bond was redeemed on its call date in July 2007;
> several Tier 2 subordinated-debt issues totalling R6.77 billionwere executed, thereby continuing to build a smooth anddiversified subordinated debt maturity profile. (A highlight of thiswas a R2 billion inaugural Tier 2 investment in a South Africanbank by the International Finance Corporation and the AfricanDevelopment Bank);
> a R1.7 billion Imperial Bank asset securitisation and a R1.87 billion Nedbank Retail home loan securitisation werecompleted; and
> R364 million of Tier 1 perpetual preference shares were issued.
Certain hybrid capital instruments now qualify as Tier 1 regulatorycapital under Basel II and Nedbank is well advanced in planningits inaugural hybrid Tier 1 issue.
Nedbank Group, Nedbank Limited and Imperial Bank Limited allreceived ratings upgrades from Moody’s and Fitch during 2007.This was very pleasing and recognises the successful turnaround of Nedbank over the past few years.
Nedbank expects to issue further Tier 2 capital and hybrid forms of Tier 1 capital in 2008. Nedbank is committed to improving itsprofile as an issuer in the debt capital markets and this shouldresult in a more robust subordinated debt yield curve.
Economic capitalEconomic capital is a scientific, consistent measurement and allowscomparison of risk across business units, risk types and individualproducts or transactions. Economic capital is now embedded in the management and performance culture of Nedbank Group, andis fundamental in the assessment of risk/return at all levels.
Nedbank’s economic capital framework also satisfies a majorcomponent of Basel II, namely the requirement for an InternalCapital Adequacy Assessment Process (ICAAP). This involves the group’s ongoing assessment of its internal capital adequacy on a true economic basis.
In addition to economic capital, Nedbank Group calculatesregulatory capital requirements developed by the Basel Committeeon Banking Supervision – both under the current Basel I Accordand the new revised Basel II Accord. Nedbank Group will alwaysaim to hold the greater of regulatory capital and economic capitalfor capital adequacy purposes, but primarily uses its internaleconomic capital assessment for managing the business as thisrepresents a better overall assessment of the true economicrisk/return relationship.
An award-winning GroupNedbankCannes Lions International Advertising Awards
CategoryInspiring Ambient Advertising
AwardOutdoor Grand Prix – Winner

Old Mutual plc Annual Report and Accounts 2007Directors’ report – Business review 49
Key performance indicatorsAfter successfully achieving the short-term targets of a 20% RoE and 55% efficiency ratio in 2007, Nedbank Group has set the followingkey medium-term targets:
Performance in 2007 Medium- to long-term financial targets
Return on shareholders’ equity 21.4% RoE greater than 20% and RoE (excluding goodwill) (24.8% excluding goodwill) 10% above Nedbank Group’s monthly weighted average cost
of ordinary shareholders’ equity
Efficiency ratio 54.9% Maintain an efficiency ratio of less than 55%
Fully diluted headline earnings 32.8% growth Growth in fully diluted HEPS of at least average per share (HEPS) CPIX plus GDP growth plus 5%
Impairment charge as a % 0.62% An impairment charge of between 0.55% of average advances and 0.85% of average advances
Capital adequacy ratios (Basel II) 7.9% Tier 1: 8.0% – 9.0 %11.3% Total: 11.0% – 12.0%
Economic capital adequacy A- Adequately capitalised to a 99.9% (A-) confidence on an economic capital basis plus a 15% buffer
Dividend cover 2.25 times 2.25 to 2.75 times cover
In the medium term Nedbank aims to meet or exceed thecomparable performance of its peers.
Risk appetiteRisk appetite is an articulation of the risk capacity or quantum of risk Nedbank Group is willing to accept in pursuit of its strategy,duly set and monitored by its board of directors and integrated into its strategy and business plans.
Nedbank measures risk appetite in terms of quantitative riskmeasures, which include earnings-at-risk (or earnings volatility),economic and regulatory capital adequacy and risk limits.Qualitatively, Nedbank expresses risk appetite in terms of policies,procedures and controls designed to limit risks that may or may not be quantifiable.
Capital managementNedbank Group’s Capital Management Framework is designed tomeet its external stakeholders’ needs, both those more focused onthe return or profitability of the group relative to the risk assumed(or risk versus return) and those more focused on the adequacy ofthe group’s capital in relation to its risk profile (or solvency). Theframework is based on world-class risk and capital management,integrated with strategy, performance measurement and incentives,and intended to fulfill one of the group’s twelve key strategicobjectives, namely to optimise risk and capital.
Nedbank Group’s board approves a comprehensive StrategicCapital Plan, which is driven by and in turn integrated into thegroup’s three-year business plans. Included in this plan is thegroup’s strategic and tactical response to Basel II, economiccapital, risk appetite and financial targets (including risk-adjustedreturn on capital), long-run (three-year) capital planning andvarious proposed capital optimisation actions.
Basel llBasel II is mandatory in South Africa from 1 January 2008.Nedbank Group was well positioned for the introduction of Basel IIand the group’s estimated Basel II capital requirements have forsome time been integrated into its three-year business plans and its long-run capital planning within the strategic capital plan.
Overall, no material impact is expected on the capital levels ofNedbank Group after the full implementation of Basel II in 2008.
Nedbank, Power to the PeopleDuring the year Nedbank unveiled two solar billboards. The first panelgenerated electricity for a kitchen at MC Weiler Primary School in AlexandraTownship in Gauteng, enabling mealsto be cooked for more than 1,400children every day. This initiative led toNedbank winning the Grand Prix Awardat the Cannes Advertising Awards.
Perf
orm
ance

Old Mutual plc Annual Report and Accounts 2007Directors’ report – Business review50
Mutual & Federal (General Insurance)Mutual & Federal Insurance Company Limited (Mutual & Federal)shares are publicly listed on the JSE. The Group currently owns75% of the company, but has indicated its intention to exit generalinsurance and accordingly Old Mutual plc is in discussions withcommunity-based investment group, Royal Bafokeng Holdings(Proprietary) Limited (RBH), which may or may not result in thesale by Old Mutual to RBH of a controlling interest in Mutual & Federal. If the potential offer proceeds, RBH would make an offer for all of the issued share capital of Mutual & Federal and Old Mutual would undertake to accept it in relation to a minimum of 60% and a maximum of 70% out of its overall stake in Mutual & Federal.
Business profileMutual & Federal provides insurance services to the personal,commercial and corporate markets in South Africa, Namibia,Botswana and Zimbabwe through professional and highlyexperienced brokers who are able to offer clients personal serviceand advice when purchasing policies, and practical assistance in the event of a claim. The business manages its insuranceoperations in three broad segments, which reflect the marketswithin which clients are serviced.
Commercial divisionThe Commercial division provides a comprehensive portfolio ofinsurance services, including domestic and export credit risk,insurance against fire, accident and motor risk and crop insuranceservices to a diverse range of customers from small and medium-sized businesses to large corporations including mining and heavyindustrial companies. Where clients require specialist insuranceexpertise such as engineering, marine and agricultural knowledge,these are also provided by this division.
Personal divisionThe Personal division provides domestic household, motor, and all-risks short-term insurance products to individual clients throughwhite-labelled intermediary-branded and in-house products. One of the in-house products, Allsure, offers clients lower premiums bycombining household goods and motor insurance into one policy.The division also offers hospital cash plans and various forms ofpersonal accident policies. Allsure is supported by intermediariesthroughout South Africa, providing customers with excellent value,supported by a fair and fast claims-settling service.
Group Finance Director’s reportcontinued
Risk Finance divisionThe Risk Finance division has a dominant position in the SouthAfrican market. The division continues to enjoy a highly positiveprofile within the industry and is one of the largest suppliers of riskfinancing solutions in Africa. The division offers facilities to clientson a “rent-a-captive” basis, as well as through independent cellsowned by third parties.
Performance during 2007 Solid performance in a challenging year
Highlights (Rm) 2007 2006 % change
IFRS adjusted operating profit 1,256 1,039 21%Gross premiums1 9,323 8,549 9%Earned premiums1 7,948 7,458 7%Claims ratio1 66% 63%Combined ratio1 95.4% 93.9%Solvency ratio1 42% 49%Return on capital1 (3-year average) 31.7% 27.5%
1 As reported by Mutual & Federal.
Mutual & Federal maintained solid results in the context of a highlycompetitive trading environment and a gradual decline in theunderwriting cycle following the record results achieved in 2004and 2005.
The underwriting result for the year was adversely impacted by anincrease in the severity and frequency of large claims, particularlyindustrial fires. Severe weather conditions experienced in SouthAfrica also negatively affected the results. In addition, despitestrong rating adjustments and underwriting interventions, results in the motor account continued to be negatively impacted by anincrease in claims emanating from high levels of accidents onSouth African roads.
An award-winning GroupMutual & FederalSAFSIA 2007 Awards
CategoryInsurance
AwardCorporate Insurer of the Year

Old Mutual plc Annual Report and Accounts 2007Directors’ report – Business review 51
Market environment and outlookThe southern African general insurance market remained extremelycompetitive during 2007. Premium rates increased, but growth inpremiums was more than offset by poor claims experience fromweather-related claims and the motor book. More positively, thebuoyancy of the economy has resulted in pockets of new marketsand customers and the black middle class continues to drive thebulk of economic activity in South Africa.
There has been strong growth in the direct channels, driven by a growing preference of customers to deal with direct channelinsurers. The motor books of most broker-based insurers haveeither been unprofitable or marginally profitable, and remain a strong challenge for insurers.
A gradual decline in the value of the Rand threatens to increaseclaims costs.
The vision of management remains to be the strongest and mostsuccessful short-term insurer in its chosen markets, being allclasses of general insurance except those that carry long-termclaims liabilities. In order to achieve this, management focuses on profitability, growth from new and existing markets andchannels, new regions and acquisitions, as well as new products.Management plans to rejuvenate the brand to meet the challengesof the current and future market. Operational efficiencies will beachieved through new business processes and technology. Inaddition management is seeking to improve employee satisfactionand to realise significant transformation in the workplace.
Real growth in units will be achieved through new productdevelopment and exploration of alternative distribution channelsand emerging markets. The business continues to focus on its keyfinancial targets of sustaining a long-term average underwritingratio of 4% and delivering a return on capital in excess of 20%, while maintaining service excellence to intermediaries and policyholders.
The loss ratio is expected to remain reasonably steady following thereturn to more normal claims patterns and the correction of certainunderperforming accounts.
Gross premiums Gross premiums in Risk Finance grew by only 2%, but thePersonal and Commercial portfolios grew 9% and 13%respectively, giving an overall increase of 9% against the prior year.This was achieved despite the cancellation of certain uneconomicalblocks of business within the Personal division. Mutual & Federaldoes not accept risks at sub-economic rates and has diligentlyfollowed prudent underwriting practices.
Combined ratio weakens Mutual & Federal generated an underwriting surplus of R366million (2006: R455 million), or a ratio of 4.6% to earnedpremiums (2006: 6.1%), which is above our long-term objectiveof 4%. The estimation methods used in providing for claims andother technical liabilities were further refined and this released R96million (2006: R215 million) into the underwriting result. If theseadjustments are excluded, the underwriting result improved overthe previous year by R52 million.
The trading environment remains conducive to producing animproved underwriting profit in 2008, with signs of a hardening of rates in certain sectors. Recent electricity load-shedding hascreated substantial inconvenience to Mutual & Federal, but isunlikely to impact the underwriting account significantly.
Solvency ratio The solvency ratio has decreased from 49% to 42% following thepayment of a special dividend of R2 per share in December 2007.
Strong growth in adjusted operating profit and return on capital exceeding targetThe adjusted operating profit includes R262 million arising from a change in the long-term investment return rate from 11.1% to15.6%. This, together with special dividends of R8 per share paidin 2006 and R2 per share in 2007, has contributed to an increasein the return on capital from 27.5% in 2006 to 31.7% in 2007.This is well ahead of our targeted return of 20%.
Motor Claims AdvertisingThe Motor Claims campaign ran from 22 November to 13 December 2007before the majority of South Africans wenton holiday.
Radio – Mutual & Federal sponsored livetraffic reports on national and regionalstations during peak hours. These were supported by a 30-second radiocommercial that advised policyholders to use the call centre number in the eventof an accident.
Print – Mutual & Federal ran three differentEnglish and Afrikaans advertisements inleading newspapers countrywide advisingpolicy holders to use the call centrenumber in the event of an accident.
Perf
orm
ance

Old Mutual plc Annual Report and Accounts 2007Directors’ report – Business review52
Risk managementUnderwriting risks are controlled through a formal system ofparameters within Mutual & Federal that is only deviated fromfollowing approval by senior management. Reinsurance cover is set at conservative levels and is in place for losses arising fromcatastrophic events such as hurricanes, earthquakes, tornadoes,severe hail, floods and fires, with retentions set at conservativelevels. The business does not provide cover against losses from terrorist attacks, a risk that is underwritten by the South African Government.
Management has set a number of financial objectives for the Groupin pursuit of Mutual & Federal’s corporate mission. The followingperformance against these was achieved during the year:
> an underwriting surplus of 4.6%, which was in excess of thelong-term objective of 4%;
> general expenses increased by 9.0%, which was broadly withininflation levels and in accordance with the corporate objective;
> a return on capital in excess of 20%;> following the payment of the special dividend, a solvency
margin of 42% was achieved (it is expected that the ratio willbe managed to a new target range of 30% to 35%), while thecompany maintained a level of 80% of shareholders’ fundsinvested in listed equities.
The target for premium growth of inflation plus growth in Gross Domestic Product plus 2% was not achieved because of the highly competitive market, which made the pursuit ofbusiness inadvisable where this would have led to deterioration in profitability.
Group Finance Director’s reportcontinued
United States
Highlights
> Gross life sales of $6.1bn, up 58% on the prior year– Driven by Old Mutual Bermuda, which now
represents 25% of Funds Under Management
> Asset Management net client cash flows of $35.2bn,13% of opening funds under management– Driven by continued strong investment
performance
> Life business achieves capital self-sufficiency– Dividend paid by the US business for the
first time during 2007
> Long-term equity plans implemented at several affiliates– Half of our affiliates now have equity in the
hands of employees
An award-winning GroupMutual & FederalSAFSIA 2007 Awards
CategoryInsurance
AwardPersonal Insurer of the Year
Funds under management
£170.1bnFunds under managementas percentage of Group
61%Growth in funds undermanagement
22%

Old Mutual plc Annual Report and Accounts 2007Directors’ report – Business review 53
Reputation riskAs participants in the financial services industry, the businessesmust maintain a high-quality reputation in order to attract andretain clients and employees. If the businesses fail, or appear to fail, to deal properly with the various issues (for example, potentialconflicts of interest or customer privacy), that could potentiallyharm their reputation and they could experience adverse effects totheir operations and financial results.
Litigation riskThe businesses are subject to claims and lawsuits in the ordinarycourse of their activities, which can result in settlements andawards. It is inherently difficult to predict the ultimate outcome ofthese matters, particularly in cases in which claimants seeksubstantial or unspecified damages, and a substantial judgment,settlement, fine or penalty could be material to the businesses’operating results for a particular future period, depending on theresults for that period.
Regulation riskThe businesses are subject to extensive regulation in the UnitedStates and around the world. Violation of applicable laws orregulations could result in fines, temporary or permanentprohibition from engagement in certain activities, reputation harm,suspension of personnel or revocation of their licences, suspensionor termination of investment adviser or insurance registrations, or other sanctions, which could cause earnings to decline.Additionally, the businesses may be adversely impacted byregulatory and legislative initiatives imposed by various US andnon-US regulatory and exchange authorities. Accordingly, thebusinesses maintain a disciplined compliance and legalinfrastructure to ensure appropriate application of rules andregulations in conducting their business.
Operations riskThe businesses rely on their respective systems, operationalprocesses and infrastructure to help process numerous transactionson a daily basis across various different markets. In the event of a breakdown in an operational process (for example, human erroror employee misconduct), a malfunction of the businesses’systems or the third-party vendors’ systems, or external eventsbeyond the businesses’ control such as a natural disaster thatcould impact both the operational processes and systems, thebusinesses could suffer business and financial losses and besubject to litigation and regulatory sanctions.
Old Mutual has built significant asset management and lifeassurance businesses in the United States through a number ofacquisitions as well as strong organic growth over the past sevenyears. Our US businesses are well placed strategically to takeadvantage of demographic and other related trends as we continueto seek to develop innovative product solutions, deliver stronginvestment performance and grow our retail presence. Substantialinvestment was made during 2007 in a co-ordinated brandinginitiative aimed at financial intermediaries as well as individualretail consumers, focused on ‘new thinking’ and name recognition.In the fourth quarter, we commenced a campaign of television andradio commercials and online advertising plans. The campaign is a finalist for both an American Advertising Federation AddyAward (the world's largest advertising competition) and FundAction’s Ad Campaign of The Year.
Risk managementAs a member of the financial services industry, both the US Lifeand Asset Management businesses are subject to certain risks.Additionally, each of these businesses contains risks specific to its own industry. Below are the risks inherent to both businesses.
Market and credit riskOverall market and economic conditions, which are beyond thebusinesses’ control and cannot be predicted with great certainty,generally have a direct impact on client asset valuations and thebusinesses’ proprietary holdings. A diversified group of productofferings is maintained to mitigate underperformance across thebusiness in a uniform manner. However, in an environment ofadverse or uncertain market or economic conditions, the businesscould experience decreased fee-based and performance-basedrevenue, investment losses and decreased profitability.
Competition riskThe financial services industry has been, and is likely to continueto be, intensely competitive. The businesses compete withcompanies having greater financial resources and with companiesoffering other financial services. The businesses generally compete on the basis of their strong reputation, quality advice and superior service, performance, quality of employees and product offerings. In the event that the businesses are not able to competesuccessfully on one or more of these factors, they may face a reduction in market share, a reduction in revenues and/or a reduction in profitability.
Perf
orm
ance
New thinkingOld Mutual’s intermediary and first-everUS direct-to-consumer brand advertisingcampaigns. The campaigns focused on‘new thinking’ and name recognition.

Old Mutual plc Annual Report and Accounts 2007Directors’ report – Business review54
Client guideline riskWhen clients retain one of the businesses to manage assets orprovide products or services on their behalf, they specify guidelinesor contractual requirements that the business is required to observein the provision of its services. Failure to comply with theseguidelines or contractual requirements could result in reputationaldamage or to the clients seeking to recover losses, clientswithdrawing assets or terminating their contracts, any of whichcould cause earnings to decline.
US LifeBusiness profileThe US Life business comprises OM Financial Life InsuranceCompany and its subsidiary, OM Financial Life Insurance Companyof New York, which are marketed under the name of Old MutualFinancial Network (OMFN) and Old Mutual Bermuda.
We commenced operations in the US life market in 2001 throughthe acquisition of several established insurance companies, thelargest being OM Financial Life Insurance Company (formerlyknown as Fidelity and Guaranty Life Insurance Company). The business is headquartered in Baltimore, with a sales office in Atlanta, and offers a diverse portfolio of annuities and lifeinsurance products to individuals in the United States.
Our operations were further strengthened in 2003 with theacquisition of Old Mutual Bermuda (formerly known as OMNIA Life (Bermuda)). This offshore variable annuity business has beenpositioned within private bank channels, one of the main sources of business for the international insurance market, and hasprovided significant sales growth since acquisition.
The US Life business has experienced strong new business growthsince its acquisition, backed by Group capital injections in priorperiods. US Life remitted a dividend to the Group in 2007.
US Life’s fixed income investments are invested by our US AssetManagement business, which manages these on a commercialbasis. The majority of US Life’s administrative functions areoutsourced to third-party service providers.
While our OMFN products are distributed through variouschannels, the majority of sales are generated through establishedgroups of managing general agents (MGAs), with the MGAstypically providing agents with access to a range of annuity and life assurance products from different suppliers.
Group Finance Director’s reportcontinued
Fixed index annuities (FIA)Our FIA product has been consistently placed in the top five in theUS product segment over the past few years. Under this product,the policyholder is guaranteed not to lose principal, with a returnthat is based on some participation in equity index movements.The potential equity index upside is covered using equity indexoptions and futures, enabling us to provide the potential for gainswhile managing exposure to loss of principal.
Fixed annuitiesThese are fixed-rate contracts that involve the business investing ina portfolio of bonds that earn a spread above the rate guaranteed to the policyholder. There are two main types of fixed annuities, theprincipal purpose of one being to offer a tax-efficient way to savemoney for retirement, and the other to provide an income streamfor life.
Variable annuitiesThe variable annuity products sold through our offshore business,Old Mutual Bermuda, are investment products targeted at non-UScitizens residing outside the United States. The variable annuityproduct is essentially a unit-linked investment plan which providesvarious guarantees with distribution primarily through private banks.
2007 marked the launch by OMFN of our first onshore variableannuity. This product packages guarantees that provide offsettingrisks to the business, which in turn results in pricing advantages topolicyholders. The product is primarily sold through independentinsurance agents. A second-generation product will soon be launched,designed for distribution through registered investment advisers.
Protection productsOur US Life business offers two principal protection product lines,term mortgage protection and universal life products, which provideflexible life assurance protection in the event of death or illness.Through the introduction of some product features such as partialreturn of premium benefits, and quick underwriting turnaroundtimes, our products have grown rapidly in this traditional life segment.
An award-winning GroupOld Mutual Capital, USMutual Fund Education Alliance Awards
CategoryBest overall communication
AwardBest Small Company Group

Old Mutual plc Annual Report and Accounts 2007Directors’ report – Business review 55
Value of new business and healthy margins driven by strongoffshore variable annuity salesVNB for the year of $144 million was up 73% due to the highervolume of Bermuda variable annuity business. The new businessmargin of 21% was at the high end of our longer-term expectationsprimarily driven by Bermuda variable annuity business. The overallbusiness continues to benefit from good investment performanceand enhanced distribution. Our co-ordinated retail distributionstrategy has made good progress.
Underlying results solidIFRS and EV adjusted operating profit and returns decreased in 2007 compared to 2006. This was due to assumption andmodelling changes recorded during 2007 and non-recurring net investment income in the first half of 2006 of $18 million. As indicated at our interim results, we strengthened our annuitantmortality assumptions and adopted a more conservative approach to future assumed spreads. These changes resulted in a $277 million ($186 million post-tax) adjustment to EmbeddedValue, of which $195 million ($131 million post-tax) was inrespect of annuitant mortality assumptions included within EVadjusted operating profit and a $60 million adjustment to pre-taxIFRS adjusted operating profit. Excluding these impacts, IFRSadjusted operating profit was up 20%, driven by higher averageasset levels.
Credit update 3% of US Life’s fixed income portfolio of $21 billion has directexposure to sub-prime debt and this helped US Life weather themarket turbulence during the second half of 2007. The sub-primeexposure is highly rated (86% is AAA, 99% is AA and higher, and100% is A and higher), concentrated in first mortgages withoutrate-reset risk, and owner-occupied, rather than investor properties.
Approximately 2.3% of US Life’s investment portfolio has exposureto monoline insurers, of which $493 million (85% of the totalexposure) is indirect (wrapped) exposure, with a 95% fair value-to-book value ratio, and $90 million is direct (unsecured) exposure,with a 87% fair value-to-book value ratio. Of the 15% thatrepresents the unsecured exposure, most is being recapitalised, or has sufficient funds to go into run-off mode, if necessary.
However, US Life was not fully immune to the unfavourable creditconditions and recorded $64 million of impairment provisionsduring the fourth quarter. For IFRS adjusted operating profit, theimpairment provision did not impact the long-term investmentreturn in 2007.
Performance during 2007 Continuing strong international variable annuity sales add todiversity of earnings
Highlights ($m) 2007 2006 % change
IFRS adjusted operating profit (pre-tax) 195 230 (15%)Return on equity 5.9% 7.3%1
EV adjusted operating profit (pre-tax) 126 181 (30%)Return on Embedded Value 3.8% 6.1%Life assurance sales (APE) 671 4552 47%Value of new business (post-tax) 144 83 73%New business margin (post-tax) 21% 18%2
Present value of new business premiums 6,305 4,0932 54%Funds under management ($bn) 24.1 22.1 9%
1 Restated due to change in ROE methodology.2 Restated due to change in US Life APE calculation to align with the volume
of new business calculation.
Growth in funds under managementFunds under management of $24.1 billion at year end were up 9% due to positive net client cash flows of $2.4 billion, primarilydriven by strong Old Mutual Bermuda variable annuity sales,partially offset by increased surrenders on the Multi-Year GuaranteedAnnuity block of business and a 1% decrease in the fair value ofinvested assets.
The business returned cash in 2007, while exceeding targeted risk-based capital ratios in the operating entities including OM Financial Life Insurance Company and Old Mutual Bermuda.
Excellent sales growth in international variable annuity businessTotal life sales were $6.1 billion on a gross basis, up 58% over2006. Total life sales APE was $671 million, a 47% increase over2006. Sales by Old Mutual Bermuda were the largest contributor tothe increase over the prior year.
Old Mutual Bermuda increased sales on an APE basis by 201% to $360 million compared to 2006, representing 54% of APE sales in the US Life business. The increase in sales was due to anew product launch in April 2007 and new distribution agreementsin Asia. Bermuda now represents 25% of total funds undermanagement. Universal life sales were up over the comparativeperiod by 28% as part of a shift from a term life-focused distributionto a more balanced life portfolio. Continued demand for fixedindexed annuities was also a contributing factor. We have anattractive and diverse mix of product offerings including variableannuities, fixed indexed annuities, term life and universal life.
Perf
orm
ance
New thinkingThe second advertisement in acampaign focused on “new thinking”and name recognition for Old Mutual’s US direct-to-consumer brand.

Old Mutual plc Annual Report and Accounts 2007Directors’ report – Business review56
The investment portfolio’s aggregate credit experience remainedwithin expectations and is in line with long-term assumptions.
Market environment and Outlook2008 will see the continued expansion and development of USLife’s product portfolio across all of its product platforms in concertwith its independent distribution partners. For the fixed annuityline, launches are planned of an indexed-linked guaranteedinvestment contract, a vesting bonus-type product, as well asseveral more traditional fixed annuity products. In January 2008the domestic variable annuity range was augmented with thelaunch of an innovative zero-commission product, Beacon Advisor.This product is targeted at the growing fee-based plannercommunity. During 2008 the domestic US variable annuity groupwill be launching a bank-focused distribution capability. Old MutualBermuda will continue to build on its extensive bank-focuseddistribution and plans to enhance its product line during 2008.
Driving towards a more balanced product portfolio will be a coreemphasis including the build-out of both indexed universal life andtraditional fixed universal life products. OMFN will continue tofocus its efforts on expanding its en Español channel to meet theneeds of the US Spanish-speaking market and maintain a leadingposition in the term insurance market.
The retail and brand strategy will evolve as we seek to expand our retail capability with a focus on affluent and middle-marketbaby-boomers by providing solutions that address people’s needsduring the life-cycle of accumulation, protection, retirement income and care.
Risk management Underwriting riskUnderwriting risk is carefully controlled through underwritingprinciples governing product repricing procedures and authoritylimits. The underwriting process takes into account prospectivemortality, morbidity and expense experience, with a largeproportion of the mortality and morbidity risk reinsured to highlyrated companies. In the event that such processes are notadequately designed or operating effectively to project experiences,the business may assume variances to expected earnings levels.
Group Finance Director’s reportcontinued
Policyholder option riskFixed annuity policyholder option risk is managed by investing infixed securities with durations within a half year of the duration ofthe liabilities, with the exception of our longest duration liabilities,which are managed within a year of the liability duration, and cashflows in any period are closely aligned to ensure mismatches areminimal. Extensive interest rate scenario-testing is undertaken, as required by regulatory authorities, to ensure that the amountsreserved are sufficient to meet the guaranteed obligations.
Additionally, the guaranteed returns provided in relation to the fixedindex annuity and variable annuity products are hedged to managethe matching of option payoffs to liability growth, with hedgingpositions reviewed and re-adjusted as necessary. In the event thatmisalignments of assets and liabilities occur, adverse impacts couldresult in a decline in earnings.
US Asset ManagementThrough our US Asset Management business, we combine theinvestment focus of boutique managers with the stability andresources of a large, international firm. We have created anenvironment where unique, entrepreneurial asset managementboutiques can thrive and the investment professionals within themcan do their best work for our clients. We have capitalised on oureconomies of scale and brought best-practice risk management,technology, legal and distribution capabilities to our affiliates. Our firms are free to focus their time and resources on deliveringstrong investment performance.
Business profileOur US Asset Management business, based in Boston andestablished through the acquisition of UAM in 2000, now consists of 20 distinct boutique firms, including asset managerswho specialise in high-quality, active investment strategies forinstitutional clients, high net worth individuals and mutual fundinvestors. Collectively, the Asset Management business offers over 100 distinctive investment strategies. Individually, however,each member firm has its own vibrant, entrepreneurial culture ofinvestment managers focusing on their particular area of expertise.
The business has benefitted strongly from its affiliate structure,offering a diversity of investment styles, minimising exposure to the changing preferences of investors, and benefitting fromefficiency savings resulting from the centralisation of complianceand distribution capabilities.
An award-winning GroupOld Mutual, US2007 ADDY Awards
CategoryTelevision Campaign
AwardBronze award for ‘So Old Mutual”

Old Mutual plc Annual Report and Accounts 2007Directors’ report – Business review 57
Retail accountsThe Old Mutual Advisor Funds offered through our retail distributionarm, Old Mutual Capital, allow individual investors access toinstitutional-quality management in a mutual fund format.
Individual mutual funds are currently offered in a wide range ofasset classes and investment styles. Funds are offered as single-strategy mutual funds, or alternatively as diversified asset allocationfunds under the Pure Portfolio brand. In addition, multi-strategyfunds are offered that leverage the capabilities of our firms as wellas these of selected outside managers.
Single-strategy mutual funds are currently offered by our affiliates inUS equities, fixed income, international equities, emerging markets,real estate investment trusts and money markets.
We achieved exchangeability between our two retail platformsduring 2007, providing investors with the ability to trade in and out of the funds across the platforms, and we have also recentlyrestructured our Asset Allocation funds into a fund-of-fundsstructure, enhancing our flexibility as well as helping to achievescale in many of our single-strategy funds. A fund rationalisationexercise has also recently been initiated, aimed at consolidating or closing underperforming funds during the first half of 2008.
Performance during 2007Another year of strong investment performance and asset growth
Highlights ($m) 2007 20061 % change
IFRS adjusted operating profit 324 259 25%Mutual fund/unit trust sales 3,782 3,088 22%Net client cash flows ($bn) 35.2 31.0 14%Operating margin 27% 27%Funds under management ($bn) 332.6 272.6 22%
1 2006 comparative information has been restated to include OMAM (UK)(transferred from the Skandia UK segment to the US Asset Management segment),and to exclude fund flows related to eSecLending, which was sold in 2006.
The business’s asset mix is weighted towards value equities, fixed income and non-US Dollar-denominated international assets.While the business consists of a diverse range of affiliates, AcadianAsset Management, an international equities firm, is the largestmanager with 25% of total funds under management, havingnearly tripled in size since December 2005. Dwight AssetManagement, a fixed income manager, accounts for 21% of totalfunds under management. Barrow, Hanley, Mewhinney & Strauss,a value equity manager, holds another 20% of the firm’s assets.Over time, the largest firms within US Asset Management maychange, depending on the market environment and investmentstyles currently in favour.
Most affiliates now operate under profit-sharing arrangements, with a certain percentage of operating profit, after overheads andsalaries, paid to the affiliates as variable compensation. Long-termequity plans have also been implemented during 2007 at AcadianAsset Management, Analytic Investors and Thompson, Siegel andWalmsley. Half of our affiliates now own equity in their businesses,and additional implementations are planned for 2008. This modeldifferentiates us from our competitors and, in conjunction with theprofit-sharing arrangements, ensures that the interests of ouraffiliates are closely aligned with those of our shareholders.
US Asset Management’s product range includes the following:
Institutional accountsActively managed investment products are offered in all the majorasset classes and investment styles. The business’s investmentcapabilities span US and global equities, fixed income, real estateand alternative asset classes. Separate accounts and activelymanaged commingled accounts are offered across a range of assetclasses and investment strategies. Our US Asset Managementbusiness has been a pioneer in the market for 130/30 and similarstrategies, which seek to enhance further the alpha producedthrough active management. This is a fast-growing area forinvestors, and these products typically command higher fees. Five of our affiliates (Acadian Asset Management, AnalyticInvestors, Thompson, Siegel & Walmsley, Thomson Horstmann & Bryant, and Dwight Asset Management Company) manageassets in this market. Acadian and Analytic in particular haveestablished excellent five-year track records. We are also seeing a diversification of our client base, with a significant proportion of our net client cash flows coming from investors outside theUnited States.
Perf
orm
ance
New thinkingThe third advertisement in a campaignfocused on “new thinking” and name recognition for Old Mutual’s US direct-to-consumer brand.

Old Mutual plc Annual Report and Accounts 2007Directors’ report – Business review58
Investment performance drives growth in funds under managementStrong investment performance at our affiliates continued to attract new funds during a volatile year in global equity markets. At 31 December 2007, 83% of assets had outperformed theirbenchmarks and 83% were ranked above the median of their peergroup over the trailing three-year period. A pleasing $35.2 billion of net client cash flows, 13% of opening funds under management,were up 14% on 2006 with Rogge, Acadian, Barrow Hanley andDwight the largest contributors. Market appreciation of $22 billionand the acquisition of $3 billion in assets at Ashfield CapitalPartners contributed to an overall increase in funds undermanagement of 22% to $332.6 billion at 31 December 2007.
Retail sales growth continuesOld Mutual Capital’s gross mutual fund sales increased 3% from2006 to $1,408 million despite the impact of volatile marketsduring the second half of the year. At year end, 14 of Old MutualCapital’s mutual funds carried four- or five-star rankings byMorningstar. OMAM (UK)’s unit trust sales increased 38% over2006 to $2,374 million, benefitting from investments made during2006 to enhance the product offering and distribution capabilitiesof the business.
IFRS adjusted operating profit increases 25%Adjusted operating profit for the year was up 25% compared to the prior year, primarily as a result of increased funds undermanagement and higher performance fees. The operating marginremained in line with the prior year, dampened during 2007 byexpenses associated with long-term equity plan implementations.The loss of margin was offset, however, by above-average net clientcash flows. Aligning the interests of our affiliates and shareholdersthrough equity plans is critical to setting us apart in this regard.
Market environment and outlookCompetition in the United States is strong, with each of OldMutual’s Asset Management firms facing significant competitionfrom other specialist providers. The differentiating factors betweenfirms are often investment performance and product capabilities.Our investment managers have a record of delivering excellent long-term performance and, through our ability to leverage thediverse styles of our individual firms, we are able to seek targetedinvestment opportunities to broaden our product capabilities.
Group Finance Director’s reportcontinued
Institutional business remains the anchor of our portfolio, and inthe near term is expected to continue to provide the majority of ourasset growth, as well as support further expansion of our retailbusiness, which will continue to be a focus in 2008. We will alsocontinue to seek opportunities to develop our portfolio of assetmanagers as circumstances evolve.
Global equity markets have had a poor start to 2008, and in theabsence of a recovery this will restrict earnings growth for our USAsset Management business over the coming year. However, ourtrack record of excellent investment performance has positioned us well relative to our competitors, and our diversified asset mix between equities and fixed income will help us weather market volatility.
Risk management Key employee riskThe business’s employees are its most important assets, andcompetition for qualified employees is strong, especially forinvestment professionals. We mitigate the risk of loss of keyemployees through the use of long-term incentive schemes alignedwith shareholder value targets, and through competition restrictionsembedded in employment agreements. If the business cannotcontinue to attract and retain quality employees, or if the costs toattract and retain quality employees rise due to the competition forsuch employees, operations and financial performance could beadversely impacted.
Other Key Performance Indicators – US Asset Management
2007 20061
Annualised revenue full-year impact from net client cash flows ($m) 105 88
Average fee rate (basis points) 30 30Return on capital 11% 10%
1 2006 comparative information has been restated to include OMAM (UK), andexcludes fund flows related to eSecLending, which was sold in 2006.

Old Mutual plc Annual Report and Accounts 2007Directors’ report – Business review 59
Asia Pacific and other
Highlights
> Strong growth in sales
> Continued geographical and distribution expansion
> Healthy new business margins consistent with those of listed competitors
> Pursuing market entry strategy for further expansion
Kotak Mahindra Old Mutual Life InsuranceAn outdoor, print media and radiocampaign for Kotak’s Unit-Linked Child Plans, Headstart Child Plans.
Perf
orm
ance
Business profile Operations in Skandia Group Australia include retail mutual fundsand institutional investment funds. They are structured along twocomplementary business lines:
> Retail: trading as Australian Skandia Limited, focusing on thedelivery and administration of investments and superannuationsolutions for retail investors. The platform is used by licensedfinancial advisers.
> Institutional: currently operating under the Intech brand,providing institutional and corporate clients with multi-managerinvestment solutions.
Old Mutual’s business in China, Skandia:BSAM is a 50:50 jointventure established in 2004 in conjunction with the Beijing State-Owned Asset Management Company (BSAM). It providesunit-linked assurance solutions for high net worth individuals andhas licences to operate in Beijing, Shanghai, Jiangsu Province and Guangdong Province. Distribution is exclusively through thirdparties including banks, securities houses and brokers. China’sunit-linked market is at an early stage of development and haspromising potential in the longer term.
In India, Kotak Mahindra Old Mutual Life Insurance offers a rangeof individual and group life assurance products. Old Mutualcurrently owns a 26% stake in this joint venture with the KotakMahindra Group, with an option to increase this to 49% whenapplicable local legislation permits.
Performance during 2007
Highlights (£m) 2007 2006 % change
Australia unit trust/mutual funds sales 604 5601 8%Australia institutional sales 115 – n/aSkandia:BSAM (China)
gross premiums2 122 38 221%Advisers selling Skandia:BSAM products 2,477 799 210%KMOM (India) gross premiums2 163 108 51%KMOM branches 106 65 63%
1 Skandia businesses included in the 2006 numbers have been adjusted on a pro-forma basis assuming ownership for 12 months rather than 11 months.
2 This represents 100% of the businesses; Old Mutual owns 50% of Skandia:BSAM and 26% of Kotak Mahindra Old Mutual Life Insurance (KMOM).
Funds under management
£6.5bnFunds under managementas percentage of Group
2%Growth in funds undermanagement
12%

Old Mutual plc Annual Report and Accounts 2007Directors’ report – Business review60
Group Finance Director’s reportcontinued
GBP exchange rates AUD RMB INR
Closing 2.26 14.47 78.15Average 2.39 15.23 82.77
In January 2008 we announced the appointment of Steffen Gilbert as Regional Head of Asia Pacific and also the establishmentof our Asia Pacific headquarters in Hong Kong. This will form thebase from which we intend to expand our existing operations in the region.
AustraliaAfter breaking even for the first time in 2006, the business generatedan operating profit of AUD7.8 million (£3.3 million) in 2007. At 31 December 2007, funds under management were AUD14.5billion (£6.4 billion), up 2% from AUD14.2 billion (£5.7 billion) at 31 December 2006. This was made up of institutional funds ofAUD8.7 billion and retail funds of AUD5.8 billion. Integration of theinstitutional business, acquired in late 2006, is now complete and ontrack to generate the expected cost savings. The 2007 John WestPlatform awards in Australia named Australian Skandia Limited asthe rising star for having above-average platform funds undermanagement growth.
ChinaSkandia:BSAM, now in its third full year of operation, continues to show strong sales growth (gross premiums for the year were over three times the prior year). Despite its recent entry into themarket, of the 24 foreign-owned joint venture insurance companiesin China, Skandia:BSAM had, for 2007, the eighth largest grosspremium flows (up two places compared to 2006). Our unit-linkedproduct range was granted “the most welcome financial product”award at the Shanghai Financial Expo 2007. New business marginsare just over 25%, which is higher than our long-term expectations.
IndiaKotak Mahindra Old Mutual Life Insurance Ltd continues to showsteady progress. The business now operates in 74 cities, with 106 branches across India. Gross premiums for the calendar yearwere £163 million, up 51% from £108 million for the prior year. In September we agreed to boost the venture with a capitalinjection of INR1.5 billion (approximately £19 million) in order forthe business to extend its office network and increase its workforce.New business margins are healthy and are consistent with those of listed competitors in the country.
Market environment and outlookOld Mutual continues to see Asia Pacific as a very attractive growthregion characterised by high levels of economic activity and risingdisposable income and personal wealth well suited to qualityprotection and savings products.
Markets within the region are diverse and unsuited to a “one sizefits all” business model. In developing our businesses in the regionour plans reflect different stages of economic development, as wellas varying cultures, languages, legal and regulatory frameworks.
Australia continues to be an attractive market in the Asia Pacificregion for asset gathering activities given the high level of fundsunder management, strong growth and market maturity underpinnedby Government superannuation legislation. While this is a highlycompetitive and regulated market, we continue to see goodopportunities for growth.
Our key Asia Pacific objective is to develop a credible operation interms of both size and profitability. As well as building and wideningour presence in existing markets, we will develop opportunities forgeographic expansion.
We will continue to provide working capital to our Indian andChinese joint ventures to support their further expansion and expectour Australian business to continue to grow profitably in 2008.
Risk management In addition to many of the risks faced by the other Old Mutualbusinesses, Asia Pacific has to contend with the challenges ofoperating in emerging markets with developing economies andregulatory environments. Our management teams have to facethese challenges in small, dynamic, fast growing businesses.Accordingly management of risk is a key priority.
Jonathan NichollsGroup Finance Director27 February 2008
An award-winning GroupAustralian SkandiaJohn West Platform Awards
CategoryMarket growth
AwardRising Star Award

Old Mutual plc Annual Report and Accounts 2007Directors’ report – Business review 61
Forward-looking statementsThis Business Review contains certain forward-looking statementswith respect to certain of Old Mutual plc’s plans and its currentgoals and expectations relating to its future financial condition,performance and results. By their nature, all forward-lookingstatements involve risk and uncertainty because they relate tofuture events and circumstances that are beyond Old Mutual plc’scontrol, including, among other things, UK domestic and globaleconomic and business conditions, market-related risks such as fluctuations in interest rates and exchange rates, policies andactions of regulatory authorities, the impact of competition,inflation, deflation, the timing and impact of other uncertainties or of future acquisitions or combinations within relevant industries,as well as the impact of tax and other legislation and regulations in territories where Old Mutual plc or its affiliates operate.
As a result, Old Mutual plc’s actual future financial condition,performance and results may differ materially from the plans, goals and expectations set forth in Old Mutual plc’s forward-lookingstatements. Old Mutual plc undertakes no obligation to update any forward-looking statements contained in this Business Reviewor any other forward-looking statements that it may make.
Asia Pacific – SkandiaValues posters used by Skandia:BSAMbased on the Group’s values.
Perf
orm
ance

Old Mutual plc Annual Report and Accounts 2007Directors’ report – Board of directors62
Board of directors
Christopher Collins (68)2
F.C.A., has been non-executive Chairmansince May 2005, having been a non-executive director since March 1999. He also chairs the Nomination Committee.He was formerly Chairman of Hanson PLCfrom 1998 until April 2005. He is Chairmanof Forth Ports plc and a non-executivedirector of Go-Ahead Group plc.
Jim Sutcliffe (51)2
B.Sc., F.I.A., became Chief Executive inNovember 2001, having been appointed tothe Board as Chief Executive of the Group’slife assurance businesses in January 2000.He is also a non-executive director ofNedbank Group Limited, Nedbank Limitedand Lonmin plc and a director of TheNelson Mandela Legacy Trust (UK). Beforejoining the Group, he was Chief Executive,UK, of Prudential plc and Chief OperatingOfficer of Jackson National, Prudential’s US subsidiary.
Jonathan Nicholls (50)B.A, A.C.A, F.C.T., has been Group FinanceDirector since November 2006, havingpreviously been Finance Director of HansonPLC from 1996. Prior to that, he heldvarious roles at Abbey National from 1985.During his period at Hanson PLC he initiatedcontinuous improvement at its operationsin over 14 countries and introduced morerigorous capital appraisal and strategicplanning processes. He was formerly anon-executive director of Man Group plc, a role he resigned from on joining the Company.
Julian Roberts (50)B.A, F.C.A, M.C.T., has been Chief Executiveof Skandia since February 2006. He waspreviously Group Finance Director of Old Mutual plc, a position he had heldsince joining the Group in August 2000.He was formerly Group Finance Director ofSun Life & Provincial Holdings plc. Beforejoining Sun Life & Provincial Holdings plc,he was a director and Chief FinancialOfficer of Aon UK Holdings Limited.
Nigel Andrews (60)1,2,3
B.Sc., M.B.A., has been an independentnon-executive director of the Companysince June 2002. He is non-executiveChairman of the Company’s principal US holding company, Old Mutual (US)Holdings, Inc. He is a non-executivedirector of Chemtura Corporation, agovernor of the London Business Schooland a trustee of the Victory Funds.Previously he was an Executive VicePresident and member of the office of theCEO of GE Capital, having spent 13 yearswith The General Electric Company Inc.
Rudi Bogni (60)1,2,3
D.Econ. (Bocconi), has been anindependent non-executive director of theCompany since February 2002 and hechairs the Remuneration Committee. Hewill succeed Mr Broadhurst as the seniorindependent director upon Mr Broadhurst’sretirement in May 2008. Mr Bogni isChairman of Medinvest International SCA,Luxembourg. He is also a member of theboards of the LGT Foundation, CommonPurpose International Limited and ProspectPublishing, and of the governing council of the Centre for the Study of FinancialInnovation. He served previously as amember of the Executive Board and ChiefExecutive, Private Banking, of UBS AG, and before that he was Group Treasurerand a member of the Executive Committeeof Midland Bank plc.
From left to rightNorman BroadhurstJonathan NichollsRichard PymBongani NqwababaChristopher CollinsJim SutcliffeNigel AndrewsLars OtterbeckJulian RobertsRussell EdeyReuel KhozaRudi Bogni

Old Mutual plc Annual Report and Accounts 2007Directors’ report – Board of directors 63
Norman Broadhurst (66)1,2,3
F.C.A., F.C.T., has been an independentnon-executive director of the Company sinceMarch 1999 and the senior independentdirector since May 2005. He chairs theGroup Audit and Risk Committee. Havingserved nine years on the Board, he willretire at the AGM in May 2008 and will not seek re-election. He was Group FinanceDirector of Railtrack plc from 1994 to 2000.He is Chairman of Freightliner Limited,Chloride Group plc and Cattles plc. He is also a non-executive director ofUnited Utilities plc.
Russell Edey (65)1,2
F.C.A., has been an independent non-executive director of the Company sinceJune 2004. He is Chairman of AnglogoldAshanti Limited, deputy Chairman of N MRothschild Corporate Finance Limited and a member of the Conseil de Surveillance of Paris-Orléans, SA. He previously servedon the boards of English China Clays plc,Wassall plc, Northern Foods plc and ExpressDairies plc. His career began in the FinanceDivision of the Anglo American Corporationof South Africa Limited in Johannesburg. In the 1970s he was General Manager –Corporate Finance of Capel CourtCorporation in Melbourne. He joinedRothschild in 1977 and was Head ofCorporate Finance from 1991 to 1996.
Reuel Khoza (58)Eng.D., M.A., has been a non-executivedirector of the Company since January2006 and Chairman of Nedbank Groupsince May 2006. Mr Khoza is Chairman of Aka Capital, which is 25% owned byOld Mutual Life Assurance Company(South Africa) and is the single largestparticipant in Nedbank’s Corporate ClientScheme established as part of its BEEownership arrangements. He is also a non-executive director of Nampak, Protea Hospitality Holdings and Corobrik.His previous appointments includeChairmanship of Eskom and non-executivedirectorships of Glaxo Wellcome SA, IBMSA, Vodacom, the JSE, JCI, Standard Bankand Liberty.
Bongani Nqwababa (41)1
B.Acc., C.A., M.B.A., joined the Board as an independent non-executive directoron 1 April 2007. He has been FinanceDirector of the South African electricityutility group, Eskom Holdings Limited,since 2004. Prior to joining Eskom, he hadbeen Treasurer and CFO of Shell SouthernAfrica. He is currently Chairman of theSouth African Revenue Services (Receiverof Revenue) Audit Committee.
Lars Otterbeck (65)Dr. Econ., has been an independent non-executive director of the Company sinceNovember 2006. He is also Chairman ofSkandia Insurance Company Limited, HakonInvest AB, The Free Enterprise Foundationand Näringslivets Börskommittee (Industryand Commerce Stock Exchange Committee).He is Vice Chairman of the SwedishCorporate Governance Board and of theThird AP Fund as well as a non-executivedirector of AB Svenska Spel.
Richard Pym (58)1
B.Sc., F.C.A., joined the Board as anindependent non-executive director on 1 September 2007. He is a member of the Group Audit and Risk Committee andwill succeed Mr Broadhurst as Chairman of that Committee during 2008. Mr Pymwas Group Chief Executive of Alliance &Leicester plc from 2002 until July 2007,and prior to that he held a number of seniorfinancial and management roles at Alliance& Leicester plc and The Burton Group plc.He is also Chairman of Halfords Group plcand of Brighthouse Group Limited and wasuntil 2007 a Vice President of the BritishBankers Association.
Key:1 Member of the Group Audit and Risk Committee2 Member of the Nomination Committee3 Member of the Remuneration Committee
Gov
erna
nce

Old Mutual plc Annual Report and Accounts 2007Directors’ Report on Corporate Governance and Other Matters64
Directors’ Report on Corporate Governance and Other Matters
Introduction and Combined Code complianceThe Group is committed to achieving high standards of corporategovernance. The organisation is directed and controlled by its Board of Directors, and through systems of delegation andescalation, so as to achieve its business objectives responsiblyand in accordance with high standards of accountability and integrity.
The principal governance rules that apply to UK companies listed on the London Stock Exchange are set out in the Combined Code appended to the Listing, Prospectus, Disclosure andTransparency Rules of the Financial Services Authority (theCombined Code). As the Company’s primary listing is on theLondon Stock Exchange, this report mainly addresses the matterscovered by the Combined Code, but the Company also hasregard to governance expectations in the four other territorieswhere its shares are listed (South Africa, Malawi, Namibia and Zimbabwe).
In the year ended 31 December 2007 and in the preparation of this Annual Report and these Accounts, the Company hascomplied with the main and supporting principles and provisionsset out in the Combined Code as described in the followingsections of this Report. The Company’s compliance withCombined Code provisions C1.1, C2.1, C3.1 to C3.7, and the statement relating to the going concern basis adopted inpreparing the financial statements, have been reviewed by the Company’s auditors, KPMG Audit Plc, in accordance with guidance published by the Auditing Practices Board.
Board of DirectorsMembership and directors’ interestsThe Board currently has 12 members, consisting of threeexecutive and nine non-executive directors. All of the currentdirectors except for Mr Nqwababa and Mr Pym (who wereappointed to the Board in April and September 2007respectively) served throughout the year ended 31 December2007. Mr Michael Marks retired from the Board as a non-executive director and as a member of the Nomination andRemuneration Committees at the end of the Annual GeneralMeeting on 24 May 2007.
Details of the directors’ interests (including interests of theirconnected persons) in the share capital of the Company andquoted securities of its subsidiaries at the beginning and end of the year under review are set out in the following tables, while their interests in share options and restricted share awards are described in the section of the Remuneration Report entitled “Directors’ interests under employee share plans”. There have been no changes to any of these interestsbetween 31 December 2007 and 27 February 2008.
Index to this section of the Report
Introduction and Combined Code compliance 64
Board of Directors 64 > Membership and directors’ interests > Rotation and re-election of directors > Skills, experience and review > Mandate, governance and Scheme of Delegated Authority > Executive and non-executive roles > Independence of non-executive directors > 2007 operations
Group Executive 68
Board Committees 68 > Group Audit and Risk Committee > Remuneration Committee > Nomination Committee > Executive Committee > Group Capital Management Committee > Terms of reference
Attendance record 71
Auditors 71
General Meetings 72 > Results of the Annual General Meeting 2007
Internal control environment 73 > Internal audit > Categorisation as a Major Retail Group > Risk governance > Approach to risk management> Risk appetite > Group risk principles > Risk methodologies > Treasury management
Other Directors’ Report matters 75 > Relations with shareholders and analysts > Employment matters > Directors’ shareholdings and share dealings > Directors’ indemnities > Supplier payment policy > Charitable contributions > Environmental matters > Political donations > Dividend policy> Share capital > Rights and obligations attaching to shares> Significant agreements> Substantial interests in voting rights > Going concern > Disclosure of information to the auditors
Governing law 81

Old Mutual plc Annual Report and Accounts 2007Directors’ Report on Corporate Governance and Other Matters 65
Gov
erna
nce
Rotation and re-election of directorsThe Articles of Association of the Company require that anynewly appointed directors should be subject to election at thenext following Annual General Meeting and also that at least one third of the directors (excluding those appointed by the Board during the year) should retire by rotation each year. These provisions are applied in such a manner that each director submits himself for election or re-election at regularintervals and at least once every three years.
The Nomination Committee considered the candidates who are standing for election or re-election at this year’s AnnualGeneral Meeting (as referred to in Ordinary Resolutions 3 (i) to(iv) in the Notice of Annual General Meeting) at its meeting inFebruary 2008. In accordance with its findings, it recommendsto shareholders the election of Mr Pym, and the re-election of Mr Andrews, Mr Edey and Mr Sutcliffe as directors based upon their respective professional qualifications, prior businessexperience and contribution to the Board. Biographical details ofeach of the candidates are contained in the Board of Directorssection of this document.
Skills, experience and reviewPlans for refreshing and renewing the Board’s composition are managed proactively by the Nomination Committee so as to ensure that changes take place without undue disruptionand that there is an appropriate balance of experience and length of service. That Committee also has regard, in makingrecommendations, to independence of candidates and theirsuitability and willingness to serve on other Committees of the Board. All of these aspects are currently believed by that Committee to be satisfactory and appropriate for therequirements of the Group’s business. While there are currentlyonly three executive directors, members of the Board have regular contact with the other most senior executive management(including the regional heads of the most significant businessunits of the Group), through the periodic participation in Boardmeetings and other briefing sessions by those executives.
Nedbank Old Mutual plc Group Limited
Number of shares Number of shares
At 31 December 2007 N D T Andrews 7,000 –R Bogni 19,000 –N N Broadhurst 2,416 –C D Collins 75,000 –R P Edey 25,000 2,604 R J Khoza – 2,0621
J C Nicholls 106,7642 –B Nqwababa – –L H Otterbeck – –R A Pym 20,000 –J V F Roberts 806,5462 –J H Sutcliffe 1,692,7692 –
Nedbank Old Mutual plc Group Limited
Number of shares Number of shares
At 1 January 2007 (or date of appointment as a director, if later) N D T Andrews 7,000 –R Bogni 19,000 –N N Broadhurst 2,416 –C D Collins 50,000 –R P Edey 25,000 2,550R J Khoza – 2,0621
J C Nicholls –2 –B Nqwababa – –L H Otterbeck – –R A Pym – –J V F Roberts 562,5432 –J H Sutcliffe 1,318,9712 –
Former director (at 1 January 2007 and date of resignation) M J P Marks – –
1 This figure does not include shares in the Aka-Nedbank Eyethu Trust, one of Nedbank’s Eyethu BEE trusts.2 These figures do not include rights to restricted shares that have not yet vested, which are described in the Remuneration Report.
No director had a material interest in any significant contract with the Company or any of its subsidiaries during the year. Additionaldetails of various non-material transactions between the directors and the Group are reported, on an aggregated basis along with othertransactions by senior managers of the Company, in note 47 to the Accounts.

Old Mutual plc Annual Report and Accounts 2007Directors’ Report on Corporate Governance and Other Matters66
Directors’ Report on Corporate Governance and Other Matterscontinued
Mandate, governance and Scheme of Delegated AuthorityThe Board’s role is to provide entrepreneurial leadership to theCompany within a framework of prudent and effective controlsthat enable risk to be assessed and managed. The Board sets theCompany’s strategic aims, ensures that the necessary financialand human resources are in place for it to meet its objectives andreviews management performance. It regularly reviews strategicissues through the Chief Executive’s report and also holds one or more strategy sessions each year at which high-level strategicmatters are debated. The Board sets the Company’s values andstandards, and ensures that its obligations to shareholders andothers are understood and met.
The Board receives a wide array of information on the Group’sbusinesses on a regular basis. Monthly management accountsare circulated to each member of the Board within three weeks of the month end. These contain detailed analysis of the businesses’ financial performance, including comparisonsagainst budget. Any issues arising from these are addressed at Board meetings or can be raised directly with management.The Board calendar ensures that all key matters are dealt with on a scheduled basis over the course of the year, includingpresentations on each of the Group’s major businesses. Boardmeetings are held regularly in the principal overseas territorieswhere the Group operates, at which local management makesdetailed presentations of business and strategic issues affectingthose businesses.
The Board has oversight of the Group’s wholly-ownedbusinesses, but also: (i) delegates specific responsibilities for certain matters to its committees (Executive, Nomination,Remuneration, and Group Audit and Risk), subject to theirrespective terms of reference; and (ii) receives assurance fromboards (and their respective committees) at the Group’s principalsubsidiaries. The governance relationships with the Group’smajority-owned subsidiaries, Nedbank Group Limited andMutual & Federal Insurance Company Limited, are somewhatdifferent, in recognition of their own governance expectations asseparately-listed entities on the JSE and the fact that they eachhave minority shareholders.
With respect to Nedbank Group, the Company entered into a relationship agreement in February 2004 setting out theCompany’s requirements and expectations as its majorityshareholder. The full text of that relationship agreement isavailable on the Company’s website. Among the matters covered are: (i) transactions involving members of the NedbankGroup that require prior consultation with or agreement by theCompany; (ii) provision of information, including that required for assuring the Company about various aspects of corporategovernance; (iii) consultation over senior appointments; and (iv) business co-operation.
The policyholders’ funds of the Group’s African life assuranceoperations have holdings representing in aggregate in excess of 20% of the issued share capital of companies listed on thestock exchanges of the countries in which those businessesoperate. These are held purely as investments, and thecompanies concerned are not subject to the governance or control structures of the Group.
The Chairman and Company Secretary are both involved inensuring good information flows within the Board and itscommittees and between senior management and the non-executive directors, as well as in facilitating induction andencouraging non-executive directors to attend courses at theCompany’s expense to update their skills and knowledge.
On appointment, new directors receive induction, includinginformation about matters of immediate importance to the Group, such as the current budget and strategy documents,management accounts, the Scheme of Delegated Authority anddetails of the Company’s directors’ and officers’ liability policy.They also have a series of meetings with other directors, seniormanagement and external advisers (such as the auditors).
Processes are in place for any potential conflicts of interest to be disclosed and for directors to recuse themselves fromparticipation in any decisions where they may have any suchconflict or potential conflict.
The directors may take independent professional advice at theCompany’s expense for the furtherance of their duties, whetheras members of the Board or of any of its committees.
The Company maintains directors’ and officers’ liability insurancein respect of legal action against its directors.
Directors have access to the Company Secretary, who isresponsible to the Board for ensuring that Board procedures arecomplied with. There is an agreed list of matters reserved for theBoard’s decision. These are set out in the Company’s Scheme ofDelegated Authority and currently include, among other things,the following:
> payment or recommendation of dividends;> approval of results announcements, annual reports and
any other public statements relating to the Group’s financialposition likely to have a material impact on the Group’sreputation;
> approval of the Group’s budgets and the formulation ofmedium- and long-term direction and strategy for the Group;
> establishment of committees of the Board, their constitutionand terms of reference;
> monitoring of compliance with the Group’s environmentalpolicies;
> approval of the acquisition or disposal of any business orinvestment for a consideration of £25 million or more;
> approval of capital expenditure by a principal subsidiary inexcess of its delegated expenditure authority;
> approval of significant changes to the accounting policies or practices of the Group;
> approval of any proposal as a result of which either NedbankGroup Limited or Mutual & Federal Insurance CompanyLimited would cease to be a majority-owned subsidiary of the Company;
> approval of appointments to the Board and renewal of non-executive directors’ appointments, following prior review by the Nomination Committee;
Old Mutual plc Annual Report and Accounts 2007Directors’ Report on Corporate Governance and Other Matters 67
Gov
erna
nce
> approval of any major decision relating to the conduct orsettlement of any material litigation involving the Company or its subsidiaries;
> appointment and removal of the Company Secretary;> appointment or termination of appointment of key professional
advisers to the Group; and> any other matters that are likely to have a material effect on
the Group’s financial position, future strategy or reputation.
Executive and non-executive rolesThe executive element of the Board is balanced by a strongindependent group of non-executive directors so that noindividual or small group of individuals can dominate the Board’s decision-making.
The non-executive directors scrutinise the performance ofmanagement in meeting agreed goals and objectives, andmonitor the reporting of performance. Procedures are in place to enable them to satisfy themselves on the integrity of theGroup’s financial information and that financial controls andsystems of risk management are robust and sustainable. Thosenon-executive directors who are members of the RemunerationCommittee are responsible for determining appropriate levels of remuneration for the executive directors. Members of theNomination Committee have a primary role in recommending the appointment and, where necessary, removal of executivedirectors. The Board as a whole receives and considers regularreports on talent management and succession planning.
Separately from the formal Board meeting schedule, theChairman holds meetings with the other non-executive directors,without any executives being present, in order to provide a forum for any issues to be raised. He also conducts an annualperformance evaluation of each of the other non-executivedirectors, with any resulting action points being reported to theNomination Committee. These are designed to ensure that eachdirector is continuing to contribute effectively and to demonstratecommitment to the role (including commitment of time for Boardand Committee meetings and any other duties). The outputs from these performance evaluations are taken into account bythe Nomination Committee in deciding whether to recommend to the Board the extension of engagement of non-executive directorsand also whether to recommend to shareholders the re-electionof any non-executive directors who are due to retire by rotation at the Annual General Meeting. They would also form the basis, if the need arose, for the Chairman to act to address anyweaknesses identified in the Board by seeking the resignation ofunderperforming directors or proposing, through the NominationCommittee, that additional directors should be appointed.
Informal meetings among the non-executive directors, without the Chairman or any executive being present, are alsofacilitated by the Company. Among the activities carried out atsuch meetings is the annual review of the Chairman’s ownperformance, under the aegis of the senior independent director,who also obtains such input as he considers appropriate for suchpurpose from the executive directors.
Where directors have concerns that cannot be resolved about the running of the Company or a proposed action, they areencouraged to make their views known and these are recorded in the minutes of the Board meeting. No written statements onresignation containing matters of concern, such as are referred to in paragraph A.1.4 of the Combined Code, were received by the Chairman during 2007.
The assignment of responsibilities between the Chairman, Mr Collins, and the Chief Executive, Mr Sutcliffe, is documentedso as to ensure that there is a clear division between the runningof the Board and executive responsibility for running theCompany’s business. This, together with the Scheme ofDelegated Authority and the matters reserved for decision by the Board, ensures that no single individual has unfetteredpowers of decision.
Responsibilities of Mr Collins as Chairman include thosecontained in the Supporting Principle to paragraph A.2 of theCombined Code, namely leadership of the Board, ensuring itseffectiveness in all aspects of its role and setting its agenda;ensuring that the directors receive accurate, timely and clearinformation; ensuring effective communication with shareholders;facilitating the effective contribution to the Board of non-executivedirectors in particular; and ensuring constructive relationshipsbetween the executive and non-executive directors.
The Board has determined that, in the absence of exceptionalcircumstances, no non-executive director’s three-year cycle ofappointment (which is itself subject to re-election and toCompanies Act provisions relating to the removal of a director)should be renewed more than twice, i.e. that non-executivedirectors should serve a maximum of nine years in that role. The renewal of non-executive directors’ terms for successivethree-year cycles is not automatic and the continued suitability of each non-executive director is assessed by the NominationCommittee before renewal of his appointment takes place. A particularly searching review is carried out at the end of six years. The section of the Remuneration Report entitled “Non-Executive Directors’ Terms of Engagement” describes the current position of each of the non-executive directors withrespect to their maximum three terms of three years and how theextension process has been applied to the directors concerned.
The Board conducts an annual self-assessment exercise toevaluate the effectiveness of its procedures. In 2007, this processwas carried out through a detailed questionnaire, with returnsbeing submitted to the Company Secretary, who collated a reporton the outputs for the Chairman and the Board. The Chairmantook these into account in one-to-one meetings between himselfand the other directors, so as to ensure that any concerns about Board processes or capabilities were identified and aired. Various action points were identified as a consequence of the 2007 survey.

Old Mutual plc Annual Report and Accounts 2007Directors’ Report on Corporate Governance and Other Matters68
Directors’ Report on Corporate Governance and Other Matterscontinued
Independence of non-executive directorsSeven of the eight current non-executive directors other than the Chairman (Messrs. Andrews, Bogni, Broadhurst, Edey,Nqwababa, Otterbeck and Pym) are considered by the Board to be independent within the meaning of, and having regard tothe criteria set out in, paragraph A.3.1 of the Combined Code –i.e. independent in character and judgement and there being no relationships or circumstances which are likely to affect, orcould appear to affect, their judgement. Mr Marks, who retiredduring the year, was also considered to be independent. TheBoard decided in February 2006, following a review by theNomination Committee, that it was not appropriate to classify Mr Khoza as independent in view of the business interestsbetween his company, Aka Capital, and the Company’s banking subsidiary, Nedbank.
Mr Broadhurst has been the senior independent director sinceMay 2005 and will be succeeded in that role, following hisretirement from the Board at the Annual General Meeting on 8 May 2008, by Mr Bogni. The senior independent director is available to shareholders if they have concerns that areunresolved after contact through the normal channels of theChairman, Chief Executive or Group Finance Director or wheresuch contact would be inappropriate. The senior independentdirector’s contact details can be obtained from the CompanySecretary ([email protected]).
The terms and conditions of engagement of each of the non-executive directors are available in the Corporate Governancesection of the Company’s website. These include details of theexpected time commitment involved (which each of the non-executive directors has accepted). Other significant commitmentsof potential appointees are considered by the NominationCommittee as part of the selection process and are disclosed to the Board when recommendation of an appointment issubmitted. Non-executive directors are also required to inform the Board of any subsequent changes to such commitments,which must be pre-cleared with the Chairman if material.
The executive directors are permitted to hold one external (i.e.non-Group) non-executive directorship (but not a chairmanship)of another listed company, subject to prior clearance by theBoard and the directorship concerned not being in conflict orpotential conflict with any of the Group’s businesses. Mr Sutcliffewas appointed as a non-executive director of Lonmin plc from 10 August 2007. Neither Mr Nicholls nor Mr Roberts currentlyholds any external non-executive directorships of another publiclyquoted company.
2007 operationsThe Board meets regularly during the year and met nine times on a scheduled basis during 2007. Meetings are co-ordinatedwith the Company’s reporting calendar to allow for detailedconsideration of interim and preliminary results and quarterlybusiness updates. Scheduled sessions are also devotedspecifically to strategy and business planning. In addition, the Board meets ad hoc, as and when required, to deal with specific matters requiring its consideration. It met ad hoctwice during 2007.
The scheduled Board meetings in 2007 included visits to the Group’s businesses in South Africa and to Skandia UK inSouthampton. These visits included presentations to the Boardby the senior management teams of the local businesses.
Group ExecutiveThe Group Executive (formerly known as the Old MutualExecutive) is the executive management committee throughwhich the Company exercises its co-ordination and stewardshipof the Group.
In addition to the executive directors of the Company (Mr Sutcliffe, Mr Nicholls and Mr Roberts), the other members of the Old Mutual Executive at 31 December 2007 were Mr Head and Mr Powers as the regional heads of South Africaand the USA respectively, and Mrs Harris, the Group RiskDirector. The Company Secretary also serves as Secretary to the Group Executive.
Board CommitteesThe Board has a number of standing committees or sub-committees, to which various matters are delegated inaccordance with their respective terms of reference. The Boardalso establishes committees on an ad hoc basis to deal withparticular matters as and when thought fit. In doing so, itspecifies a remit, quorum and appropriate mix of executive and non-executive participation. Further information on the main standing committees and sub-committees of the Board is set out below.
Group Audit and Risk CommitteeMembers and years of appointment: N N Broadhurst(Chairman) (1999), N D T Andrews (2003), R Bogni (2002), R P Edey (2004), B Nqwababa (2007), R A Pym (2007).Secretary and year of appointment: M C Murray (1999)All of the members of the Group Audit and Risk Committee are independent non-executive directors. The Chairman, Mr Broadhurst, is a Chartered Accountant and has recent andrelevant financial experience as a former finance director and as Chairman or non-executive director of a number of other major UK companies. Upon his retirement from the Board at theAnnual General Meeting on 8 May 2008 he will be succeeded as Chairman of the Committee by Mr Pym (subject to Mr Pymhimself being duly elected at that meeting). Mr Pym is also aChartered Accountant with a wide range of recent and relevantfinancial experience, having been Chief Executive of the major UK banking group, Alliance & Leicester plc, until July 2007. All members of the Committee are expected to be financiallyliterate and to have relevant corporate finance experience.
The Committee:
> monitors the integrity of the financial statements of theCompany and any formal announcements relating to theCompany’s financial performance, including reviewingsignificant financial reporting judgements contained in them;
> reviews the Company’s internal financial controls;> monitors and reviews the independence and effectiveness
of the Company’s internal audit function and its activities. An internal audit charter, reviewed and approved by theCommittee, governs internal audit activity within the Groupand such activities are conducted in accordance with anannual audit plan. Progress against that plan is reportedregularly to the Committee;

Old Mutual plc Annual Report and Accounts 2007Directors’ Report on Corporate Governance and Other Matters 69
Gov
erna
nce
> receives and reviews reports on risk matters;> makes recommendations to the Board, for it to put to
shareholders for their approval in general meeting, in relation to appointment, reappointment and removal of the external auditors and approving their remuneration and terms of engagement;
> reviews and monitors the external auditors’ independence and objectivity and the effectiveness of the audit process,taking into consideration relevant UK professional andregulatory requirements;
> develops and implements policy on the engagement of theexternal auditors to supply non-audit services, taking intoaccount relevant ethical guidance regarding the provision ofnon-audit services by the external audit firm, reporting to theBoard any matters in respect of which it considers that actionor improvement is needed and making recommendations asto the steps to be taken; and
> reviews the Group’s whistleblowing arrangements.
At its meetings during 2007, the Committee received reportscovering, among other things:
> the accounting principles, policies and practices adopted inthe Group’s accounts;
> significant accounting and actuarial issues; > Economic Capital principles that are being adopted by
the Group;> tax, litigation and contingent liabilities affecting the Group;> any significant findings or control issues arising from internal
audits carried out around the Group; > environmental and corporate responsibility matters; and> significant risks and related risk management practices across
the Group.
A number of audit or audit and risk committees operated atsubsidiary level during 2007, including at Old Mutual LifeAssurance Company (South Africa) Limited, Old Mutual (US)Holdings, Inc., Skandia AB, Skandia UK, Skandia Nordic,Skandia Europe & Latin America (the latter two from the fourthquarter of the year), Nedbank Group Limited and Mutual &Federal Insurance Company Limited, with terms of reference (in relation to the businesses under their respective remit) broadlyequivalent to those of the Committee. The Committee receivedminutes of the proceedings and reports from subsidiary auditcommittees on a regular basis and the Chairmen of various ofthese subsidiary audit committees were invited to attendmeetings of and report to the Committee periodically. A planningmeeting was held between the Chairman of the Committee and the Chairmen of the main subsidiary audit committees, the regional heads of internal audit and representatives of theGroup’s auditors during November 2007, to co-ordinate the auditcommittees’ activities and to review and approve the scope ofinternal audit plans for 2008. Such planning meetings take place annually.
During 2007, the Group established Internal Review Committeesthrough which Group Finance reviews in detail the results of the major businesses on a half-yearly basis in conjunction withthe Chief Executives and Finance Directors of the businessescovered. Alongside these meetings, an Internal Actuarial ReviewCommittee meets to review the actuarial aspects of the results of the life businesses around the Group. Findings from thesemeetings are incorporated into reports to the Group Audit andRisk Committee.
The Committee is responsible for the development,implementation and monitoring of the Group’s policy on externalaudit. The policy assigns overall responsibility for monitoring the independence and objectivity of, and compliance with ethical and regulatory requirements by, the external auditors to the Committee and day-to-day responsibility to the GroupFinance Director.
The Group’s policy on external audit sets out the categories ofnon-audit services that the external auditors are and are notallowed to provide to the Group. Further details of this policy are set out under the heading “Auditors” later in this report.
To fulfil its responsibility regarding the independence of theexternal auditors, the Committee reviewed:
> changes in key external audit staff in the external auditors’plan for the year;
> the arrangements for day-to-day management of the auditrelationship;
> a report from the external auditors describing theirarrangements to identify, report and manage any conflicts of interest; and
> the overall extent of non-audit services provided by theexternal auditors, in addition to their case-by-case approval of the provision of non-audit services by the external auditors.
To assess the effectiveness of the external auditors, theCommittees reviewed:
> the external auditors’ fulfilment of the agreed audit plan and variations from the plan; and
> the robustness and perceptiveness of the auditors in theirhandling of the key accounting and audit judgements.
To fulfil its responsibility for oversight of the external auditprocess, the Committee reviewed:
> the terms, areas of responsibility, associated duties and scopeof the audit as set out in the external auditors’ engagementletter for the year;
> the external auditors’ overall work plan for the year;> the external auditors’ fee proposal;> any major issues that arose during the course of the audit
and their resolution;> the key accounting and audit judgements;> the levels of errors identified during audit; and> any recommendations made by the external auditors
in their management letter and the adequacy ofmanagement’s response.
Based on its satisfaction with the results of the activities outlinedabove, the Committee has recommended to the Board that theexternal auditors should be reappointed for 2008.
The Committee’s role in relation to monitoring of risk is explainedin more detail in the “Risk governance” section of this report.

Old Mutual plc Annual Report and Accounts 2007Directors’ Report on Corporate Governance and Other Matters70
Directors’ Report on Corporate Governance and Other Matterscontinued
In relation to internal audit, the Committee reviewed:
> internal audit’s terms of reference, reporting lines and accessto the Committee and members of the Board;
> internal audit’s plans and resources and its achievement of the activities planned as part of its agreed programme for the year;
> the results of key audits and other significant findings, theadequacy of management’s responses and the timeliness of resolution; and
> statistics on staff numbers, qualifications and experience and timeliness of reporting.
The Group’s whistleblowing arrangements enable employees of the Group and others to report, in confidence, via a dedicatedhotline operated by an independent firm of accountants,complaints on accounting, risk issues, internal controls, auditing issues and related matters. Any matters so reported are investigated and escalated to the Committee as appropriate.Efforts are also made to educate staff around the Group about the existence of the whistleblowing facility and to help themdetect the signs of possible fraudulent or improper activity.
The Committee holds private meetings with the external auditorstwice yearly (or more often, if requested by the auditors) toreview key issues. The Chairman of the Committee also hasregular interaction with the external auditors, the Group InternalAudit Director and the Group Risk Director, as well as with theChairmen of subsidiary audit committees and the Group FinanceDirector, so as to remain abreast of issues as they arise duringthe year.
Remuneration CommitteeMembers and years of appointment: R Bogni (Chairman)(2005), N D T Andrews (2002), N N Broadhurst (1999), R P Edey (2007). Other member during part of the year: M J P Marks (appointed 2004, ceased on 24 May 2007).Secretary and year of appointment: M C Murray (1999) Details of the role and activities of the Remuneration Committeeand how the Remuneration Committee and the Board haveapplied the main and supporting principles and the CodeProvisions in Section B of the Combined Code relating toremuneration matters are provided in the Remuneration Report.
Nomination CommitteeMembers and years of appointment: C D Collins (1999, becameChairman in May 2005), N D T Andrews (2005), R Bogni(2003), N N Broadhurst (1999), R P Edey (2005), J H Sutcliffe(2003). Other member during part of the year: M J P Marks(appointed 2005, ceased on 24 May 2007). Secretary and year of appointment: M C Murray (1999)The Nomination Committee makes recommendations to theBoard in relation to the appointment of directors, the structure of the Board and membership of the Board’s main standingcommittees. It also reviews development and succession plansfor the most senior executive management of the Group andproposed appointments to the boards and standing committeesof principal subsidiaries where these are material in the contextof the Group as a whole. It is chaired by the Chairman of theBoard, Mr Collins, and a majority of its members (four out of six)are independent non-executive directors.
The Nomination Committee seeks to ensure that its process for identifying candidates for recommendation to the Board asnew directors is formal, rigorous and transparent. Vacanciesgenerally arise in the context of either planned refreshing andrenewal of the Board, replacing directors who are due to retire, or adjusting the balance of knowledge, skills or independence of the Board.
Mr Nqwababa’s appointment (which took effect from 1 April2007) was recommended by the Committee to replenish SouthAfrican representation on the Board following the resignation of Professor Nkuhlu in October 2006, and his candidature wasestablished through a shortlisting of potential suitable appointeesagainst a job specification, with assistance from externaladvisers. Mr Pym was appointed as a non-executive director from 1 September 2007 following a search conducted throughindependent headhunters for a candidate with appropriatefinancial services and accounting experience to be a potentialsuccessor to Mr Broadhurst (who is retiring at the Annual General Meeting in May 2008) as Chairman of the Group Audit and Risk Committee.
In identifying candidates, appropriate regard is paid to ensuringthat they will have sufficient time available in the light of theirother commitments to discharge their duties as directors of the Company.
Executive CommitteeMembers: J C Nicholls, J V F Roberts, J H Sutcliffe The Executive Committee is a committee comprising theexecutive directors of the Company, to which executive controland decision-making are delegated, subject to reservation ofmatters that require approval by the Board itself. A quorumcomprises two of the executive directors. The Committee met ten times during 2007.
Group Capital Management CommitteeMembers and years of appointment: J C Nicholls (Chairman)(2006), A Duncan (2006), R Harris (2007), D I Hope (2002),M Mittal (2006), J H Sutcliffe (2002). Secretary and year ofappointment: J Simpson (2007)The Group Capital Management Committee is a sub-committeeof the Executive Committee. Its role is: (i) to agree capitalallocation up to the delegated authority of the ExecutiveCommittee, or make recommendations to the Board forallocations in excess of the Executive Committee’s authority; (ii) to recommend to the Board the most appropriate capitalstructure for the Group having regard to long-term strategicobjectives, the current business plan, risk appetite parametersand target credit ratings; (iii) to sign off a capital plan for the Group as part of the annual business planning process; (iv) to allocate capital in accordance with the business plan; (v) to approve the overall investment strategy of the Group’sshareholders’ funds; (vi) to set an appropriate framework formanaging capital and to issue guidelines and/or recommendtargets in order to ensure the appropriate management of capital;(vii) to receive reports from Group Finance, Group Risk andbusiness units so that it can monitor performance against agreed criteria; and (viii) to consider and approve any changes in required capital outside that agreed in the business plan,including the remittance or withdrawal of capital from business units.

Old Mutual plc Annual Report and Accounts 2007Directors’ Report on Corporate Governance and Other Matters 71
Gov
erna
nce
Terms of referenceThe terms of reference of each of the principal committees of the Board are available in the Corporate Governance section of the Company’s website.
The membership and chairmanship of the Board’s standingcommittees are regularly reviewed by the Nomination Committeeso as to ensure that they are refreshed and that undue reliance is not placed on particular individuals.
Each of the Group Audit and Risk, Remuneration andNomination Committees conducted a self-assessment exerciseduring 2007 to address, among other things, whether theirrespective terms of reference had been fulfilled satisfactorilyduring the year, whether the Committees had the necessary skills and resources and were receiving a satisfactory level of information in order to discharge their responsibilities, andwhether their processes and methods could be improved. These were each conducted via questionnaires to members of the Committee concerned and other key participants in theCommittee’s activities (including the external auditors, in the case of the Group Audit and Risk Committee). The results
AuditorsDuring the year ended 31 December 2007, fees paid by the Group to KPMG Audit Plc, the Group’s auditors, and itsassociates (KPMG) totalled £9.6 million for statutory auditservices (2006: £9.9m), £0.4 million for other audit andassurance services relating to European Embedded Valuereporting (2006: £0.3 million), and £3.9 million for tax andother services (2006: £3.4 million). In addition to the above,Nedbank Group paid a further £2.5 million (2006: £2.9 million)to Deloitte in respect of joint audit arrangements.
The following guidelines have been approved by the Group Audit and Risk Committee as part of the Group’s policy on non-audit services:
Board Group(scheduled Audit and Risk Remuneration Nomination and ad hoc) Committee Committee Committee
Number of meetings held 11 5 5 5N D T Andrews 11/11 5/5 4/5 4/5R Bogni 11/11 5/5 5/5 4/5N N Broadhurst 11/11 5/5 5/5 5/5C D Collins 11/11 – – 5/5R P Edey 11/11 5/5 3/3 5/5R J Khoza 11/11 – – –J C Nicholls 10/11 – – –B Nqwababa 8/9 1/2 – –L H Otterbeck 11/11 – – –R A Pym 5/5 1/1 – –J V F Roberts 11/11 – – –J H Sutcliffe 11/11 – – 5/5
Former directorM J P Marks 4/4 – 2/2 2/2
were collated by the Company Secretary and reported to the Committees for consideration.
Attendance recordThe table below sets out the number of meetings held andindividual directors’ attendance at meetings of the Board and itsprincipal standing committees (based on membership of thosecommittees, rather than attendance as an invitee) during 2007.
Messrs Collins, Nicholls and Sutcliffe attended all of the Group Audit and Risk Committee meetings held during the year, at the invitation of the Chairman of that Committee (but members of management were absent for the privatesessions between members of that Committee and the auditors).Mr Collins and Mr Sutcliffe also attended all of the Remuneration Committee meetings at the invitation of the Chairman of that Committee, but absented themselves for any matters relating to their own respective remuneration arrangements.Attendance at Committee meetings by persons other than the members is always at the invitation of the Chairman of the Committee concerned.
> prior to accepting a proposed non-audit engagement, the lead audit engagement partner and management willassess the threats to objectivity and independence andconsider safeguards to be applied. Such assessment will be repeated whenever the scope and objectives of the non-audit service change significantly. Before accepting a proposed engagement to provide a non-audit service to the Group and its subsidiaries, the audit engagement partner and management will:– consider whether it is probable that a reasonable and
informed third party would regard the proposed engagementas being inconsistent with the objectives of the audit of thefinancial statements;

Old Mutual plc Annual Report and Accounts 2007Directors’ Report on Corporate Governance and Other Matters72
Directors’ Report on Corporate Governance and Other Matterscontinued
– identify and assess the significance of any related threats to the firm’s objectivity including any perceived loss ofindependence; and
– identify and assess the effectiveness of the availablesafeguards to eliminate or reduce threats to an acceptable level;
> where it is assessed that it is probable that an informed party would regard the proposed service as being inconsistentwith the objectives of the firm as auditors, the firm will not be permitted to undertake the non-audit service;
> reports are tabled quarterly at Group Audit and RiskCommittee meetings setting out the details of the non-auditservices being provided by the Group’s auditors. Theseinclude a comparison of fees paid for audit services and feespaid to other accounting firms engaged for similar services;
> the Company and its auditors have agreed that they will not,directly or indirectly, solicit the employment of key senior staffand management of the respective organisations without priorwritten mutual consent. Partners and directors of the auditfirm who have acted as lead partner or as a key audit partnerfor the Group will not be permitted to join Old Mutual Groupas a director or in a senior management position until at leasttwo years have passed since the partner/director ceased to beassociated with the audit.
The following process governs the provision of non-audit servicesprovided by the auditors:
> there is a schedule of non-audit services that need to beapproved in principle on an annual basis and are reported, as and when provided, on a regular basis. This is in line withthe SEC’s guidelines on auditor independence;
> all non-audit work costing less than £50,000 placed with the external auditors is to be approved by the Head of GroupFinance or Business Unit Chief Financial Officer;
> all non-audit work in excess of £50,000 placed with the external auditors is to be agreed by the Group FinanceDirector or his designate;
> all non-audit work in excess of £300,000 placed with the external auditors is to be subject to competitive tender and agreed by the Group Finance Director and Group Chief Executive;
> all non-audit work in excess of £1 million placed with external auditors is to be approved by the Group Audit andRisk Committee;
> cumulative fees in respect of non-audit services for anyfinancial quarter should not exceed £250,000 withoutapproval of the Group Audit and Risk Committee or its Chairman; and
> cumulative fees in respect of non-audit work for the Groupshould not exceed total statutory audit and audit-related feesin any one year without the approval of the Group Audit andRisk Committee.
KPMG Audit Plc has expressed its willingness to continue in office as auditor to the Company and, following arecommendation by the Group Audit and Risk Committee to the Board, a resolution proposing its reappointment will be put to the Annual General Meeting (Resolution 4 in the Notice of Annual General Meeting).
Arrangements have been made, in conjunction with KPMGAudit Plc, for appropriate audit partner rotation in accordancewith recommendations of the Institute of Chartered Accountantsin England and Wales. The current lead audit partner in the UK, Mr Alastair Barbour, has been in place since 2005.
General MeetingsThe Board uses the Annual General Meeting (AGM) to commenton the Group’s trading performance during the first quarter of theyear. A record of the AGM proceedings is made available on theCompany’s website shortly after the end of the Meeting. All itemsof formal business at the AGM are conducted on a poll, ratherthan by a show of hands. The Company has arrangements inplace through its registrars, Computershare Investor Services, toensure that all validly submitted proxy votes are counted, and a senior member of Computershare’s staff acts as scrutineer to ensure that votes cast are properly received and recorded.
Each substantially separate issue at the AGM is dealt with by aseparate resolution and the business of the AGM always includesa resolution relating to the approval of the Report and Accounts.The Chairmen of the Group Audit and Risk, Remuneration andNomination Committees are available to answer any questionson the matters covered by these Committees at AGMs. All of the directors who were in office at the date of the meetingattended the AGM in 2007, except Mr Edey, who was preventedfrom doing so by an injury.
The notice of AGM and related materials contained in the Reportand Accounts or Summary Financial Statements are sent out toshareholders in time to arrive in the ordinary course of the post at least 20 working days before the date of the AGM.
Results of the Annual General Meeting 2007The results of the polls on the resolutions at the Annual GeneralMeeting held on 24 May 2007 were as follows:
Ordinary resolutionsResolution 1To receive and adopt the directors’ report and accounts for theyear ended 31 December 2006
In favour Against % in favour Votes withheld*
2,810,830,189 1,967,510 99.93 6,413,431
Resolution 2To declare a final dividend of 4.15 pence per ordinary share
In favour Against % in favour Votes withheld*
2,815,469,616 168,829 99.99 3,592,776
Resolution 3 (i)Election of Mr J C Nicholls as a director of the Company
In favour Against % in favour Votes withheld*
2,810,691,700 1,119,976 99.96 7,397,855

Old Mutual plc Annual Report and Accounts 2007Directors’ Report on Corporate Governance and Other Matters 73
Gov
erna
nce
Resolution 3 (ii)Election of Mr B Nqwababa as a director of the Company
In favour Against % in favour Votes withheld*
2,809,858,333 1,303,057 99.95 8,048,141
Resolution 3 (iii)Re-election of Mr L H Otterbeck as a director of the Company
In favour Against % in favour Votes withheld*
2,811,788,762 1,114,560 99.96 6,305,399
Resolution 3 (iv)Re-election of Mr C D Collins as a director of the Company
In favour Against % in favour Votes withheld*
2,812,692,028 958,766 99.97 5,580,427
Resolution 3 (v)Re-election of Mr J V F Roberts as a director of the Company
In favour Against % in favour Votes withheld*
2,786,118,762 9,971,030 99.64 23,123,449
Resolution 4Reappointment of KPMG Audit Plc as auditors to the Company
In favour Against % in favour Votes withheld*
2,783,940,615 10,549,301 99.62 24,711,305
Resolution 5Authority to the Group Audit and Risk Committee of the Companyto settle the remuneration of the auditors
In favour Against % in favour Votes withheld*
2,810,056,611 3,168,099 99.89 5,975,899
Resolution 6Approval of the Remuneration Report in the Company’s reportand accounts
In favour Against % in favour Votes withheld*
2,453,741,960 334,922,846 87.68 20,545,643
Resolution 7Approval of proposals arising from the closure of the Company’sUnclaimed Shares Trusts
In favour Against % in favour Votes withheld*
2,800,708,336 4,574,525 99.84 13,926,854
Resolution 8Authority to allot relevant securities up to an aggregate nominalamount of £55,009,000
In favour Against % in favour Votes withheld*
2,438,807,540 374,173,883 86.70 5,826,885
Special resolutionsResolution 9Authority to allot equity securities up to a maximum nominalaggregate amount of £27,504,000
In favour Against % in favour Votes withheld*
2,459,018,515 353,633,160 87.43 6,158,842
Resolution 10Authority in accordance with section 166 of the Companies Act1985 to purchase up to 550,090,000 Ordinary Shares of 10peach in the Company by way of market purchase
In favour Against % in favour Votes withheld*
2,810,630,662 3,563,066 99.87 4,614,579
Resolution 11Approval of contingent purchase contracts to enable shares to be bought back on the overseas stock exchanges where theCompany’s shares then had secondary listings
In favour Against % in favour Votes withheld*
2,807,228,994 4,278,373 99.85 7,222,098
* A vote withheld is not a vote in law and is therefore not counted in the calculationof votes.
Each of the resolutions at the 2007 AGM was accordingly duly passed.
Internal control environmentThe Board retains its overall responsibility for the Group’s systemof internal control and for reviewing its effectiveness, while therole of executive management is to implement Board policies onrisk and control.
Executive management has implemented an internal controlsystem designed to facilitate the effective and efficient operationof the Group and its business units, enabling management to respond appropriately to significant risks to achieving theGroup’s business objectives. It should be noted that the system is designed to manage, rather than eliminate, the risk of failure to achieve the Group’s business objectives, and can only provide reasonable, and not absolute, assurance against material misstatement or loss.
This system of internal control helps to ensure the quality ofinternal and external reporting, compliance with applicable lawsand regulations, and internal policies with respect to the conductof business.
The Board has reviewed the effectiveness of the system ofinternal control during and at the end of the year. This reviewcovered all material controls, including financial, operational and compliance controls and the risk management framework.
The Board is of the view that there is a sufficient ongoing processfor identifying, evaluating and managing the significant risksfaced by the Group, and that this process has been in place for the year ended 31 December 2007 and up to the date ofapproval of this Report. The process accords with the Turnbullguidance set out in “Internal Control Guidance for Directors onthe Combined Code” and is regularly reviewed by the Board.

Old Mutual plc Annual Report and Accounts 2007Directors’ Report on Corporate Governance and Other Matters74
Directors’ Report on Corporate Governance and Other Matterscontinued
Internal auditThe Group Internal Audit (GIA) function operates on a decentralised basis, with teams established at all majorbusinesses. Internal audit carries out regular risk-focused reviewsof the control environment and reports on these to local executivemanagement. The Director, Group Internal Audit has access to all reports issued by each audit team, and prepares a report to the Group Audit and Risk Committee. He reports functionallyto the Chairman of the Group Audit and Risk Committee andadministratively to the Group Risk Director and also enjoysunrestricted access to the Chief Executive and the auditcommittees of the Group’s principal subsidiaries.
The internal audit function has adopted a single auditmethodology, aligned to current international standards by GroupRisk Services, which is a centralised function responsible forensuring quality and consistency of risk management practicesand internal audit working practices around the Group.
An extensive independent review of internal audit by externalexperts was carried out in 2007, in keeping with the IIA’sStandards of Professional Practice and GIA was found to be in compliance with the requirements of the IIA.
Categorisation as a Major Retail GroupOld Mutual plc was recategorised as a Major Retail Group by the UK Financial Services Authority for the purposes ofregulatory supervision following the Group’s acquisition of Skandia during 2006.
Risk governanceThe Group’s risk governance model is based on three lines ofdefence. This model distinguishes between functions owning and managing risks, functions overseeing the management ofrisks, and functions providing independent assurance.
Risk managementunder the first line of defence, the Board sets the Group’s risk appetite, approves the strategy for managing risk and is responsible for the Group’s system of internal control.Management and staff within each business have the primaryresponsibility for managing risk, while the Chief Executive,supported by the Group Executive, has overall responsibility forthe management of risks facing the Group. Management andstaff within the businesses are responsible for the identification,assessment, management, monitoring and reporting of enterpriserisks arising within their respective areas.
Risk oversightThe second line of defence is provided by the Group Risk Directorsupported by subsidiary Chief Risk Officers and their respectiveRisk functions. In addition, other specialist in-house functions at Company and subsidiary levels, such as Treasury, Actuarialand Legal, provide technical support and advice to operatingmanagement to assist them with the identification, assessment,management, monitoring and reporting of financial and non-financial risks. The Group risk function recommends Group RiskPrinciples to the Board for approval, provides objective oversightand co-ordinates enterprise risk management (ERM) activities in conjunction with other specialist risk-related functions.
Independent assuranceThe third line of defence is designed to provide independentobjective assurance on the effectiveness of the management ofenterprise risks across the Group. This is provided to the Boardthrough GIA, the external auditors and the Group Audit and Risk Committee, supported by Audit and Risk Committees at subsidiaries.
Approach to risk managementThe Group derives its approach to risk management and controlfrom a shareholder value perspective. As a result, the risk processis based on an ERM concept, which takes a holistic approach to the managed acceptance of risks on an enterprise-wide basis.This involves identifying the key risks that affect the achievementof the Group’s objectives. Risks are assessed on an inherentbasis, by establishing the main influences on the risks in theabsence of any controls. The residual risk is assessed afteridentifying the controls in operation. Where the residual level isoutside the risk appetite, further controls and action are identifiedto bring the risks within the risk appetite. Risk management isnot limited solely to the downside or risk avoidance, but is abouttaking risk knowingly and using this for competitive advantage.
In order to meet its ERM objectives, the Group follows aframework which contains the following components: (i) a robust risk governance structure; (ii) risk appetites established at Group and subsidiary level; (iii) Group-wide risk policies and risk language; and (iv) methodologies that focus on riskidentification, risk measurement, risk assessment, action plans,monitoring and reporting. Each component is explained in moredetail in the sections below.
A review of the Group’s ERM practices and framework wasinitiated in late 2007. The results will be used to enhanceexisting practices and to ensure that the Group continues toemploy world-class risk management practices.
Risk appetiteThe Group’s risk appetite defines the Group’s willingness to balance risk exposures with reward, and the management and monitoring of those exposures. Risks or events outside the agreed risk appetite are identified and reviewed with remedial action agreed and then are subject to oversight by executive management and agreed by the Group Audit and Risk Committee. The Group’s risk appetite encompasses: (i) volatility and quantum of returns to shareholders; (ii) value for money for customers; (iii) financial strength ratings; (iv) regulatory solvency; and (v) how risks are monitored and controlled. Compliance with the risk appetite is monitored through the quarterly business review process.
Group risk principlesGroup risk principles have been established for each major risk category to which the Group is exposed. These are designed to provide management teams across the Group with guiding principles and requirements within which tomanage risks. Business unit risk policies expand on theseprinciples and contain detailed requirements for the specificbusiness concerned.
Old Mutual plc Annual Report and Accounts 2007Directors’ Report on Corporate Governance and Other Matters 75
Gov
erna
nce
Adherence to these principles provides the Board and theCompany’s stakeholders with assurance that high-level commonstandards are consistently applied throughout the Group and alsocontributes to strong governance within the Group.
Risk methodologiesRisk identificationStrategic objectives, reflecting management’s choice as to howthe Group will seek to create value for its stakeholders, aretranslated into business unit objectives. Risks (and risk events)that would prevent the achievement of both the strategic andbusiness objectives are then identified. Risk identification is thuspart of the annual business planning process as well as anongoing process.
Risk assessment and measurementVarious means of assessing, categorising and measuringenterprise risks and risk events are used throughout the Group.These include estimating the financial impact and the likelihoodof risk occurrence, trend and “traffic light” assessments andhigh/medium/low assessments.
Action plansAction plans to implement the risk management strategy in respect of key risks or to remedy a material breakdown in control are recorded on risk and control logs maintained by each business unit. The expected date of mitigation of the risk is recorded, along with the person responsible for the mitigating action.
Monitoring and controlThe Board regularly receives and reviews reports on risks andcontrols across the Group. These reviews cover all materialcontrols, including financial, operational and compliance controlsand risk management systems.
Management teams in each subsidiary and business unit performannual reviews of the control environment in their business.
Risk monitoring is undertaken at Group, principal subsidiary and business unit level by management, specialised riskmanagement functions, internal audit and subsidiary auditcommittees. The following are some of the other key processesfor risk monitoring used around the Group:
> the Group Finance Director provides the Board with monthlyperformance information, which includes key performanceindicators;
> items on risk logs and control logs (which contain details ofany control failures) are reported pursuant to an escalationprotocol to the appropriate level of management board orcommittee, where rectification procedures and progress areclosely monitored;
> significant corrective actions are independently monitored for timely completion by internal audit and, as appropriate, by the relevant Audit and Risk Committee;
> exposure reporting, risk concentrations and solvency andcapital adequacy reports are submitted to the relevant creditand capital management committees in the normal course of business. Where exposures are in excess of limits, they are treated in the same way as control breakdowns andreported on the relevant control log for Audit and RiskCommittee review.
ReportingAs part of the Board’s review process, the Chief Executive of each of the Group’s major businesses completes a Letter of Representation at half year and for the full year. This Letterconfirms that there has been no indication of any significantbusiness risk occurring, nor any material malfunction in controls,procedures or systems during the reporting period, resulting inloss or reputational damage, which impacts negatively on theattainment of the business’s objectives during the year and up to the date of approval of the Annual Report. Exceptions arenoted and reported. In addition the Letter confirms that thebusiness unit will continue as a going concern for the yearahead. The collated results of these Letters are reported to theGroup Audit and Risk Committee via a Letter of Representationfrom the Group Chief Executive.
Monthly management reports, reports by the Group FinanceDirector, risk logs, control logs and exposure reports describedunder “Monitoring and control” above also form part of thereporting process.
Management of specific risksDetails of some of the principal risks arising at Group level and in each key subsidiary are contained in the Business Review –Group Finance Director’s Report earlier in this Annual Report.
Treasury managementThe Group operates a centralised treasury function, which isresponsible for recommending and implementing the fundingstrategy for the Group, including the ongoing management ofdebt facilities, managing relationships with banks and ratingsagencies and managing Old Mutual plc’s operational cash flow requirements.
It is also responsible for the provision of capital to the Group’ssubsidiaries, as approved by the Old Mutual plc Board and theGroup Capital Management Committee.
Other Directors’ Report mattersRelations with shareholders and analystsThe Company regards clear and direct dialogue with itsshareholders and analysts as important in raising theirunderstanding of the Group’s strategy, operational and financialperformance, management and prospects. Its Investor Relationsdepartment has a dedicated programme for facilitating regularcommunication between the executive management team and a wide range of institutions and investors worldwide within the constraints of the Listing, Prospectus, Disclosure andTransparency Rules.
During 2007, around 100 meetings were held with institutionalinvestors in the UK, South Africa, North America and Europe. In most cases the meetings involved the Chief Executive, GroupFinance Director or another member of the senior managementteam. In addition, institutional investors and analysts were given the opportunity to attend presentations on the Skandia and OMSA businesses given by members of the localmanagement teams.

Old Mutual plc Annual Report and Accounts 2007Directors’ Report on Corporate Governance and Other Matters76
Directors’ Report on Corporate Governance and Other Matterscontinued
Currently 12 sell-side analysts from the UK and South Africaactively provide coverage on the Company. Further encouragementis given to other sell-side analysts to cover the Company’s shares in order to assist investors in assessing the Group’s valuation, itsperformance and the business environment in which it operatesand in making meaningful comparisons with peers.
The Company, through its Investor Relations team, responds to a variety of enquiries from investors and analysts.
The Chairman makes contact with major investors during theyear and arranges to meet them as required. The Board isupdated regularly by the Investor Relations department on key issues arising from any shareholder communications andprovided with reports to monitor changes in market or shareholderopinion. The Company also periodically commissionsindependent surveys of its major investors, the most recent of which was carried out in June 2006.
Group activities, operational and financial performance and outlook are communicated to financial markets throughannual and interim reports, regulatory news releases, speeches, transcripts and presentations, using a wide range of communication channels. The Company holds two resultsmeetings a year, at the time of its preliminary and interim results, which are hosted and webcast simultaneously in London and Johannesburg.
Old Mutual plc de-listed its shares from the Stockholm StockExchange in September 2007, following which it has ceased full quarterly reporting. However, in May and November, theCompany issues an update on its sales performance in theprevious quarter-year accompanied by a teleconference call foranalysts and institutional investors. From 2008, these businessupdates will be made in accordance with the requirements of the Disclosure and Transparency Rules relating to interimmanagement statements.
The Company’s public announcements, statements andpresentations to the investor community are posted on theCompany’s website in a timely fashion. The website provides avaluable source of both historical and current information, as wellas useful tools relating to share price and dividend calculations,for use by investors. In addition, all major announcements by theCompany and its affiliates are emailed to the Investor Relationsdepartment’s investor database as they are made public.
Employment matters The Group’s employment policies are designed to promote a working environment that supports the recruitment and retentionof highly effective employees, improves productivity and fostersrelationships that build on the diversity of its workforce. They areregularly reviewed and updated to ensure their relevance for thelocations to which they apply. While local employment policiesand procedures are developed by each business according to itsown circumstances, the following key principles of employmentare applied consistently throughout the Group:
> employees are recruited, retained, trained and promoted onthe basis of their suitability for the job, without discriminationin terms of race, religion, national origin, colour, gender, age,marital status, sexual orientation or disability (whether inexistence at the commencement of employment or developingsubsequently) unrelated to the task at hand. In South Africathis principle is balanced with the requirement to addressissues of employment equity and transformation, and the local businesses’ practices take due account of this;
> clear goals are established, together with training andfeedback on performance, to deliver the Group or businessobjectives;
> a working environment is provided that meets the health andsafety standards of the Group and local regulations and allowsemployees to work to the best of their abilities, free fromdiscrimination and harassment;
> employee involvement, consultation and communication are promoted through in-house publications, briefings,roadshows and internet-based channels and relevantemployee representative bodies; and
> the efforts of employees in contributing to the success of theGroup are appropriately recognised. Compensation systemsare structured to recognise and reward both the efforts ofindividuals and the performance of the business sector in which they work.
Group valuesThe Group values were communicated across Skandia through a series of workshops held during the year. Employees wereencouraged to explore their meaning and to understand therelated behaviours they were expected to adopt as part of the Group.
In addition to the four common values of Integrity, Respect,Accountability and Pushing Beyond Boundaries, each businessmay select a fifth value for itself and, at a senior managementmeeting in July 2007, Skandia senior managers selected Passion as its additional value.
The values were also introduced into Skandia:BSAM, the Group’sjoint venture in China, through a series of employee workshops.
The annual Group Values Survey measured wider aspects ofemployee engagement and discretionary effort, both of which are lead indicators of performance. The survey showed that theGroup’s employees generally delivered high levels of discretionaryeffort. It also identified that retention in the Group’s South Africanbusinesses needed to be addressed better. Each business isaccountable for determining the actions required to addressissues identified through the survey and these will be reported to the Group Executive at the end of the first quarter of 2008,with progress reports made quarterly thereafter.

Old Mutual plc Annual Report and Accounts 2007Directors’ Report on Corporate Governance and Other Matters 77
Gov
erna
nce
Executive talent reviewThe identification and retention of talented staff are important to Old Mutual. Businesses are required annually to review their current and future people needs as well as to understandthe career aspirations of their employees, and to establishdevelopment plans to meet these twin needs. A significantamount of both Group Executive and Board time was spent thisyear reviewing the Group’s executive talent and succession plans.To support this review and provide greater insight, a quantitativeanalytical tool has been developed to identify areas of greater riskand enable targeted action plans to be applied.
Profile of the senior leadership groupTurnover in the senior leadership group during 2007 was 17%,of which 4% was voluntary, 4% attributable to retirements and9% to managed exits. The Company continued to strengthen its leadership bench through the development of high-potentialinternal candidates and the targeted selection of externalcandidates for specific roles.
The senior leadership group continues to grow in experience,with more than 60% of its members having over five years’experience with the Group, and 7% new to the Group in 2007.16% of people have been in position for less than one year,which compares with over 50% in 2006 following theacquisition of Skandia and other restructuring undertaken during that year.
DiversityA single measure for ethnic diversity is not practical given thegeographic spread of Old Mutual’s business activities. Eachregion has therefore been tasked with determining its ownappropriate ethnic diversity targets. The Group will begin tracking progress against these targets during 2008.
The Group Executive has committed to a Group-wide target of30% for gender diversity in the senior leadership group. Womencurrently represent 20% of the senior leadership group, whichalready exceeds the Corporate Leadership Council benchmark of 18%.
The Group’s South African businesses continue to implementrecruitment and retention policies and practices aimed atensuring that Old Mutual plays a leading role in the employmentequity transformation of the country. Additional effort is beingmade to develop and retain black employees so that localbusinesses are able to meet and, where possible, exceed thecode targets prescribed by the South African Department of Labour.
Succession planningThe Group has established targets for its businesses for thenumber of succession candidates over various timeframes.Planned successors in the one- to three-year timeframe haveimproved over 2006. In South Africa 60% of planned successioncandidates are black, which underlines the businesses’ focus on meeting the transformation targets referred to above.
International mobilityDuring 2007, 71 people were on secondments outside theirhome country as compared to 44 in 2006, demonstrating theGroup’s commitment to developing its talent.
Management Development ProgrammeThe Company continued during 2007 to roll out to all regions its Management Development Programme initiated in 2006. The programme architecture provides clarity across the Group on management accountabilities at all levels and enables eachbusiness to map its development programmes accordingly.
The pilot Business Manager programme in October broughttogether people from across the Group to develop the specificskills essential for success and to share experiences, createnetworks and learn from each other. This programme has actively involved the Group Executive and the Board.
Directors’ shareholdings and share dealingsThe Remuneration Committee has established guidelines onshareholdings by executive directors of the Company. Underthese, the Chief Executive is expected to build up a holding ofshares in the Company equal in value to at least 150% of annualbase salary within five years of appointment; the equivalentfigure for other executive directors is 100% of annual base salary.Further details of the executive directors’ shareholdings andinterests in awards under the Company’s employee share plansare contained in the Remuneration Report. The Board hasconsidered whether to adopt a shareholding requirement for non-executive directors, but does not consider this to be appropriate.
All directors of the Company, together with other personsdischarging managerial responsibilities in relation to theCompany, are restricted persons for the purposes of the ModelCode annexed to section LR9 of the Listing Rules of the FinancialServices Authority. The Company continues to operate provisionsequivalent to those set out in the Model Code for a widercategory of employee insiders who hold certain senior positionsaround the Group, even though the Model Code itself no longerrequires this. The Model Code imposes restrictions on the periodswhen restricted persons may deal in affected securities (whichcomprise shares and other listed securities of the Company andother quoted entities within the Group). Dealings by restrictedpersons during open periods must be pre-cleared through theappropriate designated officer of the Company, and any dealingsin affected securities by the directors or other persons dischargingmanagerial responsibilities are required to be publicly announcedonce they have been notified to the Company. The lists ofpersons discharging managerial responsibilities and otheremployee insiders are regularly reviewed. Currently all membersof the Group Executive, together with certain other heads ofmajor businesses, are regarded as persons dischargingmanagerial responsibilities.
Directors’ indemnitiesFollowing a change in applicable UK law introduced by theCompanies (Audit, Investigations and Community Enterprise) Act2004, the Company has entered into formal deeds of indemnityin favour of each of the directors. These are dated as follows:Messrs Andrews, Bogni, Broadhurst, Collins, Edey, Roberts andSutcliffe – 19 October 2005; Mr Khoza – 24 February 2006;Messrs Nicholls and Otterbeck – 15 November 2006;Messrs Nqwababa and Pym – 17 December 2007. A specimencopy of the indemnities is available in the Corporate Governancesection of the Company’s website.

Old Mutual plc Annual Report and Accounts 2007Directors’ Report on Corporate Governance and Other Matters78
Directors’ Report on Corporate Governance and Other Matterscontinued
Supplier payment policyIn most cases suppliers of goods or services to the Group do so under standard terms of contract that lay down terms ofpayment. In other cases, specific terms are agreed to beforehand.It is the Group’s policy to ensure that terms of payment arenotified in advance and adhered to. The Company has signed the Better Payment Practice Code, an initiative promoted by the Department for Business, Enterprise and Regulatory Reformin the UK to encourage prompt settlement of invoices.
The total outstanding indebtedness of the Company (and itsservice company subsidiary, Old Mutual Business ServicesLimited) to trade creditors at 31 December 2007 amounted to £2,956,000, corresponding to 26 days’ payments whenaveraged over the year then ended.
Charitable contributionsThe Group made a wide range of significant donations tocharitable causes and social development projects during 2007,as described in more detail in the Corporate Responsibilitysection of this document. The Company, its subsidiaries in the UK, and the Old Mutual Bermuda Foundation collectivelymade charitable donations of £352,000 during the year (2006: £359,000).
Environmental mattersA description of the Group’s environmental policy and activitiesduring 2007 is contained in the Corporate Responsibility sectionof this document.
Political donationsThe Group made no EU or other political donations during the year.
Dividend policyThe Board’s policy on dividends is to seek to achieve steadilyincreasing returns to shareholders over time, reflecting theunderlying rate of progress and the cash flow requirements of the Group’s businesses. The Board anticipates declaring an interim dividend for the current year in August 2008, forpayment at the end of November 2008.
Share capitalThe Company has a single class of share capital, which isdivided into Ordinary Shares of 10p each. The Company’s issuedshare capital at 31 December 2007 was £551,027,253.70divided into 5,510,272,537 Ordinary Shares of 10p each(2006: £550,089,550.80 divided into 5,500,895,508Ordinary Shares of 10p each). During the year ended 31December 2007, 9,377,029 shares were issued under theCompany’s employee share option schemes at an average price of 93.2p each.
Authorities from the shareholders for the Company to make marketpurchases of, and/or to purchase pursuant to contingent purchasecontracts relating to each of the overseas exchanges on which theCompany’s shares are listed, up to an aggregate of 550,090,000of its own shares were in force at 31 December 2007.
Out of the 5,510,272,537 shares in issue at 31 December 2007:
> 97,074,907 were held by the Company in treasury and afurther 8,026,152 shares had been contracted to be boughtback by the Company into treasury, but had not yet at thatdate been settled into the Company’s treasury shares accounton the UK register; and
> a total of 239,734,104 shares were held by African lifesubsidiaries of the Company, with 225,462,006 of theseshares being held on books for the benefit of the Group’sSouth African life operations and related businesses. Theseshares cannot be voted while they are held by subsidiaries of Old Mutual plc because of applicable provisions of UKcompany law.
The 105,101,059 shares bought back into treasury at 31 December 2007 comprised 74,153,587 shares repurchasedon the London Stock Exchange under the authority granted byResolution 10 passed at the 2007 AGM at an average price of £1.657 per share and 30,947,472 shares repurchased on the JSE under the South African contingent purchase contractsapproved as part of Resolution 11 passed at the 2007 AGM at an average price of R23.14 per share.
The total number of voting rights in the Company’s issuedordinary share capital at 31 December 2007 (which excludesthe 97,074,907 shares held in treasury and the further8,026,152 shares contracted to be bought into treasury, but includes the shares held by the African life subsidiaries) was 5,405,171,478.
Subsequent to the year end, in the period up to and including 26 February 2008, the Company has issued 65,589 sharesunder its share option schemes at an average price of 97.02peach and has bought back into treasury a further 79,025,116shares on the London Stock Exchange at an average price of £1.366p each. The Company’s issued share capital at 26 February 2008 was accordingly £551,033,812.60 dividedinto 5,510,338,126 Ordinary Shares of 10p each of which184,126,175 were held or had been bought into treasury. The total number of voting rights at 26 February 2008 was5,326,211,951.
Rights and obligations attaching to sharesThe following description summarises certain provisions of thecurrent Articles of Association of the Company (as adopted byspecial resolution passed on 14 May 2004 and amended on 6 July 2005 (the Articles)) and applicable English law concerningcompanies (the Companies Act 1985 and the Companies Act2006, together referred to as the Companies Acts). This is a summary only and the relevant provisions of the CompaniesActs or of the Articles should be consulted if further information is required. Certain amendments will be proposed to theseprovisions in the new Articles that are proposed to be adopted atthe Annual General Meeting on 8 May 2008. Further details areset out in the Notice of the Annual General Meeting. Copies ofthe Company’s current and proposed new Articles of Associationare available for inspection at the Company’s registered office and also in the Annual General Meeting section of its website.

Old Mutual plc Annual Report and Accounts 2007Directors’ Report on Corporate Governance and Other Matters 79
Gov
erna
nce
Issue of sharesSubject to applicable statutes and other shareholders’ rights,shares may be issued with such rights and restrictions as theCompany may by ordinary resolution approve or as the directorsmay decide. Subject to the Articles, the Companies Acts andother shareholders’ rights, unissued shares are at the disposal ofthe Board. At each Annual General Meeting the Company seeksshareholder authority for the directors to allot up to a certainamount of unissued shares, and up to a lower limit for cash.These limits are established having regard to the guidelines of the UK Investor Protection Committees.
Voting Subject to any rights or restrictions attaching to any class ofshares, every member present in person at a general meeting orclass meeting has, upon a show of hands, one vote. In the caseof joint holders of a share, the vote of the senior who tenders avote, whether in person or by proxy, shall be accepted to theexclusion of votes of the other joint shareholders and seniorityshall be determined by the order in which the names stand in the register in respect of the joint holding. Under the CompaniesActs, members are entitled to appoint a proxy to exercise all orany of their rights to attend and to speak and vote on their behalfat a general meeting or class meeting. A member may appointmore than one proxy in relation to a general meeting or classmeeting provided that each proxy is appointed to exercise the rights attached to a different share or shares held by thatmember. The Articles currently only entitle proxies to vote on a poll, whereas the Companies Acts now entitle proxies to voteon a show of hands. It is therefore proposed that the new Articlesto be adopted at the Annual General Meeting on 8 May 2008will reflect this change in legislation.
A member that is a corporation may appoint one or moreindividuals to act on its behalf at a general meeting or classmeeting as a corporate representative. Where more than onecorporate representative has been appointed, any one of them is entitled to vote and exercise other powers on behalf of themember at a general meeting or class meeting, but in the eventthat the representatives’ votes or other powers conflict, the poweris treated by the Company as not having been exercised and themember will be deemed to have abstained from exercising itsvotes or powers. In order to avoid this rule having inappropriateconsequences, the Company plans to adopt the DesignatedCorporate Representative procedure recommended by theInstitute of Corporate Secretaries and Administrators as explainedin more detail in the notes accompanying the Notice of AnnualGeneral Meeting.
Restrictions on votingNo member shall be entitled to vote at any general meeting orclass meeting in respect of any shares held by him if any call or other sum then payable by him in respect of that shareremains unpaid. In addition, no member shall be entitled to vote if he has been served with a restriction notice (as defined in the Articles) after failure to provide the Company withinformation concerning interests in those shares to be providedunder the Companies Acts.
Deadlines for voting rightsVotes are exercisable at the general meeting of the Company inrespect of which the business being voted upon is being heard.Votes may be exercised in person, by proxy or, in relation tocorporate members, by corporate representative. Under theCompanies Acts, the deadline for delivering proxy forms cannotbe earlier than 48 hours (excluding non-working days) before the meeting for which the proxy is being appointed. The currentArticles, however, provide a deadline for submission of not less than 48 hours before the meeting (not excluding non-working days).
Dividends and distributionsSubject to the provisions of the Companies Acts, the Companymay by ordinary resolution from time to time declare dividendsnot exceeding the amount recommended by the Board. TheBoard may pay dividends, and also any fixed rate dividend,whenever the financial position of the Company, in the opinion of the Board, justifies its payment. If the Board acts in good faith,it is not liable to holders of shares with preferred or pari passurights for losses arising from the payment of interim or fixeddividends on other shares.
The Board may withhold payment of all or any part of anydividends or other monies payable in respect of the Company’sshares from a person with an interest in 0.25% or more (innominal value or in number, calculated exclusive of any sharesheld as treasury shares) in the Company’s share capital if suchperson has been served with a restriction notice (as defined inthe Articles) after failure to provide the Company with informationconcerning interests in those shares required to be providedunder the Companies Acts.
LiquidationUnder the Articles, on a liquidation the liquidator may, with thesanction of a special resolution of the Company and any otherapprovals required by legislation, divide among the members inkind all or part of the assets of the Company. It is proposed toamend the Articles at the Annual General Meeting on 8 May2008 to remove this provision as it is simply a reflection ofapplicable legislation.
Variation of rightsSubject to the Companies Acts, the Articles specify that rightsattached to any class of shares may be varied with the writtenconsent of the holders of not less that three quarters in nominalvalue of the issued shares of that class (calculated excluding any shares held as treasury shares), or with the sanction of anextraordinary resolution passed at a separate general meeting of the holders of those shares. At every such separate generalmeeting (except an adjourned meeting) the quorum shall be two persons holding or representing by proxy at least one third in nominal value of the issued shares of the class (excludingtreasury shares). The rights conferred upon the holders of anyshares shall not, unless otherwise expressly provided in the rightsattached to those shares, be deemed to be varied by the creationor issue of further shares ranking pari passu with them. However,because of the reference to extraordinary resolutions, which is a concept not retained in the Companies Act 2006, and sincethe proceedings and specific quorum requirements for meetingsconvened to vary class rights are contained in the CompaniesActs, it is proposed to amend these provisions in the new Articlesto be adopted at the Annual General Meeting on 8 May 2008.

Old Mutual plc Annual Report and Accounts 2007Directors’ Report on Corporate Governance and Other Matters80
Directors’ Report on Corporate Governance and Other Matterscontinued
Transfer of sharesAny shares in the Company may be held in uncertificated formand, subject to the Articles, title to uncertificated shares may be transferred by means of a relevant system. Provisions of theArticles do not apply to any uncertificated shares to the extentthat such provisions are inconsistent with the holding of shares in uncertificated form or with the transfer of shares by means of a relevant system. Registration of a transfer of an uncertificatedshare may be refused in the circumstances set out in theUncertificated Securities Regulations (as defined in Articles) and where, in case of a transfer to joint holders, the number of joint holders to whom the uncertificated share is to betransferred exceeds four.
Subject to the Articles, any member may transfer all or any or his certificated shares by an instrument of transfer in any usualform or in any other form which the Board may approve. Theinstrument of transfer must be executed by or on behalf of thetransferor and (in the case of a partly-paid share) the transferee.The transferor of a share is deemed to remain the holder until thetransferee’s name is entered into the register. The Board may alsodecline to register a transfer of a certificated share unless theinstrument of transfer: (i) is duly stamped or certified or otherwiseshown to the satisfaction of the Board to be exempt from stampduty and is accompanied by the relevant share certificate andsuch other evidence of the right to transfer it as the Board mayreasonably require; (ii) is in respect of only one class of share;and (iii) if to joint transferees, is in favour of not more than foursuch transferees.
The Board may decline to register a transfer of any of theCompany’s certificated shares by a person with an interest in0.25% or more (in nominal value or in number, calculatedexclusive of any shares held as treasury shares) in theCompany’s share capital if such a person has been served with a restriction notice (as defined in the Articles) after failure toprovide the Company with information concerning interests in those shares required to be provided under the CompaniesActs, unless the transfer is pursuant to an outright sale to anindependent third party.
Repurchase of sharesSubject to authorisation by shareholder resolution, the Company may purchase its own shares in accordance with the Companies Acts. Any shares which have been bought maybe held as treasury shares or, if not so held, must be cancelledimmediately upon completion of the purchase, thereby reducingthe amount of the Company’s issued share capital. Furtherdetails of the existing authorities that the Company was grantedby shareholders at the Annual General Meeting on 24 May 2007and how these authorities have been used are set out under the heading “Share capital” earlier in this report. Details of theproposed renewal of those authorities at the Annual GeneralMeeting on 8 May 2008 are set out in the shareholder circularrelating to that meeting.
Amendment to the Articles of AssociationAny amendments to the Articles of the Company may be made in accordance with the provisions of the Companies Acts byspecial resolution. A resolution will be put to the Annual GeneralMeeting to be held on 8 May 2008 to adopt new Articles with effect from 1 October 2008 to bring them up to date with provisions of the Companies Act 2006 then to be in force. The Companies Act 2006 was enacted on 8 November 2006and is being implemented in stages. Details of the main changesin the new Articles are set out in the separate notice conveningthe Annual General Meeting.
Appointment and replacement of directorsUnder the Articles, directors shall be at least four and not morethan 16 in number. Directors may be appointed by the Companyby ordinary resolution or by the Board. A director appointed by the Board holds office only until the next following AnnualGeneral Meeting and is then eligible for election by theshareholders. The Board may from time to time appoint one or more directors to hold employment or executive office for such period (subject to the Companies Acts) and on such terms as it may determine and may revoke or terminate any such appointment.
At every Annual General Meeting of the Company, a minimum ofone third of the directors shall retire by rotation. The directors toretire by rotation shall be those who have been longest in officesince their last election or re-election. If there are directors whowere last elected or re-elected on the same date, they can agreeamong themselves who is to retire, but if they do not agree, thiswill determined by lot. The Company may by special resolutionremove any director before the expiration of his term of office.The office of director shall be vacated if: (i) his resignation is requested by all of the other directors and all of the otherdirectors are not less than three in number; (ii) he delivers awritten letter of resignation at a meeting of the directors or to the Company’s registered office; (iii) he is or has been sufferingfrom mental ill health and the directors pass a resolution statingthat he has ceased to be a director; (iv) he is absent withoutpermission of the Board from meetings of the Board for sixconsecutive months and the Board resolves that his office isvacated; (v) he becomes bankrupt or makes any arrangement or composition with his creditors; (vi) he is prohibited from being or ceases to be a director by law or by any powersconferred on the Board or the Company’s shareholders by theArticles; (vii) he becomes a director of another company whosebusiness conflicts with that of any member of the Group withoutpermission of the Chairman; or (viii) his appointment as anexecutive director is terminated or expires and the Board resolves that his office is vacated.

Old Mutual plc Annual Report and Accounts 2007Directors’ Report on Corporate Governance and Other Matters 81
Gov
erna
nce
Powers of the directorsSubject to the Company’s Memorandum of Association, theArticles, any legislation and any directions given by specialresolution, the business of the Company will be managed by the directors, who may exercise all the powers of the Company,whether relating to the management of the business of theCompany or not. In particular, the Board may exercise all thepowers of the Company to borrow money and to mortgage orcharge any of its undertaking, property, assets and uncalledcapital and to issue debentures and other securities and givesecurity for any debt, liability or obligation of the Company to any third party.
Shares held in Employee Benefit TrustsThe shareholdings in the Company of the Group’s employeebenefit trusts and the policies of those trusts on voting thoseshares are described in the section of the Remuneration Reportentitled “Employee Share Ownership Trusts”.
Significant agreementsThe following significant agreements to which the Company is a party contain provisions entitling counterparties to exercisetermination or other rights in the event of a change of control of the Company:
> £1,250 million Revolving Credit Facility (the Facility) dated 2 September 2005 between the Company, various syndicatebanks (the Banks) and Lloyds TSB Bank plc as agent (theAgent). If a person or group of persons acting in concert gainscontrol of the Company, the Company must notify the Agent.The Agent and the Company will negotiate with a view toagreeing terms and conditions acceptable to the Company andall of the Banks for continuing the Facility. If such negotiationsfail within 30 days of the original notification to the Agent by the Company, the Banks become entitled to declare anyoutstanding indebtedness repayable by giving notice to theAgent within 15 days of the 30-day period mentioned above.Upon receiving notice for payment from the Agent, theCompany shall pay the outstanding sums within threebusiness days to the relevant Bank(s);
> Old Mutual Capital Funding L.P. (the Issuer) $750 million 8 per cent. Guaranteed Cumulative Perpetual PreferredSecurities (the Preferred Securities) guaranteed on asubordinated basis by the Company. Under the terms of thePreferred Securities, the Issuer is required to give notice to the holders of such securities (the Holders) in the event of achange of control of the Company. In such case the Issuer andthe Company agree, to the extent that such action is withintheir reasonable control, to vary the terms of the PreferredSecurities and the Company’s guarantee (and to use allreasonable endeavours to ensure that the entity that hasacquired control of the Company (the Acquiror) gives suchundertakings as are necessary) in order to preserve the rightsof the Holders. The Issuer and the Company shall also takesuch steps as are in their reasonable control to ensure that theeconomic interests of the Holders are not adversely affected bythe actions of the Acquiror following the change of control.
Substantial interests in voting rightsAt 26 February 2008, the following substantial interests in votingrights had been declared to the Company in accordance with theDisclosure and Transparency Rules:
Number of % ofvoting rights voting rights
Franklin Resources Inc. 411,613,352 7.72Public Investment Corporation of the
Republic of South Africa 307,212,664 5.77Legal & General Group Plc 267,902,908 5.03Old Mutual Life Assurance Company
(South Africa) Limited 225,462,006 4.23
Going concernThe Board has satisfied itself that the Group has adequateresources to continue in operation for the foreseeable future. The Group’s financial statements have accordingly been preparedon a going concern basis.
Disclosure of information to the auditorsThe directors who held office at the date of approval of thisDirectors’ Report confirm that, so far as they are each aware,there is no relevant audit information of which the Company’sauditors are unaware, and each director has taken all the stepsthat he ought to have taken as a director to make himself awareof any relevant audit information and to establish that theCompany’s auditors were aware of that information.
Governing lawThe Directors’ Report – Business Review and this Directors’Report on Corporate Governance and Other Matters togethercomprise the directors’ report for the purposes of section463(i)(a) of the Companies Act 2006. The Remuneration Report set out in this document is the directors’ remunerationreport for the purposes of section 463(1)(b) of that Act. English law governs the disclosures contained in and liability for the directors’ report and the directors’ remuneration report.
By order of the Board
Martin C MurrayGroup Company Secretary27 February 2008

Old Mutual plc Annual Report and Accounts 2007Remuneration Report82
Remuneration Report
This Remuneration Report has been prepared by the RemunerationCommittee (referred to in this report as the Committee) and hasbeen approved by the Board of the Company. The figures includedin the sections of this report headed “Directors’ Emoluments for2006 and 2007” on page 87 and “Directors’ interests underemployee share plans” on pages 93 and 94 have been audited byKPMG Audit Plc as required by the Directors’ Remuneration ReportRegulations 2002. Their audit report is set out on page 110. Theinformation in the remainder of this report has not been audited.
Remuneration CommitteeThe Committee consists of non-executive directors who are all considered by the Board to be independent. Mr Bogni isChairman of the Committee and other members throughout2007 were Mr Andrews and Mr Broadhurst. Mr Edey became a member of the Committee on 1 March 2007 and Mr Marksceased to be a member of the Committee upon his resignationfrom the Board on 24 May 2007. The Company Secretary, Mr Murray, acts as Secretary to the Committee.
The Committee is responsible for:
> determining the remuneration, incentive arrangements,benefits and any compensation payments of the executivedirectors;
> determining the remuneration of the Chairman of the Boardand monitoring and approving the level and structure ofremuneration of senior management who report directly to theChief Executive, together with the Company Secretary; and
> reviewing, monitoring and approving, or recommending forapproval, share incentive arrangements of the Company.
The full terms of reference of the Committee are published on theCompany’s website.
During the year under review, the Committee met five times. The meetings were attended by all of the members of theCommittee, save for one from which Mr Andrews was absent.The Board accepted the recommendations made by theCommittee during the year without amendment.
The Committee continued to retain Mr Alan Judes as itsindependent adviser through his consultancy StrategicRemuneration during 2007. A copy of the letter of engagementbetween the Committee and Strategic Remuneration is on the Company’s website. Any work that the Company wishes Mr Judes to do on its behalf, rather than for the Committee, is pre-cleared with the Chairman of the Committee with a view to avoiding any conflicts of interest. In 2007 Mr Judes did notprovide any other services to the Company. The Companyretained New Bridge Street Consultants (NBSC) to advise onmarket incentive practice and benchmarking as well as indrafting the rules of the new share incentive plans which are to be put to shareholders for approval at the 2008 AnnualGeneral Meeting.
Mrs Susan Jackson and Mr Kevin Stacey of the Group HumanResources department (Group HR) also assisted the Committeeduring the year. Group HR provides supporting materials formatters that come before the Committee, including comparativedata and justifications for proposed salary, benefit, bonus andshare awards and criteria for performance targets and appraisalsagainst those targets. It uses the services of external advisers as necessary. The Chairman of the Committee has access to, and regular contact with, Group HR independently of theexecutive directors.
Terms of engagement – Chairman and non-executive directorsMr Collins entered into an engagement letter with the Companyin January 2005 setting out the terms applicable to his role asChairman from May 2005. Under these terms, subject to: (a) 12 months’ notice at any time given by either the Company or Mr Collins, (b) his being duly re-elected at any interveningAnnual General Meetings, and (c) the provisions of theCompany’s Articles of Association relating to the removal of directors, Mr Collins’ appointment may continue until his seventieth birthday (19 January 2010).
The other eight non-executive directors are engaged on terms that may be terminated by either side without notice. However, it is envisaged that they will remain in place on a three-yearcycle, in order to provide assurance to both the Company and the non-executive director concerned that the appointment is likely to continue. The renewal of non-executive directors’terms for successive three-year cycles is not automatic, with the continued suitability of each non-executive director beingassessed by the Nomination Committee. In the absence ofexceptional circumstances, the Board has determined that non-executive directors’ engagements will be terminated at the end of their third three-year cycle.
The original dates of appointment and the dates when thecurrent appointments of the non-executive directors are due toterminate are as follows:
Date of Current Date current original term as appointment
appointment director terminates
N D T Andrews 1 June 2002 2nd 1 June 2008R Bogni 1 Feb 2002 3rd 1 Feb 2011N N Broadhurst 25 March 1999 3rd 8 May 2008R P Edey 24 June 2004 2nd 24 June 2010R J Khoza 27 Jan 2006 1st 27 Jan 2009B Nqwababa 1 April 2007 1st 1 April 2010L H Otterbeck 14 Nov 2006 1st 14 Nov 2009R A Pym 1 Sep 2007 1st 1 Sep 2010
Mr Marks retired from the Board (and also ceased to be amember of the Remuneration and Nomination Committees) atthe conclusion of the Annual General Meeting on 24 May 2007.
Mr Broadhurst will retire at the Annual General Meeting on 8 May 2008.

Old Mutual plc Annual Report and Accounts 2007Remuneration Report 83
Gov
erna
nce
Remuneration – Chairman and non-executive directorsThe Company’s policy on remuneration for non-executivedirectors is that this should be:
> fee-based;> market-related (having regard to fees paid and time
commitments of non-executive directors of other members of the FTSE 100 Index); and
> not linked to share price or Company performance.
The annual fees for the Chairman and for other non-executiveroles for 2007 and 2008 are set out in the table below.
2007 2008£ £
Chairman 280,000 300,000
Non-executive directorsBase fee 50,000 55,000Senior Independent DirectorAdditional fee – 3,000
Additional fees payable for Committees Group Audit and Risk Committee Chairman 22,000 30,000Member 7,500 10,000Remuneration CommitteeChairman 10,000 12,000Member 3,500 4,000
The non-executive directors’ fee review for 2008 was carried out by an independent committee of the Board in which none ofthe non-executive directors affected by the review participated.The increases recommended by that committee were developedhaving due regard to comparative data and were approved by the Board in December 2007.
None of the non-executive directors of the Company (includingthe Chairman) contributed to any Group pension fund during2007 or had any accrued pension fund benefits in any Grouppension fund at 31 December 2007.
Terms of engagement of the executive directorsDirectors holding executive office have service contracts with the Company. The terms of these are considered by theCommittee to provide a proper balance of responsibilities and security between the parties. The Company’s policy is to fix notice periods for executive directors at a maximum of 12 months. Compensation for loss of office, where applicable, is tailored to reflect the Company’s contractual obligations andthe obligation on the part of the employee to mitigate loss.
The service contracts of the three executive directors, Mr Sutcliffe,Mr Nicholls and Mr Roberts, are terminable by the Company on12 months’ notice. Their current contracts are dated 6 February2002, 1 November 2006 and 15 November 2002 respectively. If not terminated before, these contracts may continue until the director attains the age of 65 (i.e. until 20 April 2021 for Mr Sutcliffe, until 27 October 2022 for Mr Nicholls and until 7 June 2022 for Mr Roberts).
Neither Mr Sutcliffe’s nor Mr Nicholls’ contract contains anyprovisions quantifying compensation that would be payable on early termination. Mr Roberts’ contract contains a provisionunder which, on termination by the Company other than for cause or on constructive dismissal, he would be paidcompensation for the period of unexpired notice equal to three-quarters of his then annual salary and benefit allowance plus a further three-eighths of annual salary on account of potentialbonus entitlement. This has been agreed to constitute a genuinepre-estimate of his loss over the notice period after taking intoaccount appropriate mitigation.
Although Mr Roberts’ contract with Old Mutual plc remains inforce, he has been indefinitely assigned to Skandia AB under an assignment agreement between himself, Old Mutual plc and Skandia AB dated as of 21 February 2006.
Remuneration policy for executive directorsThe Company embraces the principles and complies with theprovisions of the Combined Code relating to directors’remuneration. The guiding principles that the Committee hasapplied during 2007, and which it intends to continue to apply,are as follows:
> to take account of appropriate benchmarks, while using such comparisons with caution and recognising the risk of anupward ratchet of remuneration levels with no correspondingimprovement in performance. Members of the UK FTSE 100Index provide the benchmark for UK-based executivedirectors, with particular reference to subsets of that datawithin the financial sector and by market capitalisation;
> to be sensitive in determining, reviewing, monitoring orapproving matters under its remit in relation to pay andemployment conditions around the Group where relevant;
> to make a significant percentage of potential maximumrewards conditional on both short-term and long-termperformance. These rewards include share-based incentives,in order to align the executive directors’ interests closely withthose of shareholders;
> to provide an opportunity for overall remuneration packages to be in the upper quartile of the comparator group throughpayments under short-term and long-term incentive schemesif superior performance is delivered, while the fixed elementsof remuneration remain benchmarked at or below appropriatemedian levels;
> to focus attention on the main drivers of shareholder value bylinking performance-related remuneration to clearly definedobjectives and measurable targets; and
> to design remuneration arrangements that will attract, retainand motivate individuals of the exceptional calibre needed tolead the development of the Group.
The Committee’s policy, including in relation to setting the fixed elements of remuneration at or below appropriate medianlevels, is influenced by the need to be competitive with otherinternational financial services groups, while avoiding anyexcess. The Committee has reviewed this policy and considers it to be appropriate.

Old Mutual plc Annual Report and Accounts 2007Remuneration Report84
Remuneration Reportcontinued
The Committee has discretion to consider corporate performanceon environmental, social and governance (ESG) issues whensetting the remuneration of executive directors. The Committeehas ensured that the incentive structures used for executivedirectors and senior management do not raise ESG risks byinadvertently motivating irresponsible behaviour.
The Committee seeks, where it considers appropriate, the views of institutional investors on any significant changes toremuneration structures applicable to the executive directors or affecting the structure of the Company’s share incentive
arrangements. The Chairman of the Committee andrepresentatives of Group HR held meetings with representativesof the UK institutional investor bodies during January 2008 todiscuss the proposed 2008 remuneration structure for theexecutive directors set out later in this report.
Full information on the performance targets attached to the share incentive awards granted to executive directors and othersenior employees is set out in the section of this report entitled“Performance targets applicable to share incentives”.
Executive directors’ remuneration during 2007The Committee reviews the structure of the executive directors’ remuneration packages annually to satisfy itself that the balancebetween fixed and variable remuneration and short-term and long-term incentives and rewards remains appropriate.
A summary description of the different elements of the executive directors’ remuneration packages for 2007 is set out in the tablebelow. Changes to this structure from 2008 onwards are described later in this report.
Base salary > Base salary is paid monthly in cash and reviewed with effect from 1 January each year, taking into account market benchmarks for the director concerned, as well as any changes in role or responsibilities.
Benefits > A cash-based benefits package approach is used. During 2007, the executive directors received:– a benefit allowance of 35% of base salary which may be used to purchase benefits from
independent suppliers or to participate in benefit arrangements established for Group employees in the UK;
– life cover of four times base salary, and disability cover capped at £140,000 per annum; and– 30 working days’ paid holiday.
Annual short-term incentive > The annual short-term incentive for 2007 was based on achievement of Group financial targets (and Skandia financial targets for Mr Roberts) as well as delivery of individually agreed objectives.The maximum award was 130% of base salary, of which two thirds was payable in cash and one third was to be deferred for three years in restricted shares.
Bonus-matching shares > A one-for-one, gross-for-net (after tax and NIC) bonus match, in restricted shares, was offered on any portion of the cash element of the short-term incentive used to purchase Company shares.Bonus-matching shares vest, subject to: (a) continued employment with the Group, (b) achievementof an EPS-based corporate performance target (as set out in the section of this report entitled“Performance targets applicable to share incentives”), and (c) retention for the entire three-yearperiod of the shares purchased using the cash element of the short-term incentive.
Share options > The grant of share options to the executive directors is determined each year in the light of relativemarket positioning of their total remuneration against market benchmarks. During 2007, theCommittee determined that awards of share options equal to 200% of base salary should be madeto Mr Sutcliffe and 100% of base salary should be made to each of Mr Nicholls and Mr Roberts.Share options vest, subject to the achievement of EPS-based corporate performance targets (as setout in the “Performance targets applicable to share incentives” section below).

Total remuneration 2007 The value of total remuneration for Executive Directors in 2007 has been determined as follows:
> “actual” values reflect amounts paid in base salary, benefits allowance, short-term and deferred short-term incentives (provided in restricted share awards) and the expected value of actual share awards made;
> hypothetical values have been used for “target” and “maximum” incentive levels by assuming that the respective short-term targetsare achieved and the bonus match offer is maximised in each case;
> the expected value of long-term incentives awarded in 2007 has been derived by discounting the value of both share options andbonus matching share awards by 30%, for the impact of the hurdles applied to vesting. Share option awards are valued on a cost-to-company basis, which is currently 25% of the market value of the underlying shares, before the 30% discount is applied.
The following diagrams show the breakdown of the executive directors’ total remuneration arrangements and comparison to the marketmedian and upper quartile of the FTSE pan-sector (as provided by NBSC).
Old Mutual plc Annual Report and Accounts 2007Remuneration Report 85
Gov
erna
nce
Total remuneration 2007 (£000)
J C Nicholls
J V F Roberts
J H Sutcliffe
Actual Maximum On-target
Median total remuneration of peer group
Upper Quartile total remuneration of peer group
0 500 1,000 1,500 2,000 3,000 3,5002,500
Total remuneration 2007 – split by component (£000)
J C Nicholls
J V F Roberts
J H Sutcliffe
Base salary Benefit allowance Cash bonus Deferred bonus Bonus match Share options
0 500 1,000 1,500 2,000

Old Mutual plc Annual Report and Accounts 2007Remuneration Report86
Remuneration Reportcontinued
Short-term incentive targets for performance year 2007The payment of short-term incentives is subject to the achievement of pre-determined financial targets and personal objectives, whichare based on the key deliverables for each of the executive directors as reviewed and approved each year by the Committee. Details ofthe structure and outcomes of the metrics for 2007 are set out in the table below.
J C Nicholls J V F Roberts J H SutcliffeGroup Skandia Total Total
Element Potential Achieved Potential Achieved Potential Achieved Potential Achieved Potential Achieved
Group/Business targets (%)1 110 51.2 26 12.1 52 23.4 78 35.5 110 51.2Personal Objectives (%) 20 16.8 – – – – 52 33.3 20 16.6Total % of Salary 130 68 26 12.1 52 23.4 130 68.8 130 67.8£000 of Incentive 650 340 130 61 260 117 650 344 956 498
1 The Group targets were divided among IFRS Earnings per share, Return on Average Equity, EEV Earnings per share and Return on Embedded Value. The Skandia-relatedcomponent for Mr Roberts was split among IFRS earnings of the business, Return on its Equity, EEV earnings of the business, Return on its Embedded Value, net client cash flows, expense management and synergies.
The Old Mutual Staff Pension FundDuring 2007:
> the Company contributed a total of £20,000 to the Old Mutual Staff Pension Fund (which is a defined contribution scheme) in lieu of an equivalent cash payment under Mr Roberts’ benefit allowance. The accumulated value of Mr Roberts’ funds in the scheme was £214,300 at 31 December 2007 (£179,400 at 31 December 2006).
> the Company did not make any contributions to the Old Mutual Staff Pension Fund on Mr Sutcliffe’s behalf. The accumulated valueof his funds in the scheme was £125,100 at 31 December 2007 (£116,000 at 31 December 2006).
Mr Nicholls does not participate in any employer-provided pension scheme, but has a self-invested personal pension with Skandia UK.
Furnished accommodation for Mr RobertsBetween March 2006 and September 2007, Mr Roberts was provided with furnished accommodation in Stockholm in order to enable him to fulfil his role at Skandia. The total cost of this accommodation during 2007 was £33,000. This arrangement has nowcome to an end.

Old Mutual plc Annual Report and Accounts 2007Remuneration Report 87
Gov
erna
nce
Directors’ Emoluments for 2006 and 2007
RemunerationRemuneration for the years ended 31 December 2006 and 31 December 2007 (including, in each case, remuneration from officesheld with the Company’s subsidiaries, Skandia Insurance Company Limited (Skandia), Old Mutual (US) Holdings, Inc. (OMUSH) andNedbank Group Limited (Nedbank), where relevant) was as follows:
Salary and Fees Bonus Benefits and Pension TotalBenefit allowance
2007 2006 2007 2006 2007 2006 2007 2006 2007 2006 £000 £000 £000 £000 £000 £000 £000 £000 £000 £000
Chairman C D Collins 280 250 – – 201 191 – – 300 269Executive directorsJ C Nicholls 4952 79 3403 3004 2491,5 401,5 – – 1,084 419J V F Roberts 500 475 3443 4433 2051,6 2091 207 207 1,069 1,147J H Sutcliffe 735 700 4983 5463 3551 3181 – – 1,588 1,564Non-executive directors N D T Andrews 938 898 – – 131 121 – – 106 101R Bogni 68 66 – – 111 91 – – 79 75N N Broadhurst 869 999 – – 111 101 – – 97 109R P Edey 60 51 – – – – – – 60 51R J Khoza 22710 17010 – – – – – – 227 170B Nqwababa 54 – – – – – – – 54 –L H Otterbeck 12611 4311 – – 81 – – – 134 43R A Pym 19 – – – 121 – – – 31 –Former non-executive directorM J P Marks 22 48 – – – – – – 22 48
Total emoluments 2,765 2,070 1,182 1,289 884 617 20 20 4,851 3,99612
Notes1 Benefits include cash allowances payable to the executive directors, as well as travel costs for directors’ spouses to accompany them to certain Board meetings or other
corporate events of the Company and its major subsidiaries. The amount of this expenditure is reported to and considered by the Committee, and procedures are in place for such costs to be authorised. The Committee is satisfied that such expenditure is reasonable and in the interests of the Company.
2 Mr Nicholls took unpaid paternity leave during 2007 forgoing base salary of £5,000.3 The total short-term incentive is payable two thirds in cash and one third in the form of a restricted share award. The cash element for 2007 (£227,000 for Mr Nicholls,
£229,000 for Mr Roberts and £332,000 for Mr Sutcliffe) may be used for the purposes of the bonus-matching arrangement described under the “Executive Directors’Remuneration during 2007” section above. The cash incentives for 2006 were applied net of tax, as to £236,000 gross (in the case of Mr Roberts) and as to £364,000gross (in the case of Mr Sutcliffe) to purchase shares in the Company under the bonus-matching arrangement.
4 As part of Mr Nicholls’ offer of employment, the Company agreed to buy out his bonus entitlement with his previous employer by way of a cash payment of £300,000 in March 2007, which Mr Nicholls elected to use, net of tax, to purchase Old Mutual plc shares under the bonus-matching arrangement.
5 Includes a payment of £62,500 (2007) and £12,500 (2006) in compensation for the loss of fees resulting from Mr Nicholls’ resignation as a non-executive director ofanother listed FTSE 100 financial services group, which was agreed as a condition of appointment.
6 Includes a cost of £33,000 (2007) and £35,000 (2006) in respect of the cost of Mr Roberts’ furnished accommodation in Stockholm.7 The Company made pension contributions in lieu of an equivalent cash payment under Mr Roberts’ benefit allowance.8 Includes fees of £32,000 (2007) and £35,000 (2006) from OMUSH.9 Includes fees of £11,000 (2007) and £34,000 (2006) from Skandia.10 Includes fees of £177,000 (2007) and £125,000 (2006) from Nedbank.11 Includes fees of £76,000 (2007) and £37,000 (2006) from Skandia.12 The prior year comparative number as published in the Remuneration Report for 2006 was £4,134,000, which included £138,000 paid to non-executive directors
who retired during that year.
The executive directors were required to waive fees for non-executive directorships held in subsidiary companies totalling £45,000during the year ended 31 December 2007 in favour of the Company or its subsidiaries. These waivers are expected to remain in force in the future. Mr Sutcliffe received and retained fees totalling £22,000 during 2007 relating to his position as non-executivedirector of Lonmin plc.

Old Mutual plc Annual Report and Accounts 2007Remuneration Report88
Remuneration Reportcontinued
Changes to executive directors’ remuneration in 2008Certain changes to the executive directors’ remuneration arrangements have been approved by the Committee for 2008 and are set out below. These changes were based on a detailed analysis of the market undertaken in 2007 to coincide with the implementation of new share incentive plans which are to be put forward to shareholders for approval at the Annual General Meeting in 2008. TheCommittee reviewed tailored benchmarking data provided by NBSC (in FTSE pan-sector by market capitalisation and the financesector) to assist in determining the size of the annual short-term and long-term incentive awards. This analysis showed that theincentive structure that applied in 2007 did not provide the potential for executive directors to reach the market upper quartile for total remuneration, even if they achieved the maximum level of short-term incentive. The new structure, which applies with effect from the 2008 performance year, is intended to rectify this and provide an opportunity to achieve upper quartile total remuneration on an expected value analysis where the maximum annual incentive is achieved.
This restructure required an adjustment to base salaries, realignment of the annual incentive, removal of the stand-alone long-termincentive (share option) awards and an enhancement of the bonus-matching arrangement. The total remuneration position was thenassessed against the market data provided by NBSC. After the restructure, if target level bonuses are achieved, the executive directorswill still fall below the market median total remuneration for the lower subset of data provided by NBSC (market capitalisation sample).At maximum annual bonus levels, however, using expected value assumptions for share awards, the new structure offers the potentialfor the executive directors to achieve a top-quartile position against the same survey sample.
Base salaryThe base salaries of the executive directors were increased from 1 January 2008 as shown in the table below. These increases wereconsidered by the Committee to be appropriate in the light of comparative FTSE financial services sector and market capitalisationmedian benchmarks.
Percentage2007 2008 increase
Executive director £000 £000 %
J C Nicholls 500 525 5J V F Roberts 500 525 5J H Sutcliffe 735 800 9
Annual short-term incentiveThe maximum short-term incentive award has been increased from 130% of base salary in 2007 to 150% of base salary for the 2008 performance year, of which two-thirds is to be paid in cash and one-third is to be deferred for three years in restricted shares.
Short-term incentive targets for performance year 2008 The respective weightings attached to the Group metrics shown as a percentage of base salary for the executive directors’ short-termincentives for 2008 are as follows:
J H Sutcliffe J C Nicholls J V F RobertsMetrics Group % Group % Group % Skandia %
IFRS Earnings 51 51 12 15Return on Equity 51 51 12 15EEV Earnings 25.5 25.5 6 7.5Return on Embedded Value – – – 7.5Net client cash flows – – – 7.5Synergies/other – – – 15
Sub-total 127.5 127.5 30 67.5
Personal objectives 22.5 22.5 52.5

Old Mutual plc Annual Report and Accounts 2007Remuneration Report 89
Gov
erna
nce
Bonus matchThe bonus-matching plan in operation for 2007 provided a one-for-one, gross-for-net (after tax and NIC) match in restricted shares on any portion of the cash element of the short-term incentive used to purchase Company shares (personal shares). The new bonus-matching plan, for the 2008 performance year onwards, provides for a two-for-one, gross-for-net (after tax and NIC) bonus match on any portion of the cash element of the short-term incentive used to purchase personal shares. The Committee intends, in respect of the awards to be granted in 2009, to make half of the award in restricted shares and half in share options. This ratio will beconsidered by the Committee each year. The number of options to be granted will be based on an equivalent “cost to company” value of an option in relation to a share award at the time of each grant. The current calculation is that the cost to the Company of four shares under option is equivalent to one share under award, where the same performance targets are applied to both.
Bonus-matching shares vest, subject to: (a) continued employment with the Group for the three-year vesting period, (b) theachievement of performance targets (as described below), and (c) retention for the entire three-year period of the personal sharesbacking the match.
As a result of the incentive restructure, the grant of stand-alone share options as a long-term incentive will no longer apply. The full LTI award is therefore linked to the success of the executive directors in delivering annual performance. If there is no annual incentivepayment, the Committee has discretion to allow the executive directors to invest their own money to purchase Old Mutual plc shares(up to the target level of the annual cash bonus) and hold them for a period of three years in order to obtain a matching share award.
Performance targets for the bonus matchThe Company and the Committee have given much thought to the choice of appropriate performance metrics for the LTI awards thatwill be made from 2009. The metrics proposed at the inception of the plan are as follows:
> IFRS EPS growth – above UK RPI;> RoAE (Return on Average Equity) – based on the average of the annual RoAE achieved in the three-year period; and > Revenue growth – using growth in Assets x Margins as the measure.
The Committee is satisfied that this structure supports the strategy of the Company and that the performance measures proposed reflect the drivers of underlying performance and should result in long-term delivery of shareholder value.
The following chart depicts the overall make-up of the executive directors’ respective remuneration packages for 2008, assuming on-target (rather than maximum) delivery on the short-term incentive and an expected value for the long-term incentive.
Percentage of total remuneration – 2008
J C Nicholls
J V F Roberts
J H Sutcliffe
% of total
Base Benefit allowance Bonus Deferred Bonus LTI
0 3010 4020 50 60 70 80 90 100

Old Mutual plc Annual Report and Accounts 2007Remuneration Report90
Remuneration Reportcontinued
Employee share plansThe following is a summary of the employee share plans currently operated by the Company and its wholly-owned subsidiaries.
Shares under award or option
Name of Plan Description at 31 Dec 2007
Share Option and Deferred Delivery Plan (SOP) > The purpose of the SOP is to grant share options as a long-term incentive to qualifying senior employees. Grants are phased annually so that no undue incentive arises in relation to any year of maturity. 39,645,508
Restricted Share Plan (RSP) > The purpose of the RSP is: (i) To assist in the recruitment of key individuals by making awards of shares, restricted for three or more years, which lapse on prior termination of employment unless special circumstances apply; and (ii) to support retention of key talent by (a) contingent share awards that form the deferred element of an annual incentive award, based upon performance evaluation for the prior year; and (b) bonus matching awards. 21,071,553
UK Sharesave Plan (Sharesave) > The purpose of Sharesave is to provide a savings and investment opportunity for employees of the Group’s participating UK businesses, which encourages share ownership at all levels. Options are granted for three- or five-year periods at a discount of up to 20% from the market price during a reference period shortly before the date of grant. 6,264,838
The following plans were introduced in 2005 as part of the Company’s Black Economic Empowerment (BEE) transactions for Old Mutual South Africa (OMSA) and were extended during 2006 as part of the Company’s BEE transactions for Old Mutual Namibia (OMN).
The OMSA Broad-Based Employee Share Plan > This plan is designed to reward all permanent staff of OMSA and OMN who were not in any of the Company’s other share schemes with a one-off award of shares. Grants of share awards in respect of the South African BEE transactions were made in October 2005 and in respect of Namibian BEE transactions in April 2007. There is currently no intention for further awards to be made to South African or Namibian employees under this plan. 5,641,904
The OMSA Senior Black Management Share Plan > This plan is designed to assist OMSA and OMN in attracting and retaining senior black managers in light of the increased competition for talented and experienced black management. It provides for the award of restricted shares and the grant of share options. Grants are made in addition to the normal annual share incentive allocations under the OMSA Management Incentive Share Plan. 16,238,925
The OMSA Management Incentive Share Plan (MISP) > The MISP is designed to attract, retain and reward senior and middle management. It provides for awards of both restricted shares and share options on similar terms and conditions to the SOP and RSP. 25,565,524
Total shares held under award or option at 31 December 2007 114,428,252
Change of controlUnder the rules of the respective schemes, in the event of a change of control:
> options granted under the SOP and awards granted under the RSP would vest in full;> options granted under the MISP would vest: (i) to the extent that the performance criteria to which such options are subject
have been met; and (ii) on a pro-rata basis to reflect the reduction in the length of the original performance period;> restricted share awards granted under the MISP and the OMSA Broad-Based Employee Share Plan would vest in full; and > options and restricted share awards granted under the OMSA Senior Black Management Share Plan would vest in full.

Old Mutual plc Annual Report and Accounts 2007Remuneration Report 91
Gov
erna
nce
The Committee has reviewed the operation of the current share incentive schemes, including how discretion is exercised and the grantlevels currently applicable, and considers these to be appropriate to the Company’s current circumstances and prospects.
Information about the Company’s new share incentive plans, which are intended to replace the SOP, the RSP and the Sharesave Plan,is contained in the shareholder circular relating to the Company’s 2008 Annual General Meeting.
Employee Share Ownership TrustsThe Group operates a number of Employee Share Ownership Trusts (ESOTs), through which it collateralises some of its obligationsunder employee share schemes.
The Old Mutual plc Employee Share Trust is used to satisfy awards under the RSP (excluding South Africa, Namibia and Zimbabwe)and the strategy is to hold shares approximately equal to the number of shares awarded, but not yet vested, at any time. Any surplusshares held in trust because of non-vesting are taken into account when purchasing shares in respect of future awards.
There are various employee share trusts in existence in South Africa and Namibia relating to current and historic share incentiveschemes. The strategy for each scheme has historically been to ensure that sufficient shares were acquired to match at least 90% ofthe obligations of each share incentive grant. However, as a result of the requirements of the Company’s BEE transactions in SouthAfrica and Namibia, it was necessary to place shares allotted as part of the transactions in the relevant BEE employee share trustsimmediately, in order to cover the total annual share grant allocations likely to be made to black participants in terms of the BEEtransactions up to 2014 and 2016 respectively.
The general practice of the ESOTs shown in the table below (save for the BEE-related trusts) is not to vote shares held at shareholdermeetings, although beneficiaries of restricted shares may in principle give directions for those shares to be voted. However, with respectto the OMSA Broad-Based Employee Share Trust, the OMSA Management Incentive Trust, the OMN Broad-Based Employee Share Trustand the OMN Management Incentive Trust, the Trustees may vote any unallocated shares held in these trusts as well as those sharesheld in respect of any unexercised share options. The beneficiaries of any restricted shares allocated by these BEE employee sharetrusts are entitled to vote their relevant shares.
At 31 December 2007, the following shares in the Company were held in ESOTs:Old Mutual plc
Trust Country shares held in trust
Capital Growth Investment Trust1 Zimbabwe 1,713,762Old Mutual plc Employee Share Trust Guernsey 13,388,197OMN Broad-Based Employee Share Trust2 Namibia 904,224OMN Management Incentive Trust2 Namibia 2,234,800OMSA Broad-Based Employee Share Trust3 South Africa 30,512,478OMSA Management Incentive Trust3 South Africa 83,645,335OMSA Share Trust South Africa 29,930,587
Total 162,329,383
1 The Capital Growth Investment Trust is used to satisfy restricted share awards or Deferred Delivery Shares in Zimbabwe under a locally run scheme. Any surplus shares held in trust because of non-vesting are taken into account when purchasing shares in respect of future grants.
2 The OMN Broad-Based Employee Share Trust and the OMN Management Incentive Trust were established during 2006 to subscribe for and hold shares in the Company inconnection with its Namibian BEE ownership transactions. The OMN Broad-Based Employee Share Trust holds shares for the purposes of the Namibian awards under boththe OMSA Broad-Based Employee Share Plan and the OMSA Senior Black Management Share Plan, while the OMN Management Incentive Trust holds shares for Namibianawards under the OMSA MISP. Awards to white employees in Namibia under the OMSA MISP are settled by the OMSA Share Trust.
3 The OMSA Broad-Based Employee Share Trust and the OMSA Management Incentive Trust were established during 2005 to subscribe for and hold shares in the Company in connection with its South African BEE ownership transactions. The OMSA Broad-Based Employee Share Trust holds shares for the purposes of both the OMSA Broad-Based Employee Share Plan and the OMSA Senior Black Management Share Plan, while the OMSA Management Incentive Trust holds shares for the OMSA MISP. Awards to white employees under the OMSA MISP are settled by the OMSA Share Trust.
Dilution limitsIn accordance with the governing rules of the various share incentive plans, there is a maximum dilution limit of 10% (over a 10-yearperiod) of the Company’s issued ordinary share capital under all share incentive plans and a 6% limit (over a 10-year period) underexecutive share incentive plans. Shareholder approval was obtained at an Extraordinary General Meeting of the Company held on 6 July 2005 for the latter limit to be increased to 6% from its previous level of 5% as a result of the Company’s South African BEE ownership transactions. The new share incentive plans being submitted for shareholder approval at the Annual General Meeting on 8 May 2008 revert back to a 5% limit (over a 10-year period) for executive share incentive plans.
For the purposes of calculating dilution limits, any awards that are satisfied by transfer of pre-existing issued shares (e.g. sharesacquired by market purchase through ESOTs) and any shares comprised in any option that has lapsed are disregarded. The Companyhas complied with these limits at all times.
At 31 December 2007, the Company had 2.79% of share capital available under the 6% in five years limit and 6.47% of share capitalavailable under the 10% in 10 years limit. The issued share capital figure used for this calculation has not been reduced to reflectshares bought back into treasury by the Company.

Old Mutual plc Annual Report and Accounts 2007Remuneration Report92
Remuneration Reportcontinued
Subsidiaries’ share incentive schemesThe Company’s separately-listed subsidiaries, Nedbank Group Limited and Mutual & Federal Insurance Company Limited, have their own share incentive schemes, which are under the control of the Remuneration Committees of their respective boards and are not further addressed in this Report. None of the executive directors of the Company has any interest under such subsidiary shareincentive schemes.
Performance targets applicable to share incentivesThe vesting of executive share options and, in certain cases, restricted share awards, is subject to the successful achievement of EPS-based targets. In choosing performance targets for the SOP, the RSP and the MISP, the Committee has considered the merits of EPS-based targets against alternative possibilities and determined that EPS-based targets were appropriate and sufficientlydemanding in the context of the Company’s market environment, prevailing circumstances and prospects.
Prior to 2006, EPS was measured on a UK GAAP basis and after the introduction of IFRS, on an IFRS basis. As a result of theacquisition of Skandia, existing unvested awards were converted to an EEV EPS basis and the 2006 awards were also based on EEV EPS. Both conversions (from UK GAAP to IFRS and subsequently to EEV EPS) were validated with KPMG Audit Plc and therationale for the use of EEV EPS targets following the Skandia acquisition was set out in the resolution approved by shareholders inNovember 2005.
In 2007 the Committee determined that IFRS EPS targets should once again be applied and intends to use that basis for awards to be made during 2008; however, these will be the last awards to be granted with EPS as the only target. The metrics and structure oftargets applying to the 2008 performance cycle, with first awards to be made in 2009, are set out above in the section of this reportentitled “Changes to executive directors’ remuneration in 2008”.
Group HR prepares the analysis of EPS performance, and the calculations are independently checked by KPMG Audit Plc. This processis, in the opinion of the Committee, appropriate for confirming whether or not the performance targets have been fulfilled.
A summary of the targets attached to the unvested share options and restricted share awards is set out in the table below.
Plans covered Year of grant by targets Target 1 Target 2 Target 3
For applicable RSP awards and For tier 2 of share option awards For tier 3 of share option awards tier 1 of share option awards (between 100% and 200% (in excess of 200% of (up to 100% of base salary) of base salary) base salary)
2005 SOP Growth in EEV EPS: For 50%, Growth in EEV EPS: For 50%, Growth in EEV EPS: For 50%,MISP must exceed growth in the must exceed growth in must exceed growth in RSP1 UK Retail Price Index (UK RPI) UK RPI by at least 12% over UK RPI by at least 15% over
by at least 9% over the the three-year vesting period the three-year vesting period three-year vesting period
For 50%, must exceed growth For 50%, must exceed growth For 50%, must exceed growth in the South African Consumer in SA CPI by at least 12% in SA CPI by at least 15% Price Index (SA CPI) by at over the three-year over the three-year least 9% over the three-year vesting period vesting period vesting period
2006 SOP Growth in EEV EPS must Growth in EEV EPS must Growth in EEV EPS must MISP exceed growth in UK RPI exceed growth in UK RPI exceed growth in UK RPI RSP1 by at least 9% over the by at least 12% over the by at least 15% over the
three-year vesting period three-year vesting period three-year vesting period
2007 SOP Growth in IFRS EPS must Growth in IFRS EPS must Growth in IFRS EPS must MISP exceed growth in UK RPI exceed growth in UK RPI exceed growth in UK RPI RSP1 by at least 9% over the by at least 12% over the by at least 15% over the
three-year vesting period three-year vesting period three-year vesting period
1 Target 1 applies to the bonus-matching restricted share awards granted between 2005 and 2007 and also to the deferred short-term incentive restricted share awards granted to the executive directors in 2005.

Old Mutual plc Annual Report and Accounts 2007Remuneration Report 93
Gov
erna
nce
Directors’ interests under employee share plansThe following options and rights over shares in the Company were outstanding at 1 January and 31 December 2007 in favour of theexecutive directors under the employee share schemes described in the “Employee share plans” section above, those granted during2007 being highlighted in bold and those vested, released or exercised during 2007 being shown in italics:
DateShare Gain exercised
price at made or releasedPerformance date of on date or from which Expiry
Award Type targets Grant At Exercised/ At Exercise exercise/ of exercise exercisable or or vestingand Plan to be met Date 1 Jan 07 Granted released 31 Dec 07 price p release p or release £ releasable date
J C NichollsOption Yes1 30 Mar 07 – 1,183,8882 1,183,888 162.6 30 Mar 10 30 Mar 13
(SOP)
Total 1,183,888 1,183,888
Match Yes1 30 Mar 07 – 182,5423 – 182,542 – – – 30 Mar 10 30 Mar 10(RSP)
Total 182,542 182,542
Joining No4 30 Mar 07 – 876,384 – 876,384 – – – 30 Mar 10 30 Mar 12(RSP)
Total 876,384 876,384
J V F RobertsOption Vested 4 Mar 02 357,000 – 357,0005 – 95.25 177 291,848 12 Oct 07
(SOP) Vested 26 Feb 03 143,000 – 143,0006 – 86.25 177 129,773 12 Oct 07Vested 26 Feb 03 645,406 – – 645,406 86.25 – – 26 Feb 06 26 Feb 09Vested 3 Mar 04 661,418 – – 661,418 95.25 – – 3 Mar 07 3 Mar 10
Yes7 26 Apr 05 304,348 – – 304,348 126.5 – – 26 Apr 08 26 Apr 11Yes1 29 Mar 06 239,295 – – 239,295 198.5 – – 29 Mar 09 29 Mar 12Yes1 30 Mar 07 – 307,5042 – 307,504 162.6 – – 30 Mar 10 30 Mar 13
Total 2,350,467 307,504 500,000 2,157,971 421,621
Match Vested 3 Mar 04 35,695 – 35,6958 – – 164.17 58,603 5 Mar 07(RSP) Yes7 27 Apr 05 173,538 – – 173,538 – – – 27 Apr 08 27 Apr 08
Yes1 29 Mar 06 118,976 – – 118,9766 – – – 29 Mar 09 29 Mar 09Yes1 30 Mar 07 – 143,7663 – 143,766 – – – 30 Mar 10 30 Mar 10
Total 328,209 143,766 35,695 436,280 58,603
DSTI Yes7 27 Apr 05 109,520 – – 109,520 – – – 27 Apr 08 27 Apr 08(RSP) No 29 Mar 06 75,578 – – 75,578 – – – 29 Mar 09 29 Mar 09
No 30 Mar 07 – 90,812 – 90,812 – – – 30 Mar 10 30 Mar 10
Total 185,098 90,812 – 275,910
Option(Sharesave) No 27 May 05 9,199 – – 9,199 1039 – – 1 Jul 08 31 Dec 08
Total 9,199 – – 9,199
J H SutcliffeOption Vested 4 Mar 02 128,000 – 128,00010 – 95.25 149.50 69,440 13 Sep 07
(SOP) Vested 4 Mar 02 396,950 – 396,95011 – 95.25 165.70 279,651 15 Nov 07Vested 26 Feb 03 1,124,639 – – 1,124,639 86.25 26 Feb 06 26 Feb 09Vested 3 Mar 04 944,882 – – 944,882 95.25 – – 3 Mar 07 3 Mar 10
Yes7 26 Apr 05 434,783 – – 434,783 126.5 – – 26 Apr 08 26 Apr 11Yes1 29 Mar 06 352,645 – – 352,645 198.5 – – 29 Mar 09 29 Mar 12Yes1 30 Mar 07 – 904,0602 – 904,060 162.6 – – 30 Mar 10 30 Mar 13
Total 3,381,899 904,060 524,950 3,761,009 349,091
Match Vested 3 Mar 04 83,989 – 83,9898 – – 164.17 137,891 5 Mar 07(RSP) Yes7 27 Apr 05 315,933 – – 315,933 – – – 27 Apr 08 27 Apr 08
Yes1 29 Mar 06 211,003 – – 211,003 – – – 29 Mar 09 29 Mar 09Yes1 30 Mar 07 – 221,3723 – 221,372 – – – 30 Mar 10 30 Mar 10
Total 610,925 221,372 83,989 748,308 137,891
DSTI Yes7 27 Apr 05 159,508 – – 159,508 – – – 27 Apr 08 27 Apr 08(RSP) No 29 Mar 06 107,230 – – 107,230 – – – 29 Mar 09 29 Mar 09
No 30 Mar 07 – 111,877 – 111,877 – – – 30 Mar 10 30 Mar 10
Total 266,738 111,877 – 378,615
Option(Sharesave) No 5 Apr 02 19,939 – 19,93912 – 8313 177.4 18,822 1 Jun 07
No 4 Apr 07 – 12,500 12,500 13114 – – 1 Jun 12 30 Nov 12
Total 19,939 12,500 19,939 12,500 18,822
The aggregate amount of gains made by directors on the exercise of share options during the year was £789,534 (2006: £35,304).
There have been no changes in the directors’ interests in any of the Group’s employee share plans between 31 December 2007 and27 February 2008.

Old Mutual plc Annual Report and Accounts 2007Remuneration Report94
Remuneration Reportcontinued
1 Subject to the fulfilment of performance targets prescribed by the Committee, under which:> options and restricted shares granted in 2006 are subject to a Sterling-denominated EPS performance target requiring growth in EEV EPS to exceed growth
in UK RPI by at least 9% over the 3-year vesting period;> options and restricted shares granted in 2007 are subject to a Sterling-denominated EPS performance target requiring growth in IFRS EPS to exceed growth
in UK RPI by at least 9% over the 3-year vesting period;> as a result of the acquisition of Skandia, the Company converted the targets for awards granted between 2004 and 2006 from IFRS EPS-based targets to EEV
EPS-based targets.2 Options under the SOP and the deferred STI RSP awards granted on 30 March 2007 were based on the closing middle market price of the Company’s shares on the
London Stock Exchange on 29 March 2007, namely 162.60p. The award under the SOP granted to Mr Sutcliffe was over shares with a market value equal to 200% of his base salary at the time of grant, while the grant to Mr Roberts was over shares with a market value equal to 100% of his base salary at the time of grant. The award to Mr Nicholls consisted of a joining grant with a market value of £1,425,000 and an annual grant with a market value equal to 100% of his base salary at the time of grant.
3 The number of shares awarded under the RSP bonus match on 30 March 2007 was calculated by reference to a price of 164.32p per share, being the price at which the matching shares were acquired by the Trust.
4 The restricted share award granted to Mr Nicholls on 30 March 2007 was in respect of a buy-out of an entitlement with his previous employer. As a result, the vesting of the award, which occurs in equal thirds on the third, fourth and fifth anniversaries of grant, is not subject to the achievement of performance targets.
5 Mr Roberts sold 260,891 of the shares released and retained 96,109 shares. 6 Mr Roberts sold 100,194 of the shares released and retained 42,806 shares. 7 As a result of the successful achievement of tier 1 of the EEV EPS-based performance targets, the options and restricted share awards granted on 26 and 27 April 2005
respectively will vest in full on 26 and 27 April 2008.8 Mr Roberts sold 14,686 of the shares released to cover his income tax and employee National Insurance Contribution liabilities and retained 21,009 shares. Mr Sutcliffe
sold 34,557 of the shares released to cover his income tax and employee National Insurance Contribution liabilities and retained 49,432 shares.9 The Sharesave option price was determined as 20% below the average of the Company’s share price between 5 and 9 May 2005. The Company’s share price at the
date of grant (27 May 2005) was 120p.10 Mr Sutcliffe retained all of the shares exercised.11 Mr Sutcliffe sold 350,000 of the shares exercised and retained 46,950 shares.12 Mr Sutcliffe retained all of the shares exercised.13 The Sharesave option price was determined as 20% below the average of the Company’s share price between 7 and 11 March 2002. The Company’s share price
at the date of grant (5 April 2002) was 109p.14 The Sharesave option price was determined as 20% below the average of the Company’s share price between 13 and 15 March 2007. The Company’s share price
at the date of grant (4 April 2007) was 166.5p.
Executive directors’ shareholding requirementsThe Committee has established guidelines on shareholdings by executive directors of the Company. Under these, the Chief Executive is expected to build up a holding of shares in the Company equal in value to at least 150% of annual base salary within five years ofappointment; the equivalent figure for other executive directors is 100% of annual base salary. For the purposes of the calculations,unvested restricted share awards are excluded.
The following table shows Old Mutual plc shares held by executive directors at 31 December 2007 (including holdings by connectedpersons) compared to the shareholding requirements prescribed by these guidelines.
Minimum number of Personal shares held at Date by which holdingshares required to be held1 31 December 2007 must be achieved
J C Nicholls2 298,330 106,764 1 November 2011J V F Roberts 298,330 806,546 –J H Sutcliffe 657,816 1,692,769 –
Notes1 The minimum number of shares required to be held has been calculated using the market price of Old Mutual plc shares on 31 December 2007, namely 167.6p.2 J C Nicholls also holds 876,384 unvested restricted shares which are subject to time-vesting only.
Current exposureThe current exposure of the executive directors to the Company’s share price is shown in the table below. This includes shares ownedoutright (including holdings by connected persons), and the intrinsic value (market share price at 31 December 2007 less the weightedaverage option exercise price) of options already vested. It excludes unvested share options and restricted share awards that are subjectto performance targets, although the executive directors do have further exposure to the Company’s share price in this respect.
Total restricted shares held Total
Total value (not subject to Total value Vested options Weighted Total intrinsic exposure as a Personal of personal performance of restricted at 31 December average value of Total percentage
shares held shares £ targets) shares £ 2007 exercise price p vested options £ exposure £ of base salary
J C Nicholls 106,764 179,000 876,384 1,469,000 – – – 1,648,000 330J V F Roberts 806,546 1,352,000 166,390 279,000 1,306,824 90.80 1,004,000 2,635,000 527J H Sutcliffe 1,692,769 2,837,000 219,107 367,000 2,069,521 90.35 1,599,000 4,803,000 653
The Board has considered whether to adopt a shareholding requirement for non-executive directors, but does not consider this to be appropriate.

Old Mutual plc Annual Report and Accounts 2007Remuneration Report 95
Gov
erna
nce
Company share price performanceThe market price of the Company’s shares was 167.6p at 31 December 2007 and ranged from a low of 144p to a high of 187.5pduring 2007.
The following graph shows the total shareholder return to 1 January 2008 on £100 invested in shares in Old Mutual plc on 1 January2003 compared with £100 invested in the FTSE 100 Index. The other points are the comparative returns at the intervening financialyear ends.
In the opinion of the directors, the FTSE 100 Index is the most appropriate index against which to measure total shareholder return of the Company, as it is an index of which Old Mutual plc is a member and is located where the Company has its primary listing. The Board and the Committee also have regard to a variety of other sector-specific comparators in reviewing performance.
Total shareholder return for five years to 1 January 2008Old Mutual plc – total return
Source: Datastream
Shareholder approval of the Remuneration ReportAn advisory vote on the Remuneration Report will be put to shareholders at the Annual General Meeting on 8 May 2008 in accordancewith the Directors’ Remuneration Report Regulations 2002.
Rudi BogniChairman of the Remuneration Committee,On behalf of the Board27 February 2008
0
50
100
150
200
250
FTSE 100
Old Mutual plc
Jan 03 Jan 04 Jan 06Jan 05 Jan 07 Jan 08

Old Mutual plc Annual Report and Accounts 2007Corporate Responsibility96
OverviewBusinesses within the Old Mutual plc group (the Group) aim tomeet the needs of clients while understanding the wider issuesfor which they have responsibility. The Group views corporateresponsibility as the pursuit of commercial success in ways thathonour ethical values and respect people, communities and the natural environment. The Group’s corporate responsibilityprogrammes operate at a local level following guidelines andframeworks that are standardised across the Group. Thesestandards take cognisance of the United Nations Global Compact(UNGC), criteria established by the FTSE4Good Index and workdone with the FORGE Group to identify issues relevant to thefinancial sector. The Group has established Corporate Responsibilityprinciples that each business unit replicates at local level.
The Group is committed to observing proper practices in the area of human rights. This has been further supported by Old Mutual having become a signatory to the UNGC during2007. The UNGC is a framework of ten universally acceptedprinciples in the areas of human rights, labour, the environmentand the prevention of corruption. The Group supports them andwill work to further the principles through its business activities.The commitment to the UNGC will sit alongside the existingFTSE4Good framework that has been built into the Group’sstrategy and will support the work undertaken during 2008.
The Group has also adopted and aims to abide by a Code ofBusiness Conduct/Ethics. The Code includes information onrelations with customers, suppliers, intermediaries, shareholdersand investors, employees, government and the local community,as well as competitors and compliance issues. The Code can be viewed on Old Mutual plc’s website and is also provided toOld Mutual staff. The Code supports the International LabourOrganisation’s Core Labour Standards, covering issues such as equal opportunities, freedom of association and collectivebargaining. The Group Company Secretary has responsibility for the Code of Business Conduct/Ethics. As human rightsstatements exist within that Code, any suspected breach will bedealt with through the appropriate risk functions and the Auditand Risk Committees that are in place around the Group. Thesealso enable matters to be suitably escalated to the Group Auditand Risk Committee, where warranted. The Group does notsupport forced labour or child labour in any of its operations.
Corporate Responsibility
We believe that our reputation is built upon our desire to berespected members of thecommunities in which we live and work.We express this desirethrough our corporate values,through the way we interact with our customers, investors,regulators, suppliers and eachother and through our activeinvestment in the upliftment ofour communities and preservationof our natural environments.

Old Mutual plc Annual Report and Accounts 2007Corporate Responsibility 97
Res
pons
ibili
ties
Old Mutual plc is a member of the FTSE4Good Index, the selection criteria for which include working towardsenvironmental sustainability, developing positive relationshipswith stakeholders, and upholding and supporting universalhuman rights. Old Mutual plc and Nedbank Group Limited areboth included in the JSE’s Socially Responsible Investment Index.This Index measures participant companies’ commitment andperformance against a triple bottom line of sustainability in termsof environmental, economic and social impacts.
Nedbank Group has also been listed on the Dow Jones WorldSustainability Index (DJSI) for a third year. The DJSI was theworld’s first benchmark to track the performance of leadingcompanies in terms of corporate sustainability.
Community projectsDuring 2007, the Group’s social investment programmesoperated principally in the countries where its businesses werelocated, working with selected charities and other organisationsto benefit causes supported by the Group. These includededucation, health and welfare, local economic development, the environment and the arts. In South Africa particular attention was paid to Black Economic Empowerment (BEE) and HIV/AIDS. The Financial Sector Charter (FSC) targets for BEE and transformation continued to be met and exceeded in many areas by the Group’s local businesses.
South AfricaOld Mutual South Africa (OMSA)OMSA is committed to growing and investing in sociallyresponsible business activities, employment equity and diversity,skills development and affirmative procurement, as well assustainable social investment projects and the active involvementof employees in social and community affairs. Its CorporateCitizenship programme recognises the value of non-financialperformance and social accountability.
The Old Mutual (South Africa) Foundation (the Foundation) is the primary source of funds for OMSA’s social investmentprogramme. At the year end, the assets of the Foundation were worth R332 million, including 14.5 million shares in Old Mutual plc.
The Foundation began a three-year medium-term strategy in2007 whose areas of focus are local economic and enterprisedevelopment (LEED), education and staff volunteerism. Inaddition to these programmes, the Foundation supports HIV/AIDSprojects. These programmes have continued to offer help to localcommunities, to vulnerable children and to OMSA staff who wish to participate in voluntary activities. The Foundation spentover R32 million on its corporate social investment programmesduring the year and also made ad hoc donations to a number of charities.
LEED: 2007 saw the start of the LEED programme, with over R9.5 million being given in support of 12 programmes. The Product to Market skills development programme was one of the largest investments, helping 126 craftsmen develop theircareers. The products made have been sold to 18 government or corporate buyers, supporting the formation of over 100supplier relationships. Under the small-scale farming initiative,over 500 trainees have attended courses and then gone on todevelop a farm in their communities. This programme is run inassociation with the Organic Farms Group, which has assistedthe farmers to form links to recognised supermarket chains. A new project was also established to support entrepreneurs,focusing on school-leavers and women’s groups. Fundingenabled teams to propagate trees for planting in variouscommunities and to restore the Ongoye Forest.
AIDS Orphans Programme: Old Mutual has adopted a four-pronged strategy to address the social and economic challengescaused by the HIV/AIDS epidemic in South Africa. This strategycovers the workplace (employees), the broader community,financial services and advice (customers), and business impacts.The Foundation has worked with a number of organisations in this area, including Heartbeat, NOAH and Helping Hands. The Foundation’s AIDS Orphans Programme supported NOAH in its successful application to be the charity of choice for theTwo Oceans Marathon for the next three years. During 2007 over 5,000 orphans were supported through the programme and training was also given to over 130 people to enable them to supply home-based care supporting orphans orvulnerable children.
From left to right Product to Market Under one of Old Mutual South Africa’slocal economic development programmeinvestments, over 100 craftsmenreceived support to develop their careers.
Umcebo Trust Durban SA Working with other supporters, includingthe National Department of Arts andCulture, Old Mutual South Africasupports the Trust in skills development,job creation and access to markets.

Old Mutual plc Annual Report and Accounts 2007Corporate Responsibility98
Corporate Responsibilitycontinued
Staff Volunteer Programme: The Staff Volunteer Programmeconsists of the Staff Community Builder Programme, “Adopt an Orphan” and the Staff Charity Fund. This programme wasrenewed during the year, making donations of R6.3 million. TheStaff Community Builder Programme supported 174 projects,giving R3.2 million to the local community. Sixteen organisationswere supported through the Staff Charity Fund this year, with a total of over R340,000 being distributed to causes such asabused children, HIV/AIDS charities, the elderly and animalwelfare groups. Care and Share Week was a great success in2007, with almost 90 projects approved and nearly 2,000employees signed up to support them. The Adopt an Orphanprogramme encourages staff to commit a regular amount of R50per month (matched Rand for Rand by the Foundation) towardsthe care and support of vulnerable children. The Foundation’spartner organisation, Heartbeat, manages the administration of funding of the children supported by the programme andworks to address their educational and welfare needs.
General programmes: Old Mutual staff, including the Group Chief Executive, Jim Sutcliffe, took part in building five houses in Gauteng and five houses in Mfuleni with Habitat for Humanity,which brought the total number of houses built by Old Mutual inSouth Africa through the efforts of staff volunteers to 35. Linksbetween the Department of Social Development and members of the Gauteng Provincial Management Board were furtherdeveloped through a mentorship and skills-sharing programme.
The Out of the Box Environmental Education Programme waslaunched in Johannesburg in April 2007, thereby extending thework already done in the Cape Town region.
Masisizane: The Masisizane Trust was launched by OMSA during2007 using some of the proceeds released from the closure ofthe Company’s South African Unclaimed Shares Trust.
When Old Mutual became a publicly listed company in 1999,eligible Old Mutual policyholders were issued with free shares.Under the scheme of demutualisation approved by the SouthAfrican High Court, persons eligible to receive those free shareswere required to claim them. Since then, some 98% of theshares have been claimed by the original policyholders. 2% of the shares remained unclaimed despite strenuous efforts totrace those potential shareholders. The Trust in South Africaclosed in August 2006, as required by the Trust Deed, with the54 million remaining unclaimed shares being sold. In line withmanagement’s recommendation, shareholders agreed at the Old Mutual plc Annual General Meeting on 24 May 2007
that the after-tax proceeds would be used as follows: R400million would be retained to meet claims from any remainingpolicyholders who had not yet claimed their shares with anyresidue remaining after three years from 31 August 2006 to beused to benefit South Africa; R300 million would be used toimprove the benefits of certain small policyholders; and someR400 million would be invested in development initiatives thatwould contribute to shared economic growth in South Africa.
Masisizane has been incorporated to co-ordinate the delivery ofthese initiatives. A mix of representatives from Old Mutual plc,OMSA, the Group’s empowerment partners (WIPHOLD andBrimstone) and two external representatives will oversee them. In summary, the initiatives and related funding are:
> Women-owned Enterprise Development (R260m), which aims to facilitate the development of women-owned SMMEbusinesses that create employment in various economicsectors, with a special focus on micro-sized businesses. In the long term, this should translate into wealth forindividuals, sustainable home-building, access to education,and re-investment into the economy;
> Financial Education Initiative (R60m), which aims to helpSouth Africans across all income groups improve theirfinancial discipline and financial knowledge;
> the Ilima Trust (R50m), which will aim to assist in developingthe ability of South African municipalities to serve theircommunities on a sustainable basis. Capacity-building and knowledge transfer will be delivered by former staff ofOMSA. These activities are conducted in partnership with the Department of Provincial and Local Government;
> the JIPSA initiative (R5m) aims to train people in localgovernment organisations on project management skills. This is a continuation of a partnership initiative betweenOMSA and the Deputy President’s Office to deepen the ability of municipalities to deliver services;
> a R25m pool of funds has been allocated to Old Mutual plc to support South African initiatives aligned to the four broad themes above, namely job creation and enterprisedevelopment, financial education, skills and capacity-buildingand training.
All of these interventions are in addition to existing business and corporate social initiatives undertaken by OMSA. Theintention is that each initiative should make a meaningfulinvestment in shared growth, as envisaged in the Government’splans for the Accelerated and Shared Growth Initiative for SouthAfrica (ASGISA).
From left to right Habitat for HumanityOld Mutual’s Chief Executive, Jim Sutcliffe, joined Old Mutual SouthAfrica employees building houses with Habitat for Humanity. In total Old Mutual South Africa built fivehouses in Gauteng and five in Mfuleni.
Community Builder One of the 174 projects supported by Old Mutual South Africa Staffthrough the 2007 Community BuilderProgramme. Each of these projects is run on a local level with local staff participating.

Old Mutual plc Annual Report and Accounts 2007Corporate Responsibility 99
Res
pons
ibili
ties
BEE: OMSA is committed to broad-based empowerment and tobeing rated an ‘A’ performer as measured by the FSC. Initiativescontinue to be implemented to develop staff, particularly in thearea of management and leadership, and to ensure that blackstaff are supported in their roles as leaders in the Group. Otherobjectives of these initiatives are to contribute to the building of a strong and stable society and democracy through soundinfrastructural investments, to facilitate the entry of blackentrepreneurs into corporate South Africa through structuring and investing in BEE deals, and to make direct investments into communities and society at large.
OMSA has a good track record in each of these areas, havingalready set industry benchmarks in infrastructural investment,corporate social investment, staff development and training, and the creation of a diverse workplace.
The black business partners introduced to the Company as aresult of the empowerment transactions entered into with theBrimstone and WIPHOLD consortia during 2005 have had amarked impact on the overall transformation strategies of OMSA.These partners have played a key advisory role in diverse areassuch as small and medium company development, skillsdevelopment, stakeholder relations, and product development.All parties remain committed to the performance contractsentered into as part of those transactions and these shouldcontinue to position OMSA as a leading exponent oftransformation within the South African context.
OMSA's Corporate Citizenship Report for 2007 details OMSA’scontribution to South Africa's economic transformation, includingBEE programmes and their alignment to the FSC. It is expectedto be available on the Company's website, www.oldmutual.com,from April 2008. A copy may also be requested from theCorporate Affairs Manager, Old Mutual (South Africa), PO Box 66, Cape Town 8000 and from the Head of Corporate Responsibility, Old Mutual plc, 5th Floor, Old Mutual Place, 2 Lambeth Hill, London EC4V 4GG.
Nedbank GroupNedbank Group (Nedbank) contributed R35 million tocommunity projects during 2007. These were carried out mainlythrough the Nedbank Foundation, which spent R30 million tosupport over 200 projects in the areas of welfare, communitydevelopment, economic development, heritage, arts and cultureand education, with the largest contribution going to the last of these. The Foundation’s contribution was double the levelrequired by the FSC.
Nedbank aims to help meet the challenge of giving all SouthAfrican children a good education. Through its focus on ruralschool development, the Foundation has made significantinvestments to provide better learning facilities for some of thecountry’s most needy communities. The organisation has beeninvolved in the development of youth centres in both Gautengand KwaZulu-Natal, which offer skills and financial managementtraining and business education to out-of-school and out-of-workyouths. During 2007 nearly 300 young men and womenbenefited from these programmes.
During the year Nedbank unveiled two promotional “solarbillboards”. The first panel generated electricity for a kitchen atMC Weiler Primary School in Alexandra Township in Gauteng,enabling meals to be cooked for more than 1,400 children everyday. This initiative led to Nedbank winning the first-ever GrandPrix Award at the Cannes Advertising Awards. The secondbillboard was opened towards the end of 2007 in Athlone in the Western Cape.
HIV/AIDS: Nedbank’s health strategy focuses on prevention ofHIV/AIDS among the uninfected and on positive living for thosewho are infected. Prevention involves educational work, while the positive living programme aims to extend life expectancy and the quality of life of those living with the virus. Nedbankhelps children who have been left vulnerable by the pandemic, as well as those living with the disease, and employees areencouraged to become personally involved in HIV/AIDS projects.As part of this, the company works with organisations such as Johannesburg Child Welfare Society, Lerator Love Home,Cotlands Baby Sanctuary, Jan Hofmeyr Emdeni Children’s Home,Hospice in Soweto, McCord Hospital and Sparrow Ministries toassist local communities to support those affected by HIV/AIDSand their families.

Old Mutual plc Annual Report and Accounts 2007Corporate Responsibility100
Corporate Responsibilitycontinued
Through its economic development work, the Foundation directlyaddresses another important South African national priority, jobgeneration, by helping people to improve their skills. Women and out-of-school young people are a particular focus of theprogramme. Implementation of these programmes is often inpartnership with non-governmental or community-basedorganisations. As part of its focus on education Nedbank hassupported the Walter Sisulu University in the Eastern Cape, with a donation funding equipment for two media centres for its Department of Economics.
Employee participation: Nedbank encourages its employees to become involved in charitable activities by providing time,energy, talent and leadership skills. Team Challenge is anexample of this, being a team-based, community-focusedinitiative designed to give employees an opportunity to win a share of R230,000 for their favoured causes. During 2007, a new category was introduced, the seven-day challenge, toencourage staff to become involved in projects that could becompleted in under a week. The winning long-term teamsupported the Simphumelele Home, which provides care forchildren who have been abandoned, neglected or abused.Projects supported by the winning seven-day teams includedvegetable gardens for a children’s care centre and donation ofbeds to a nursery at a children’s home in Soweto.
The Local Hero programme is an initiative that honours staffmembers who make a difference in their communities throughvolunteer work. It supports and showcases the efforts of theseindividuals, thereby furthering a culture of employee involvementand caring. The qualifying criteria are stringent and thecommitment from the staff member must be long-term. In 2007 there were 43 applications, with R390,000 beingdonated. During the year the programme was also extended to include projects supported by the bank’s customers.
Foundation/Trusts: The BoE Education Foundation and BoECharitable Trust provided R3 million of support to projects ineducation and welfare during 2007, focusing especially on theGauteng, Western Cape and KwaZulu-Natal regions. OverR560,000 was distributed by the Nedbank NBS CentenaryFoundation, with a focus on early childhood development andwelfare. Many awareness days and public fund-raising eventswere also held in conjunction with staff.
Nedbank has had a long association with sport for the disabled,the highlight being the annual Nedbank Championships for thePhysically Disabled. These Championships support Nedbank’scontinuing sponsorship of the South African Paralympic Team,which will compete in Beijing in 2008.
The Nedbank Green, Sport, Arts and Children’s Affinitiescontinued during 2007. These operate in conjunction withaffinity bank accounts opened and run by Nedbank’s customers,with donations by the Company based on the levels of usage of these accounts. Together they have donated nearly R100 million to environmental, sports, arts and children’s projects since they began.
The Green Trust, a partnership between Nedbank and WWF-SA,is a partnership that supports conservation projects throughcommunity-based programmes. Since its inception in 1990, the Trust has funded over 150 conservation projects throughoutSouth Africa, with over R5 million being donated by Nedbankduring 2007. Projects that received support include rehabilitationprojects for a variety of species and a wider biodiversity programme.
The Sports Trust donated over R850,000 during 2007 tosupport a number of projects, including a Bicycle EmpowermentNetwork, which promotes the use of bicycles as a low-cost and environmentally friendly mode of transport, and theestablishment of netball courts and cricket nets at theDiamandveld Primary School.
Donations during the year by the Nedbank Arts & Culture Trustexceeded R450,000. Among the recipients was the JikelezaDance Project, which works with disadvantaged children in Hout Bay.
The Nedbank Children’s Affinity, which works in partnership withthe Nelson Mandela Children’s Fund (NMCF), aims to improvethe quality of life for South Africa’s children and youth. The fund’seducation programmes support orphans and vulnerable children.During 2007, Nedbank and its Children’s Affinity clients donatednearly R3.5 million to the NMCF, helping the fund to supportnearly 70 projects.
From left to right Nedbank ParalympicsOscar Pristorius is one of the SouthAfrican Paralympic Team supported by Nedbank. The 2008 Beijing Gamesmark Nedbank’s fourteenth year as a sponsor of the South AfricanParalympic Team.
Solar Billboard The children at MC Weiler PrimarySchool in Gauteng benefitted fromNedbank’s first solar billboard.Generating electricity for the schoolkitchen, it enabled 1,400 meals to be cooked every day.

Old Mutual plc Annual Report and Accounts 2007Corporate Responsibility 101
Res
pons
ibili
ties
BEE: Nedbank remains committed to meeting and exceeding the requirements of the FSC as one of its signatories and toachieving the ideals of transformation and implementing BEEinitiatives under the FSC within acceptable risk parameters. Ithas taken a number of steps to ensure this. The organisation’sphilosophy is to differentiate itself in terms of its BEE approachby strengthening existing BEE relationships, creating newrelationships among established and new BEE players in the market, and supporting emerging BEE players.
More information on Nedbank’s approach to the FSC and BEE, as well as further details of the projects supported by theNedbank Foundation, will be provided in its Sustainability Report,which will be published in April 2008. This Report will beavailable on its website, www.nedbank.co.za, and also uponrequest from the Senior Manager, Corporate Governance andSustainability, Nedbank Group Limited, PO Box 1144, Sandton2196, South Africa.
Mutual & FederalIn 2007, Mutual & Federal spent just under R2 millionsupporting various charitable organisations, focusing on the areas of education, health and welfare, road traffic safety, crimeprevention and conservation. Organisations which receivedsupport included the Drive Alive Trust, NICRO, Business AgainstCrime, the WWF, the SA Conservation Education Trust and theEndangered Wildlife Fund.
Mutual & Federal’s sport sponsorship was focused on cricket and rowing and amounted to R1.14 million in 2007. Through its sponsorship of the Mutual & Federal Cricket Annual and theAnnual Cricket Awards, the company has established a solidrelationship with Cricket South Africa. The Company alsosponsors the Annual Universities Boat Race held in Port Alfred,including a novice race which was introduced in 2007.
In addition to its Corporate Social Investment programme, Mutual & Federal has established a Community Trust that hasidentified three major areas of need in South Africa. The first is youth empowerment, the second AIDS orphans, vulnerablechildren and child-headed households, and the third enterprisedevelopment. During 2007 the Trust supported SOS Children’sVillages in Mpumalanga and MaAfrica Tikkun in Gauteng to runprojects supporting empowerment and disadvantaged children.Support was also extended to a social upliftment project in the Western Cape.
Rest of AfricaNamibia: The Old Mutual Namibia Foundation remainscommitted to being a good corporate citizen and to helping tocreate sustainable livelihoods in Namibia. The Foundation tries to ensure that, through mutual understanding and responsiblebehaviour, the role of business in building a better future isrecognised and encouraged. Its agenda is tailored to meet thecompany’s social priorities by supporting education, health andwelfare and accelerating the transition to a sustainable way of life in local communities. During 2007, over N$1,600,000 wasspent on existing projects as well as new partnerships. Amongthe projects supported were the Ekondopeko Mathematics Project in conjunction with Nedbank, which for the second year, worked for the upliftment of mathematics in rural areas. In the health and welfare area, a donation was made to theMinistry of Health and Social Services to support a project in the Tsumkwe constituency working with the local community totackle tuberculosis. Support for community development projectsincluded the Mahetago Community Centre where communityskills training workshops are held. To date over 600 communitymembers have been trained. Project Etango, a project to convertdecommissioned shipping containers into offices, kitchens,counselling centres or classrooms for local communities, willreceive a three-year commitment from Old Mutual Namibia in the form of donations and employee support through the Staff Community Builder Programme.
At the end of 2007, the Namibian Foundation had assets of nearly N$11 million, including 5,478,000 shares in Old Mutual plc.
BEE: In September 2006, the Old Mutual Group announced BEE transactions in Namibia, which resulted in a broad range ofblack stakeholders acquiring ownership of N$308 million-worthof the Group’s Namibian businesses. There were three separate,but interdependent, BEE transactions for Old Mutual Namibia,Nedbank Namibia and Mutual & Federal Namibia. Thetransactions included employees, strategic business partners,distributors, trade union members and their families, women’sorganisations and church groups. Three business consortia werecarefully selected from different parts of Namibia as strategicbusiness partners on the basis of their ability to add value byattracting new clients to the current businesses. These consortiaare all broad-based, have empowerment credentials, demonstratestrong leadership, share the Group’s values and have relevantfinancial services experience. The Group also selected strategic
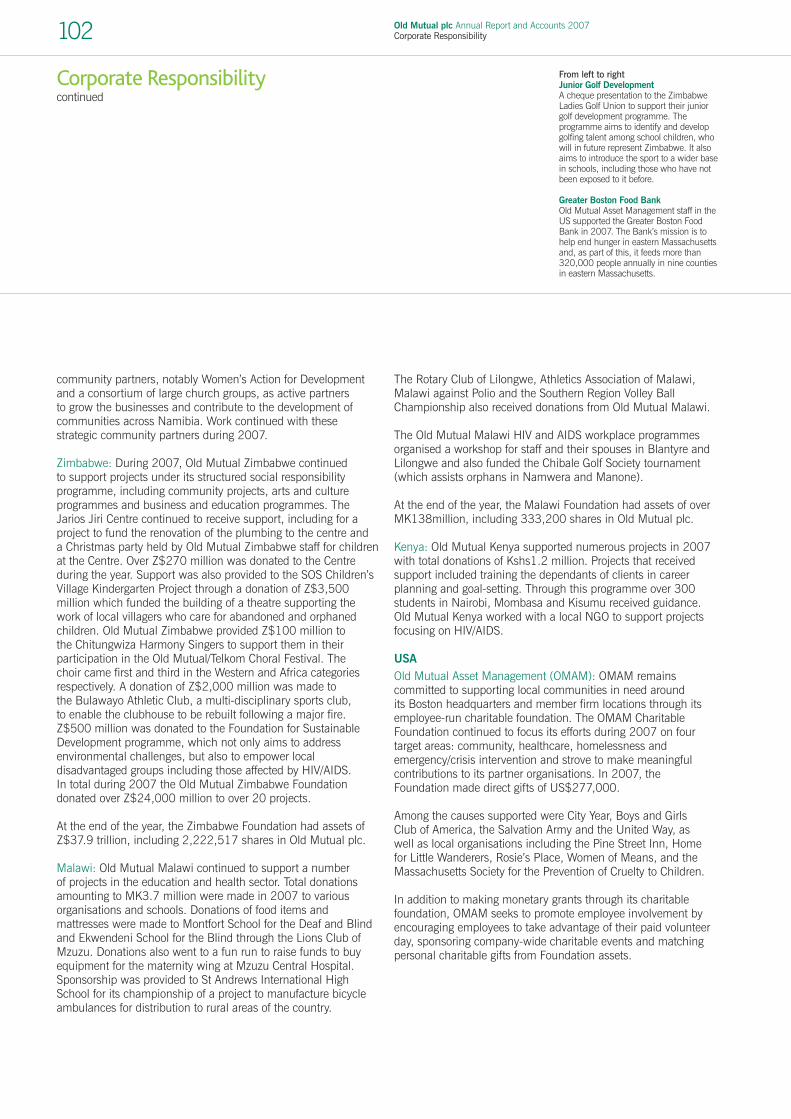
Old Mutual plc Annual Report and Accounts 2007Corporate Responsibility102
Corporate Responsibilitycontinued
community partners, notably Women’s Action for Developmentand a consortium of large church groups, as active partners to grow the businesses and contribute to the development ofcommunities across Namibia. Work continued with thesestrategic community partners during 2007.
Zimbabwe: During 2007, Old Mutual Zimbabwe continued to support projects under its structured social responsibilityprogramme, including community projects, arts and cultureprogrammes and business and education programmes. TheJarios Jiri Centre continued to receive support, including for aproject to fund the renovation of the plumbing to the centre and a Christmas party held by Old Mutual Zimbabwe staff for childrenat the Centre. Over Z$270 million was donated to the Centreduring the year. Support was also provided to the SOS Children’sVillage Kindergarten Project through a donation of Z$3,500million which funded the building of a theatre supporting thework of local villagers who care for abandoned and orphanedchildren. Old Mutual Zimbabwe provided Z$100 million to the Chitungwiza Harmony Singers to support them in theirparticipation in the Old Mutual/Telkom Choral Festival. The choir came first and third in the Western and Africa categoriesrespectively. A donation of Z$2,000 million was made to the Bulawayo Athletic Club, a multi-disciplinary sports club, to enable the clubhouse to be rebuilt following a major fire.Z$500 million was donated to the Foundation for SustainableDevelopment programme, which not only aims to address environmental challenges, but also to empower localdisadvantaged groups including those affected by HIV/AIDS. In total during 2007 the Old Mutual Zimbabwe Foundationdonated over Z$24,000 million to over 20 projects.
At the end of the year, the Zimbabwe Foundation had assets ofZ$37.9 trillion, including 2,222,517 shares in Old Mutual plc.
Malawi: Old Mutual Malawi continued to support a number of projects in the education and health sector. Total donationsamounting to MK3.7 million were made in 2007 to variousorganisations and schools. Donations of food items andmattresses were made to Montfort School for the Deaf and Blindand Ekwendeni School for the Blind through the Lions Club ofMzuzu. Donations also went to a fun run to raise funds to buyequipment for the maternity wing at Mzuzu Central Hospital.Sponsorship was provided to St Andrews International HighSchool for its championship of a project to manufacture bicycleambulances for distribution to rural areas of the country.
The Rotary Club of Lilongwe, Athletics Association of Malawi,Malawi against Polio and the Southern Region Volley BallChampionship also received donations from Old Mutual Malawi.
The Old Mutual Malawi HIV and AIDS workplace programmesorganised a workshop for staff and their spouses in Blantyre andLilongwe and also funded the Chibale Golf Society tournament(which assists orphans in Namwera and Manone).
At the end of the year, the Malawi Foundation had assets of overMK138million, including 333,200 shares in Old Mutual plc.
Kenya: Old Mutual Kenya supported numerous projects in 2007with total donations of Kshs1.2 million. Projects that receivedsupport included training the dependants of clients in careerplanning and goal-setting. Through this programme over 300students in Nairobi, Mombasa and Kisumu received guidance.Old Mutual Kenya worked with a local NGO to support projectsfocusing on HIV/AIDS.
USAOld Mutual Asset Management (OMAM): OMAM remainscommitted to supporting local communities in need around its Boston headquarters and member firm locations through itsemployee-run charitable foundation. The OMAM CharitableFoundation continued to focus its efforts during 2007 on fourtarget areas: community, healthcare, homelessness andemergency/crisis intervention and strove to make meaningfulcontributions to its partner organisations. In 2007, theFoundation made direct gifts of US$277,000.
Among the causes supported were City Year, Boys and Girls Club of America, the Salvation Army and the United Way, as well as local organisations including the Pine Street Inn, Homefor Little Wanderers, Rosie’s Place, Women of Means, and theMassachusetts Society for the Prevention of Cruelty to Children.
In addition to making monetary grants through its charitablefoundation, OMAM seeks to promote employee involvement byencouraging employees to take advantage of their paid volunteerday, sponsoring company-wide charitable events and matchingpersonal charitable gifts from Foundation assets.
From left to right Junior Golf Development A cheque presentation to the ZimbabweLadies Golf Union to support their juniorgolf development programme. Theprogramme aims to identify and developgolfing talent among school children, whowill in future represent Zimbabwe. It alsoaims to introduce the sport to a wider basein schools, including those who have notbeen exposed to it before.
Greater Boston Food Bank Old Mutual Asset Management staff in theUS supported the Greater Boston FoodBank in 2007. The Bank’s mission is tohelp end hunger in eastern Massachusettsand, as part of this, it feeds more than320,000 people annually in nine countiesin eastern Massachusetts.

Old Mutual plc Annual Report and Accounts 2007Corporate Responsibility 103
Res
pons
ibili
ties
During the year, OMAM employees lent their support to Daffodil Days, benefitting the American Cancer Society, Lee Denim Day benefitting the Susan G. Komen Foundation, and a toy drive benefitting the children at the Home for LittleWanderers. Employees also participated in the JP Morgan Chase Corporate Challenge and the Epal programme in whichemployees mentor local high-school children via email. OMAM also sponsored a company outing in which the entirecompany spent half a day volunteering at the Greater BostonFood Bank sorting food to be delivered to individuals in need.
Old Mutual Financial Network (OMFN): The Group’s US Lifebusiness, OMFN, made significant contributions to a number ofworthy organisations during the year. Employee gifts to charitableorganisations were matched by OMFN through its matchingprogramme on a dollar-for-dollar basis up to an annual limit of$1,000. During 2007, nearly 70 projects and/or organisationswere supported in this way with the focus being on education,health and community issues. Organisations that receiveddonations included the Maryland Food Bank, the Leukaemia & Lymphoma Society, National MS Society, Habitat for Humanity,Special Olympics, the American Cancer Society and the JohnsHopkins Children’s Center.
The Atlanta office participated in a three-day Breast Cancer walk to benefit the Susan G. Komen for the Cure charity, theworld’s largest grassroots network of breast cancer survivors and activists. Events like this have supported the raising of nearly $1 billion to fulfil the charity’s promise to become the largestsource of non-profit funds dedicated to the fight against breastcancer in the world. Total funds generated by employees, andsubsequently matched by the company, exceeded $20,000.
From a corporate perspective, OMFN focused its support on local organisations including Rebuilding Together, a non-profitorganisation that works with local businesses and communityassociations to repair and rehabilitate the homes of low-income,elderly or disabled homeowners. Support was also again given to the University of Baltimore for its Baltimore City Scholars and Leadership programme. OMFN also supported the Beans & Bread programme, Big Brother, Big Sisters, RonaldMcDonald House, the American Red Cross and the AmericanCancer Society.
SkandiaSkandia’s business concept is to meet people’s need for financialsecurity, with corporate social responsibility (CSR) playing anintegral role in the business. At the beginning of 2007, SkandiaGroup agreed and adopted various formal CSR Principles.
Nordic: In May 2007 the Nordic division supported the SkandiaGroup CSR Principles by introducing CSR Principles for the localregion. A working group was established with responsibility forimplementing these Principles.
Skandia in Sweden has a long history of supporting projects for the development of society. Over the past few years, itsengagement has focused on projects that support and developthe young in the community. This is done mostly through theflagship programme for the Nordic region, Ideas for Life (IFL).Celebrating its twentieth anniversary in 2007, IFL workspreventively and long term, providing activities for children andyouth organised under the guidance of parents and teachers. The work takes place in close co-operation with municipalities,schools and other organisations. The IFL organisation consists of a central unit through which projects are directed by a projectco-ordinator. Skandia offers professional guidance and support,but also financial support depending on the objective of theproject. Currently nearly 400 Skandia employees are working asambassadors for IFL, devoting many working hours to activitiesfor children and young people. Part of the IFL funding comesfrom a not-for-profit mutual fund supplied as part of the mutualfund offerings. When a customer selects this offering, 2% of thenet asset value goes directly to the IFL Foundation.
Skandia Denmark started its own IFL Foundation in 2007 based on the Swedish model. Since its inception, over 30% of employees have signed up.
Skandia Sweden also continued its support for the Ren IdrottFoundation during 2007. Set up in 2002, this has helped 35 of Sweden’s most famous athletes become role models for clean sport. The main purpose is to educate youngsters that it is possible to be the best at sport without using drugs.

Old Mutual plc Annual Report and Accounts 2007Corporate Responsibility104
Europe and Latin America: Among the beneficiaries of SkandiaColombia’s corporate responsibility programme during 2007 wasthe International Dialogue project, which is designed to preventdrug consumption among children and young people. As part ofthis programme, 40 Skandia employees acted as mentors tochildren at the Home San Mauricio. The business also providedsupport to the Skandia Cultural Centre, which is a corporateinitiative that aims to promote culture through music, paintingand visual arts, and to financial education. Skandia Mexicocontinued to support a large-scale project working with childrenwith cancer. This programme, which is run in association withCasa de la Amistad, supports them through their treatment andhelps them to continue their education. In Chile, staff once againclubbed together to run a Christmas party for disadvantagedchildren from the suburbs of Santiago.
Skandia Switzerland supported a wide variety of charities andcauses during 2007, with staff raising funds for various not-for-profit organisations including Wunderlamps, which helps sickchildren fulfil a dream. In Portugal donations were given to thePortuguese Association Against Poverty and Unicef. In Poland,Skandia once again supported the Scandinavian Sports FamilyFestival and, among other projects, immunisation cards forchildren. Every year Skandia Vita in Italy donates money for thedistribution of Christmas gifts to social associations. In 2007,money was donated, among other charities, to AssociazioneBambini Cerebrolesi, which supports children born with brainproblems and their families. Skandia Germany started to developa general CSR concept, with the objective of integrating andcentralising all social and environmental initiatives from mid-2008. In 2007 the business gave €2,000 to a local homelesscharity to fund Christmas dinner and shelter for 800 people.Skandia Austria donated a total of €17,500 in 2007 to projectssuch as the EKZ Tournament for Children, supporting localcommunity sporting projects. Schmetterlingskinder againreceived €10,000 to support its work with children sufferingfrom epidermolysis bullosa, a rare genetic condition that leavesthem with extremely fragile skin.
Skandia UK & Offshore division: Skandia UK & Offshore divisiongave over £20,000 to charities through employee support,company matching and company donations of 50p for everyemployee who participated in an annual survey during 2007.The largest recipients were Wessex Cancer Trust and the NSPCC.Another charity supported by Skandia UK & Offshore was theSaints in the Community programme, a programme local toSouthampton that helps over 80,000 children every year to buildtheir confidence and improve their numeracy and literacy skillsthrough coaching and mentoring initiatives. Through thisprogramme, Skandia UK & Offshore has donated £1,500 andraised more than £1,200 through employee support, andemployees have donated a total of 367 hours of their time, mostof which has been during working hours. Children in Need andComic Relief were also supported with nearly £2,500 raised by employees for each charity. Through its title sponsorship ofSkandia Cowes Week, the Skandia UK & Offshore division alsosupports the Ellen MacArthur Trust as the event’s official charity.
Old Mutual plcOld Mutual plc makes donations to charities through its BermudaFoundation. The funds are split into different pots: staff choice,staff matching, ad hoc donations and a CEO selection. In 2007Old Mutual plc staff selected three charities to receive supportthrough the staff choice programme. The Lavender Trust, Habitatfor Humanity and Thames 21 were chosen and each charityreceived £10,000. Additional money was raised for the LavenderTrust through Breast Cancer Awareness Month. The office soldpin badges and had a Wear it Pink day to raise funds. Donationsfrom the ad hoc fund supported music workshops in schools by the City of London Sinfonia for a second year.
Staff participated in a number of fundraising events in 2007,many of which received matching. One member of staff raisedover £2,000 for the neonatal unit at Barts Hospital. Manymembers of staff took part in running events, in support of nominated charities from the Race for Life to the Great South Run.
Ad hoc donations from the Bermuda Foundation were madethroughout the year. The main project that received support wasthe Lord Mayor’s Appeal. Further support was given to Crisis, the homelessness charity, both through the Crisis Square MileRun and the Christmas Card Challenge. Staff also attended anumber of charity dinners during the year, including the RailwayBall, a charity gala night raising money to stop abuse of children living on the streets.
Corporate Responsibilitycontinued
From left to right Crisis RunIn June 2007 a team of Old Mutual plc staff took part in the Crisis Square Mile Run. Covering 5km around the sites ofLondon, the team raised funds to supportCrisis in its aim to fight homelessness andempower people to fulfil their potential and transform their lives.
Home San Mauricio Queen Silvia of Sweden and HRH PrinceTurki bin Talal bin Abdulaziz Al Saud of Saudi Arabia attend the launch of theSkandia Colombia’s mentoring programmewith the Home San Mauricio. Forty childrenhave been paired with Skandia employeesand through the year they will work ondeveloping self-esteem to help, among other things, avoid the risk of drugs.

Old Mutual plc Annual Report and Accounts 2007Corporate Responsibility 105
Res
pons
ibili
ties
Old Mutual plc continued its support for the Nelson MandelaFoundation, which aims to promote the growth of humanfulfilment and the continuous expansion of the frontiers offreedom through four programme areas: the Nelson MandelaCentre of Memory and Commemoration, a lecture and seminar series, HIV/ AIDS projects and education and rural development. Old Mutual plc has committed to give a total £1 million to this Foundation over five years.
Support was again given to the Chairman’s scholarship fund.This fund is run in association with the Centre for Financial and Management Studies at the School of Oriental and AfricanStudies at the University of London. Old Mutual has agreed tosupport a number of students on selected courses such as theMSc Financial Management, MSc Financial Economics and thePostgraduate Diploma in Economic Principles. Support began in2007 and will last for the duration of the students’ courses.
At the end of 2007, the Bermuda Foundation had assets of over£4.6 million, including 3,650,000 shares in Old Mutual plc.
OMAM (UK): OMAM (UK)’s corporate charitable givingprogramme gave £2,000 to support a number of charitablecauses that its employees participated in during the year. Theseincluded the Stroke Association, Oxford Mencap, the AnthonyNolan Trust and the Prostate Cancer Charity. OMAM (UK) alsoheld a charity raffle at the Christmas Party and raised £3,000,which was split between the National Blind Children’s Societyand the Children’s Heart Foundation. As part of joint activitieswith other tenants at Old Mutual Place, employees alsoparticipated in Jeans for Genes Day and Wear it Pink Day. Again this year, instead of sending traditional Christmas cards, theCompany made a donation of £5,000 to Save the Children.
In 2007, as part of a process of continual improvement, OMAM (UK) launched a number of new initiatives designed to reduce its environmental impact. These included thewidespread introduction of totally chlorine-free and recycledpaper, agreeing a re-use scheme for computers through aregistered charity, using an energy-efficient hybrid car hire firm,and increasing internal communications to raise awareness andusage of existing environmental schemes. Work was also donewith regard to responsible energy management (includingimprovements in energy efficiency and the use of renewableenergy) and to select office equipment and materials withinherently lower environmental impacts.
EnvironmentOld Mutual recognises that, while meeting the needs of itsclients, it has an impact on the environment, directly through theoffices the Group occupies and indirectly through investmentsthat are held. The Group’s environmental policy was introducedsix years ago and Mr Christopher Collins, the Chairman of Old Mutual plc, is the member of the Board responsible for the Group’s environmental performance.
2007 was a year of increasing environmental awareness withinthe Group. Business units communicated with employees andsuppliers on environmental and ethical matters and, at Grouplevel, central frameworks were agreed on a number of areasincluding climate change.
The Group’s environmental objectives are:
> to ensure compliance at local, national and internationallevels;
> to minimise the consumption of energy, water and materialsacross operations;
> to minimise solid waste generation by waste re-use andrecycling wherever possible;
> to avoid the use of materials that may cause harm to the environment;
> to promote internal awareness of environmental issues among staff;
> to support environmental initiatives by employees and relevant external groups.
These objectives are applied across the Group at the businessunit level, using best practice in environmental management.Where appropriate, business units have introduced policies morespecifically tailored to their particular operations.
At each business unit, the individuals responsible forenvironmental matters have set objectives. Reporting is doneagainst agreed key performance indicators (KPIs) and, wherepossible, these are standardised across the Group. Annualreviews ensure the KPIs remain appropriate. Nedbank andOMSA produce separate reports on their environmentalperformance. At Group level, annual comparable data is collatedand disclosed to rating agencies and other regulatory bodies.

Old Mutual plc Annual Report and Accounts 2007Corporate Responsibility106
Energy useEnergy use at Old Mutual sites around the Group is tracked and reported centrally. Where Old Mutual is the owner-occupier,those responsible for building management undertake efficiencyreviews and work with third parties to raise awareness andreduce energy use through both education and buildingalterations. Old Mutual Properties in South Africa tracks andreports on its managed buildings through OMSA’s CorporateCitizenship Report. In buildings where Old Mutual is not theowner-occupier, education about energy efficiency is stillundertaken at many of the sites. At Old Mutual head office inLondon, facilities management has worked with the Carbon Trustto identify areas where efficiencies can be made. The report was shared with tenants so that building-wide initiatives could be developed.
Water consumptionFollowing the increase in water consumption across the Group in 2006, awareness programmes were run with tenants andemployees to manage water usage. Awareness programmes willcontinue during 2008 and building managers will continue toinvestigate technology to reduce water use by building plantaround the Group.
Waste productionAcross the Group recycling systems are operated in many offices.Where such systems cannot be run, extra efforts are made toreduce the amount of waste produced. Both the amount of wasteproduced and the amount recycled are tracked by the Group andreported periodically to the Board. Offices look for ways to re-useequipment that is no longer needed by the Group and waste isdisposed of in line with legislative requirements. Where OldMutual is an owner-occupier, work is done with both employeesand third-party tenants to address waste production. As anexample, the building-wide initiative at Old Mutual Place inLondon has shown success, with the amount of recyclingincreasing during 2007.
Climate changeClimate change is a major issue affecting the Group directlythrough its offices and indirectly through its business. In 2007Old Mutual maintained its signatory status to the CarbonDisclosure Project, a global initiative that informs investors onissues of climate change. It used this project to communicatewith its business units on the responsibilities involved. A Group-wide carbon footprint study will be undertaken during 2008.
Old Mutual plc itself has worked with the FORGE Group, aninformal group of UK-based banks and insurance companies,which debates and addresses issues of common interest in thearea of corporate responsibility, to produce a guidance frameworkfor managing climate change risk in the financial sector. Issuesfor both business units and business functions are addressed inthis work alongside an engagement framework for employees.The framework has been disseminated around the Group topromote a consistent approach.
The Group also supported the United Nations ClimateNegotiations in Bali at the end of 2007, by signing up to the Bali Communiqué. Led by the Prince of Wales’s UK and EUCorporate Leaders Group on Climate Change, the communiquécalled for a comprehensive, legally-binding United Nationsframework to tackle climate change.
Hazardous materialsThe Group has little contact with materials that could do greatdamage to the environment. It has ensured, where relevant, that it has avoided using materials that may cause harm.
Environmental managementThe Group has environmental management systems (EMSs) in place at many of its sites and, although each one is site-specific, many follow ISO 14001 guidelines. Currently over 50%of employees in the Group are covered by a recognised EMS.Data is regularly gathered and performance is compared to the site targets. Each system has a monitoring system in placealongside it. Data disclosure occurs at both OMSA and Nedbankthrough their individual reports. Other areas of the Group runenvironmental programmes at the local level to minimise theimpact of their day-to-day business on the environment.
At a business unit level, committees have been established to manage environmental impacts. This allows the focus to be on local issues that affect the businesses and employeespersonally. Where necessary, training is provided to support the relevant personnel.
Corporate Responsibilitycontinued

Old Mutual plc Annual Report and Accounts 2007Corporate Responsibility 107
Res
pons
ibili
ties
CustomersThe Group operates in around 40 countries and recognises the many differing needs of its customers. At the heart of thecustomer experience lie the Group values of Respect, Integrity,Accountability and Pushing Beyond Boundaries. Operating in line with these allows employees around the Group to supportand advise our clients to achieve the best returns on theirinvestments. The Group’s businesses aim to be open andtransparent in all interactions with their customers andshareholders. Systems are, however, in place to ensure that if customers feel their needs are not being met opportunities are provided to discuss their concerns with a representative. The handling of all issues is monitored and, if required, reported further up the governance chain.
SuppliersThe Group has procurement policies in its business units that include, where practical, criteria addressing the ethical,social and environmental impacts of the business. Businesseswork with their suppliers to develop processes where these arenot already in place. In South Africa, specific attention is paid to using black empowerment partners. More details of thespecific South African supply projects will be contained in thesubsidiaries’ own Corporate Responsibility Reports. A Group-wideproject is also planned for 2008 to draw together Group-wideprocurement principles.
Health and safetyThe Group recognises its obligation to supply its employees witha safe and clean working environment. Data on health and safetycompliance is collated and reported to the Board twice yearly viaMr Christopher Collins, the Director responsible. Nedbank Groupis aware of the risk of robberies and attacks at its bankingbusinesses and work continually to improve its systems tominimise the risk to its employees.
During 2007 there were no industrial deaths or materialindustrial injuries in the Group.
A report on the Group’s employment policies is contained in theDirectors’ Report on Corporate Governance and Other Matters.
Helen WilsonHead of Corporate Responsibility27 February 2008

Old Mutual plc Annual Report and Accounts 2007Financial information108
Financial information
Index to the financial information
Statement of directors’ responsibilities in respect of the Annual Report and the financial statements 109
Independent auditors’ report to the members of Old Mutual plc 110Consolidated income statement 111Adjusted operating profit 112Consolidated balance sheet 113Consolidated cash flow statement 114Consolidated statement of changes in equity 116
Notes to the consolidated financial statements1 Accounting policies 1202 Foreign currencies 1373 Segment information 1374 Operating profit adjusting items 1455 Income tax expense 1496 Minority interests – Income statement 1507 Earnings and earnings per share 1518 Investment return (non-banking) 1539 Banking interest and similar income 15410 Banking trading, investment and similar income 15411 Fee and commission income, and income
from service activities 15512 Finance costs 15513 Banking interest payable and similar expense 15614 Fee and commission expense, and other acquisition costs 15615 Other operating and administrative expenses 15716 Acquisition of subsidiaries 15817 Goodwill and other intangible assets 16018 Property, plant and equipment 16219 Investment property 16320 Operating lease arrangements 16321 Deferred tax assets and liabilities 16422 Investments in associated undertakings 16623 Deferred acquisition costs 16724 Long-term and general business policyholder liabilities 16825 Loans and advances 17226 Investments and securities 17327 Other assets 17428 Derivative financial instruments – assets and liabilities 17429 Hedge accounting 17730 Fair values of financial assets and liabilities 17831 Analysis of movements in impairment account 18032 Group balance sheet – categories of financial instruments 18133 Discontinued operations, assets and liabilities held-for-sale 18334 Borrowed funds 18435 Provisions 18736 Deferred revenue 18837 Other liabilities 18838 Amounts owed to bank depositors 18939 Equity 19040 Minority interests – balance sheet 19041 Post employment benefits 19142 Share-based payments 19443 Dividends 20144 Contingent liabilities 20245 Commitments 20246 Related parties 20347 Principal subsidiaries and Group enterprises 20648 Financial risk 20649 Insurance risk 21850 Reclassifications 224
Financial statements of the CompanyCompany balance sheet 227Company cash flow statement 228Company statement of changes in equity 229
Notes to the Company financial statements1 Investments and securities 2302 Other assets 2303 Derivative financial instruments 2304 Borrowed funds 2315 Provisions 2326 Other liabilities 2327 Post employment benefits 2338 Principal subsidiaries 2349 Contingent liabilities 23410 Related parties 23511 Financial risk 23612 Post balance sheet events 237
European Embedded Value basis supplementary informationStatement of directors’ responsibilities in relation to the European Embedded Value basis supplementary information 238Independent auditors’ report to Old Mutual plc on the European
Embedded Value (EEV) basis supplementary information 239Income statement on a European Embedded Value basis 240
Notes to the European Embedded Value basis supplementary information1 Basis of preparation 2422 Adjustments applied in determining adjusted operating profit 2433 Reconciliation of movements in Group embedded value 2434 Components of Group embedded value 2445 Components of adjusted Group embedded value 2446 Reconciliation of Group embedded value of the covered
business to the adjusted Group embedded value 2457 Components of embedded value of the covered business 2468 Analysis of covered business embedded
value results (after tax) 2479 Value of new business (after tax) 25110 Product analysis of new covered business premiums 25211 Drivers of new business value 25312 Assumptions 25413 Sensitivity tests 259

Old Mutual plc Annual Report and Accounts 2007Statement of directors’ responsibilities in respect of the Annual Report and the financial statements
109
Fina
ncia
ls
The directors are responsible for preparing the Annual Report and the group and parent company financial statements in accordance with applicablelaw and regulations.
Company law requires the directors to prepare group and parent company financial statements for each financial year. Under that law they arerequired to prepare the group financial statements in accordance with IFRSs as adopted by the EU and applicable law and have elected to preparethe parent company financial statements on the same basis.
The group and parent company financial statements are required by law and IFRSs as adopted by the EU to present fairly the financial position ofthe group and the parent company and the performance for that period; the Companies Act 1985 provides in relation to such financial statementsthat references in the relevant part of that Act to financial statements giving a true and fair view are references to their achieving a fair presentation.
In preparing each of the group and parent company financial statements, the directors are required to:
> select suitable accounting policies and then apply them consistently;> make judgments and estimates that are reasonable and prudent;> state whether they have been prepared in accordance with IFRSs as adopted by the EU; and> prepare the financial statements on the going concern basis unless it is inappropriate to presume that the group and the parent company
will continue in business.
The directors are responsible for keeping proper accounting records that disclose with reasonable accuracy at any time the financial position of theparent company and enable them to ensure that its financial statements comply with the Companies Act 1985. They have general responsibility for taking such steps as are reasonably open to them to safeguard the assets of the group and to prevent and detect fraud and other irregularities.
Under applicable law and regulations, the directors are also responsible for preparing a Directors’ Report, Directors’ Remuneration Report andCorporate Governance Statement that comply with that law and those regulations.
The directors are responsible for the maintenance and integrity of the corporate and financial information included on the company’s website.Legislation in the UK governing the preparation and dissemination of financial statements may differ from legislation in other jurisdictions.
Statement of directors’ responsibilities in respectof the Annual Report and the financial statements

Old Mutual plc Annual Report and Accounts 2007Independent auditors’ report to the members of Old Mutual plc110
Independent auditors’ report to the members of Old Mutual plcFor the year ended 31 December 2007
We have audited the group and parent company financial statements (the “'financial statements”) of Old Mutual plc for the year ended 31 December 2007 which comprise the Consolidated Income Statement, the Adjusted Operating Profit, the Consolidated and Parent CompanyBalance Sheets, the Consolidated and Parent Company Cash Flow Statements, the Consolidated and Parent Company Statements of Changes in Equity, and the related notes. These financial statements have been prepared under the accounting policies set out therein. We have also auditedthe information in the Directors’ Remuneration Report that is described as having been audited.
This report is made solely to the company’s members, as a body, in accordance with section 235 of the Companies Act 1985. Our audit work has been undertaken so that we might state to the company’s members those matters we are required to state to them in an auditor’s report and for no other purpose. To the fullest extent permitted by law, we do not accept or assume responsibility to anyone other than the company and thecompany’s members as a body, for our audit work, for this report, or for the opinions we have formed.
Respective responsibilities of directors and auditorsThe directors’ responsibilities for preparing the Annual Report, the Directors’ Remuneration Report and the financial statements in accordance with applicable law and International Financial Reporting Standards (IFRSs) as adopted by the EU are set out in the Statement of Directors’Responsibilities on page 109.
Our responsibility is to audit the financial statements and the part of the Directors’ Remuneration Report to be audited in accordance with relevantlegal and regulatory requirements and International Standards on Auditing (UK and Ireland).
We report to you our opinion as to whether the financial statements give a true and fair view and whether the financial statements and the part of the Directors’ Remuneration Report to be audited have been properly prepared in accordance with the Companies Act 1985 and, as regards the Group financial statements, Article 4 of the IAS Regulation. We also report to you whether in our opinion the information given in the Directors’Report is consistent with the financial statements.
In addition we report to you if, in our opinion, the company has not kept proper accounting records, if we have not received all the information andexplanations we require for our audit, or if information specified by law regarding directors’ remuneration and other transactions is not disclosed.
We review whether the Corporate Governance Statement reflects the company’s compliance with the nine provisions of the 2006 Combined Codespecified for our review by the Listing Rules of the Financial Services Authority, and we report if it does not. We are not required to consider whetherthe board’s statements on internal control cover all risks and controls, or form an opinion on the effectiveness of the Group’s corporate governanceprocedures or its risk and control procedures.
We read the other information contained in the Annual Report and consider whether it is consistent with the audited financial statements. Weconsider the implications for our report if we become aware of any apparent misstatements or material inconsistencies with the financial statements.Our responsibilities do not extend to any other information.
Basis of audit opinionWe conducted our audit in accordance with International Standards on Auditing (UK and Ireland) issued by the Auditing Practices Board. An auditincludes examination, on a test basis, of evidence relevant to the amounts and disclosures in the financial statements and the part of the Directors’Remuneration Report to be audited. It also includes an assessment of the significant estimates and judgments made by the directors in thepreparation of the financial statements, and of whether the accounting policies are appropriate to the Group’s and company’s circumstances,consistently applied and adequately disclosed.
We planned and performed our audit so as to obtain all the information and explanations which we considered necessary in order to provide us with sufficient evidence to give reasonable assurance that the financial statements and the part of the Directors’ Remuneration Report to be auditedare free from material misstatement, whether caused by fraud or other irregularity or error. In forming our opinion we also evaluated the overalladequacy of the presentation of information in the financial statements and the part of the Directors’ Remuneration Report to be audited.
OpinionIn our opinion:
> the Group financial statements give a true and fair view, in accordance with IFRSs as adopted by the EU, of the state of the Group’s affairs as at 31 December 2007 and of its profit for the year then ended;
> the parent company financial statements give a true and fair view, in accordance with IFRSs as adopted by the EU as applied in accordance with the provisions of the Companies Act 1985, of the state of the parent company’s affairs as at 31 December 2007;
> the financial statements and the part of the Directors’ Remuneration Report to be audited have been properly prepared in accordance with the Companies Act 1985 and, as regards the Group financial statements, Article 4 of the IAS Regulation; and
> the information given in the Directors’ Report is consistent with the financial statements.
KPMG Audit Plc Chartered Accountants Registered Auditor8 Salisbury SquareLondon EC4Y 8BB27 February 2008
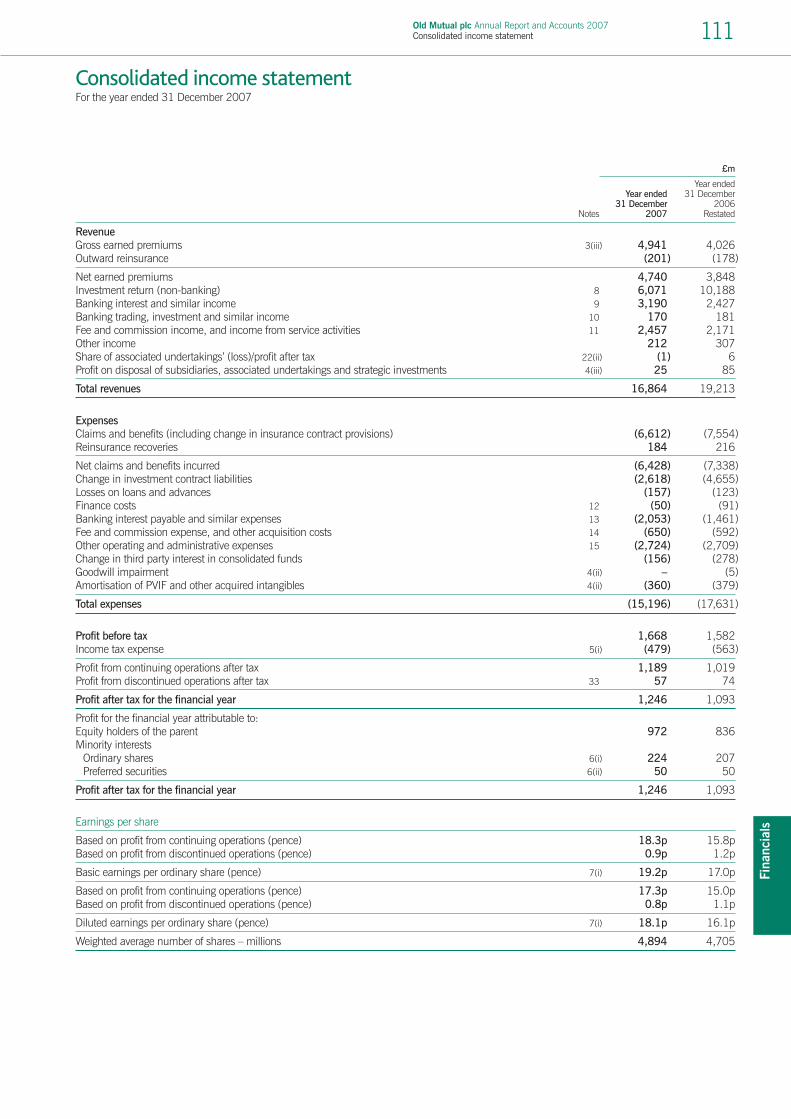
Old Mutual plc Annual Report and Accounts 2007Consolidated income statement 111
Fina
ncia
ls
£m
Year ended Year ended 31 December
31 December 2006Notes 2007 Restated
RevenueGross earned premiums 3(iii) 4,941 4,026Outward reinsurance (201) (178)
Net earned premiums 4,740 3,848Investment return (non-banking) 8 6,071 10,188Banking interest and similar income 9 3,190 2,427Banking trading, investment and similar income 10 170 181Fee and commission income, and income from service activities 11 2,457 2,171Other income 212 307Share of associated undertakings’ (loss)/profit after tax 22(ii) (1) 6Profit on disposal of subsidiaries, associated undertakings and strategic investments 4(iii) 25 85
Total revenues 16,864 19,213
ExpensesClaims and benefits (including change in insurance contract provisions) (6,612) (7,554)Reinsurance recoveries 184 216
Net claims and benefits incurred (6,428) (7,338)Change in investment contract liabilities (2,618) (4,655)Losses on loans and advances (157) (123)Finance costs 12 (50) (91)Banking interest payable and similar expenses 13 (2,053) (1,461)Fee and commission expense, and other acquisition costs 14 (650) (592)Other operating and administrative expenses 15 (2,724) (2,709)Change in third party interest in consolidated funds (156) (278)Goodwill impairment 4(ii) – (5)Amortisation of PVIF and other acquired intangibles 4(ii) (360) (379)
Total expenses (15,196) (17,631)
Profit before tax 1,668 1,582Income tax expense 5(i) (479) (563)
Profit from continuing operations after tax 1,189 1,019Profit from discontinued operations after tax 33 57 74
Profit after tax for the financial year 1,246 1,093
Profit for the financial year attributable to:Equity holders of the parent 972 836Minority interests
Ordinary shares 6(i) 224 207Preferred securities 6(ii) 50 50
Profit after tax for the financial year 1,246 1,093
Earnings per share
Based on profit from continuing operations (pence) 18.3p 15.8pBased on profit from discontinued operations (pence) 0.9p 1.2p
Basic earnings per ordinary share (pence) 7(i) 19.2p 17.0p
Based on profit from continuing operations (pence) 17.3p 15.0pBased on profit from discontinued operations (pence) 0.8p 1.1p
Diluted earnings per ordinary share (pence) 7(i) 18.1p 16.1p
Weighted average number of shares – millions 4,894 4,705
Consolidated income statementFor the year ended 31 December 2007

Old Mutual plc Annual Report and Accounts 2007Adjusted operating profit112
Reconciliation of adjusted operating profit to profit after tax£m
Year ended Year ended 31 December
31 December 2006Notes 2007 Restated
South Africa 3(ii) 1,165 1,036United States 3(ii) 260 264Europe 3(ii) 268 239Other 3(ii) 2 1
1,695 1,540Finance costs (119) (130)Other shareholders’ expenses (41) (33)
Adjusted operating profit1 1,535 1,377Adjusting items 4(i) 73 (34)
Profit for the financial year before tax (excluding policyholder tax) 1,608 1,343Total income tax expense 5(i) (479) (563)Income tax attributable to policyholder returns 60 239
Profit for the financial year after tax from continuing operations 1,189 1,019Profit for the financial year after tax from discontinued operations 33 57 74
Profit after tax for the financial year 1,246 1,093
Adjusted operating profit after tax attributable to ordinary equity holders£m
Year ended Year ended 31 December
31 December 2006Notes 2007 Restated
Adjusted operating profit1 before tax 1,535 1,377Tax on adjusted operating profit 5(iii) (390) (352)
Adjusted operating profit1 after tax 1,145 1,025
Adjusted operating profit1 after tax from continuing operations 1,145 1,025Adjusted operating profit1 after tax from discontinued operations 61 39
Adjusted operating profit1 after tax 1,206 1,064
Minority interest – ordinary shares 6(iii) (242) (224)Minority interest – preferred securities 6(ii) (50) (50)
914 790
Adjusted weighted average number of shares – (millions) 7(i) 5,411 5,222
Based on adjusted operating profit from continuing operations2 (pence) 16.1p 14.6pBased on adjusted operating profit from discontinued operations2 (pence) 0.8p 0.5p
Adjusted operating earnings per share2 – (pence) 7(ii) 16.9p 15.1p
1 For long-term business and general insurance businesses, adjusted operating profit is based on a long-term investment return, includes investment returns on life funds’investments in Group equity and debt instruments, and is stated net of income tax attributable to policyholder returns. For the US Asset Management business it includescompensation costs in respect of certain long-term incentive schemes defined as minority interests in accordance with IFRS. For all businesses, adjusted operating profitexcludes goodwill impairment, the impact of acquisition accounting, revaluations of put options related to long-term incentive schemes, the impact of closure of unclaimedshares trusts, profit/(loss) on disposal of subsidiaries, associated undertakings and strategic investments, dividends declared to holders of perpetual preferred callablesecurities, and fair value (profits)/losses on certain Group debt movements.
2 Adjusted operating earnings per ordinary share is calculated on the same basis as adjusted operating profit. It is stated after tax attributable to adjusted operating profit andminority interests. It excludes income attributable to Black Economic Empowerment trusts of listed subsidiaries. The calculation of the adjusted weighted average number of shares includes own shares held in policyholders’ funds and Black Economic Empowerment trusts.
Adjusted operating profitFor the year ended 31 December 2007

Old Mutual plc Annual Report and Accounts 2007Consolidated balance sheet 113
Fina
ncia
ls
£m
At At 31 December
31 December 2006Notes 2007 Restated
AssetsGoodwill and other intangible assets 17 5,459 5,367Mandatory reserve deposits with central banks 615 515Property, plant and equipment 18 608 499Investment property 19 1,479 1,149Deferred tax assets 21 683 511Investments in associated undertakings and joint ventures 22 81 83Deferred acquisition costs 23 2,253 1,578Reinsurers’ share of long-term business policyholder liabilities 24 1,394 1,314Reinsurers’ share of general insurance liabilities 24 – 57Deposits held with reinsurers 213 247Loans and advances 25 30,687 26,438Investments and securities 26 90,220 81,915Current tax receivable 83 60Client indebtedness for acceptances 165 188Other assets 27 2,181 3,106Derivative financial instruments – assets 28 1,527 1,263Cash and cash equivalents 3,469 3,101Non-current assets held-for-sale 33 1,617 1,165
Total assets 142,734 128,556
LiabilitiesLong-term business policyholder liabilities 24 84,251 75,265General insurance liabilities 24 – 265Third party interests in consolidation of funds 3,547 3,041Borrowed funds 34 2,353 1,978Provisions 35 499 542Deferred revenue 36 462 283Deferred tax liabilities 21 1,413 1,393Current tax payable 320 283Other liabilities 37 6,180 7,247Liabilities under acceptances 165 188Amounts owed to bank depositors 38 31,817 27,130Derivative financial instruments – liabilities 28 1,716 1,071Non-current liabilities held-for-sale 33 414 1,107
Total liabilities 133,137 119,793
Net assets 9,597 8,763
Shareholders’ equityEquity attributable to equity holders of the parent 7,961 7,237
Minority interestsOrdinary shares 40(i) 933 848Preferred securities 40(ii) 703 678
Total minority interests 1,636 1,526
Total equity 9,597 8,763
The consolidated financial statements on pages 111 to 226 were approved by the Board of Directors on 27 February 2008.
Jim Sutcliffe Jonathan NichollsChief Executive Group Finance Director
Consolidated balance sheetAt 31 December 2007

Old Mutual plc Annual Report and Accounts 2007Consolidated cash flow statement114
£m
Year ended Year ended31 December 31 December
Notes 2007 2006
Cash flows from operating activities
Profit before tax from continuing operations 1,668 1,582Profit before tax from discontinued operations 33 82 132
1,750 1,714
Capital gains included in investment income (1,836) (4,076)Profit/(loss) on disposal of property, plant and equipment 4 (1)Depreciation of property, plant and equipment 73 68Amortisation and impairment of intangible assets 403 428Impairment of loans and receivables 183 143Share-based compensation expense 15 40Share of associated undertakings’ loss after tax (1) (6)Loss arising on disposal of subsidiaries, associated undertakings and strategic investments (25) (85)Other non-cash amounts in profit 29 68
Non-cash movements in profit before tax (1,155) (3,421)
Reinsurers’ share of long-term business policyholder liabilities (53) (785)Deferred acquisition costs (482) (632)Loans and advances (5,339) (5,543)Insurance liabilities 1,962 2,886Investment contracts 4,124 6,594Amounts owed to bank depositors 4,647 5,251Other operating assets and liabilities (491) 555
Changes in working capital 4,368 8,326Taxation paid (563) (317)
Net cash inflow from operating activities 4,400 6,302
Cash flows from investing activitiesAcquisitions of financial investments (3,896) (4,294)Acquisitions of investment properties (26) (4)Net acquisition of tangible fixed assets (186) (120)Net acquisition of intangible fixed assets (67) (39)Acquisition of interests in subsidiaries (278) (1,318)Disposal of interests in subsidiaries, associated undertakings and strategic investments 106 78
Net cash outflow from investing activities (4,347) (5,697)
Cash flows from financing activitiesDividends paid to:
Equity holders of the Company (333) (282)Equity minority interests and preferred security interests (205) (199)
Interest payable (excluding banking interest payable) (83) (52)Net proceeds from issue of ordinary shares (including by subsidiaries to minority interests) 42 52Net receipts from unclaimed shares trust 95 –Issue of subordinated debt 699 297Other debt repaid (356) (96)
Net cash outflow from financing activities (141) (280)
Net (decrease)/increase in cash and cash equivalents (88) 325
Consolidated cash flow statementFor the year ended 31 December 2007

Old Mutual plc Annual Report and Accounts 2007Consolidated cash flow statement 115
Fina
ncia
ls
£m
Year ended Year ended31 December 31 December
2007 2006
Net (decrease)/increase in cash and cash equivalents (88) 325Effects of exchange rate changes on cash and cash equivalents 50 (575)Cash and cash equivalents on acquisition of new subsidiaries – 581Cash and cash equivalents at beginning of the year 3,634 3,303
Cash and cash equivalents at end of the year 3,596 3,634
Consisting of:Coins and bank notes 211 236Money at call and short notice 3,169 2,856Balances with central banks (other than mandatory reserve deposits) 121 9Cash and cash equivalents from non-current assets held-for-sale (32) –
Cash and cash equivalents 3,469 3,101Mandatory reserve deposits with central banks 615 515Other cash equivalents 808 1,101Cash and cash equivalents subject to consolidation of funds (1,296) (1,083)
Total 3,596 3,634
Other supplementary cash flow disclosuresInterest income received (including banking interest) 4,858 4,059Dividend income received 388 513Interest payable (including banking interest) 2,130 1,552
Cash flows presented in this statement include all cash flows relating to policyholders’ funds for the long-term business.
Cash and cash equivalents subject to consolidation of funds are not included in the cash flow as they relate to the minority holding in the funds.
Management do not consider that there are material amounts of cash and cash equivalents which are not available for use by the Group.

Old Mutual plc Annual Report and Accounts 2007Consolidated statement of changes in equity116
Millions £m
Number of Attributable toshares issued equity holders Total minority Total
Year ended 31 December 2007 and fully paid of the parent interest equity
Equity holders’ funds at beginning of the year 5,501 7,237 1,526 8,763Changes in equity arising in the yearFair value gains/(losses):
Property revaluation – 95 1 96Net investment hedge – (13) – (13)Available-for-sale investments:
Fair value losses – (161) – (161)Shadow accounting – 25 – 25Currency translation differences/exchange differences on translating foreign operations – 129 4 133Other movements – (4) – (4)Aggregate tax effect of items taken directly to or transferred from equity – 34 – 34
Net income recognised directly in equity – 105 5 110Profit for the year – 972 274 1,246
Total recognised income and expense for the year – 1,077 279 1,356Dividends for the year – (373) (165) (538)Net sale of treasury shares – 149 – 149Shares repurchased in the buyback programme – (177) – (177)Issue of ordinary share capital by the Company – 3 – 3Net acquisition of interests in subsidiaries – – (4) (4)Exercise of share options 9 9 – 9Fair value of equity settled share options – 36 – 36
Equity holders’ funds at end of the year 5,510 7,961 1,636 9,597
Consolidated statement of changes in equityFor the year ended 31 December 2007

Old Mutual plc Annual Report and Accounts 2007Consolidated statement of changes in equity 117
Fina
ncia
ls
£m
Perpetualpreferred
Share Share Other Translation Retained callableYear ended 31 December 2007 capital premium reserves reserve earnings securities Total
Attributable to equity holders of the parentat beginning of the year 550 746 2,901 (421) 2,773 688 7,237
Changes in equity arising in the year:Fair value gains/(losses):
Property revaluation – – 95 – – – 95Net investment hedge – – – (13) – – (13)Available-for-sale investments:
Fair value losses – – (161) – – – (161)Shadow accounting – – 25 – – – 25Currency translation differences/exchange differences
on translating foreign operations – – – 129 – – 129Other movements – – (10) (2) 8 – (4)Aggregate tax effect of items taken directly toor transferred from equity – – 22 3 9 – 34
Net income recognised directly in equity – – (29) 117 17 – 105Profit for the year – – – – 972 – 972
Total recognised income and expense for the year – – (29) 117 989 – 1,077Dividends for the year – – – – (373) – (373)Net sale of treasury shares – – – – 149 – 149Shares repurchased in the buyback programme – – – – (177) – (177)Issue of ordinary share capital by the Company – 3 – – – – 3Exercise of share options 1 8 – – – – 9Fair value of equity settled share options – – 36 – – – 36
Attributable to equity holders of theparent at end of the year 551 757 2,908 (304) 3,361 688 7,961
£m
At31 December
Other reserves 2007
Merger reserve 2,716Available-for-sale reserve (30)Property revaluation reserve 75Share-based payments reserve 147
Attributable to equity holders of the parent at end of the year 2,908
Retained earnings were reduced by £588 million at 31 December 2007 in respect of own shares held in policyholders’ funds, ESOP trusts, Black Economic Empowerment trusts and other related undertakings.
Included in the dividend for the year is £40 million of dividends declared to holders of perpetual preferred callable securities.
Included within other reserves is the merger reserve for the additional share consideration made in respect of the Skandia acquisition, being thedifference between the market value of the shares on the date of issue and the nominal value included as share capital.

Old Mutual plc Annual Report and Accounts 2007Consolidated statement of changes in equity118
Millions £m
Number of Attributable toshares issued equity holders Total minority Total
Year ended 31 December 2006 and fully paid of the parent interest equity
Equity holders’ funds at beginning of the year 4,090 4,751 1,668 6,419Changes in equity arising in the yearFair value gains/(losses):
Property revaluation – 28 – 28Net investment hedge – 75 – 75Available-for-sale investments:
Fair value losses – (111) – (111)Recycled to income statement on realisation – 17 – 17
Shadow accounting – 28 – 28Currency translation differences/exchange differences on translating foreign operations – (852) (208) (1,060)Other movements – 38 (42) (4)Aggregate tax effect of items taken directly to or transferred from equity – 14 – 14
Net expense recognised directly in equity – (763) (250) (1,013)Profit for the year – 836 257 1,093
Total recognised income and expense for the year – 73 7 80Dividends for the year – (321) (160) (481)Net sale of treasury shares – 18 – 18Issue of ordinary share capital by the Company 1,400 2,674 – 2,674Net acquisition of interests in subsidiaries – – 11 11Exercise of share options 11 14 – 14Fair value of equity settled share options – 28 – 28
Equity holders’ funds at end of the year 5,501 7,237 1,526 8,763
Consolidated statement of changes in equityFor the year ended 31 December 2007 continued

Old Mutual plc Annual Report and Accounts 2007Consolidated statement of changes in equity 119
Fina
ncia
ls
£m
Perpetualpreferred
Share Share Other Translation Retained callableYear ended 31 December 2006 capital premium reserves reserve earnings securities Total
Attributable to equity holders of the parentat beginning of the year 410 730 374 357 2,192 688 4,751
Changes in equity arising in the year:Fair value gains/(losses):
Property revaluation – – 28 – – – 28Net investment hedge – – – 75 – – 75Available-for-sale investments:
Fair value losses – – (111) – – – (111)Recycled to income statement on realisation – – 17 – – – 17
Shadow accounting – – 28 – – – 28Currency translation differences/exchange differences
on translating foreign operations – – – (852) – – (852)Other movements – – (6) – 44 – 38Aggregate tax effect of items taken directly to
or transferred from equity – – 11 (1) 4 – 14
Net expense recognised directly in equity – – (33) (778) 48 – (763)Profit for the year – – – – 836 – 836
Total recognised income and expense for the year – – (33) (778) 884 – 73Dividends for the year – – – – (321) – (321)Net sale of treasury shares – – – – 18 – 18Issue of ordinary share capital by the Company 139 3 2,532 – – – 2,674Exercise of share options 1 13 – – – – 14Fair value of equity settled share options – – 28 – – – 28
Attributable to equity holders of theparent at end of the year 550 746 2,901 (421) 2,773 688 7,237
£m
At31 December
Other reserves 2006
Merger reserve 2,716Available-for-sale reserve 28Property revaluation reserve 48Cash flow hedge reserve (1)Share-based payments reserve 110
Attributable to equity holders of the parent at end of the year 2,901
Retained earnings were reduced by £704 million at 31 December 2006 in respect of own shares held in policyholders’ funds, ESOP trusts, Black Economic Empowerment trusts and other related undertakings.
Included in the dividend for the year is £39 million of dividends declared to holders of perpetual preferred callable securities.
Included within issue of ordinary share capital by the Company are transaction costs totalling £2 million deducted from the share premium.
Included within other reserves is the merger reserve for the additional share consideration made in respect of the Skandia acquisition, being thedifference between the market value of the shares on the date of issue and the nominal value included as share capital.

Old Mutual plc Annual Report and Accounts 2007Notes to the consolidated financial statements120
1 Accounting policies
(a) Basis of preparationStatement of complianceOld Mutual plc (the Company) is a company incorporated in England and Wales.
The Group financial statements consolidate those of the Company and its subsidiaries (together referred to as the “Group”) and equity account theGroup’s interest in associates and jointly controlled entities (other than those held by long-term insurance funds). The Parent Company financialstatements present information about the Company as a separate entity and not about the Group.
Both the Parent Company financial statements and the Group financial statements have been prepared and approved by the directors in accordancewith International Financial Reporting Standards as adopted by the EU (“Adopted IFRSs and IFRICs”). On publishing the Parent Company financialstatements here together with the Group financial statements, the Company is taking advantage of the exemption in section 230 of the CompaniesAct 1985 not to present its individual income statement and related notes that form a part of these approved financial statements.
The accounting policies set out below have, unless otherwise stated, been applied consistently to all periods presented in these consolidatedfinancial statements.
The financial statements are prepared on the historical cost basis except that the following assets and liabilities are stated at their fair value:derivative financial instruments, financial instruments classified as fair value through the income statement or as available-for-sale, owner-occupiedproperty and investment property. Non-current assets and disposal groups held-for-sale are stated at the lower of the previous carrying amount andthe fair value less costs to sell.
The Parent Company financial statements are prepared in accordance with these accounting policies, other than for investments in subsidiaryundertakings and associates, which are stated at cost less impairments see note 1e(x), in accordance with IAS 27.
Judgments made by the directors in the applications of these accounting policies that have a significant effect on the financial statements andestimates with a significant risk of material adjustment in the next year are discussed in note 1(q).
(b) Foreign currency translation(i) Foreign currency transactionsThe Group’s presentation currency is Pounds Sterling (£). The functional currency of the Group’s foreign operations is the currency of the primaryeconomic environment in which these entities operate. The Parent Company functional currency is Pounds Sterling (£).
Transactions in foreign currencies are converted into the functional currency at the rate of exchange ruling at the date of the transaction.
Monetary assets and liabilities denominated in foreign currencies are translated into the relevant functional currency at rates of exchange ruling at the balance sheet date. Non-monetary assets and liabilities denominated in foreign currencies that are stated at fair value are translated into thefunctional currency at foreign exchange rates ruling at the dates the fair values were determined. Non-monetary assets and liabilities denominated in foreign currencies that are stated at historical cost are converted into the functional currency at the rate of exchange ruling at the date of the initialrecognition of the asset and liability and are not subsequently retranslated.
Exchange gains and losses on the translation and settlement during the period of foreign currency assets and liabilities are recognised in the incomestatement. Exchange differences for non-monetary items are recognised in equity when the changes in the fair value of the non-monetary item are recognised in equity, and in the income statement if the changes in fair value of the non-monetary item are recognised in the income statement.
(ii) Foreign investmentsThe assets and liabilities of foreign operations are translated from their respective functional currencies into the Group’s presentation currency usingthe year-end exchange rates, and their income and expenses using the average exchange rates. Other than in respect of cumulative translation gains and losses up to 1 January 2004, unrealised gains or losses resulting from translation of functional currencies to the presentation currency are included as a separate component of shareholders’ equity. To the extent that these gains and losses are effectively hedged, the gains and lossesarising on the hedging instruments are also included in that component of shareholders’ equity. Upon the disposal of subsidiaries the cumulativeamount of exchange differences deferred in shareholders’ equity, net of attributable amounts in relation to net investments, is recognised in theincome statement. Cumulative translation gains and losses up to 1 January 2004 were reset to zero.
Notes to the consolidated financial statementsFor the year ended 31 December 2007

Old Mutual plc Annual Report and Accounts 2007Notes to the consolidated financial statements 121
Fina
ncia
ls
1 Accounting policies continued
(c) Group accounting(i) Subsidiary undertakings and special purpose entitiesSubsidiary undertakings are those entities controlled by the Group. Subsidiary undertakings include special purpose entities created to accomplish a narrow, well-defined objective, which may take the form of a corporation, trust, partnership or unincorporated entities, and where the substance of the relationship between the Group and the entity indicates that the entity is controlled by the Group.
Control exists when the Company has the power, directly or indirectly, to govern the financial and operating policies of an entity so as to obtainbenefits from its activities. The Company considers the existence and effect of potential voting rights currently exercisable or convertible whenassessing whether it has control. Entities which the Company controls by virtue of the Company retaining the majority of risks or benefits, are alsoincluded in the consolidated financial statements.
The Group financial statements include the assets, liabilities and results of the Company and subsidiary undertakings. This includes consolidatedspecial purpose entities and holdings in mutual funds. The results of subsidiary undertakings acquired or disposed of in the year are included in the consolidated income statement from the date of acquisition or up to the date of disposal or control ceasing.
The consolidated financial statements do not include the wholly owned company Livförsäkringsaktiebolaget Skandia (Skandia Liv) and itssubsidiaries. Skandia Liv’s business is a mutual life assurance company that is highly regulated within a strict legal framework for mutual lifeassurance companies in Sweden, particularly in relation to its relationship with its holding company. The Group does not have the power to controlSkandia Liv in such a way as to access the benefits usually associated with share ownership due to the legal and regulatory restrictions. Thosebenefits accrue to the policyholders of Skandia Liv. Consequently, Skandia Liv is not consolidated. The shares in Skandia Liv are accounted for in accordance with the accounting policy for other equity financial instruments.
Intra-group balances and transactions, and all profits and losses arising from intra-group transactions, are eliminated in preparing the Groupfinancial statements. Unrealised losses are not eliminated to the extent that they provide evidence of impairment.
(ii) Associates and jointly controlled operationsAn associate is an entity, including an unincorporated entity such as a partnership, over which the Group has significant influence but not control, through participation in the financial and operating policy decisions of the investee (and that is neither a subsidiary nor an investment in a joint venture).
A jointly controlled operation is a joint venture operated through a corporation, partnership or other entity in which each venturer has an interest. A joint venture is a contractual arrangement, whereby two or more parties undertake an economic activity that is subject to joint control. Jointcontrol is the contractually agreed sharing of control over the activity. Joint control exists when the strategic financial and operating decisions relatingto the activity require unanimous consent of the parties sharing control.
The results, assets and liabilities of associates and jointly controlled operations are incorporated in these financial statements using the equitymethod of accounting. The carrying amount of such investments is reduced to recognise any impairment in the value of individual investments.
Where a Group enterprise transacts with an associate or jointly controlled operation of the Group, unrealised profits and losses are eliminated to the extent of the Group’s interest in the relevant associate or jointly controlled operation. Unrealised losses are eliminated in the same way but only to the extent that there is no evidence of impairment.
Investments in associates and jointly controlled operations, which are held with a view to subsequent resale are accounted for as non-current assets held-for-sale, and those held by policyholder long-term insurance funds are accounted for as financial assets fair valued through the income statement.

Old Mutual plc Annual Report and Accounts 2007Notes to the consolidated financial statements122
1 Accounting policies continued
(d) Insurance and investment contractsLong-term business(i) Classification of contractsContracts sold as long-term business (with the exception of unit-linked assurance contracts) are categorised into insurance contracts, contracts with a discretionary participation feature or investment contracts in accordance with the classification criteria set out in the following paragraphs.
For the Group’s unit-linked assurance business, contracts are separated into an insurance component and an investment component (known as ‘unbundling’), and each unbundled component is accounted for separately in accordance with the accounting policy for that component.
Contracts under which the transfer of insurance risk to the Group from the policyholder is not significant are classified as investment contracts.
Contracts under which the Group accepts significant insurance risk from another party (the policyholder) by agreeing to compensate the policyholderor other beneficiary if a specified uncertain future event (the insured event) adversely affects the policyholder are classified as insurance contracts.Insurance risk is risk other than financial risk. Financial risk is the risk of a possible future change in one or more of a specified interest rate, securityprice, security index, commodity price, foreign exchange rate, index of prices or rates, a credit rating or credit index, or other variable, provided in the case of a non-financial variable that the variable is not specific to a party to the contract.
Contracts with a discretionary participating feature are those under which the policyholder holds a contractual right to receive additional paymentsas a supplement to guaranteed minimum payments. These additional payments, the amount or timing of which is at the Group’s discretion,represent a significant portion of the total contractual payments and are contractually based on (1) the performance of a specified pool of contractsor a specified type of contract, (2) realised and/or unrealised investment returns on a specified pool of assets held by the Group or (3) the profit or loss of the Group. Investment contracts with discretionary participating features are accounted for in the same manner as insurance contracts.
(ii) Premiums on long-term insurancePremiums and annuity considerations receivable under insurance contracts and investment contracts with a discretionary participating feature arestated gross of commission, and exclude taxes and levies. Premiums in respect of linked insurance contracts are recognised when the liability isestablished. Premiums in respect of other insurance contracts and investment contracts with a discretionary participation feature are recognisedwhen due for payment.
Outward reinsurance premiums are recognised when due for payment.
Amounts received under investment contracts other than those with a discretionary participating feature are recorded as deposits and crediteddirectly to investment contract liabilities.
(iii) Revenue on investment management service contractsFees charged for investment management services provided in conjunction with an investment contract are recognised as revenue as the servicesare provided. Initial fees, which exceed the level of recurring fees and relate to the future provision of services are deferred and amortised over the anticipated period in which services will be provided. Fees charged for investment management service contracts in our asset managementbusinesses are also recognised on this basis.
(iv) Claims paid on long-term insuranceClaims paid under insurance contracts and investment contracts with a discretionary participating feature include maturities, annuities, surrenders,death and disability payments.
Maturity and annuity claims are recorded as they fall due for payment. Death and disability claims and surrenders are accounted for when notified.
Reinsurance recoveries are accounted for in the same period as the related claim.
Amounts paid under investment contracts other than those with a discretionary participating feature are recorded as deductions from investmentcontract liabilities.
Notes to the consolidated financial statementsFor the year ended 31 December 2007 continued
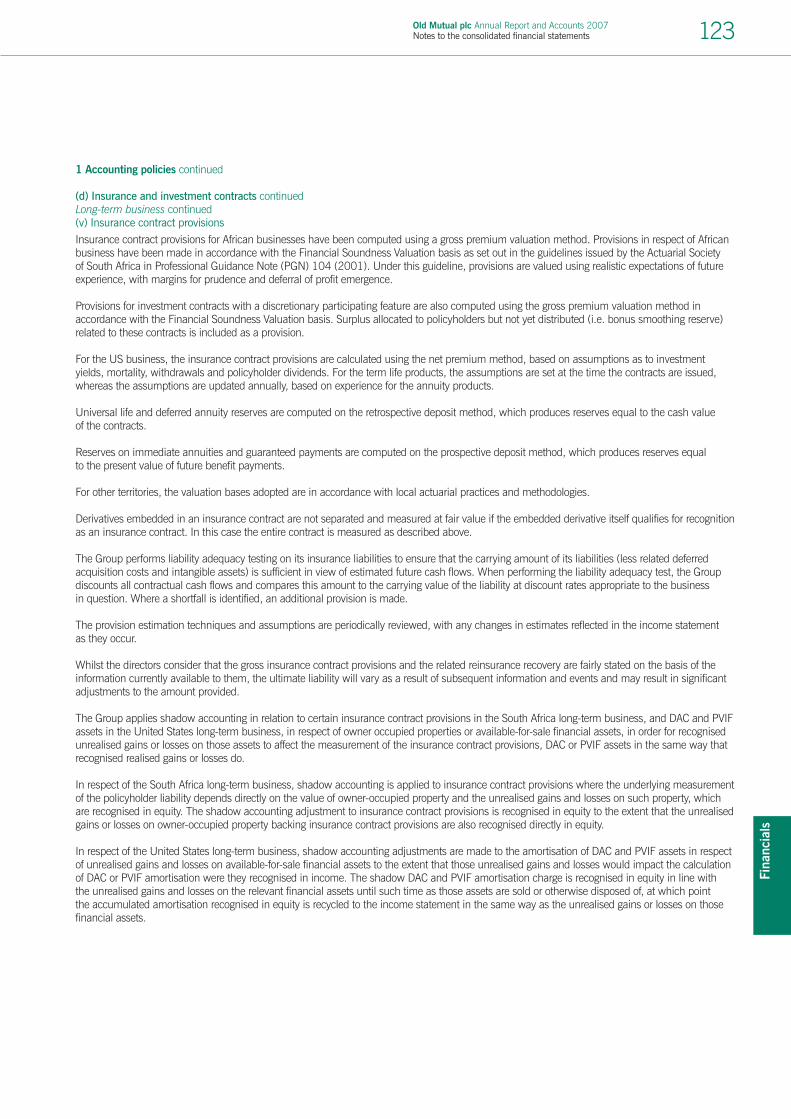
Old Mutual plc Annual Report and Accounts 2007Notes to the consolidated financial statements 123
Fina
ncia
ls
1 Accounting policies continued
(d) Insurance and investment contracts continuedLong-term business continued(v) Insurance contract provisionsInsurance contract provisions for African businesses have been computed using a gross premium valuation method. Provisions in respect of Africanbusiness have been made in accordance with the Financial Soundness Valuation basis as set out in the guidelines issued by the Actuarial Society of South Africa in Professional Guidance Note (PGN) 104 (2001). Under this guideline, provisions are valued using realistic expectations of futureexperience, with margins for prudence and deferral of profit emergence.
Provisions for investment contracts with a discretionary participating feature are also computed using the gross premium valuation method inaccordance with the Financial Soundness Valuation basis. Surplus allocated to policyholders but not yet distributed (i.e. bonus smoothing reserve)related to these contracts is included as a provision.
For the US business, the insurance contract provisions are calculated using the net premium method, based on assumptions as to investmentyields, mortality, withdrawals and policyholder dividends. For the term life products, the assumptions are set at the time the contracts are issued,whereas the assumptions are updated annually, based on experience for the annuity products.
Universal life and deferred annuity reserves are computed on the retrospective deposit method, which produces reserves equal to the cash value of the contracts.
Reserves on immediate annuities and guaranteed payments are computed on the prospective deposit method, which produces reserves equal to the present value of future benefit payments.
For other territories, the valuation bases adopted are in accordance with local actuarial practices and methodologies.
Derivatives embedded in an insurance contract are not separated and measured at fair value if the embedded derivative itself qualifies for recognitionas an insurance contract. In this case the entire contract is measured as described above.
The Group performs liability adequacy testing on its insurance liabilities to ensure that the carrying amount of its liabilities (less related deferredacquisition costs and intangible assets) is sufficient in view of estimated future cash flows. When performing the liability adequacy test, the Groupdiscounts all contractual cash flows and compares this amount to the carrying value of the liability at discount rates appropriate to the business in question. Where a shortfall is identified, an additional provision is made.
The provision estimation techniques and assumptions are periodically reviewed, with any changes in estimates reflected in the income statement as they occur.
Whilst the directors consider that the gross insurance contract provisions and the related reinsurance recovery are fairly stated on the basis of theinformation currently available to them, the ultimate liability will vary as a result of subsequent information and events and may result in significantadjustments to the amount provided.
The Group applies shadow accounting in relation to certain insurance contract provisions in the South Africa long-term business, and DAC and PVIFassets in the United States long-term business, in respect of owner occupied properties or available-for-sale financial assets, in order for recognisedunrealised gains or losses on those assets to affect the measurement of the insurance contract provisions, DAC or PVIF assets in the same way thatrecognised realised gains or losses do.
In respect of the South Africa long-term business, shadow accounting is applied to insurance contract provisions where the underlying measurementof the policyholder liability depends directly on the value of owner-occupied property and the unrealised gains and losses on such property, whichare recognised in equity. The shadow accounting adjustment to insurance contract provisions is recognised in equity to the extent that the unrealisedgains or losses on owner-occupied property backing insurance contract provisions are also recognised directly in equity.
In respect of the United States long-term business, shadow accounting adjustments are made to the amortisation of DAC and PVIF assets in respectof unrealised gains and losses on available-for-sale financial assets to the extent that those unrealised gains and losses would impact the calculationof DAC or PVIF amortisation were they recognised in income. The shadow DAC and PVIF amortisation charge is recognised in equity in line with the unrealised gains and losses on the relevant financial assets until such time as those assets are sold or otherwise disposed of, at which point the accumulated amortisation recognised in equity is recycled to the income statement in the same way as the unrealised gains or losses on thosefinancial assets.

Old Mutual plc Annual Report and Accounts 2007Notes to the consolidated financial statements124
1 Accounting policies continued
(d) Insurance and investment contracts continuedLong-term business continued(vi) Investment contract liabilitiesInvestment contract liabilities in respect of the Group’s US long-term non-linked business are measured at fair value. Investment contract liabilitiesfor non-linked business in the Group’s other territories are measured at fair value, determined by reference to the fair value of the underlying assets.
For linked liabilities, including the deposit component of unbundled unit-linked assurance contracts, fair value is calculated as the account balance,which is the value of the units allocated to the policyholder, based on the bid price of the assets in the underlying fund (adjusted for tax).
Investment contract liabilities measured at fair value are subject to a “deposit floor” such that the liability established cannot be less than the amountrepayable on demand.
Derivatives embedded in investment contracts are separated and measured at fair value, when their risks and characteristics are not closely relatedto those of the host contract and the host contract liability is calculated on an amortised cost basis.
(vii) Acquisition costsAcquisition costs for insurance contracts comprise all direct and indirect costs arising from the sale of insurance contracts.
As the gross premium valuation method used in African territories to determine insurance contract provisions makes implicit allowance for thedeferral of acquisition costs, no explicit deferred acquisition cost asset is recognised in the balance sheet for the contracts issued in these areas.
For the US life insurance business, an explicit deferred acquisition cost asset has been established in the balance sheet. Deferred acquisition costsare amortised over the period that profits on the related insurance policies are expected to emerge. Acquisition costs are deferred to the extent thatthey are deemed recoverable from available future profit margins.
Deferral of costs on insurance business in other territories is limited to the extent that they are deemed recoverable from available future margins.
(viii) Costs incurred in acquiring investment management service contractsIncremental costs that are directly attributable to securing an investment management service contract are recognised as an asset if they can beidentified separately and measured reliably and it is probable that they will be recovered. Deferred acquisition costs represent the contractual right to benefit from providing investment management services and are amortised as the related revenue is recognised. Costs attributable to investmentmanagement service contracts in the asset management businesses are also recognised on this basis.
General insurance businessAll classes of general insurance business are accounted for on an annual basis.
(ix) Premiums on general insurancePremiums stated gross of commissions exclude taxes and levies and are accounted for in the period in which the risk commences. The proportion of the premiums written relating to periods of risk after the balance sheet date is carried forward to subsequent accounting periods as unearnedpremiums, so that earned premiums relate to risks carried during the accounting period.
Outward reinsurance premiums are accounted for in the same accounting period as the premiums for the related direct insurance.
(x) Claims on general insuranceClaims incurred comprise the settlement and handling costs of paid and outstanding claims arising during the year and adjustments to prior yearclaim provisions. Outstanding claims comprise claims incurred up to, but not paid, at the end of the accounting period, whether reported or not.
Outstanding claims do not include any provision for possible future claims where the claims arise under contracts not in existence at the balancesheet date.
The Group performs liability adequacy testing on its claim liabilities to ensure that the carrying amount of its liabilities (less related deferredacquisition costs and the unearned premium reserve) is sufficient in view of estimated future cash flows.
Whilst the directors consider that the gross provisions for claims and the related reinsurance recoveries are fairly stated on the basis of theinformation currently available to them, the ultimate liability will vary as a result of subsequent information and events, and may result in significantadjustments to the amount provided. Adjustments to the amounts of claims provisions established in prior years are reflected in the financialstatements for the period in which the adjustments are made, and disclosed separately if material. The methods used and estimates made arereviewed regularly.
Notes to the consolidated financial statementsFor the year ended 31 December 2007 continued

Old Mutual plc Annual Report and Accounts 2007Notes to the consolidated financial statements 125
Fina
ncia
ls
1 Accounting policies continued
(d) Insurance and investment contracts continuedGeneral insurance business continued(xi) Acquisition costs on general insuranceAcquisition costs, which represent commission and other related expenses, are deferred and amortised over the period in which the relatedpremiums are earned.
(xii) ReinsuranceThe Group cedes reinsurance in the normal course of business for the purpose of limiting its net loss potential through the diversification of its risks.Assets, liabilities and income and expense arising from ceded reinsurance contracts are presented separately from the related assets, liabilities,income and expense from the related insurance contracts because the reinsurance arrangements do not relieve the Group from its direct obligationsto its policyholders.
Only rights under contracts that give rise to a significant transfer of insurance risk are accounted for as reinsurance assets. Rights under contractsthat do not transfer significant insurance risk are accounted for as financial instruments.
Reinsurance premiums for ceded reinsurance are recognised as an expense on a basis that is consistent with the recognition basis for the premiums on the related insurance contracts. For general insurance business, reinsurance premiums are expensed over the period that thereinsurance cover is provided based on the expected pattern of the reinsured risks. The unexpensed portion of ceded reinsurance premiums is included in reinsurance assets.
The net amounts paid to a reinsurer at the inception of a contract may be less than the reinsurance assets recognised by the Group in respect of its rights under such contracts. Any difference between the premium due to the reinsurer and the reinsurance asset recognised is included in the income statement in the period in which the reinsurance premium is due.
The amounts recognised as reinsurance assets are measured on a basis that is consistent with the measurement of the provisions held in respect of the related insurance contracts. Reinsurance assets include recoveries due from reinsurance companies in respect of claims paid.
Reinsurance assets are assessed for impairment at each balance sheet date. An asset is deemed impaired if there is objective evidence, as a resultof an event that occurred after its initial recognition, that the Group may not recover all amounts due, and that the event has a reliably measurableimpact on the amounts that the Group will receive from the reinsurer.
(e) Financial instruments(i) Recognition and de-recognitionA financial asset or liability is recognised when, and only when, the Group becomes a party to the contractual provisions of the financial instrument.The Group de-recognises a financial asset when, and only when:
> The contractual rights to the cash flows arising from the financial assets have expired or been forfeited by the Group; or> It transfers the financial asset including substantially all the risks and rewards of ownership of the asset; or> It transfers and no longer controls the financial asset, regardless of whether it has retained or transferred substantially all the risks and rewards
of ownership.
A financial liability is de-recognised when and only when the liability is extinguished, that is, when the obligation specified in the contract isdischarged, assigned, cancelled or has expired.
The difference between the carrying amount of a financial liability (or part thereof) extinguished or transferred to another party and considerationreceived, including any non-cash assets transferred or liabilities assumed, is recognised in the income statement.
All purchases and sales of financial assets that require delivery within the time frame established by regulation or market convention (“regular way” purchases and sales) are recognised at trade date, which is the date that the Group commits to purchase or sell the asset. Otherwise suchtransactions are treated as derivatives until settlement occurs. Loans and receivables are recognised (at fair value plus attributable transaction costs) when cash is advanced to borrowers.

Old Mutual plc Annual Report and Accounts 2007Notes to the consolidated financial statements126
1 Accounting policies continued
(e) Financial instruments continued(ii) Derivative financial instrumentsDerivative financial instruments are recognised in the balance sheet at fair value. Fair values are obtained from quoted market prices, discountedcash flow models and option pricing models as appropriate. All derivatives are carried as assets when their fair value is positive and as liabilitieswhen their fair value is negative.
Changes in the fair value of derivatives not designated as hedges for hedge accounting purposes are included in investment income or finance costs as appropriate.
(iii) Hedge accountingQualifying hedging instruments must either be derivative financial instruments or non derivative financial instruments used to hedge the risk of changes in foreign currency exchange rates, changes in fair value or changes in cash flows. Changes in the value of the financial instrumentshould be expected to offset changes in the fair value or cash flows of the underlying hedged item.
The Group designates certain qualifying hedging instruments as either (1) a hedge of the exposure to changes in fair value of a recognised asset or liability or an unrecognised firm commitment (fair value hedge); (2) a hedge of a future cash flow attributable to a recognised asset or liability, or a forecasted transaction, and could affect profit or loss (cash flow hedge); or, (3) a hedge of a net investment in a foreign operation. Hedgeaccounting is used for qualifying hedging instruments designated in this way provided certain criteria are met.
The Group’s criteria for a qualifying hedging instrument to be accounted for as a hedge include:
> Upfront formal documentation of the hedging instrument, hedged item or transaction, risk management objective and strategy, the nature of the risk being hedged and the effectiveness measurement methodology that will be applied is prepared before hedge accounting is adopted;
> The hedge is documented showing that it is expected to be highly effective in offsetting the changes in the fair value or cash flows attributable to the hedged risk, consistent with the risk management and strategy detailed in the upfront hedge documentation;
> The effectiveness of the hedge can be reliably measured;> The hedge is assessed and determined to have been highly effective on an ongoing basis; and> For cash flow hedges of a forecast transaction, an assessment that it is highly probable that the hedged transaction will occur and will carry
profit and loss risk.
Changes in the fair value of derivatives that are designated and qualify as fair value hedges and that prove to be highly effective in relation to hedged risk, are recorded in the income statement, along with the corresponding change in fair value of the hedged asset or liability that isattributable to that specific hedged risk.
Changes in the fair value of derivatives that are designated and qualify as cash flow hedges or hedges of a net investment in a foreign operation and that prove to be highly effective in relation to the hedged risk are recognised in equity.
If the hedge no longer meets the criteria for hedge accounting, hedge accounting is discontinued prospectively. Any previous adjustment to thecarrying amount of a hedged interest-bearing financial instrument carried at amortised cost, (as a result of previous hedge accounting), is amortisedin the income statement from the date hedge accounting ceases, to the maturity date of the financial instrument, based on the effective interest rate method. The adjustment to the carrying amount of a previously hedged available-for-sale security remains in retained earnings until the disposal of the equity security.
For hedges of a net investment in a foreign operation, any cumulative gains or losses recognised in equity are recognised in the income statement on disposal of the foreign operation.
(iv) Embedded derivativesCertain derivatives embedded in other financial and non-financial instruments (other than investment contracts), such as the conversion option in a convertible bond, are treated as separate derivatives and recognised as such on a stand alone basis, when their risks and characteristics are notclosely related to those of the host contract and the host contract is not carried at fair value with unrealised gains and losses reported in the incomestatement. If it is not possible to determine the fair value of the embedded derivative, the entire hybrid instrument is categorised as fair value throughthe income statement and measured at fair value.
Notes to the consolidated financial statementsFor the year ended 31 December 2007 continued

Old Mutual plc Annual Report and Accounts 2007Notes to the consolidated financial statements 127
Fina
ncia
ls
1 Accounting policies continued
(e) Financial instruments continued(v) Offsetting financial instruments and related incomeFinancial assets and liabilities are offset and the net amount reported in the balance sheet only when there is a legally enforceable right to set off and there is intention to settle on a net basis, or to realise the asset and settle the liability simultaneously.
Income and expense items are offset only to the extent that their related instruments have been offset in the balance sheet, with the exception of those relating to hedges, which are disclosed in accordance with the income statement effect of the hedged item.
(vi) Interest income and expenseInterest income and expense in relation to financial instruments carried at amortised cost or held as available-for-sale is recognised in the incomestatement using the effective interest rate method taking into account the expected timing and amount of cash flows. Interest income and expenseinclude the amortisation of any discount or premium or other differences between the initial carrying amount of an interest-bearing instrument and its amount at maturity calculated on an effective interest rate basis.
Interest earned on financial assets carried at fair value through the income statement is presented as part of interest income.
(vii) Non-interest revenueNon-interest revenue in respect of financial instruments principally comprises fees and commission and other operating income. These areaccounted for as set out below:
Fees and commission incomeLoan origination fees for loans that are probable of being drawn down, are deferred (together with related direct costs) and recognised as anadjustment to the effective yield on the loan. Fees and commission arising from negotiating, or participating in the negotiation of a transaction for a third party, such as the acquisition of loans, shares or other securities or the purchase or sale of businesses, are recognised on completion of the underlying transaction.
OtherRevenue other than interest, fees and commission (including fees and insurance premiums), which includes exchange and securities tradingincome, dividends from investments and net gains on the sale of banking assets, is recognised in the income statement when the amount ofrevenue from the transaction or service can be measured reliably, it is probable that the economic benefits of the transaction or service will flow to the Group and the costs associated with the transaction or service can be measured reliably.
(viii) Financial assets Financial assets (other than derivatives) are recorded as held-for-trading, designated as fair value through the income statement, loans andreceivables, held-to-maturity or available-for-sale. An analysis of the Group’s balance sheet, showing the categorisation of financial assets, togetherwith financial liabilities is set out in note 32.
Held-for-trading financial assetsHeld-for-trading financial assets are those that were either acquired for generating a profit from short-term fluctuations in price or dealer’s margin, or are securities included in a portfolio in which a pattern of short-term profit taking exists, or are derivatives that are not designated as effectivehedging instruments.
Financial assets designated as fair value through the income statementFinancial assets that the Group has elected to designate as fair value through the income statement are those where the treatment either eliminatesor significantly reduces a measurement or recognition inconsistency that would otherwise arise when using a different measurement basis (forinstance with respect to financial assets supporting insurance contract provisions) or are managed, evaluated and reported using a fair value basis(for instance financial assets supporting shareholder funds).
All financial assets carried at fair value through the income statement, whether held-for-trading or designated, are initially recognised at fair valueand subsequently re-measured at fair value based on quoted bid prices. If quoted bid prices are unavailable the fair value of the financial asset is estimated using pricing models or discounted cash flow techniques. Where discounted cash flow techniques are used, estimated future cashflows are based on management’s best estimates and the discount rate used is a market-related rate at the balance sheet date for an instrumentwith similar terms and conditions. Where pricing models are used, inputs are based on market-related measures at the balance sheet date.
Realised and unrealised fair value gains and losses on all financial assets carried at fair value through the income statement are included inInvestment return (non-banking) or in Banking trading, investment and similar income as appropriate.
Interest earned whilst holding financial assets at fair value through the income statement is reported within Investment return (non-banking) and Banking interest and similar income, as appropriate. Dividends receivable are included separately in dividend income, within Investmentincome or Banking trading, investment and similar income, when a dividend is declared.
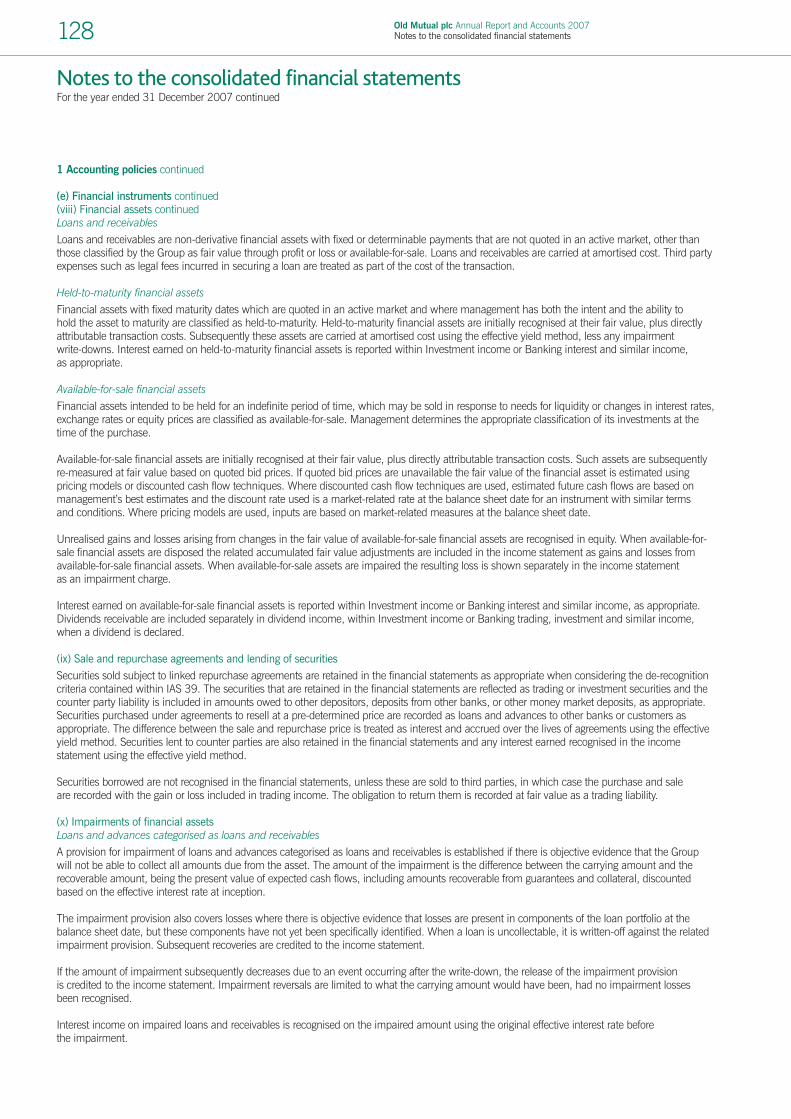
Old Mutual plc Annual Report and Accounts 2007Notes to the consolidated financial statements128
1 Accounting policies continued
(e) Financial instruments continued (viii) Financial assets continued Loans and receivablesLoans and receivables are non-derivative financial assets with fixed or determinable payments that are not quoted in an active market, other thanthose classified by the Group as fair value through profit or loss or available-for-sale. Loans and receivables are carried at amortised cost. Third partyexpenses such as legal fees incurred in securing a loan are treated as part of the cost of the transaction.
Held-to-maturity financial assetsFinancial assets with fixed maturity dates which are quoted in an active market and where management has both the intent and the ability to hold the asset to maturity are classified as held-to-maturity. Held-to-maturity financial assets are initially recognised at their fair value, plus directlyattributable transaction costs. Subsequently these assets are carried at amortised cost using the effective yield method, less any impairment write-downs. Interest earned on held-to-maturity financial assets is reported within Investment income or Banking interest and similar income, as appropriate.
Available-for-sale financial assetsFinancial assets intended to be held for an indefinite period of time, which may be sold in response to needs for liquidity or changes in interest rates,exchange rates or equity prices are classified as available-for-sale. Management determines the appropriate classification of its investments at thetime of the purchase.
Available-for-sale financial assets are initially recognised at their fair value, plus directly attributable transaction costs. Such assets are subsequentlyre-measured at fair value based on quoted bid prices. If quoted bid prices are unavailable the fair value of the financial asset is estimated usingpricing models or discounted cash flow techniques. Where discounted cash flow techniques are used, estimated future cash flows are based onmanagement’s best estimates and the discount rate used is a market-related rate at the balance sheet date for an instrument with similar terms and conditions. Where pricing models are used, inputs are based on market-related measures at the balance sheet date.
Unrealised gains and losses arising from changes in the fair value of available-for-sale financial assets are recognised in equity. When available-for-sale financial assets are disposed the related accumulated fair value adjustments are included in the income statement as gains and losses fromavailable-for-sale financial assets. When available-for-sale assets are impaired the resulting loss is shown separately in the income statement as an impairment charge.
Interest earned on available-for-sale financial assets is reported within Investment income or Banking interest and similar income, as appropriate.Dividends receivable are included separately in dividend income, within Investment income or Banking trading, investment and similar income,when a dividend is declared.
(ix) Sale and repurchase agreements and lending of securitiesSecurities sold subject to linked repurchase agreements are retained in the financial statements as appropriate when considering the de-recognitioncriteria contained within IAS 39. The securities that are retained in the financial statements are reflected as trading or investment securities and thecounter party liability is included in amounts owed to other depositors, deposits from other banks, or other money market deposits, as appropriate.Securities purchased under agreements to resell at a pre-determined price are recorded as loans and advances to other banks or customers asappropriate. The difference between the sale and repurchase price is treated as interest and accrued over the lives of agreements using the effectiveyield method. Securities lent to counter parties are also retained in the financial statements and any interest earned recognised in the incomestatement using the effective yield method.
Securities borrowed are not recognised in the financial statements, unless these are sold to third parties, in which case the purchase and sale are recorded with the gain or loss included in trading income. The obligation to return them is recorded at fair value as a trading liability.
(x) Impairments of financial assetsLoans and advances categorised as loans and receivablesA provision for impairment of loans and advances categorised as loans and receivables is established if there is objective evidence that the Groupwill not be able to collect all amounts due from the asset. The amount of the impairment is the difference between the carrying amount and therecoverable amount, being the present value of expected cash flows, including amounts recoverable from guarantees and collateral, discountedbased on the effective interest rate at inception.
The impairment provision also covers losses where there is objective evidence that losses are present in components of the loan portfolio at thebalance sheet date, but these components have not yet been specifically identified. When a loan is uncollectable, it is written-off against the relatedimpairment provision. Subsequent recoveries are credited to the income statement.
If the amount of impairment subsequently decreases due to an event occurring after the write-down, the release of the impairment provision is credited to the income statement. Impairment reversals are limited to what the carrying amount would have been, had no impairment losses been recognised.
Interest income on impaired loans and receivables is recognised on the impaired amount using the original effective interest rate before the impairment.
Notes to the consolidated financial statementsFor the year ended 31 December 2007 continued

Old Mutual plc Annual Report and Accounts 2007Notes to the consolidated financial statements 129
Fina
ncia
ls
1 Accounting policies continued
(e) Financial instruments continued(x) Impairments of financial assets continuedOther financial assets carried at amortised cost, and available-for-sale financial assets A financial asset is deemed to be impaired when its carrying amount is greater than its estimated recoverable amount, and there is objectiveevidence to suggest that the impairment occurred subsequent to the initial recognition of the asset in the financial statements. The amount of theimpairment loss for other financial assets carried at amortised cost is calculated as being the difference between the asset’s carrying amount and the present value of expected future cash flows discounted at the financial asset’s original effective interest rate. The recoverable amount, for assetsclassified as available-for-sale and measured at fair value, is the present value of expected future cash flows discounted at the current market rate of interest for a similar financial asset. All such impairments are recognised in the income statement.
Where there is evidence of the reversal of the impairment of a financial asset held at amortised cost, the release of the impairment allowance is credited to the income statement. This is consistent with the initial recognition of impairment charges.
Where there is evidence of the reversal of the impairment of a financial asset classified as available-for-sale the release of the impairment allowance is credited to the available-for-sale reserve within equity.
Parent Company investments in subsidiary undertakings and associates, loans and receivablesImpairment of Parent Company investments in subsidiary undertakings and associates, loans and receivables are accounted for in the same way as impairments of other financial assets, and loans and receivables (as set out above).
(xi) Financial liabilities (other than investment contracts)Financial liabilities, including borrowed funds, amounts owed to depositors and liabilities under acceptances, are recorded as held-for-trading,designated as fair value through the income statement or as financial liabilities at amortised cost.
Liabilities that the Group has elected to designate as fair value through the income statement are those where the treatment either eliminates orsignificantly reduces a measurement or recognition inconsistency that would otherwise arise when using a different measurement basis and aremanaged, evaluated and reported using a fair value basis.
For financial liabilities recorded at fair value and which contain a demand feature, the fair value of the liability is not less than the amount payableon demand, discounted from the first date that the amount could be required to be paid.
Financial liabilities categorised at amortised cost are recognised initially at fair value, which is normally represented by the transaction price, lessdirectly attributable transaction costs. Subsequent to initial recognition these financial liabilities are stated at amortised cost with any differencebetween cost and redemption value being recognised in the income statement over the period of the borrowings on an effective interest rate basis.
Conversion options included within financial liabilities are recorded separately in shareholders’ equity. The Group does not recognise any change in the value of this option in subsequent periods. The remaining obligation to make future payments of principal and interest to bondholders is calculated using a market interest rate for an equivalent non-convertible bond and is presented on the amortised cost basis in other borrowedfunds until extinguished on conversion or maturity of the bonds.
If the Group purchases its own debt, it is removed from the balance sheet and the difference between the carrying amount of a liability and theconsideration paid is included in other income.
(f) TaxIncome tax on the profit or loss for the year comprises current and deferred tax. Income tax is recognised in the income statement except to theextent that it relates to items recognised directly to equity, in which case it is recognised in equity.
(i) Current taxCurrent tax is the expected tax payable on the taxable income for the year, using tax rates enacted or substantively enacted at the balance sheet date, and any adjustment to tax payable in respect of previous years.
(ii) Deferred taxDeferred taxation is provided using the balance sheet liability method, based on temporary differences. Temporary differences are differencesbetween the carrying amounts of assets and liabilities for financial reporting purposes and their tax base. The amount of deferred taxation provided is based on the expected manner of realisation or settlement of the carrying amount of assets and liabilities using tax rates enacted or substantivelyenacted at the balance sheet date. Deferred taxation is charged to the income statement except to the extent that it relates to a transaction that is recognised directly in equity, or a business combination that is an acquisition. The effect on deferred taxation of any changes in tax rates isrecognised in the income statement, except to the extent that it relates to items previously charged or credited directly to equity. A deferred-tax asset is recognised only to the extent that it is probable that future taxable income will be available, against which the unutilised tax losses anddeductible temporary differences can be used. Deferred-tax assets are reduced to the extent that it is no longer probable that the related tax benefitswill be realised.
In certain circumstances, as permitted by accounting guidance, deferred tax balances are not recognised. In particular where the liability relates to the initial recognition of goodwill, or transactions that are not a business combination and at the time of their occurrence affect neither accountingor taxable profit. Note 21 includes further detail of circumstances in which the Group does not recognise temporary differences.

Old Mutual plc Annual Report and Accounts 2007Notes to the consolidated financial statements130
1 Accounting policies continued
(g) Intangible assets(i) Goodwill and goodwill impairmentAll business combinations are accounted for by applying the purchase method. At acquisition date, the Group recognises the fair value of theacquiree’s identifiable assets, liabilities and contingent liabilities that satisfy the recognition criteria. The cost of a business combination is the fairvalue of purchase consideration due at date of acquisition plus any directly attributable transaction costs. Contingent purchase consideration isrecognised to the extent that it is probable and can be measured reliably. Any minority interest in the acquiree is stated at the minority’s proportion of the net fair values of those items. Any excess between the cost of the business combination and the Group’s interest in the net fair value of theidentifiable assets, liabilities and contingent liabilities is recognised as goodwill. Goodwill is adjusted for any subsequent re-measurement ofcontingent purchase consideration.
In accordance with the exemptions permitted under IFRS 1, First-Time Adoption of International Financial Reporting Standards, businesscombinations that took place prior to 1 January 2004 have not been restated.
Purchased goodwill is allocated to one or more cash-generating units (CGUs), being the smallest identifiable group of assets that generates cashinflows that are largely independent of the cash inflows from other assets or group of assets. The directors annually test for impairment of each CGU containing goodwill and intangible assets with indefinite useful lives. Where businesses are acquired as part of the same investmentacquisition, these are combined for determining recoverability of the related goodwill. An impairment loss is recognised whenever the carryingamount of an asset or its CGU exceeds its recoverable amount, which is the higher of its fair value less costs to sell and its value in use. However,impairment losses relating to goodwill are not reversed.
(ii) Present value of acquired in-force for insurance and investment contract businessThe present value of acquired in-force for insurance and investment contract business is capitalised in the consolidated balance sheet as anintangible asset.
The capitalised value is the present value of cash flows anticipated in the future from the relevant book of insurance and investment contract policiesacquired. This is calculated by performing a cash flow projection of the associated long-term fund and book of in-force policies in order to estimatefuture after tax profits attributable to shareholders. The valuation is based on actuarial principles taking into account future premium income,mortality, disease and surrender probabilities, together with future costs and investment returns on the assets supporting the fund. These profits are discounted at a rate of return allowing for the risk of uncertainty of the future cash flows. The key assumptions impacting the valuation arediscount rate, future investment returns and the rate at which policies discontinue.
The asset is amortised over the expected profit recognition period on a systematic basis over the anticipated lives of the related contracts.
The amortisation charge is stated net of any unwind in the discount rate used to calculate the asset.
The recoverable amount of the asset is re-calculated at each balance sheet date and any impairment losses recognised accordingly.
(iii) Other intangible assets acquired as part of a business combinationContractual banking and asset management customer relationships, relationships with distribution channels and similar intangible assets, acquired as a part of a business combination, are capitalised at their fair value, represented by the estimated net present value of the future cash flows from the relevant relationships acquired at the date of acquisition.
Brands and similar items acquired as part of a business combination are capitalised at their fair value based on a ‘relief from royalty’ valuation methodology.
Subsequent to initial recognition such acquired intangible assets are amortised on a straight-line basis over their estimated useful lives as set out below:
> Distribution channels 10 years> Customer relationships 10 years> Brand 15 – 20 years
The estimated life is re-evaluated on a regular basis.
Notes to the consolidated financial statementsFor the year ended 31 December 2007 continued

Old Mutual plc Annual Report and Accounts 2007Notes to the consolidated financial statements 131
Fina
ncia
ls
1 Accounting policies continued
(g) Intangible assets continued(iv) Internally developed softwareInternally developed software is amortised over its estimated useful life. Such assets are stated at cost less accumulated amortisation andimpairment losses. Software is recognised in the balance sheet if, and only if, it is probable that the relevant future economic benefits attributable to the software will flow to the Group and its cost can be measured reliably.
Costs incurred in the research phase are expensed whereas costs incurred in the development phase are capitalised subject to meeting specificcriteria, set out in the relevant accounting guidance. The main criteria being that future economic benefits can be identified as a result of thedevelopment expenditure. Amortisation is charged to the income statement on a straight-line basis over the estimated useful lives of the relevantsoftware, which range between two and five years.
(v) Subsequent expenditureSubsequent expenditure on capitalised intangible assets is capitalised only when it increases the future economic benefits embodied in the specificasset to which it relates. All other expenditure is expensed as incurred.
(h) Impairment (all assets other than goodwill and financial instruments)The Group assesses all assets (other than goodwill and intangible assets with an indefinite useful life) on an ongoing basis for indications ofimpairment or whether a previously recognised impairment loss should be reversed. If such indicators are found to exist, then detailed impairmenttesting is carried out. Impairments (where the carrying value of the asset exceeds its recoverable amount) and the reversal of previously recognisedimpairments are recognised in the income statement.
(i) Property, plant and equipment(i) Owned assetsOwner-occupied property is stated at revalued amounts, being fair value at the date of revaluation less subsequent accumulated depreciation and accumulated impairment losses.
Plant and equipment, principally computer equipment, motor vehicles, fixtures and furniture, is stated at cost less accumulated depreciation and impairment losses.
In accordance with the exemptions permitted under IFRS 1, individual terms of property, plant and equipment held at 1 January 2004 weremeasured at fair value, which was deemed to be their cost at that date.
(ii) Subsequent expenditureSubsequent expenditure is capitalised when it is measurable and will result in probable future economic benefits. Expenditure incurred to replace a separate component of an item of owner-occupied property, plant and equipment is capitalised to the cost of the item of owner-occupied property,plant and equipment and the component replaced is de-recognised. All other expenditure is recognised in the income statement as an expense when incurred.
(iii) Revaluation of owner-occupied propertyOwner-occupied property is valued on the same basis as investment property.
When an individual property is revalued, any increase in its carrying amount (as a result of the revaluation) is transferred to a revaluation reserve,except to the extent that it reverses a revaluation decrease of the same property previously recognised as an expense in the income statement.
When the value of an individual property is decreased as a result of a revaluation, the decrease is charged against any related credit balance in the revaluation reserve in respect of that property. However, to the extent that it exceeds any surplus, it is recognised as an expense in the income statement.
(iv) De-recognitionOn de-recognition of an owner-occupied property or item of plant and equipment, any gain or loss on disposal, determined as the differencebetween the net disposal proceeds and the carrying amount of the asset, is included in the income statement in the period of the de-recognition. In the case of owner-occupied property, any surplus in the revaluation reserve in respect of the individual property is transferred directly to retained earnings.

Old Mutual plc Annual Report and Accounts 2007Notes to the consolidated financial statements132
1 Accounting policies continued
(i) Property, plant and equipment continued(v) DepreciationDepreciation is charged to the income statement on a straight-line basis over the estimated useful lives of items of owner-occupied property, plant and equipment that are accounted for separately.
In the case of owner-occupied property, any accumulated depreciation at revaluation is eliminated against the gross carrying amount of the propertyconcerned and the net amount restated to the revalued amount. Subsequent depreciation charges are adjusted based on the revalued amount for each property. Any difference between the depreciation charge on the revalued amount and that which would have been charged under historic cost is transferred, net of any related deferred tax, between the revaluation reserve and retained earnings as the property is utilised. Land is not depreciated.
The maximum estimated useful lives are as follows:
> Computer equipment 5 years> Computer software 3 years> Motor vehicles 6 years> Fixtures and furniture 10 years> Leasehold property 20 years> Freehold property 50 years
(vi) LeasesOperating leasesLeases where the lessor retains the risks and rewards of ownership of the underlying asset are classified as operating leases. Payments made underoperating leases are charged against income on a straight-line basis over the period of the lease.
Finance leasesLease agreements where the Group substantially accepts the risks and rewards of the ownership of the leased asset are classified as finance leases.Finance leases are capitalised at the inception of the lease at the lower of the fair value of the leased asset or the present value of the minimum lease payments. Lease payments are allocated between the liability and finance charges so as to achieve a constant interest rate on the outstandingbalance of the liability.
Finance lease obligations, net of finance charges, are included in liabilities. The interest element of the finance cost is charged to the incomestatement over the lease period according to the effective interest method. Where applicable, assets acquired under finance leases are depreciatedover the shorter of the useful life of the asset and the lease term.
(j) Investment propertiesInvestment property is real estate held to earn rentals or for capital appreciation. It does not include real estate held for use in the production orsupply of goods or services or for administrative purposes.
Investment properties are stated at fair value. Internal professional valuers perform valuations annually. For practical reasons, valuations are carriedout on a cyclical basis over a twelve-month period due to the large number of properties involved. External valuations are obtained once every threeyears on a cyclical basis. In the event of a material change in market conditions between the valuation date and balance sheet date an internalvaluation is performed and adjustments made to reflect any material changes in value.
The valuation methodology adopted is dependent upon the nature of the property. Income generating assets are valued using discounted cash flows.Vacant land, land holdings and residential flats are valued according to sales of comparable properties. Near vacant properties are valued at landvalue less the estimated cost of demolition.
Surpluses and deficits arising from changes in fair value are reflected in the income statement.
For properties reclassified during the year from property, plant and equipment to investment properties, any revaluation gain arising is initiallyrecognised in the income statement to the extent that impairment losses were previously recognised. Any residual excess is taken to the revaluationreserve. Revaluation deficits are recognised in the revaluation reserve to the extent of previously recognised gains and any residual deficit isaccounted for in the income statement.
Investment properties that are reclassified to owner-occupied property are revalued at the date of transfer, with any difference being taken to theincome statement.
Notes to the consolidated financial statementsFor the year ended 31 December 2007 continued

Old Mutual plc Annual Report and Accounts 2007Notes to the consolidated financial statements 133
Fina
ncia
ls
1 Accounting policies continued
(k) Finance costsFinance costs relate to the Group’s borrowed funds that are directly controlled by, or managed on behalf of, Old Mutual plc. These include interestpayable, and gains and losses on revaluation of these funds and on those derivative instruments which are used to hedge these funds.
(l) Non-current assets held-for-sale and discontinued operationsNon-current assets (and disposal groups) classified as held-for-sale are measured at the lower of their carrying amount and their fair value less costs to sell. Where the proceeds of disposal are expected to exceed the book value of the related net assets no impairment loss is recognised on the reclassifications of assets as held-for-sale.
Non-current assets and disposal groups are classified as held-for-sale if their carrying amount will be recovered through a sales transaction ratherthan through continuing use. This condition is regarded as having been met only when the sale is highly probable and the asset is available forimmediate sale in its present condition. Management must be committed to the sale, which should be expected to qualify for recognition as a completed sale within one year of the date of classification.
A discontinued operation is defined as a component of an entity that either has been disposed of, or is classified as held-for-sale and:
> represents a separate major line of business or geographical area of operations;> is part of a single co-ordinated plan to dispose of a separate major line of business or geographical area of operations; or> is a subsidiary acquired exclusively with a view to resale.
(m) Pension plans and retirement benefitsDefined benefit and defined contribution schemes have been established for eligible employees of the Group with the assets held in separate trusteeadministered funds.
The projected unit credit method is used to determine the defined benefit obligations based on actuarial assessments, which incorporate not only the pension obligations known on the balance sheet date but also information relevant to their expected future development. The discount rates used are determined based on the yields for investment grade corporate bonds that have maturity dates approximating to the terms of theGroup’s obligations.
Actuarial gains or losses arising subsequent to 1 January 2004 are accounted for using the “corridor method”. Actuarial gains and losses arerecognised in the income statement over a period of time to the extent that they exceed 10 per cent of the greater of the fair value of the plan assetsor the present value of the gross defined benefit obligations in the scheme. Such actuarial gains and losses are recognised over the expected averageremaining working lives of the employees participating in the scheme. Cumulative actuarial gains and losses at 1 January 2004 were recognised in equity at that date.
Where the corridor calculation results in a benefit to the Group, the recognised asset is limited to the net total of any unrecognised actuarial lossesand past service costs and the present value of any future refunds from the plan or reductions in future contributions to the plan.
When the benefits of a plan are improved, the portion of the increased benefit relating to past service by employees is recognised as an expense in the income statement on a straight-line basis over the average period until the benefits become vested. To the extent that the benefits vestimmediately, the expense is recognised immediately in the income statement.
Contributions in respect of defined contribution schemes are recognised as an expense in the income statement as incurred.
Where applicable, Group companies make provision for post retirement medical and housing benefits for eligible employees. Non-pension post retirement benefits are accounted for according to their nature, either as defined contribution or defined benefit plans. The expected costs of post retirement benefits that are defined benefit plans in nature are accounted for in the same manner as for defined benefit pension plans.
(n) Share-based payments(i) Equity-settled share-based payment transactions with employeesThe services received in an equity-settled transaction with employees are measured at the fair value of the equity instruments granted. The fair value of those equity instruments is measured at grant date.
If the equity instruments granted vest immediately and the employee is not required to complete a specified period of service before becomingunconditionally entitled to those instruments, the services received are recognised in full on grant date in the income statement for the period, with a corresponding increase in equity.
Where the equity instruments do not vest until the employee has completed a specified period of service, it is assumed that the services rendered by the employee, as consideration for those equity instruments, will be received in the future, during the vesting period. These services areaccounted for in the income statement as they are rendered during the vesting period, with a corresponding increase in equity.

Old Mutual plc Annual Report and Accounts 2007Notes to the consolidated financial statements134
1 Accounting policies continued
(n) Share-based payments continued(ii) Cash-settled share-based payment transactions with employeesThe services received in cash-settled transactions with employees and the liability to pay for those services, are recognised at fair value as theemployee renders services. Until the liability is settled, the fair value of the liability is re-measured at each reporting date and at the date ofsettlement, with any changes in fair value recognised in the income statement for the period.
(iii) Measurement of fair value of equity instruments grantedThe equity instruments granted by the Group are measured at fair value at the measurement date using standard option pricing valuation models.The valuation technique is consistent with generally acceptable valuation methodologies for pricing financial instruments, and incorporates all factorsand assumptions that knowledgeable, willing market participants would consider in setting the price of the equity instruments.
As permitted under IFRS 1, the provisions of this accounting policy have not been applied to equity-settled grants made on or before 7 November 2002, or awards granted after that date but which had vested prior to 1 January 2005.
(o) Cash and cash equivalentsFor the purposes of the cash flow statement, cash and cash equivalents comprise balances with less than 90 days maturity from the date ofacquisition and which are highly liquid and subject to an insignificant risk of changes in value. This includes: cash and balances with CentralBanks, treasury bills and other eligible bills, amounts due from other banks and trading securities. It excludes cash balances held in policyholderinvestment portfolios.
(p) Other provisionsProvisions are recognised when the Group has a present legal or constructive obligation as a result of past events, for which it is probable that anoutflow of economic benefits will occur, and where a reliable estimate can be made of the amount of the obligation. Where the effect of discountingis material, provisions are discounted and the discount rate used is a pre-tax rate that reflects current market assessments of the time value ofmoney and, where appropriate, the risks specific to the liability.
Specific policies:
> A provision for onerous contracts is recognised when the expected benefits to be derived by the Group from a contract are lower than theunavoidable cost of meeting the obligations under the contract;
> A provision for restructuring is recognised only if the Group has approved a detailed formal plan and raised a valid expectation among thoseparties directly affected, that the plan will be carried out either by having begun implementation or by publicly announcing the plan’s mainfeatures; and
> No provision is made for future operating costs or losses.
(q) Critical accounting estimates and judgmentsCritical accounting estimates are those which involve the most complex or subjective judgments or assessments. The areas of the Group’s business that typically require such estimates are life insurance contract provisions, determination of the fair value for financial assets and liabilities,impairment charges, present values of acquired in-force for insurance and investment contract business, other intangible assets acquired as part of a business combination, deferred acquisition costs, deferred taxes and the non consolidation of the Group’s wholly owned mutual lifeinsurance undertaking.
Insurance contract accounting is discussed in more detail in note 1(d), and further detail of the key assumptions made in determining insurancecontract provisions is included in note 24. Accounting for deferred acquisition cost assets is also discussed in note 1(d).
The fair values of financial assets and liabilities are classified and accounted for in accordance with the policies set out in note 1(e). They are valuedon the basis of listed market prices in so far as this is possible. If prices are not readily determinable, fair value is based either on internal valuationmodels or management estimates of amounts that could be realised under current market conditions. Fair values of certain financial instrumentsincluding over-the-counter (OTC) derivative instruments, are determined using pricing models that consider, among other factors, contractual andmarket prices, correlations, yield curves, credit spreads, and volatility factors.
Accounting for present values of acquired in-force insurance and investment contract business, together with other intangibles acquired as part of a business combination are discussed in note 1(g).
Assets are subject to regular impairment reviews as required. Impairments are measured at the difference between the cost (or amortised cost) of a particular asset and the current fair value or recoverable amount. Impairments are recorded in the income statement in the period in which they occur. The Group’s policy in relation to impairment testing in respect of Goodwill is detailed in note 1(g). The policy in respect of investmentsecurities and purchased loans and receivables is described in note 1(e).
The accounting policy for deferred tax is detailed in note 1(f).
The Group does not consolidate its wholly owned mutual life insurance undertaking, Skandia Liv. For more information refer to the SubsidiaryUndertakings and Special Purpose Entities Accounting Policy, note 1(c) (i).
Notes to the consolidated financial statementsFor the year ended 31 December 2007 continued

Old Mutual plc Annual Report and Accounts 2007Notes to the consolidated financial statements 135
Fina
ncia
ls
1 Accounting policies continued
(r) Segment reportingThe Group’s results are analysed across four geographic segments. This segmentation is consistent with the Group’s management structure andrepresents the basis on which the entity has been organised. The geographic segments are South Africa, United States, Europe and Other.
The South Africa segment principally comprises the African life and general insurance and banking businesses. The United States segmentcomprises the US life and US asset management businesses. The Europe segment comprises the operations in the UK, Nordic, Continental Europeand Latin America covering life, asset management and banking businesses. The Other segment comprises the Asia Pacific and Bermuda assetmanagement businesses. Other shareholders income/(expenses), together with finance costs, are shown as Corporate. These geographic segmentsrepresent the components of the entity that management considers when making operating decisions and it is the basis on which resources areallocated and performance assessed by the chief operating decision maker in the Group. The information reflected in note 3 reflects the measures of profit and loss, assets and liabilities for each segment reported as regularly provided to the chief operating decision maker. There are nodifferences between the measurement of the assets and liabilities reflected in the primary statements and that reported for the segments anddiscontinued operations.
There are four principal lines of business generating revenue. These lines of business are based on the products or groups of similar products thatare provided within each of the geographical segments. The lines of business are long-term business, asset management, banking and generalinsurance, the latter being treated as discontinued in the current financial year. See note 33 for further information on discontinued operations. Assets, liabilities, revenues or expenses that are not directly attributable to a particular segment are allocated between segments where there is a reasonable basis for doing so. The Group accounts for inter-segment revenues and transfers as if the transactions were with third parties at current market prices. Given the nature of the operations, there are no major customers within any of the segments.
Reallocations of certain comparative segment information have been made following changes in the Group’s management reporting structure,effective 1 January 2007. There was no impact on net profit or net assets.
(s) Treasury sharesUpon consolidation, the balance sheet and income statement are adjusted for own shares held by Employee Share Ownership Trusts (ESOPs), policyholder funds of African life companies and those held in Black Economic Empowerment Trusts consolidated within the Group’s financial statements.
Own shares are deducted from equity to eliminate the inter-company portion.
On purchase, the cost of the shares acquired is deducted from equity. Subsequently, any gain or loss on the sale or cancellation of an entity’s own equity instruments is recognised in equity.
Any net income in relation to own shares, both dividends received and unrealised losses on own shares are eliminated before stating the profit for the year.
Dividends paid in respect of these shares are also excluded when determining the retained profit for the year.
In calculating the basic earnings per share, the exclusion of income in respect of own shares from the income statement requires the exclusion of treasury shares from the weighted average number of shares.
When calculating the diluted earnings per share, the number of shares included in the weighted average reflects the potential issue in respect of the treasury shares.
(t) Share capitalOrdinary and preference share capital (including perpetual preferred callable securities) are classified as equity if they are non-redeemable by the shareholder and any dividends are discretionary and coupon payments are recognised as distributions within equity.
Preference share capital is classified as a liability if it is redeemable on a specific date or at the option of the shareholders or if dividend payments are not discretionary. Coupon payments thereon are recognised in the income statement as interest expense.

Old Mutual plc Annual Report and Accounts 2007Notes to the consolidated financial statements136
1 Accounting policies continued
(u) DividendsDividends payable to holders of equity instruments are recognised in the period in which they are authorised or approved. Interim dividends payable to holders of the Group’s ordinary share capital are authorised by the directors of the Parent Company, the final dividend typically requiresshareholder approval.
(v) Balance sheet liquidity analysisThe Group’s balance sheet is presented in order of liquidity as is permitted by IAS 1. In order to satisfy the requirements of IAS 1, the followingadditional balance sheet analyses are given to describe how balance sheet lines are categorised between current and non-current balances, applyingthe principles laid out in IAS 1.
The following balance sheet captions are generally classified as current – cash and cash equivalents, non-current assets held-for-sale, clientindebtedness for acceptances, current tax receivable, current tax payable, liabilities under acceptances and non-current liabilities held-for-sale. The following balances are generally classified as non-current – goodwill and other intangible assets, mandatory reserve deposits with central banks,property, plant and equipment, investment property, deferred tax assets, investments in associated undertakings and jointly controlled operations,deferred acquisition costs, deposits held with reinsurers, third party interests in the consolidation of funds, provisions, deferred revenue and deferredtax liabilities.
The following balances include both current and non-current portions – reinsurers’ shares of long-term and general insurance business policyholderliabilities, loans and advances, investments and securities, other assets, derivative financial assets and liabilities, long-term business and generalinsurance policyholder liabilities, borrowed funds, amounts owed to bank depositors and other liabilities. The split between the current and non-current portions for these assets and liabilities is given either by way of a footnote to the relevant note to the accounts or by way of a maturityanalysis (in respect of major financial liability captions).
(w) Standards, amendments to standards, and interpretations adopted in the 2007 annual financial statementsThe following standards, amendments to standards and interpretations effective for the first time in the current accounting year, and which arerelevant to the Group, have been adopted in these financial statements:
> IAS 1 amendment. Additional disclosures in relation to an entity’s capital (effective 1 January 2007);> IFRS 7 ‘Financial Instruments: Disclosures’ (effective 1 January 2007). IFRS 7 supersedes IAS 30, ‘Disclosures in the Financial Statements
of Banks and Similar Financial Institutions’ and the disclosure requirements in IAS 32 ‘Financial Instruments: Disclosure and Presentation’. Inparticular, IFRS 7 requires additional disclosure over and above that required by IAS 32 in respect of (1) the significance of financial instruments for an entity’s financial position and performance, and (2) the nature and extent of risks arising from financial instruments. IFRS 7 also amends the disclosure requirements of IFRS 4 ‘Insurance Contracts’. Further information on the impact of the introduction of IFRS 7 is given in note 50.
(x) Standards and interpretations early adopted in the 2007 annual financial statementsThe following standards and interpretations have been early adopted in these financial statements.
> IFRS 8 ‘Operating segments’ (effective 1 January 2009) has been early adopted in these financial statements. IFRS 8 replaces IAS 14 ‘SegmentReporting’. The key change from IAS 14 is to require segment information to be presented based on internal reports that are regularly reviewed bythe entity’s chief operating decision maker. The amount of each operating segment item reported is the measure reported to the chief operatingdecision maker for the purposes of allocating resources to the segment and assessing its performance. Other than limited additional disclosures,there were no significant impacts in respect of the Group’s identification, recognition or measurement of its reportable segments as a result of thetransitioning to IFRS 8, as the Group’s existing structures were in line with both reporting standards. Other than in respect of minor changes toreporting structures during the financial year, no reclassifications were required to comparative information due to the adoption of IFRS 8 in theGroup’s identification of its reportable segments or in the measurement of segment information.
> IFRIC 11, IFRS 2 ‘Group and Treasury Share Transactions’ (effective 1 March 2007). IFRIC 11 clarifies the treatment required in group andsubsidiary financial statements of certain share-based transactions entered into by holding companies or subsidiaries, principally in respect ofaccounting for entitlements to equity instruments of the holding company. The principles set out in the interpretation had no impact on the Group’sexisting accounting policy on share-based payments and limited impact in the Parent Company’s financial statements.
Notes to the consolidated financial statementsFor the year ended 31 December 2007 continued

Old Mutual plc Annual Report and Accounts 2007Notes to the consolidated financial statements 137
Fina
ncia
ls
1 Accounting policies continued
(y) Future standards, amendments to standards, and interpretations not early adopted in the 2007 annual financial statementsAt the date of authorisation of these financial statements the following standards, amendments to standards, and interpretations, which are relevant to the Group, were issued but not yet effective and have not been early adopted in these financial statements:
> IAS 1 ‘Presentation of Financial Statements’ (effective date 1 January 2009). The changes include a comprehensive revision of primarystatements, and include a requirement to introduce a statement of comprehensive income. There will be some limited presentational changes as a result of the introduction of this standard but no changes in measurement or recognition.
> IFRIC 13 ‘Customer Loyalty Programmes’ (effective for periods commencing after 1 July 2008) addresses accounting by entities that grant loyaltyaward credits to customers who buy other goods or services. Specifically, it explains how such entities should account for their obligations toprovide free or discounted goods or services (“awards”) to customers who redeem award credits.
> IFRIC 14 ‘The Limit on a Defined Benefit Asset, Minimum Funding Requirements and their Interaction’ (effective date 1 January 2008) clarifieswhen refunds or reductions in future contributions in relation to defined benefit assets should be regarded as available and provides guidance onthe impact of minimum funding requirements (MFR) on such assets. It also addresses when a MFR might give rise to a liability. IFRIC 14 willbecome mandatory for the Group’s 2008 financial statements, with retrospective application required. The Group has not yet determined thepotential effect of the interpretation.
The above amendments, which will be adopted in 2009, will predominantly require changes in disclosure and presentation, and are not expected to result in changes to the Group’s recognition and measurement accounting policies.
2 Foreign currencies
The principal exchange rates used to translate the operating results, assets and liabilities of key foreign business segments to Sterling are:
Incomestatement Balance sheet
(average rate) (closing rate)
31 December 2007Rand 14.1109 13.6043US Dollars 2.0014 1.9827Swedish Kronor 13.5253 12.8320Euro 1.4602 1.3596
31 December 2006Rand 12.4740 13.6746US Dollars 1.8429 1.9569Swedish Kronor 13.59181 13.3924Euro 1.46711 1.4837
1 February 2006Swedish Kronor 13.5347
1 The 2006 income statement rate applied in respect of Skandia is an eleven month average rate.
3 Segment information
(i) Basis of segmentationThe Group’s results are analysed across four geographic segments. This is consistent with the way the Group manages the business. The fourgeographic segments, based on the Group’s management structure, are South Africa, United States, Europe and Other. Within the geographicsegments, the Group generates revenue from four principal lines of business: long-term business, asset management, banking and general insurance.For IFRS purposes, the general insurance line of business has been discontinued during the financial year, however for the purposes of reportingadjusted operating profit, the result of the general insurance line of business is included in the following analyses.
The income statement information that follows is based on the Group’s geographical management structure with revenue and expenses allocated to the lines of business. This follows the same format as the Consolidated income statement and is reconciled to Adjusted operating profit which is one of the key measures reported to the Group’s chief operating decision makers for their consideration in the allocation of resources to and the review of performance of the segments. The Group utilises additional measures to assess the performance of each of the segments. These measures are also presented and include an analysis of gross earned premiums and funds under management. Additional performance measures considered by management in assessing the performance of the segments can be found in the European Embedded Value information presented on pages 238 to 261.

Old Mutual plc Annual Report and Accounts 2007Notes to the consolidated financial statements138
3 Segment information continued
(ii) Income statement – segment information year ended 31 December 2007
South Africa United States
Long-term Asset Long-term Assetbusiness management Banking business management
RevenueGross earned premiums 1,563 – – 3,148 – Outward reinsurance (41) – – (88) –
Net earned premiums 1,522 – – 3,060 –Investment return (non-banking) 3,203 89 – 528 13Banking interest and similar income – – 2,979 – –Banking trading, investment and similar income – – 167 – –Fee and commission income, and income from service activities 108 161 474 – 570 Other income 77 36 52 9 12 Share of associated undertakings’ profit after tax 11 – 8 – –Profit on disposal of subsidiaries, associated undertakings
and strategic investments – – 1 – 8 Inter-segment revenues 144 49 39 – 12
Total revenue 5,065 335 3,720 3,597 615
ExpensesClaims and benefits (including change in insurance contract provisions) (2,981) – – (3,480) –Reinsurance recoveries 39 – – 95 –
Net claims and benefits incurred (2,942) – – (3,385) – Change in investment contract liabilities (767) – – – –Losses on loans and advances – – (154) – –Finance costs – – – – – Banking interest payable and similar expenses – – (1,928) – – Fee and commission expense, and other acquisition costs (153) – – (102) (10)Other operating and administrative expenses (410) (153) (940) (54) (424)Change in third party interest in consolidated funds – – – – – Goodwill impairment – – – – –Amortisation of PVIF and other acquired intangibles – – – (24) –Inter-segment expenses (63) (84) (75) (13) –
Total expenses (4,335) (237) (3,097) (3,578) (434)
Profit before tax for the financial year (excluding policyholder tax) 730 98 623 19 181
Adjusting items (222) – (1) 79 (19)Income tax attributable to policyholder returns (63) – – – –
Adjusted operating profit before tax 445 98 622 98 162
Notes to the consolidated financial statementsFor the year ended 31 December 2007 continued

Old Mutual plc Annual Report and Accounts 2007Notes to the consolidated financial statements 139
Fina
ncia
ls
3 Segment information continued
(ii) Income statement – segment information year ended 31 December 2007 continued
Europe Other Group £m
Inter-segment Total Long-term Asset Asset (revenues)/ continuing Discontinued
business management Banking management Corporate expense operations operations Total
230 – – – – – 4,941 625 5,566 (72) – – – – – (201) (92) (293)
158 – – – – – 4,740 533 5,273 2,019 – – – 8 211 6,071 56 6,127
– – 211 – – – 3,190 – 3,190 – – 3 – – – 170 – 170
730 345 27 42 – – 2,457 – 2,457 8 23 2 3 – 23 245 – 245 – – – (3) (17) – (1) – (1)
– – 16 – – – 25 – 25 178 27 13 2 15 (512) (33) 33 –
3,093 395 272 44 6 (278) 16,864 622 17,486
(151) – – – – – (6,612) (390) (7,002)50 – – – – – 184 52 236
(101) – – – – – (6,428) (338) (6,766)(1,851) – – – – – (2,618) – (2,618)
– – (3) – – – (157) – (157)– – – – (50) – (50) – (50)– – (125) – – – (2,053) – (2,053)
(201) (103) – (11) – (70) (650) (110) (760)(468) (137) (80) (30) (56) (8) (2,760) (53) (2,813)
– – – – – (156) (156) – (156)– – – – – – – (3) (3)
(326) (5) (5) – – – (360) – (360)(73) (132) (32) (1) (3) 512 36 (36) –
(3,020) (377) (245) (42) (109) 278 (15,196) (540) (15,736)
73 18 27 2 (103) – 1,668 82 1,750
152 8 (13) – (57) – (73) 7 (66)3 – – – – – (60) – (60)
228 26 14 2 (160) – 1,535 89 1,624

Old Mutual plc Annual Report and Accounts 2007Notes to the consolidated financial statements140
3 Segment information continued
(ii) Income statement – segment information year ended 31 December 2006
South Africa United States
Long-term Asset Long-term Assetbusiness management Banking business management
RevenueGross earned premiums 1,628 – – 2,128 –Outward reinsurance (33) – – (81) –
Net earned premiums 1,595 – – 2,047 –Investment return (non-banking) 5,207 43 – 736 17Banking interest and similar income – – 2,285 – –Banking trading, investment and similar income – – 195 – –Fee and commission income, and income from service activities 107 153 499 – 465Other income 73 28 36 – 21Share of associated undertakings’ profit after tax 6 – 6 – –Profit on disposal of subsidiaries, associated undertakings
and strategic investments – – 17 – 68Inter-segment revenues 96 53 8 – 14
Total revenue 7,084 277 3,046 2,783 585
ExpensesClaims and benefits (including change in insurance contract provisions) (4,706) – – (2,667) –Reinsurance recoveries 21 – – 164 –
Net claims and benefits incurred (4,685) – – (2,503) –Change in investment contract liabilities (1,096) – – – –Losses on loans and advances – – (120) – –Finance costs – – – – –Banking interest payable and similar expenses – – (1,386) – –Fee and commission expense, and other acquisition costs (152) (4) – (128) (19)Other operating and administrative expenses (532) (115) (967) (24) (359)Change in third party interest in consolidated funds – – – – –Goodwill impairment – – (5) – –Amortisation of PVIF and other acquired intangibles – – – (22) –Inter-segment expenses (65) (62) (23) (15) –
Total expenses (6,530) (181) (2,501) (2,692) (378)
Profit before tax for the financial year (excluding policyholder tax) 554 96 545 91 207
Adjusting items (23) – (11) 33 (67)Income tax attributable to policyholder returns (125) – – – –
Adjusted operating profit before tax 406 96 534 124 140
Notes to the consolidated financial statementsFor the year ended 31 December 2007 continued

Old Mutual plc Annual Report and Accounts 2007Notes to the consolidated financial statements 141
Fina
ncia
ls
3 Segment information continued
(ii) Income statement – segment information year ended 31 December 2006 continued
Europe Other Group £m
Inter-segment Total Long-term Asset Asset (revenues)/ continuing Discontinued Totalbusiness management Banking management Corporate expense operations operations Restated
270 – – – – – 4,026 687 4,713(64) – – – – – (178) (89) (267)
206 – – – – – 3,848 598 4,4463,791 6 – 2 7 379 10,188 101 10,289
– – 142 – – – 2,427 – 2,427– – (14) – – – 181 – 181
613 269 24 41 – – 2,171 – 2,17131 (3) 6 1 119 (5) 307 – 307
– – – (6) – – 6 – 6
– – – – – – 85 – 85180 39 33 1 11 (435) – – –
4,821 311 191 39 137 (61) 19,213 699 19,912
(181) – – – – – (7,554) (404) (7,958)31 – – – – – 216 29 245
(150) – – – – – (7,338) (375) (7,713)(3,559) – – – – – (4,655) – (4,655)
– – (3) – – – (123) – (123)– – – – (91) – (91) – (91)– – (75) – – – (1,461) – (1,461)
(163) (57) – (9) – (60) (592) (125) (717)(414) (125) (71) (25) (47) (36) (2,715) (58) (2,773)
– – – – – (278) (278) – (278)– – – – – – (5) (3) (8)
(349) (7) (1) – – – (379) – (379)(89) (132) (31) (4) (8) 435 6 (6) –
(4,724) (321) (181) (38) (146) 61 (17,631) (567) (18,198)
97 (10) 10 1 (9) – 1,582 132 1,714
246 9 1 – (154) – 34 (50) (16)(114) – – – – – (239) – (239)
229 (1) 11 1 (163) – 1,377 82 1,459

Old Mutual plc Annual Report and Accounts 2007Notes to the consolidated financial statements142
3 Segment information continued
(iii) Gross earned premiums£m
South UnitedYear ended 31 December 2007 Africa States Europe Other Total
Long-term business – insurance contracts 1,048 3,148 230 – 4,426Long-term business – investment contracts with
discretionary participation features 515 – – – 515
Gross earned premiums 1,563 3,148 230 – 4,941
Long-term business – other investment contracts recognised as deposits 1,315 177 8,450 – 9,942
£m
South UnitedYear ended 31 December 2006 Africa States Europe Other Total
Long-term business – insurance contracts 1,183 2,128 270 – 3,581Long-term business – investment contracts with
discretionary participation features 445 – – – 445
Gross earned premiums 1,628 2,128 270 – 4,026
Long-term business – other investment contracts recognised as deposits 1,493 216 7,889 – 9,598
(iv) Funds under management£m
South UnitedAt 31 December 2007 Africa States Europe Other Total
Long-term business policyholder funds 22,469 14,822 44,674 122 82,087Unit trusts and mutual funds 6,693 5,260 14,416 2,535 28,904Third party client funds 10,517 149,850 – 3,833 164,200
Total client funds under management 39,679 169,932 59,090 6,490 275,191Shareholder funds 2,042 191 1,454 – 3,687
Total funds under management 41,721 170,123 60,544 6,490 278,878
£m
South United TotalAt 31 December 2006 Africa States Europe Other Restated
Long-term business policyholder funds 19,937 13,704 39,113 41 72,795Unit trusts and mutual funds 5,183 3,131 13,156 2,544 24,014Third party client funds 12,950 122,945 – 3,167 139,062
Total client funds under management 38,070 139,780 52,269 5,752 235,871Shareholder funds 2,066 200 1,296 – 3,562
Total funds under management 40,136 139,980 53,565 5,752 239,433
Notes to the consolidated financial statementsFor the year ended 31 December 2007 continued

Old Mutual plc Annual Report and Accounts 2007Notes to the consolidated financial statements 143
Fina
ncia
ls
3 Segment information continued
(v) Balance sheet information£m
Inter-segmentSouth United Unallocated assets/
At 31 December 2007 Africa States Europe Other to segment liabilities Total
AssetsLong-term business 27,356 15,969 55,607 – – (2,430) 96,502 Asset management 1,817 1,640 498 311 – (334) 3,932Banking 35,575 – 4,475 – – (142) 39,908 General insurance 641 – – – – (52) 589 Other shareholders’ assets 1,276 – 638 – (257) 65 1,722 Investments in associated undertakings 87 – – (9) 3 – 81
Consolidated total assets 66,752 17,609 61,218 302 (254) (2,893) 142,734
LiabilitiesLong-term business 27,086 14,754 51,598 – – (620) 92,818 Asset management 1,709 361 229 34 – (1,129) 1,204 Banking 33,082 – 4,169 – – (512) 36,739 General insurance 394 – – – – (4) 390 Other shareholders’ liabilities 246 – 791 – 1,577 (628) 1,986
Consolidated total liabilities 62,517 15,115 56,787 34 1,577 (2,893) 133,137
Net assetsLong-term business 491 1,215 4,009 – – (1,810) 3,905Asset management 108 1,279 326 277 – 795 2,785Banking 2,493 – 306 – – 370 3,169General insurance 247 – – – – (48) 199Other shareholders’ net assets 1,030 – (153) – (701) 693 869Investments in associated undertakings 87 – – (9) 3 – 81
4,456 2,494 4,488 268 (698) – 11,008
Debt (221) – (57) – (1,133) – (1,411)
Consolidated net assets 4,235 2,494 4,431 268 (1,831) – 9,597
The net assets of South African businesses are stated after eliminating investments in Group equity and debt instruments of £493 million (2006: £560 million) held in policyholder funds. These include investments in the Company’s ordinary shares and subordinated liabilities andpreferred securities issued by the Group’s banking subsidiary Nedbank Limited. All South Africa debt relates to long-term business. All other debtrelates to other shareholders’ net assets.
The general insurance operations are classified as discontinued.

Old Mutual plc Annual Report and Accounts 2007Notes to the consolidated financial statements144
3 Segment information continued
(v) Balance sheet information continued
£m
Inter-segmentSouth United Unallocated assets/
At 31 December 2006 Africa States Europe Other to segment liabilities Total
AssetsLong-term business 24,983 15,370 49,653 – – (2,199) 87,807Asset management 1,647 1,511 458 281 – (433) 3,464Banking 30,723 – 4,325 – – (14) 35,034General insurance 616 – – – – (32) 584Other shareholders’ assets 991 – 611 263 571 (852) 1,584Investments in associated undertakings 70 – – 13 – – 83
Consolidated total assets 59,030 16,881 55,047 557 571 (3,530) 128,556
LiabilitiesLong-term business 24,536 14,113 45,803 – – (324) 84,128Asset management 1,407 424 445 23 – (1,062) 1,237Banking 28,680 – 4,046 – – (509) 32,217General insurance 354 – – – – – 354Other shareholders’ liabilities 397 – 579 65 2,451 (1,635) 1,857
Consolidated total liabilities 55,374 14,537 50,873 88 2,451 (3,530) 119,793
Net assetsLong-term business 685 1,257 3,850 – – (1,875) 3,917Asset management 240 1,087 13 258 – 629 2,227Banking 2,043 – 279 – – 495 2,817General insurance 262 – – – – (32) 230Other shareholders’ net assets 594 – 171 198 (938) 783 808Investments in associated undertakings 70 – – 13 – – 83
3,894 2,344 4,313 469 (938) – 10,082
Debt (238) – (139) – (942) – (1,319)
Consolidated net assets 3,656 2,344 4,174 469 (1,880) – 8,763
Notes to the consolidated financial statementsFor the year ended 31 December 2007 continued

Old Mutual plc Annual Report and Accounts 2007Notes to the consolidated financial statements 145
Fina
ncia
ls
4 Operating profit adjusting items
(i) Summary of adjusting itemsIn determining the adjusted operating profit of the Group adjustments are made to profit before tax to reflect the directors’ view of the underlying long-term performance of the Group. These items are summarised below:
£m
South UnitedYear ended 31 December 2007 Notes Africa States Europe Other Total
Income/(expense)Goodwill impairment and impact of acquisition accounting 4(ii) – (24) (218) – (242)Profit on disposal of subsidiaries, associated undertakings
and strategic investments 4(iii) 1 8 16 – 25Short-term fluctuations in investment return 4(iv) 195 (55) 55 – 195Investment return adjustment for Group equity
and debt instruments held in life funds 4(v) 14 – – – 14Dividends declared to holders of perpetual
preferred callable securities 4(vi) – – – 40 40Closure of unclaimed shares trusts 4(vii) 13 – – (12) 1US Asset Management equity plans and minority holders 4(viii) – 11 – – 11Fair value gains on Group debt instruments 4(ix) – – – 29 29
Total adjusting items 223 (60) (147) 57 73Tax on adjusting items 5(iii) (101) 30 51 (9) (29)Minority interest in adjusting items 6(iii) 23 (11) – – 12
Total adjusting items after tax and minority interests 145 (41) (96) 48 56
£m
South UnitedYear ended 31 December 2006 Notes Africa States Europe Other Total
Income/(expense)Goodwill impairment and impact of acquisition accounting 4(ii) (5) (22) (256) – (283)Profit on disposal of subsidiaries, associated undertakings
and strategic investments 4(iii) 17 68 – – 85Short-term fluctuations in investment return 4(iv) 285 (12) – – 273Investment return adjustment for Group equity
and debt instruments held in life funds 4(v) (148) – – – (148)Dividends declared to holders of perpetual
preferred callable securities 4(vi) – – – 39 39Closure of unclaimed shares trusts 4(vii) (115) – – 115 –
Total adjusting items 34 34 (256) 154 (34)Tax on adjusting items 5(iii) (32) 18 46 (4) 28Minority interest in adjusting items 6(iii) 15 – 7 – 22
Total adjusting items after tax and minority interests 17 52 (203) 150 16

Old Mutual plc Annual Report and Accounts 2007Notes to the consolidated financial statements146
Notes to the consolidated financial statementsFor the year ended 31 December 2007 continued
4 Operating profit adjusting items continued
(ii) Goodwill impairment and impact of acquisition accountingIn applying acquisition accounting in accordance with IFRS deferred acquisition costs and deferred revenue are not recognised. These are reversed in the acquisition balance sheet and replaced by goodwill, other intangible assets and the value of the acquired present value of in-force business(“acquired PVIF”). In determining its adjusted operating profit the Group recognises deferred revenue and acquisition costs in relation to policies sold by acquired businesses pre-acquisition, and excludes the impairment of goodwill and the amortisation of acquired other intangibles and acquired PVIF.
Goodwill impairment and acquisition accounting adjustments to adjusted operating profit are summarised below:
£m
South UnitedYear ended 31 December 2007 Africa States Europe Other Total
Amortisation of acquired PVIFLong-term business – 24 266 – 290
Amortisation of acquired deferred costs and revenueLong-term business – – (112) – (112)Asset management – – 6 – 6
Amortisation of other acquired intangible assetsLong-term business – – 60 – 60Asset management – – 5 – 5Banking – – 5 – 5
Release of acquisition balance sheet provisionsLong-term business – – (7) – (7)Asset management – – (3) – (3)Banking – – (2) – (2)
– 24 218 – 242
£m
South UnitedYear ended 31 December 2006 Africa States Europe Other Total
Amortisation of acquired PVIFLong-term business – 22 293 – 315
Amortisation of acquired deferred costs and revenueLong-term business – – (103) – (103)Asset management – – 2 – 2
Amortisation of other acquired intangible assetsLong-term business – – 56 – 56Asset management – – 7 – 7Banking – – 1 – 1
Goodwill impairmentBanking 5 – – – 5
5 22 256 – 283

Old Mutual plc Annual Report and Accounts 2007Notes to the consolidated financial statements 147
Fina
ncia
ls
4 Operating profit adjusting items continued
(iii) Profit on disposal of subsidiaries, associated undertakings and strategic investmentsDuring 2007 the Europe banking subsidiary sold its Danish operation. An accounting profit on sale of £16 million was recognised.
During the year, the US Asset Management business disposed of its interests in certain affiliate asset managers, resulting in a profit on disposal of £8 million. In 2006 profits on sale of £68 million were recognised in relation to unrelated affiliate disposals.
During 2006, the Group’s South African banking subsidiary disposed of an IT finance solutions business resulting in a profit on disposal of £17 million.
Profits on the disposal of subsidiaries, associated undertakings and strategic investments are analysed below:
£m
South UnitedYear ended 31 December 2007 Africa States Europe Other Total
Asset management – 8 – – 8Banking 1 – 16 – 17
£m
South UnitedYear ended 31 December 2006 Africa States Europe Other Total
Asset management – 68 – – 68Banking 17 – – – 17
(iv) Long-term investment returnProfit before tax includes actual investment returns earned on the shareholder assets of the Group. Adjusted operating profit is stated after recalculatingshareholder asset investment returns based on a long-term investment return rate. The difference between the actual and the long-term investmentreturns are short-term fluctuations in investment return.
Long-term rates of return are based on achieved real rates of return appropriate to the underlying asset base, adjusted for current inflation expectationsand consensus economic investment forecasts, and are reviewed frequently, usually annually, for appropriateness. These rates of return have beenselected with a view to ensuring that returns credited to adjusted operating profit are consistent with the actual returns expected to be earned over the long-term.
For South Africa long-term business, the return is applied to an average value of investible shareholders’ assets, adjusted for net fund flows. For US and Europe long-term businesses, the return is applied to average investible assets.
For all businesses mis-matches attributed to the timing of the recognition of policyholder tax and related receipts from policyholders are eliminatedwith reference to the historic net gains/(losses) in respect of this item.
%Year ended Year ended
31 December 31 DecemberLong-term investment rates 2007 2006
South Africa long-term business 15.6 11.3United States long-term business 5.7 5.9Europe long-term business 4.9 4.6

Old Mutual plc Annual Report and Accounts 2007Notes to the consolidated financial statements148
Notes to the consolidated financial statementsFor the year ended 31 December 2007 continued
4 Operating profit adjusting items continued
(iv) Long-term investment return continuedAnalysis of short-term fluctuations in investment return
£m
South United Year ended 31 December 2007 Africa States Europe Total
Long-term businessActual investment return attributable to shareholders 416 527 61 1,004Less: long-term investment return (221) (582) (6) (809)
Total short-term fluctuations in investment return 195 (55) 55 195
The actual investment return attributable to shareholders for the US long-term business reflects total investment income, as a distinction is not drawn between shareholder and policyholder funds.
£m
South UnitedYear ended 31 December 2006 Africa States Europe Total
Long-term businessActual investment return attributable to shareholders 434 620 5 1,059Less: long-term investment return (149) (632) (5) (786)
Total short-term fluctuations in investment return 285 (12) – 273
(v) Investment return adjustment for Group equity and debt instrument held in life fundsAdjusted operating profit includes investment returns on policyholder investments in Group equity and debt instruments by the Group’s life funds.These include investments in the Company’s ordinary shares, and the subordinated liabilities and ordinary securities of the Group’s South Africabanking subsidiary. These investment returns are eliminated within the consolidated income statement in arriving at profit before tax, but are included in adjusted operating profit. In 2007 the investment return adjustment decreased adjusted operating profit by £14 million (2006: increase of £148 million).
(vi) Dividends declared to holders of perpetual preferred callable securitiesDividends declared to the holders of the Group’s perpetual preferred callable securities were £40 million in the year ended 31 December 2007(2006: £39 million). These are recognised in finance costs on an accruals basis for the purpose of determining adjusted operating profit. In the IFRS financial statements this cost is recognised in equity.
(vii) Closure of unclaimed shares trustsDuring 2006 Old Mutual plc announced that the Old Mutual South Africa Unclaimed Shares Trust (UST) together with similar trusts set up inNamibia, Zimbabwe, Malawi and Bermuda, would be closed and that the gross proceeds from the sale of unclaimed shares by these trusts should be paid to Old Mutual plc. Under the terms of the deeds establishing the USTs, the trustees of the USTs were required, following their termination, to liquidate the residual assets of the USTs and to distribute them in accordance with the directions given by Old Mutual plc. Following discussionswith the South African National Treasury, the Company announced on 30 January 2007 that it intended, subject to shareholders approval(subsequently granted) at the Company’s Annual General Meeting in May 2007, to use substantially all of the proceeds realised to discharge lateclaims in cash for a further period of three years (to 31 August 2009), to fund good causes in the jurisdictions of the trust concerned or to enhancebenefits for certain specific small policyholders of the Group’s South African and Namibian life businesses.
The principal impact of the closure of these trusts was reflected in the 2006 Group Financial Statements. Income of £115 million was recognised byOld Mutual plc and expenses of £115 million were recognised by the Group’s South Africa long-term business. The income related to the anticipatedreceipt of sales proceeds from the trusts. The expenses related to anticipated cost of the proposals to discharge the Group’s obligations following theclosure of the trusts. This item had no impact on the profit before tax or adjusted operating profit of the Group, and was excluded from the adjustedoperating profit of Old Mutual plc and the Group’s South Africa long-term business.
During 2007 payments of the proceeds have been made by the trusts to Old Mutual plc. These payments resulted in the realisation of foreignexchange losses. These losses amounted to £14 million in the year ended 31 December 2007. Furthermore, as a result of remeasurement of certainprovisions for obligations established during 2006, an amount of £13 million has been released. Consistent with the treatment of the original salesproceeds and costs in 2006, these amounts have been excluded from adjusted operating profit.

Old Mutual plc Annual Report and Accounts 2007Notes to the consolidated financial statements 149
Fina
ncia
ls
4 Operating profit adjusting items continued
(viii) US Asset Management equity plans and minority interestsDuring 2007, US Asset Management has entered into a number of new long-term incentive arrangements with its asset management affiliates.
In accordance with IFRS requirements the cost of these schemes is disclosed as being attributable to minority interests. However, this is treated as a compensation expense in determining adjusted operating profit. The amount recognised in relation to this in 2007 was £11 million (2006: £nil).
During 2007 the Group has issued put options to employees as part of some of its US affiliate incentive schemes. The impact of revaluing theseinstruments is recognised in accordance with IFRS, but excluded from adjusted operating profit. As at 31 December 2007 these instruments wererevalued, the impact of which was less than £1 million. At 31 December 2006 no such instruments existed.
(ix) Fair value gains on Group debt instrumentsThe significant widening of credit spreads in the second half of 2007 has led to a reduction in the market price of the Group’s debt instruments. This decline in market price has resulted in a gain of £29 million being recorded in the Group’s income statement for those instruments that arerecorded at fair value.
In the directors’ view, this gain is not reflective of the underlying performance of the Group and will reverse over time. The gain has therefore beenexcluded from adjusted operating profit.
5 Income tax expense
(i) Analysis of total income tax expense£m
Year ended Year ended 31 December
31 December 20062007 Restated
Current taxUnited Kingdom tax
Corporation tax 436 61Double tax relief (399) (26)
Overseas taxSouth Africa 379 239United States 26 16Europe 73 54
Secondary Tax on Companies (STC) 65 11Prior year adjustments (25) (3)
Total current tax 555 352
Deferred taxOrigination of temporary differences (58) 213Changes in tax rates/bases (13) –Recognition of deferred tax assets (5) (2)
Total deferred tax (76) 211
Total income tax expense 479 563
(ii) Reconciliation of total income tax expense£m
Year ended Year ended 31 December
31 December 20062007 Restated
Profit before tax 1,668 1,582
Tax at standard rate of 30% (2006: 30%) 500 474Different tax rate or basis on overseas operations (20) (19)Untaxed and low taxed income (154) (133)Disallowable expenses 88 59Net movement on deferred tax assets not recognised (52) 19STC 47 11Income tax attributable to policyholder returns 51 173Other 19 (21)
Total income tax expense 479 563

Old Mutual plc Annual Report and Accounts 2007Notes to the consolidated financial statements150
Notes to the consolidated financial statementsFor the year ended 31 December 2007 continued
5 Income tax expense continued
(iii) Income tax on adjusted operating profit£m
Year ended Year ended 31 December
31 December 20062007 Restated
Income tax expense 479 563Tax on adjusting itemsImpact of acquisition accounting 65 52Profit on disposal of subsidiaries, associated undertakings and strategic investments (10) 8Short-term fluctuations in investment return (40) (28)Income tax attributable to policyholders returns (60) (239)Secondary Tax on Companies (STC) on dividends paid (35) –Tax on dividends declared to holders of perpetual preferred callable securities recognised in equity (9) (4)
Income tax on adjusted operating profit 390 352
6 Minority interests – Income statement
(i) Minority interests – ordinary sharesThe minority interest charge to profit for the financial year has been calculated on the basis of the Group’s effective ownership of the subsidiaries inwhich it does not own 100 per cent of the ordinary equity. The principal subsidiaries where a minority exists are the Group’s banking and generalinsurance businesses in South Africa. For the year ended 31 December 2007 the minority interest attributable to ordinary shares was £224 million(2006: £207 million).
(ii) Minority interests – preferred securities£m
At At31 December 31 December
2007 2006
R2,000 million non-cumulative preference shares 13 13R792 million non-cumulative preference shares 5 5R300 million non-cumulative preference shares 1 –US$750 million cumulative preferred securities 30 32R364 million non-cumulative preference shares 1 –
Minority interest – preferred securities 50 50
(iii) Minority interests – adjusted operating profitThe following table reconciles minority interests’ share of profit for the financial year to minority interests’ share of adjusted operating profit:
£m
Year ended Year ended 31 December 31 December
Reconciliation of minority interests share of profit for the financial year 2007 2006
The minority interest charge is analysed as follows:Minority interest – ordinary shares 224 207Goodwill impairment and impact of acquisition accounting – 11Profit on disposal of subsidiaries, associated undertakings and strategic investments – (7)Short-term fluctuations in investment return – (9)Income attributable to Black Economic Empowerment trusts of listed subsidiaries 29 22Income attributable to US Asset Management minority holdings (11) –
Minority interest share of adjusted operating profit 242 224
The Group uses revised weighted average effective ownership interests when calculating the minority interest applicable to the adjusted operatingprofit of its South Africa banking and general insurance businesses. This reflects the legal ownership of these businesses following the implementationfor Black Economic Empowerment (BEE) schemes in 2005. In accordance with IFRS accounting rules the shares issued for BEE purposes aredeemed to be, in substance, options. Therefore the effective ownership interest reflected in arriving at profit after tax in the consolidated incomestatement is lower than that applied in arriving at adjusted operating profit after tax. In 2007 the increase in adjusted operating profit attributable to minority interests as a result of this was £29 million (2006: £22 million).

Old Mutual plc Annual Report and Accounts 2007Notes to the consolidated financial statements 151
Fina
ncia
ls
7 Earnings and earnings per share
(i) Basic and diluted earnings per shareBasic earnings per share is calculated by dividing the profit for the financial year attributable to ordinary equity shareholders by the weighted averagenumber of ordinary shares in issue during the year excluding own shares held in policyholder funds, ESOP trusts, Black Economic Empowermenttrusts and other related undertakings.
£m
Year ended Year ended31 December 31 December
2007 2006
Profit for the financial year attributable to equity holders of the parent from continuing operations 929 781Profit for the financial year attributable to equity holders of the parent from discontinued operations 43 55
Profit for the financial year attributable to equity holders of the parent 972 836Dividends declared to holders of perpetual preferred callable securities (31) (35)
Profit attributable to ordinary equity holders 941 801
Total dividends declared to holders of perpetual preferred callable securities of £40 million in 2007 are stated net of tax credits of £9 million.
Millions
Year ended Year ended31 December 31 December
2007 2006
Weighted average number of ordinary shares in issue 5,492 5,339Shares held in charitable foundations (20) (19)Shares held in ESOP trusts (61) (98)
Adjusted weighted average number of ordinary shares 5,411 5,222Shares held in life funds (282) (292)Shares held in Black Economic Empowerment trusts (235) (225)
Weighted average number of ordinary shares 4,894 4,705
Basic earnings per ordinary share from continuing operations (pence) 18.3 15.8Basic earnings per ordinary share from discontinued operations (pence) 0.9 1.2
Basic earnings per ordinary share (pence) 19.2 17.0
Diluted earnings per share recognises the dilutive impact of share options held in ESOP trusts and Black Economic Empowerment trusts which are currently in the money in the calculation of the weighted average number of shares, as if the relevant shares were in issue for the full period.
Millions
Year ended Year ended31 December 31 December
2007 2006
Weighted average number of ordinary shares 4,894 4,705Adjustments for share options held by ESOP trusts 63 62Adjustments for shares held in Black Economic Empowerment trusts 235 225
5,192 4,992
Diluted earnings per ordinary share from continuing operations (pence) 17.3 15.0Diluted earnings per ordinary share from discontinued operations (pence) 0.8 1.1
Diluted earnings per ordinary share (pence) 18.1 16.1

Old Mutual plc Annual Report and Accounts 2007Notes to the consolidated financial statements152
7 Earnings and earnings per share continued
(ii) Adjusted operating earnings per ordinary shareAdjusted operating earnings per ordinary share is determined based on adjusted operating profit. Adjusted operating profit represents the directors’view of the underlying performance of the Group. For long-term and general insurance business adjusted operating profit is based on a long-terminvestment return, includes investment returns on life funds’ investments in Group equity and debt instruments and is stated net of income taxattributable to policyholder returns. For the US Asset Management business it includes compensation costs in respect of certain long-term incentiveschemes defined as minority interests in accordance with IFRS. For all businesses, adjusted operating profit excludes goodwill impairment, the impact of acquisition accounting, revaluations of put options related to long-term incentive schemes, the impact of closure of unclaimed shares trusts,profit/(loss) on disposal of subsidiaries, associated undertakings and strategic investments, dividends declared to holders of perpetual preferredcallable securities, income/(expense) from closure of unclaimed shares trusts and fair value gains on Group debt instruments.
The reconciliation of profit for the financial year to adjusted operating profit after tax attributable to ordinary equity holders is as follows:
£m
Continuing DiscontinuedYear ended 31 December 2007 operations operations Total
Profit for the financial year attributable to equity holders of the parent 929 43 972Adjusting items (73) 7 (66)Tax on adjusting items 29 (3) 26Minority interest on adjusting items (12) (6) (18)
Adjusted operating profit after tax attributable to ordinary equity holders 873 41 914
Adjusted weighted average number of ordinary shares – (millions) 5,411
Adjusted operating earnings per ordinary share – (pence) 16.1 0.8 16.9
£m
Continuing DiscontinuedYear ended 31 December 2006 operations operations Total
Profit for the financial year attributable to equity holders of the parent 781 55 836Adjusting items 34 (50) (16)Tax on adjusting items (28) 15 (13)Minority interest on adjusting items (22) 5 (17)
Adjusted operating profit after tax attributable to ordinary equity holders 765 25 790
Adjusted weighted average number of ordinary shares – (millions) 5,222
Adjusted operating earnings per ordinary share – (pence) 14.6 0.5 15.1
Notes to the consolidated financial statementsFor the year ended 31 December 2007 continued

Old Mutual plc Annual Report and Accounts 2007Notes to the consolidated financial statements 153
Fina
ncia
ls
8 Investment return (non-banking)£m
Year ended Year ended 31 December
31 December 20062007 Restated
Interest and similar incomeLoans and advances 10 33
Investments and securities 1,559 1,482Government and government-guaranteed securities 323 389Other debt securities, preference shares and debentures 731 673Pooled investments 57 49Short-term funds and securities treated as investments 271 193Other 177 178Cash and cash equivalents 100 95
Total interest and similar income 1,669 1,610
Dividend income – investments and securities 377 494Equity securities 334 475Pooled investments 43 19
Rental income from investment property 57 62Fair value gains and losses recognised in income 3,962 8,037Investments and securities 3,732 8,112Derivatives (44) (214)Investment property 264 139Other 10 –
Foreign currency gains/(losses) 6 (15)
Total investment return recognised in income 6,071 10,188
£m
Year ended Year ended 31 December
31 December 20062007 Restated
Included in interest and similar income above are the following amounts:
Total interest income for assets not at fair value through profit or loss 620 824
The fair value gains and losses shown above are analysed according to their IAS 39 categorisations as follows:Held for trading (including derivatives) 48 (214)Designated at fair value through profit or loss 3,685 8,128Available for sale financial assets (36) (16)Loans and receivables 1 –Investment property 264 139
3,962 8,037
Realised fair value gains and losses included in the above 5,928 4,560
The fair value gains/(losses) on available for sale financial assets shown above reflect the amount previously recognised as unrealised within the Available for sale reserve in equity that have been recycled to the income statement on disposal of the particular assets.

Old Mutual plc Annual Report and Accounts 2007Notes to the consolidated financial statements154
9 Banking interest and similar income£m
Year ended Year ended 31 December
31 December 20062007 Restated
Interest and similar incomeLoans and advances 2,942 2,203Mortgage loans 1,531 1,121Finance lease and instalment debtors 457 350Credit cards 71 47Bills and acceptances 7 10Overdrafts 122 100Term loans and other 754 575Investments and securities 244 224Government and government-guaranteed securities 137 119Other debt securities, preference shares and debentures 107 103Short-term funds and securities treated as investments – 2Cash and cash equivalents 4 –
Total interest and similar income 3,190 2,427
Included in banking interest and similar income above are the following amounts:Total interest income for assets not at fair value through profit or loss 2,880 2,114
10 Banking trading, investment and similar income£m
Year ended Year ended 31 December
31 December 20062007 Restated
Dividend income – investments and securities 11 14Equity securities 10 10Pooled investments 1 4
Rental income from investment property 4 4
Exchange and other non-interest income 62 41Derivative income 45 18Exchange – 3Securities dealing 16 22Fair value gains/(losses) 1 (2)
Net trading income 93 122Foreign exchange 51 47Debt securities 24 44Equities 16 31Other 2 –Total banking trading, investment and similar income 170 181
The fair value gains and losses shown above are analysed according to their IAS 39 categorisations as follows:
Held for trading (including derivatives) (20) 45Designated at fair value through profit or loss 20 (46)Loans and receivables 1 (1)
1 (2)
Realised fair value gains included in the above 47 75
Notes to the consolidated financial statementsFor the year ended 31 December 2007 continued

Old Mutual plc Annual Report and Accounts 2007Notes to the consolidated financial statements 155
Fina
ncia
ls
11 Fee and commission income, and income from service activities£m
Long-term AssetYear ended 31 December 2007 business management Banking Total
Fee and commission income 977 1,007 501 2,485Transaction and performance fees – 132 – 132Change in deferred revenue (139) (21) – (160)
838 1,118 501 2,457
Year ended 31 December 2006
Fee and commission income 853 881 522 2,256Transaction and performance fees – 86 – 86Change in deferred revenue (133) (38) – (171)
720 929 522 2,171
The amounts shown above for asset management relate to fees earned on trust and fiduciary activities where the group holds or invests assets onbehalf of its customers.
12 Finance costs £m
Year ended Year ended 31 December
31 December 2006Note 2007 Restated
Interest payable on borrowed funds 86 78Senior debt and term loans 25 44Subordinated debt 60 36Other 1 (2)
Fair value gains and losses on borrowed funds (37) 8Borrowed funds (29) (7)Derivative instruments (8) 15
Foreign currency gains and losses on borrowed funds – –Reserve movements relating to debt and derivative instruments 1 5
Total finance costs excluding banking activities 50 91
Finance costs from banking activities 13 68 71
Total interest expense included above for liabilities not at fair value through profit or loss 29 51
The fair value gains and losses shown above are analysed according to their IAS 39 categorisations as follows:
Held for trading (including derivatives) (8) 16Designated at fair value through profit or loss (29) (7)
(37) 9
Realised fair value gains and losses included in the above – –

Old Mutual plc Annual Report and Accounts 2007Notes to the consolidated financial statements156
13 Banking interest payable and similar expense£m
Year ended Year ended 31 December
31 December 20062007 Restated
Amounts owed to bank depositors 1,854 1,321Deposits and loan accounts 1,216 924Current and savings accounts 203 100Negotiable certificates of deposit 367 226Long-term debt instruments 68 71
Other liabilities 199 140
Total interest payable and similar expenses 2,053 1,461
Total interest expense included above for liabilities not at fair value through profit or loss 1,723 1,421
14 Fee and commission expense, and other acquisition costs£m
Long-term AssetYear ended 31 December 2007 business management Total
Fees and commission expense 846 210 1,056Changes in deferred acquisition costs (457) (32) (489)Other acquisition costs 68 15 83
457 193 650
Year ended 31 December 2006
Fees and commission expense 830 194 1,024Changes in deferred acquisition costs (464) (46) (510)Other acquisition costs 78 – 78
444 148 592
Notes to the consolidated financial statementsFor the year ended 31 December 2007 continued

Old Mutual plc Annual Report and Accounts 2007Notes to the consolidated financial statements 157
Fina
ncia
ls
15 Other operating and administrative expenses
(i) Other operating and administrative expenses£m
Year ended Year ended31 December 31 December
Note 2007 2006
Staff costs 15(ii) 1,573 1,442Depreciation 72 68Software costs 29 7Operating lease rentals – banking 41 47Operating lease rentals – non-banking 49 38Amortisation of intangibles 340 414Impairment of goodwill 3 14
(ii) Staff costs£m
Year ended Year ended31 December 31 December
Note 2007 2006
Staff costsWages and salaries 971 946Social security costs 52 53Retirement obligations
Defined contribution plans 45 38Defined benefit plans (3) –Other retirement benefits 4 4
Bonus and incentive remuneration 358 292Share-based payments
Cash settled (2) 25Equity settled 42(ix) 38 32
Termination benefits 3 1Long-term employee benefits 4 10Other 103 41
1,573 1,442
Number
The average number of persons employed by the Group during the year was:Long-term business 20,188 21,713Banking 26,314 23,581Asset management 5,257 5,028General insurance (discontinued operations) 2,723 2,709Other 148 121
54,630 53,152
The discontinued operations operating and administrative expenses included in the above are as follows: £m
Year ended Year ended31 December 31 December
2007 2006
Staff costs 68 44Depreciation 5 4Software costs – 3Operating lease rentals – non-banking 3 3Amortisation of intangibles 3 4Impairment of goodwill 3 4

Old Mutual plc Annual Report and Accounts 2007Notes to the consolidated financial statements158
15 Other operating and administrative expenses continued
(iii) Fees to Group’s auditorsIncluded in other operating expenses are fees paid to the Group’s auditors. These can be categorised as follows:
£m
Year ended Year ended31 December 31 December
2007 2006
Fees for audit servicesGroup 1.3 0.9Subsidiaries 8.4 9.2Pension schemes 0.3 0.1
Total audit fees 10.0 10.2
Fees for non-audit servicesTaxation 0.3 0.6Information technology – 0.1Valuation and actuarial 0.7 0.2Corporate finance transactions 0.1 0.2Any other services provided by auditors 2.8 2.3
Total non-audit services 3.9 3.4
Total Group auditors’ remuneration 13.9 13.6
In addition to the above, fees of £2.5 million (2006: £2.9 million) were payable to other auditors in respect of joint audit arrangements of Nedbank,the Group’s banking subsidiary in South Africa.
The discontinued operations fees paid for audit services included in the above are £0.4 million (2006: £0.5million).
16 Acquisition of subsidiariesThe Company acquired control of Försäkringsaktiebolaget Skandia (publ) (Skandia) in January 2006 when it obtained 72.1 per cent of Skandia’sshares. Further acceptances were received and settled on 17 February 2006 (17.4 per cent) and on 23 March 2006 (8.7 per cent). Followingfurther permitted open market purchases, the Group’s interest in Skandia was 98.8 per cent at 31 December 2006. The Company instigated a compulsory purchase of the remaining Skandia shares during 2007. These compulsory purchase proceedings are complete and as a result theCompany owns 100% of Skandia.
Under the terms of the offer, consideration was paid to Skandia shareholders by way of a combination of cash and shares in Old Mutual plc. In total,cash consideration of £1,303 million has been paid of which £1,253 million was paid in 2006 and the remainder, in respect of the compulsorypurchase programme, in 2007. The Company issued 1,389 million Old Mutual plc shares in 2006, with a fair value of £2,670 million.
Skandia has been consolidated in the Group Financial Statements of Old Mutual plc since 1 February 2006.
Total revenue and profit before tax for the year ended 31 December 2007 were £3,620 million and £115 million respectively (eleven months ended31 December 2006: £5,148 million and £89 million). The total revenue and profit before tax for the twelve months ended 31 December 2006 were £5,309 million and £97 million, respectively.
The fair value of the consideration paid for Skandia is as follows:£m
Year ended31 December
2007
Cash paid 1,303Fair value of 1,389 million Old Mutual plc shares issued, based on the published prices at applicable rates of exchange 2,670Costs of acquisition 72
Total consideration 4,045
The acquisition of Skandia in exchange for the Group’s ordinary shares meant that merger relief was applicable under section 131 of the CompaniesAct 1985. As a result £2,532 million was credited to the merger reserve in 2006 within the Company’s balance sheet.
Notes to the consolidated financial statementsFor the year ended 31 December 2007 continued

Old Mutual plc Annual Report and Accounts 2007Notes to the consolidated financial statements 159
Fina
ncia
ls
16 Acquisition of subsidiaries continued
The fair value of the assets and liabilities acquired was as follows:£m
Fair value and Final fair valuesaccounting reported at
policy Acquired 31 DecemberBook value adjustments intangibles 2007
AssetsIntangible assets 52 (113) 3,036 2,975Deferred acquisition costs (DAC) 1,422 (1,422) – –Deferred tax assets 40 (5) – 35Other assets 39,366 (270) – 39,096
Total assets 40,880 (1,810) 3,036 42,106
LiabilitiesDeferred revenue liability (DRL) 1,214 (1,214) – –Provisions 89 136 – 225Contingent liabilities – 63 – 63Deferred tax liabilities 234 (109) 500 625Other liabilities 38,426 (18) – 38,408
Total liabilities 39,963 (1,142) 500 39,321
Net assets acquired 917 (668) 2,536 2,785
Residual goodwill 1,260
Total consideration 4,045
Fair value and accounting policy adjustments as stated above include net adjustments of £559 million reflected in the 11 months from 1 February2006 to 31 December 2006, and a further £109 million of adjustments reflected in January 2007. The adjustments identified during the yearended 31 December 2007 related to actuarial risk provisions and taxation, pensions and litigation liabilities identified subsequent to control passingfrom Skandia to the Group.
Other fair value adjustments principally comprised the de-recognition of DAC, DRL and related balances (including deferred tax impacts thereon) on the basis that these items had no fair value at acquisition.
The remaining fair value and accounting policy adjustments related to the de-recognition of goodwill shown in Skandia’s balance sheet, recognition at fair value of certain assets and liabilities previously recorded at amortised cost and other adjustments to reflect up to date estimates in respect of certain litigation issues and tax, including the recognition of certain contingencies.
Separately identifiable intangible assets have been valued at £3,036 million, using estimated post-tax cash flows and post-tax discount rates. Thisrepresents the value of Skandia PVIF, distribution networks, non-life customer relationship, and brand. No other intangibles were identified whichwere capable of reliable measurement. A deferred tax liability of £500 million was provided for in respect of these intangible assets, based on the tax rates applicable in the various territories, on the grounds that the assets had no tax base, thereby creating temporary differences on which deferred tax must be provided.
The useful economic lives of the PVIF and other intangibles have been assessed, taking into account factors such as the usage of the asset, life cycles, obsolescence, maintenance, and period of control over the asset. PVIF and other intangible assets are amortised over a period of between 10 and 20 years. Related deferred tax liabilities are amortised in line with the amortisation of the particular intangible asset.
The final residual goodwill of £1,260 million represents the value of the Skandia workforce and synergies, both from increased revenues and reduced costs which are expected to arise across the Skandia business and within the UK life assurance operations as a result of the acquisition. It also represents the value of new business growth and other customer intangible assets that cannot be reliably measured.

Old Mutual plc Annual Report and Accounts 2007Notes to the consolidated financial statements160
17 Goodwill and other intangible assets£m
Present valueof acquired Software Other
in-force development intangible Goodwill business costs assets Total
At 31 December 2007 2006 2007 2006 2007 2006 2007 2006 2007 2006
CostBalance at beginning of the year 2,559 1,451 2,543 288 358 355 758 – 6,218 2,094Acquisitions through business
combinations 122 1,338 101 2,289 1 38 15 755 239 4,420Additions – – – – 90 56 4 2 94 58Foreign exchange and other movements 127 (220) 92 (34) 3 (72) 27 1 249 (325)Disposals or retirements (26) (10) – – (2) (19) – – (28) (29)Transfer to Assets Held-for-Sale (20) – – – (27) – – – (47) –
Balance at end of the year 2,762 2,559 2,736 2,543 423 358 804 758 6,725 6,218
Amortisation and impairment lossesBalance at beginning of the year (130) (161) (431) (159) (222) (204) (68) – (851) (524)Amortisation charge for the year – – (283) (303) (48) (46) (70) (65) (401) (414)Impairment losses charged for the year – (8) – – (1) (6) (1) – (2) (14)Foreign exchange and other movements (10) 39 (14) 31 (5) 21 (5) (3) (34) 88Disposals or retirements – – – – 1 13 – – 1 13Transfer to Assets Held-for-Sale 7 – – – 14 – – – 21 –
Balance at end of the year (133) (130) (728) (431) (261) (222) (144) (68) (1,266) (851)
Carrying amountBalance at beginning of the year 2,429 1,290 2,112 129 136 151 690 – 5,367 1,570
Balance at end of the year 2,629 2,429 2,008 2,112 162 136 660 690 5,459 5,367
The majority of other intangible assets comprise distribution channels, customer relationships and brands associated with the Skandia businessacquired during the previous financial year.
Goodwill arising on acquisitions through business combinations is principally £51 million with respect to various acquisitions by the Group’s United States Asset Management business, £70 million relating to the purchase of additional interests in the Group’s South Africa Banking business,£1 million relating to various other small acquisitions.
Goodwill impairment chargeThe goodwill impairment charge for the year ended 31 December 2007 was nil (2006: £8 million).
Impairment tests for goodwillGoodwill arising on acquisition is reviewed for each cash generating unit (CGU) and the recoverable amounts are determined from value in use or net selling price calculations. An impairment to goodwill is made where the recoverable amount is less than the carrying value.
The key assumptions used in the determination of the recoverable amount are outlined below by segment:
EuropeThe CGUs are the geographical areas, UK, Nordic and ELAM. In determining the total recoverable amount for each CGU the following assumptionsare used:
Long-term business Shareholders’ recoverable amount of the long-term business is determined using embedded value methodology plus a multiple of the value of newbusiness (VNB). Embedded value represents the shareholders’ interest in the long-term business and is calculated in accordance with the EuropeanEmbedded Value (EEV) principles. The VNB represents the present value of future profits from new business.
The EEV and VNB are actuarially determined, based on business plans approved by management covering a three year period. Projections beyondthat date have been extrapolated using a conservative inflation based growth assumption. The methodology and significant assumptions underlyingthe determination of EEV and VNB are disclosed in the supplementary information shown on pages 242 and 254 to 258. The valuation includes the expected synergies arising from the acquisition. The valuation multiple applied to the VNB has been determined by reference to recent marketmultiples applied in similar transactions of similar businesses.
Notes to the consolidated financial statementsFor the year ended 31 December 2007 continued

Old Mutual plc Annual Report and Accounts 2007Notes to the consolidated financial statements 161
Fina
ncia
ls
17 Goodwill and other intangible assets continued
Other businessThe asset management business recoverable amount has been determined under the value-in-use methodology, based on projected cash flows. The cash flows are based on the business plans approved by management for the next three years and extrapolated using the same inflation basedgrowth rate as under EEV. The assumptions underlying the business plan include market share, sales growth, investment performance and expectedsynergies arising from the acquisition. The risk free rates of return are the same as in the EEV calculations. The discount rate applied is based on thecost of equity. The equity market risk premium is determined by references to market valuation models.
The banking business has been valued based on a multiple of earnings, with comparison to recent similar transactions and market valuations.
North AmericaGoodwill attributable to North America relates to the acquisition of the US Life business and US Asset Management. As for Europe, the recoverableamount of the long-term business is determined as the EEV plus a multiple of the value of new business. The methodology and assumptionsunderlying the EEV and VNB are disclosed on pages 242 and 254 to 258. The multiples are determined by reference to recent market transactionsand valuation models. The recoverable amount of the asset management business is determined under the value-in-use methodology. Projected cash flows are based on three year business plans approved by management, with extrapolation for two further years using a 6 per cent growth rate. The discount rate applied to these projected future cash flows is 14 per cent.
AfricaThe goodwill for South Africa primarily relates to the banking business. The recoverable amount for the banking business is determined based on thevalue-in-use methodology. The calculation uses cash flow projections from business plans for the forthcoming three years which are then extrapolatedfor two further years. Extrapolation is achieved using a long-term growth rate which varies between 3 and 5 per cent. The risk adjusted discount rateis approximately 12.5 per cent.
Goodwill by cash generating unitThe following table is an analysis of the goodwill, net of amortisation and impairment losses by principal cash generating units:
£m
Year ended Year ended31 December 31 December
2007 2006
US Asset Management 932 923US Life 57 58African banking 318 233UK 639 587Nordic region 196 173Europe and Latin America 436 370Other 51 85
Goodwill, net of impairment losses 2,629 2,429
Goodwill and other intangible assets by segment£m
South UnitedAt 31 December 2007 Africa States Europe Other Total
Goodwill and intangible assets, net of amortisation and impairment losses 448 1,141 3,839 31 5,459Amortisation 37 24 340 – 401Impairment losses 1 – 1 – 2
£m
South UnitedAt 31 December 2006 Africa States Europe Other Total
Goodwill and intangible assets, net of amortisation and impairment losses 384 1,092 3,826 65 5,367Amortisation 42 14 358 – 414Impairment losses 14 – – – 14

Old Mutual plc Annual Report and Accounts 2007Notes to the consolidated financial statements162
18 Property, plant and equipment£m
Plant and Land Buildings equipment Total
2007 2006 2007 2006 2007 2006 2007 2006
Gross carrying amountBalance at beginning of the year 53 63 290 331 514 507 857 901Additions 3 1 4 5 108 93 115 99Additions from business combinations – 2 1 14 – 75 1 91Increase arising from revaluation 17 3 87 25 – – 104 28Disposals – (2) (20) (5) (43) (54) (63) (61)Foreign exchange and
other movements 1 (14) 5 (80) 2 (107) 8 (201)Transfer to non-current assets
held-for-sale (1) – (7) – (34) – (42) –
Balance at end of the year 73 53 360 290 547 514 980 857
Accumulated depreciation and impairment losses
Balance at beginning of the year – – (13) (6) (345) (357) (358) (363)Depreciation charge for the year – – (8) (8) (65) (60) (73) (68)Disposals – – 4 1 30 42 34 43Foreign exchange and
other movements – – 6 – (4) 30 2 30Transfer to non-current assets
held-for-sale – – 1 – 22 – 23 –
Balance at end of the year – – (10) (13) (362) (345) (372) (358)
Carrying amount
Balance at beginning of the year 53 63 277 325 169 150 499 538
Balance at end of the year 73 53 350 277 185 169 608 499
The carrying value of property, plant and equipment leased to third parties under operating leases, included in the above is £28 million (2006: £20 million) and comprises land of £4 million (2006: £3 million) and buildings of £24 million (2006: £17 million).
There are no restrictions on property, plant and equipment title as a result of security pledges and no contractual commitments for the acquisition of plant, property and equipment.
The revaluation of land and buildings relates to the South Africa long-term business, £2 million and £67 million respectively, the South Africa bankingbusiness, £15 million and £20 million respectively. For long-term business, land and buildings are valued as at 31 December each year by internalprofessional valuers and external valuations are obtained once every three years. External professional valuers are used for the banking business. For both businesses the valuation methodology adopted is dependent upon the nature of the property. Income generating assets are valued usingdiscounted cash flows and vacant land and property are valued according to sales of comparable properties. The carrying value that would have been recognised had the land and buildings been carried under the cost model would be £19 million (2006: £19 million) and £92million (2006:£92 million) respectively for the African long-term business and £13 million (2006: £15 million) and £86 million (2006: £97 million) for the African banking business respectively.
Capital expenditure and depreciation by segment£m
South UnitedAt 31 December 2007 Africa States Europe Other Total
Capital expenditure, net of depreciation 544 17 39 8 608Depreciation 54 6 13 – 73
£m
South UnitedAt 31 December 2006 Africa States Europe Other Total
Capital expenditure, net of depreciation 450 14 28 7 499Depreciation 51 5 12 – 68
Notes to the consolidated financial statementsFor the year ended 31 December 2007 continued

Old Mutual plc Annual Report and Accounts 2007Notes to the consolidated financial statements 163
Fina
ncia
ls
19 Investment property£m
Year ended Year ended 31 December
31 December 20062007 Restated
Balance at beginning of the year 1,149 847Additions 50 1Additions from business combinations – 2Disposals (12) 3Net gain from fair value adjustments 264 139Foreign exchange and other movements 28 157
Balance at end of the year 1,479 1,149
In 2007 additions of £49 million (2006: £1 million) related to Africa long-term business and £1 million (2006: nil) related to Africa bankingbusiness. Of the net gain arising from fair value adjustments on investment properties, £263 million (2006: £137 million) related to Africa long-termbusiness and £1 million (2006: £2 million) related to Africa banking business.
The fair value of investment property leased to third parties under operating leases is as follows:£m
Year ended Year ended 31 December
31 December 20062007 Restated
Freehold 1,471 1,142Long leaseholds – –Short leaseholds 8 7
1,479 1,149
Rental income from investment property 80 87Direct operating expense arising from investment property that generated rental income (25) (21)
55 66
The carrying amount of investment property is the fair value of the property as determined by a registered independent valuer at least every threeyears, and annually by locally qualified staff, having an appropriate recognised professional qualification and recent experience in the location andcategory of the property being valued. Fair values are determined having regard to recent market transactions for similar properties in the samelocation as the Group’s investment property. The Group’s current lease arrangements, which are entered into on an arm’s length basis and which are comparable to those for similar properties in the same location, are taken into account.
Of the total investment property of £1,479 million (2006: £1,149 million), £1,117 million (2006: £802 million) is attributable to South Africa and £362 million (2006: £347 million) to Europe.
20 Operating lease arrangements
(i) The Group as lessee£m
Year ended Year ended31 December 31 December
Minimum lease payments under operating leases recognised as an expense in the year 2007 2006
Banking 46 39Non-banking 30 27
Minimum lease payments 76 66
£m
Year ended 31 December 2007 Year ended 31 December 2006Non- Non-
Banking Banking Total Banking Banking Total
Within one year 56 32 88 45 26 71In the second to fifth years inclusive 281 105 386 234 90 324After five years 262 35 297 236 48 284
599 172 771 515 164 679
Operating lease payments principally represent rentals payable by the Group for the rental of buildings and equipment.
Outstanding commitments under non-cancellableoperating leases, fall due as follows:

Old Mutual plc Annual Report and Accounts 2007Notes to the consolidated financial statements164
20 Operating lease arrangements continued
(ii) The Group as lessor£m
Year ended Year ended31 December 31 December
Assets subject to operating leases 2007 2006
Land 4 3Buildings 24 17Investment property 1,479 1,149
1,507 1,169
£m
Year ended Year ended31 December 31 December
Future minimum lease payments of contracts with tenants 2007 2006
Within one year 51 46In the second to fifth years inclusive 129 115After five years 41 32
221 193
21 Deferred tax assets and liabilities
Deferred income taxes are calculated on all temporary differences at the tax rate applicable to the jurisdiction in which the timing differences arise.
(i) Deferred tax assetsThe movement on the deferred tax assets account is as follows:
£m
Income Foreignstatement (Charged)/ Acquisition/ exchange
1 January (charge)/ credited to disposals of and other 31 December2007 credit equity subsidiaries movements 2007
Insurance funds 125 (57) – – 3 71Tax losses carried forward 337 (231) – – 33 139Accelerated capital allowances 42 – – – (2) 40Available for sale securities – – 50 – (3) 47Other temporary differences 7 322 7 7 13 356Netted against liabilities – (102) – – (21) (123)Deferred fee income – 86 – – 67 153
511 18 57 7 90 683
£m
Income Foreignstatement (Charged)/ Acquisition/ exchange
1 January (charge)/ credited to disposals of and other 31 December2006 credit equity subsidiaries movements 2006
Insurance funds 186 (32) – – (29) 125Tax losses carried forward 241 138 – 2 (44) 337Accelerated capital allowances 95 (44) – – (9) 42Available for sale securities (4) – – – 4 –Other temporary differences (60) 45 (8) 23 7 7
458 107 (8) 25 (71) 511
Notes to the consolidated financial statementsFor the year ended 31 December 2007 continued

Old Mutual plc Annual Report and Accounts 2007Notes to the consolidated financial statements 165
Fina
ncia
ls
21 Deferred tax assets and liabilities continued
(i) Deferred tax assets continuedDeferred tax assets are recognised for tax losses carried forward only to the extent that realisation of the related tax benefit is probable. The amountsfor which no deferred tax asset has been recognised comprise:
£m
31 December 31 December2007 2006
Gross amount Tax Gross amount Tax
Unrelieved tax lossesExpiring within one year – – 39 2Expiring in the second to fifth years inclusive 262 17 75 4Expiring after five years 825 177 1,039 244Accelerated capital allowances 19 6 25 19Other timing differences 207 68 200 73
1,313 268 1,378 342
(ii) Deferred tax liabilitiesThe movement on the deferred tax liabilities account is as follows:
£m
Income Foreignstatement Charged/ Acquisition/ exchange
1 January charge/ (credited) disposals of and other 31 December2007 (credit) to equity subsidiaries movements 2007
Accelerated tax depreciation 5 15 – – 5 25Deferred acquisition costs 338 142 27 – 27 534Leasing 173 (91) – – (2) 80PVIF 311 (63) – – 8 256Other acquired intangibles 109 (11) – – 5 103Available for sale securities 4 – (4) – – –Other temporary differences 453 91 – (1) (114) 429Policyholder Tax – (45) – – 154 109Netted against assets – (102) – – (21) (123)
1,393 (64) 23 (1) 62 1,413
£m
Income Foreignstatement Charged/ Acquisition/ exchange
1 January charge/ (credited) disposals of and other 31 December2006 (credit) to equity subsidiaries movements 2006
Accelerated tax depreciation 2 2 – – 1 5Deferred acquisition costs 302 63 15 – (42) 338Leasing 157 30 – – (14) 173PVIF – (62) – 375 (2) 311Other acquired intangibles – (9) – 119 (1) 109Available for sale securities 18 13 (26) – (1) 4Other temporary differences 132 274 (11) 99 (41) 453
611 311 (22) 593 (100) 1,393
As the Group is able to control the reversal of temporary differences in respect of investments in subsidiaries, branches, associates and JVs and it is probable that these temporary differences will not reverse in the foreseeable future, there is no need to provide for the associated deferred taxliabilities. The aggregate amount of temporary differences on which further tax might be due if these temporary differences reversed would beestimated at £2.2 billion (2006: £1.6 billion).
The figures shown above take into account the proposed reduction in corporation tax rates in Germany and the UK.

Old Mutual plc Annual Report and Accounts 2007Notes to the consolidated financial statements166
22 Investments in associated undertakings
(i) Investments in associated undertakingsThe Group’s investments in associated undertakings accounted for under the equity method are as follows:
£m
Carrying Group shareAt 31 December 2007 Country of operation % interest held value of profit/(loss)
Acturis Ltd United Kingdom 53% 1 –Clidet No. 638 (Pty) Ltd Republic of South Africa 49% 16 –G & C Shelf 31 (Pty) Ltd Republic of South Africa 40% 3 –Kotak Mahindra Old Mutual Life Insurance Ltd India 26% 25 (3)Masingita Property Investment Holdings Republic of South Africa 35% 2 –Visigro Investments (Pty) Ltd Republic of South Africa 30% 4 –Odyssey Developments (Pty) Ltd Republic of South Africa 49% 8 –All other associated undertakings 22 2
81 (1)
All of the above investments in associated undertakings are unlisted. All investments in associated undertakings are equity accounted using financialinformation as at 31 December 2007. The Group’s holding in Acturis Ltd is non-voting preference shares. Consequently as the Group does not havecontrol in Acturis Ltd this Company has not been consolidated.
£m
Carrying Group shareAt 31 December 2006 Country of operation % interest held value of profit/(loss)
Acturis Ltd United Kingdom 53% 1 –Clidet No. 638 (Pty) Ltd Republic of South Africa 49% 12 –G & C Shelf 31 (Pty) Ltd Republic of South Africa 40% 6 –Kimberley Clark Republic of South Africa 50% 19 2Kotak Mahindra Old Mutual Life Insurance Ltd India 26% 12 (6)Masingita Property Investment Holdings Republic of South Africa 35% 2 –Visigro Investments (Pty) Ltd Republic of South Africa 30% 2 –Whirlprops 33 (Pty) Ltd Republic of South Africa 49% 4 3SA Retail Properties Ltd Republic of South Africa 17% 4 –All other associated undertakings 21 7
83 6
All of the above investments in associated undertakings are unlisted.
(ii) Aggregate financial information of investments in associated undertakingsThe aggregate financial information for all investments in associated undertakings is as follows:
£m
Year ended Year ended31 December 31 December
2007 2006
Total assets 428 301Total liabilities 353 263Total revenues 125 80Net (loss)/profit after tax (1) 6
Notes to the consolidated financial statementsFor the year ended 31 December 2007 continued

Old Mutual plc Annual Report and Accounts 2007Notes to the consolidated financial statements 167
Fina
ncia
ls
22 Investments in associated undertakings continued
(iii) Aggregate Group investment in associated undertakings continuedThe aggregate amounts for the Group’s investment in associated undertakings are as follows:
£m
Year ended Year ended31 December 31 December
2007 2006
Balance at beginning of the year 83 93Additions from business combinations – 6Net additions/(disposals) of investment in associated undertakings 8 (13)Share of (loss)/profit after tax (1) 6Dividends paid (8) (9)Foreign exchange and other movements (1) –
Balance at end of the year 81 83
The Group has no significant investments which are accounted for as investment in associated undertakings, for which it owns less than 20 per cent of the ordinary share capital.
(iv) Other Group holdingsThe above does not include companies whereby the Group has a holding of more than 20 per cent, but does not have significant influence over thesecompanies by virtue of the Group not having any direct involvement in decision making or the other owners possessing veto rights.
(v) Contingent liabilitiesThe Group is severally liable for the contingent liabilities relating to investments in associated undertakings of £2 million (2006: £2 million).
23 Deferred acquisition costs£m
Insurance Investment AssetYear end 31 December 2007 contracts contracts management Total
Balance at beginning of the year 1,103 401 74 1,578Acquisition cost deferred on inwards business 364 357 67 788Amortisation (108) (58) (35) (201)Foreign exchange and other movements 70 17 8 95Transfer to assets held-for-sale (7) – – (7)
Balance at end of the year 1,422 717 114 2,253
£m
Insurance Investment Asset Year end 31 December 2006 contracts contracts management Total
Balance at beginning of the year 936 121 32 1,089Acquisition cost deferred on inwards business 378 308 57 743Additions from business combinations – – 4 4Amortisation (115) (15) (11) (141)Foreign exchange and other movements (96) (13) (8) (117)
Balance at end of the year 1,103 401 74 1,578

Old Mutual plc Annual Report and Accounts 2007Notes to the consolidated financial statements168
24 Long-term and general business policyholder liabilities£m
AtAt 31 December
31 December 20062007 Restated
Gross Reinsurance Net Gross Reinsurance Net
Long-term business policyholder liabilitiesInsurance contracts 23,637 (727) 22,910 21,877 (717) 21,160Investment contracts
Unit-linked investment contracts and similar contracts 52,171 (636) 51,535 45,826 (552) 45,274Other investment contracts 1,574 – 1,574 1,512 – 1,512Discretionary participating investment contracts 6,404 – 6,404 5,690 – 5,690
Outstanding claims 465 (31) 434 360 (45) 315
84,251 (1,394) 82,857 75,265 (1,314) 73,951
General insurance liabilitiesClaims incurred but not reported – – – 40 (6) 34Unearned premiums – – – 66 (18) 48Outstanding claims – – – 159 (33) 126
– – – 265 (57) 208
84,251 (1,394) 82,857 75,530 (1,371) 74,159
Of the £1,394 million (2006: £1,371 million) included in reinsurer’s share of long-term and general insurance policy liabilities is an amount of £682 million (2006: £743 million) which is classified as current, the remainder being non-current.
Of the £213 million (2006: £247 million) included in deposits held with reinsurers £183 million (2006: £218 million) is classified as current, the remainder being non-current.
Movements in the amounts outstanding in respect of long-term business policyholder liabilities, other than outstanding claims, are set out below.
(i) Insurance contracts£m
Year ended Year ended31 December 31 December
2007 2006Gross Reinsurance Net Gross Reinsurance Net
Balance at beginning of the year 21,877 (717) 21,160 22,655 (376) 22,279Additions from business combinations – – – 1,149 (68) 1,081Income
Premium income 4,107 (128) 3,979 4,216 (127) 4,089Investment income 1,805 – 1,805 3,066 – 3,066Other income 13 – 13 10 (362) (352)
ExpensesClaims and policy benefits (3,479) 111 (3,368) (2,845) 118 (2,727)Operating expenses (274) – (274) (743) 24 (719)Currency translation loss (33) 10 (23) (4,686) 68 (4,618)Other charges and transfers (160) (10) (170) (690) – (690)Taxation (29) – (29) (53) – (53)
Transfer from/(to) operating profit (190) 7 (183) (202) 6 (196)
Balance at end of the year 23,637 (727) 22,910 21,877 (717) 21,160
Notes to the consolidated financial statementsFor the year ended 31 December 2007 continued

Old Mutual plc Annual Report and Accounts 2007Notes to the consolidated financial statements 169
Fina
ncia
ls
24 Long-term and general business policyholder liabilities continued
(ii) Unit-linked investment contracts and similar contracts, and other investment contracts£m
Year ended Year ended31 December 31December
2007 2006
Balance at beginning of the year 47,338 9,659Additions from business combinations – 31,651New contributions received 9,942 9,588Maturities (729) (694)Withdrawals/surrenders (5,305) (4,196)Fair value movements 455 2,877Foreign exchange and other movements 2,044 (1,547)
Balance at end of the year 53,745 47,338
(iii) Discretionary participating investment contracts£m
Year ended Year ended 31 December 31December
2007 2006
Balance at beginning of the year 5,690 6,230Income
Premium income 515 445Investment income 818 1,419Currency translation gains/(losses) 54 (1,337)Other income 15 –
1,402 527
ExpensesClaims and policy benefits (535) (895)Operating expenses (56) (62)Other charges and transfers (31) (26)Taxation (6) (18)
(628) (1,001)
Transfer to operating profit (60) (66)
Balance at end of the year 6,404 5,690
A maturity analysis of long-term and general insurance policyholder liabilities is shown in the following table:£m
Undiscounted cash flows
More than Balance 3 months Between
sheet Less than less than 1 and 5 More than No contractualAt 31 December 2007 amount 3 months 1 year years 5 years maturity date Total
Long-term business Insurance contracts 23,637 495 2,489 12,475 29,422 3 44,884
Investment contractsUnit-linked investment contracts and similar contracts 52,171 46,171 364 947 5,133 1 52,616Other investment contracts 1,574 433 129 578 1,001 – 2,141Discretionary participating investment contracts 6,404 5,638 3 15 42 – 5,698
Outstanding claims 465 332 47 27 66 1 473
84,251 53,069 3,032 14,042 35,664 5 105,812

Old Mutual plc Annual Report and Accounts 2007Notes to the consolidated financial statements170
24 Long-term and general business policyholder liabilities continued
(iii) Discretionary participating investment contracts continued£m
Undiscounted cash flows
More than Balance 3 months Between
sheet Less than less than 1 and 5 More than No contractualAt 31 December 2006 amount 3 months 1 year years 5 years maturity date Total
Long-term business Insurance contracts 21,877 826 2,248 11,146 27,895 386 42,501
Investment contractsUnit-linked investment contracts and similar contracts 45,826 46,168 15 29 114 – 46,326Other investment contracts 1,512 40 131 572 935 – 1,678Discretionary participating investment contracts 5,690 4,569 5 38 119 – 4,731
Outstanding claims 360 279 12 34 38 – 363
General insurance liabilitiesClaims incurred but not reported 40 19 15 6 – – 40Unearned premiums 66 31 25 10 – – 66Outstanding claims 159 111 40 8 – – 159
75,530 52,043 2,491 11,843 29,101 386 95,864
Insurance contract provisions are calculated based upon assumptions determined in accordance with local accounting requirements. As described in the accounting policies, these vary significantly between geographies and are therefore discussed separately below.
South AfricaIn the calculation of liabilities, provision has been made for:
> the best estimate of future experience, as described below; plus> the compulsory margins as set out in the Actuarial Society of South Africa professional guidance notes; plus> discretionary margins reflecting mainly the excess of capital charges over the compulsory investment margin of 0.25 per cent for policies that
are valued prospectively. These discretionary margins cause capital charges to be included in operating profits as they are charged and ensure that profits are released appropriately over the term of each policy.
Other discretionary margins, mainly held to cover:
> mortality and investment return margins for Group Schemes funeral policies, due to the additional risk associated with this business, and to ensure that profit is released appropriately over the term of the policies;
> expense margins in the pricing basis for Employee Benefits annuities;> profit margins on Employee Benefits non-profit annuities to ensure that profit is released appropriately over the life of the policies;> mortality margins on Individual Business life policies, accidental death supplementary benefits and disability supplementary benefits, due
to uncertainty about future experience;> margins on certain Individual Business non-profit annuities, due to the inability to fully match assets to liabilities as a result of the limited
availability of long-dated bonds; > interest margins on Employee Benefits PHI claims in payment due to the inability to fully match assets to liabilities as a result of the high rate
of change in the portfolio (high volume of new claimants and terminations); and> investment guarantee reserves calculated on a market-consistent basis because they are very sensitive to market interest rates in particular.
Liabilities include provisions to meet financial options and guarantees on a market-consistent basis, and make due allowance for potential lapses and surrenders, based on levels recently experienced. Mortality and disability rates assumed are consistent with Old Mutual’s recent experience, orexpected future experience if this would result in a higher liability. In particular, allowance has been made for the expected deterioration in assuredlives experience due to HIV/AIDS, and for the expected improvement in annuitant mortality.
Notes to the consolidated financial statementsFor the year ended 31 December 2007 continued

Old Mutual plc Annual Report and Accounts 2007Notes to the consolidated financial statements 171
Fina
ncia
ls
24 Long-term and general business policyholder liabilities continued
(iii) Discretionary participating investment contracts continuedThe provision for expenses (before allowing for margins) starts at a level consistent with recent experience and allows for an escalation thereafter.
The future gross investment returns by major asset categories and expense inflation (excluding margins) assumed for South Africa insurance business are as follows:
At At31 December 31 December
2007 2006
Fixed interest securities 8.5% 8.0%Cash 6.5% 6.0%Equities 12.0% 11.5%Properties 10.0% 9.5%
Future expense inflation 5.5%1 5.0%1
1 7.5% (2006: 7%) for Individual Business administered on old platforms and 6.5% (2006: 6%) for Group Schemes business.
For non-profit annuities, liabilities are determined by calculating the present value of projected future benefits and expenses, valued using currentfixed-interest yields or swap curve yields.
Assumptions are based upon experience as analysed in the following investigations:
Type of business Type of investigation Period of investigation
Individual Business Flexi business mortality 2003 to 2006Conventional business mortality 1999 to 2000
Annuitant mortality 2001 to 2004Dread disease 2000 to 2002
Disability 2000 to 2002Persistency 2006
Group Schemes Mortality 2006Persistency 2007
Employee Benefits Annuitant mortality 2000 to 2004Group assurance Ongoing for the purpose of setting scheme rates
All Expenses Reviewed on an annual basis
There were various changes to valuation assumptions, which have resulted in a net increase in the value of insurance contract provisions of £22 million as at 31 December 2007, with a corresponding reduction in profit before tax of the same amount. The most significant item was a £60 million increase (including a discretionary margin) in the reserve for investment guarantees which has been calculated on a market-consistentbasis for the first time. The basis for terminations and alterations was strengthened by £10 million leading to an increase in liabilities. Lower assuredlives mortality and a reduction in retail maintenance expenses reduced the value of liabilities by £21 million and £11 million respectively. Variousmethodology changes reduced the value of liabilities by £12 million.

Old Mutual plc Annual Report and Accounts 2007Notes to the consolidated financial statements172
24 Long-term and general business policyholder liabilities continued
(iii) Discretionary participating investment contracts continued
United StatesInsurance contract provisions and Deferred Acquisition Costs (DAC) balances for traditional insurance products with fixed premiums and benefits(measured according to FAS 60 under US GAAP) are calculated using mortality, lapse, expense and discount assumptions as at inception of thecontract. These assumptions are determined based on management’s best estimate, reflecting actual and expected experience, and also includeprovision for adverse deviation. The assumptions are locked in as of the date of issue, and are revised only where liability adequacy testing based on current best estimate assumptions results in loss recognition.
For insurance products with flexible premiums or benefits (measured according to FAS 97 under US GAAP), the account value is held as the baseinsurance contract provision, and the assumptions below are therefore not applicable. DAC balances, and additional reserves held for items includinglapse guarantees, persistency bonuses and gains followed by losses, utilise best estimate assumptions as of the valuation date.
Mortality rates vary by gender and issue age; lapse rates vary by issue age and duration.
Reserves for life contingent payout annuities are accumulated using the effective interest rate, which is the rate that discounts future liability cashflows back to the gross premium less transaction costs. All other FAS 60 products use a discount rate based on best estimate of future yields at policy inception.
Best estimate assumptions as of December 2007 reflect experience as analysed in the following investigations:
Assumption Period of investigation
Mortality rates – assurance 1994 to 2006Mortality rates – annuities 2004 to 2006Lapse rates 1996 to 2006Expenses 2005
EuropeInsurance contract provisions for the Group’s Europe long-term business are limited, and principally comprise technical provisions for pure disabilityand death benefit cover sold in the United Kingdom and Sweden, together with death benefit risk cover in respect of unit-linked assurance products.
25 Loans and advances
(i) Summary£m
AtAt 31 December
31 December 2006Notes 2007 Restated
Home loans 12,082 9,780Commercial mortgages 4,415 3,392Properties in possession 23 10Credit cards 541 391Overdrafts 990 1,075Policyholder loans 204 192Other loans to clients 4,727 4,839Preference shares and debentures 689 500Net finance leases and instalment debtors 3,866 3,468
Gross investment 4,267 3,741Unearned finance charges (401) (273)
Factoring accounts 36 61Trade, other bills and bankers’ acceptances 135 309Term loans 2,988 2,301Remittances in transit 14 12Deposits placed under reverse purchase agreements 429 490
Gross loans and advances 31,139 26,820
Less provisions for impairment of advancesSpecific provisions 31 (322) (277)Portfolio provision 31 (130) (105)
Total net loans and advances 30,687 26,438
Non-performing loans included above had a book value less impairment provisions of £487 million (2006: £310 million).
Notes to the consolidated financial statementsFor the year ended 31 December 2007 continued

Old Mutual plc Annual Report and Accounts 2007Notes to the consolidated financial statements 173
Fina
ncia
ls
25 Loans and advances continued
(i) Summary continuedImpairment provisions in respect of loans and advances is established when there is objective evidence that a loan or group of loans is impaired,including observable data that come to the attention of the Group about the following loss events:
> significant financial difficulty of the borrower;> a breach of contract, such as a default or delinquency in interest or principal payments;> the Group, for economic or legal reasons relating to the borrower’s financial difficulty, grants to the borrower a concession that the Group would
not otherwise consider;> it becomes probable that the borrower will enter bankruptcy or other financial reorganisation;> the disappearance of an active market for that asset because of financial difficulties; or> observable data indicating that there is a measurable decrease in the estimated future cash flows from a group of loan assets since the initial
recognition of those assets, although the decrease cannot yet be identified with the individual loans, including:– adverse changes in the payment status of borrowers in the group of loans; or– national or local economic conditions that correlate with defaults on the assets in the group of loans.
Of the loans and advances shown above, £10,110 million (2006: £8,731 million) is receivable within one year of the balance sheet date and is regarded as current. £20,577 million (2006: £17,707 million) is regarded as non-current based on the maturity profile of the assets.
The specific provisions for impairment at 31 December 2007 included £296 million (2006: £256 million) relating to non-performing loans and advances made by the banking business.
(ii) Finance lease and instalment debtors£m
Minimum lease Present value of minimumpayments receivable lease payments receivable
At At At 31 December At 31 December
31 December 2006 31 December 2006Amounts receivable under finance leases 2007 Restated 2007 Restated
Within one year 828 726 748 669In the second to fifth years inclusive 3,165 2,990 2,869 2,776After five years 274 25 249 23
4,267 3,741 3,866 3,468Less: unearned finance income (401) (273) – –
Present value of minimum lease payments receivable 3,866 3,468 3,866 3,468
The accumulated allowance for uncollectable minimum lease payments receivable is £131 million (2006: £69 million).
26 Investments and securities£m
At At 31 December
31 December 20062007 Restated
Government and government-guaranteed securities 7,234 8,669Other debt securities, preference shares and debentures
Listed 12,621 11,414Unlisted 4,281 2,832
Equity securitiesListed 21,361 21,432Unlisted 1,015 704
Pooled investmentsListed 7,122 2,465Unlisted 33,069 30,846
Short-term funds and securities treated as investments 3,342 3,307Other 175 246
Total investments and securities 90,220 81,915
Investments and securities are regarded as current and non-current assets based on the intention with which the financial assets are held as well as their contractual maturity profile. Of the amounts shown above, £42,754 million (2006: £33,987 million) is regarded as current and £47,466 million (2006: £47,928 million) are regarded as non-current.

Old Mutual plc Annual Report and Accounts 2007Notes to the consolidated financial statements174
27 Other assets£m
At At 31 December
31 December 20062007 Restated
Debtors arising from direct insurance operationsAmounts owed by policyholders 26 66Amounts owed by intermediaries 88 114Other 43 50
157 230Debtors arising from reinsurance operations 91 –Outstanding settlements 147 1,241Other receivables 772 601Accrued interest and rent 444 260Trading securities and spot positions 273 308Prepayments and accrued income 134 341Other assets 163 125
Total other assets 2,181 3,106
Based on the maturity profile of the above assets, £1,561 million (2006: £1,302 million) is regarded as current and £620 million (2006: £1,804 million) as non-current.
28 Derivative financial instruments – assets and liabilities
The Group utilises the following derivative instruments for both hedging and non-hedging purposes:
Foreign currency, interest rate and equity, or equity index, futures are contractual obligations to receive or pay a net amount based on changes in currency rates or underlying equities, or indices or interest rates or buy or sell foreign currency or a financial instrument on a future date at a specified price established in an organised financial market (an Exchange). Since futures contracts are collateralised by cash or marketable securities and changes in the futures contract value are settled daily with the Exchange, the credit risk is negligible.
Forward rate agreements are individually negotiated interest rate contracts that call for a cash settlement at a future date for the difference between a contracted rate of interest and the current market rate, based on a notional principal amount.
Forward foreign exchange contracts are individually negotiated contracts that require settlement of the pre-agreed currency amounts at a future date.
Currency and interest rate swaps are commitments to exchange one set of cash flows for another. Swaps result in an economic exchange ofcurrencies or interest rates or a combination of both (i.e. cross-currency interest rate swaps). Except for certain currency swaps, no exchange of principal takes place. The Group’s credit risk represents the potential cost to replace the swap contracts if counterparties fail to perform theirobligation. This risk is monitored continuously with reference to the current fair value, a proportion of the notional amount of the contracts and the liquidity of the market. To control the level of credit risk taken, the Group assesses counterparties using the same techniques as for its lending activities.
Foreign currency, interest rate options and equity, or equity index, are contractual agreements under which the writer grants the holder the right, butnot the obligation, either to buy (a call option) or sell (a put option) at or by a set date or during a set period, a specific amount of a foreign currency or a financial instrument or amount of assets determined by reference to an index at a predetermined price. In consideration for the assumption of foreign exchange, interest rate or asset price risk, the seller receives a premium from the purchaser. Options may be either exchange-traded ornegotiated between the Group and a customer (over-the-counter). The Group is exposed to credit risk on purchased options only, and only to theextent of their carrying amount, which is their fair value.
The notional amounts of certain types of financial instruments provide a basis for comparison with instruments recognised on the balance sheet, but do not necessarily indicate the amounts of future cash flows involved or the current fair value of the instruments and, therefore, do not indicate the Group’s exposure to credit or price risks. The derivative instruments become in-the-money or out-of-the-money as a result of fluctuations in market interest rates, foreign exchange rates or asset prices relative to their terms. The aggregate contractual or notional amount of derivative financialinstruments on hand, the extent to which instruments are in-the-money or out-of-the-money and, therefore, the aggregate fair values of derivativefinancial assets and liabilities can fluctuate significantly from time to time.
Notes to the consolidated financial statementsFor the year ended 31 December 2007 continued

Old Mutual plc Annual Report and Accounts 2007Notes to the consolidated financial statements 175
Fina
ncia
ls
28 Derivative financial instruments – assets and liabilities continued
The following tables provide a detailed breakdown of the contractual or notional amounts and the fair values of the Group’s derivative financialinstruments outstanding at year end. These instruments allow the Group and its customers to transfer, modify or reduce their credit, equity market,foreign exchange and interest rate risks.
The Group undertakes transactions involving derivative financial instruments with other financial institutions. Management has established limitscommensurate with the credit quality of the institutions with whom it deals, and manages the resulting exposures such that a default by anyindividual counterparty is unlikely to have a materially adverse impact on the Group.
£m
Notional principals Fair values
At 31 December 2007 Positive values Negative values Assets Liabilities
Equity derivativesOptions written – 3,515 – 171Options purchased 3,443 – 68 –Futures 823 1,831 35 65
4,266 5,346 103 236
Exchange rate contractsForwards 5,765 6,307 917 952Swaps 2,576 1,186 96 71Options purchased 445 – 1 –Futures 193 58 – –Options written – 319 – 2
8,979 7,870 1,014 1,025
Interest rate contractsSwaps 10,153 11,849 294 380Forward rate agreements 2,744 3,454 8 7Options purchased 305 – 2 –Options written – 339 – 42Futures 10,205 10,268 51 25Caps 487 182 2 1
23,894 26,092 357 455
Credit derivativesCredit linked notes 104 – 32 –Credit default swaps – 53 – –
104 53 32 –
Other derivatives 142 287 21 –
Total 37,385 39,648 1,527 1,716

Old Mutual plc Annual Report and Accounts 2007Notes to the consolidated financial statements176
Notes to the consolidated financial statementsFor the year ended 31 December 2007 continued
28 Derivative financial instruments – assets and liabilities continued£m
Notional principals Fair values
At 31 December 2006 Positive values Negative values Assets Liabilities
Equity derivativesOptions written – 5,447 – 271Options purchased 5,768 – 529 –Futures 769 719 12 11
6,537 6,166 541 282
Exchange rate contractsForwards 6,920 6,298 326 288Swaps 607 859 127 33Options purchased 57 53 – –
7,584 7,210 453 321
Interest rate contractsSwaps 8,177 10,035 233 369Forward rate agreements 2,918 2,484 5 3Options purchased 94 283 9 –Options written – 77 – –Futures 514 715 17 12Caps 289 279 1 2
11,992 13,873 265 386
Credit derivativesCredit linked notes 66 50 – –Credit default swaps 50 10 – –
116 60 – –
Other derivatives 182 267 4 82
Total 26,411 27,576 1,263 1,071
The contractual maturities of the derivatives held are as follows:£m
More than Balance Less 3 months Between No contractual
sheet than less than 1 and 5 More than maturityAt 31 December 2007 amount 3 months 1 year years 5 years date Total
Derivative financial liabilities 1,716 1,620 46 15 – 35 1,716
£m
More than Balance Less 3 months Between No contractual
sheet than less than 1 and 5 More than maturityAt 31 December 2006 amount 3 months 1 year years 5 years date Total
Derivative financial liabilities 1,071 44 394 376 215 42 1,071

Old Mutual plc Annual Report and Accounts 2007Notes to the consolidated financial statements 177
Fina
ncia
ls
29 Hedge accounting
Cash flow hedgesCash flow hedge accounting is applied by the Parent Company in respect of the Group’s exposures to foreign currency risk. The Group hedges itsforeign currency risk on two of its existing Euro loan borrowings by entering into foreign currency swaps for USD. These swaps are bifurcated into a Euro/GBP swap and a GBP/USD swap. Cash flow hedge accounting is applied to the Euro/GBP swap. At 31 December the remaining Euro/GBPswaps had a notional principal of £22 million (€30 million) and a minimal fair value. The GBP/USD swap qualifies as a net investment hedge, as discussed below.
During the year, the Group repaid €400 million Eurobond and in turn closed out the €400 million – $349 million swap. The maturity of the finalEUR/USD swap of €30 million is on 11 July 2010 and matches the repayment of the corresponding bond. The cash flow hedge reserve will bereleased to the income statement over the remaining life of the swap to offset the currency movements on the loan.
An analysis of amounts in the financial statements relating to derivatives designated as cash flow hedges is shown in the table below:
£m
At At31 December 31 December
2007 2006
Fair value of derivatives designated as cash flow hedges at the balance sheet dateGMTN4 cross currency interest rate swap – 25GMTN6 cross currency interest rate swap – (2)
– 23
Analysis of movements in cash flow hedge reserveCash flow hedge at beginning of the year 1 2Amount recognised in equity during the year – 1Amount removed from equity and recognised in income statement during the year
Finance costs (borrowed funds) (1) (2)
Cash flow hedge reserve at end of year – 1
In respect of the GMTN4 cross currency swap, cash flows ceased on 10 April 2006. In respect of the GMTN6 cross currency swap, cash flows will occur annually on 11 July until 11 July 2010.
There was no ineffectiveness in respect of either of the above cash flow hedges during the financial year (2006: nil).
Net investment hedgesThe Group uses a combination of currency swaps, forward foreign exchange contracts and debt raised in the currency of the exposure to mitigate thetranslation effect of holding overseas companies. The following table summarises the Group’s open positions with respect to financial instrumentsutilised for net investment hedging purposes.
Open positions at year-end£m
At 31 December 2007 USD ZAR SEK
Forward contracts 38 182 52Currency swaps1 262 – 318Debt2 106 – 161
406 182 531
Open positions at year-end£m
At 31 December 2006 USD ZAR SEK
Forward contracts – 40 202Currency swaps1 195 – 305Debt2 118 – 169
313 40 676
1 Excludes $35 million of currency swaps that do not qualify for hedge accounting.2 Excludes $750 million and €500 million of financial instruments accounted as minority interests or as equity.

Old Mutual plc Annual Report and Accounts 2007Notes to the consolidated financial statements178
Notes to the consolidated financial statementsFor the year ended 31 December 2007 continued
29 Hedge accounting continued
Net investment hedges continuedAn analysis of amounts in the financial statements relating to derivatives designated as net investment hedges is shown in the table below:
£m
At At31 December 31 December
2007 2006
Fair value of financial instruments designated as net investment hedges at the balance sheet dateGMTN4 cross currency interest rate swap – fair value of net investment hedge only – 71GMTN6 cross currency interest rate swap – fair value of net investment hedge only 4 4SEK forward foreign exchange contracts (1) (1)ZAR forward foreign exchange contracts (5) –£300 million cross currency interest rate swap (16) (3)€750 million cross currency interest rate swap (2) –
(20) 71
The GMTN4 and GMTN6 cross currency swaps are designated to hedge the foreign exchange currency exposure to USD assets in respect of theGroup’s investment in its US operations. The ZAR forwards are designated as hedges against the foreign currency risk in respect of the Group’sinvestment in its South African operations. SEK forwards are used to hedge foreign currency risk in respect of the Group’s investment in Skandia. The £300 million cross currency interest rate swap is used to hedge SEK currency risk on SEK based assets in the Group’s net investment in Skandia.
There was no ineffectiveness in respect of any of the above net investment hedges during the financial year (2006: nil).
30 Fair values of financial assets and liabilities
Determination of fair valueAll financial instruments, regardless of their IAS 39 categorisation, are initially recorded at fair value. The fair value of a financial instrument on initial recognition is normally the transaction price, that is, the fair value of the consideration given or received. In certain circumstances, however, the initial fair value may be based on other observable current market transactions in the same instrument, without modification or repackaging, or on a valuation technique whose variables include only observable data.
Subsequent to initial recognition, the fair values of financial instruments measured at fair value that are quoted in active markets are based on offerprices for assets and bid prices for liabilities. When quoted prices are not available, fair values are determined by using valuation techniques that refer as far as possible to observable market data. These include comparison with similar instruments where market observable prices exist,discounted cash flow analysis, option pricing models and other valuation techniques commonly used by market participants.
For certain derivative instruments, fair values may be determined in whole or in part using valuation techniques based on assumptions that are not supported by prices from current market transactions or observable market data.
A number of factors such as bid-offer spread, credit profit, servicing costs and model uncertainty are taken into account, as appropriate, when values are calculated using a valuation technique.
None of the carrying amounts of financial assets and liabilities carried at amortised cost have a fair value significantly different to their carryingamounts.
Loans and advancesThe fair values of loans and advances equate, broadly, to the carrying amount measured on an amortised cost basis.
Investments and securitiesThe fair values of listed investments and securities are based on bid prices. For unlisted investments and securities, fair values are determined using valuation techniques that refer as far as possible to observable market data.
Investment contractsThe approach to determining the fair values of investment contracts is set out in the accounting policies section for insurance and investment contract business.
Amounts owed to bank depositorsThe fair values of amounts owed to bank depositors corresponds with the carrying amount shown in the balance sheet, which generally reflects the amount payable on demand.

Old Mutual plc Annual Report and Accounts 2007Notes to the consolidated financial statements 179
Fina
ncia
ls
30 Fair values of financial assets and liabilities continued
Determination of fair value continued
Borrowed fundsThe fair values of amounts included in borrowed funds are based on quoted market prices at the balance sheet date where applicable, or by reference to quoted prices of similar instruments.
Other financial assets and liabilitiesThe fair values of other financial assets and liabilities are reasonably approximated by the carrying amounts reflected in the balance sheet.
Financial instruments designated as fair value through profit and lossCertain items in the Group’s balance sheet that would otherwise be categorised as loans and receivables under IAS 39 have been designated as fair value through profit or loss. Information relating to the change in fair value of these items as it relates to credit risk is shown in the table below:
£m
Change in fair value due to change in credit risk
Maximum exposure Current
At 31 December 2007 to credit risk financial year Cumulative
Loans and advances 1,768 (8) 1Investments and securities 6,346 (1) (4)Other assets 18 – –
8,132 (9) (3)
£m
Change in fair value due to change in credit risk
Maximum exposure Current
At 31 December 2006 to credit risk financial year Cumulative
Loans and advances 1,982 (2) 8Investments and securities 4,350 1 –Other assets 22 – –
6,354 (1) 8
Certain items in the Group’s balance sheet that would otherwise be categorised as financial liabilities at amortised cost under IAS 39 have beendesignated as fair value through profit or loss. Information relating to the change in fair value of these items as it relates to credit risk is shown in the table below:
£m
Change in fair value due to change in credit risk
Contractual Current maturity
At 31 December 2007 Fair value financial year Cumulative amount
Borrowed funds 1,676 (61) (62) 1,718Amounts owed to bank depositors 4,002 1 1 4,022
5,678 (60) (61) 5,740
£m
Change in fair value due to change in credit risk
Contractual Current maturity
At 31 December 2006 Fair value financial year Cumulative amount
Borrowed funds 1,053 (1) (1) 1,060Amounts owed to bank depositors 705 1 – 705
1,758 – (1) 1,765

Old Mutual plc Annual Report and Accounts 2007Notes to the consolidated financial statements180
Notes to the consolidated financial statementsFor the year ended 31 December 2007 continued
31 Analysis of movements in impairment account
Movements in provisions for impairment by classification are analysed as follows:£m
Year ended Year ended 31 December 31 December
2007 2006
Specific Portfolio Total Specific Portfolio Totalimpairment impairment impairment impairment impairment impairment
Balance at beginning of the yearLoans and advances
At amortised cost 268 105 373 392 72 464At fair value through profit or loss 9 – 9 13 – 13
Other assets 8 1 9 4 1 5
285 106 391 409 73 482
Income statement chargeLoans and advances
At amortised cost 140 23 163 91 48 139At fair value through profit or loss (7) – (7) (2) – (2)
Other assets 5 – 5 7 – 7
138 23 161 96 48 144
Amounts written off against the impairmentLoans and advances
At amortised cost (116) – (116) (174) 8 (166)At fair value through profit or loss – – – – – –
Other assets – – – – – –
(116) – (116) (174) 8 (166)
Recoveries of amounts previously written off Loans and advances
At amortised cost 30 – 30 27 – 27At fair value through profit or loss – – – – – –
Other assets – – – – – –
30 – 30 27 – 27
Foreign exchange and other movementsLoans and advances
At amortised cost (1) 2 1 (68) (23) (91)At fair value through profit or loss (1) – 1 (2) – (2)
Other assets – – – (3) – (3)
(2) 2 – (73) (23) (96)
Balance at end of the yearLoans and advances
At amortised cost 321 130 451 268 105 373At fair value through profit or loss 1 – 1 9 – 9
Other assets 13 1 14 8 1 9
Balance at end of the year 335 131 466 285 106 391
The aggregate amount of non-performing loans and advances on which interest was not being accrued amounted to £483 million (2006: £324 million).

Old Mutual plc Annual Report and Accounts 2007Notes to the consolidated financial statements 181
Fina
ncia
ls
32 Group balance sheet – categories of financial instruments
The analysis of assets and liabilities into their categories as defined in IAS 39 'Financial Instruments: Recognition and Measurement' (IAS 39) is set out in the following table. For completeness, assets and liabilities of a non-financial nature, or financial assets and liabilities that are specificallyexcluded from the scope of IAS 39, are reflected in the non-financial assets and liabilities category.
£m
Fair value through profit and lossAvailable- Financial
for-sale Held-to- liabilities Non-financial Held-for- financial maturity Loans and amortised assets and
At 31 December 2007 Total trading Designated assets investments receivables cost liabilities
AssetsGoodwill and other intangible assets 5,459 – – – – – – 5,459Mandatory reserve deposits with central banks 615 – – – – 615 – –Property, plant and equipment 608 – – – – – – 608Investment property 1,479 – 359 – – – – 1,120Deferred tax assets 683 – – – – – – 683Investment in associated undertakings
and joint ventures 81 – – – – – – 81Deferred acquisition costs 2,253 – – – – – – 2,253Reinsurers’ share of long-term business
policyholder liabilities 1,394 – 638 – – 16 – 740Deposits held with reinsurers 213 – 184 – – 29 – –Loans and advances 30,687 1,912 1,768 – – 27,007 – –Investments and securities 90,220 1,445 75,171 12,524 650 430 – –Current tax receivable 83 – – – – – – 83Client indebtedness for acceptances 165 – – – – – – 165Other assets 2,181 273 66 – – 1,459 – 383Derivative financial instruments – assets 1,527 1,527 – – – – – –Cash and cash equivalents 3,469 – – 1 – 3,468 – –Non-current assets held-for-sale 1,617 – – – – – – 1,617
142,734 5,157 78,186 12,525 650 33,024 – 13,192
LiabilitiesLong-term business policyholder liabilities 84,251 – 53,745 – – – – 30,506Third party interests in consolidation of funds 3,547 – 3,547 – – – – –Borrowed funds 2,353 – 1,676 – – – 677 –Provisions 499 – – – – – – 499Deferred revenue 462 – – – – – – 462Deferred tax liabilities 1,413 – – – – – – 1,413Current tax payable 320 – – – – – – 320Other liabilities 6,180 1,955 435 – – – 3,184 606Liabilities under acceptances 165 – – – – – – 165Amounts owed to bank depositors 31,817 1,187 4,002 – – – 26,628 –Derivative financial instruments – liabilities 1,716 1,716 – – – – – –Non-current liabilities held-for-sale 414 – – – – – – 414
133,137 4,858 63,405 – – – 30,489 34,385

Old Mutual plc Annual Report and Accounts 2007Notes to the consolidated financial statements182
Notes to the consolidated financial statementsFor the year ended 31 December 2007 continued
32 Group balance sheet – categories of financial instruments continued£m
Fair value through profit and lossAvailable- Financial
for-sale Held-to- liabilities Non-financial Held-for- financial maturity Loans and amortised assets and
At 31 December 2006 Total trading Designated assets investments receivables cost liabilities
AssetsGoodwill and other intangible assets 5,367 – – – – – – 5,367Mandatory reserve deposits with central banks 515 – – – – 515 – –Property, plant and equipment 499 – – – – – – 499Investment property 1,149 – 345 – – – – 804Deferred tax assets 511 – – – – – – 511Investment in associated undertakings
and joint ventures 83 – – – – – – 83Deferred acquisition costs 1,578 – – – – – – 1,578Reinsurers’ share of long-term business
policyholder liabilities 1,314 – 552 – – – – 762Reinsurers’ share of general insurance liabilities 57 – – – – – – 57Deposits held with reinsurers 247 – 214 – – 33 – –Loans and advances 26,438 1,688 1,982 – – 22,768 – –Investments and securities 81,915 1,209 67,967 11,832 518 389 – –Current tax receivable 60 – – – – – – 60Client indebtedness for acceptances 188 – – – – – – 188Other assets 3,106 300 91 – – 2,406 – 309Derivative financial instruments – assets 1,263 1,263 – – – – – –Cash and cash equivalents 3,101 – – – – 3,101 – –Non-current assets held-for-sale 1,165 – – – – – – 1,165
128,556 4,460 71,151 11,832 518 29,212 – 11,383
LiabilitiesLong-term business policyholder liabilities 75,265 – 47,338 – – – – 27,927General insurance liabilities 265 – – – – – – 265Third party interests in consolidation of funds 3,041 – 3,041 – – – – –Borrowed funds 1,978 – 1,053 – – – 925 –Provisions 542 – – – – – – 542Deferred revenue 283 – – – – – – 283Deferred tax liabilities 1,393 – – – – – – 1,393Current tax payable 283 – – – – – – 283Other liabilities 7,247 2,177 413 – – – 4,107 550Liabilities under acceptances 188 – – – – – – 188Amounts owed to bank depositors 27,130 1,373 705 – – – 25,052 –Derivative financial instruments – liabilities 1,071 1,071 – – – – – –Non-current liabilities held-for-sale 1,107 – – – – – – 1,107
119,793 4,621 52,550 – – – 30,084 32,538

Old Mutual plc Annual Report and Accounts 2007Notes to the consolidated financial statements 183
Fina
ncia
ls
33 Discontinued operations, assets and liabilities held-for-sale
Discontinued operationsThe results of the Group’s South Africa general insurance business, Mutual & Federal, are shown as a discontinued operation in these financialstatements. The Group is currently in discussions with the investment group, Royal Bafokeng Holdings (Proprietary) Limited (“RBH”) which may or may not result in the sale to RBH of a controlling interest in Mutual & Federal.
An analysis of the results of Mutual & Federal is shown in the segmental income statement in note 3 to the Group financial statements. Furtheranalysis of the results of discontinued operations is given below.
Reconciliation of adjusted operating profit from discontinued operations to profit after tax from discontinued operations£m
Year ended Year ended31 December 31 December
2007 2006
Adjusted operating profit from discontinued operations 89 82Adjusting items from discontinued operations (7) 50
Profit for the financial year before tax from discontinued operations 82 132Income tax expense on discontinued operations (25) (58)
Profit for the financial year after tax on discontinued operations 57 74
Adjusting items from discontinued operations£m
Year ended Year ended31 December 31 December
2007 2006
Goodwill impairment and impact of acquisition accounting (3) (3)Short-term fluctuations in investment return (4) 53
Total adjusting items from discontinued operations (7) 50Tax on adjusting items 3 (15)Minority interest in adjusting items 6 (5)
Adjusting items from discontinued operations after tax and MI 2 30
Adjusted operating profit from discontinued operations attributable to ordinary equity holders£m
Year ended Year ended31 December 31 December
2007 2006
Adjusted operating profit from discontinued operations 89 82Tax on adjusted operating profit from discontinued operations (28) (43)
Adjusted operating profit after tax from discontinued operations 61 39Minority interests – ordinary shares (20) (14)
Adjusted operating profit after tax from discontinued operations attributable to ordinary equity holders 41 25
Net cash flows from discontinued operations£m
Year ended Year ended31 December 31 December
2007 2006
Operating activities 66 91Investing activities (28) 45Financing activities (61) (234)
Net cash outflow (23) (98)

Old Mutual plc Annual Report and Accounts 2007Notes to the consolidated financial statements184
Notes to the consolidated financial statementsFor the year ended 31 December 2007 continued
33 Discontinued operations, assets and liabilities held-for-sale continued
Non-current assets held-for-sale£m
At At31 December 31 December
2007 2006
Loans and advances 994 –Investments and securities 359 669Other assets 232 107Derivative financial instruments – 55Cash and cash equivalents 32 334
1,617 1,165
Non-current liabilities held-for-sale£m
At At31 December 31 December
2007 2006
Long-term business policyholder liabilities – 1,052General insurance liabilities 299 –Other liabilities 115 55
414 1,107
Europe vehicle finance businessSkandia’s Nordic vehicle finance operation, SkandiaBanken Bilfinans, has been sold to DnB NOR. The transfer of business is expected to becompleted in the first part of 2008 and therefore the assets have been classified as held-for-sale as at 31 December 2007. The total consideration of the transaction is £1,100 million.
South Africa general insurance businessThe assets and liabilities of Mutual & Federal have been shown as non-current assets and liabilities held-for-sale as at 31 December 2007.
The Group’s with-profits segment of the savings market in Spain and the Group’s South African banking business interest in a financial solutionsbusiness held-for-sale at 31 December 2006 were sold in 2007.
34 Borrowed funds £m
AtAt 31 December
31 December 2006Notes 2007 Restated
Senior debt securities and term loans 34(i) 461 831Mortgage backed securities 34(ii) 103 –Subordinated debt securities 34(iii) 1,789 1,147
Borrowed funds 2,353 1,978
(i) Senior debt securities and term loans£m
At At31 December 31 December
2007 2006
Floating rate notes1 151 175Fixed rate notes2 44 315Revolving credit facility3 161 226Term loan and other loans 26 9Investment fund borrowings 79 106
Total senior debt securities and term loan 461 831

Old Mutual plc Annual Report and Accounts 2007Notes to the consolidated financial statements 185
Fina
ncia
ls
34 Borrowed funds continued
(i) Senior debt securities and term loans continuedThe maturities of the senior debt securities and term loans are as follows:
£m
Greater than1 year and
Less than less than Greater thanAt 31 December 2007 1 year 5 years 5 years Total
Floating rate notes – 75 76 151Fixed rate notes – 29 15 44Revolving credit facility – 161 – 161Term loans and other loans 17 9 – 26Investment fund borrowings 79 – – 79
Total senior debt securities and term loan 118 252 91 461
At 31 December 2006
Floating rate notes 49 24 102 175Fixed rate notes 265 40 10 315Revolving credit facility – 226 – 226Term loans and other loans – 9 – 9Investment fund borrowings 106 – – 106
Total senior debt securities and term loan 420 299 112 831
Senior debt securities and term loan comprise:1 Floating rate notes
– £13 million note repayable in December 2010, with holders having the option to elect for early redemption every 6 months with coupon referenced against 6 month LIBOR less 0.50 per cent.
– US$150 million repayable September 2014 at 3 month LIBOR plus 0.63 per cent.– US$50 million repayable September 2011 at 3 month LIBOR plus 0.50 per cent.– US$10 million repayable September 2009 at 3 month LIBOR plus 0.35 per cent.– SEK100 million repayable March 2009 at 3 month STIBOR plus 0.20 per cent.– €22 million repayable January 2010 at 3 month EURIBOR plus 0.35 per cent.– SEK50 million repayable March 2010 at 3 month STIBOR plus 0.38 per cent.
2 Fixed rate notes– €30 million Euro bond repayable July 2010, capital and interest swapped into fixed rate US Dollars at 5.28 per cent.– €10 million Euro bond repayable December 2010, capital and interest swapped into floating rate US Dollars at 3 month LIBOR plus 0.95 per cent.– €20 million Euro bond repayable August 2013, capital and interest swapped into floating rate US Dollars at 3 month LIBOR plus 1.30 per cent.
The total fair value of the swap derivatives associated with the Senior notes is £8 million (2006: £101 million). These are recognised as assets and are included within note 28.
3 Revolving credit facilityThe Group has a £1,250 million five-year multi-currency revolving credit facility, which had an original maturity date of September 2010. On 18 August 2007 syndicate banks agreed to extend the maturity date of £1,232 million of the facility by a further 12 months until September 2012. At 31 December 2007 £413 million(2006: £353 million) of this facility was utilised, £161 million (2006: £226 million) in the form of drawn debt and £252 million (2006: £127 million) in the form of irrevocable letters of credit.
(ii) Mortgage backed securities£m
AtAt 31 December
31 December 20062007 Restated
R291 million notes (class A1) repayable 18 November 2039 (11.467 per cent)1 21 –R1.4 billion notes (class A2A) repayable 18 November 2039 (11.817 per cent)1 73 –R98 million notes (class B note) repayable 18 November 2039 (12.067 per cent)1 5 –R76 million notes (class C note) repayable 18 November 2039 (13.317 per cent)1 4 –
103 –
1 Issued on 10 December 2007 (2006: nil) by the Group’s South African banking business and are callable on 18 November 2012.

Old Mutual plc Annual Report and Accounts 2007Notes to the consolidated financial statements186
Notes to the consolidated financial statementsFor the year ended 31 December 2007 continued
34 Borrowed funds continued
(iii) Subordinated debt securities£m
AtAt 31 December
31 December 20062007 Restated
BankingUS$18 million repayable 31 August 2009 (6 month LIBOR less 1.5 per cent)1 9 9R4.0 billion repayable 9 July 2012 (13.0 per cent) – Repaid – 312R1.5 billion repayable 24 April 2016 (7.85 per cent)2 103 107R1.8 billion repayable 20 September 2018 (9.84 per cent)3 135 118R515 million repayable on 4 December 2008 (13.5 per cent)4 39 40R500 million repayable on 30 December 2010 (8.38 per cent)5 34 37R650 million repayable 8 February 2017 (9.03 per cent)6 47 –R1.7 billion repayable 8 February 2019 (8.9 per cent)7 123 –R2.0 billion repayable 6 July 2022 (3 month JIBAR plus 0.47 per cent)8 151 –R500 million repayable 15 August 2017 (3 month JIBAR plus 0.45 per cent)9 37 –R1.0 billion repayable 17 September 2015 (10.54 per cent)10 77 –R500 million repayable 14 December 2017 (3 month JIBAR plus 0.70 per cent)11 37 –R120 million repayable 14 December 2017 (10.38 per cent)12 9 –
801 623OtherR3.0 billion repayable 27 October 2020 (8.9 per cent)13 220 219£300 million repayable 21 January 2016 (5.0 per cent)14 291 291R250 million preference shares repayable 9 June 201115 18 18€750 million repayable 18 January 2017 (4.5 per cent)16 519 –SEK850 million repayable in 2017 – Repaid – 65
1,048 593
Less: banking subordinated debt securities held by other Group companies (60) (69)
Total subordinated liabilities 1,789 1,147
The subordinated notes rank behind the claims against the Group depositors and other unsecured, unsubordinated creditors. None of the Group’ssubordinated notes are secured.
1 This instrument is matched either by advances to clients or covered against exchange rate fluctuations.2 Unsecured secondary callable note was issued 24 April 2005 with a call date of 24 April 2011.3 Unsecured secondary callable note was issued 20 September 2006 at R1.5 billion with a call date of 20 September 2013. On 18 May an additional R0.3 billion
was issued.4 Unsecured callable Bonds issued 10 June 2002.5 Unsecured callable Bonds issued 30 March 2006.6 Unsecured secondary callable note was issued 8 February 2007 with a call date of 8 February 2012.7 Unsecured secondary callable note was issued 8 February 2007 at R1.0 billion. On 19 March 2007 an additional R0.7 billion was issued. 8 Unsecured secondary capital callable note issued 6 July 2007 and has a call date of 6 July 2017.9 This bond issued on 15 August 2007 is an unsecured secondary capital callable floating rate note with a call date 15 August 2012.10 This bond issued on 17 September 2007 is an unsecured fixed rate note with a term of 13 years (non-call 8). 11 This bond issued on 14 December 2007 is a 10 year (non-call 5) floating rate note. After its call date on 14 December 2012 its terms become JIBAR plus 1.70 per cent
until maturity.12 This bond issued on 14 December 2007 is a 10 year (non-call 5) fixed rate note. After its call date its terms become floating 3 month JIBAR plus initial margin
over mid swaps plus 1.0 per cent until maturity.13 These bonds have a maturity date of 27 October 2020 and pay a coupon of 8.92 per cent to 27 October 2015 and 3 month JIBAR plus 1.59 per cent thereafter.
The Group has the option to repay the bonds at par on 27 October 2015 and at 3 monthly intervals thereafter.14 These bonds, issued on 20 January 2006, have a maturity date of 21 January 2016 and pay a coupon of 5.0 per cent to 21 January 2011 and 6 month LIBOR plus
1.13 per cent thereafter. The coupon on the bonds was swapped into floating rate of 6 month STIBOR plus 0.50 per cent. The Group has the option to repay the bonds at par on 21 January 2011 and at 6 monthly intervals thereafter.
15 These preference shares are redeemable on 9 June 2011 and pay a variable cumulative coupon of 61.0 per cent of the Prime Rate as quoted by Nedbank Limited. The Group has the option to redeem the shares at par at any time before the final redemption date but after giving an agreed period of notice.
16 This bond, issued on 16 January 2007, has a maturity date of 18 January 2017 and pays a coupon of 4.5 per cent to 17 January 2012 and 6 month EURIBOR plus 0.96 per cent thereafter. The principal and coupon on the bond was swapped equally into Sterling and US Dollars with coupons of 6 month STIBOR plus 0.34 per cent and 6 month US LIBOR plus 0.31 per cent respectively. The Group has the option to repay the bonds at par on 17 January 2012 and at 6 monthly intervals thereafter.

Old Mutual plc Annual Report and Accounts 2007Notes to the consolidated financial statements 187
Fina
ncia
ls
35 Provisions£m
At At 31 December 31 December
2007 2006
Surplus property 29 41Client compensation 19 8Warranties on sale of business 87 113Liability for long service leave 34 30Other provisions 329 337
498 529Post employment benefits 1 13
Total 499 542
£m
Warranties Liability forSurplus Client on sale of long service
Year ended 31 December 2007 property compensation business leave Other Total
Balance at beginning of the year 41 8 113 30 337 529Unused amounts reversed (3) (1) (11) – (6) (21)Unwind of discount 2 – – – – 2Charge to income statement – 20 – 4 23 47Utilised during the year (8) (8) (15) (2) (33) (66)Foreign exchange and other movements (3) – – 2 8 7
Balance at end of the year 29 19 87 34 329 498
At 31 December 2007 provisions in relation to sale of business were £87 million (2006: £113 million). These principally relate to warranties in respect of the sale of American Skandia to Prudential Financial, recognised by the Group upon acquisition of Skandia.
At 31 December 2007 Other provisions include £71 million (2006: £115 million) in respect of the distribution of proceeds arising upon the closureof the unclaimed shares trusts. Further information is included in note 4 (vii). Also included in this amount are provisions for ongoing litigation across the Group totalling £64 million (2006: £71 million).
£m
Warranties Liability forSurplus Client on sale of long service
Year ended 31 December 2006 property compensation business leave Other Total
Balance at beginning of the year 54 10 20 35 123 242Additions from business combinations 3 – 102 – 146 251Unused amounts reversed (5) (2) (6) – (15) (28)Unwind of discount 2 – – – – 2Charge to income statement 1 1 – 3 136 141Utilised during the year (14) (1) (3) (1) (39) (58)Foreign exchange and other movements – – – (7) (14) (21)
Balance at end of the year 41 8 113 30 337 529
Included in the above are amounts of £78 million (2006: £116 million) that are expected to be settled in less than one year.

Old Mutual plc Annual Report and Accounts 2007Notes to the consolidated financial statements188
Notes to the consolidated financial statementsFor the year ended 31 December 2007 continued
36 Deferred revenue£m
Year endedYear ended 31 December
31 December 20062007 Restated
Long-term Asset Long-term Assetbusiness management Total business management Total
Balance at beginning of the year 201 82 283 68 44 112Fees and commission income deferred 149 52 201 143 60 203Amortisation (10) (31) (41) (10) (21) (31)Foreign exchange and other movements 10 9 19 – (1) (1)
Balance at end of the year 350 112 462 201 82 283
37 Other liabilities£m
AtAt 31 December
31 December 20062007 Restated
Amounts payable on direct insurance businessFunds held under reinsurance business ceded 325 26Amounts owed to policyholders 708 524Amounts owed to intermediaries 54 55Other direct insurance operation creditors 3 34
Accounts payable on reinsurance business 29 338Accruals and deferred income 713 553Share-based payments – cash-settled scheme liabilities 26 36Short trading securities and spot positions 1,952 2,177Trade creditors 278 637Outstanding settlements 1,078 1,948Total securities sold under agreements to repurchase 304 290Other liabilities 710 629
6,180 7,247
Included in the amounts shown above are £4,865 million (2006: £4,436 million) that are regarded as current, the remainder as non-current.

Old Mutual plc Annual Report and Accounts 2007Notes to the consolidated financial statements 189
Fina
ncia
ls
38 Amounts owed to bank depositors£m
AtAt 31 December
31 December 20062007 Restated
Current accounts 7,303 6,806Savings deposits 1,024 978Other deposits and loan accounts
Call and term deposits 10,568 8,374Fixed deposits 1,792 1,656Cash management deposits 3,081 2,834Other 3,268 3,010
Negotiable certificates of deposit 4,129 2,650Deposits received under repurchase agreements 652 822
31,817 27,130
A contractual maturity analysis of the amounts owed to bank depositors is shown in the following table:£m
More than3 months
Balance sheet Less than less than Between More than No contractualYear ended 31 December 2007 amount 3 months 1 year 1 and 5 years 5 years maturity date Total
Amounts owed to bank depositorsCurrent accounts 7,303 7,267 19 17 – – 7,303Savings deposits 1,024 1,024 – – – – 1,024Other deposits and loan accounts 18,709 15,765 2,389 861 53 – 19,068Negotiable certificates of deposit 4,129 1,648 2,555 325 – – 4,528Deposits received under repurchase agreements 652 652 – – – – 652
Amounts owed to bank depositors 31,817 26,356 4,963 1,203 53 – 32,575
£m
More than3 months
Balance sheet Less than less than Between More than No contractualYear ended 31 December 2006 amount 3 months 1 year 1 and 5 years 5 years maturity date Total
Amounts owed to bank depositorsCurrent accounts 6,806 6,806 – – – – 6,806Savings deposits 978 978 – – – – 978Other deposits and loan accounts 15,874 13,795 1,672 463 54 24 16,008Negotiable certificates of deposit 2,650 1,306 1,936 330 1 – 3,573Deposits received under repurchase agreements 822 822 – – – – 822
Amounts owed to bank depositors 27,130 23,710 3,608 793 55 24 28,190

Old Mutual plc Annual Report and Accounts 2007Notes to the consolidated financial statements190
Notes to the consolidated financial statementsFor the year ended 31 December 2007 continued
39 Equity
(i) Share capital£m
At At31 December 31 December
Authorised and issued share capital 2007 2006
Authorised ordinary shares of 10p each 750 750Issued ordinary shares of 10p each 551 550
The Company’s authorised share capital was increased to £750 million, divided into 7,500,000,000 ordinary shares of 10p each in accordance with a resolution of shareholders passed at an Extraordinary General Meeting on 14 November 2005, conditional upon the Company’s offer toacquire Försäkringsaktiebolaget Skandia (publ) becoming or being declared wholly unconditional. This condition was satisfied on 26 January 2006.
(ii) Perpetual preferred callable securitiesIn addition to the Group’s senior and subordinated debt, the Group issued perpetual preferred callable securities during 2005 with a total carryingvalue of £688 million as at 31 December 2007. In accordance with IFRS accounting standards these instruments are classified as equity anddisclosed within equity shareholders’ funds as shown on page 117.
On 24 March 2005 the Group issued £350 million of perpetual preferred callable securities. These are unsecured and subordinated to the claims of senior creditors and the holders of any priority preference shares. For an initial period to 24 March 2020 interest is payable at a fixed rate of 6.4 per cent per annum annually in arrears. From 24 March 2020 interest is reset semi-annually at 2.2 per cent per annum above the Sterling inter-bank offer rate for six month Sterling deposits, and is payable semi-annually in arrears. Coupon payments may be deferred at the Group’sdiscretion. The perpetual preferred callable securities are redeemable at the discretion of the Group at their principal amount from 24 March 2020.
On 4 November 2005 the Group issued further perpetual preferred callable securities in the form of €500 million Step-up Option B UndatedSubordinated Notes issued under a Global Note Programme. These are unsecured and subordinated to the claims of senior creditors and the holdersof any priority preference shares. For an initial period to 4 November 2015 the notes pay interest at a fixed rate of 5.0 per cent per annum annually in arrears. After this date the interest is reset semi-annually at 2.63 per cent per annum above six month EURIBOR and is payable semi-annually in arrears. Coupon payments may be deferred at the Group’s discretion. The perpetual preferred callable securities are redeemable at the discretion of the Group at their principal amount from 4 November 2015.
(iii) Share buy back programmeOn 3 October 2007 the Company announced a share buy back programme involving the repurchase of shares to a total value of approximately £350 million. The transactions are a combination of on-market purchases on the London Stock Exchange and purchases on the JSE Limitedpursuant to one of the contingent purchase contracts approved by shareholders at the 2007 Annual General Meeting. The repurchases are beingfinanced using the Company’s internal resources. The shares repurchased have not been cancelled and are held by the Company as treasury shares.
As at 31 December 2007 there had been 74,153,587 shares repurchased on the LSE at an average price paid of 165.7p and 30,947,472 sharesrepurchased on the JSE at an average price paid of Rand 23.14.
40 Minority interests – balance sheet
(i) Ordinary shares£m
Year to Year to31 December 31 December
Reconciliation of movements in minority interests 2007 2006
Balance at beginning of the year 848 1,012Minority interests’ share of profit 224 207Minority interests’ share of dividends paid (115) (110)Net acquisition/(disposal) of interests 1 (11)Foreign exchange and other movements (25) (250)
Balance at end of the year 933 848

Old Mutual plc Annual Report and Accounts 2007Notes to the consolidated financial statements 191
Fina
ncia
ls
40 Minority interests – balance sheet continued
(ii) Preferred securities£m
At At31 December 31 December
2007 2006
R2,000 million non-cumulative preference shares1 140 140R792 million non-cumulative preference shares2 71 71R300 million non-cumulative preference shares3 22 22US$750 million cumulative preferred securities4 458 458R364 million non-cumulative preference shares5 25 –
716 691Unamortised issue costs (13) (13)
Total in issue at 31 December 703 678
Preferred securities are held at historic value of consideration received less unamortised issue costs.
1 200 million R10 preference shares issued by Nedbank Group Limited (Nedbank), the Group’s banking subsidiary. These shares are non-redeemable and non-cumulative and pay a cash dividend equivalent to 75 per cent of the prime overdraft interest rate of Nedbank. Preference shareholders are only entitled to vote during periods when a dividend or any part of it remains unpaid after the due date for payment or when resolutions are proposed that directly affect any rights attaching to the shares or the rights of the holders. Preference shareholders will be entitled to receive their dividends in priority to any payment of dividends made in respect of any other class of Nedbank’s shares.
2 77.3 million R10 preference shares issued at R10.68 per share by Nedbank on the same terms as the securities described in (1) above.3 30 million R10 preference shares issued on 22 June 2006 by Imperial Bank Limited a subsidiary of Nedbank Limited, on the same terms as the securities described in
(1) above.4 US$750 million Guaranteed Cumulative Perpetual Preference Securities issued on 19 May 2003 by Old Mutual Capital Funding L.P., a subsidiary of the Group. Subject to
certain limitations, holders of these securities are entitled to receive preferential cash distributions at a fixed rate of 8.0 per cent per annum payable in arrears on a quarterlybasis. The Group may defer payment of distributions at its sole discretion, but such an act may restrict Old Mutual plc from paying dividends on its ordinary shares for a period of 12 months. Arrears of distributions are payable quarterly cumulatively only on redemption of the securities or at the Group’s option. The securities are perpetual, but may be redeemed at the discretion of the Group from 22 December 2008. The costs of issue are being amortised over the period to 22 December 2008.
5 35 million R10 preference shares issued on 16 April 2007 at R10.27 per share by Nedbank on the same terms as the securities described in (1) above.
41 Post employment benefits
The Group operates a number of pension schemes around the world. These schemes have been designed and are administered in accordance withlocal conditions and practices in the countries concerned and include both defined contribution and defined benefit schemes. The assets of theseschemes are held in separate trustee administered funds. Pension costs and contributions relating to defined benefit schemes are assessed inaccordance with the advice of qualified actuaries. Actuarial advice confirms that the current level of contributions payable to each pension scheme,together with existing assets, are adequate to secure members’ benefits over the remaining service lives of participating employees. The schemes arereviewed at least on a triennial basis or in accordance with local practice and regulations. In the intervening years the actuary reviews the continuingappropriateness of the assumptions applied. The actuarial assumptions used to calculate the projected benefit obligations of the Group’s pensionschemes vary according to the economic conditions of the countries in which they operate.

Old Mutual plc Annual Report and Accounts 2007Notes to the consolidated financial statements192
Notes to the consolidated financial statementsFor the year ended 31 December 2007 continued
41 Post employment benefits continued
The discontinued operation is included below.
(i) Liability for defined benefit obligations £m
Other post-retirementPension plans benefit schemes
Year to Year to Year to Year to31 December 31 December 31 December 31 December
2007 2006 2007 2006
Changes in projected benefit obligationProjected benefit obligation at beginning of the year 758 497 133 152Additions from business combinations – 304 – –Benefits earned during the year 8 10 4 4Interest cost on benefit obligation 38 36 10 9Plan amendments/assumption changes – (1) – –Actuarial (gain)/loss (47) (2) (3) 2Benefits paid (34) (31) (5) (4)Foreign exchange and other movements (48) (55) (11) (30)
Projected benefit obligation at end of the year 675 758 128 133
Change in plan assetsPlan assets at fair value at beginning of the year 836 508 139 152Additions from business combinations – 333 – –Actual return on plan assets 82 88 16 18Company contributions 14 14 – 2Employee contributions 1 1 – –Benefits paid (33) (29) (4) (4)Foreign exchange and other movements (45) (79) (17) (29)
Plan assets at fair value at end of the year 855 836 134 139
Net liability recognised in balance sheetFunded status of plan (180) (78) (6) (6)Unrecognised assets 84 16 – –Other amounts recognised in balance sheet – – 3 1Unrecognised actuarial gains 83 65 21 13
Net amount recognised in balance sheet (13) 3 18 8
(ii) Expense recognised in the income statement£m
Other post-retirementPension plans benefit schemes
Year to Year to Year to Year to31 December 31 December 31 December 31 December
2007 2006 2007 2006
Current service costs 7 8 4 5Interest cost 28 29 10 9Expected return on plan assets (43) (38) (10) (9)Net actuarial losses recognised in the year 5 1 – (1)
Total (included in staff costs) (3) – 4 4
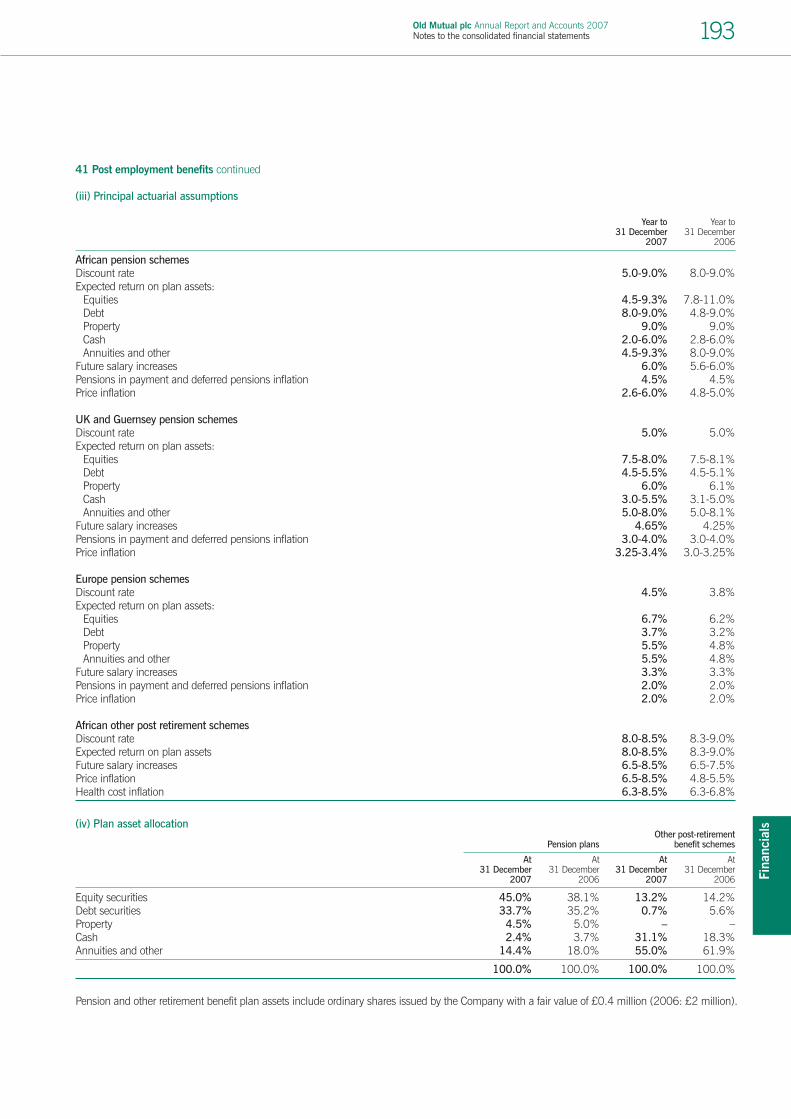
Old Mutual plc Annual Report and Accounts 2007Notes to the consolidated financial statements 193
Fina
ncia
ls
41 Post employment benefits continued
(iii) Principal actuarial assumptions
Year to Year to31 December 31 December
2007 2006
African pension schemesDiscount rate 5.0-9.0% 8.0-9.0%Expected return on plan assets:
Equities 4.5-9.3% 7.8-11.0%Debt 8.0-9.0% 4.8-9.0%Property 9.0% 9.0%Cash 2.0-6.0% 2.8-6.0%Annuities and other 4.5-9.3% 8.0-9.0%
Future salary increases 6.0% 5.6-6.0%Pensions in payment and deferred pensions inflation 4.5% 4.5%Price inflation 2.6-6.0% 4.8-5.0%
UK and Guernsey pension schemesDiscount rate 5.0% 5.0%Expected return on plan assets:
Equities 7.5-8.0% 7.5-8.1%Debt 4.5-5.5% 4.5-5.1%Property 6.0% 6.1%Cash 3.0-5.5% 3.1-5.0%Annuities and other 5.0-8.0% 5.0-8.1%
Future salary increases 4.65% 4.25%Pensions in payment and deferred pensions inflation 3.0-4.0% 3.0-4.0%Price inflation 3.25-3.4% 3.0-3.25%
Europe pension schemesDiscount rate 4.5% 3.8%Expected return on plan assets:
Equities 6.7% 6.2%Debt 3.7% 3.2%Property 5.5% 4.8%Annuities and other 5.5% 4.8%
Future salary increases 3.3% 3.3%Pensions in payment and deferred pensions inflation 2.0% 2.0%Price inflation 2.0% 2.0%
African other post retirement schemesDiscount rate 8.0-8.5% 8.3-9.0%Expected return on plan assets 8.0-8.5% 8.3-9.0%Future salary increases 6.5-8.5% 6.5-7.5%Price inflation 6.5-8.5% 4.8-5.5%Health cost inflation 6.3-8.5% 6.3-6.8%
(iv) Plan asset allocationOther post-retirement
Pension plans benefit schemes
At At At At31 December 31 December 31 December 31 December
2007 2006 2007 2006
Equity securities 45.0% 38.1% 13.2% 14.2%Debt securities 33.7% 35.2% 0.7% 5.6%Property 4.5% 5.0% – –Cash 2.4% 3.7% 31.1% 18.3%Annuities and other 14.4% 18.0% 55.0% 61.9%
100.0% 100.0% 100.0% 100.0%
Pension and other retirement benefit plan assets include ordinary shares issued by the Company with a fair value of £0.4 million (2006: £2 million).

Old Mutual plc Annual Report and Accounts 2007Notes to the consolidated financial statements194
Notes to the consolidated financial statementsFor the year ended 31 December 2007 continued
41 Post employment benefits continued
(v) Summary of Group pension plans£m
Year to Year to31 December 31 December
2007 2006
Present value of defined benefit obligations (675) (758)Fair value of plan assets 855 836
Surplus 180 78
Experience losses arising on defined benefit plan liabilities:Amount (5) (12)As a percentage of plan liabilities 0.7% 1.6%Experience gains arising on defined benefit plan assets:Amount 39 50As a percentage of plan assets 4.3% 6.0%
42 Share-based payments
(i) Share-based payment arrangementsDuring the year ended 31 December 2007, the Group had the following share-based payment arrangements:
Description of award Contractual life Vesting conditions
Restricted Dividend ServiceScheme1 shares Options entitlement Other Years (years) Performance (measure) Other
UK Sharesave Scheme – ✓ ✓ ✓2 31⁄2 - 51⁄2 3 & 5 – –
UK Share Option and Deferred Delivery Plan – ✓ ✓ – 6 3 Target growth in EPS –
UK Restricted Share Plan ✓ – ✓ – 3 - 5 3 & 5 – –
South Africa Share Option and Deferred Delivery Plan – ✓ ✓ – 6 3 Target growth in EPS –
South Africa Restricted Share Plan ✓ – ✓ – 5 3 – –
OMSA Broad-based Employee Scheme ✓ – ✓ – 5 – – ✓3
OMSA Senior Black Management Scheme ✓ – ✓ – 4 - 6 4, 5 & 64 – –
OMSA Management Scheme ✓ ✓ ✓ – 3 - 6 3 Target growth in EPS5 –
OMSA Black Business Partners Scheme ✓ – ✓ – 10 – – ✓6
OMSA Client & Distributor Scheme ✓ – ✓ – 10 – – ✓7
OMSA Community Scheme ✓ – ✓ – 10 – – ✓7
Old Mutual Namibia Management Scheme ✓ ✓ ✓ – 3 - 6 3 – –
Old Mutual Namibia Senior Black Management Scheme ✓ – ✓ – 4 - 6 4, 5 & 64 – –
Old Mutual Namibia Broad-based Employee Scheme ✓ – ✓ – 5 – – ✓6
Old Mutual Namibia Education Scheme ✓ – ✓ – 10 – – ✓6
Old Mutual Namibia Distributor Scheme ✓ – ✓ – 10 – – ✓6
Old Mutual Namibia Community Partners Scheme ✓ – ✓ – 10 – – ✓6
Old Mutual Namibia Black Business Partners Scheme ✓ – ✓ – 10 – – ✓6
Old Mutual Namibia Discretionary Scheme ✓ – – – 10 – – ✓6
Target growth in Nedcor Group (1994) Share Option Scheme – ✓ ✓ – 6 3 & 48 headline earnings –
Nedbank Group (2005) Share Option Scheme – ✓ ✓ – 5 3 – –

Old Mutual plc Annual Report and Accounts 2007Notes to the consolidated financial statements 195
Fina
ncia
ls
42 Share-based payments continued
(i) Share-based payment arrangements continued
Description of award Contractual life Vesting conditions
Restricted Dividend ServiceScheme1 shares Options entitlement Other Years (years) Performance (measure) Other
Nedbank Group (2005) Matched Share Scheme ✓ – – ✓9 5 3 Various10 –
Nedbank Eyethu Non-Executive Directors’ Scheme – ✓ ✓ – 6 6 – ✓11
Nedbank Eyethu Black Executive Scheme ✓ ✓ ✓ – 7 4, 5 & 64 – –
Nedbank Eyethu Black Management Scheme ✓ ✓ ✓ – 7 4, 5 & 64 – –
Nedbank Eyethu Broad-based Employee Scheme ✓ – ✓ – 5 – – ✓6
Nedbank Eyethu Black Business Partner Scheme – ✓ ✓ – 10 – – ✓6,11
Nedbank Eyethu Retail Scheme ✓ – – ✓12 3 – – ✓13
Nedbank Eyethu Corporate Scheme – ✓ ✓ – 6 – – ✓14
Nedbank Namibia Omufima Black Management Scheme ✓ ✓ ✓ – 7 4, 5 & 64 – –
Nedbank Namibia Omufima Broad-based Employee Scheme ✓ – ✓ – 5 – – ✓6
Nedbank Namibia Omufima Black Business Partner Scheme – ✓ ✓ – 10 – – ✓6,11
Nedbank Namibia Omufima Affinity Group Scheme – ✓ ✓ – 10 – – ✓6,11
Nedbank Namibia Omufima Education Scheme – ✓ ✓ – 10 – – ✓6,11
Target growth in Nedbank UK Long-term Incentive Plan – – – ✓15 4 3 average RoE –
Mutual & Federal Share Option Scheme – ✓ ✓ – 6 3 – –
Mutual & Federal Senior Black Management Scheme ✓ – ✓ – 7 4, 5 & 64 – –
Mutual & Federal Management Incentive Scheme ✓ ✓ ✓ – 6 3 – –
Mutual & Federal Distributor Scheme ✓ – ✓ – Indefinite – – ✓7
Mutual & Federal Community Scheme ✓ – ✓ – Indefinite – – ✓7
Mutual & Federal Black Business Partners Scheme ✓ – – – 10 – – ✓6

Old Mutual plc Annual Report and Accounts 2007Notes to the consolidated financial statements196
Notes to the consolidated financial statementsFor the year ended 31 December 2007 continued
42 Share-based payments continued
(i) Share-based payment arrangements continued
Description of award Contractual life Vesting conditions
Restricted Dividend ServiceScheme1 shares Options entitlement Other Years (years) Performance (measure) Other
Mutual & Federal Broad-based Employee Scheme ✓ – ✓ – 5 – – ✓6
Mutual & Federal Namibia Share Option Scheme – ✓ ✓ – 6 3 – –
Mutual & Federal Namibia Senior Black Management Scheme ✓ – ✓ – 7 4, 5 & 64 – –
Mutual & Federal Namibia Community Scheme ✓ – ✓ – Indefinite – – ✓7
Mutual & Federal Namibia Black Business Partners Scheme ✓ – – – 10 – – ✓6
Mutual & Federal Namibia Management Incentive Scheme ✓ ✓ ✓ – 6 3 – –
Mutual & Federal Namibia Broad-based Employee Scheme ✓ – ✓ – 5 – – ✓6
Mutual & Federal Discretionary Scheme ✓ – – – 10 – – ✓6
1 All share-based payment arrangements are equity settled with the exception of the South Africa Share Option and Deferred Delivery Plan and the South Africa RestrictedShare Plan which are cash-settled. ‘UK’ schemes relate to shares in Old Mutual plc listed on the London Stock Exchange. ‘South Africa’, ‘OMSA’ and ‘Old Mutual’ schemesrelate to shares in Old Mutual plc listed on the Johannesburg Stock Exchange (“JSE”). ‘Nedcor’ and ‘Nedbank’ schemes relate to shares in Nedbank Group Ltd listed on theJSE. ‘Mutual & Federal’ schemes relate to shares in Mutual & Federal Insurance Company Ltd listed on the JSE. Details of schemes related to US Asset Management areprovided in note 42 (vi).
2 Scheme is linked to a savings plan.3 Earlier of five years or participant being entitled to any other award under any other share incentive scheme of the Company.4 One third of the instruments granted become unrestricted after each of these time periods.5 Performance target applies to options only.6 Expiry of the contractual life.7 Minimum period of ten years.8 One half of the instruments granted become unrestricted after each of these time periods.9 Matching contributions made by the participant of an amount not more than 50 per cent of their after-tax bonus.10 Where performance targets are not met, 50 per cent of the instruments granted will become unrestricted.11 No dealing in these instruments during the notional funding period.12 For every three shares acquired, participants qualify for an additional bonus share.13 Participant holds a Nedbank Group Ltd account as their primary account for the contractual life of the instrument.14 Participant uses Nedbank Group Ltd as their primary banker for contractual life of the instrument. Nedbank has first right of refusal over all banking requirements.15 Share appreciation rights "SAR" scheme, where Nedbank will settle the difference between the current market price and the exercise price in cash, when the employee
decides to exercise the SAR.
(ii) Reconciliation of movements in optionsThe number and weighted average exercise prices of share options is as follows:
Year ended Year ended31 December 31 December
2007 2006
Weighted Weighted Number average Number average
Options over shares in Old Mutual plc (London Stock Exchange) of options exercise price of options exercise price
Outstanding at beginning of the year 28,763,896 £1.04 38,512,802 £0.92Granted during the year 11,642,305 £1.51 3,023,519 £1.81Forfeited during the year (873,287) £1.39 (1,422,453) £1.03Exercised during the year (9,047,035) £0.92 (11,279,079) £0.85Expired during the year (217,812) £1.57 (70,893) £1.08
Outstanding at end of the year 30,268,067 £1.24 28,763,896 £1.04
Exercisable at 31 December 11,700,076 £0.93 12,746,176 £0.92
The options outstanding at 31 December 2007 have an exercise price in the range of £0.60 to £1.99 (2006: £0.60 to £1.99) and a weightedaverage remaining contractual life of 3.0 years (2006: 2.8 years). The weighted average share price at date of exercise for options exercised during the year was £1.68 (2006: £1.83).

Old Mutual plc Annual Report and Accounts 2007Notes to the consolidated financial statements 197
Fina
ncia
ls
42 Share-based payments continued
(ii) Reconciliation of movements in options continuedYear ended Year ended
31 December 31 December2007 2006
Weighted Weighted Number average Number average
Options over shares in Old Mutual plc (Johannesburg Stock Exchange) of options exercise price of options exercise price
Outstanding at beginning of the year 37,090,128 R15.47 64,978,907 R14.13Granted during the year 7,565,967 R23.28 8,733,523 R21.81Forfeited during the year (688,282) R14.45 (1,115,896) R15.24Exercised during the year (10,075,116) R12.41 (33,584,977) R14.47Expired during the year (188,543) R17.90 (1,921,429) R20.16
Outstanding at end of the year 33,704,154 R18.15 37,090,128 R15.47
Exercisable at 31 December 16,199,844 R14.08 5,277,087 R14.86
The options outstanding at 31 December 2007 have an exercise price in the range of R10.80 to R24.78 (2006: R10.80 to R24.78) and a weighted average remaining contractual life of 3.5 years (2006: 3.7 years). The weighted average share price at date of exercise for optionsexercised during the year was R24.35 (2006: R21.24).
Year ended Year ended31 December 31 December
2007 2006
Weighted Weighted Number average Number average
Options over shares in Nedbank Group Ltd of options exercise price of options exercise price
Outstanding at beginning of the year 42,641,399 R108.04 43,557,432 R102.80Granted during the year 8,101,157 R141.14 8,435,773 R117.71Forfeited during the year (2,591,584) R88.30 (2,367,175) R83.27Exercised during the year (3,591,323) R80.82 (2,429,160) R80.20Expired during the year (61,665) R74.81 (4,555,471) R96.54
Outstanding at end of the year 44,497,984 R86.94 42,641,399 R108.04
Exercisable at 31 December 2,197,789 R93.52 3,645,448 R101.40
The options outstanding at 31 December 2007 have an exercise price in the range of R45.00 to R282.58 (2006: nil to R172.67) and a weightedaverage remaining contractual life of 2.9 years (2006: 3.2 years). The weighted average share price at date of exercise for options exercised duringthe year was R143.43 (2006: R124.00).
Year ended Year ended31 December 31 December
2007 2006
Weighted Weighted Number average Number average
Options over shares in Mutual & Federal Insurance Company Ltd of options exercise price of options exercise price
Outstanding at beginning of the year 7,234,000 R18.82 7,783,050 R18.24Granted during the year 317,700 R26.04 1,873,200 R24.30Forfeited during the year (305,500) R19.34 (504,550) R20.78Exercised during the year (825,500) R8.18 (1,917,700) R7.57
Outstanding at end of the year 6,420,700 R14.49 7,234,000 R18.82
Exercisable at 31 December 1,206,900 R8.55 903,400 R4.17
The options outstanding at 31 December 2007 have an exercise price in the range of R3.50 to R27.99 (2006: R3.35 to R29.99) and a weightedaverage remaining contractual life of 3.7 years (2006: 4.5 years). The weighted average share price at date of exercise for options exercised duringthe year was R27.12 (2006: R30.67).

Old Mutual plc Annual Report and Accounts 2007Notes to the consolidated financial statements198
Notes to the consolidated financial statementsFor the year ended 31 December 2007 continued
42 Share-based payments continued
(iii) Measurements and assumptions The recognition and measurement principles in IFRS 2 have only been applied to equity settled share arrangements granted post November 2002 in accordance with the transitional provisions in IFRS 1 and IFRS 2. Any options forfeited, exercised or lapsed prior to the IFRS 2 implementation date of 1 January 2005 have not been included in the IFRS 2 valuation.
The fair value of services received in return for share options granted are measured by reference to the fair value of share options granted. Theestimate of the fair value of share options granted is measured using a Black-Scholes option pricing model.
Share options are granted under a service and non-market based performance condition. Such conditions are not taken into account in the grant date fair value measurement of the share options granted. There are no market conditions associated with the share option grants.
The grant date for the UK and SA Share Option and Deferred Delivery Plan annual awards is deemed to be 1 January in the year prior to the date ofissue. As such the Group is required to estimate, at the reporting date, the number and fair value of the options that will be granted in the followingyear. The fair value of awards expected to be granted in 2008 which will have an IFRS 2 grant date of 1 January 2007, is shown separately below. The grant date for all other awards is the award issue date.
(iv) Option pricing inputsThe following describes the option pricing inputs used for option granted by the Group during the year:
Fair value at Number of measurement Share Exercise Expected Expected Expected Risk-free
options granted date price price volatility life dividends interest rate
2007 4,376,651 £0.45 £1.66 £1.31 26.2% 3.7 yrs 4.2% 5.2%UK Sharesave Scheme 2006 939,625 £0.54 £2.01 £1.53 24.4% 3.3 yrs 3.1% 4.4%
UK Share Option and 2007 7,265,654 £0.39 £1.64 £1.63 31.6% 5.0 yrs 4.2% 5.1%Deferred Delivery Plan 2006 2,083,894 £0.44 £1.96 £1.93 33.0% 5.0 yrs 3.7% 4.6%
2007 7,473,176 R6.99 R23.28 R23.28 27.1% 5.3 yrs 3.0% 8.9%OMSA Management Scheme 2006 8,733,523 R8.21 R21.81 R21.81 30.0% 5.4 yrs 3.0% 8.0%
Old Mutual Namibia 2007 92,791 R7.03 R23.22 R23.22 27.2% 5.4 yrs 3.0% 8.9%Management Scheme 2006 – – – – – – – –
Nedbank Group (2005) 2007 6,377,666 R27.19 R134.78 R143.16 27.0% 4.0 yrs 4.9% 8.6%Share Option Scheme 2006 6,142,374 R28.12 R118.50 R110.71 27.0% 4.0 yrs 4.7% 7.4%
Nedbank Eyethu Black 2007 160,465 R32.93 R134.86 R139.81 28.0% 5.8 yrs 5.1% 9.0%Executive Scheme 2006 143,775 R29.83 R114.33 R109.57 28.0% 6.0 yrs 5.0% 7.9%
Nedbank Eyethu Black 2007 1,225,244 R33.40 R134.88 R139.13 28.0% 6.0 yrs 5.1% 8.8%Management Scheme 2006 826,783 R29.12 R112.96 R109.20 28.0% 6.0 yrs 5.0% 8.0%
Nedbank Eyethu 2007 300,282 R63.59 R134.76 R108.06 27.0% 3.9 yrs – 9.8%Corporate Scheme 2006 892,130 R55.10 R108.06 R108.06 28.0% 4.8 yrs – 8.6%
Nedbank Namibia Omufima 2007 – – – – – – – –Black Business Partner Scheme 2006 199,929 R42.72 R124.00 R279.25 29.0% 10.0 yrs – 8.1%
Nedbank Namibia Omufima 2007 – – – – – – – –Affinity Group Scheme 2006 74,048 R42.23 R124.00 R282.58 29.0% 10.0 yrs – 8.1%
Nedbank Namibia Omufima 2007 – – – – – – – –Education Scheme 2006 98,730 R42.23 R124.00 R282.58 29.0% 10.0 yrs – 8.1%
Nedbank Namibia Omufima 2007 – – – – – – – –Black Management Scheme 2006 58,004 R40.28 R124.70 R101.29 28.0% 6.0 yrs 4.8% 8.4%
Nedbank UK Long-term 2007 37,500 R33.50 R135.00 R134.27 28.0% 5.0 yrs 5.3% 9.3%Incentive Plan 2006 – – – – – – – –
Mutual & Federal Share 2007 – – – – – – – –Option Scheme 2006 8,100 R5.25 R4.97 R4.97 27.0% 3.0 yrs 4.5% 7.5%
Mutual & Federal Management 2007 317,700 R9.15 R26.04 R26.04 34.6% 3.0 yrs 4.5% 8.1%Incentive Scheme 2006 1,865,100 R5.25 R24.38 R24.38 27.0% 3.0 yrs 4.5% 7.5%
All of the above model inputs are expressed as weighted averages. The expected volatility is based on the annualised historic volatility of the shareprice over a period commensurate with the expected option life, ending on the date of valuation of the option. The expected life assumption is basedon the average length of time similar grants have remained outstanding in the past and the type of employees to which awards have been granted.

Old Mutual plc Annual Report and Accounts 2007Notes to the consolidated financial statements 199
Fina
ncia
ls
42 Share-based payments continued
(v) Share-based payment arrangements relating to SkandiaThe Company acquired a controlling shareholding in Skandia on 26 January 2006. As at that date, there were 25,725,421 options outstanding over Skandia shares, as a result of employee stock option programmes approved at Skandia’s Annual General Meetings. Options under theseprogrammes vested after the completion of either one or three years’ service and had a contractual life of either three years and three months or seven years. All options were equity settled, with the exception of synthetic stock options offered to employees in certain countries, which were cash settled. Option holders were not entitled to dividend payments during the vesting period.
Upon the Company’s acquisition of its controlling shareholding in Skandia, all outstanding options became vested and had a revised expiry date of 26 July 2006.
The following table presents a reconciliation of movement in options over shares in Skandia from the date of acquisition to the end of 2006:
WeightedNumber of average
Options over shares in Skandia options exercise price
Outstanding at 26 January 2006 25,725,421 80.79krExercised during the year (5,608,888) 20.33krExpired during the year (20,116,533) 97.65krOutstanding at end of the year – –
(vi) Share-based payment arrangements relating to US Asset ManagementDuring the year ended 31 December 2007, US Asset Management had the following share-based payment arrangements:
OMAM Affiliate Equity Plan Equity granted during the year to employees of firms participating in the OMAM Affiliate Equity Plan vests 3 years from the date of grant, conditionalupon continued employment over this period. Equity purchased vested immediately. Fair value was determined based on a multiple of prior yearearnings. Under the terms of the arrangements, no sooner than 4 years from the date of purchase (for purchased equity) or 4 years from the date of grant (for granted equity) participating employees can sell their equity back to Old Mutual (which acts as a buyer of last resort) at a fixed multiple of prior year earnings, subject to certain restrictions. Accordingly, the schemes are accounted for as cash-settled share-based payments, despite thefact the initial purchase and/or grants of equity are settled in equity instruments.
Acadian Asset Management (AAM)Class B equity interests in AAM acquired by employees during the year entitle the participating employees to 28.57 per cent of the earnings of AAM in excess of $120 million, and to a liquidation preference proportionate to their shareholding. In consideration for the equity acquired, theparticipating employees agreed to forego a portion of existing long-term incentive payments owed. The difference between the carrying amount of this consideration and the fair value of the interest acquired was treated as share-based compensation expense. Fair value was determined based on the discounted projected future cash flows of AAM.
Total Affiliate share Affiliate share minority share
Fair value of instruments granted and purchased during the year purchases grants in affiliate
2007 28.6% – 28.6%AAM1 2006 – – –
2007 2.4% 7.3% 9.7% OMAM Affiliate Equity Plan 2006 – – –
2007 17 9 26 Total fair value of instruments ($USm)2 2006 – – –
1 Percentage of Class B equity.2 Represents fair value in excess of consideration granted for affiliate share purchases.
US Asset Management annual bonus awardsThe OMAM Affiliate Equity Plan is incorporated into annual bonus awards of employees at participating firms, which are to be settled partly in cash,and partly in equity. The level of bonus is contingent upon current year financial and individual performance, therefore the vesting period for bonusequity to be granted during 2008 in respect of the 2007 financial year has been determined to commence from 1 January 2007.
It is anticipated that instruments with a fair value of US$2.8 million will be granted during 2008 to firms participating in the OMAM Affiliate EquityPlan based on 2007 financial performance.

Old Mutual plc Annual Report and Accounts 2007Notes to the consolidated financial statements200
Notes to the consolidated financial statementsFor the year ended 31 December 2007 continued
42 Share-based payments continued
(vii) Restricted share grants The following summarises the fair value of restricted shares granted by the Group during the year:
WeightedNumber averagegranted fair value
2007 6,112,787 £1.63UK Restricted Share Plan 2006 5,358,703 £1.92
2007 1,865,075 R22.56OMSA Senior Black Management Scheme 2006 2,355,480 R23.30
2007 4,970,627 R23.39OMSA Management Scheme 2006 4,788,114 R21.69
2007 37,211 R23.31Old Mutual Namibia Management Scheme 2006 – –
2007 439,854 R23.36Old Mutual Namibia Senior Black Management Scheme 2006 – –
2007 144,000 R21.33Old Mutual Namibia Broad-based Employee Scheme 2006 – –
2007 179,917 R125.10Nedbank Group (2005) Matched Share Scheme 2006 153,960 R114.45
2007 72,705 R134.83Nedbank Eyethu Black Executive Scheme 2006 73,726 R115.15
2007 110,562 R134.88Nedbank Eyethu Black Management Scheme 2006 75,968 R112.96
2007 2,137 R118.41Nedbank Eyethu Retail Scheme 2006 979,726 R99.85
2007 – –Nedbank Namibia Omufima Black Management Scheme 2006 17,396 R124.70
2007 – –Nedbank Namibia Omufima Broad-based Employee Scheme 2006 39,816 R124.70
2007 145,770 R25.95Mutual & Federal Senior Black Management Scheme 2006 107,550 R24.89
2007 95,310 R26.04Mutual & Federal Management Incentive Scheme 2006 428,510 R24.43
2007 2,267,136 R27.70Mutual & Federal Black Business Partners Scheme 2006 3,259,081 R34.25
2007 – –Mutual & Federal Namibia Broad-based Employee Scheme 2006 23,895 R29.40
2007 35,347 R26.33Mutual & Federal Namibia Black Business Partners Scheme 2006 248,590 R29.40
2007 13,092 R26.33Mutual & Federal Namibia Community Scheme 2006 92,070 R29.40
2007 15,480 R26.33Mutual & Federal Discretionary Scheme 2006 108,864 R29.40
The share price at measurement date was used to determine the fair value of the restricted shares. Expected dividends were not incorporated into the measurement of fair value where the holder of the restricted share is entitled to dividends throughout the vesting period.

Old Mutual plc Annual Report and Accounts 2007Notes to the consolidated financial statements 201
Fina
ncia
ls
42 Share-based payments continued
(viii) Annual bonus awardsThe UK and South Africa Share Option and Deferred Delivery Plans give rise to annual bonus awards. The level of annual bonus awards is contingent upon the satisfactory completion of individual and Company performance targets, measured over the financial year prior to the date theemployees receive the award. The accounting grant date for the SA and UK annual bonus plans (other than the new joiner and newly qualifiedgrants) has therefore been determined as 1 January in the year prior to the date of issue of the grants.
The Group anticipates awards under the South African scheme of 6,456,000 options and 4,721,500 restricted shares. The options have beenvalued using the Black-Scholes option pricing model, using an at the money option assumption. The restricted shares have been valued using a share price of R22.91.
The Group estimate of the total fair value of the annual bonus expected to be paid in the form of options and restricted shares under the UK ShareOption and Deferred Delivery Plan is outlined below. The fair value is determined by making an estimate of the level of bonus to be paid out following the attainment of personal and Company performance conditions.
Total fair value Vesting £m period
UK Share Option and Deferred Delivery Plan – restricted shares 5 4.2 yearsUK Share Option and Deferred Delivery Plan – options 1 4.2 years
(ix) Financial impact£m
Year ended Year ended31 December 31 December
2007 2006
Expense arising from equity settled share and share option plans 38 32Expense arising from cash settled share and share option plans (2) 25
36 57
Closing balance of liability for cash settled share awards 26 36Total intrinsic value liability for vested benefits 10 21
43 Dividends
Dividends paid were as follows:£m
Year ended Year ended31 December 31 December
Note 2007 2006
2005 Final dividend paid – 3.65p per 10p share – 1742006 Interim dividend paid – 2.1p per 10p share – 1082006 Final dividend paid – 4.15p per 10p share 218 –2007 Interim dividend paid – 2.3p per 10p share 115 –
Dividends to ordinary equity holders 333 282Dividends declared to holders of perpetual preferred callable securities 39(ii) 40 39
Dividend payments for the year 373 321
Dividends paid to ordinary equity holders, as above, are calculated using the number of shares in issue at the record date, less treasury shares held in ESOP trusts, life funds of Group companies, Black Economic Empowerment trusts and related undertakings.
As a consequence of the exchange control arrangements in place in certain African territories, dividends to ordinary equity holders on the branchregisters of those countries (or, in the case of Namibia, the Namibian section of the principal register) are settled through Dividend Access Trustsestablished for that purpose.
The directors are recommending a 2007 final dividend of 4.55p per share, which will be paid on 30 May 2008 to all ordinary equity holders on the register at the close of business on 9 May 2008, being the record date for the dividend. In accordance with IFRS requirements, no provision has been recognised in respect of this dividend.
In March and November 2007, £22 million and £18 million respectively were declared and paid to holders of perpetual preferred callable securities(March 2006: £22 million and November 2006: £17 million).

Old Mutual plc Annual Report and Accounts 2007Notes to the consolidated financial statements202
Notes to the consolidated financial statementsFor the year ended 31 December 2007 continued
44 Contingent liabilities£m
At At31 December 31 December
2007 2006
Guarantees and assets pledged as collateral security 1,489 1,115Irrevocable letters of credit 426 334Secured lending 1,052 1,440Other contingent liabilities 136 213
Nedbank structured financingHistorically a number of the Group’s South Africa banking businesses entered into structured finance transactions with third parties using the tax base of these companies. Pursuant to the terms of the majority of these transactions, the underlying third party has contractually agreed to accept the risk of any tax being imposed by the South African Revenue Service (SARS), although the obligation to pay in the first instance rests with theGroup’s companies. It is only in limited cases where, for example, the credit quality of a client becomes doubtful, or where the client has specificallycontracted out of the re-pricing of additional taxes, that the recovery from a client could be less than the liability that could arise on assessment, in which case provisions are made. SARS has examined the tax aspects of some of these types of structures and SARS could assess these structures in a manner different to that initially envisaged by the contracting parties. As a result Group companies could be obliged to pay additional amounts to SARS and recover these from clients under the applicable contractual arrangements.
Skandia LivSkandia Liv has submitted claims to Skandia relating to compensation for alleged prohibited profit distributions. These distributions relate to the sale of Skandia Liv’s asset management business by Skandia to Den Norske Bank in 2002. The dispute is in arbitration, a ruling is expected in 2008.
American SkandiaThe sale of American Skandia to Prudential Financial contained customary representations and warranties. The indemnity in respect of this is limitedto US$1 billion. Investigations by various US regulators have given rise to potential settlements and claims in relation to market timing. AmericanSkandia’s exposure to market timing is part of a wider investigation of the US industry. The exposure is covered by the aforementioned indemnitywhich also covers the matter of American Skandia’s failure to administer the annuitisation provisions contained in certain contracts. This was anadministrative error made by the American Skandia business between 1996 and 2003.
Skandia Liv and American Skandia have been provided for in the acquisition accounting.
45 Commitments
Capital commitmentsThe Group’s capital commitments are detailed in the table below. The Group’s management is confident that future net revenues and funding will be sufficient to cover these commitments.
£m
At At31 December 31 December
2007 2006
Investment property 3 1Property and equipment 66 42
The following table presents the contractual amounts of the Group’s off-balance sheet financial instruments that commit it to extend credit to customers.
£m
At At31 December 31 December
2007 2006
Original term to maturity of one term or less 1,588 1,372Original term to maturity of more than one year 96 52Other commitments, note issuance facilities and revolving underwriting facilities 237 261
Assets are pledged as collateral under repurchase agreements with other banks and for security deposits relating to local futures, options and stock exchange memberships. Mandatory reserve deposits are also held with local Central Banks in accordance with statutory requirements. These deposits are not available to finance the Groups’ day-to-day operations.

Old Mutual plc Annual Report and Accounts 2007Notes to the consolidated financial statements 203
Fina
ncia
ls
46 Related parties
The Group provides certain pension fund, insurance, banking and financial services to related parties. These are conducted on an arm’s length basis and are not material to the Group’s results.
(i) Transactions with key management personnel, remuneration and other compensation Key management personnel are those persons having authority and responsibility for planning, directing and controlling the activities of the Group,directly or indirectly, including any director (whether executive or otherwise) of the Group. Details of the compensation paid to the Board of Directors as well as their shareholdings in the Company are disclosed in the Remuneration Report on page 82 to 95.
(ii) Key management personnel remuneration and other compensation Year ended Year ended
31 December 31 December2007 2006
Number of Value Number of Valuepersonnel £000s personnel £000s
Directors’ fees 9 1,014 11 963Remuneration 13,989 13,533Cash remuneration 13 8,616 15 9,022Short-term employee benefits 20 1,319 17 865Other long-term benefits 12 326 15 849Share-based payments 17 3,728 11 2,797
15,003 14,496
Year ended Year ended31 December 31 December
2007 2006
Number of Number ofNumber of options/shares Number of options/sharespersonnel ’000s personnel ’000s
Share optionsOutstanding at beginning of the year 11 15,458 9 16,061New appointments 2 1,370 4 2,366Granted during the year 8 1,888 7 1,104Exercised during the year 11 (6,110) 10 (3,313)Lapsed during the year 1 (14) 3 (760)
Outstanding at end of the year 11 12,592 11 15,458
Year ended Year ended31 December 31 December
2007 2006
Number of Number ofNumber of options/shares Number of options/sharespersonnel ’000s personnel ’000s
Restricted sharesOutstanding at beginning of the year 13 4,257 8 2,603New appointments 3 1,333 5 183Granted during the year 8 1,695 11 1,942Released during the year 10 (1,015) 3 (471)
Outstanding at end of the year 11 6,270 13 4,257

Old Mutual plc Annual Report and Accounts 2007Notes to the consolidated financial statements204
46 Related parties continued
(iii) Key management personnel transactionsKey management personnel and members of their close family have undertaken transactions with Old Mutual plc and its subsidiaries, jointlycontrolled entities and associated undertakings in the normal course of business, details of which are given below. For current accounts positivevalues indicate assets of the individual whilst for credit cards and mortgages positive values indicate liabilities of the individual.
Year ended Year ended31 December 31 December
2007 2006
Number of Value Number of Valuepersonnel £000s personnel £000s
Current accountsBalance at beginning of the year 7 2,323 2 (116)Net movement during the year (2,283) 2,415Foreign exchange movement – 24Balance at end of the year 6 40 7 2,323Credit cardsBalance at beginning of the year 4 12 2 8Net movement during the year 4 6Foreign exchange movement – (2)Balance at end of the year 5 16 4 12MortgagesBalance at beginning of the year 5 1,643 1 79Net movement during the year 2,201 1,943Interest charged 210 93Less repayments (2,048) (299)Foreign exchange movement 8 (173)Balance at end of the year 5 2,014 5 1,643General insurance contractsTotal premium paid during the year 7 21 5 25Claims paid during the year 2 11 1 3Life insurance productsTotal sum assured/value of investment at end of the year 7 3,157 7 1,927Pensions, termination benefits paidValue of pension plan as at end of the year 13 8,404 12 8,501
Various members of key management personnel hold, and/or have at various times during the year held, investments managed by asset managementbusinesses of the Group. These include unit trusts, mutual funds and hedge funds. None of the amounts concerned are material in the context of thefunds managed by the Group business concerned, and all of the investments have been made by the individuals concerned either on terms which arethe same as those available to external clients generally or, where that is not the case, on the same preferential terms as were available to employeesof the business generally.
Notes to the consolidated financial statementsFor the year ended 31 December 2007 continued

Old Mutual plc Annual Report and Accounts 2007Notes to the consolidated financial statements 205
Fina
ncia
ls
46 Related parties continued
(iv) Skandia LivLivförsäkringsaktiebolaget Skandia (publ) (Skandia Liv), is a related party to the Old Mutual Group. Skandia Liv is a wholly-owned subsidiary ofSkandia and its business is conducted on a mutual basis. For the reasons given in the accounting policies Skandia Liv’s result is not consolidated in these financial statements.
Material transactions between the Group and the Skandia Liv group in twelve months ended 31 December 2007 were as follows:
1 Agreement in principle and framework agreement on co-operation covering market-related functions and certain staff functions – this involvesdistribution and distribution support, customer service, market communication, administration of group insurance products, and staff and servicefunctions. Skandia Liv paid £86 million (2006: £104 million) for services rendered under this agreement.
2 Premises – the Group rents office premises from Skandia Liv. The Group paid market rents of £14 million (2006: £13 million) for these premises.3 Occupational pensions – Skandia Liv provides occupational pensions for the employees of the Group, for which the Group paid £14 million
(2006: £12 million).4 Agreement on IT services – the Group provides IT services to Skandia Liv. The amount charged to Skandia Liv was £7 million (2006: £7 million).5 With effect on 1 January 2007, Skandia and Skandia Liv entered into a new agreement on the handling of administrative services within the
joint-group occupational pensions concept. This agreement entirely supersedes the previous agreement that applied. Under the previousagreement, Skandia outsourced the acquisition and a large share of the administration of unit-linked assurance business in the occupationalpensions concept to Skandia Liv. Skandia Liv was remunerated for these services both through policyholder fees and through fees from Skandia.These fees were to cover Skandia Liv’s acquisition and administrative costs for this unit-linked assurance. In connection with the new occupational pensions agreement, the parties have agreed that Skandia have paid a sum to release itself from its future payment obligation underthe old agreement. A one-time payment of £174 million (SEK2,360 million) has been made by Skandia to Skandia Liv. Through this one-timesettlement, the companies have settled all claims pertaining to services in previous years in the aforementioned outsourced business conductedaside from Skandia Liv’s ordinary activity as insurer. Skandia has capitalised this payment as an acquisition cost, and the asset will be amortisedover the term of the underlying insurance contracts. The payment was financed by a loan from Skandia’s subsidiary Skandia Capital, which in turn financed the transaction through a loan from Skandia’s parent company, Old Mutual plc.
The balance outstanding at 31 December 2007 due from Skandia Liv is £13 million (2006: £37 million).
Various other arrangements exist between the Group and Skandia Liv, principally in respect of provision of accounting, legal and treasury functions, all of which are transacted on an arm’s length basis.
(v) Aka Capital (Proprietory) LimitedA Group subsidiary, Nedbank Ltd, sold its 20 per cent interest in Aka Capital (Proprietary) Limited (“Aka Capital”) at arm’s length, in August 2006, to the other existing Aka Capital shareholders. These included Mr RJ Khoza, who is a non-executive director of Old Mutual plc, who acquired anadditional 4.2 per cent of Aka Capital through a special purpose vehicle (SPV) for R11.0 million. Nedbank Ltd’s Capital Investment Committeeapproved this transaction in line with its mandate in the normal course of business. The funding for the acquisition by Mr Khoza’s SPV was financedby Nedbank Ltd on arm’s length terms, with R12.8 million of such funding being outstanding at year-end.

Old Mutual plc Annual Report and Accounts 2007Notes to the consolidated financial statements206
47 Principal subsidiaries and Group enterprises
The following table lists the principal Group undertakings whose results are included in the consolidated financial statements. All shares held are ordinary shares and, except for OM Group (UK) Ltd, are held indirectly by the Company.
PercentageName Nature of business holding Country of incorporation
Old Mutual (South Africa) Ltd Holding company 100 Republic of South AfricaOld Mutual Life Assurance Company (South Africa) Ltd Life assurance 100 Republic of South AfricaOld Mutual Life Assurance Company (Namibia) Ltd Life assurance 100 NamibiaOld Mutual Investment Group (South Africa) (Pty) Ltd Asset management 100 Republic of South AfricaNedbank Group Ltd Banking 58 Republic of South AfricaNedbank Ltd Banking 58 Republic of South AfricaMutual & Federal Insurance Company Ltd General insurance 85 Republic of South AfricaOld Mutual (US) Holdings, Inc Holding company 100 Delaware, United States of AmericaOld Mutual U.S. Life Holdings, Inc Holding company 100 Delaware, United States of AmericaOM Financial Life Insurance Company Life assurance 100 Maryland, United States of AmericaOld Mutual (Bermuda) Ltd Life assurance 100 BermudaDwight Asset Management Company Asset management 100 Delaware, United States of AmericaAcadian Asset Management1 Asset management 100 Massachusetts, United States
of AmericaBarrow, Hanley, Mewhinney & Strauss, Inc Asset management 100 Nevada, United States of AmericaOM Group (UK) Ltd Holding company 100 England and WalesSkandia Europe and Latin America (Holdings) Ltd Holding company 100 England and WalesSkandia Life Assurance Company Ltd Life assurance 100 England and WalesFörsäkringsaktiebolaget Skandia Life assurance 100 SwedenSkandiaBanken AB Banking 100 Sweden
1 The Group holds 100 per cent Class A shares and 71.43 per cent Class B shares in Acadian Asset Management. The remaining 28.57 per cent Class B shares are held by the employees as described in note 42(vi).
A complete list of subsidiaries is filed with the UK Registrar of Companies with the annual return. All the above companies have a year-end of 31 December.
48 Financial risk
The Group is exposed to financial risk through its financial assets (investments and loans), financial liabilities (investment contracts, customer deposits and borrowings), reinsurance assets and insurance liabilities. The key focus of financial risk management for the Group is ensuring that the proceeds from its financial assets are sufficient to fund the obligations arising from its insurance and banking operations. The most importantcomponents of financial risk are credit risk, market risk (arising from changes in equity, and bond prices, interest and foreign exchange rates), andliquidity risk. Market risk arises from open positions in interest rate, currency and equity products, all of which are exposed to general and specificmarket movements and/or conditions.
(a) Financial Risk Management strategy and policy(i) Overview The Old Mutual Group operates an Enterprise Risk Management (ERM) framework containing the following components:
> a robust risk governance structure;> risk appetites established at Group and subsidiary level;> Group-wide risk policies; and> methodologies that focus on risk identification, risk measurement, risk assessment, action plans, monitoring and reporting. Group risk principles
have been established for each major risk category to which the Group is exposed. These are designed to provide management teams across the Group with guiding principles within which to manage risks. Business unit risk policies expand on these principles and contain detailedrequirements and/or limits for the specific business unit concerned.
Further details regarding the ERM framework and risk governance procedures are contained in the Directors’ Report on Corporate Governance and Other Matters on pages 64 to 81 of this Annual Report and Accounts.
Notes to the consolidated financial statementsFor the year ended 31 December 2007 continued

Old Mutual plc Annual Report and Accounts 2007Notes to the consolidated financial statements 207
Fina
ncia
ls
48 Financial risk continued
(a) Financial Risk Management strategy and policy continued(i) Overview continuedThe Group’s exposure to financial risk varies according to the nature of its operations and the location of those operations. Consequently the Group’spolicy is to manage financial risk separately through its principal operations subject to appropriate central corporate monitoring. The Group’soperations that incur significant financial risk are:
> Old Mutual plc> Old Mutual Life Assurance Company South Africa (OMLAC(SA))> Old Mutual US Life (OMUSL)> Skandia, through its unit-linked assurance operations> Mutual & Federal Insurance Company Ltd (M&F)> Nedbank Group (Nedbank)> SkandiaBanken
The Group’s asset management businesses are exposed to financial risk to some extent due to the impact of market fluctuations on revenue levels,which are a function of the value of client portfolios. This exposure is reduced through asset class and product diversification. Investment risk is borneprincipally by the client. These asset management businesses, together with the long-term insurance operations in the rest of Africa, do not give rise to significant financial risks relative to the Group as a whole, and are therefore not considered further.
(ii) Old Mutual plc The principal financial risks Old Mutual plc faces, other than those that it is exposed to through its operating entities, relate to credit risk, liquidity riskand currency risk.
Credit risk arises primarily as a result of the exposure to financial institutions with which Old Mutual plc has deposited surplus cash or entered intoother financial arrangements, such as forward foreign exchange transactions or interest rate derivatives. The Old Mutual plc Board controls this risk by setting limits on the level of exposure to individual counterparties.
Liquidity risk is the risk that Old Mutual plc may not be able to pay obligations when due, or provide capital to its subsidiaries when required. Old Mutual plc mitigates this risk by ensuring it maintains liquid assets and/or committed finance facilities sufficient to meet its expected needs.
In terms of currency risk, Old Mutual plc’s exposure arises from the fact that the impact on the consolidated results of the Group, insofar as itspresentational currency is GBP, whilst the functional currencies of its principal operations are South African Rand, US Dollar, Euro and Swedish Krona.Old Mutual plc seeks to reduce it’s consolidated exposure to currency fluctuations by hedging a proportion of the currency translation risk of its netinvestments in its foreign subsidiaries and anticipated cash flows through currency swaps, currency borrowings and forward foreign exchangecontracts. The hedging relationships that qualify for hedge accounting are classified as either cash flow hedges or net investment hedges in theconsolidated financial statements. Certain transactions undertaken as hedges do not qualify for hedge accounting. Fair value movements for thesederivatives are accounted for in the income statement.
(iii) Insurance operationsThe principal financial risks faced by the insurance operations are credit risk, market risk and liquidity risk and, to the extent that those operationshave overseas operations with different functional currencies, currency risk.
Each of the insurance operations manages their financial risks using asset and liability management (ALM) frameworks aimed at matching assets to the liabilities arising as a result of the various type of benefits payable to policyholders, as well as seeking to maximise the return on shareholders’funds, all within an acceptable risk framework.
The insurance operations retain substantial financial exposures to the extent that the benefits payable to policyholders are not linked to theperformance of the underlying assets and/or policyholders enjoy options embedded in their contracts that are not matched by identical options in their investment portfolios. These exposures include liquidity risk (for example where the durations of assets do not match those of the policyholderliabilities they seek to match), credit risk (where changes in credit quality of asset portfolios or credit losses cannot be passed on to policyholders) and market risk (for example in respect of equity holdings in shareholders’ funds).
(iv) Banking operationsThe Group’s banking operations incur credit, interest rate and liquidity risk by accepting deposits from customers at both fixed and floating rates and for various periods and seeks to earn above average interest margins by consolidating them and investing in a range of assets, often for longerperiods, whilst maintaining sufficient liquidity to meet all claims that might fall due.
Nedbank also incurs credit exposures as a result of entering into guarantees and other commitments such as letters of credit and performance, and other bonds. Nedbank also trades in financial instruments, taking positions in traded and over the counter instruments including derivatives, in order to take advantage of short-term market movements in equity, bond, currency, interest rate and commodity prices.
Each of the banking operations manages their financial risks using an asset and liability management framework, conducted through formalstructures appropriate to their individual businesses.

Old Mutual plc Annual Report and Accounts 2007Notes to the consolidated financial statements208
48 Financial risk continued
(b) Capital risk management(i) Overview The Group actively manages its capital to ensure that entities in the Group will be able to continue as a going concern while maximising the return to shareholders through the optimisation of the debt and equity balance. It is critical that the Group’s capital management policies are aligned with the Group’s overall strategy, business plans and risk appetite. The Group has a business planning process that runs on an annual cycle with regularupdates to projections. It is through this process, which includes risk and sensitivity analyses of forecasts, that the operating businesses gain approvalfrom the Old Mutual plc Board for their requests for capital.
In terms of general policy, each regulated business is required to hold, as a minimum, capital sufficient to meet the requirements of any applicableregulator in the jurisdictions in which it operates, together with such additional capital as management believes is necessary to ensure that obligationsto policyholders and/or clients can always be met on a timely basis. In addition, Old Mutual plc ensures that it can meet its expected capital andfinancing needs at all times, having regard to the Group’s business plans, forecasts and any strategic initiatives.
The Group’s Capital Management Committee (GCMC) reviews the capital structure regularly. As part of the review the committee considers the cost of capital and the risks associated with each class of capital. Based on the recommendations of the committee, the Group will balance its overallcapital structure through the payment of dividends, new share issues, share buybacks as well as the issue of new debt or the redemption of existingdebt. Measures that inform the GCMC’s views on the appropriate level of capital for the Group includes shareholder performance objectives, regulatorycapital requirements, internal economic capital measures, rating agency expectations and general views on maintaining financial flexibility.
The GCMC is a sub-committee of the Executive Committee of the Board, established to set an appropriate framework and guidelines to ensure theappropriate management of capital, to allocate capital to the various businesses, and to monitor return on allocated capital for each business relativeto the agreed hurdle rate. The GCMC comprises the Chief Executive and Group Finance Director of Old Mutual plc together with certain executivesdrawn from Old Mutual plc and/or its subsidiaries. Meetings are held as circumstances require and are the body through which requests for capitalare submitted outside the business plans.
Management regularly monitors the capital requirements of the Group, taking account of future balance sheet growth, profitability, projected dividendpayments and any anticipated regulatory changes, in order to ensure that the Group is at all times able to meet the forecast future minimum capitalrequirements.
(ii) Old Mutual plcOld Mutual plc is the holding company of the Group and is responsible for the raising and allocation of capital in line with the Group’s capitalmanagement policies set out above and for ensuring the operational funding and regulatory capital needs of the holding company and its subsidiariesare met at all times.
(iii) Long-term insurance business operations The regulatory capital position of the Group’s long-term insurance operations, based on latest estimates, is summarised as follows:
£m
At 31 December 2007 At 31 December 2006
SouthSouth United Africa UnitedAfrica States Europe Restated States Europe
Equity shareholders’ funds 3,980 1,191 3,699 4,053 1,253 2,997Adjustments to a regulatory basis:Inadmissible assets (22) (154) (1,049) (20) (140) (897)Other adjustments (831) (570) (1,505) (1,040) (704) (1,156)
Total available capital resources 3,127 467 1,145 2,993 409 944Total capital requirements – local regulatory basis (886) (126) (211) (872) (185) (249)
Overall excess of capital resources over requirements 2,241 341 934 2,121 224 695
£m
At 31 December 2007 At 31 December 2006
SouthSouth United Africa UnitedAfrica States Europe Restated States Europe
Capital position at 1 January 2,993 409 944 3,079 487 –Earnings after tax 535 19 238 1,026 61 (26)Change in admissible assets and other adjustments 194 62 (75) (202) (165) (30)Additions from business combinations – – – – – 991(Capital redemptions)/new capital – (19) 3 – 85 –Dividends (613) – – (232) – –Foreign exchange movements 18 (4) 35 (678) (59) 9
Capital position at 31 December 3,127 467 1,145 2,993 409 944
Notes to the consolidated financial statementsFor the year ended 31 December 2007 continued
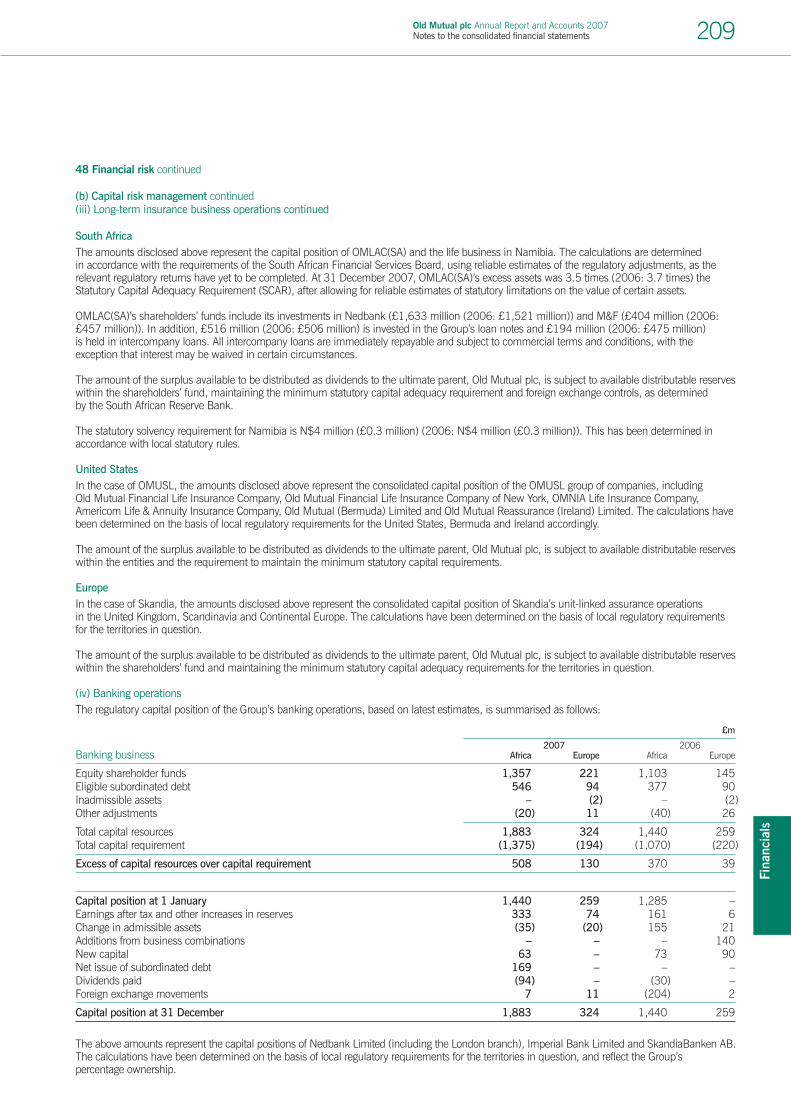
Old Mutual plc Annual Report and Accounts 2007Notes to the consolidated financial statements 209
Fina
ncia
ls
48 Financial risk continued
(b) Capital risk management continued(iii) Long-term insurance business operations continued
South AfricaThe amounts disclosed above represent the capital position of OMLAC(SA) and the life business in Namibia. The calculations are determined in accordance with the requirements of the South African Financial Services Board, using reliable estimates of the regulatory adjustments, as therelevant regulatory returns have yet to be completed. At 31 December 2007, OMLAC(SA)’s excess assets was 3.5 times (2006: 3.7 times) theStatutory Capital Adequacy Requirement (SCAR), after allowing for reliable estimates of statutory limitations on the value of certain assets.
OMLAC(SA)’s shareholders’ funds include its investments in Nedbank (£1,633 million (2006: £1,521 million)) and M&F (£404 million (2006:£457 million)). In addition, £516 million (2006: £506 million) is invested in the Group’s loan notes and £194 million (2006: £475 million) is held in intercompany loans. All intercompany loans are immediately repayable and subject to commercial terms and conditions, with the exception that interest may be waived in certain circumstances.
The amount of the surplus available to be distributed as dividends to the ultimate parent, Old Mutual plc, is subject to available distributable reserveswithin the shareholders’ fund, maintaining the minimum statutory capital adequacy requirement and foreign exchange controls, as determined by the South African Reserve Bank.
The statutory solvency requirement for Namibia is N$4 million (£0.3 million) (2006: N$4 million (£0.3 million)). This has been determined inaccordance with local statutory rules.
United StatesIn the case of OMUSL, the amounts disclosed above represent the consolidated capital position of the OMUSL group of companies, including Old Mutual Financial Life Insurance Company, Old Mutual Financial Life Insurance Company of New York, OMNIA Life Insurance Company,Americom Life & Annuity Insurance Company, Old Mutual (Bermuda) Limited and Old Mutual Reassurance (Ireland) Limited. The calculations have been determined on the basis of local regulatory requirements for the United States, Bermuda and Ireland accordingly.
The amount of the surplus available to be distributed as dividends to the ultimate parent, Old Mutual plc, is subject to available distributable reserveswithin the entities and the requirement to maintain the minimum statutory capital requirements.
EuropeIn the case of Skandia, the amounts disclosed above represent the consolidated capital position of Skandia’s unit-linked assurance operations in the United Kingdom, Scandinavia and Continental Europe. The calculations have been determined on the basis of local regulatory requirements for the territories in question.
The amount of the surplus available to be distributed as dividends to the ultimate parent, Old Mutual plc, is subject to available distributable reserveswithin the shareholders’ fund and maintaining the minimum statutory capital adequacy requirements for the territories in question.
(iv) Banking operations The regulatory capital position of the Group’s banking operations, based on latest estimates, is summarised as follows:
£m
2007 2006Banking business Africa Europe Africa Europe
Equity shareholder funds 1,357 221 1,103 145Eligible subordinated debt 546 94 377 90Inadmissible assets – (2) – (2)Other adjustments (20) 11 (40) 26
Total capital resources 1,883 324 1,440 259Total capital requirement (1,375) (194) (1,070) (220)
Excess of capital resources over capital requirement 508 130 370 39
Capital position at 1 January 1,440 259 1,285 –Earnings after tax and other increases in reserves 333 74 161 6Change in admissible assets (35) (20) 155 21Additions from business combinations – – – 140New capital 63 – 73 90Net issue of subordinated debt 169 – – –Dividends paid (94) – (30) –Foreign exchange movements 7 11 (204) 2
Capital position at 31 December 1,883 324 1,440 259
The above amounts represent the capital positions of Nedbank Limited (including the London branch), Imperial Bank Limited and SkandiaBanken AB.The calculations have been determined on the basis of local regulatory requirements for the territories in question, and reflect the Group’s percentage ownership.
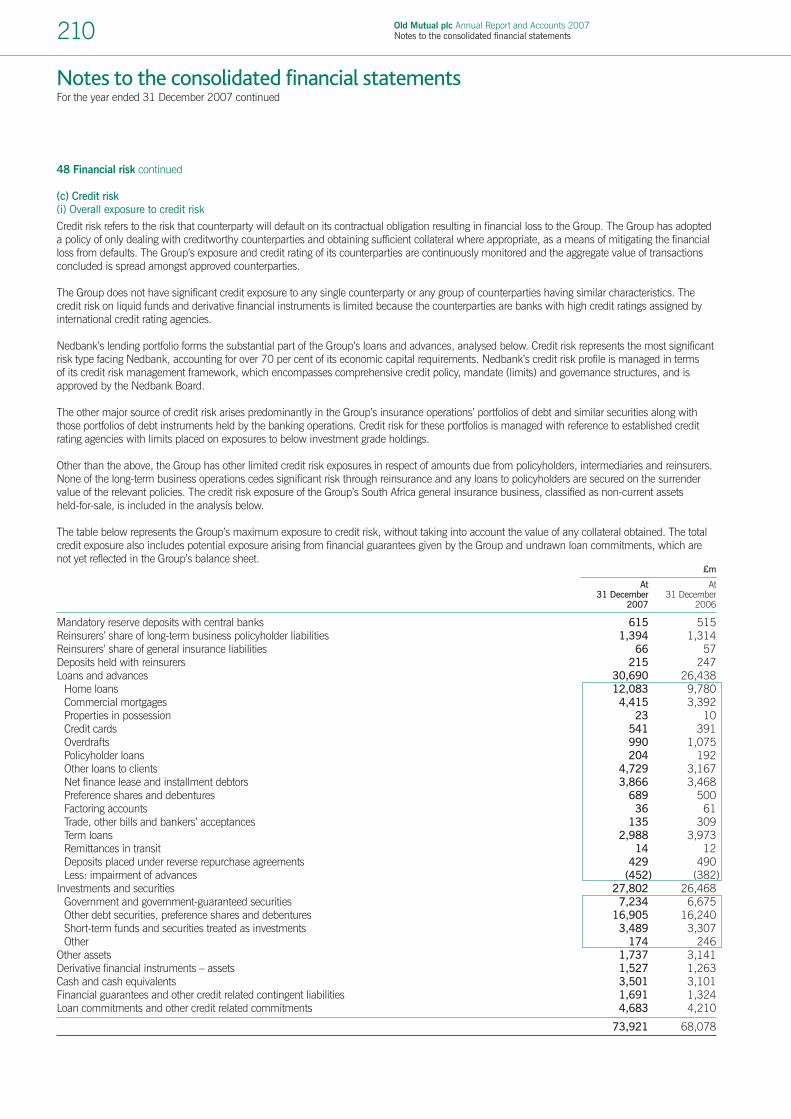
Old Mutual plc Annual Report and Accounts 2007Notes to the consolidated financial statements210
48 Financial risk continued
(c) Credit risk(i) Overall exposure to credit riskCredit risk refers to the risk that counterparty will default on its contractual obligation resulting in financial loss to the Group. The Group has adopted a policy of only dealing with creditworthy counterparties and obtaining sufficient collateral where appropriate, as a means of mitigating the financialloss from defaults. The Group’s exposure and credit rating of its counterparties are continuously monitored and the aggregate value of transactionsconcluded is spread amongst approved counterparties.
The Group does not have significant credit exposure to any single counterparty or any group of counterparties having similar characteristics. The credit risk on liquid funds and derivative financial instruments is limited because the counterparties are banks with high credit ratings assigned byinternational credit rating agencies.
Nedbank’s lending portfolio forms the substantial part of the Group’s loans and advances, analysed below. Credit risk represents the most significantrisk type facing Nedbank, accounting for over 70 per cent of its economic capital requirements. Nedbank’s credit risk profile is managed in terms of its credit risk management framework, which encompasses comprehensive credit policy, mandate (limits) and governance structures, and isapproved by the Nedbank Board.
The other major source of credit risk arises predominantly in the Group’s insurance operations’ portfolios of debt and similar securities along withthose portfolios of debt instruments held by the banking operations. Credit risk for these portfolios is managed with reference to established creditrating agencies with limits placed on exposures to below investment grade holdings.
Other than the above, the Group has other limited credit risk exposures in respect of amounts due from policyholders, intermediaries and reinsurers.None of the long-term business operations cedes significant risk through reinsurance and any loans to policyholders are secured on the surrendervalue of the relevant policies. The credit risk exposure of the Group’s South Africa general insurance business, classified as non-current assets held-for-sale, is included in the analysis below.
The table below represents the Group’s maximum exposure to credit risk, without taking into account the value of any collateral obtained. The totalcredit exposure also includes potential exposure arising from financial guarantees given by the Group and undrawn loan commitments, which are not yet reflected in the Group’s balance sheet.
£m
At At 31 December 31 December
2007 2006
Mandatory reserve deposits with central banks 615 515Reinsurers’ share of long-term business policyholder liabilities 1,394 1,314Reinsurers’ share of general insurance liabilities 66 57Deposits held with reinsurers 215 247Loans and advances 30,690 26,438
Home loans 12,083 9,780Commercial mortgages 4,415 3,392Properties in possession 23 10Credit cards 541 391Overdrafts 990 1,075Policyholder loans 204 192Other loans to clients 4,729 3,167Net finance lease and installment debtors 3,866 3,468Preference shares and debentures 689 500Factoring accounts 36 61Trade, other bills and bankers’ acceptances 135 309Term loans 2,988 3,973Remittances in transit 14 12Deposits placed under reverse repurchase agreements 429 490Less: impairment of advances (452) (382)
Investments and securities 27,802 26,468Government and government-guaranteed securities 7,234 6,675Other debt securities, preference shares and debentures 16,905 16,240Short-term funds and securities treated as investments 3,489 3,307Other 174 246
Other assets 1,737 3,141Derivative financial instruments – assets 1,527 1,263Cash and cash equivalents 3,501 3,101Financial guarantees and other credit related contingent liabilities 1,691 1,324Loan commitments and other credit related commitments 4,683 4,210
73,921 68,078
Notes to the consolidated financial statementsFor the year ended 31 December 2007 continued

Old Mutual plc Annual Report and Accounts 2007Notes to the consolidated financial statements 211
Fina
ncia
ls
48 Financial risk continued
(c) Credit risk continued(ii) Loans and advancesThe table below gives an age analyses of the gross value of loans and advances (before impairment provisions) recognised in the Group’s consolidated balance sheet, representing primarily the exposures of the Group’s banking operations.
£m
At At 31 December 31 December
2007 2006
Neither past due nor impaired 29,794 25,724Past due but not impaired 559 539
Past due but less than 1 month 338 92Past due, greater than 1 month but less than 3 months 74 446Past due, greater than 3 months but less than 6 months 22 –Past due, greater than 6 months but less than 1 year 39 1Past due more than 1 year 86 –
Impaired loans and advances 789 557
Total of gross loans and advances 31,142 26,820
For the Group’s loans and advances portfolios, the type of collateral taken depends on the type of product (loan class) and the credit quality of theindividual borrower. For credit cards, overdrafts, and term loans generally there is no security taken. For asset backed finance, mortgage loans, and lease and installment debtors, security is usually taken by way of a charge over the underlying assets.
(iii) Debt instruments and similar securitiesThe following table shows an analysis of the Group’s portfolio of debt and similar securities according to their credit rating (Standard & Poor’s or equivalent), by investment grade.
Other debt securities,
Government and preference Short-term government- shares and funds and
At 31 December 2007 related securities debentures securities Total
Investment grade (AAA to BBB) 5,122 14,229 2,969 22,320Sub-investment grade (BB and lower) – 296 – 296Not rated 2,112 2,380 520 5,012
7,234 16,905 3,489 27,628
Other debt securities,
Government and preference Short-term government- shares and funds and
At 31 December 2006 related securities debentures securities Total
Investment grade (AAA to BBB) 6,627 11,518 3,027 21,172Sub-investment grade (BB and lower) – 993 10 1,003Not rated 2,042 1,735 270 4,047
8,669 14,246 3,307 26,222

Old Mutual plc Annual Report and Accounts 2007Notes to the consolidated financial statements212
48 Financial risk continued
(c) Credit risk continued(iii) Debt instruments and similar securities continuedAn age analysis of the above portfolio is set out below.
£m
At At31 December 31 December
2007 2006
Neither past due nor impaired 27,628 26,222Past due but not impaired – –
Past due but less than 1 month – –Past due, greater than 1 month but less than 3 months – –Past due, greater than 3 months but less than 6 months – –Past due, greater than 6 months but less than 1 year – –Past due more than 1 year – –
Impaired instruments – –
Total debt instruments and similar securities 27,628 26,222
In general, no collateral is taken in respect of the Group’s holdings of debt instruments and similar securities.
(iv) Reinsurance assetsThe following table shows an analysis of the Group’s balance sheet exposure to reinsurers according to the individual reinsurers’ credit rating(Standard & Poor’s or equivalent).
Reinsurers’ share of long-term Reinsurers’ share
business of general Deposits policyholder insurance held with
At 31 December 2007 liabilities liabilities reinsurers Total
Investment grade (AAA to BBB) 1,375 66 215 1,656Sub-investment grade (BB and lower) 1 – – 1Not rated 18 – – 18
1,394 66 215 1,675
Reinsurers’ share of long-term Reinsurers’ share
business of general Deposits policyholder insurance held with
At 31 December 2006 liabilities liabilities reinsurers Total
Investment grade (AAA to BBB) 1,314 57 247 1,618
1,314 57 247 1,618
An age analysis of the above portfolio is set out below.£m
At At 31 December 31 December
2007 2006
Neither past due nor impaired 1,668 1,618Past due but not impaired 7 –
Past due but less than 1 month – –Past due, greater than 1 month but less than 3 months – –Past due, greater than 3 months but less than 6 months – –Past due, greater than 6 months but less than 1 year 7 –Past due more than 1 year – –
Impaired reinsurance assets – –
Total reinsurance assets 1,675 1,618
Collateral is not taken against reinsurance assets or deposits held with reinsurers other than in limited circumstances.
Notes to the consolidated financial statementsFor the year ended 31 December 2007 continued

Old Mutual plc Annual Report and Accounts 2007Notes to the consolidated financial statements 213
Fina
ncia
ls
48 Financial risk continued
(c) Credit risk continued(v) Collateral and other credit enhancements obtainedSet out below is an analysis of the collateral obtained and held at the end of the year, principally in respect of defaults by banking customers. It is the policy of the banking operations to dispose of the collateral held in the most efficient way possible, subject to suitable levels of recovery, in order to limit the extent of the losses on amounts advanced.
£m
At At 31 December 31 December
2007 2006
Nature and carrying amount of assets heldResidential property 22 10Deposits owing to reinsurers 9 9Other 4 –
35 19
(d) Market risk(i) OverviewMarket risk is the risk of an adverse financial impact arising from the changes in values of financial assets or financial liabilities from changes inequity, bond and property prices, interest rates and foreign exchange rates. Market risk arises differently across the Group’s businesses depending on the types of financial assets and liabilities held.
Each of the Group’s business units has an established set of policies, principles and governance processes to manage market risk within theirindividual businesses and in accordance with their local regulatory requirements. A monitoring process established at a Group level overlies theseindividual approaches to the management of market risk.
The impacts of changes in market risk are monitored and managed by way of sensitivity analyses, through the business units’ own regulatoryprocesses, with reference to the Group’s economic capital processes, and by other means. The sensitivity of the Group’s earnings, capital position and embedded value is monitored through the Group’s embedded value reporting processes.
(ii) Insurance operations For the Group’s insurance operations, equity and property price risk and interest rate risk (on the value of the securities) are modelled in accordancewith the Group’s risk-based capital practices, which require sufficient capital to be held in excess of the statutory minimum to allow the Group tomanage significant equity exposures.
In South Africa the stock selection and investment analysis process is supported by a well-developed research function. For fixed annuities, marketrisks are managed where possible by investing in fixed interest securities with a duration closely corresponding to those liabilities. Market risk onpolicies that include specific guarantees and where shareholders carry the investment risk, principally reside in the South African guaranteed non-profit annuity book, which is closely matched with gilts and semi-gilts. Other non-profit policies are also suitably matched based upon comprehensiveinvestment guidelines. Market risk on with-profit policies, where investment risk is shared, is minimised by appropriate bonus declaration practices.
In the US, for fixed annuities, policyholder option risk is managed by investing in fixed securities with durations within a half-year of the duration ofthe liabilities. Cash flows in any period are closely aligned to ensure any mismatch is not material. In addition, extensive interest rate scenario testingis carried out, as required by US regulatory authorities, in order to ensure that the amounts reserved are sufficient to meet the guaranteed obligations.The guaranteed returns provided under equity index annuities are dynamically hedged to ensure a close matching of option or futures payoffs to theliability growth. Hedging positions are reviewed daily to re-adjust them as necessary.
In Skandia’s unit-linked assurance operations, the Group has limited exposure to the volatility from equity markets, because in the main, equity pricerisk is borne by policyholders (subject to the impact on asset-based fees charged on policyholder funds). In respect of Skandia’s shareholders’ funds,equity price risks are addressed in Skandia’s investment policy, which provides for very limited opportunity for business units to invest their owncapital in equities or in units in equity funds.
In some areas of Skandia’s business, most notably its traditional life insurance business, Skandia is exposed to market risks arising from various forms of guarantees. Typically the policyholder is guaranteed a certain return regardless of the asset return achieved during the term of the policy.These risks are closely monitored and mitigated by applying asset and liability management techniques, ensuring that the proceeds from sale of assets are sufficient to meet the obligations to policyholders.
Sensitivities to adverse impacts of changes in market prices arising in the Group’s insurance operations are set out in the European Embedded Valuesupplementary basis information section of the Annual Report and Accounts on pages 259 to 261.

Old Mutual plc Annual Report and Accounts 2007Notes to the consolidated financial statements214
48 Financial risk continued
(d) Market risk continued(iii) Banking operationsThe principal market risks arising in the Group’s banking operations arise from:
> trading risk in Nedbank Capital; and> banking book interest rate risk arises from repricing and/or maturity mismatches between on and off-balance sheet components in all
banking businesses.
A comprehensive market risk framework is used to ensure that market risks are understood and managed. Governance structures are in place to achieve effective independent monitoring and management of market risk.
Trading riskMarket risk exposures from trading activities at Nedbank Capital are measured using Value-at-Risk (VaR), supplemented by sensitivity analysis, and stress-scenario analysis, and limit structures are set accordingly.
The VaR risk measure estimates the potential loss in pre-tax profit over a given holding period for a specified confidence level. The VaR methodology is a statistically defined, probability-based approach that takes into account market volatilities as well as risk diversification by recognising offsettingpositions and correlations between products and markets. Risks can be measured consistently across all markets and products, and risk measurescan be aggregated to arrive at a single risk number. The one-day 99 per cent VaR number used by Nedbank represents the overnight loss that hasless than 1 per cent chance of occurring under normal market conditions.
£m
Historical VaR (one-day, 99 per cent) by risk type Average Minimum Maximum Year-end
At 31 December 2007Foreign exchange 0.2 – 0.5 0.3Interest rate 1.0 0.7 1.6 1.0Equity products 0.9 0.4 2.0 0.5Diversification (0.3) – – (0.2)
Total VaR exposure 1.8 1.1 4.1 1.6
£m
Historical VaR (one-day, 99 per cent) by risk type Average Minimum Maximum Year-end
At 31 December 2006Foreign exchange 0.2 0.1 0.5 0.1Interest rate 1.3 0.6 1.8 0.9Equity products 1.2 0.4 2.2 1.6Diversification (0.5) – – (0.4)
Total VaR exposure 2.2 1.1 4.5 2.2
Notes to the consolidated financial statementsFor the year ended 31 December 2007 continued

Old Mutual plc Annual Report and Accounts 2007Notes to the consolidated financial statements 215
Fina
ncia
ls
48 Financial risk continued
(d) Market risk continued(iii) Banking operations continuedBanking book interest rate riskBanking book interest rate risk at Nedbank arises because:
> the bank writes a large quantum of prime-linked assets and raises fewer prime-linked deposits;> funding is prudently raised across the curve at fixed-term deposit rates that reprice only on maturity;> short-term demand-funding products reprice to different short-end base rates;> certain ambiguous maturity accounts are non-rate-sensitive; and> the bank has a mismatch in net non-rate-sensitive balances, including shareholders’ funds, that do not reprice for interest rate changes.
Nedbank uses standard analytical techniques to measure interest rate sensitivity within its banking book. This includes static reprice gap analysis and a point-in-time interest income stress testing for parallel interest rate moves over a forward-looking 12-month period. At 31 December 2007 the sensitivity of the banking book to a 1 per cent parallel reduction in interest rates was 1.7 per cent (2006: 2.3 per cent) of Nedbank’s total equity.
The table below shows the repricing profile of Nedbank’s banking book balance sheet, which highlights the fact that assets reprice quicker thanliabilities following derivative hedging activities.
£m
Up to 3 3<6 6 months 1<5 Over 5 Trading andInterest rate repricing gap months months < 1 year years years non-rate Total
At 31 December 2007Total assets 27,972 343 288 1,699 911 4,720 35,933Total liabilities and shareholders’ funds 20,683 1,348 3,186 1,166 407 8,743 35,933Interest rate hedging activities (3,122) 1,777 2,557 (998) (214) – –Repricing profile 4,166 (128) (342) 35 291 (4,022) –Cumulative repricing profile 4,166 4,038 3,696 3,731 4,022 – –Expressed as a % of total assets 11.6 11.2 10.3 10.4 11.2 – –
£m
Up to 3 3<6 6 months 1<5 Over 5 Trading andInterest rate repricing gap months months < 1 year years years non-rate Total
At 31 December 2006Total assets 21,786 291 362 1,805 786 6,043 31,073Total liabilities and shareholders’ funds 17,639 1,110 2,219 582 153 9,370 31,073Interest rate hedging activities 262 501 492 (772) (483) – –Repricing profile 4,409 (318) (1,365) 450 150 (3,326) –Cumulative repricing profile 4,409 4,091 2,726 3,176 3,326 – –Expressed as a % of total assets 14.2 13.2 8.8 10.2 10.7 – –
SkandiaBanken has low sensitivity to interest rate risk. The majority of SkandiaBanken’s deposit taking and lending activity, after risk coverage, is short-term, which means that interest rates are changed to reflect the situation in the money market. The interest rate risk that arises frommismatching of fixed rates of interest is reduced through interest rate swap agreements.

Old Mutual plc Annual Report and Accounts 2007Notes to the consolidated financial statements216
48 Financial risk continued
(e) Currency riskThe Group is exposed to effects of fluctuations in the prevailing foreign currency exchange rates on its financial position and cash flows. The principalforeign currency risk arises from the fact that the Group’s functional currency is GBP, whereas the functional currencies of its principal operations areSouth African Rand, US Dollar, Swedish Krona and Euro. The Group reduces this risk through the use of currency swaps, currency borrowings andforward foreign exchange contracts.
The table below shows the Group’s balance sheet by major currency at 31 December 2007.
£m
At 31 December 2007 ZAR GBP USD Euro SEK Other Total
AssetsGoodwill and other intangible assets 446 1,732 1,105 866 1,190 120 5,459Mandatory reserve deposits with central banks 611 – – – – 4 615Property, plant and equipment 530 24 20 5 3 26 608Investment property 1,117 361 – – – 1 1,479Deferred tax assets 120 41 431 17 77 (3) 683Investments in associated undertakings
and joint ventures 66 25 – – – (10) 81Deferred acquisition costs 96 513 1,423 138 13 70 2,253Reinsurers’ share of long-term business
policyholder liabilities 17 702 663 1 4 7 1,394Reinsurers’ share of general insurance liabilities – – – – – – –Deposits held with reinsurers – – 213 – – – 213Loans and advances 24,831 373 1,610 106 1,309 2,458 30,687Investments and securities 26,347 28,465 20,253 5,958 7,699 1,498 90,220Current tax receivable 7 68 – 1 – 7 83Client indebtedness for acceptances 158 – 4 – – 3 165Other assets 1,126 314 502 140 40 59 2,181Derivative financial instruments – assets 700 98 647 66 15 1 1,527Cash and cash equivalents 861 1,722 371 114 (174) 575 3,469Non-current assets held-for-sale 542 6 4 6 526 533 1,617
57,575 34,444 27,246 7,418 10,702 5,349 142,734
LiabilitiesLong-term business policyholder liabilities 25,663 31,347 13,862 2,976 7,773 2,630 84,251General insurance liabilities – – – – – – –Third party interests in consolidation of funds 488 1,406 147 – 1,506 – 3,547Borrowed funds 1,076 384 132 580 177 4 2,353Provisions 155 165 79 4 82 14 499Deferred revenue 28 340 – 58 – 36 462Deferred tax liabilities 405 339 399 160 100 10 1,413Current tax payable 176 119 8 6 4 7 320Other liabilities 3,187 1,621 938 172 169 93 6,180Liabilities under acceptances 158 1 4 – – 2 165Amounts owed to bank depositors 24,672 696 1,786 138 1,700 2,825 31,817Derivative financial instruments – liabilities 949 105 621 4 37 – 1,716Non-current liabilities held-for-sale 358 – – 6 – 50 414
57,315 36,523 17,976 4,104 11,548 5,671 133,137
Notes to the consolidated financial statementsFor the year ended 31 December 2007 continued

Old Mutual plc Annual Report and Accounts 2007Notes to the consolidated financial statements 217
Fina
ncia
ls
48 Financial risk continued
(e) Currency risk continued£m
At 31 December 2006 ZAR GBP USD Euro SEK Other Total
AssetsGoodwill and other intangible assets 380 1,877 1,092 954 1,044 20 5,367Mandatory reserve deposits with central banks 515 – – – – – 515Property, plant and equipment 445 20 14 12 6 2 499Investment property 789 347 – 2 – 11 1,149Deferred tax assets 97 12 328 14 58 2 511Investments in associated undertakings
and joint ventures 69 19 – – – (5) 83Deferred acquisition costs 82 302 1,094 81 5 14 1,578Reinsurers’ share of long-term business
policyholder liabilities 16 616 672 3 7 – 1,314Reinsurers’ share of general insurance liabilities 51 – – – – 6 57Deposits held with reinsurers 5 – 28 – 214 – 247Loans and advances 20,144 262 1,946 7 3,680 399 26,438Investments and securities 23,391 25,710 19,359 5,234 6,508 1,713 81,915Current tax receivable 15 28 7 5 4 1 60Client indebtedness for acceptances 182 3 3 – – – 188Other assets 1,565 20 1,352 106 56 7 3,106Derivative financial instruments – assets 1,140 2 105 1 15 – 1,263Cash and cash equivalents 983 1,472 309 140 165 32 3,101Non-current assets held-for-sale 36 – – 1,129 – – 1,165
49,905 30,690 26,309 7,688 11,762 2,202 128,556
LiabilitiesLong-term business policyholder liabilities 23,524 24,628 16,038 4,576 5,490 1,009 75,265General insurance liabilities 242 – – 6 – 17 265Third party interests in consolidation of funds 294 1,064 269 740 674 – 3,041Borrowed funds 782 508 127 347 214 – 1,978Provisions 197 197 2 12 126 8 542Deferred revenue 23 227 – 24 – 9 283Deferred tax liabilities 359 390 349 170 118 7 1,393Current tax payable 139 115 19 6 (3) 7 283Other liabilities 760 1,061 2,154 172 319 2,781 7,247Liabilities under acceptances 180 3 3 – – 2 188Amounts owed to bank depositors 20,431 596 2,024 – 3,819 260 27,130Derivative financial instruments – liabilities 1,026 16 6 8 15 – 1,071Non-current liabilities held-for-sale 31 – – 1,076 – – 1,107
47,988 28,805 20,991 7,137 10,772 4,100 119,793
A 10 per cent deterioration in the value of the major currencies shown above in relation to GBP would result in a reduction in the Group’sconsolidated equity holders’ funds of £1,810 million (2006: £1,007 million), and a similar decline in the average exchange rates for the year (as set out in note 2) would have led to a reduction in Adjusted operating profit of £146 million (2006: £133 million).
(f) Liquidity riskLiquidity risk is the risk that cash may not be available to pay obligations when due at a reasonable cost. Ultimate responsibility for liquidity riskmanagement rests with the Board of Directors, which has built an appropriate liquidity risk management framework for the management of theGroup’s short, medium and long-term funding and liquidity management requirements. The Group manages liquidity by maintaining adequatereserves, banking facilities and continuously monitoring forecast and actual cash flows and matching the maturity profiles of financial assets andliabilities. Individual businesses separately maintain and manage their local liquidity requirements according to their business needs, within the overall liquidity framework established by Old Mutual plc.
The contractual maturities of the Group’s financial liabilities are set out in the appropriate notes to the financial statements.
(g) Fiduciary activitiesThe Group provides custody, trustee, corporate administration, and investment management and advisory services to third parties that involve the Group making allocation and purchase and sale decisions in relation to a wide range of financial instruments. Those assets that are held in a fiduciary capacity are not included in these financial statements. Some of these arrangements involve the Group accepting targets for benchmarklevels of returns for the assets under the Group’s care. These services give rise to the risk that the Group will be accused of misadministration or under-performance. Total funds under management are disclosed in note 3(iv).

Old Mutual plc Annual Report and Accounts 2007Notes to the consolidated financial statements218
49 Insurance risk
The Group assumes insurance risk by issuing insurance contracts, under which the Group agrees to compensate the policyholder or other beneficiaryif a specified uncertain future event (the insured event) affecting the policyholder occurs. Insurance risk includes mortality and morbidity risk in thecase of long-term business or risk of loss (from fire, accident, or other source) in the case of general insurance.
For accounting purposes insurance risk is defined as risk other than financial risk. Contracts issued by the Group may include both insurance andfinancial risk; contracts with significant insurance risk are classified as insurance contracts, while contracts with no or insignificant insurance risk are classified as investment contracts. The Group’s approach to financial risk management has been described in note 48.
(a) Risk management objectives and policies for mitigating insurance riskThe Group’s exposure to insurance risk varies depending on the nature of its operations and their location. Consequently the Group’s policy is tomanage insurance risk separately through its principal operations, subject to appropriate central Corporate supervision and monitoring. The Group’sprincipal operations that incur significant insurance risk are:
> OMLAC (SA) – long-term insurance in South Africa> Old Mutual US Life – long-term insurance in the United States> Mutual & Federal – general insurance in South Africa
The Group’s other insurance operations include long-term insurance in Skandia’s unit-linked assurance operations in Scandinavia, the UnitedKingdom, Continental Europe and Latin America, Namibia, and Rest of World but do not give rise to significant insurance risks relative to the Group as a whole. Exposure to insurance risk in Skandia’s unit-linked assurance operations is limited, as the unbundled insurance component of thoseproducts is insignificant in comparison to the rest of the Old Mutual Group.
Whilst in general the Europe long-term businesses incur only limited insurance risk, the Nordic long-term business does have a portfolio of definedbenefit contracts that include guaranteed minimum fund values. The time-value of these guarantees have been valued using closed form solutions.
The Group effectively manages its insurance risks through the following mechanisms:
> the diversification of business over several classes of insurance and a number of geographical segments and large numbers of uncorrelatedindividual risks, by which the Group seeks to reduce variability in loss experience;
> the maintenance and use of sophisticated management information systems, which provide current data on the risks to which the business is exposed;
> actuarial models, which use the above information to calculate premiums and monitor claims patterns. Past experience and statistical methods are used;
> guidelines for concluding insurance contracts and assuming insurance risks. These include underwriting principles and product pricing procedures;> reinsurance, which is used to limit the Group’s exposure to large single claims and catastrophes. When selecting a reinsurer, consideration is
given to those companies that provide high security. In order to assess this, rating information from both public and private sources is used; and> the mix of assets, which is driven by the nature and term of the insurance liabilities. The management of assets and liabilities is closely monitored
to ensure that there are sufficient interest bearing assets to match the guaranteed portion of liabilities. Hedging instruments are used at times tolimit exposure to equity market and interest rate movements.
Notes to the consolidated financial statementsFor the year ended 31 December 2007 continued

Old Mutual plc Annual Report and Accounts 2007Notes to the consolidated financial statements 219
Fina
ncia
ls
49 Insurance risk continued
(b) Terms and conditions of long-term insurance business – South Africa and United StatesThe terms and conditions attaching to insurance contracts determine the level of insurance risk accepted by the Group. The following tables outlinethe general form of terms and conditions that apply to contracts sold in each category of business, and the nature of the risk incurred by the Group.
South AfricaPolicyholderparticipation in
Category Essential terms Main risks Policyholder guarantees investment return
Individual Life Mortality/morbidity rates may Mortality, morbidity Some investment performance, Varies1
Flexi business with cover be repriced (regular premium contracts) cover and annuity guarantees
Conventional with cover Charges fixed at inception and Mortality, morbidity Some investment performance Varies1
cannot be changed and annuity guarantees
Greenlight Charges fixed at inception and Mortality, morbidity, Rates fixed for a specified Nonecannot be changed for a specified term expense number of years
Group Schemes – Charges fixed at inception and Mortality including Rates fixed for a specified Nonefuneral cover cannot be changed for a specified HIV/AIDS, expense number of years
number of years
Employee Benefits – Rates are annually renewable Mortality, morbidity No significant guarantees, NoneGroup Assurance except for PHI claims in
payment for which benefit payment schedule is guaranteed
Non-profit annuity Regular benefit payments guaranteed Mortality, investment Benefit payment schedulein return for consideration is guaranteed None
With-profit annuity Regular benefit payments participating Investment Underlying pricing interest rate Yes2
in profits in return for consideration is guaranteed. Declared bonuses cannot be reduced
1 The extent of the Group’s discretion as to the allocation of investment return to policyholders varies based on the type of contract. Where the contracts are pure risk type, there is no sharing of investment returns. For other contracts, investment return is attributed to the policyholder. Declared bonuses may be either vesting and/or non-vesting(in which case they can be removed in adverse circumstances).
2 Smoothed bonus products constitute a significant proportion of the business. Particular attention is paid to ensuring that the declaration of bonuses is done in a responsiblemanner, such that sufficient reserves are retained for bonus smoothing purposes. Investment returns not distributed after deducting charges are credited to bonus smoothingreserves, which are used to support subsequent bonus declarations.
United StatesPolicyholderparticipation in
Category Essential terms Main risks Policyholder guarantees investment return
Life term Renewable term products offering coverage Mortality, expense Premium guarantees from Nonefor level periods ranging from 1 to 30 years 1 to 30 years, return of premium
guarantees
Universal life Flexible and fixed premium interest sensitive Mortality, expense Secondary non-lapse guarantees Yes, through life insurance with cash value build up (max of 15 years or to age 95); the crediting rate
cost of insurance (mortality charge) guarantees
Equity indexed annuities Single and flexible premium accumulation Mortality, investment Minimum caps, maximum Yes, through annuities with upside potential of equity spread guarantees the indexindexed returns on their account value
Fixed deferred annuities Single and flexible premium accumulation Mortality, investment Minimum guaranteed accumulation Limited – annuities rates and annuitisation rates crediting rates
are reset at specified intervals
Equity indexed Flexible premium interest sensitive whole Mortality, investment, Secondary non–lapse guarantees; Yes, through universal life life products with upside potential of equity expense cost of insurance (mortality charge) the index
indexed returns on their account value guarantees; minimum caps; maximum spread guarantees
Immediate (Payout) Regular benefit payments guaranteed Mortality, investment Benefit payment schedule NoneAnnuities in return for consideration is guaranteed
Variable Annuities Accumulation annuities with policyholder Mortality, investment Minimum guaranteed, death benefit Yes, throughinvestments in separate accounts and accumulation benefit separate
accounts
In addition to the specific risks identified above, the Group is subject to the risk that policyholders discontinue the insurance policy, through lapse or surrender.

Old Mutual plc Annual Report and Accounts 2007Notes to the consolidated financial statements220
49 Insurance risk continued
(c) Management of insurance risks – long-term businessThe table below summarises the variety of risks to which the Group’s long-term insurance business is exposed, and the methods by which the Group seeks to mitigate these risks.
Risk Definition Risk management
Underwriting Misalignment of policyholders to the appropriate Experience is closely monitored. For universal life pricing basis or impact of anti-selection, resulting in a loss business, mortality rates can be reset. Underwriting
limits, health requirements, spread of risks and training of underwriters all mitigate the risk.
HIV/AIDS Impact of HIV/AIDS on mortality rates and critical illness cover Impact of HIV/AIDS is mitigated wherever possible by writing products that allow for repricing on a regular basis or are priced to allow for the expected effects of HIV/AIDS. Tests for HIV/AIDS and other tests for lives insured above certain values are conducted. A negative test result is a prerequisite for acceptance at standard rates.
Medical developments Possible increase in annuity costs due to policyholders For non-profit annuities, improvements to mortality are living longer allowed for in pricing and valuation. Experience is
closely monitored. For with-profit annuity business, the mortality risk is carried by policyholders and any mortality profit or loss is reflected in the bonuses declared.
Changing financial The move to a lower inflationary environment may cause Value of guarantees, determined on a stochastic basis, market conditions more policyholder guarantees to be “in the money” included in current reserves (South Africa). Fewer and
lower guarantees are typically provided on new business (South Africa). Certain guarantees are reinsured (United States).
Policyholder behaviour Selection of more expensive options, or lapse and re-entry Experience is closely monitored, and policyholder when premium rates are falling, or termination of policy, behaviour is allowed for in pricing and valuation.which may cause the sale of assets at inopportune times
Catastrophe Natural and non-natural disasters, including war/terrorism, Catastrophe stop loss/excess of loss reinsurance treatycould result in increased mortality risk and payouts on policies in place which covers claims from one incident
occurring within a specified period between a range of specified limits.
Policy lapse A policyholder option to terminate the policy, which may Experience is closely monitored, and policyholder cause the sale of assets at inopportune times. This creates the behaviour is allowed for in pricing and valuation.risk of capital losses and/or reinvestment risk if market yields have decreased
Many of the above risks are concentrated, either geographically (in the case of catastrophe) or by line of business (for example, medicaldevelopments, HIV/AIDS). The Group, through diversification in the types of business it writes and its geographic spread, attempts to mitigate thisconcentration of risk. See “Segment Analysis”, in the preceding section, for illustration of this.
Notes to the consolidated financial statementsFor the year ended 31 December 2007 continued

Old Mutual plc Annual Report and Accounts 2007Notes to the consolidated financial statements 221
Fina
ncia
ls
49 Insurance risk continued
(d) Sensitivity analysis – long-term businessChanges in key assumptions used to value insurance contracts would result in increases or decreases to the insurance contract liabilities recorded,with a corresponding impact on profit/(loss) and/or shareholders’ equity. The effect of a change in assumption is mitigated by the following factors:
> offset (partial or full) through Deferred Acquisition Costs (DAC) amortisation in the case of US business;> the effect of locked-in assumptions for payout annuities and term insurance under US GAAP accounting, where assumptions underlying the
insurance contract liabilities are not changed until liabilities are not adequate after reflecting current best estimates; and> offset to the bonus stabilisation reserve in the case of mortality assumption changes for with-profit annuity business in South Africa.
The impact on Group equity resulting from a change in insurance contract liabilities or DAC balances at 31 December 2007 for long-term businesshas been estimated as follows (negative impact shown as positive figure):
% £m £m
Assumption Change South Africa US
Mortality and morbidity rates – assurance +10 155 1Mortality rates – annuities -10 31 (4)Discontinuance rates +10 (7) 30Expenses (maintenance) +10 47 6
The insurance contract liabilities recorded for the South African business are also impacted by the valuation discount rate assumed. Lowering this rate by 1 per cent would result in a net increase to the insurance contract liabilities, and decrease to profit, of £41 million (2006: £33 million). There is no impact for the US businesses as the valuation rate is locked-in.
South AfricaThe changes in insurance contract liabilities shown are calculated using the specified increase or decrease to the rates, with no change in chargespaid by policyholders.
The valuation interest rate sensitivity reflects a change in the valuation interest rates without any corresponding change in investment returns or in the expense inflation rate. It should be noted that where the assets and liabilities of a product are closely matched (e.g. non-profit annuitybusiness), the net effect has been shown since the assets and liabilities move in parallel.
United StatesThe assumption changes have relatively little impact on the US net IFRS insurance contract liabilities or DAC on life and immediate annuities, as assumptions are generally locked in. For universal life and deferred annuities, assumptions supporting the Present Value Future Profits (PVFP)/Deferred Acquisition Costs (DAC) amortisation are periodically updated for actual experience. Each of these assumption changes would trigger a DAC unlocking. The assumption changes specified do not approach the levels necessary to trigger a change in liabilities or DAC.
(e) Guarantees and options – long-term businessMany of the insurance contracts issued by the Group contain guarantees and options to policyholders, the ultimate liability for which will dependsignificantly on the number of policyholders exercising their options and on market and investment conditions applying at that time.
South AfricaCertain life assurance contracts include the payment of guaranteed values to policyholders on maturity, death, disability or survival. The publishedliabilities include the provision for both the intrinsic and time-value of the options and guarantees. The time-value of options and guarantees has been valued using a market-consistent stochastic asset model that is in keeping with the applicable professional guidance notes issued by theActuarial Society of South Africa (ASSA), PGN 110 in particular. The options and guarantees that could have a material effect on the amount, timingand uncertainty of future cash flows are described below. The required shock calculations have been performed as at 31 December 2007.

Old Mutual plc Annual Report and Accounts 2007Notes to the consolidated financial statements222
49 Insurance risk continued
(e) Guarantees and options – long-term business continuedSouth Africa continued
Product category Description of options and guarantees Required shock to bring out-of-the-money policies in-the-money
Individual business
Death, disability, point A closed block of unit-linked type and smoothed bonus An insignificant proportion of policies is currentlyand/or maturity business with an underlying minimum growth rate guarantee in-the-money (current actual cumulative investmentguarantees (4.28 per cent per annum for life and endowment business and return lower than that guaranteed). On average
4.78 per cent per annum for retirement annuity business), and a 54 per cent fall in asset value is required before smoothed bonus business with vested bonuses, applicable current out-of-the-money policies becomewhen calculating death,disability and maturity claims. in-the-money.
A small block of smoothed bonus savings business in Group None of these policies are currently in-the-money. Schemes that has death guarantees of premiums (net of fees) On average a 53 per cent fall in asset value is plus 4.25 per cent per annum investment return. required before current out-of-the-money policies
become in-the-money.
Guaranteed annuity Retirement annuities sold prior to June 1997 contain guaranteed A small proportion of policies is currently in-the-options annuity options, whereby the policyholder has an option to money (the current policy value lower than the
exchange the full retirement proceeds for a minimum level threshold annuity consideration at which the of annuity income at maturity. guaranteed annuity option becomes in-the-money).
On average a 250 basis points reduction in yield is required to bring current out-of-the-money policies to become in-the-money.
Group business
Vested bonuses in respect There is a significant pre-retirement savings smoothed bonus This business is currently out-of-the-money as theof pre-retirement portfolio. Vested bonuses affect the calculation of benefit aggregate market value exceeds the vested reserve. with-profits business payments when a member exits from the scheme as the On average a 34 per cent fall in assets is required
face value is paid out. If, however, a scheme terminates, to cause this block of business to become the lower of face and market value is paid out and the vested in-the-money.bonuses are not guaranteed.
United States
Product category Description of options and guarantees Required shock to bring out-of-the-money policies in-the-money
Death, disability, Crediting rates declared for the fixed deferred annuity block of 28 per cent of policies are currently in-the-money surrender point and/or business vest fully. They are subject to a minimum crediting rate and being credited the minimum rate. A 300 basis maturity guarantees which is specified in the contract. Minimum surrender values points drop in interest rates would bring 90 per cent
are determined by this rate. of policies in-the-money.
Equity indexed annuities offer minimum crediting rates on the The minimum surrender values of 18 per cent of fixed portion of the product, minimum surrender values based policies are currently in-the-money. A year of flat on this and credit equity participation annually as a percentage equity markets with no equity credits would bring an of equity growth subject to a maximum percentage. This equity additional 24 per cent in-the- money. Two years participation, which is subject to a minimum of zero per cent of no equity credits would result in 31 per cent of therefore vests annually. the portfolio being in-the-money. The equity exposure
is hedged using a dynamic hedging strategy.The variable annuities offered to off-shore customers through Old Mutual Bermuda can offer minimum death benefit The minimum death benefit of 19 per cent of guarantees. Death benefits are subject to a minimum of the policies is currently in-the-money. These risks are sum invested or value at any anniversary date if greater. dynamically hedged.50 per cent of variable annuity clients elect a minimum guaranteed account value on maturity.
The universal life policies specify a minimum crediting rate The minimum rate is currently being credited on to accumulate account balances. 73 per cent of the block.
Guaranteed annuity All deferred annuities offer a guaranteed annuitisation option The extent to which the policies are currently options on maturity. The rates are set conservatively and typically have in-the-money is negligible.
very low utilisation as customers in the United States value the choice inherent in a lump-sum payment.
No-lapse guarantees Certain universal life contracts contain a feature that guarantees 17 per cent of policies are currently in-the-money. that the contract will continue, even if values would otherwise be This risk is reinsured.insufficient, provided the customer has paid at least a stated amount of premium.
Assets and liabilities for all products are matched by duration and convexity. Investment mandates constrain tactical mismatches.
Notes to the consolidated financial statementsFor the year ended 31 December 2007 continued

Old Mutual plc Annual Report and Accounts 2007Notes to the consolidated financial statements 223
Fina
ncia
ls
49 Insurance risk continued
(f) General insurance risks and sensitivitiesMutual & Federal writes the following types of business within its commercial, risk finance and personal divisions:
Commercial Risk finance Personal
Fire ✓ ✓ ✓Accident ✓ ✓ ✓Personal accident ✓ ✓ ✓Motor ✓ ✓ ✓Engineering ✓ ✗ ✗Crop ✓ ✗ ✗Marine ✓ ✗ ✓Credit ✓ ✗ ✓
Underwriting guidelines are designed to ensure that underwritten risks are well diversified, and that terms and conditions, including premium rates,appropriately reflect the risk.
Reinsurance plays an extremely important role in the management of risk and exposure at Mutual & Federal. The Group makes use of a combinationof proportional and non-proportional reinsurance to limit the impact of both individual and event losses and to provide insurance capacity.
Involvement in any property catastrophe loss is limited to approximately £5 million for any one event and the level of catastrophe cover purchased is based on estimated maximum loss scenarios, in keeping with accepted market norms.
General insurance risk includes the following risks:
> occurrence risk – the possibility that the number of insured events will differ from those expected;> severity risk – the possibility that the costs of the events will differ from those expected; and> development risk – the possibility that changes may occur in the amount of an insurer’s obligation at the end of a contract period.
An increase of 10 per cent in the average cost of claims would require the recognition of an additional loss of £36 million (£35 million net ofreinsurance). Similarly, an increase of 10 per cent in the ultimate number of claims would result in an additional loss of £36 million (£35 millionnet of reinsurance).
The majority of the Group’s general insurance contracts are classified as ‘short-tailed’, meaning that any claim is settled within a year after the lossdate. This contrasts with the ‘long-tailed’ classes where the claims costs take longer to materialise and settle. The Group’s long-tailed business isgenerally limited to personal accident, third party motor liability and some engineering classes. In total the long-tail business comprises less than 5 per cent of an average year’s claim costs.

Old Mutual plc Annual Report and Accounts 2007Notes to the consolidated financial statements224
50 Reclassifications
(i) Income statement reclassificationsAs a result of the treatment of Mutual & Federal as a discontinued operation, together with certain changes in presentation of income statement linesfollowing the implementation of IFRS 7, the 2006 income statement has been restated, as set out in the table below.
£m
Reclassified asAs previously discontinued
Year ended 31 December 2006 Notes stated operation Restatements As restated
RevenueGross earned premiums 3(iii) 4,713 (687) – 4,026Outward reinsurance (267) 89 – (178)
Net earned premiums 4,446 (598) – 3,848Investment return (non-banking) 8 10,439 (101) (150) 10,188Banking interest and similar income 9 2,441 – (14) 2,427Banking trading, investment and similar income 10 – – 181 181Fee and commission income, and income from service activities 11 2,171 – – 2,171Other income 324 – (17) 307Share of associated undertakings’ profit after tax 22 6 – – 6
Total revenues 19,827 (699) – 19,128
ExpensesClaims and benefits (including change in insurance contract provisions) (7,958) 404 – (7,554)Reinsurance recoveries 245 (29) – 216
Net claims and benefits incurred (7,713) 375 – (7,338)Change in investment contract liabilities (4,655) – – (4,655)Losses on loans and advances (123) – – (123)Finance costs 12 (91) – – (91)Banking interest payable and similar expenses 13 (1,461) – – (1,461)Fee and commission expense, and other acquisition costs 14 (717) 125 – (592)Other operating and administrative expenses 15 (2,773) 64 – (2,709)Change in third party interest in consolidated funds (278) – – (278)Goodwill impairment 4(ii) (8) 3 – (5)Amortisation of PVIF and other acquired intangibles 4(ii) (379) – – (379)Profit on disposal of subsidiaries, associated undertakings
and strategic investments 4(iii) 85 – – 85
Total expenses (18,113) 567 – (17,546)
Profit before tax 1,714 (132) – 1,582Income tax expense 5(i) (621) 58 – (563)
Profit from continuing operations after tax 1,093 (74) – 1,019Profit from discontinued operations after tax 33 – 74 – 74
Profit after tax for the financial year 1,093 – – 1,093
Notes to the consolidated financial statementsFor the year ended 31 December 2007 continued

Old Mutual plc Annual Report and Accounts 2007Notes to the consolidated financial statements 225
Fina
ncia
ls
50 Reclassifications continued
(ii) Balance sheet reclassificationsAs part of the implementation of IFRS 7, Financial instruments: Disclosures, the 2006 balance sheet has been restated to more appropriately reflectthe Group’s financial assets and liabilities on the basis of the nature and characteristics of those financial instruments. As a result, a number of thepreviously disclosed balance sheet headings have been changed or removed and new balance sheet captions have been created. The analysis belowtabulates the reclassification adjustments that have been made.
£m
As Mandatorypreviously reserve Reinsurance Loans and Investments Other As
At 31 December 2006 stated deposits assets advances and securities adjustments restated
AssetsGoodwill and other intangible assets 5,367 – – – – – 5,367 Mandatory reserve deposits with central banks – 515 – – – – 515Property, plant and equipment 499 – – – – – 499 Investment property 804 – – – 345 – 1,149Deferred tax assets 511 – – – – – 511 Investments in associated undertakings 83 – – – – – 83 Deferred acquisition costs 1,578 – – – – – 1,578 Reinsurers’ share of long-term business
policyholder liabilities – – 1,314 – – – 1,314 Reinsurers’ share of general insurance liabilities – – 57 – – – 57 Reinsurers’ share of insurance contract provisions 763 – (763) – – – –Deposits held with reinsurers – – 247 – – – 247 Loans and advances 22,804 – – 3,662 – (28) 26,438 Investments and securities – – – (75) 80,852 1,138 81,915 Financial assets fair valued through
income statement 73,065 – (551) (3,578) (68,618) (318) –Other financial assets 11,568 – – – (10,806) (762) –Current tax receivable 60 – – – – – 60 Client indebtedness for acceptances – – – – – 188 188 Other assets 3,635 – (304) (9) (345) 129 3,106 Derivative financial instruments – assets 1,238 – – – 25 – 1,263 Short-term securities 1,819 – – – (1,442) (377) –Cash and cash equivalents 2,951 (515) – – 3 662 3,101 Non-current assets held-for-sale 1,165 – – – – – 1,165 Placements with other banks 665 – – – (3) (662) –
Total assets 128,575 – – – 11 (30) 128,556
The lines shown in italics above have been removed as part of the restatement.

Old Mutual plc Annual Report and Accounts 2007Notes to the consolidated financial statements226
Notes to the consolidated financial statementsFor the year ended 31 December 2007 continued
50 Reclassifications continued
(ii) Balance sheet reclassifications continued
£m
As Long-term General Banking previously Investments business insurance related Other As
At 31 December 2006 stated and securities liabilities liabilities liabilities adjustments restated
LiabilitiesInsurance contract provisions 22,495 – (22,230) (265) – – – Financial liabilities fair valued
through income statement 57,586 – (55,508) – (2,078) – –Long-term business policyholder liabilities – – 75,265 – – – 75,265 General insurance liabilities – – – 265 – – 265 Third party interests in consolidation of funds 3,041 – – – – – 3,041 Borrowed funds 1,676 – 302 – – – 1,978 Provisions 542 – – – – – 542 Deferred revenue 311 – – – – (28) 283 Deferred tax liabilities 1,393 – – – – – 1,393 Current tax payable 283 – – – – – 283 Other liabilities 5,266 – 2,171 – – (190) 7,247 Liabilities under acceptances – – – – – 188 188 Amounts owed to bank depositors 25,052 – – – 2,078 – 27,130 Derivative financial instruments – liabilities 1,060 11 – – – – 1,071 Non-current liabilities held-for-sale 1,107 – – – – – 1,107
Total liabilities 119,812 11 – – – (30) 119,793
Net assets 8,763 8,763
The lines shown in italics above have been removed as part of the restatement.

Old Mutual plc Annual Report and Accounts 2007Financial statements of the CompanyCompany balance sheet
227
Fina
ncia
ls
Financial statements of the CompanyCompany balance sheetAt 31 December 2007
£m
At At31 December 31 December
2007 2006Notes Restated
AssetsInvestments in Group subsidiaries 8 4,792 4,682Investments in associated undertakings 25 13Investments and securities 1 45 56Other assets (including intercompany) 2 2,943 2,698Derivative financial instruments – assets 3 72 101Cash balances 41 39
Total assets 7,918 7,589
LiabilitiesBorrowed funds 4 1,134 942Provisions 5 23 24Other liabilities (including intercompany) 6 1,745 1,644Derivative financial instruments – liabilities 3 31 21
Total liabilities 2,933 2,631
Net assets 4,985 4,958
Shareholders’ equityEquity attributable to equity holders 4,985 4,958
The Company’s financial statements on pages 227 to 237 were approved by the Board of Directors on 27 February 2008.
Jim Sutcliffe Jonathan NichollsChief Executive Group Finance Director

Old Mutual plc Annual Report and Accounts 2007Financial statements of the Company Company cash flow statement
228
Financial statements of the CompanyCompany cash flow statementFor the year ended 31 December 2007
£m
Year ended Year ended31 December 31 December
2007 2006
Cash flows from operating activitiesProfit before tax 423 161Capital gains/(losses) included in investment income 11 (3)Recognition of impairment losses (6) 6Other non cash amounts in profit (123) (222)
Non-cash movements in profit before tax (118) (219)
Loans, receivables and advances (6) (8)Other operating assets and liabilities 126 132
Changes in working capital 120 124
Net cash inflow from operating activities 425 66
Cash flows from investing activitiesProceeds from sale and maturity of other investments 95 –Net acquisition of financial investments – 14Acquisition of interests in subsidiaries (100) (1,269)Purchase of interest in associates and joint ventures (6) (1)Other investing cash flows 95 –
Net cash inflow/(outflow) from investing activities 84 (1,256)
Cash flows from financing activitiesExternal interest received 63 56External interest paid (112) (96)Intercompany interest received 1 –Intercompany interest paid (44) (47)Dividends paid to:
Ordinary shareholders of the Company (228) (159)Equity minority interests and preferred shares (40) (39)
Net proceeds from issue of ordinary shares 12 14Redemption of own shares (176) –Other debt issued 181 473Loan financing (paid to)/received from Group companies (158) 359
Net cash (outflow)/inflow from financing activities (501) 561
Net increase/(decrease) in cash and cash equivalents 8 (629)
Effects of exchange rate changes on cash and cash equivalents (6) (15)Cash and cash equivalents at beginning of the period 39 683
Cash and cash equivalents at end of the year 41 39
At 31 December 2006 and 2007 all cash and cash equivalents were in the form of cash balances. No cash from dividend income was receivedduring the year ended 31 December 2007 (2006: Nil).

Old Mutual plc Annual Report and Accounts 2007Financial statements of the Company Parent Company statement of changes in equity
229
Fina
ncia
ls
Millions £m
Perpetual Number of preferred
shares issued Share Share Other Retained callable Year ended 31 December 2007 and fully paid capital premium reserves earnings1 securities Total
Attributable to equity holders of the parent at beginning of the year 5,501 550 746 2,544 430 688 4,958
Profit for the year – – – – 456 – 456
Total recognised income and expense for the year – – – – 456 – 456Dividends for the year – – – – (268) – (268)Shares repurchased in the buyback programme – – – – (176) – (176)Net purchase of treasury shares – – – – (7) – (7)Issue of share capital by the Company – – 3 – – – 3Exercise of share options 9 1 8 – – – 9Fair value of equity settled share options – – – 10 – – 10
Attributable to equity holders of the parent at end of the year 5,510 551 757 2,554 435 688 4,985
Millions £m
Perpetual Number of preferred
shares issued Share Share Other Retained callable Year ended 31 December 2006 – Restated and fully paid capital premium reserves earnings1 securities Total
Attributable to equity holders of the parent at beginning of the year 4,090 410 730 – 480 688 2,308
Changes in equity arising in the year:Other – – – – (5) – (5)
Net income recognised directly in equity – – – – (5) – (5)Profit for the year – – – – 161 – 161
Total recognised income and expense for the year – – – – 156 – 156Dividends for the year – – – – (198) – (198)Net purchase of treasury shares – – – – (8) – (8)Issue of share capital by the Company2 1,400 139 3 2,532 – – 2,674Exercise of share options 11 1 13 – – – 14Fair value of equity settled share options – – – 12 – – 12
Attributable to equity holders of the parent at end of the year 5,501 550 746 2,544 430 688 4,958
1 Included within retained earnings of £435 million (2006: £430 million) are distributable reserves of £334 million (2006: £330 million). 2 Included within issue of share capital in the prior year are transaction costs totalling £2 million deducted from share premium. Also included within other reserves
is the merger reserve for the additional share consideration made in respect of the Skandia acquisition being the difference between the market value of the shares on date of issue and nominal value included as share capital.
£m
At At31 December 31 December
2007 2006
Merger reserve 2,532 2,532Share based payment reserve 22 12
Attributable to equity holders of the parent at end of the year 2,554 2,544
Financial statements of the Company Company statement of changes in equity For the year ended 31 December 2007

Financial statements of the CompanyNotes to the Company financial statementsFor the year ended 31 December 2007
Old Mutual plc Annual Report and Accounts 2007Financial statements of the CompanyNotes to the Company financial statements
230
1 Investments and securities
£m
At At 31 December 31 December
2007 2006
Equity securitiesUnlisted 44 54
Other 1 2
Total investments and securities 45 56
Investments and securities are regarded as current and non-current assets based on the intention with which the financial assets are held as well astheir contractual maturity profile. Of the amounts shown above, £44 million (2006: nil) are regarded as current and £1 million (2006: £56 million)are regarded as non-current.
2 Other assets £m
At At31 December 31 December
2007 2006
Other receivables 38 10Accrued interest and rent 52 28Other prepayments and accrued income 2 115Amounts owed by Group undertakings
Current 2 4Non-current 2,849 2,541
Total other assets 2,943 2,698
3 Derivative financial instruments
The following tables provide a detailed breakdown of the contractual or notional amounts and the fair values of the Company’s derivative financialinstruments outstanding at the year end. These instruments allow the Company and its customers to transfer, modify or reduce their foreign exchange and interest rate risks.
The Company undertakes transactions involving derivative financial instruments with other financial institutions. Management has established limitscommensurate with the credit quality of the institutions with whom it deals, and manages the resulting exposures such that a default by anyindividual counterparty is unlikely to have a materially adverse impact on the Company.
£m
Notional principals Fair values
At 31 December 2007 Positive values Negative values Assets Liabilities
Exchange rate contractsSwaps 508 318 64 16Forwards – 273 – 7
508 591 64 23Interest rate contractsSwaps 569 300 8 8
Total 1,077 891 72 31
£m
Notional principals Fair values
At 31 December 2006 Positive values Negative values Assets Liabilities
Exchange rate contractsSwaps 196 305 98 3Forwards – 242 – 1
196 547 98 4Interest rate contractsSwaps 17 637 3 17
Total 213 1,184 101 21
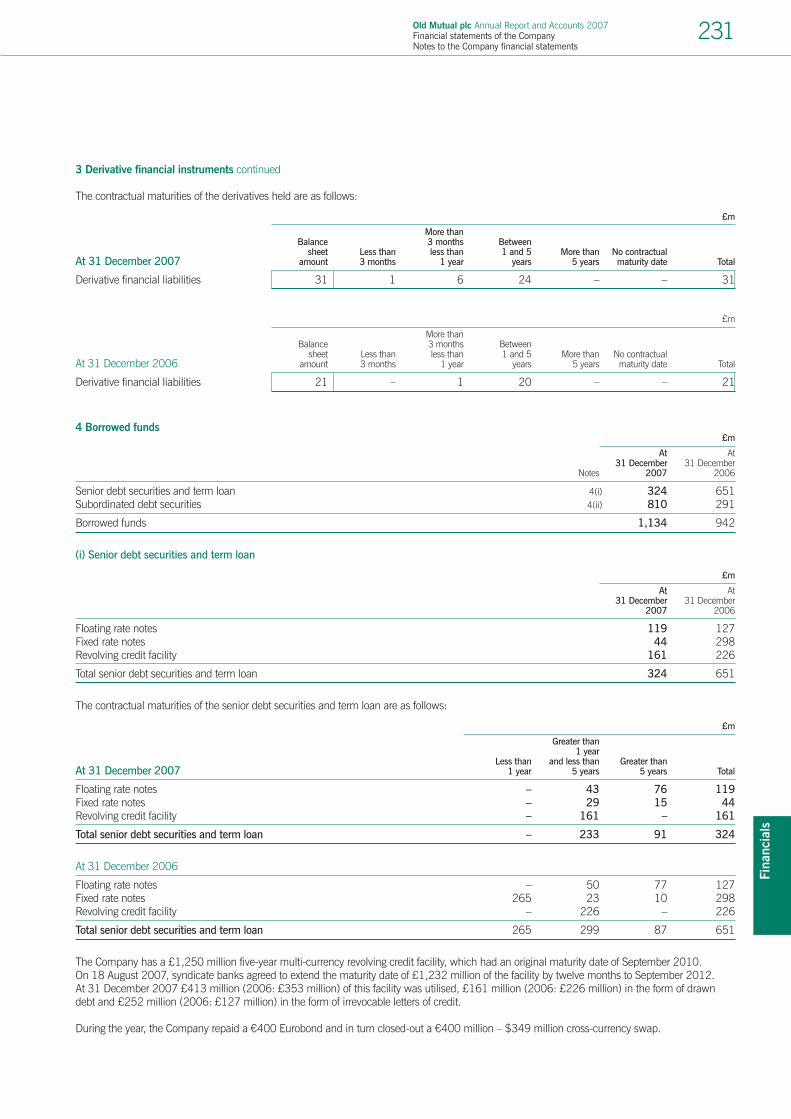
Old Mutual plc Annual Report and Accounts 2007Financial statements of the CompanyNotes to the Company financial statements
231
Fina
ncia
ls
3 Derivative financial instruments continued
The contractual maturities of the derivatives held are as follows:
£m
More thanBalance 3 months Between
sheet Less than less than 1 and 5 More than No contractual At 31 December 2007 amount 3 months 1 year years 5 years maturity date Total
Derivative financial liabilities 31 1 6 24 – – 31
£m
More thanBalance 3 months Between
sheet Less than less than 1 and 5 More than No contractual At 31 December 2006 amount 3 months 1 year years 5 years maturity date Total
Derivative financial liabilities 21 – 1 20 – – 21
4 Borrowed funds£m
At At31 December 31 December
Notes 2007 2006
Senior debt securities and term loan 4(i) 324 651Subordinated debt securities 4(ii) 810 291
Borrowed funds 1,134 942
(i) Senior debt securities and term loan
£m
At At31 December 31 December
2007 2006
Floating rate notes 119 127Fixed rate notes 44 298Revolving credit facility 161 226
Total senior debt securities and term loan 324 651
The contractual maturities of the senior debt securities and term loan are as follows:
£m
Greater than1 year
Less than and less than Greater thanAt 31 December 2007 1 year 5 years 5 years Total
Floating rate notes – 43 76 119Fixed rate notes – 29 15 44Revolving credit facility – 161 – 161
Total senior debt securities and term loan – 233 91 324
At 31 December 2006
Floating rate notes – 50 77 127Fixed rate notes 265 23 10 298Revolving credit facility – 226 – 226
Total senior debt securities and term loan 265 299 87 651
The Company has a £1,250 million five-year multi-currency revolving credit facility, which had an original maturity date of September 2010. On 18 August 2007, syndicate banks agreed to extend the maturity date of £1,232 million of the facility by twelve months to September 2012. At 31 December 2007 £413 million (2006: £353 million) of this facility was utilised, £161 million (2006: £226 million) in the form of drawn debt and £252 million (2006: £127 million) in the form of irrevocable letters of credit.
During the year, the Company repaid a €400 Eurobond and in turn closed-out a €400 million – $349 million cross-currency swap.

Old Mutual plc Annual Report and Accounts 2007Financial statements of the CompanyNotes to the Company financial statements
232
Financial statements of the CompanyNotes to the Company financial statementsFor the year ended 31 December 2007 continued
4 Borrowed funds continued
(ii) Subordinated debt securities£m
At At31 December 31 December
2007 2006
£300 million repayable 21 January 2016 (5.0 per cent)1 291 291€750 million repayable 18 January 2017 (4.5 per cent)2 519 –
Total subordinated debt securities 810 291
1 This bond, issued on 20 January 2006, has a maturity date of 21 January 2016 and pays a coupon of 5.0 per cent to 21 January 2011 and six month LIBOR plus 1.13 per cent thereafter. The coupon on the bonds was swapped into floating rate of six month STIBOR plus 0.50 per cent. The Company has the option to repay the bondsat par on 21 January 2011 and at six monthly intervals thereafter.
2 This bond, issued on 16 January 2007, has a maturity date of 18 January 2017 and pays a coupon of 4.5 per cent to 17 January 2012 and six month EURIBOR plus 0.96per cent thereafter. The principal and coupon on the bond was swapped equally into Sterling and US Dollars with coupons of six month STIBOR plus 0.34 per cent and sixmonth US LIBOR plus 0.31 per cent respectively. The Company has the option to repay the bonds at par on 17 January 2012 and at six monthly intervals thereafter.
5 Provisions £m
At At31 December 31 December
Notes 2007 2006
Post employment benefits 7 23 24
Total 23 24
6 Other liabilities£m
At At31 December 31 December
2007 2006
Accruals and deferred income 87 64Amounts owed to Group undertakings:
Current 26 1Non-current 1,610 1,579
Other liabilities 22 –
Total other liabilities 1,745 1,644

Old Mutual plc Annual Report and Accounts 2007Financial statements of the CompanyNotes to the Company financial statements
233
Fina
ncia
ls
7 Post employment benefits
The Company holds a provision in respect of the Old Mutual Staff Pension Fund Defined Benefit pension scheme, which provides benefits based onfinal pensionable pay for members within the Group. The assets of the scheme are held in separate trustee administered funds. Pension costs andcontributions relating to the scheme are assessed in accordance with the advice of qualified actuaries. Actuarial advice confirms that the current level of contributions payable to the scheme, together with existing assets, are adequate to secure members’ benefits over the remaining lives ofparticipating employees. The scheme is reviewed on a triennial basis. In the intervening years the actuary reviews the continuing appropriateness of the assumptions applied.
£m
Pension plans
Year to Year to31 December 31 December
Liability for defined benefit obligations 2007 2006
Change in projected benefit obligationProjected benefit obligation at beginning of the year 56 55Interest cost on benefit obligation 3 2Actuarial gains (3) (1)
Projected benefit obligation at end of the year 56 56
Change in plan assetsPlan assets at fair value at beginning of the year 32 27Actual return on plan assets 2 2Company contributions 3 3
Plan assets at fair value at end of the year 37 32
Net liability recognised in balance sheetFunded status of plan 19 24Unrecognised actuarial gains 4 –
Net amount recognised in balance sheet 23 24
£m
Pension plans
Year to Year to31 December 31 December
Expense recognised in the income statement 2007 2006
Expected return on plan assets (2) (2)Net actuarial losses recognised in the year – (1)
Total (2) (3)
Pension plans
Year to Year to31 December 31 December
Principal actuarial assumptions 2007 2006
Discount rate 5.50% 5.00%Future salary increases 4.65% 4.25%Price inflation 3.40% 3.00%Pensions in payment and deferred pensions inflation 3.40% 3.00%
Pension plans
Year to Year to31 December 31 December
Plan asset allocation 2007 2006
Equity securities 61% 65%Debt securities 36% 31%Other investments 3% 4%

Old Mutual plc Annual Report and Accounts 2007Financial statements of the CompanyNotes to the Company financial statements
234
Financial statements of the CompanyNotes to the Company financial statementsFor the year ended 31 December 2007 continued
8 Principal subsidiaries£m
At At31 December 31 December
2007 2006Restated
Balance at beginning of the year 4,682 730Acquisitions 100 3,940Additions 10 12
Balance at end of the year 4,792 4,682
During 2007, the Company further invested £50 million to buy-out the remaining minority interest holders in Försäkringsaktiebolaget Skandia (publ).The Company completed this transaction to become a 100% shareholder on 22 October 2007.
On 19 October 2007, the Company completed the purchase of the entire share capital of Skandia ELAM Holdings Limited for a total consideration of £50 million.
On 19 December 2007, the Company completed the purchase of the entire share capital of Millpencil Limited and Papercoast Limited for a totalconsideration of £1,000 each.
Additions represent increases to the Company’s investments in subsidiary undertakings in respect of movements on the share based payments reserve.
The Company holds the following interests in Group companies:
At 31 December 2007 Country of incorporation Class of shares % interest held
Commsale 2000 Ltd England & Wales Ordinary 100%Constantia Insurance Company (Guernsey) Limited Guernsey Ordinary 100%Försäkringsaktiebolaget Skandia (publ) Sweden Ordinary 100%Millpencil Limited England & Wales Ordinary 100%Old Mutual Properties Limited England & Wales Ordinary 100%OM Group (UK) Ltd England & Wales Ordinary 100%Old Mutual (UK) Nominees Ltd England & Wales Ordinary 100%Old Mutual Asset Solutions Ltd England & Wales Ordinary 100%Old Mutual Capital Funding (Jersey) Limited Jersey Ordinary 100%Old Mutual Finance (No.2) Limited England & Wales Ordinary 50%Old Mutual Finance (No.4) Limited England & Wales Ordinary 100%Papercoast Limited England & Wales Ordinary 100%Selestia Holdings Limited England & Wales Ordinary 100%Skandia Europe and Latin America (Holdings) Limited England & Wales Ordinary 100%
9 Contingent liabilities £m
At At31 December 31 December
2007 2006
Irrevocable letters of credit 252 127
The contingent liabilities relate to letters of credit issued in support of the operations of a subsidiary company. Any liability arising from these letters ofcredit would be recovered from the subsidiary company.

Old Mutual plc Annual Report and Accounts 2007Financial statements of the CompanyNotes to the Company financial statements
235
Fina
ncia
ls
10 Related parties
Old Mutual plc enters into transactions with its subsidiaries in the normal course of business. These are principally related to funding of the Group’s businesses and head office functions. Details of loans, including balances due from/to the Company and terms and conditions thereon are set out below.
There are no transactions entered into by the Company with associated undertakings.£m
Balance dueBalance sheet information from/(to)
At 31 December 2007SubsidiariesOM Group (UK) Limited1 2,634Primemajor 4Skandia companies2 209Old Mutual International companies3 4Global Edge Technologies Pty Limited4 1Bermuda Holding companies5 (306)Old Mutual (SA) companies6 (517)Old Mutual Financial Services companies (224)Old Mutual Business Services Limited (56)Old Mutual Capital Funding L.P..7 (377)Constantia Insurance Company (Guernsey) Limited (1)Pointspirit8 (108)Nedbank companies (25)OMLA Holdings Limited (22)Sandlord Limited (1)Other related partiesFairbairn Trust Company Limited9 25
1 Loan with OM Group (UK) Limited includes loan advances of $2,115 million, £1,184 million and A$32 million (2006: $3,246 million, £465 million and A$32 million). The Dollar facility expires 30 September 2010, whilst the Sterling facility expires 30 June 2010 and both facilities terms are at LIBOR +0.50 per cent. The Australian Dollarfacility expires 30 November 2011 and interest is charged at 8.60 per cent per annum. In addition, the balance also includes a subordinated loan of £350 million (2006: £350 million), with a term agreement of 6.75 per cent, switching to floating rate (LIBOR +2.48 per cent) after 15 years.
2 Loan with Skandia companies includes a SEK 5 billion multicurrency revolving credit facility with Skandia Capital AB, where the agreement states that interest be received at LIBOR +0.15 per cent. This facility is due to mature on 31 January 2008, although it is expected to be rolled forward. In addition, the balance also includes a £250 million revolving credit facility with Skandia Europe and Latin America (Holdings) Limited, where the agreement states that interest be received at LIBOR +0.15 per cent. This facility is due to mature on 7 December 2012.
3 Loan with Old Mutual International companies includes one contingent loan facility (£4 million) where the agreement states that no interest is charged and no maturity dateis set in place.
4 Subordinated loan with Global Edge Technologies Pty Limited of R6.5 million. There is no interest charged in respect to this advance as it has been fully provided for in thebooks of Old Mutual plc.
5 Loan with Bermuda Holding companies include a number of revolving credit facilities where the terms state that the interest is variable and the loan is payable on demand. In addition, the balance includes one discount note for $480 million. Interest is charged at LIBOR +0.10 per cent margin.
6 Loan with Old Mutual (SA) companies include three discount notes totalling $1,018 million. Interest is charged at LIBOR +0.10 per cent margin.7 Loan with Old Mutual Capital Funding L.P. is a $750 million subordinated cumulative perpetual note which bears interest at 8.00 per cent per annum payable quarterly.8 Loan with Pointspirit is a £500 million revolving credit facility where the agreement states that interest be charged at LIBOR +0.15 per cent. This facility is due to mature
on 17 May 2009.9 This represents amounts paid to the Fairbairn Trust Company Limited in respect of an ‘ESOP’ for the purchase of the Company’s own shares.
£m
Balance dueBalance sheet information from/(to)
At 31 December 2006SubsidiariesOM Group (UK) Limited 2,503Primemajor 4Skandia companies 37Global Edge Technologies Pty Limited 1Bermuda Holding companies (289)Old Mutual (SA) companies (502)Old Mutual Financial Services companies (216)Old Mutual Business Services Limited (28)Old Mutual Capital Funding L.P. (373)Constantia Insurance Company (Guernsey) Limited (1)Old Mutual (Netherlands) BV (147)Fairbairn Investment Company Limited (2)OMLA Holdings Limited (22)Other related partiesFairbairn Trust Company Limited 19

Old Mutual plc Annual Report and Accounts 2007Financial statements of the CompanyNotes to the Company financial statements
236
Financial statements of the CompanyNotes to the Company financial statementsFor the year ended 31 December 2007 continued
10 Related parties continued
£m
Ordinary OtherInterest dividends amounts
received/ received/ received/Income statement information (paid) (paid) (paid)
2007Subsidiaries 97 470 (48)
£m
Ordinary OtherInterest dividends amounts
received/ received/ received/Income statement information (paid) (paid) (paid)
2006Subsidiaries 92 150 (39)
11 Financial risk
The Company is exposed to financial risk through its financial assets, financial liabilities and intercompany balances. The most important components of financial risk for the Company are interest rate risk, currency risk and credit risk. These risks arise from open positions in interest rate, currency and equity products, all of which are exposed to general and specific market movements.
The principal risk the Company faces is currency risk. The Company’s functional and presentational currency is GBP, whereas the functionalcurrencies of its principal subsidiaries are South African Rand, US Dollar, Swedish Krona and Euro.
(a) Capital risk managementOld Mutual plc is the holding company of the Group and is responsible for the raising and allocation of capital in line with the Group’s capitalmanagement policies set out in note 48 to the consolidated financial statements and for ensuring the operational funding and regulatory capital needs of the holding company and its subsidiaries are met at all times.
(b) Currency riskThe Company is exposed to effects of fluctuations in the prevailing foreign currency exchange rates on its financial position and cash flows. Theprincipal foreign currency risk arises from the fact that the Company’s functional currency is GBP, whereas the functional currency of its principaloperations is South African Rand, US Dollar, Swedish Krona and Euro. The Company hedges some of this currency translation risk through currencyswaps, currency borrowings and forward foreign exchange rate contracts. Exchange rate exposures are managed within approved policy parametersutilising forward exchange contracts and currency swap agreements.
The table below summarises the Company’s exposure to foreign currency exchange rate risk:
£m
At 31 December 2007 GBP ZAR USD Euro SEK Other Reclassification Total
AssetsInvestments in associated undertakings 25 – – – – – – 25Derivative financial instruments – assets1 29 – 33 4 – – 6 72Placements with other banks 18 15 8 – – – – 41Investments and securities 45 – – – – – – 45Other non-financial assets 5,108 – 1,111 36 1,466 14 – 7,735
Total assets 5,225 15 1,152 40 1,466 14 6 7,918
LiabilitiesOther borrowed funds2 272 – 359 43 470 – (10) 1,134Derivative financial instruments – liabilities3 8 5 1 – 1 – 16 31Other non-financial liabilities 484 1 1,220 36 27 – – 1,768
Total liabilities 764 6 1,580 79 498 – 6 2,933

Old Mutual plc Annual Report and Accounts 2007Financial statements of the CompanyNotes to the Company financial statements
237
Fina
ncia
ls
11 Financial risk continued
(b) Currency risk continued£m
At 31 December 2006 GBP ZAR USD Euro SEK Other Reclassification Total
AssetsInvestments in associated undertakings 13 – – – – – – 13Derivative financial instruments – assets – – – – – – 101 101Placements with other banks 27 – 10 2 – – – 39Investments and securities 56 – – – – – – 56Other non-financial assets 5,560 112 1,669 14 – 13 – 7,368
Total assets 5,656 112 1,679 16 – 13 101 7,577
LiabilitiesOther borrowed funds 55 – 314 12 463 – 98 942Derivative financial instruments – liabilities 10 1 – 6 1 – 3 21Other non-financial liabilities 481 – 1,179 3 5 – – 1,668
Total liabilities 546 1 1,493 21 469 – 101 2,631
1 The derivative financial instruments of £6 million (2006: £101 million) represent currency hedge for borrowed funds and so have been reclassified and netted against USDborrowed funds.
2 The total of £359 million (USD) (2006: £314 million) and £470 million (SEK) (2006: £463 million) of borrowed funds have been net of hedges in derivative financialinstruments of £6 million and £16 million respectively.
3 The derivative financial instruments of £16 million (2006: £3 million) represent currency hedge for borrowed funds and so have been reclassed and netted against SEK borrowed funds.
(c) Credit risk The Company is principally exposed to credit risk through cash at bank, which it holds to back shareholder liabilities. Credit risk is managed byplacing limits on exposures to any single counterparty, or groups of counterparties and to geographical and industry segments. Credit risk is monitoredwith reference to established credit rating agencies with limits placed on exposure to below investment grade holdings.
The following table analyses the credit rating (Standard & Poor’s or equivalent) by investment grade of financial assets bearing credit risk:
£m
Sub-investment Investment Grade Grade
At 31 December 2007 (AAA to BBB) (BB and lower) Not rated Total
Investments in associated undertakings – – 25 25Derivative financial instruments – assets 72 – – 72Investments and securities – – 45 45Placements with other banks 41 – – 41
Financial assets bearing credit risk 113 – 70 183
At 31 December 2006
Investments in associated undertakings – – 13 13Derivative financial instruments – assets 101 – – 101Investments and securities – – 56 56Placements with other banks 39 – – 39
Financial assets bearing credit risk 140 – 69 209
(d) Interest rate riskInterest rate risk is the risk that fluctuating interest rates will unfavourably affect the Company’s earnings and the value of its assets, liabilities and capital.
The Company employs currency and interest rate swap transactions to mitigate against the impact of changes in the fair values of its borrowed funds.Details of the arrangements in place are shown in the Group Accounts note 29 (Hedge accounting).
12 Post balance sheet eventsPost year end, the Company provided a guarantee in relation to a block of business sold by one of its subsidiary undertakings, on behalf of a thirdparty. The maximum cumulative aggregate liability of the Guarantor in relation to all and any claims under this guarantee shall in no event exceed£126 million, over a 10 year period. The probability of payment of such an amount is considered very low.
Old Mutual plc Annual Report and Accounts 2007Statement of directors’ responsibilities in relation to the European Embedded Value basis supplementary information
238
Statement of directors’ responsibilities in relation to the European Embedded Value basis supplementary information
The directors of Old Mutual plc have chosen to prepare supplementary information in accordance with the European Embedded Value Principlesissued in May 2004 by the CFO Forum (“the EEV Principles”), as supplemented by the Additional Guidance on European Embedded ValueDisclosures issued in October 2005. When compliance with the EEV Principles is stated, those principles require the directors to preparesupplementary information in accordance with the Embedded Value Methodology (“EVM”) contained in the EEV Principles and to disclose and explain any non-compliance with the EEV Guidance included in the EEV Principles.
In preparing the EEV supplementary information, the directors have:
> prepared the supplementary information in accordance with the EEV Principles;> identified and described the business covered by the EVM;> applied the EVM consistently to the covered business;> determined assumptions on a realistic basis, having regard to past, current and expected future experience and to any relevant external data,
and then applied them consistently; and> made estimates that are reasonable and consistent.
Old Mutual plc Annual Report and Accounts 2007Independent auditors’ report to Old Mutual plc on the European Embedded Value (EEV) basis supplementary information
239
Fina
ncia
ls
Independent auditors’ report to Old Mutual plc on the European Embedded Value (EEV) basis supplementary information
We have audited the EEV basis supplementary information (“the supplementary information”) of Old Mutual plc (“the Company”) on pages 240 to 261 in respect of the year ended 31 December 2007. The supplementary information has been prepared in accordance with the EuropeanEmbedded Value Principles issued in May 2004 by the CFO Forum, as supplemented by the Additional Guidance on European Embedded ValueDisclosures issued in October 2005 (together “the EEV Principles”) using the methodology set out on page 242 and assumptions set out on pages254 to 258. The supplementary information should be read in conjunction with the Group financial statements which are on pages 111 to 226.
This report is made solely to the Company in accordance with the terms of our engagement. Our audit work has been undertaken so that we mightstate to the Company those matters we have been engaged to state in this report and for no other purpose. To the fullest extent permitted by law, we do not accept or assume responsibility to anyone other than the Company for our audit work, for this report, or for the opinions we have formed.
Respective responsibilities of directors and auditorAs described in the statement of directors’ responsibilities on page 238, the directors’ responsibilities include preparing the supplementaryinformation on the EEV basis in accordance with the EEV Principles. Our responsibilities, as independent auditor, in relation to the supplementaryinformation are established in the United Kingdom by the Auditing Practices Board, by our profession’s ethical guidance and the terms of our engagement.
Under the terms of engagement we are required to report to the Company our opinion as to whether the supplementary information has been properlyprepared in accordance with the EEV Principles using the methodology set out on page 242 and assumptions set out on pages 254 to 258. We alsoreport if we have not received all the information and explanations we require for this audit.
Basis of audit opinionWe conducted our audit having regard to International Standards on Auditing (UK and Ireland) issued by the Auditing Practices Board. An auditincludes examination, on a test basis, of evidence relevant to the amounts and disclosures in the supplementary information. It also includes anassessment of the significant estimates and judgments made by the directors in the preparation of the supplementary information, and of whether the accounting policies applied in the preparation of the supplementary information are appropriate to the Group’s circumstances, consistently applied and adequately disclosed.
We planned and performed our audit so as to obtain all the information and explanations which we considered necessary in order to provide us with sufficient evidence to give reasonable assurance that the supplementary information is free from material misstatement, whether caused by fraud or other irregularity or error. In forming our opinion, we also evaluated the overall adequacy of the presentation of the supplementary information.
OpinionIn our opinion, the EEV basis supplementary information for the year ended 31 December 2007 has been properly prepared in accordance with the EEV Principles using the methodology set out on page 242 and assumptions set out on pages 254 to 258.
KPMG Audit PlcChartered Accountants8 Salisbury SquareLondon EC4Y 8BB27 February 2008

Old Mutual plc Annual Report and Accounts 2007European Embedded Value basis supplementary information240
£m
Year ended Year ended31 December 31 December
Income statement on a European Embedded Value basis 2007 2006
South AfricaCovered business 345 480Asset management 98 96Banking 622 534
1,065 1,110
United StatesCovered business 63 98Asset management 162 140
225 238
EuropeCovered business 350 403Asset management 26 (1)Banking 14 11
390 413
Other 2 1
1,682 1,762Finance costs (119) (130)Other shareholders’ expenses (31) (27)
Adjusted operating profit before tax* 1,532 1,605Adjusting items 315 652
EEV profit before tax (net of income tax attributable to policyholder returns) 1,847 2,257Income tax attributable to shareholders (472) (514)
EEV profit for the financial year after tax from continuing operations 1,375 1,743EEV profit for the financial year after tax from discontinued operations 57 74
EEV profit for the financial year after tax 1,432 1,817
Profit for the financial year attributable to:Equity holders of the parent 1,155 1,531Minority interests
Continuing ordinary shares 213 236Discontinued ordinary shares 14 –Preferred securities 50 50
EEV profit for the financial year after tax 1,432 1,817
* For long-term business and general insurance businesses, adjusted operating profit is based on a long-term investment return, includes investment returns on life funds’investments in Group equity and debt instruments, and is stated net of income tax attributable to policyholder returns. For the US Asset Management business it includescompensation costs in respect of certain long-term incentive schemes defined as minority interests in accordance with IFRS. For all businesses, adjusted operating profitexcludes goodwill impairment, the impact of acquisition accounting, revaluations of put options related to long-term incentive schemes, the impact of closure of unclaimedshares trusts, profit on disposal of subsidiaries, associated undertakings and strategic investments, dividends declared to holders of perpetual preferred callable securities, and fair value gains on certain Group debt movements.
European Embedded Value basis supplementary informationFor the year ended 31 December 2007

Old Mutual plc Annual Report and Accounts 2007European Embedded Value basis supplementary information 241
Fina
ncia
ls
£m
Year ended Year ended31 December 31 December
Adjusted operating profit after tax attributable to ordinary equity holders 2007 2006
Adjusted operating profit before tax 1,532 1,605Tax on adjusted operating profit (366) (426)
Adjusted operating profit after tax from continuing operations 1,166 1,179Adjusted operating profit after tax from discontinued operations 61 39
Adjusted operating profit after tax 1,227 1,218Minority interests
Continuing ordinary shares (225) (239)Discontinued ordinary shares (20) –Preferred securities (50) (50)
Adjusted operating profit after tax attributable to ordinary equity holders 932 929
Adjusted operating profit of the covered business
Adjusted operating profit for the covered business 758 981South Africa 345 480United States 63 98Europe 350 403
Tax on adjusted operating profit for the covered business 154 253South Africa 75 125United States 21 32Europe 58 96
Adjusted operating profit after tax for the covered business 604 728South Africa 270 355United States 42 66Europe 292 307
Tax on adjusted operating profit comprisesCovered business 154 253Other business 212 173
Tax on adjusted operating profit 366 426
Adjusted operating earnings per share*
Based on adjusted operating profit from continuing operations (pence) 16.5p 17.3pBased on adjusted operating profit from discontinued operations (pence) 0.7p 0.5p
Adjusted operating earnings per share (pence) 17.2p 17.8p
EEV earnings per share
Based on EEV profit from continuing operations (pence) 21.5p 29.4pBased on EEV profit from discontinued operations (pence) 0.8p 1.2p
Basic EEV earnings per ordinary share (pence) 22.3p 30.6p
Adjusted weighted average number of shares – millions 5,411 5,222Weighted average number of shares – millions 5,176 4,997
* Adjusted operating earnings per share is calculated on the same basis as adjusted operating profit, but is stated after tax and minority interests. It excludes income attributable to Black Economic Empowerment trusts of listed subsidiaries. The calculation of the adjusted weighted average number of shares includes own shares held in policyholders’ funds and Black Economic Empowerment trusts.

Old Mutual plc Annual Report and Accounts 2007Notes to the European Embedded Value basis supplementary information
242
Notes to the European Embedded Value basis supplementary informationFor the year ended 31 December 2007
1 Basis of preparation
This supplementary information has been prepared in accordance with the European Embedded Value (EEV) Principles issued in May 2004 by the European CFO Forum. The directors acknowledge their responsibility for the preparation of this supplementary information.
The results for the year ended 31 December 2007 and the position at that date have been prepared on the same basis as that used in the 31 December 2006 EEV supplementary statements.
Covered business is defined as long-term business in the primary Financial Statements. Covered business is traditional life insurance, long-termhealthcare and accident insurance, savings, pensions and annuity business written by the life insurance subsidiaries. The results of Groupcompanies providing administration and distribution services have been included to the extent that they relate to covered business. Following theacquisition of Skandia, covered business now includes the traditional life and unit-linked assurance business of Skandia. Institutional investmentplatform pension business written in the United Kingdom has been excluded as it is more appropriately classified as mutual fund business. Coveredbusiness results do not include services provided by Group investment management companies. Unallocated Group holding expenses have beenincluded to the extent that they relate to the covered business.
For South Africa the covered business excludes individual unit trusts and some Group market-linked business written by the asset managementcompany through the life company as profits from this business arise in the asset management companies.
The treatment within this supplementary information of all business other than the covered business is the same as the primary financial statements.
Under the EEV methodology, profit is recognised as it is earned over the life of the products defined within the covered business.
The embedded value of the covered business is the sum of the shareholders’ adjusted net worth in respect of the covered business and the value of the in-force covered business. The Group embedded value includes the value of all other business at the book value detailed in the primaryfinancial statements. Adjusted Group embedded value is a measure used by the directors to assess the shareholders’ interest in the value of theGroup, includes the Group’s listed banking and general insurance subsidiaries at market value. The value of deferred consideration due in respect of Black Economic Empowerment partners and the value of own shares held in the employee share trust scheme are also included.
The adjusted net worth of the covered business is the market value of shareholders’ assets held in respect of the covered business, and consists of the required capital and free surplus. The level of required capital of the covered business reflects the level of capital considered by the directors to be appropriate to manage the business allowing for minimum local statutory requirements (or equivalent where there is no local requirement),their internal assessment of the market, insurance and operational risk inherent in the underlying products and the level of capital required by rating agencies in respect of our United States business in order to maintain the desired credit rating. The level of required capital is on average134, 278 and on average 137 per cent of the minimum local statutory requirements in South Africa, United States and Europe respectively as at 31 December 2007. The free surplus comprises the market value of assets allocated to the covered business in excess of the required capital.The required capital in respect of the South Africa covered business is partially covered by the market value of the Group’s investments in bankingand general insurance in South Africa. On consolidation these investments are shown separately.
The value of in-force covered business is the present value at the appropriate risk discount rate (which incorporates a risk margin) of the statutorydistributable profits to shareholders projected to arise from the in-force covered business on a best estimate basis, less a deduction for the cost of holding the required level of capital.
Statutory distributable profit arises from the difference between amounts charged to policyholders for guarantees, expenses and insurance and the actual experience of these items, together with the investment return earned on shareholders’ assets.
Allowance has been made for the cost (intrinsic value) of financial options and guarantees to policyholders in the local statutory reserves accordingto local requirements. In South Africa and Europe an investment guarantee reserve on a stochastic basis is included in the local statutory reserves. A deduction from the value of in-force has been made to allow for the impact of future variability of investment returns on the cost of policyholderfinancial options and guarantees (time-value) to the extent that it is not already included in the statutory reserves. This time-value has beendetermined using stochastic modelling techniques and represents the difference between the average value of shareholder cash flows under manygenerated economic scenarios and the deterministic shareholder value under the best estimate assumptions. In the generated economic scenariosallowance is made, where appropriate, for the effect of management and or policyholder actions in different circumstances.
The directors believe that the embedded value of the covered business is calculated in accordance with the CFO Forum EEV Principles. Themethodology and assumptions adopted within this supplementary information, including the recalibration of risk margins as referred to on page255, follow the same approach as adopted in prior years. The CFO Forum is in the process of developing a new set of principles and guidance inorder to formalise an approach to market consistent embedded values (MCEVs). It is expected that these new principles and guidance will bepublished later this year. Old Mutual’s intention is to review its embedded value approach in the light of the new MCEV principles and guidancefollowing their publication, and to carry out and publish a restatement onto the new MCEV basis in due course.

Old Mutual plc Annual Report and Accounts 2007Notes to the European Embedded Value basis supplementary information
243
Fina
ncia
ls
2 Adjustments applied in determining adjusted operating profit£m
Year ended Year ended 31 December 31December
Analysis of adjusting items 2007 2006
Income/(expense)Goodwill impairment and amortisation of non-covered business acquired intangible assets (11) (12)Profit on disposal of subsidiaries, associated undertakings and strategic investments 25 84Short-term fluctuations in investment returns (including economic assumption changes) for the covered business 206 543Cost of capital methodology and modelling changes 14 55Material revision to actuarial models – (57)Dividends declared to holders of perpetual preferred callable securities 40 39Closure of unclaimed share trusts 1 –US Asset Management equity plans and minority holders 11 –Fair value gains on Group debt instruments 29 –
Adjusting items 315 652
3 Reconciliation of movements in Group embedded value£m
Year ended Year ended31 December 31 December
2007 2006
Group embedded value at beginning of the year 7,117 5,808Opening adjustments (67) –
Restated Group embedded value at beginning of the year 7,050 5,808
Change in equity arising in the yearFair value gains/(losses) 21 (4)Net investment hedge (13) 75Currency translation differences/exchange differences on translating foreign operations 116 (1,285)Aggregate tax effects of items taken directly to or transferred from equity 13 3Other movements 29 99
Net income recognised directly into equity 166 (1,112)Profit for the year 1,155 1,531
Total recognised income and expense for the year 1,321 419Dividend for the year (373) (321)Share buy back (177) –Net issue of ordinary share capital by the Company 3 2,676Exercise of share options 9 9Fair value equity settled share options 36 28Adjustment to include Skandia long-term businesson a statutory solvency basis as at the date of acquisition – (3,575)Acquired value of in-force business of Skandia after fair value opening adjustments – 2,073
Group embedded value at end of the year 7,869 7,117

Old Mutual plc Annual Report and Accounts 2007Notes to the European Embedded Value basis supplementary information
244
Notes to the European Embedded Value basis supplementary informationFor the year ended 31 December 2007 continued
4 Components of Group embedded value£m
At At31 December 31December
2007 2006
Adjusted net worth attributable to ordinary equity holders of the parent 3,431 2,945Equity 7,961 7,237Adjustment to include long-term business on a statutory solvency basis:
South Africa 147 129United States (621) (742)Europe (2,581) (2,477)
Adjustment for market value of life funds’ investments in Group equity and debt instruments held in life funds 428 502Adjustment to remove perpetual preferred callable securities and accrued dividends (688) (668)Adjustment to exclude acquisition goodwill and intangibles from the covered business:
United States (60) (58)Europe (1,155) (978)
Value of in-force business 4,438 4,172Value of in-force business before items listed below 4,872 4,648Additional time-value of financial options and guarantees (50) (51)Cost of required capital (378) (398)Minority interest in value of in-force (6) (27)
Group embedded value 7,869 7,117
Group embedded value per share (pence) 145.6p 129.4p
Return on Group embedded value (RoEV) per annum 13.2% 13.8%Number of shares in issue – millions 5,405 5,501
The adjustments to include long-term business on a statutory solvency basis reflect the difference between the net worth of each business on thestatutory basis (as required by the local regulator) and their portion of the Group’s consolidated equity shareholders’ funds. In South Africa, thesevalues exclude items that are eliminated or shown separately on consolidation (such as Nedbank, Mutual & Federal and intercompany loans). For some European territories the value excludes deferred acquisition costs which are effectively part of the value of in-force of the business.
The RoEV is calculated as the adjusted operating profit after tax and minority interests of £932 million divided by the opening Group embedded value.
The impact of marking all debt to market value is an increase of £120 million at 31 December 2007 (2006: £61 million).
5 Components of adjusted Group embedded value£m
At At 31 December 31 December
2007 2006
Pro forma adjustments to bring Group investments to market valueGroup embedded value 7,869 7,117Adjustment to bring listed subsidiaries to market value 1,163 1,341
South Africa banking business 957 1,094South Africa general insurance business 206 247
Adjustment for present value of Black Economic Empowerment scheme deferred consideration 179 188
Adjustment for value of own shares in ESOP schemes* 158 218
Adjusted Group embedded value 9,369 8,864
Adjusted Group embedded value per share (pence) 173.3p 161.1p
Number of shares in issue – millions 5,405 5,501
* Includes adjustment for value of excess own shares in employee share scheme trusts. The movement in value between 31 December 2006 and 31 December 2007 is due to the realisation of shares and is offset by a corresponding increase in equity in the Group embedded value.

Old Mutual plc Annual Report and Accounts 2007Notes to the European Embedded Value basis supplementary information
245
Fina
ncia
ls
6 Reconciliation of Group embedded value of the covered business to the adjusted Group embedded value£m
At At31 December 31 December
2007 2006
Embedded value of the covered business 6,861 6,453Adjusted net worth* 2,423 2,281Value of in-force business** 4,438 4,172
Adjusted net worth of the asset management business 1,637 1,527South Africa 232 169United States 1,245 1,174Europe 160 184
Value of the banking business 2,716 2,482South Africa (market value) 2,411 2,231Europe (adjusted net worth) 305 251
Market value of the general insurance businessSouth Africa 405 458
Net other business (35) (19)
Adjustment for present value of Black Economic Empowerment scheme deferred consideration 179 188
Adjustment for value of own shares in ESOP schemes 158 218
Perpetual preferred securities (US$ denominated) (458) (458)
Perpetual preferred callable securities (688) (688)GBP denominated (350) (350)Euro denominated (338) (338)
Debt (1,406) (1,317)Rand denominated (221) (219)USD denominated (408) (438)GBP denominated (272) (54)SEK denominated (505) (594)Euro denominated – (12)
Accrued dividends to holders of perpetual preferred callable securities – 20
Adjusted Group embedded value 9,369 8,864
* Adjusted net worth is after the elimination of intercompany loans.** Net of minority interests.

Old Mutual plc Annual Report and Accounts 2007Notes to the European Embedded Value basis supplementary information
246
Notes to the European Embedded Value basis supplementary informationFor the year ended 31 December 2007 continued
7 Components of embedded value of the covered business£m
At At31 December 31 December
2007 2006
Embedded value of the covered business 6,861 6,453Adjusted net worth 2,423 2,281Value of in-force business 4,438 4,172
South AfricaAdjusted net worth 1,470 1,408Required capital 1,159 1,249Free surplus 311 159
Value of in-force business 1,207 1,160Value of in-force business before items listed below 1,392 1,347Cost of required capital (179) (183)Minority interest in value of in-force (6) (4)
United StatesAdjusted net worth 505 454Required capital 424 390Free surplus 81 64
Value of in-force business 564 690Value of in-force business before items listed below 703 806Additional time-value of financial options and guarantees (48) (47)Cost of required capital (91) (69)
EuropeAdjusted net worth 448 419Required capital 324 270Free surplus 124 149
Value of in-force business 2,667 2,322Value of in-force business before items listed below 2,777 2,495Additional time-value of financial options and guarantees (2) (4)Cost of required capital (108) (146)Minority interest in value of in-force – (23)
Adjusted net worth of the covered business excludes acquired intangibles and goodwill.

Old Mutual plc Annual Report and Accounts 2007Notes to the European Embedded Value basis supplementary information
247
Fina
ncia
ls
8 Analysis of covered business embedded value results (after tax)
£m
Year ended Year ended31 December 31 December
2007 2006
Required Free Adjusted Value of Adjusted Value ofTotal covered business capital surplus net worth in-force Total net worth in-force Total
Embedded value of the covered business at beginning of the year 2,281 4,172 6,453 2,242 1,979 4,221
Acquired embedded value of Skandia – – – 391 2,085 2,476Opening fair value adjustments for Skandia (181) 114 (67) (47) (12) (59)
1,903 197 2,100 4,286 6,386 2,586 4,052 6,638New business contribution 193 (601) (408) 674 266 (420) 664 244Expected return on existing business
– return on value of in-force – – – 351 351 – 317 317Expected return on existing business
– transfer to net worth – 685 685 (685) – 625 (625) –Expected release of required capital
– transfer to free surplus (226) 226 – – – – – –Experience variances 36 60 96 (111) (15) 12 16 28Operating assumption changes 4 (20) (16) (102) (118) (1) (98) (99)Recalibration of risk-margins – – – (15) (15) – 89 89Expected return on adjusted net worth 116 19 135 – 135 149 – 149
Adjusted operating profit after tax 123 369 492 112 604 365 363 728Investment return variances on in-force business 2 25 27 (1) 26 16 177 193Investment return variances on adjusted net worth (27) 229 202 – 202 298 – 298Effect of economic assumption changes 15 (17) (2) (80) (82) (2) (42) (44)Material revision to actuarial models – – – – – – (38) (38)Methodology changes impacting cost
of required capital (117) 117 – 13 13 – 46 46
Profit after tax (4) 723 719 44 763 677 506 1,183Exchange rate movements 10 5 15 85 100 (419) (362) (781)Change in minority interest (2) 3 1 23 24 (10) (24) (34)Net transfers from covered business – (412) (412) – (412) (553) – (553)
Embedded value of the covered business at end of the year 1,907 516 2,423 4,438 6,861 2,281 4,172 6,453

Old Mutual plc Annual Report and Accounts 2007Notes to the European Embedded Value basis supplementary information
248
Notes to the European Embedded Value basis supplementary informationFor the year ended 31 December 2007 continued
8 Analysis of covered business embedded value results (after tax) continued
South Africa covered business£m
Year ended Year ended31 December 31 December
2007 2006
Required Free Adjusted Value of Adjusted Value ofcapital surplus net worth in-force Total net worth in-force Total
Embedded value of the covered business at beginning of the year 1,249 159 1,408 1,160 2,568 1,725 1,266 2,991
New business contribution 67 (78) (11) 72 61 (14) 83 69Expected return on existing business
– return on value of in-force – – – 133 133 – 136 136Expected return on existing business
– transfer to net worth – 172 172 (172) – 178 (178) –Expected release of required capital
– transfer to free surplus (93) 93 – – – – – –Experience variances (33) 33 – (15) (15) 1 (16) (15)Operating assumption changes – (22) (22) 1 (21) 12 (27) (15)Recalibration of risk-margins – – – – – – 59 59Expected return on adjusted net worth 99 13 112 – 112 121 – 121
Adjusted operating profit after tax 40 211 251 19 270 298 57 355Investment return variances on in-force business (3) 22 19 41 60 8 115 123Investment return variances on adjusted net worth – 225 225 – 225 293 – 293Effect of economic assumption changes (13) 11 (2) (39) (41) – (24) (24)Methodology changes impacting cost
of required capital (117) 117 – 19 19 – 19 19
Profit after tax (93) 586 493 40 533 599 167 766Exchange rate movements 3 6 9 8 17 (354) (272) (626)Change in minority interest – (3) (3) (1) (4) (6) (1) (7)Net transfers from covered business – (437) (437) – (437) (556) – (556)
Embedded value of the covered business at end of the year 1,159 311 1,470 1,207 2,677 1,408 1,160 2,568
Annual return on embedded value (RoEV)% 10.8% 13.6%
Experience variances were positively impacted by higher risk profits and one-off profits arising from the BOE private client joint venture and the value of business acquired from Medshield offset by negative expense variance partly due to special project expenditure and persistency in the Retail business.
The main operating assumption changes are a reduction in the secondary tax rate levied on dividends from 12.5 per cent to 10.0 per cent, a change in the way the interest rate is determined for unrecouped expenses for the Flexi product to more closely align movements in surrender value tounderlying client values, an increase in the reserves held in respect of policyholder investment guarantees, and strengthening of the persistencyassumptions in the Retail Affluent market.
This year, the risk-margin recalibration exercise did not result in any movement due to non-economic factors. Last year the impact was significantpartly to reflect the business sold since the previous exercise.
The methodology changes impacting cost of required capital reflect modelling improvements and methodology changes to the required capital which reduced the cost of required capital. In aggregate, required capital is subject to a minimum of 130 per cent of the minimum statutory capitalrequirements. A minimum level equal to the minimum statutory capital requirements is no longer imposed at a product level.
The net transfers from covered business in 2007 mainly include dividend payments (net of dividends received from Nedbank and Mutual & Federal),tax on the special dividend, the purchase of additional shares in Nedbank, as well as head office expenses.
The embedded value for South Africa is after the adjustment for market value of life funds’ investments in Group equity and debt instruments.
Return on embedded value is the adjusted operating profit after tax divided by opening embedded value in local currency.

Old Mutual plc Annual Report and Accounts 2007Notes to the European Embedded Value basis supplementary information
249
Fina
ncia
ls
8 Analysis of covered business embedded value results (after tax) continued
United States covered business£m
Year ended Year ended31 December 31 December
2007 2006
Required Free Adjusted Value of Adjusted Value ofcapital surplus net worth in-force Total net worth in-force Total
Embedded value of the covered business at beginning of the year 390 64 454 690 1,144 487 678 1,165
New business contribution 108 (193) (85) 157 72 (128) 173 45Expected return on existing business
– return on value of in-force – – – 61 61 – 62 62Expected return on existing business
– transfer to net worth – 98 98 (98) – 76 (76) –Expected release of required capital
– transfer to free surplus (120) 120 – – – – – –Experience variances 46 10 56 (81) (25) (11) 1 (10)Operating assumption changes 23 4 27 (104) (77) (12) (44) (56)Recalibration of risk-margins – – – – – – 10 10Expected return on adjusted net worth 9 2 11 – 11 15 – 15
Adjusted operating profit after tax 66 41 107 (65) 42 (60) 126 66Investment return variances on in-force business – – – (36) (36) – 18 18Investment return variances on adjusted net worth (27) (6) (33) – (33) (3) – (3)Effect of economic assumption changes – – – (11) (11) – (15) (15)Material revision to actuarial models – – – – – – (38) (38)Methodology changes impacting cost
of required capital – – – (4) (4) – 9 9
Profit after tax 39 35 74 (116) (42) (63) 100 37Exchange rate movements (5) – (5) (10) (15) (61) (88) (149)Net transfers to covered business – (18) (18) – (18) 91 – 91
Embedded value of the covered business at end of the year 424 81 505 564 1,069 454 690 1,144
Annual return on embedded value (RoEV)% 3.8% 6.1%
The segment results of United States include Old Mutual Reassurance (Ireland) Limited (OMRe), which provides reinsurance to the United States life companies, and Old Mutual (Bermuda) Limited.
The negative experience variances mainly arose from mortality losses on single premium immediate annuities and revised modelling of caps on theFixed Indexed annuity block.
The main operating assumption changes include a strengthening of mortality assumptions on single premium immediate annuities and certainmodelling changes made as a result of the actuarial review of the underlying models. The economic assumption changes include revisions to theassumptions used in modelling spreads under Fixed Indexed annuity products. In 2006, the actuarial model used to calculate the embedded valuewas replaced and upgraded. This resulted in a reduction in the embedded value in 2006.
The methodology changes impacting cost of required capital reflects a change in the required capital in OMRe to accommodate the new Irish Capital Requirements.
The transfer to covered business is in respect of the release of capital and head office expenses.
Return on embedded value is the adjusted operating profit after tax divided by opening embedded value in local currency.

Old Mutual plc Annual Report and Accounts 2007Notes to the European Embedded Value basis supplementary information
250
Notes to the European Embedded Value basis supplementary informationFor the year ended 31 December 2007 continued
8 Analysis of covered business embedded value results (after tax) continued
Europe covered business£m
Year ended Year ended31 December 31 December
2007 2006
Required Free Adjusted Value of Adjusted Value ofcapital surplus net worth in-force Total net worth in-force Total
Embedded value of the covered business at beginning of the year 419 2,321 2,740 30 35 65
Acquired embedded value of Skandia – – – 391 2,085 2,476Opening fair value adjustments (181) 114 (67) (47) (12) (59)
264 (26) 238 2,435 2,673 374 2,108 2,482New business contribution 18 (330) (312) 445 133 (278) 408 130Expected return on existing business
– return on value of in-force – – – 157 157 – 119 119Expected return on existing business
– transfer to net worth – 415 415 (415) – 371 (371) –Expected release of required capital
– transfer to free surplus (13) 13 – – – – – –Experience variances 23 17 40 (15) 25 22 30 52Operating assumption changes (19) (2) (21) 1 (20) (1) (27) (28)Recalibration of risk-margins – – – (15) (15) – 20 20Expected return on adjusted net worth 8 4 12 – 12 13 – 13
Adjusted operating profit after tax 17 117 134 158 292 127 179 306Investment return variances on in-force business 5 3 8 (6) 2 8 44 52Investment return variances on adjusted net worth – 10 10 – 10 8 – 8Effect of economic assumption changes 29 (29) – (30) (30) (2) (3) (5)Methodology changes impacting cost
of required capital – – – (1) (1) – 18 18
Profit after tax 51 101 152 121 273 141 238 379Exchange rate movements 12 (1) 11 87 98 (4) (2) (6)Minority interest (3) 7 4 24 28 (4) (23) (27)Net transfers to covered business – 43 43 – 43 (88) – (88)
Embedded value of the covered business at end of the year 324 124 448 2,667 3,115 419 2,321 2,740
Annual return on embedded value (RoEV)% 10.9% 13.4%
The segmental results of Europe include the Skandia Life companies in the United Kingdom, Nordic region, Europe and Latin America.
The positive experience variances mainly arose from a higher level of fee income than that assumed, and a contribution from profits not valued, which was partially offset by negative expense variances.
The main operating assumption changes are the reduction in the future corporation tax assumption in the UK region from 30 per cent to 28 per centand in Germany from 39 per cent to 30 per cent. Lower asset based charges for the tick-the-box collective agreements and some corporate businesshave been assumed in the Nordic region. The Nordic region has also introduced annuitisation of the corporate business and valued the Waiver of Premium business. Persistency assumptions have been strengthened in Nordic, Italy and Germany.
The risk-margin recalibration impact arose in the Nordic region partly due to the introduction of annuitisation, where there is now the possibility toinvest further during the retirement phase, which extended the duration of contracts.
The transfers from covered business include internal financing arrangements, allocation of head office expenses and the sale of VIDA Spain.
Return on embedded value is the adjusted operating profit after tax divided by opening embedded value in local currency.

Old Mutual plc Annual Report and Accounts 2007Notes to the European Embedded Value basis supplementary information
251
Fina
ncia
ls
9 Value of new business (after tax)
The tables below set out the geographic analysis of the value of new business (VNB) after tax. Annual premium equivalent (APE) is calculated asrecurring premiums plus 10 per cent of single premiums. New business profitability is measured by both the ratio of the VNB to the APE as well as to the present value of new business premiums (PVNBP), and shown under APE margin and PVNBP margin below. PVNBP is defined as thepresent value of regular premiums plus single premiums for any given period and is calculated on the same assumptions as for the value of newbusiness contribution.
£m
Year ended Year ended31 December 31 December
2007 2006
Recurring premiumsSouth Africa 237 234United States 39 49Europe 415 357
691 640
Single premiumsSouth Africa 1,115 1,344United States 2,962 1,977Europe 6,607 5,476
10,684 8,797
APESouth Africa 348 368United States 335 247Europe 1,077 905
1,760 1,520
PVNBPSouth Africa 2,323 2,497United States 3,150 2,221Europe 8,405 7,111
13,878 11,829
VNBSouth Africa 61 69United States 72 45Europe 133 130
266 244
APE marginSouth Africa 18% 19%United States 21% 18%Europe 12% 14%
15% 16%
PVNBP marginSouth Africa 2.7% 2.8%United States 2.3% 2.0%Europe 1.6% 1.8%
1.9% 2.1%

Old Mutual plc Annual Report and Accounts 2007Notes to the European Embedded Value basis supplementary information
252
Notes to the European Embedded Value basis supplementary informationFor the year ended 31 December 2007 continued
9 Value of new business (after tax) continued
The value of new individual unit trust linked retirement annuities and pension fund asset management business written by the South Africa long-term business, which amounted to £435 million in the year ended 31 December 2007, is excluded as the profits on this business arise in theasset management business. The South African healthcare business secured the administration of a large new scheme (Medshield) with recurringpremium flow of £92 million per year in April 2007. This premium income has been excluded from the value of new business due to its one-offnature. The value of new business also excludes premium increases arising from indexation arrangements in respect of existing business, as these are already included in the value of in-force business.
The value of new institutional investment platform pensions business written in the United Kingdom, which amounted to £16 million in the yearended 31 December 2007, is excluded as this is more appropriately classified as mutual fund business.
10 Product analysis of new covered business premiums
£m
Year ended Year ended31 December 31 December
2007 2006South Africa product analysis Recurring Single Recurring Single
Total business 237 1,115 234 1,344
Individual business 208 641 203 694Savings 50 494 55 530Protection 77 5 74 5Annuity – 141 – 157Retail mass market 81 1 74 2
Group business 29 474 31 650Savings 5 394 3 494Protection 11 1 9 1Annuity – 79 – 155Healthcare 13 – 19 –
South Africa contract analysis
Total business* 237 1,115 234 1,344
Individual business 208 641 203 694Insurance contracts 123 132 118 151Investment contracts with discretionary participating features 44 35 42 23Other investment contracts 41 474 43 520
Group business 29 474 31 650Insurance contracts 24 80 28 156Investment contracts with discretionary participating features 5 160 3 110Other investment contracts – 234 – 384
United States product analysis
Total business 39 2,962 49 1,977Fixed deferred annuity – 97 – 81Fixed indexed annuity – 960 – 1,161Variable annuity – 1,757 – 574Life 39 18 49 –Immediate annuity – 130 – 161
United States contract analysis
Total business* 39 2,962 49 1,977Insurance contracts 39 2,790 49 1,761Other investment contracts – 172 – 216
Europe product analysis
Total business 415 6,607 357 5,476Unit-linked assurance 413 6,601 348 5,455Life 2 6 9 21
* Within the preceding contract analysis the classification of insurance contracts, investment contracts with discretionary participating features and other investment contracts is in accordance with the primary financial statements definitions. All categories of business are subject to EEV accounting.

Old Mutual plc Annual Report and Accounts 2007Notes to the European Embedded Value basis supplementary information
253
Fina
ncia
ls
11 Drivers of new business value£m
Year ended31 December
2007APE PVNBP
Total covered business Margin % Margin %
Year ended 31 December 2006 16.2 2.1
Change in volume (0.7) (0.1)Change in product mix (0.4) (0.1)Change in country mix +0.6 +0.1Change in operating assumptions (0.4) –Change in economic assumptions +0.2 –Exchange rate movements (0.3) (0.1)
Year ended 31 December 2007 15.2 1.9
APE PVNBPSouth Africa covered business Margin % Margin %
Year ended 31 December 2006 18.7 2.8
Change in volume +0.6 +0.2Change in product mix +0.4 –Change in operating assumptions (2.1) (0.3)
Year ended 31 December 2007 17.6 2.7
The APE and PVNBP per cent margin changes are calculated in local currency.
APE PVNBPUnited States covered business Margin % Margin %
Year ended 31 December 2006 18.3 2.0
Change in volume – (0.2)Change in product mix +3.1 +0.5
Year ended 31 December 2007 21.4 2.3
The APE and PVNBP per cent margin changes are calculated in local currency.
APE PVNBPEurope covered business Margin % Margin %
Year ended 31 December 2006 15.5 1.8Opening adjustment (0.6) (0.1)
Adjusted prior year 14.9 1.7Change in volume (2.5) (0.2)Change in product mix (1.7) (0.2)Change in country mix +0.9 +0.1Change in operating assumptions +0.1 +0.1Change in economic assumptions +0.3 –Exchange rate movements +0.3 +0.1
Year ended 31 December 2007 12.3 1.6
The prior year new business margins in Nordic have been restated to incorporate the impact of the Liv-Link agreement negotiated in 2007.
The margins for the 2006 year incorporate the full year’s new business.
APE and PVNBP per cent margin changes are calculated in Sterling.

Old Mutual plc Annual Report and Accounts 2007Notes to the European Embedded Value basis supplementary information
254
Notes to the European Embedded Value basis supplementary informationFor the year ended 31 December 2007 continued
12 Assumptions
IntroductionThe principal assumptions used in the calculation of the value of in-force business and VNB are set out below. The assumptions are best estimate and actively reviewed.
> Adjusted operating profit is calculated on closing operating assumptions and opening economic assumptions.> The effect of increases in premiums over the period for policies in-force has been included in the value of in-force business only where such
increases are associated with indexation arrangements. Other increases in premiums of existing policies are included in the value of new business.> New schemes written on which recurring single premiums are expected to be received on a regular basis are treated as new business. The
annualised premium is recognised as recurring premium new business at inception of the scheme and is determined by annualising the actualpremiums received during the year in question. Subsequent recurring single premiums received in future years are not treated as new business, as these have already been provided for in calculating the value of in-force business.
> The value of new business has been based on opening economic assumptions and closing operating assumptions accumulated to the period end.This is a change from the 2006 year-end where closing economic assumptions were used.
> The sensitivity of the embedded value, the value of in-force and value of new business to key assumptions are set out in note 13.
Economic assumptionsThe pre-tax investment and economic assumptions are updated every six months to reflect the economic conditions prevailing on the valuation date.Risk-free rates have a duration similar to that of the underlying liabilities. Equity and property risk premiums incorporate both historical relationshipsand the directors’ view of future projected returns in each geography.
> The risk-margins have been calculated using an approach consistent to that adopted as at 31 December 2006, and reflect the distinctive risks of the products in the respective business units. These risk-margins do not include the risk associated with financial options and guarantees.
> Where applicable, rates of future bonuses or crediting rates have been set at levels consistent with the investment return assumptions. Projectedcompany taxation is based on the current tax basis that applies in each country.
> For the South Africa business projected taxation is based on the current tax basis that applies in each country. Full allowance has been made forsecondary tax on companies (STC) at a rate of 10 per cent that may be payable in South Africa. Full account has been taken of the impact ofcapital gains tax. It has been assumed that 10 per cent of the equity portfolio (excluding Group subsidiaries) will be traded each year. The effectivetax rate was 33 per cent for South Africa and zero per cent for Namibia, except for the investment return on capital for which the attributed tax wasderived from the primary accounts.
> For the United States full allowance has been made for existing tax attributes of the companies, including the use of existing carry-forwards andpreferred tax credit investments. The effective rate was 33 per cent.
> For the Europe businesses, projected tax is based on the current tax rate that applies in each country. In Sweden, no allowance has been made for additional tax on dividends remitted to the UK. Tax has however been allowed for on dividends to be remitted to the UK from the Isle of Man.The effective tax rates for Nordic, United Kingdom and the balance of Europe were a range of 2 to 28 per cent, 23 per cent and a range of 13 to 45 per cent.
At At31 December 31 December
South Africa 2007 2006
Risk-free rate (10 year Government bond) 8.5% 7.9%Cash return 6.5% 5.9%Equity return 12.0% 11.4%Property return 10.0% 9.4%Expense inflation 5.5% 4.9%Traditional embedded value risk discount rate1 11.2% 10.8%
Risk-free rate 8.5% 7.9%Risk-margin2 2.1% 2.0%Cost of financial options and guarantees3 – –Cost of required capital in excess of statutory minimum4 0.6% 0.9%
United States
Risk-free rate (10 year Treasury yield) 4.0% 4.7%Expense inflation 3.0% 3.0%New money yield assumed* 5.8% 6.6%Net portfolio earned rate 6.0% 5.8%Traditional embedded value risk discount rate1 9.3% 9.8%
Risk-free rate 4.0% 4.7%Risk-margin2 3.4% 3.0%Cost of financial options and guarantees3 0.9% 1.0%Cost of required capital in excess of statutory minimum4 1.0% 1.1%
* The new money yield assumed increases by 0.05 per cent after 48 months. 1 This is the risk discount rate that would be applicable on a traditional embedded value basis if the calculations did not allow for the time-value of options and guarantees
and required capital in excess of the statutory minimum.2 Risk-margin is net of the risk allowance for the time-value of financial options and guarantees and for the required capital in excess of statutory minimum.3 This is the time-value of financial options and guarantees not allowed for in statutory reserves.4 This is the margin for the cost of holding required capital in excess of the statutory minimum.

Old Mutual plc Annual Report and Accounts 2007Notes to the European Embedded Value basis supplementary information
255
Fina
ncia
ls
12 Assumptions continued
Economic assumptions continuedAt At
31 December 31 DecemberEurope 2007 2006
United KingdomRisk-free rate (10 year Government bond) 4.6% 4.6%Cash return 3.6% 3.6%Equity return 7.5% 7.5% Property return 6.6% 6.1% Expense inflation 4.6% 4.3% Traditional embedded value risk discount rate1 7.6% 7.1%
Risk-free rate 4.6% 4.6%Risk-margin2 2.2% 2.1%Cost of financial options and guarantees3 – – Cost of required capital in excess of statutory minimum4 0.8% 0.4%
SwedenRisk-free rate (10 year Government bond) 4.4% 3.8% Cash return 3.4% 2.8% Equity return 7.4% 6.8%Property return 5.9% 5.3%Expense inflation 3.6% 3.1% Traditional embedded value risk discount rate1 7.7% 6.9%
Risk-free rate 4.4% 3.8% Risk-margin2 3.4% 3.1% Cost of financial options and guarantees3 – – Cost of required capital in excess of statutory minimum4 – –
Rest of Europe Risk-free rate (10 year Government bond) 3.1%-5.7% 2.5%-5.5% Cash return 2.1%-4.7% 1.5%-4.5% Equity return 6.1%-8.7% 5.5%-8.5% Property return 4.6%-7.2% 4.0%-7.0% Expense inflation 2.5%-5.0% 1.8%-3.0% Traditional embedded value risk discount rate1 4.0%-7.7% 4.0%-7.5%
Risk-free rate 3.1%-5.5% 2.5%-5.5%Risk-margin2 0.9%-2.9% 1.4%-3.1% Cost of financial options and guarantees3 – – Cost of required capital in excess of statutory minimum4 0.0%-3.0% 0.0%-3.0%
1 This is the risk discount rate that would be applicable on a traditional embedded value basis if the calculations did not allow for the time-value of options and guarantees and required capital in excess of the statutory minimum.
2 Risk-margin is net of the risk allowance for the time-value of financial options and guarantees and for the required capital in excess of statutory minimum.3 This is the time-value of financial options and guarantees not allowed for in statutory reserves.4 This is the margin for the cost of holding required capital in excess of the statutory minimum.
Risk-margins> The risk-margins above the risk-free rate were recalibrated as at 31 December 2007. The South African risk-margin increased by 10 basis points
as a result of changes in the level and direction of swap curves. The United States risk-margin increased by 40 basis points reflecting the wideningof corporate bond spreads over treasuries. The changes in risk margins for the Europe covered businesses range from an increase of 40 basispoints to a reduction of 50 basis points driven by changes in the level and direction of swap curves. To the extent that they relate to economicitems, the effect of these changes is included in the economic assumption changes.
> Risk margin movement due to non-economic factors are included as a separate item within the adjusted operating profit. > The risk-margins for the risk associated with the time-value of financial options and guarantees and the allowance for required capital in excess
of the statutory minimum have been presented separately.
Old Mutual plc Annual Report and Accounts 2007Notes to the European Embedded Value basis supplementary information
256
Notes to the European Embedded Value basis supplementary informationFor the year ended 31 December 2007 continued
12 Assumptions continued
Non-economic assumptions> The assumed future mortality, morbidity and voluntary discontinuance rates have been based as far as possible on analyses of recent operating
experience. Allowance has been made where appropriate for the effect of expected AIDS-related claims.> The management expenses attributable to life assurance business have been analysed between expenses relating to the acquisition of new
business and the maintenance of business in-force. The future expenses attributable to life assurance business include 37 per cent of the Groupholding company expenses, with 15 per cent allocated to South Africa, 5 per cent allocated to United States and 17 per cent allocated to Europe.
> The allocation of these expenses aligns to the proportion that the management expenses incurred by the business bears to the total managementexpenses incurred in the Group.
> No allowance has been made for future productivity improvements in the expense assumptions.> Future investment expenses are based on the current scales of fees payable by the life assurance companies to the asset management subsidiaries.
To the extent that these fees include profit margins for the asset management subsidiaries, these margins have not been included in the value of in-force business or the value of new business.
> The embedded value makes no provision for future development costs. However, provision is included within certain business units for projectcosts where these are known with sufficient certainty.
Required capital> For the South Africa business, the required capital is calculated for each of the major business units. The non-investment items are based on
a multiple of the non-investment components of the local Statutory Capital Adequacy Requirements set out in PGN104 issued by the ActuarialSociety of South Africa (ASSA). The investment item is based on internal models developed for capital allocation and pricing purposes. The modelsproject assets and liabilities for the business forward for 10 years using stochastically determined investment returns on a realistic basis. Bonusrates and adjustments to non-vested bonuses are determined using a consistent formula based on a weighted average of past returns and the level of the Bonus Smoothing Account (BSA) at the time. To the extent that the BSA falls to lower than normally allowable minimum levels, theshareholder is considered to be required to provide support to the business. The capital requirement, based on the discounted value of themaximum shareholder support required, is determined using a conditional tail expectation at the 97.5 percentile level. The required capital isinvested in local equities, local cash and international cash. The asset allocation as at 31 December 2007 is 60, 33 and 7 per cent respectively. In aggregate required capital is subject to a minimum of 130 per cent of the statutory capital requirement. The level of required capital was 134 per cent of the minimum statutory requirements as at 31 December 2007 (146 per cent as at 31 December 2006). The ratio declined over the year mainly as a result of modelling changes, which reduced the level of required capital.
> For the United States business, the required capital is based on the multiple of the local Risk Based Capital (RBC) requirement that managementdeems necessary to maintain the desired credit rating for the company in question. The multiples vary by company from 200 to 300 per cent andaverage 296 per cent as at 31 December 2007. The required capital for Old Mutual (Bermuda) Limited is based on the level of capital consideredby management appropriate to manage the business, which is calculated as 125 per cent of United States RBC calculated on local reserves,subject to a minimum of local statutory requirements. The required capital for Old Mutual Reassurance (Ireland) Limited is based on the level ofcapital considered by management appropriate to manage the business which is based on 125 per cent of the new Irish Capital Requirements.The required capital for the United States business is invested in fixed interest assets.
> For the Europe businesses the required capital reflects the level of capital considered by management appropriate to manage the business, allowingfor local minimum statutory requirements. In certain regions, for example Nordic, statutory capital is partially covered by the deferred acquisitioncosts which are implicitly included in the value of in-force business rather than the adjusted net worth. The required capital is invested in short and medium-term fixed interest assets. The required capital as a percentage of minimum statutory capital in the United Kingdom (excluding theIsle of Man) reduced from 200 per cent to 180 per cent. For other Skandia territories, the percentages have remained broadly the same and are:73 per cent for Nordic, 200 per cent for the Isle of Man and ranging from 63 per cent to 240 per cent for the balance of Europe.
Financial options and guaranteesSouth Africa> As required by the applicable Actuarial Society of South Africa guidance note, the time-value of the financial options and guarantees included
in the statutory reserves in the South Africa businesses as at 31 December 2007 has been valued using a proprietary risk-neutral marketconsistent asset model. The asset model and calibration input is supplied by a proprietary economic scenario generator. This represents a changefrom the random walk, log-normal “real world” stochastic asset model used to quantify the time-value reserve as at 31 December 2006. The time-value reserves relate mainly to the guarantees detailed below:
Individual business:> A closed block of unit-linked and with-profit business has an underlying minimum growth rate guarantee (4.28 per cent per annum for life
and endowment business and 4.78 per cent per annum for retirement annuity business) applicable when calculating death, disability and maturity claims.
> A small block of with-profits business guarantees minimum values to the policyholder at a point in time, generally five years from inception. If the guarantee is not exercised, another guarantee may be set.
> A small block of Retail Mass market with-profits savings business that has death guarantees of premiums (net of fees) plus 4.25 per cent perannum investment return.
> Retirement annuities sold prior to June 1997 contain guaranteed annuity options, whereby the policyholder has an option to exchange fullretirement proceeds for a minimum level of annuity income at maturity.
> In addition, with-profits business has vested bonus guarantees at certain future dates, which operate in conjunction with the options andguarantees set out above.

Old Mutual plc Annual Report and Accounts 2007Notes to the European Embedded Value basis supplementary information
257
Fina
ncia
ls
12 Assumptions continued
Financial options and guarantees continuedSouth Africa continuedGroup business:> There is a significant pre-retirement savings with-profits portfolio. Vested bonuses affect the calculation of benefit payments when a member
exits from the scheme as the face value is paid out. If a scheme terminates, the lower of face and market value is paid out and the vested bonuses are not guaranteed.
> A significant with-profits annuity in payment portfolio guarantees annuity payments once declared for the life-time of the annuitant.
Key assumptions:> The mean returns and volatilities of the asset classes incorporated in the stochastic asset model for 31 December 2006 are detailed below.
Correlations between asset classes have been based on an internal assessment of historical relationships.
Mean interest rate* Standard deviation**
31 December 31 December 2006 2006
Equity 11.4% 22% Property 9.8% 15% Fixed interest (20 year) 7.9% 13% Cash 6.0% 3%
* Means have been calculated using the weighted arithmetic average across all scenarios. ** Standard deviations have been calculated by accumulating returns for the required period in each scenario, taking the natural log of the result, calculating the variance
of this statistic, dividing by the projection period (n years) and taking the square root. This makes the result comparable to implied volatilities quoted in investment markets.
> The risk-free curve used to calibrate the 31 December 2007 market-consistent asset model is shown in the table below. The yield curve has beenderived from mid swap rates at the calibration date.
Annualised zero-couponbond yield
31 December 2007
1 year 11.5%2 years 11.1%3 years 10.7%4 years 10.4%5 years 10.1%10 years 9.1%15 years 8.5%20 years 8.1%25 years 7.8%30 years 7.6%
> The market consistent asset model has been calibrated to South African (ZAR) option prices at 31 December 2007. Annualised implied volatilitiesestimated using asset model output are shown in the table below. The option contracts are specified as at-the-money with maturities of 10 years.
Annualised implied volatility
31 December 2007
FTSE/JSE TOP40 index1 25.4%20-year ZAR interest-rate swap contract 12.1%
1 Due to liquidity problems in the ZAR equity option market, the market consistent asset model has been calibrated by extrapolating option implied volatility data beyond a term of 3 years.
> As at 31 December 2007 the investment guarantee reserves held as part of the value of liabilities, which included allowance for reasonablemanagement actions and a dynamic take-up rate on guaranteed annuity options, were sufficient to cover the time-value of options and guarantees.There is therefore no separate cost deduction from the value of in-force business. The investment guarantee reserve also includes a discretionarymargin to allow for the sensitivity of the reserves to interest rate movements. The discretionary margin is released in the value of in-force.

Old Mutual plc Annual Report and Accounts 2007Notes to the European Embedded Value basis supplementary information
258
Notes to the European Embedded Value basis supplementary informationFor the year ended 31 December 2007 continued
12 Assumptions continued
Financial options and guarantees continuedUnited States> The time-value of financial options and guarantees in the United States businesses are valued using a proprietary economic scenario generator.
A "real world" stochastic model has been used with the initial position of the yield curve calibrated to 23 US$ denominated index linked governmentbond prices as at 30 September 2007. Interest rate scenarios are floored at zero per cent and capped at 30 per cent.
> Crediting rates declared for the fixed deferred annuity block of business vest fully. They are subject to a minimum crediting rate which is specified in the contract. Minimum surrender values are determined by this rate.
> Fixed indexed annuities offer minimum crediting rates on the fixed portion of the product, minimum surrender values based on this and credit equityparticipation annually as a percentage of equity growth subject to a maximum. This equity participation, which is subject to a minimum of zero per cent therefore vests annually.
> The variable annuities offered to off-shore customers through Old Mutual Bermuda can offer various secondary guarantees, including a minimumdeath benefit. Death benefits are subject to a minimum of the sum invested or value at any anniversary date if greater.
> Notwithstanding the comments above regarding the vesting of credited interest, deferred annuities are subject to surrender charges as specified in the contracts.
> The universal life policies specify a minimum crediting rate to accumulate account balances.> All deferred annuities offer a guaranteed annuitisation option on maturity. The rates are set conservatively and typically have very low utilisation
as customers in the United States value the choice inherent in a lump-sum payment. The reserves for financial options and guarantees assume thatthe low historical take-up rates of around 1 per cent per annum will continue into the future, and are therefore insignificant.
> Certain of the universal life contracts contain a feature that guarantees that the contract will continue, even if values would otherwise be insufficient,provided the customer has paid at least a stated amount of premium.
> The mean returns and volatilities of treasuries along the yield curve are detailed below. The mean-reversion to higher future interest rates inherent inthe model is consistent with long-term historical patterns. The interest rate scenarios generated by the model range from zero to 30 per cent.
Mean interest rate* Standard deviation**
31 December 31 December 31 December 31 DecemberTreasuries 2007 2006 2007 2006
6 months 4.4% 4.7% 4.2% 4.3%1 year 4.5% 4.7% 4.3% 4.3%5 year 4.9% 4.9% 4.2% 4.1%10 year 5.1% 5.1% 3.9% 3.9%20 year 5.2% 5.3% 3.0% 3.0%
* The means are calculated by accumulating a unit investment over the projection period (in years) for each simulation, averaging the accumulation across all simulations, and converting the result to an equivalent annual rate (by taking the nth root of the average accumulation, minus 1).
** Standard deviations can be calculated by accumulating returns for the required period in each scenario, taking the natural log of the result, calculating the variance of thisstatistic, dividing by the projection period (n years) and taking the square root. This makes the result comparable to implied volatilities quoted in investment markets.
Europe> While certain products within the Europe businesses provide financial options and guarantees, these are immaterial due to the predominantly
unit-linked nature of the business except in the Nordic region where the value of certain financial options and guarantees have been taken in theopening fair value adjustments.

Old Mutual plc Annual Report and Accounts 2007Notes to the European Embedded Value basis supplementary information
259
Fina
ncia
ls
13 Sensitivity testsThe tables below for South Africa, United States and Europe show the sensitivity of the embedded value and value of in-force at 31 December 2007and the value of new business for the year ended 31 December 2007 to changes in key assumptions. For each sensitivity illustrated, all otherassumptions have been left unchanged. The sensitivity showing the impact of 1 per cent increase in the yield on equities/property (as a change in theequity/property risk premium) is not given below as a bottom-up market consistent approach has been adopted for calibrating discount rates.
31 December 2007 £m
Value ofEmbedded in-force Value of new
South Africa value business business
Central assumptions 2,677 1,207 61Effect of: Central discount rate increasing by 1 per cent 2,528 1,057 51Required capital equal to the minimum statutory requirement 2,720 1,249 65Increasing all pre-tax investment and economic assumptions by 1 per cent
with bonus rates and discount rates changing commensurately* 2,654 1,184 57Decreasing all pre-tax investment and economic assumptions by 1 per cent
with bonus rates and discount rates changing commensurately* 2,690 1,220 65Equity and property market value increasing by 10 per cent,
with all pre-tax investment and economic assumptions unchanged* ** 2,828 1,263 –Equity and property market value decreasing by 10 per cent,
with all pre-tax investment and economic assumptions unchanged* ** 2,526 1,150 – Voluntary discontinuance rates decreasing by 10 per cent 2,712 1,242 70Maintenance expense levels decreasing by 10 per cent
with no corresponding increase in policy charges 2,761 1,291 68Mortality and morbidity assumptions for assurances decreasing
by 5 per cent with no corresponding increase in policy charges 2,730 1,260 68Mortality assumption for annuities decreasing by 5 per cent
with no corresponding increase in policy charges*** 2,666 1,196 61For value of new business, acquisition expenses other than commission and commission
related expenses increasing by 10 per cent, with no corresponding increase in policy charges – – 56
* Calculations include the impact on the investment guarantee reserves held as liabilities under the adjusted net worth. ** Portfolios are assumed to be rebalanced after the increase or decrease in equity and property market values at 31 December 2007.***No impact on with-profit annuities as the mortality risk is borne by policyholders.
31 December 2007 £m
Value ofEmbedded in-force Value of new
United States value business business
Central assumptions 1,069 564 72Effect of: Central discount rate increasing by 1 per cent 1,015 510 62Required capital equal to the minimum statutory requirement 1,123 619 85Increasing all pre-tax investment and economic assumptions by 1 per cent
with bonus rates and discount rates changing commensurately 1,031 526 65Decreasing all pre-tax investment and economic assumptions by 1 per cent
with bonus rates and discount rates changing commensurately 1,107 602 89Contraction of corporate bond spreads of 10 basis points 1,065 561 – Equity and property market value increasing by 10 per cent,
with all pre-tax investment and economic assumptions unchanged* 1,081 576 – Equity and property market value decreasing by 10 per cent,
with all pre-tax investment and economic assumptions unchanged* 1,057 552 –Voluntary discontinuance rates decreasing by 10 per cent 1,133 628 90Maintenance expense levels decreasing by 10 per cent
with no corresponding increase in policy charges 1,085 581 82Mortality and morbidity assumptions for assurances decreasing by 5 per cent
with no corresponding increase in policy charges 1,081 576 77Mortality assumption for annuities decreasing by 5 per cent
with no corresponding increase in policy charges 1,061 557 77For value of new business, acquisition expenses other than commission and commission
related expenses increasing by 10 per cent, with no corresponding increase in policy charges – – 71
* Portfolios are assumed to be rebalanced after the increase or decrease in equity and property market values at 31 December 2007.

Old Mutual plc Annual Report and Accounts 2007Notes to the European Embedded Value basis supplementary information
260
Notes to the European Embedded Value basis supplementary informationFor the year ended 31 December 2007 continued
13 Sensitivity tests continued
31 December 2007 £m
Value of Value of Embedded in-force new
Europe value business business
Central assumptions 3,115 2,667 133Effect of: Central discount rate increasing by 1 per cent 2,938 2,490 111Required capital equal to the minimum statutory requirement 3,118 2,670 132Increasing all pre-tax investment and economic assumptions by 1 per cent
with bonus rates and discount rates changing commensurately 3,029 2,587 120Decreasing all pre-tax investment and economic assumptions by 1 per cent
with bonus rates and discount rates changing commensurately 3,207 2,755 144Equity and property market value increasing by 10 per cent,
with all pre-tax investment and economic assumptions unchanged* 3,261 2,812 –Equity and property market value decreasing by 10 per cent,
with all pre-tax investment and economic assumptions unchanged* 2,997 2,550 – Exchange rates – impact of a 10 per cent depreciation of the Euro against Pounds Sterling 3,070 2,625 –Exchange rates – impact of a 10 per cent depreciation of the Swedish Krona against Pounds Sterling 3,019 2,579 – Voluntary discontinuance rates decreasing by 10 per cent 3,213 2,765 151Maintenance expense levels decreasing by 10 per cent with no corresponding
increase in policy charges 3,178 2,730 140Mortality and morbidity assumptions for assurances decreasing by 5 per cent
with no corresponding increase in policy charges 3,137 2,689 134Mortality assumption for annuities decreasing by 5 per cent
with no corresponding increase in policy charges 3,115 2,667 133For value of new business, acquisition expenses other than commission and commission
related expenses increasing by 10 per cent, with no corresponding increase in policy charges – – 121
* Portfolios are assumed to be rebalanced after the increase or decrease in equity and property market values at 31 December 2007.
The 2006 tables for South Africa, United States and Europe are as follows:
31 December 2006 £m
Value of Value of Embedded in-force new
South Africa value business business
Central assumptions 2,568 1,160 69Effect of: Central discount rate increasing by 1 per cent 2,404 996 58Required capital equal to the minimum statutory requirement 2,617 1,209 73Increasing all pre-tax investment and economic assumptions by 1 per cent
with bonus rates and discount rates changing commensurately* 2,502 1,094 63Decreasing all pre-tax investment and economic assumptions by 1 per cent
with bonus rates and discount rates changing commensurately* 2,639 1,231 75Equity and property market value increasing by 10 per cent,
with all pre-tax investment and economic assumptions unchanged* ** 2,708 1,208 – Equity and property market value decreasing by 10 per cent,
with all pre-tax investment and economic assumptions unchanged* ** 2,429 1,114 – Voluntary discontinuance rates decreasing by 10 per cent 2,607 1,199 78Maintenance expense levels decreasing by 10 per cent
with no corresponding increase in policy charges 2,636 1,228 75Mortality and morbidity assumptions for assurances decreasing
by 5 per cent with no corresponding increase in policy charges 2,622 1,214 75Mortality assumption for annuities decreasing by 5 per cent
with no corresponding increase in policy charges*** 2,558 1,150 68For value of new business, acquisition expenses other than commission and commission
related expenses increasing by 10 per cent, with no corresponding increase in policy charges – – 64
* Calculations include the impact on the investment guarantee reserves held as liabilities under the adjusted net worth. ** Portfolios are assumed to be rebalanced after the increase or decrease in equity and property market values at 31 December 2006.***No impact on with-profit annuities as the mortality risk is borne by policyholders.

Old Mutual plc Annual Report and Accounts 2007Notes to the European Embedded Value basis supplementary information
261
Fina
ncia
ls
13 Sensitivity tests continued31 December 2006 £m
Value of Value of Embedded in-force new
United States value business business
Central assumptions 1,144 690 45Effect of: Central discount rate increasing by 1 per cent 1,089 635 33Required capital equal to the minimum statutory requirement 1,188 735 54Increasing all pre-tax investment and economic assumptions by 1 per cent
with bonus rates and discount rates changing commensurately 1,085 631 32Decreasing all pre-tax investment and economic assumptions by 1 per cent
with bonus rates and discount rates changing commensurately 1,210 757 60Contraction of corporate bond spreads of 10 basis points 1,125 671 –Equity and property market value increasing by 10 per cent,
with all pre-tax investment and economic assumptions unchanged* 1,147 693 – Equity and property market value decreasing by 10 per cent,
with all pre-tax investment and economic assumptions unchanged* 1,141 688 –Voluntary discontinuance rates decreasing by 10 per cent 1,208 754 56Maintenance expense levels decreasing by 10 per cent
with no corresponding increase in policy charges 1,156 703 48Mortality and morbidity assumptions for assurances decreasing by 5 per cent
with no corresponding increase in policy charges 1,162 708 46Mortality assumption for annuities decreasing by 5 per cent
with no corresponding increase in policy charges 1,132 679 45For value of new business, acquisition expenses other than commission and commission
related expenses increasing by 10 per cent, with no corresponding increase in policy charges – – 42
* Portfolios are assumed to be rebalanced after the increase or decrease in equity and property market values at 31 December 2006.
31 December 2006 £m
Value of Value ofEmbedded in-force new
Europe value** business** business***
Central assumptions 2,740 2,321 139Effect of: Central discount rate increasing by 1 per cent 2,572 2,153 114Required capital equal to the minimum statutory requirement 2,758 2,340 143Increasing all pre-tax investment and economic assumptions by 1 per cent
with bonus rates and discount rates changing commensurately 2,672 2,257 127Decreasing all pre-tax investment and economic assumptions by 1 per cent
with bonus rates and discount rates changing commensurately 2,818 2,396 157 Equity and property market value increasing by 10 per cent,
with all pre-tax investment and economic assumptions unchanged* 2,862 2,442 –Equity and property market value decreasing by 10 per cent,
with all pre-tax investment and economic assumptions unchanged* 2,619 2,201 –Exchange rates – impact of a 10 per cent depreciation of the Euro against Pounds Sterling 2,690 2,281 – Exchange rates – impact of a 10 per cent depreciation of the Swedish Krona against Pounds Sterling 2,657 2,242 –Voluntary discontinuance rates decreasing by 10 per cent 2,832 2,413 164Maintenance expense levels decreasing by 10 per cent with no corresponding
increase in policy charges 2,790 2,371 149Mortality and morbidity assumptions for assurances decreasing by 5 per cent
with no corresponding increase in policy charges 2,762 2,343 143Mortality assumption for annuities decreasing by 5 per cent
with no corresponding increase in policy charges 2,740 2,321 141For value of new business, acquisition expenses other than commission and commission
related expenses increasing by 10 per cent, with no corresponding increase in policy charges – – 127
* Portfolios are assumed to be rebalanced after the increase or decrease in equity and property market values at 31 December 2006.** The embedded value and value of the in-force business is net of minority interests.***Value of new business is gross of minority interests for the year ended 31 December 2006.

Old Mutual plc Annual Report and Accounts 2007Shareholder information262
Shareholder information
Listings and share analysisThe Company’s shares are listed on the London, Malawi, Namibian and Zimbabwe Stock Exchanges and on the JSE Limited (JSE). The primarylisting is on the London Stock Exchange and the other listings are all secondary listings. The Company’s secondary listing on the Stockholm StockExchange ended on 7 September 2007, but the Company’s shares may still be traded on the Xternal list of the Nordic Exchange in Stockholm. The ISIN number of the Company’s shares is GB0007389926.
The high and low prices at which the Company’s shares are recorded as having traded on the two main markets on which they were listed during2007 and 2006 were as follows:
2007 2006High Low High Low
London Stock Exchange 187.50p 144.0p 205.75p 150.75pJSE R26.23 R20.94 R25.57 R18.09
At 31 December 2007, the geographical analysis and shareholder profile of the Company’s share register were as follows:
NumberRegister Total shares % of whole of holders
UK 3,564,651,271 64.69 13,989South Africa 1,736,931,573 31.52 29,9041
Zimbabwe 90,445,436 1.64 30,4271
Namibia 15,847,594 0.29 5981
Malawi 5,321,756 0.10 4,8601
Treasury shares (UK) 97,074,9072 1.76 1
Total 5,510,272,537 100 79,779
Source: Computershare Investor Services
NumberSize of holding Total shares % of whole of holders
1-1,000 23,378,078 0.43 65,1821,001-10,000 35,959,701 0.65 12,16410,001-100,000 45,092,346 0.82 1,569100,001-250,000 38,733,931 0.70 237250,001+ 5,270,033,574 95.64 626Treasury shares (UK) 97,074,9072 1.76 1
Total 5,510,272,537 100 79,779
Source: Computershare Investor Services
Notes1 The registered shareholdings on the South African branch register included PLC Nominees (Pty) Limited, which held a total of 1,336,685,042 shares, including
375,141,299 shares held for the Company’s sponsored nominee, Old Mutual (South Africa) Nominees (Pty) Limited, for the benefit of 466,980 underlying beneficialowners. The registered shareholdings on the Zimbabwe branch register included Old Mutual Zimbabwe Nominees (Pvt) Limited, which held a total of 779,900 shares asnominee for 3,510 underlying beneficial owners. The registered shareholdings on the Namibian section of the principal register included Old Mutual (Namibia) Nominees(Pty) Limited, which held a total of 5,082,383 shares as nominee for 7,367 underlying beneficial owners. The registered shareholdings on the Malawi branch registerincluded Old Mutual (Blantyre) Nominees Limited, which held a total of 47,100 shares as nominee for 139 underlying beneficial owners.
2 In addition to the 97,074,907 shares registered as treasury shares at 31 December 2007, the Company had also repurchased a further 8,026,152 shares into treasurywhich had not yet been registered in the Company’s UK treasury shares account at that date.

Old Mutual plc Annual Report and Accounts 2007Shareholder information 263
RegistrarsThe Company’s share register is administered by ComputershareInvestor Services in conjunction with local representatives in variousjurisdictions. The following are the contact details:
UKComputershare Investor Services PLCThe Pavilions,Bridgwater RoadBristol BS99 6ZYTel: +44 (0)870 707 1212email: [email protected]
South AfricaComputershare Investor Services (Pty) Ltd70 Marshall Street, Johannesburg 2001(PO Box 61051, Marshalltown 2107)Tel: 0861 100 940 or +27 (0)11 870 8211
MalawiTrust Finance LimitedDelamere HouseGround FloorPO Box 1396BlantyreMalawiTel: +265 1 823 245Fax: +265 1 824 494email: [email protected]
NamibiaTransfer Secretaries (Pty) LimitedKaiserkrone CentreShop No. 12, Windhoek(PO Box 2401, Windhoek)Tel: +264 (0)61 227 647
SwedenVPC ABBox 7822SE-103 97 StockholmTel: +46 8 402 9000
ZimbabweCorpserve (Private) Limited2nd Floor, Intermarket CentreCorner 1st Street andKwame Nkrumah Avenue, Harare(PO Box 2208, Harare)Tel: +263 (0)4 751559/61Fax:+263 (0)4 752629email: [email protected]
Computershare share dealing servicesThe Company’s South African registrars, Computershare InvestorServices, administer a telephone and postal sales service for shares held through Old Mutual (South Africa) Nominees (Pty) Limited on the South African branch register and shares held through Old Mutual(Namibia) Nominees (Pty) Limited on the Namibian section of theprincipal register. If you hold your shares in this way and wish to sell your shares by telephone, Computershare may be contacted on 0861 100 940 (a South African number) between 8.00 a.m. and 4.30 p.m. (local time) on Mondays to Fridays, excluding publicholidays. A service fee is payable based on the value of the shares sold.
Internet share dealing This service provides shareholders with a facilityto buy or sell Old Mutual plc ordinary shares on the London StockExchange. The commission for deals through the internet is 0.5%,subject to a minimum charge of £15. In addition, stamp duty, currently0.5%, is payable on purchases. There is no need to open an account in order to deal. Real-time dealing is available during market hours.Orders may also be placed outside market hours. Up to 90-day limit orders are available for sales. To access the service, log on towww.computershare.com/dealing/uk. Shareholders should have theirShareholder Reference Number (SRN) available for the purposes ofsales. The SRN appears on share certificates. A bank debit card will be required for purchases. At present, this service is only available to shareholders in certain European jurisdictions. Computershare’swebsite contains an up-to-date list of these countries.
Telephone share dealing The commission for deals throughComputershare’s telephone share dealing service is 1%, subject to a minimum charge of £15. In addition stamp duty, currently 0.5%, is payable on purchases. The service is available from 8.00 a.m. to4.30 p.m. Monday to Friday, excluding bank holidays, on telephonenumber 0870 703 0084. Shareholders should have their ShareholderReference Number (SRN) ready when calling about sales. The SRNappears on share certificates. A bank debit card will be required forpurchases. Detailed terms and conditions are available on request bytelephoning 0870 873 5836. At present, this service is only availableto shareholders resident in the UK and Ireland.
These services are offered on an execution-only basis and subject to theapplicable terms and conditions. This is not a recommendation to buy,sell or hold shares in Old Mutual plc. Shareholders who are unsure ofwhat action to take should obtain independent financial advice. Sharevalues may go down as well as up, which may result in a shareholderreceiving less than he or she originally invested.
To the extent that this statement is a financial promotion for the sharedealing service provided by Computershare Investor Services PLC, it hasbeen approved by Computershare Investor Services PLC for the purposeof section 21(2)(b) of the Financial Services and Markets Act 2000only. Computershare Investor Services PLC is authorised and regulatedby the Financial Services Authority. Where this has been received in a country where the provision of such a service would be contrary tolocal laws or regulations, this should be treated as information only.
Unclaimed demutualisation benefitsPolicyholders of the South African Mutual Life Assurance Society (theSociety) who qualified for free shares in the Company when the Societydemutualised in May 1999, but who did not claim their shares by the closure date of the Unclaimed Shares Trusts (31 August 2006),should contact the Trust Administration and Confirmation Department on0861 61 9061 (a South African number) or on +27 (0)21 509 8383between 8.30 a.m. and 4.30 p.m. (South African time) on Mondays to Fridays, excluding public holidays. The Company has indicated that it will continue until 31 August 2009 to settle valid claims todemutualisation benefits on an ex-gratia basis by reference to the cash value at 31 August 2006 of the shares to which the policyholderwould have been entitled.
Inve
stor
info

Old Mutual plc Annual Report and Accounts 2007Shareholder information264
Shareholder information continued
StrateSince January 2002, all transactions in the Company’s shares on theJSE have been required to be settled electronically through Strate, and share certificates are no longer good for delivery in respect of such transactions.
The Company wrote to certificated shareholders on its South Africanbranch register in October 2001 to inform them of these changes and of the courses of action available to them. The Company also wroteseparately to certificated shareholders on the Namibian section of itsprincipal register in January 2002 to explain the impact of Strate. Theseincluded participating in Issuer-Sponsored Nominee Programmes todematerialise (in the case of South Africa) or immobilise (in the case of Namibia) their previously certificated shareholdings in the Company.Shareholders who have any enquiries about these programmes or about the effect of Strate on their holdings in the Company shouldcontact Computershare Investor Services in Johannesburg on +27 (0)861 100 940 or +27 (0)11 870 8211.
Checking your holding onlineAn online service is situated at the Investor Centre option within thewebsite address www.computershare.com which gives shareholdersaccess to their account to confirm registered details, to give or amenddividend mandate instructions, and to obtain a current shareholdingbalance. A simple calculator function places a market quote againsteach holding and allows shareholders to estimate its value. There arealso a number of downloadable forms from this site such as change ofaddress, dividend mandate and stock transfer forms. Finally there is anextensive list of frequently asked questions and the facility to contactComputershare Investor Services by email.
Financial calendarThe Company’s financial calendar for the forthcoming year is as follows:
Currency conversion date for the final dividend 17 April 2008
Announcement of currency equivalents of the final dividend 18 April 2008
Ex-dividend date in Malawi, Namibia, opening of business onSouth Africa and Zimbabwe 5 May 2008
Ex-dividend date on the opening of business onLondon Stock Exchange 7 May 2008
Annual General Meeting and first quarter business update 8 May 2008
Record date for the final dividend close of business on 9 May 2008
Final dividend payment date 30 May 2008
Interim results 6 August 2008
Third quarter business update 6 November 2008
Interim dividend payment date 28 November 2008
Final results for 2008 February 2009
NoteNo dematerialisation or rematerialisation within Strate and no transfers betweenregisters may take place in the period 5 to 9 May 2008, both dates inclusive.
Rule 144A ADRsThe Company has a Rule 144A American Depositary Receipt (Rule144A ADR) facility through The Bank of New York. Each Rule 144AADR represents 10 ordinary shares in the Company. At 31 December2007, 337,000 of the Company’s shares were held in the form of Rule144A ADRs. Any enquiries about the Company’s Rule 144A ADRfacility should be addressed to The Bank of New York, 101 BarclayStreet, New York, NY 10286, USA, tel: 1-888-BNY-ADRS (1-888-269-2377) if you are calling from within the USA. If you are callingfrom outside the USA, please call +1 212 815 3700. You may alsosend an email enquiry to [email protected].
WebsitesFurther information on the Company can be found on the followingwebsites: www.oldmutual.comwww.oldmutual.co.za
Electronic communications and electronic proxy appointmentIf you would like to receive future communications from the Companyby email, please log on to our website, www.oldmutual.com, select the“Shareholder Information” section, click on “Electronic Communications”and then follow the instructions for registration of your details. In orderto register, you will need your shareholder reference number, which canbe found on the payment advice notice or tax voucher accompanyingyour last dividend payment or notification. The number is also printedon forms of proxy (but not voting instruction forms) for the AnnualGeneral Meeting.
Before you register, you will be asked to agree to the Terms andConditions for Electronic Communications with Shareholders. It isimportant that you read these Terms and Conditions carefully, as theyset out the basis on which electronic communications will be sent to you.
You should bear in mind that, in accessing documents electronically,you will incur the cost of online time. Any election to receive documentselectronically will generally remain in force until you contact theCompany’s Registrars (via the online address set out earlier in thissection of the Report or otherwise) to terminate or change such election.
The use of the electronic communications facility described above isentirely voluntary. If you wish to continue to receive communicationsfrom the Company by post, then you do not need to take any action.
Electronic proxy appointment is available for this year’s Annual GeneralMeeting. This enables proxy votes to be submitted electronically, as analternative to filling out and posting a form of proxy. Further details areset out on the form of proxy. Electronic submission is not, however,available for voting instruction forms.

AcknowledgementsOld Mutual plc would like to thank all those who participated in producing thisreport, particularly the members of staff for their contributions.
Designed and produced by The College +44 (0)20 7457 2030
This report is printed on Symbol Freelife paper, which is FSC certified, 100% ECF(Elemental Chlorine Free) and totally recyclable.
This report is available on our website: www.oldmutual.com
If you have finished reading this Report and no longer wish to retain it, please pass it on to other interested readers or dispose of it in your recycled paper waste.

Old Mutual plcRegistered in England and Wales No. 3591559 and as an external company in each of South Africa (No. 1999/004855/10), Malawi (No. 5282), Namibia (No. F/3591559) and Zimbabwe (No. E1/99)
Registered Office:5th FloorOld Mutual Place2 Lambeth HillLondon EC4V 4GG
www.oldmutual.com