Embed Size (px)
Citation preview

1
Olympic Fisher Reintroduction Project:
Progress Report 2008-2011
Photo by J. Hoder
Prepared by: Jeffrey C. Lewis, Washington Department of Fish and Wildlife, 600 Capitol Way N,
Olympia, WA 98501
Patti J. Happe, Olympic National Park, 600 E. Park Ave., Port Angeles, WA 98362
Kurt J. Jenkins, U. S. Geological Survey, Forest and Rangeland Ecosystem Science
Center, Olympic Field Station, 600 E. Park Ave., Port Angeles, WA 98362
David J. Manson, Olympic National Park, 600 E. Park Ave., Port Angeles, WA 98362

2
Summary
This progress report summarizes the final year of activities of Phase I of the Olympic fisher
restoration project. The intent of the Olympic fisher reintroduction project is to reestablish
a self-sustaining population of fishers on the Olympic Peninsula. To achieve this goal, the
Olympic fisher reintroduction project released 90 fishers within Olympic National Park
from 2008 to 2010. The reintroduction of fishers to the Olympic Peninsula was designed
as an adaptive management project, including the monitoring of released fishers as a means
to (1) evaluate reintroduction success, (2) investigate key biological and ecological traits of
fishers, and (3) inform future reintroduction, monitoring, and research efforts.
This report summarizes reintroduction activities and preliminary research and monitoring
results completed through December 2011. The report is non-interpretational in nature.
Although we report the status of movement, survival, and home range components of the
research, we have not completed final analyses and interpretation of research results.
Much of the data collected during the monitoring and research project will be analyzed and
interpreted in the doctoral dissertation being developed by Jeff Lewis; the completion of
this dissertation is anticipated prior to April 2013. We anticipate that this work, and
analyses of other data collected during the project, will result in several peer-reviewed
scientific publications in ecological and conservation journals, which collectively will
comprise the final reporting of work summarized here. These publications will include
papers addressing post-release movements, survival, resource selection, food habits, and
age determination of fishers.
Disclaimer The information contained in this progress report is unpublished and preliminary in nature.
Users are cautioned to carefully consider the provisional nature of the information
contained herein. The contents of the report may not be published without permission of
the authors. Any use of trade, product, or firm names is for descriptive purposes only and
does not imply endorsement by the U.S. Government.
Background
Historically, the fisher (Martes pennanti) occurred throughout much of the coniferous
forests of Washington. However, the fisher was extirpated from Washington within the last
century, largely as a result of historical, unregulated trapping and loss of forests in older
age-classes at low and mid-elevations. A status review completed in 1998 by the
Washington Department of Fish and Wildlife (WDFW; Lewis and Stinson 1998)
documented these findings and prompted the listing of the fisher as a state endangered
species by the Washington Fish and Wildlife Commission in October of 1998. The fisher
was also listed as a federal candidate species by the U. S. Fish and Wildlife Service after
the proposed listing of its west coast population as endangered was deemed warranted but
precluded by higher-priority listings (U. S. Fish and Wildlife Service 2004).
Following the listing of the fisher in Washington, WDFW developed a recovery plan for
the species (Hayes and Lewis 2006). Because of the extirpation of fishers, the lack of
nearby fisher populations to support recovery through natural recolonization, and the past
success of reintroductions elsewhere, the recovery plan identified reintroductions to three

3
recovery regions of the state (Olympic, South Cascades, and North Cascades) as the
primary strategy to recover the species in Washington. Recovery efforts throughout much
of the fisher’s North American range have relied heavily on reintroductions and the fisher
has proven to be one of the most successfully reintroduced carnivores (Berg 1982, Powell
1993, Breitenmoser et al. 2001, Lewis et al. 2012). WDFW began planning a fisher
reintroduction to the Olympic recovery region as a means to begin restoration of the
species in Washington (Hayes and Lewis 2006, Lewis 2006).
A reintroduction feasibility study was completed in 2004 by WDFW and Conservation
Northwest, a non-profit conservation organization. The study concluded that fisher
reintroductions to the Olympic Peninsula and to the Cascades of Washington were
biologically feasible (Lewis and Hayes 2004), and that the most suitable location for a
reintroduction was within Olympic National Park (ONP). Biologists with ONP had long
been interested in the status of fishers in the Park, and ONP joined the reintroduction
partnership with WDFW and Conservation Northwest. WDFW and the National Park
Service (NPS) developed a reintroduction implementation plan (Lewis 2006), and an
environmental assessment/reintroduction plan (National Park Service et al. 2007) pursuant
to the National Environmental Policy Act. With the approval of the environmental
assessment and reintroduction plan by the NPS, the reintroduction was initiated in the fall
of 2007.
The goal of the Olympic fisher reintroduction project is to reestablish a self-sustaining
population of fishers on the Olympic Peninsula. The reintroduction of fishers to the
Olympic Peninsula was designed as an adaptive management project. The project
incorporates research and monitoring of released fishers as a means to evaluate
reintroduction success, investigate key biological and ecological traits of fishers, and
inform future reintroduction, monitoring, and research efforts. WDFW and ONP are the
co-leads for the reintroduction efforts, while WDFW, U. S. Geological Survey (USGS) and
ONP are the leads for the research and monitoring program associated with the
reintroduction. This report provides a preliminary summary of progress made during the
fourth (final) year (December 2010 – December 2011) of the reintroduction, monitoring,
and research project. Summaries of previous year’s accomplishments are available at
http://wdfw.wa.gov/conservation/fisher/.
Acknowledgments Reintroduction planning and implementation depended on the assistance of the British Columbia
Ministry of Environment, who supported our efforts to translocate British Columbia fishers to the
Olympic Peninsula. Twenty-two members of the British Columbia Trappers Association from
central British Columbia captured fishers for the reintroduction. In addition, we would like to thank
our hosts, Marg and Don Evans for working with the trappers and providing expert care for the
fishers prior to their transport and release.
Funding for the project has come from a number of sources including the U. S. Geological Survey,
U. S. Fish and Wildlife Service, Washington Department of Fish and Wildlife, Doris Duke
Foundation and the Wildlife Conservation Society, National Park Service, National Park Service
Donations, and Washington’s National Parks Fund.

4
Numerous people from many agencies and organizations provided essential support to the project.
From the National Park Service we thank Roger Hoffman, Katherine Beirne, Cat Hawkins
Hoffman, Barb Maynes, Scott Gremel, Nancy Hendricks, Sandy Hamilton, Tom Kay, Josh
Chenowith, Mike Danisiewicz, Mark McCool, George Leite, Kraig Snure, Gabe Asarian, Stuart
Curtin, Les Young and the Olympic National Park road crew, and Superintendents Bill Laitner, Sue
McGill, and Karen Gustin. From Conservation Northwest, we thank Dave Werntz, Jasmine
Minbashian, Paul Bannick, Jen Watkins, Mitch Friedman, Erin Moore, Mark Skatrud, and Fred
Munson. From Washington Department of Fish and Wildlife, we thank Harriet Allen, Rocky
Beach, Greg Schirato, Anita McMillan, Marion Snyder, Jack Smith, Craig Bartlett, Tom Davis,
Ken Warheit, Kristin Mansfield, Warren Michaelis, Gerry Hayes, Cheryl Dean, Todd Seamons,
Cherrill Bowman, Jennifer Von Bargen, Scott Pearson, John Pierce, pilots Jim Hodgson and Marty
Kimbrell, and Officers Brian Fairbanks and Win Miller. From the British Columbia Ministry of
Environment, we thank Eric Lofroth, Helen Schwantje, Randy Wright, Tom Ethier, Irene Teske,
Rodger Stewart, Daniel Lirette, Troy Forslund and Kelly Smith. From the U. S. Forest Service, we
thank Susan Piper, Betsy Howell, Kathy O’Halloran, Keith Aubry, Cathy Raley, Kurt Aluzas,
Karen Holtrip, Mike Schwartz, and Bill Zielinski. From the U. S. Fish and Wildlife Service, we
thank Martha Jensen, Jodi Bush, Kevin Maurice, Ken Berg, Laura Finley, and Officer Mike
Williams. From the U. S. Geological Survey, we thank Carrie Phillips, Ruth Jacobs, Doug Houston
(retired), Martin Fitzpatrick and Joan Hagar. We thank our university colleagues and advisors
including Steve West (UW), Rick Brown (HSU), Mourad Gabriel (UC Davis), Greta Wengert (UC
Davis), Tom Manning (OSU), Roger Powell (NCSU), and Larry Davis (SFU). From Northwest
Trek Wildlife Park, we thank Jessica Hoffman, Deanna Jackson, Rich Sartor, Allison Case, and
Dave Ellis. We also thank Rich Weir and Helen Davis of Artemis Wildlife Consultants, Darren
Long (Wildlife Conservation Society), pilots Jeff Well and Rick Mowbray from Rite Brothers
Aviation, pilot Curt Cousins from Olympic Air Inc., Rob McCoy and the Makah Tribe wildlife
staff, Scott Horton (WDNR), Wendy Arjo, Becki Bravi, Coke Smith, Dr. Doug Magnowski and the
staff at Caribou Animal Care Hospital, and Dr. Robert Mowbray and the staff at Olympic
Veterinary Clinic.
Progress to Date
We previously described four main aspects of the reintroduction process: 1) the capture,
housing and care of fishers; 2) the preparation of fishers for reintroduction; 3) transporting
fishers to Washington; and 4) releasing fishers in ONP (Lewis and Happe 2009; Lewis et
al. 2010, 2011). From 2008 to 2010, 90 fishers were successfully captured in central
British Columbia, transported to Washington and released in Olympic National Park
(Appendix 1). Eighteen fishers released in the park in Year 1 of the project were monitored
via radio-telemetry for up to 30 months (January 2008 to August 2010); 31 released in Year
2 were monitored for up to 24 months (December 2008 to January 2010); and 41 released
in Year 3 were monitored for up to 24 months (December 2009 to December 2011;
Appendix 1). The last telemetry locations were obtained in December of 2011.
As planned, no additional fishers were captured or released in 2011. Activities in 2011
included the continued data collection associated with the research and monitoring of
fishers released from 2008 to 2010.
Reintroduction Success Monitoring
Our monitoring efforts have focused on evaluating movements, survival, home range
establishment and reproduction of reintroduced fishers. Because most of the released
fishers occurred in areas that were relatively inaccessible to ground or vehicle-based

5
telemetry, we relied primarily on aerial telemetry to monitor fishers following their release.
Our initial goal was to locate each collared fisher once per week; however inclement
weather, poor flying conditions and logistical considerations often prevented us from
obtaining locations. As a result, our goal was revised to obtain a minimum of at least one
location per month for each fisher. For more accessible individuals, we also obtained
ground telemetry locations using homing and triangulation procedures. The ground
locations allowed us to locate and describe fisher rest and den sites and to discover scats for
an analysis of food habits.
Movements
From 2008 to 2011, we tracked the movements of each released fisher for as long as its
radio-transmitter functioned. We were able to track several fishers for over 2 years, but
contact was lost with many fishers before 2 years elapsed. Most newly released fishers
made large movements as they explored a new environment, however a few appeared to
find and occupy a home range very shortly (within a month) after being released. Almost
all fishers established a home range in <1 year after being released, but most established a
home range after the breeding season (March-May). We will analyze the timing and
distance of post-release movements in relation to sex, age, release year, and body condition
to determine if these factors influence the movement behaviors or the establishment of a
home range.
During 2011, we monitored the movements of 18 of the 41 fishers that were released in
year 3 (2010) of the reintroduction (Figure 1). The small number of fishers monitored in
2011 reflected the high rate of radio-collar failure as well as mortality of fishers during
2010. Our goal was to accumulate telemetry locations for these 18 individuals to allow us
to estimate a home range for each fisher and to evaluate resource selection. In 2011, most
of these 18 fishers occupied a localized area (e.g., F068, F074, F098; Figure 1) or made
only small, temporary forays away from the occupied area (e.g., M077, M093; Figure 1).
Several fishers moved during the breeding season and subsequently could not be found
(M075, M032; Figure 1). Fishers tracked during 2011 did not make the long distance
movements typical of newly released fishers (Lewis and Happe 2009, Lewis et al. 2010,
2011).
Survival
We determined the survival status of each radio-collared fisher by noting whether their
radio-collar was emitting a faster radio-transmitter pulse-rate (a mortality signal of 72 beats
per minute vs the normal 42 beats per minute). A mortality signal is emitted when a collar
has remained motionless for >6 hours, which indicates that the collared individual is dead
or that its collar came off. Whenever possible, we used ground telemetry to investigate
mortality signals to determine the status of the fisher or its collar. From 2008 through
2011, we detected mortality signals for 46 fishers and independently recovered 5 dead
fishers (F013, F049, F071, M031, M039) without the aid of a mortality signal (e.g., road-
killed fishers recovered by members of the public). We were able to determine that 30
(65.2%; 23F, 7M) of the 46 fishers with collars emitting a mortality signal had died
(Appendix 1). Of the remaining 16 collars emitting a mortality signal, no assessment of

6
Figure 1. Telemetry location and movements of the 18 fishers tracked in 2011; all 18
fishers were released in year 3 of the reintroduction. The movements of M056, M077,
M083 and M093 occurred during the breeding season (March-May).
fate of the fisher could be made for 12 collars (26.1%; 7F, 5M) because the collar was
inaccessible; 3 collars had come off the fisher (6.5%; 2F, 1M); and one collar that was
found appeared to have been cut by someone (2.2%; 1M). The histories and fates of two
juvenile males (M100 and M101) are provided separately (Appendix 2). These 2 males
were rescued after their mother (F088) was killed in May 2010. They were subsequently
raised in captivity, then radio-collared and released in Olympic National Park in October,
2010.
We calculated finite survival rates for males and females as the proportion of radio-collared
animals that survived the year. If we were unable to locate a fisher for more than 3 months
and could not determine its fate throughout the year, we censored it from the survival rate
calculation (Table 1, Appendix 1).
The survival status (alive vs. dead) during their first year following release was known for
17 of the 18 fishers released in year 1, 29 of the 32 released in year 2, and 32 of the 41
released in year 3 (Table 1). Percent survival was not calculated for 2011 for the Year-3

7
Table 1. Preliminary estimates of percent survival for fisher release cohorts 1-3, based on numbers of fishers that were released, survived, died, or were censored.
1Survival rate calculations were based on a 1 January to 31 December time interval each year.
2Includes fishers presumed dead, but could include fishers that are alive but lost their collar.
3includes missing fishers and those with failed radios. These individuals were excluded (censored)
from the survival calculations because their status was unknown. 4% survival = [survived/(survived + dead)]*100. Note: Preliminary estimates assume that all 12 collars that
transmitted a mortality signal, but were not retrieved, represented mortalities. 5Standard error of the survival estimate (based on a sample from a binomial population; Zar 1984: 377)
6% survival was not calculated for this year for this cohort because most individuals alive at the
beginning of the year were lost as a result of radio-collar failure. Given the large number of censored animals, a calculated survival rate for this year would lack validity.
cohort because most individuals alive at the beginning of the year were lost as a result of
radio-collar failure. As a result these missing individuals were censored from the survival
calculation (Table 1). Given the large number of censored individuals, a calculated
survival rate for this year would lack validity.
Release
Cohort Year
1 Sex # Survived Dead
2 Censored
3 % Survival
4
Standard
error5
1
2008
F 12 10 2 0 83.3 11.2
M 6 4 1 1 80.0 17.9
All 18 14 3 1 82.4 9.2
2009
F 10 8 1 1 88.9 10.5
M 4 2 0 2 100.0 0.0
All 14 10 1 3 90.9 8.0
2010
F 8 0 2 6 --6
M 2 0 0 2 --6
All 10 0 2 8 --6
2
2009
F 20 6 14 0 30.0 10.5
M 11 7 2 2 77.8 13.1
All 31 13 16 2 44.8 9.1
2010
F 6 3 2 1 60.0 21.9
M 7 2 1 4 66.7 19.2
All 13 5 3 5 62.5 14.0
3
2010
F 18 9 9 0 50.0 12.1
M 23 9 4 10 69.2 9.6
All 41 18 13 10 61.3 7.7
2011
F 9 2 1 6 ---6
M 9 0 2 7 ---6
All 18 2 3 13 ---6

8
We will use Program Mark (White and Burnham 1999) to generate survival estimates for
all fishers with sex, age, release year, genetic haplotype and body condition incorporated as
covariates in the analysis.
Causes of Mortality
With the assistance of wildlife pathologists at two laboratories (Veterinary Diagnostics
Laboratory at Colorado State University and Veterinary Genetics Laboratory at UC Davis),
we have been able to determine the cause of death, and in some cases of predation the
species of predator, of some of the fishers that died. From 2008 to 2011, we recovered the
remains of 35 released fishers (26 F, 9 M; Table 2, Appendix 1); cause of death is known
for 23 (65.7%; 18 F, 5 M) of these. Among known causes of mortality, predation and
vehicle strikes were the most common causes (Table 2). Forensic evidence indicated that
two females (F008 and F026) died as the result of bobcat predation and one female (F065)
died as a result of mountain lion predation (G. Wengert, UC Davis, unpubl. data).
Table 2. Cause of death of fishers recovered from January 2008 to December 2011.
a Female was caught in, and escaped from, a leg-hold trap ~14 months after release.
Home Range Establishment
The establishment of a home range is an indication that an area is suitable for occupancy by
an animal. While we have not yet analyzed home ranges of the released fishers,
preliminary results indicate that fishers concentrated their use in localized areas during
their first year in a variety of landscapes that ranged from mountainous terrain to coastal
plains and included federal, state, private, and tribal ownerships (Figure 2). The date when
a fisher began its use of a localized area varied among fishers; some would use a localized
area soon after being released while others moved extensively for 6-10 months before using
a localized area.
We have >20 home range locations for 20 female and 11 male fishers. We will estimate
home range sizes for these 31 fishers using fixed kernel and minimum convex polygon
methods. These ranges will also be used to assess used ranges in comparison to available
(generated spatially random) ranges in an analysis of fisher resource selection.
Cause of death Females Males All (%)
Predation 10 3 13 (37.1)
Vehicle strike 5 2 7 (20.0)
Unknown 6 0 7 (17.1)
Unknown (possible predation) 2 4 6 (17.1)
Drowning 2 0 2 (5.7)
Trapping relateda 1 0 1 (2.9)
total 26 9 35 (100.00)

9
Figure 2. Areas of concentrated use by male and female fishers on the Olympic
Peninsula, 2008-2011.
Reproduction
Because the production and recruitment of young are critical to population persistence,
reproduction is an important indicator of reintroduction success. We closely monitored the
movements of females during the denning season (late March-July) to identify possible
denning behaviors of females. When we identified females using localized areas during the
denning season, we used radio-telemetry homing procedures in an attempt to find the
female in a den. It frequently took several trips into the suspected denning area to identify
a radio-collared female within a potential natal den; and in some cases we never found the
female within a den. We used two methods to document reproduction. When a suspected
den was identified, we placed 2-3 cameras (Reconyx, Inc., Holmen,WI; models PC85 and
PC90) in locations to photograph the female or kits entering or exiting the den. If we could
not identify a den site, we placed baited camera stations within the area regularly used by
an adult female in an attempt to photograph kits after they left the natal den.

10
Prior to 2011, we documented the production of 6 litters by 6 females (F004, F007, F022,
F033, F080 and F088; Figure 3; Lewis et al. 2011). It is likely that other litters were
produced that we were unable to document. Litter sizes ranged from >1 to 4 kits. Litters
of 4 kits were produced by females F004 and F007; litters as large as 4 kits had not been
previously reported for fishers in western North America.
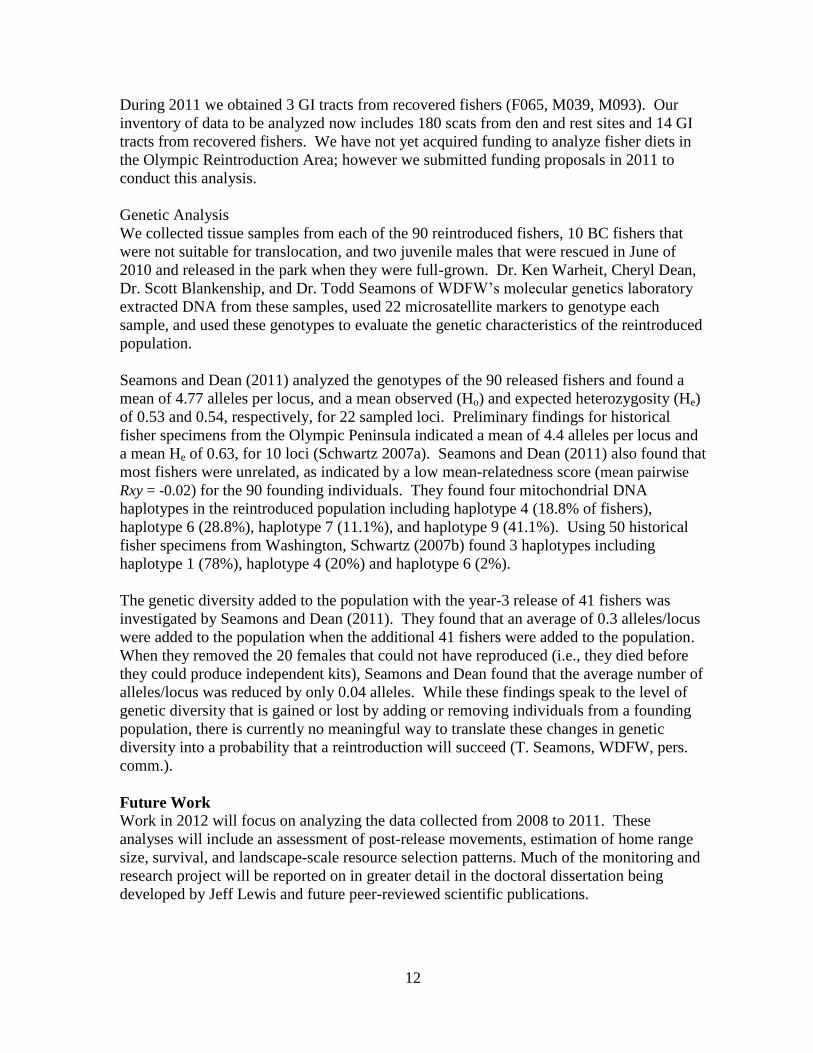
In 2011, we investigated possible rerpoduction by five females (F065, F068, F074, F078,
F098); we were able to confirm reproduction for only one (F065; Figure 3). F065 was
released in year 3 (on 24 December 2009) as a juvenile and mated with a male in
Washington when she was approximately 1-year-old, in March-May of 2010. In mid-
April, 2011, F065 was located at a suspected den site and was photographed regularly
revisiting this site. On 16 April, she was photographed moving 2 kits from the den site.
Unfortunately F065 was killed by a mountain lion between 11 May and 18 May 2011,
before we could locate her 2nd
den site and her kits.
Figure 3. Confirmed den sites of reintroduced female fishers; den sites found in 2009 are in blue boxes, those located in 2010 are in magenta, and F065’s den site in 2011 is in light green. The presence of kits (from 1-4 kits) was confirmed by photo documentation at each site. Among the seven dens found, three were located in Olympic National Park (F007, F033, F080), two were located in Olympic National Forest (F022, F065), one on Washington Department of Natural Resources land (F088) and one on private land (F004).

11
Figure 4. Female F065 carrying one of two kits she moved from her den on 16 April 2011. The large western red cedar in the left side of the photo was her first den site. This den site was located on U.S. Forest Service land near the northeastern boundary of Olympic National Park (Figure 3).
Food Habits
Prior to releasing fishers, a basic assumption was made that the diversity and abundance of
prey on the Olympic Peninsula would be sufficient to support a reintroduced population
(Lewis and Hayes 2004). The reintroduction provides an opportunity to identify the prey
species and other foods consumed by reintroduced fishers on the Olympic Peninsula. With
our limited resources, our collection of scats has largely been limited to those collected at
den sites, and consequently our findings will be limited to prey (and other foods) captured
by reproductive females during the denning season.
We conducted a scat analysis pilot study in 2010 to determine the feasibility of detecting
prey items. Using 20 scat samples collected from female F033’s den site, we found
mammal remains in 90% of scat samples, arthropod remains in 70%, and bird remains in
25% (Lewis et al. 2011). Plant material was found in 95% of the samples but it was not
clear to what extent fishers consumed plant material intentionally because plant material
can adhere to defecated scat and can be incidentally included in scat samples.
12
During 2011 we obtained 3 GI tracts from recovered fishers (F065, M039, M093). Our
inventory of data to be analyzed now includes 180 scats from den and rest sites and 14 GI
tracts from recovered fishers. We have not yet acquired funding to analyze fisher diets in
the Olympic Reintroduction Area; however we submitted funding proposals in 2011 to
conduct this analysis.
Genetic Analysis
We collected tissue samples from each of the 90 reintroduced fishers, 10 BC fishers that
were not suitable for translocation, and two juvenile males that were rescued in June of
2010 and released in the park when they were full-grown. Dr. Ken Warheit, Cheryl Dean,
Dr. Scott Blankenship, and Dr. Todd Seamons of WDFW’s molecular genetics laboratory
extracted DNA from these samples, used 22 microsatellite markers to genotype each
sample, and used these genotypes to evaluate the genetic characteristics of the reintroduced
population.
Seamons and Dean (2011) analyzed the genotypes of the 90 released fishers and found a
mean of 4.77 alleles per locus, and a mean observed (Ho) and expected heterozygosity (He)
of 0.53 and 0.54, respectively, for 22 sampled loci. Preliminary findings for historical
fisher specimens from the Olympic Peninsula indicated a mean of 4.4 alleles per locus and
a mean He of 0.63, for 10 loci (Schwartz 2007a). Seamons and Dean (2011) also found that
most fishers were unrelated, as indicated by a low mean-relatedness score (mean pairwise
Rxy = -0.02) for the 90 founding individuals. They found four mitochondrial DNA
haplotypes in the reintroduced population including haplotype 4 (18.8% of fishers),
haplotype 6 (28.8%), haplotype 7 (11.1%), and haplotype 9 (41.1%). Using 50 historical
fisher specimens from Washington, Schwartz (2007b) found 3 haplotypes including
haplotype 1 (78%), haplotype 4 (20%) and haplotype 6 (2%).
The genetic diversity added to the population with the year-3 release of 41 fishers was
investigated by Seamons and Dean (2011). They found that an average of 0.3 alleles/locus
were added to the population when the additional 41 fishers were added to the population.
When they removed the 20 females that could not have reproduced (i.e., they died before
they could produce independent kits), Seamons and Dean found that the average number of
alleles/locus was reduced by only 0.04 alleles. While these findings speak to the level of
genetic diversity that is gained or lost by adding or removing individuals from a founding
population, there is currently no meaningful way to translate these changes in genetic
diversity into a probability that a reintroduction will succeed (T. Seamons, WDFW, pers.
comm.).
Future Work
Work in 2012 will focus on analyzing the data collected from 2008 to 2011. These
analyses will include an assessment of post-release movements, estimation of home range
size, survival, and landscape-scale resource selection patterns. Much of the monitoring and
research project will be reported on in greater detail in the doctoral dissertation being
developed by Jeff Lewis and future peer-reviewed scientific publications.

13
In collaboration with a number of other researchers, we submitted proposals for funding in
2011 to support three research projects associated with the Olympic Fisher Reintroduction.
First, we are seeking funding to conduct a long-term monitoring program on the Olympic
Peninsula to assess the success of the fisher reintroduction. This program will place hair
snares and camera stations throughout a broad area of the Olympic Peninsula to assess
fisher occupancy, abundance and population genetic characteristics. Second, we are
seeking funding to conduct an analysis of fisher food habits using the scats, prey remains
and GI tracts that we collected from 2008 to 2011. Third, we anticipate using the genotype
data from the founding population and data from historical fisher specimens from
Washington to assess their levels of genetic diversity and degree of similarity.
Literature Cited
Berg, W. E. 1982. Reintroduction of fisher, pine marten and river otter. Pages 159-175
in G. C. Sanderson, editor. Midwest furbearer management. North Central
Section of The Wildlife Society, Bloomington, Illinois.
Breitenmoser, U., C. Breitenmoser-Wursten, L. W. Carbyn, and S. M. Funk. 2001.
Assessment of carnivore reintroductions. Pages 240-281 in J. L. Gittleman, S. M.
Funk, D. W. Macdonald, and R. K. Wayne, editors. Carnivore Conservation.
Cambridge University Press, New York.
Hayes, G. E. and J. C. Lewis. 2006. Washington state recovery plan for the fisher.
Washington Department of Fish and Wildlife, Olympia. 62 pp.
Lewis, J. C. 2006. Implementation plan for reintroducing fishers (Martes pennanti) to
Olympic National Park. Washington Department of Fish and Wildlife, Olympia.
Available at: http://wdfw.wa.gov/wlm/diversty/soc/fisher/.
Lewis, J. C., and P. J. Happe. 2009. Olympic Fisher Reintroduction Project: 2008 Progress
Report. Washington Department of Fish and Wildlife and Olympic National Park.
19 pp. Available at: http://wdfw.wa.gov/wlm/diversty/soc/fisher/.
Lewis, J. C., P. J. Happe, K. J. Jenkins, and D. J. Manson. 2010. Olympic Fisher
Reintroduction Project: 2009 Progress Report. Washington Department of Fish and
Wildlife and Olympic National Park. 19 pp. Available at:
http://wdfw.wa.gov/wlm/diversty/soc/fisher/.
Lewis, J. C., P. J. Happe, K. J. Jenkins, and D. J. Manson. 2011. Olympic Fisher
Reintroduction Project: 2010 Progress Report. Washington Department of Fish and
Wildlife and Olympic National Park. 24 pp. Available at:
http://wdfw.wa.gov/wlm/diversty/soc/fisher/.
Lewis, J. C. and G. E. Hayes. 2004. Feasibility assessment for reintroducing fishers to
Washington. Washington Department of Fish and Wildlife, Olympia. Available at:
http://wdfw.wa.gov/wlm/diversty/soc/fisher/.
Lewis, J.C., R. A. Powell, and W.J. Zielinski. 2012. Carnivore Translocations and
Conservation: Insights from Population Models and Field Data for Fishers (Martes
pennanti). PLoS ONE 7(3): e32726. doi:10.1371/journal.pone.0032726
Lewis, J. C. and D. W. Stinson. 1998. Washington State status report for the fisher.
Washington Department of Fish and Wildlife, Olympia. Available at:
http://wdfw.wa.gov/wlm/diversty/soc/fisher/.
National Park Service et al. 2007. Fisher Reintroduction Plan/Environmental

14
Assessment. Olympic National Park, Port Angeles, Washington. Available at:
http://wdfw.wa.gov/wlm/diversty/soc/fisher/.
Powell, R. A. 1993. The fisher: Life history, ecology, and behavior. Second edition.
University of Minnesota Press, Minneapolis, Minnesota.
Schwartz, M. K. 2007a. Washington State Fisher (Martes pennanti) Ancient DNA
Evaluation: microsatellites. Report to Washington Dept. of Fish and Wildlife. U.S
Forest Service, Rocky Mountain Research Station, Missoula, MT. 6 pp.
Schwartz, M. K. 2007b. Washington State Fisher (Martes pennanti) Ancient DNA
Evaluation: mitochondrial DNA. Report to Washington Dept. of Fish and Wildlife.
U.S Forest Service, Rocky Mountain Research Station, Missoula, MT. 8 pp.
White, G.C. and K. P. Burnham. 1999. Program MARK: Survival estimation from
populations of marked animals. Bird Study 46 Supplement, 120-138.
Zar, J.H. 1984. Biostatistical analysis, Second Edition. Prentice-Hall, Inc., Englewood
Cliffs, NJ. 718 pp.

15
Appendix 1. Data associated with the capture, processing, transport, release and monitoring of the 90 fishers from British Columbia
comprising the founding population on the Olympic Peninsula in Washington state.
Animal Number
Study Year Sex
Capture Date
Release Date
Days Captive
Age upon
release Age
Class Weight
(kg)
Fate as of 31 Dec 2011
1
Number relocations by 31 Dec 2011
Number Days monitored
2
2008F001 Y1 F 14-Dec-07 27-Jan-08 44 0 Juvenile 3.4 Dead 105 877 2008M002 Y1 M 26-Dec-07 27-Jan-08 32 1 Sub-adt 4.3 Unknown 3 444
2008F003 Y1 F 27-Dec-07 27-Jan-08 31 2 Adult 1.8 Unknown 51 428
2008F004 Y1 F 29-Dec-07 27-Jan-08 29 2 Adult 2.5 Unknown 110 852
2008M005 Y1 M 5-Jan-08 27-Jan-08 22 4 Adult 5.4 Dead 33 257
2008F006 Y1 F 6-Jan-08 27-Jan-08 21 1 Sub-ad 2.8 Unknown 87 869
2008F007 Y1 F 6-Jan-08 27-Jan-08 21 2 Adult 2.9 Unknown 105 806
2008F008 Y1 F 7-Jan-08 2-Mar-08 55 3 Adult 2.7 Dead 14 32
2008M009 Y1 M 9-Jan-08 27-Jan-08 18 0 Juvenile 4.6 Unknown 36 234
2008M010 Y1 M 13-Jan-08 27-Jan-08 14 1 Sub-ad 3.9 Unknown 37 402
2008M011 Y1 M 13-Jan-08 27-Jan-08 14 1 Sub-ad 4.2 Unknown 88 942
2008F012 Y1 F 16-Jan-08 27-Jan-08 11 2 Adult 2.0 P Dead 26 311
2008F013 Y1 F 25-Jan-08 2-Mar-08 37 0 Juvenile 3.1 Dead 119 639
2008M014 Y1 M 13-Feb-08 2-Mar-08 18 1 Sub-ad 5.4 Unknown 29 689
2008F015 Y1 F 14-Feb-08 2-Mar-08 17 n/d Adult 2.6 P Dead 10 46
2008F016 Y1 F 15-Feb-08 2-Mar-08 16 1 Sub-ad 2.8 Unknown 65 907
2008F017 Y1 F 23-Feb-08 2-Mar-08 8 0 Juvenile 2.9 Unknown 79 785
2008F018 Y1 F 29-Feb-08 2-Mar-08 2 1 Sub-ad 2.6 Unknown 72 831
2009F019 Y2 F 3-Nov-08 21-Dec-08 48 4 Adult 2.6 Dead 11 107
2009M020 Y2 M 13-Nov-08 21-Dec-08 38 1 Sub-ad 5.2 Unknown 20 466
2009F021 Y2 F 16-Nov-08 21-Dec-08 35 3 Adult 2.2 Dead 0 0
2009F022 Y2 F 23-Nov-08 21-Dec-08 28 1 Sub-ad 2.7 Unk 37 414
2009M023 Y2 M 29-Nov-08 21-Dec-08 22 0 Juvenile 4.0 Unknown 33 652
2009F024 Y2 F 30-Nov-08 21-Dec-08 21 0 Juvenile 2.8 P Dead 44 779
2009F025 Y2 F 30-Nov-08 21-Dec-08 21 0 Juvenile 2.7 Dead 41 317
2009F026 Y2 F 30-Nov-08 21-Dec-08 21 2 Adult 2.6 Dead 12 80
2009F027 Y2 F 30-Nov-08 21-Dec-08 21 2 Adult 2.5 Unk 30 719
2009F028 Y2 F 6-Dec-08 21-Dec-08 15 n/d Sub-ad 2.5 Dead 20 218
2009F029 Y2 F 8-Dec-08 17-Jan-09 40 2 Adult 2.9 Dead 7 68
2009M030 Y2 M 11-Dec-08 17-Jan-09 37 1 Sub-ad 4.1 Unknown 36 732
2009M031 Y2 M 11-Dec-08 21-Dec-08 10 0 Juvenile 4.5 Dead 13 129
2009M032 Y2 M 14-Dec-08 21-Dec-08 7 0 Juvenile 3.7 Unknown 32 647
2009F033 Y2 F 13-Dec-08 21-Dec-08 8 1 Sub-ad 2.6 Dead 32 222
2009M035 Y2 M 18-Dec-08 21-Dec-08 3 0 Juvenile 4.1 Unknown 43 466
2009F036 Y2 F 19-Dec-08 17-Jan-09 29 4 Adult 2.4 Dead 2 5
2009M037 Y2 M 22-Dec-08 17-Jan-09 26 1 Sub-ad 3.9 Dead 2 11

16
Appendix 1. continued.
Animal Number
Study Year Sex
Capture Date
Release Date
Days Captive
Age upon
release Age
Class Weight
(kg)
Fate as of 31 Dec 2011
1
Number relocations by 31 Dec 2011
Number Days
monitored2
2009M039 Y2 M 23-Dec-08 17-Jan-09 25 1 Sub-ad 4.3 Dead 3 871
2009F040 Y2 F 26-Dec-08 17-Jan-09 22 0 Juvenile 2.1 P Dead 1 0
2009F041 Y2 F 24-Dec-08 17-Jan-09 24 1 Sub-ad 2.3 Dead 12 146
2009M042 Y2 M 27-Dec-08 17-Jan-09 21 0 Juvenile 4.6 Unknown 4 72
2009F043 Y2 F 30-Dec-08 17-Jan-09 18 4 Adult 2.1 Dead 39 548
2009F044 Y2 F 31-Dec-08 17-Jan-09 17 0 Juvenile 1.9 Dead 5 55
2009M045 Y2 M 3-Jan-09 17-Jan-09 14 0 Juvenile 3.9 P Dead 21 355
2009F048 Y2 F 8-Jan-09 17-Jan-09 9 1 Sub-ad 2.5 Unknown 34 746
2009F049 Y2 F 8-Jan-09 17-Jan-09 9 n/d Adult 2.6 Dead 2 11
2009F050 Y2 F 14-Jan-09 17-Jan-09 3 0 Juvenile 2.7 Dead 19 401
2009M051 Y2 M 14-Jan-09 17-Jan-09 3 0 Juvenile 3.6 Unknown 18 368
2009F054 Y2 F 16-Jan-09 23-Feb-09 38 0 Juvenile 3.0 Dead 9 98
2009F055 Y2 F 30-Jan-09 23-Feb-09 24 0 Juvenile 2.6 P Dead 3 108
2010M056 Y3 M 4-Nov-09 24-Dec-09 50 0 Juvenile 4.7 P Dead 26 526
2010F057 Y3 F 9-Nov-09 24-Dec-09 45 0 Juvenile 2.4 Unknown 29 391
2010M058 Y3 M 15-Nov-09 24-Dec-09 39 1 Sub-ad 4.6 Unknown 14 404
2010M059 Y3 M 21-Nov-09 24-Dec-09 33 2 Adult 5.3 P Dead 2 469
2010M060 Y3 M 24-Nov-09 24-Dec-09 30 0 Juvenile 4.5 Unknown 14 228
2010M061 Y3 M 4-Dec-09 24-Dec-09 20 0 Juvenile 4.2 P Dead 21 481
2010M062 Y3 M 5-Dec-09 24-Dec-09 19 0 Juvenile 4.6 P Dead 11 383
2010M063 Y3 M 7-Dec-09 24-Dec-09 17 2 Adult 4.5 Dead 11 84
2010M064 Y3 M 9-Dec-09 24-Dec-09 15 3 Adult 5.7 Unknown 9 211
2010F065 Y3 F 11-Dec-09 24-Dec-09 13 0 Juvenile 2.0 Dead 46 510
2010F067 Y3 F 12-Dec-09 24-Dec-09 12 0 Juvenile 2.0 Dead 15 116
2010F068 Y3 F 13-Dec-09 24-Dec-09 11 n/d Adult 2.6 Unknown 31 575
2010M069 Y3 M 14-Dec-09 24-Dec-09 10 0 Juvenile 3.6 Dead 12 123
2010M070 Y3 M 16-Dec-09 24-Dec-09 8 0 Juvenile 3.8 Dead 9 176
2010F071 Y3 F 17-Dec-09 24-Dec-09 7 n/d Juvenile 2.1 Dead 9 102
2010F072 Y3 F 18-Dec-09 24-Dec-09 6 2 Adult 2.4 Unknown 9 351
2010F073 Y3 F 22-Dec-09 21-Jan-10 30 0 Juvenile 2.6 Unknown 24 501
2010F074 Y3 F 24-Dec-09 21-Jan-10 28 1 Sub-ad 2.8 Alive 39 684
2010M075 Y3 M 24-Dec-09 21-Jan-10 28 0 Juvenile 3.4 Unknown 20 355

17
Appendix 1. continued.
Animal Number
Study Year Sex
Capture Date
Release Date
Days Captive
Age upon
release Age
Class Weight
(kg) Fate as of 31 Dec 2011
1
Number relocations by 31 Dec 2011
Number Days
monitored2
2010F076 Y3 F 26-Dec-09 21-Jan-10 26 4 Adult 2.6 Unknown 22 377
2010M077 Y3 M 28-Dec-09 21-Jan-10 24 n/d Juvenile 3.5 Unknown 35 560
2010F078 Y3 F 30-Dec-09 21-Jan-10 22 0 Juvenile 2.3 Alive 41 679
2010M079 Y3 M 2-Jan-10 21-Jan-10 19 3 Adult 4.7 Unknown 163 112
2010F080 Y3 F 5-Jan-10 21-Jan-10 16 4 Adult 2.7 P Dead 26 287
2010F081 Y3 F 6-Jan-10 20-Feb-10 45 5 Adult 3.2 Dead 12 160
2010M082 Y3 M 12-Jan-10 21-Jan-10 9 0 Juvenile 3.4 Unknown 35 589
2010M083 Y3 M 16-Jan-10 21-Jan-10 5 1 Sub-ad 3.8 Unknown 25 442
2010M084 Y3 M 17-Jan-10 21-Jan-10 4 2 Adult 5.1 Unknown 53 84
2010F085 Y3 F 18-Jan-10 21-Jan-10 3 1 Sub-ad 2.2 Dead 2 70
2010M086 Y3 M 19-Jan-10 20-Feb-10 32 0 Juvenile 5.0 Unknown 22 367
2010F087 Y3 F 20-Jan-10 20-Feb-10 31 1 Sub-ad 2.6 Dead 3 61
2010F088 Y3 F 22-Jan-10 20-Feb-10 29 3 Adult 3.2 Dead 19 105
2010M089 Y3 M 25-Jan-10 20-Feb-10 26 0 Juvenile 3.8 Dead 3 16
2010F091 Y3 F 29-Jan-10 20-Feb-10 22 n/d Adult 2.6 Dead 3 30
2010M092 Y3 M 29-Jan-10 20-Feb-10 22 2 Adult 6.0 Unknown 93 46
2010M093 Y3 M 1-Feb-10 20-Feb-10 19 1 Sub-ad 4.5 Dead 28 458
2010F094 Y3 F 1-Feb-10 20-Feb-10 19 0 Juvenile 2.7 Dead 5 107
2010M096 Y3 M 7-Feb-10 20-Feb-10 13 1 Sub-ad 4.4 Unknown 483 124
2010M097 Y3 M 10-Feb-10 20-Feb-10 10 4 Adult 5.6 Unknown 303 109
2010F098 Y3 F 11-Feb-10 20-Feb-10 9 2 Adult 2.4 P Dead 70 654
2010M099 Y3 M 12-Feb-10 20-Feb-10 8 0 Juvenile 4.6 Unknown 15 249 1Alive= found alive within the past 3 months; Dead=carcass recovered; P Dead is presumed dead=collar on mortality mode but carcass not
recovered; Unknown=Includes animals missing >3 months, shed collars, known failed radios, or animal whose last known location was live and
their radio is now past its’ effective life. 2Number of days between the release date and date of the last live location for dead, presumed dead and unknown status animals. Individuals
listed as still active were actively tracked (and alive) until 31 Dec 2011, which was used as the cut-off date for data used in this report. 3This male was equipped with an Argos satellite collar that failed shortly after the fisher was released.

18
Appendix 2. Histories and fates of fisher males M100 and M101.
The survival data available for males M100 and M101 were not included in survival calculations
because their histories and fates involved an intervention by project biologists.
On 8 June 2010, fisher female F088 was found dead after she was killed by a bobcat. Two kits,
males M100 and M101, were recovered from her den later that day. These two males were taken
to Northwest Trek Wildlife Park on 10 June 2010, where they were raised for the purpose of
releasing back to Olympic National Park when they were fully grown. When they reached adult
male weights and were capable of killing and eating small and mid-sized wild mammals, males
M100 and M101 were radio-collared on 14 October, 2010 and released in Olympic National
Park on 15 October, 2010. Both males were tracked weekly via aerial-telemetry flights and were
found to use areas not far from where they were released.
On 23 May 2011, a mortality signal was detected for male M100. Using telemetry equipment to
locate the collar, project biologists found a broken collar, indicating that his collar came off
while M100 was still alive. He had survived at least 189 days (6 months, 8 days) since being
released; his status is currently unknown.
On 28 July 2011, a mortality signal was also detected for male M101. A broken collar was all
that was found by project biologists, indicating that M101’s collar came off while he was still
alive. He had survived at least 255 days (8 months, 14 days) since being released. His status is
currently unknown.
These observations are significant for several reasons.
First, it was not known if wild kits could be raised in
captivity and successfully released in the wild with any
hope of success. These 2 males grew very quickly and
learned to capture, kill and eat live, wild prey effectively
in a captive setting. Second, while it may be possible to
raise these kits in captivity, it was not known if they
could survive for very long in the wild. These 2 kits
exceeded expectations by surviving at least 6 months
(M100) and 8 months (M101). This indicates that
rescued fishers raised in captivity and released back to
the wild can survive a significant time. Third, these
observations indicate that the 2 males survived long
enough to potentially mate and contribute
demographically and genetically to the population. This
experience indicates that raising rescued fishers for
release back to the wild may be a sound conservation
investment.