Embed Size (px)
Citation preview

Olympus GroupFinancial Results for the 2nd Quarter of the Fiscal Year Ending March 31, 2015
Hiroyuki SasaPresident and Representative Director
Olympus Corporation
November 7, 2014

22014/11/7 No data copy / No data transfer permitted
Strong Medical Business performance drives consolidated performance improvements, new post-Lehman Shock (fiscal 2009) record for first-half operating income set at ¥38.4 billion
(Billions of yen)FY2014
1H (Apr-Sep)(Results)
FY20151H (Apr-Sep)(Initial forecasts)
FY20151H (Apr-Sep)
(Results)
YoYchange
Compared to forecast
Net sales 333.8 360.0 355.0 +6% -1%
Operating income(% of sales)
28.5(8.5%)
35.0(9.7%)
38.4(10.8%) +35% +10%
Ordinary income(% of sales)
17.0(5.1%)
25.0(6.9%)
29.7(8.4%) +75% +19%
Net income(% of sales)
-7.9(-)
13.0(3.6%)
22.3(6.3%) - +72%
2Q of Fiscal 2015―Consolidated Financial Results
32014/11/7 No data copy / No data transfer permitted
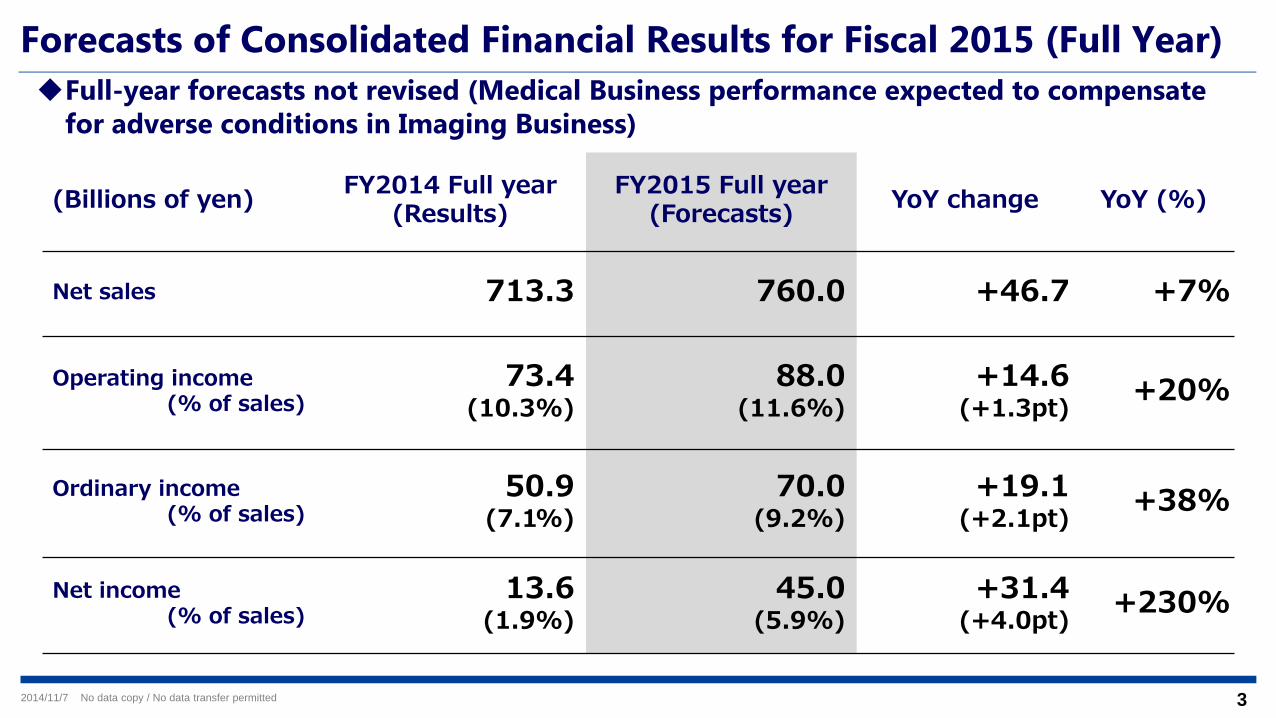
Forecasts of Consolidated Financial Results for Fiscal 2015 (Full Year)
(Billions of yen) FY2014 Full year(Results)
FY2015 Full year(Forecasts) YoY change YoY (%)
Net sales 713.3 760.0 +46.7 +7%
Operating income(% of sales)
73.4(10.3%)
88.0(11.6%)
+14.6(+1.3pt) +20%
Ordinary income(% of sales)
50.9(7.1%)
70.0(9.2%)
+19.1(+2.1pt) +38%
Net income(% of sales)
13.6(1.9%)
45.0(5.9%)
+31.4(+4.0pt) +230%
Full-year forecasts not revised (Medical Business performance expected to compensate for adverse conditions in Imaging Business)

42014/11/7 No data copy / No data transfer permitted
Key Points
Record-breaking performance and progress in strategic investments
Optimization of business scale
52014/11/7 No data copy / No data transfer permitted
20%
22%
24%
0.0
200.0
400.0
600.0
FY2015 FY2016 FY2017
Net sales Operating income % to sales
Medium-Term Vision Target
(Billions of yen)
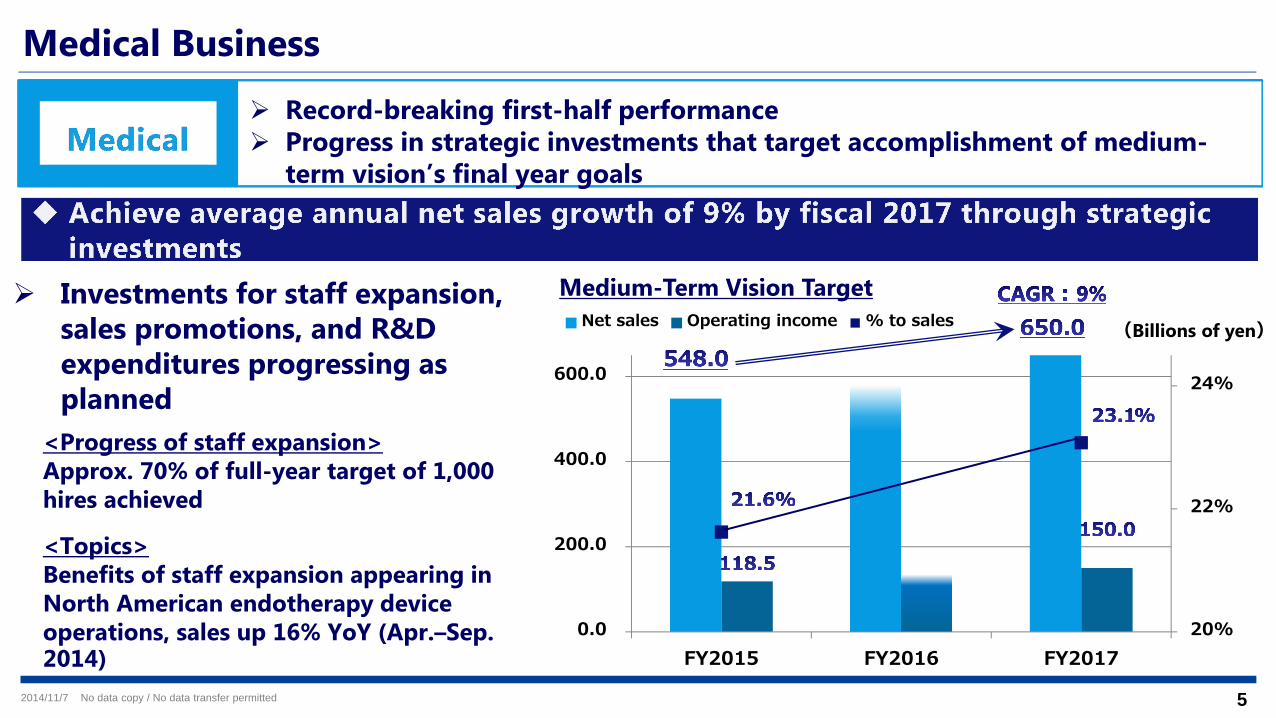
Medical Business
Record-breaking first-half performance Progress in strategic investments that target accomplishment of medium-
term vision’s final year goals
Investments for staff expansion, sales promotions, and R&D expenditures progressing as planned
<Progress of staff expansion>Approx. 70% of full-year target of 1,000 hires achieved
<Topics>Benefits of staff expansion appearing in North American endotherapy device operations, sales up 16% YoY (Apr.–Sep. 2014)

62014/11/7 No data copy / No data transfer permitted
-0.9
0.6Initial forecast
44.0
Mirrorless
-3.0 Others
Result40.1
Initial forecast Result
-3.0 Mirrorless
Others
-4.6-2.2
Imaging Business—Reasons for Higher Operating Loss
Higher operating loss recorded due to failure to meet sales target for mirrorless cameras, an area where strong growth is being targeted
Sluggish PEN series sales
(Billions of yen)
<Reasons for Failure to Meet Mirrorless Camera Sales Target>Slowdown in Japanese and other Asian markets
Reasons for Failure to Meet Net Sales Target Reasons for Failure to Meet Operating Loss Target(Billions of yen)
Deterioration in cost ratios due to depreciated yen
72014/11/7 No data copy / No data transfer permitted
Optimization of Business Scale
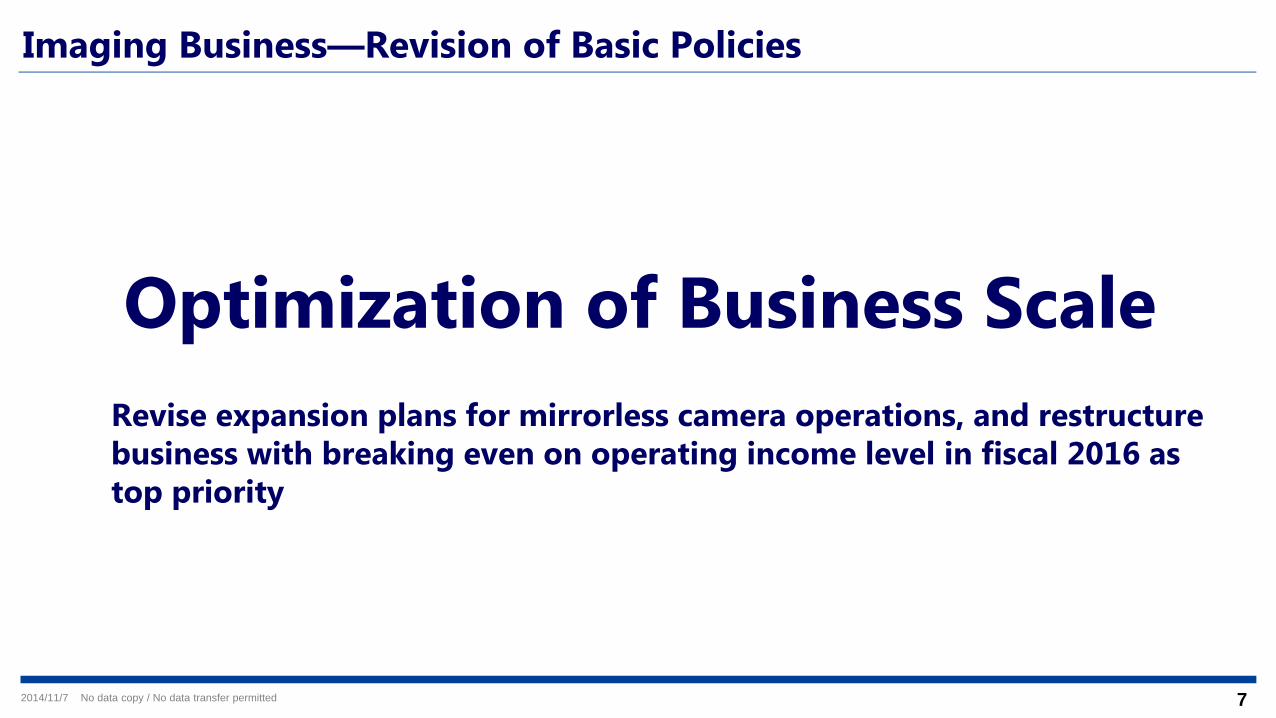
Imaging Business—Revision of Basic Policies
Revise expansion plans for mirrorless camera operations, and restructure business with breaking even on operating income level in fiscal 2016 as top priority

82014/11/7 No data copy / No data transfer permitted
Target cost level that will allow for breaking even on operating income level with net sales of less than ¥80 billion
Imaging Business—Business Restructuring
Review and rationalize fixed costs
Revise regional strategies
Reallocate resources in manufacturing, R&D, and indirect divisions
Reduce resources allocated to regions lacking market growth potential
Restructure business to cut SG&A expenses by 20%

92014/11/7 No data copy / No data transfer permitted
-140.0
-90.0
-40.0
10.0
60.0
110.0
列1 FY2013 FY2014 FY2015 FY2016 2016/4期 2016/5期 FY2017
Imaging Business—Model for Breaking Even
(Result) (Result) (Forecast) (Image)and beyond
(Image)
Mirrorless
Compact Camera
Others
Net sales
Costs
Approx. ¥107.0
Operating loss
-¥23.1 -¥9.1 -¥7.5 0
Conservative sales volume target for mirrorless and other cameras
Conservative sales volume target for mirrorless and other cameras
Substantial reduction in fixed costs to match business scale
Substantial reduction in fixed costs to match business scale
Net sales target based on conservative sales plan and appropriate cost level
Approx. ¥130.0
Approx. ¥96.0 ¥90.0 Approx. ¥80.0
(Billions of yen)
Approx. ¥105.0¥97.5
Approx. ¥80.0

Consolidated Financial Results for the 2nd Quarter of the Fiscal Year Ending March 31, 2015
Yasuo TakeuchiDirector, Senior Executive Managing Officer
Group President of Group Management Office Olympus Corporation
November 7, 2014
122014/11/7 No data copy / No data transfer permitted
Consolidated Financial Results and Business Overviewfor the 2Q of Fiscal 2015 (FY Ending March 31, 2015)
132014/11/7 No data copy / No data transfer permitted
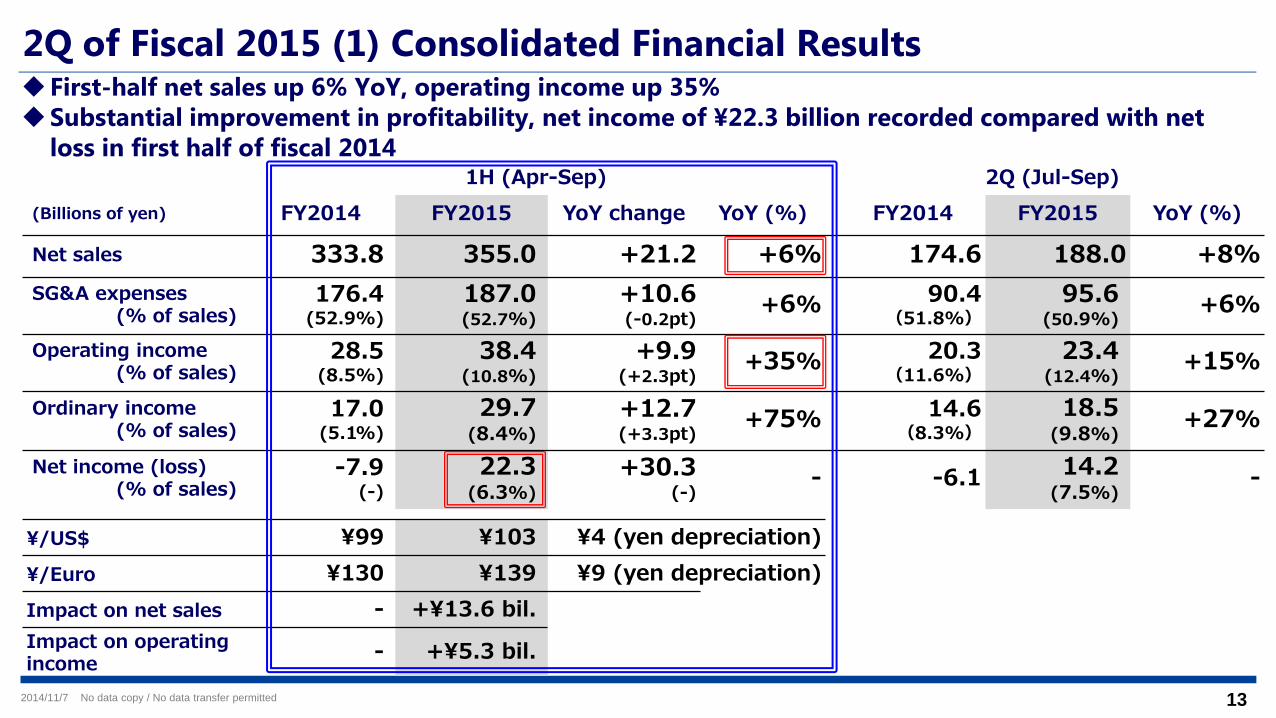
2Q of Fiscal 2015 (1) Consolidated Financial Results
1H (Apr-Sep) 2Q (Jul-Sep)(Billions of yen) FY2014 FY2015 YoY change YoY (%) FY2014 FY2015 YoY (%)
Net sales 333.8 355.0 +21.2 +6% 174.6 188.0 +8%SG&A expenses
(% of sales)176.4
(52.9%)187.0(52.7%)
+10.6(-0.2pt) +6% 90.4
(51.8%)95.6
(50.9%) +6%
Operating income(% of sales)
28.5(8.5%)
38.4(10.8%)
+9.9(+2.3pt) +35% 20.3
(11.6%)23.4
(12.4%) +15%
Ordinary income(% of sales)
17.0(5.1%)
29.7(8.4%)
+12.7(+3.3pt) +75% 14.6
(8.3%)18.5
(9.8%)+27%
Net income (loss)(% of sales)
-7.9(-)
22.3(6.3%)
+30.3(-)
- -6.1 14.2(7.5%)
-
¥/US$ ¥99 ¥103 ¥4 (yen depreciation)¥/Euro ¥130 ¥139 ¥9 (yen depreciation)Impact on net sales - +¥13.6 bil.Impact on operating income - +¥5.3 bil.
First-half net sales up 6% YoY, operating income up 35%Substantial improvement in profitability, net income of ¥22.3 billion recorded compared with net
loss in first half of fiscal 2014

142014/11/7 No data copy / No data transfer permitted
2Q of Fiscal 2015 (2) Results by Business SegmentRecord-breaking first-half net sales and operating income in Medical Business drive
consolidated performance improvementsProfitability achieved in Others Business due to withdrawal from biologics business
1H (Apr-Sep) 2Q (Jul-Sep)
(Billions of yen) FY2014 FY2015 YoYchange YoY (%) FY2014 FY2015 YoY
change YoY (%)
MedicalNet sales 229.8 256.8 +27.0 +12% 121.9 135.9 +14.0 +11%Op. income 49.2 54.6 +5.4 +11% 30.7 30.4 -0.3 -1%
Scientific Solutions
Net sales 44.0 46.7 +2.7 +6% 24.0 25.6 +1.6 +7%Op. income 0.5 1.3 +0.7 +129% 1.5 1.5 -0 -1%
ImagingNet sales 47.0 40.1 -6.9 -15% 22.1 20.3 -1.8 -8%Op. income -2.7 -4.6 -1.9 - -2.1 -2.4 -0.2 -
OthersNet sales 13.0 11.4 -1.5 -12% 6.5 6.2 -0.3 -5%Op. income -2.8 0.7 +3.5 - -1.4 0.4 +1.8 -
Elimination & corporate
Net sales - - - - - - - -Op. income -15.7 -13.6 +2.1 - -8.4 -6.6 +1.8 -
Consolidated Total
Net sales 333.8 355.0 +21.2 6% 174.6 188.0 +13.4 +8%Op. income 28.5 38.4 +9.9 +35% 20.3 23.4 +3.0 +15%

152014/11/7 No data copy / No data transfer permitted
Favorable sales of endoscopes, surgical devices, and endotherapy devices, net sales and operating income set new record highs
Deterioration of 2Q (Jul.–Sep.) operating margin resulted from strategic investments
2Q of Fiscal 2015 (3) Medical Business
121.9135.9
30.7 30.4
25% 22%
0%
15%
30%
0.0
50.0
100.0
150.0
Jul-Sep 2013 Jul-Sep 2014
(Billions of yen)
Net sales Operating income Operating margin
Net sales: +11%
Operating loss: -1%
(YoY)
229.8256.8
49.2 54.6
21% 21%
0%
15%
30%
0.0
100.0
200.0
300.0
Apr-Sep 2013 Apr-Sep 2014
(Billions of yen)
Net sales Operating income Operating margin
Net sales: +12%
Operating income:+11%
(YoY)

162014/11/7 No data copy / No data transfer permitted
24.025.6
6% 6%
0%
5%
10%
0.0
10.0
20.0
30.0
Jul-Sep 2013 Jul-Sep 2014
(Billions of yen)
Net sales Operating income Operating margin
44.046.7
1%
3%
0%
5%
0.0
20.0
40.0
60.0
Apr-Sep 2013 Apr-Sep 2014
(Billions of yen)
Net sales Operating income Operating margin
2Q of Fiscal 2015 (4) Scientific Solutions Business
0.5 1.3 1.5 1.5
Higher sales and income achieved on back of favorable performances of non-destructive testing equipment and biological microscopes, primarily overseas
Progress of strategy revisions and restructuring measures on schedule
(YoY)(YoY)
Net sales: +7%
Operating loss: -¥0 billion
Net sales: +6%
Operating income: +¥0.7 billion

172014/11/7 No data copy / No data transfer permitted
Operating loss: -¥0.2 billion
Operating loss: -¥1.9 billion
2Q of Fiscal 2015 (5) Imaging Business-(i)
47.040.1
-5.0
5.0
15.0
25.0
35.0
45.0
(Billions of yen)
Net sales Operating loss
18.2
Mirrorlessgrowth:+21%
-2.7 -4.6
Apr-Sep 2013 Apr-Sep 2014
22.0
Decline in compact camera sales volume results in 15% YoY decrease in net sales, mirrorlesscamera sales up approx. 20%
Operating loss of ¥4.6 billion recorded due to higher investments in mirrorless camera and BtoB operations
22.1 20.3
-5.0
5.0
15.0
25.0(Billions of yen)
Net sales Operating loss
9.1
Mirrorlessgrowth:+20%
-2.1 -2.4
Jul-Sep 2013 Jul-Sep 2014
10.9
(YoY)(YoY)
Net sales: -8%Net sales: -15%

182014/11/7 No data copy / No data transfer permitted
2Q of Fiscal 2015 (5) Imaging Business-(ii)
(Billions of yen)FY2014
1H (Apr-Sep)FY2015
1H (Apr-Sep)YoY
change
Net sales 47.0 40.1 -6.9Mirrorless Camera 18.2 22.0 +3.8
Compact Camera, Others 28.9 18.1 -10.7
Gross profit 22.1 18.2 -3.9
SG&A expenses(% of sales)
24.8(52.7%)
22.8(56.8%)
-2.0(+4.1pt)
Operating loss -2.7 -4.6 -1.9
Net sales downHigher mirrorless camera sales unable to compensate for lower compact camera sales, net sales down YoY accordingly
Gross profit down
Operating loss up
SG&A ratio deterioratedHigher investments in mirrorless camera and BtoBoperations

192014/11/7 No data copy / No data transfer permitted
2Q of Fiscal 2015 (6) Net Sales by Region Strong Medical Business performance drives consolidated performance, sales increases in all
regions except Japan(Japan: Imaging and Scientific Solutions Business sales down due to impacts of consumption tax hike)
*Graphs above are the total of core three businesses (Medical, Scientific Solutions, and Imaging)
49.3 51.7
84.3 90.7
57.0 67.7
33.641.2
224.3
+5%
+8%
+19%
+23%
251.4
69.9 69.7
103.2 110.5
80.9 90.8
56.964.1
310.9
-0%
+7%
+12%
+13%
335.0 +8%(YoY)
+12%(YoY)
*
202014/11/7 No data copy / No data transfer permitted
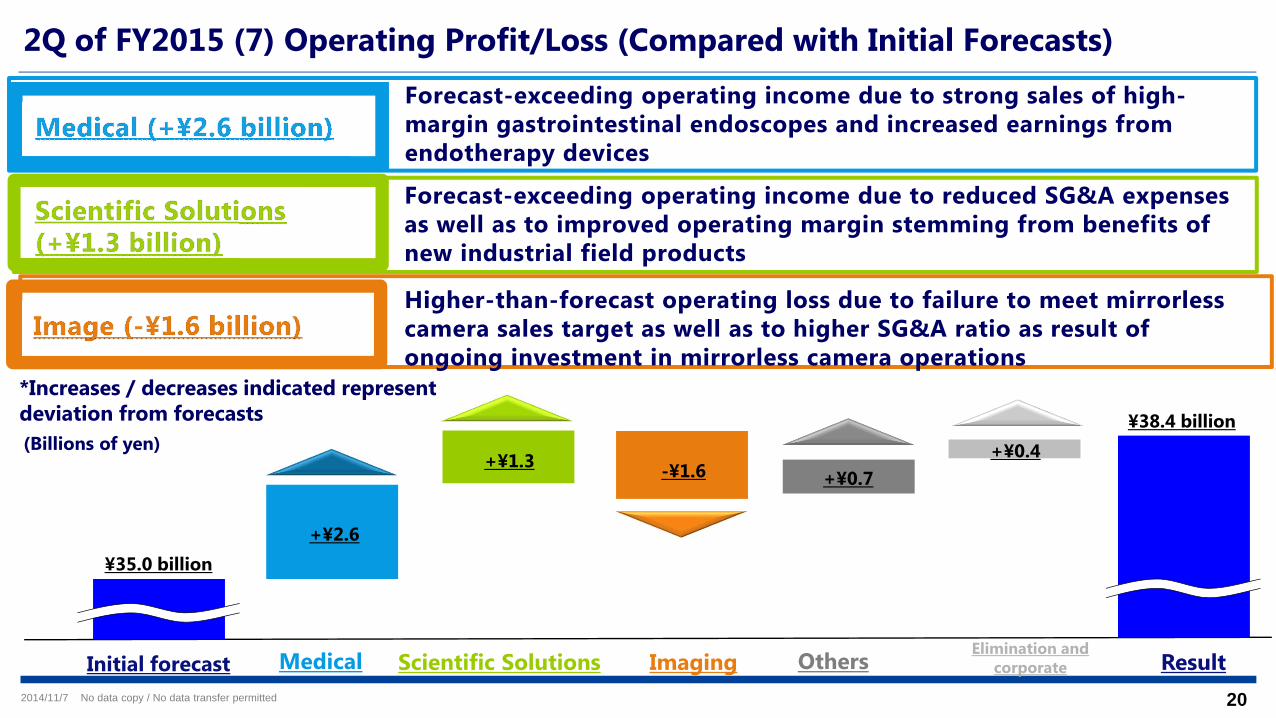
2Q of FY2015 (7) Operating Profit/Loss (Compared with Initial Forecasts)Forecast-exceeding operating income due to strong sales of high-margin gastrointestinal endoscopes and increased earnings from endotherapy devices
Initial forecast Medical Imaging OthersElimination and
corporate Result
*Increases / decreases indicated represent deviation from forecasts
¥35.0 billion+¥2.6
+¥1.3 -¥1.6 +¥0.7 +¥0.4
Scientific Solutions
¥38.4 billion
Higher-than-forecast operating loss due to failure to meet mirrorlesscamera sales target as well as to higher SG&A ratio as result of ongoing investment in mirrorless camera operations
Forecast-exceeding operating income due to reduced SG&A expenses as well as to improved operating margin stemming from benefits of new industrial field products
(Billions of yen)

212014/11/7 No data copy / No data transfer permitted
Consolidated Balance Sheet (End of September 2014) Equity ratio of 36.8%, interest-bearing debt down approx. ¥55.9 billion due to early
repayment and other factors Mirrorless and other digital camera inventory issues require attention (inventory depletion
anticipated as result of second-half sales)
(Billions of yen) End Mar2014
End Sep2014 Change End Mar
2014End Sep
2014 Change
Current assets(Digital camera inventories)
576.5(21.7)
543.9(28.1)
-32.7(+6.4) Current liabilities 276.3 274.6 -1.7
Property, plant and equipment 135.4 140.5 +5.0
Non-current liabilities(Incl. bonds/long-term loans payable)
419.9(346.8)
359.5(283.9)
-60.4(-62.9)
Intangible assets 173.6 175.2 +1.6 Net assets 331.3 372.9 +41.7
Investments and other assets 142.0 147.5 +5.5 (Equity ratio) (32.1%) (36.8%) (+4.7pt)
Total assets 1,027.5 1,007.0 -20.5 Total liabilities and net assets 1,027.5 1,007.0 -20.5
Interest-bearing debt : ¥359.9 billion (-¥55.9 billion from March 31, 2014)Net interest-bearing debt: ¥151.3 billion (-¥12.5 billion from March 31, 2014)
222014/11/7 No data copy / No data transfer permitted
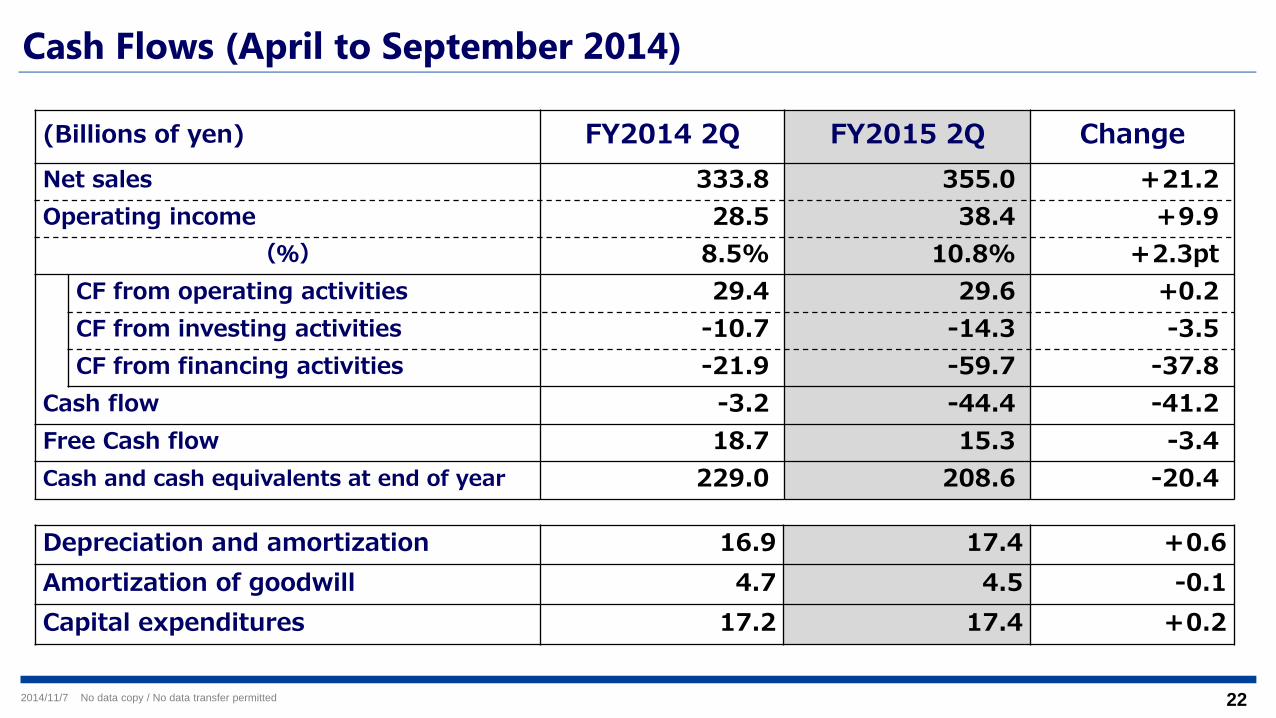
Cash Flows (April to September 2014)
(Billions of yen) FY2014 2Q FY2015 2Q ChangeNet sales 333.8 355.0 +21.2Operating income 28.5 38.4 +9.9
(%) 8.5% 10.8% +2.3ptCF from operating activities 29.4 29.6 +0.2CF from investing activities -10.7 -14.3 -3.5CF from financing activities -21.9 -59.7 -37.8
Cash flow -3.2 -44.4 -41.2Free Cash flow 18.7 15.3 -3.4Cash and cash equivalents at end of year 229.0 208.6 -20.4
Depreciation and amortization 16.9 17.4 +0.6Amortization of goodwill 4.7 4.5 -0.1Capital expenditures 17.2 17.4 +0.2

232014/11/7 No data copy / No data transfer permitted
Forecast for Fiscal 2015

242014/11/7 No data copy / No data transfer permitted
(Billions of yen) FY2014(Results)
FY2015(Forecasts) YoY change YoY (%)
Net sales 713.3 760.0 +46.7 +7%
Operating income(% of net sales)
73.4(10.3%)
88.0(11.6%)
+14.6(+1.3pt) +20%
Non-operating income/expenses -22.5 -18.0 +4.5 -
Ordinary income(% of net sales)
50.9(7.1%)
70.0(9.2%)
+19.1(+2.1pt) +38%
Net income(% of net sales)
13.6(1.9%)
45.0(5.9%)
+31.4(+4.0pt) +230%
¥/US$ ¥100 ¥105 ¥5(yen depreciation)¥/Euro ¥134 ¥137 ¥3(yen depreciation)Impact on net sales - +¥16.0 billionImpact on operating income - +¥8.2 billion
Forecasts of Consolidated Financial Results for Fiscal 2015
252014/11/7 No data copy / No data transfer permitted
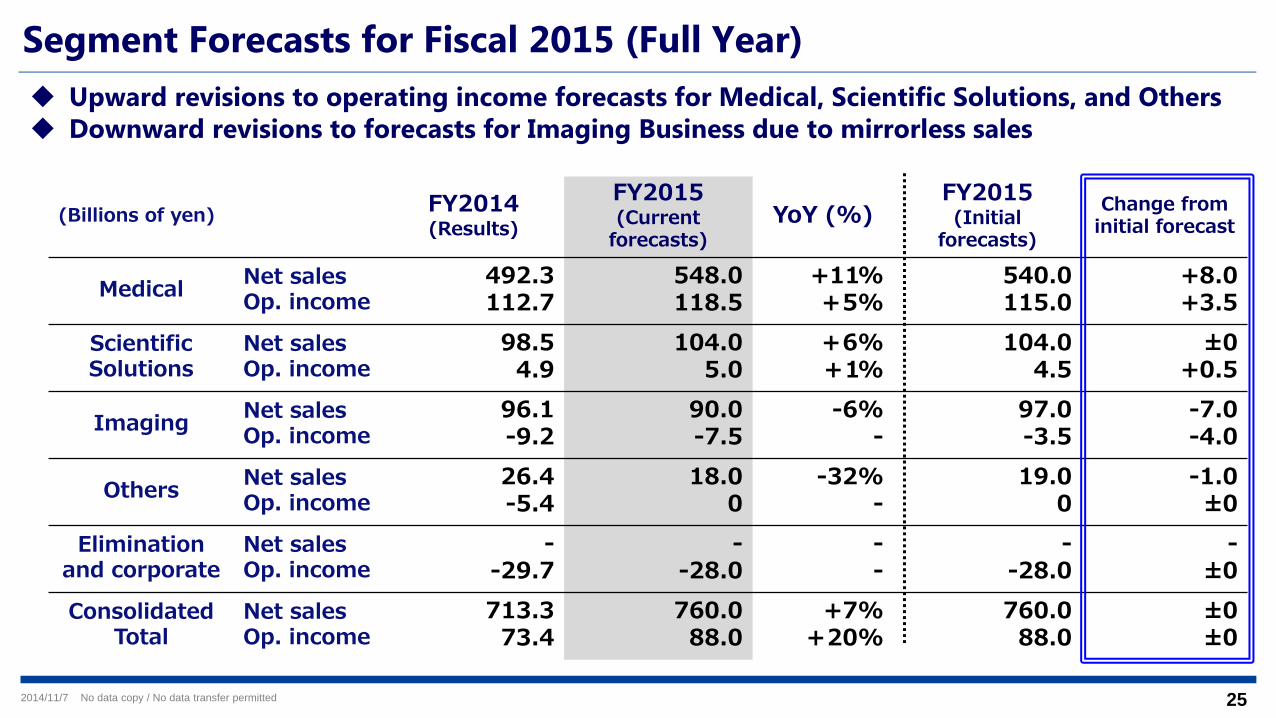
(Billions of yen) FY2014(Results)
FY2015(Current
forecasts)YoY (%)
FY2015 (Initial
forecasts)
Change from initial forecast
Medical Net salesOp. income
492.3112.7
548.0118.5
+11%+5%
540.0115.0
+8.0+3.5
Scientific Solutions
Net salesOp. income
98.54.9
104.05.0
+6%+1%
104.04.5
±0+0.5
Imaging Net salesOp. income
96.1-9.2
90.0-7.5
-6%-
97.0-3.5
-7.0-4.0
Others Net salesOp. income
26.4-5.4
18.00
-32%-
19.00
-1.0±0
Elimination and corporate
Net salesOp. income
--29.7
--28.0
--
--28.0
-±0
Consolidated Total
Net salesOp. income
713.373.4
760.088.0
+7%+20%
760.088.0
±0±0
Segment Forecasts for Fiscal 2015 (Full Year) Upward revisions to operating income forecasts for Medical, Scientific Solutions, and Others Downward revisions to forecasts for Imaging Business due to mirrorless sales
262014/11/7 No data copy / No data transfer permitted
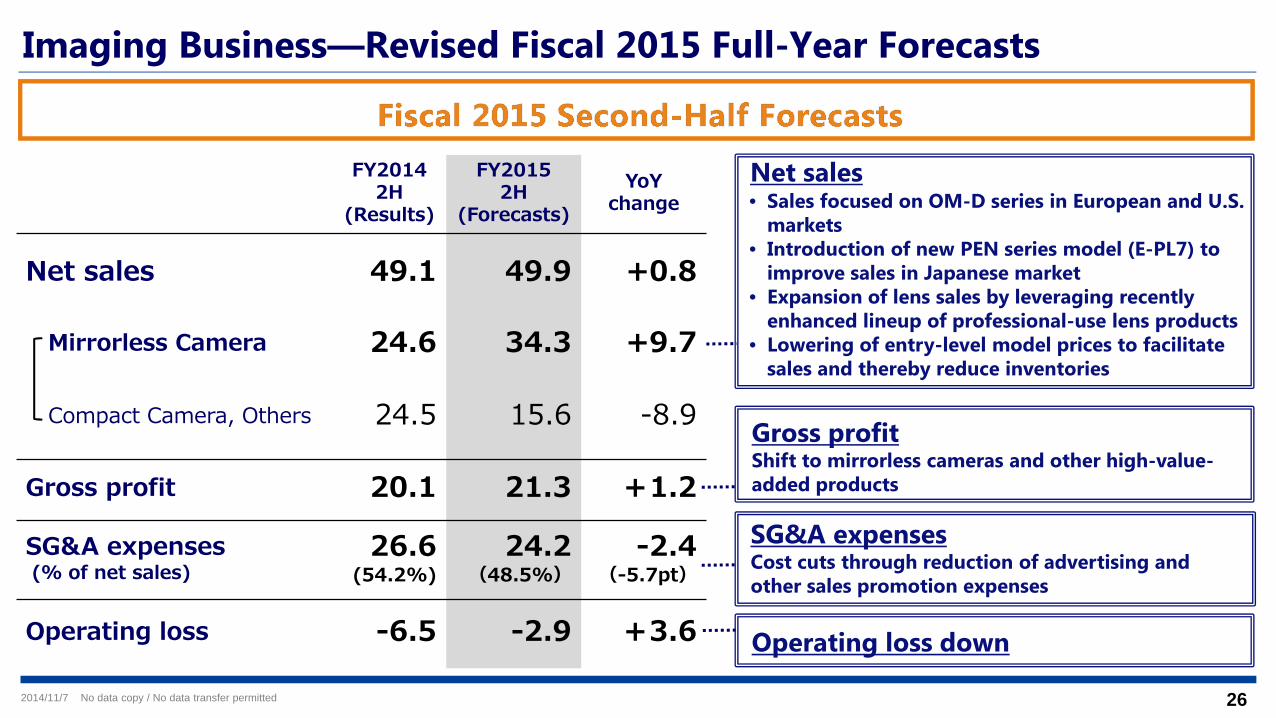
FY20142H
(Results)
FY20152H
(Forecasts)YoY
change
Net sales 49.1 49.9 +0.8
Mirrorless Camera 24.6 34.3 +9.7
Compact Camera, Others 24.5 15.6 -8.9
Gross profit 20.1 21.3 +1.2
SG&A expenses(% of net sales)
26.6(54.2%)
24.2(48.5%)
-2.4(-5.7pt)
Operating loss -6.5 -2.9 +3.6
• Sales focused on OM-D series in European and U.S. markets
• Introduction of new PEN series model (E-PL7) to improve sales in Japanese market
• Expansion of lens sales by leveraging recently enhanced lineup of professional-use lens products
• Lowering of entry-level model prices to facilitate sales and thereby reduce inventories
Gross profitShift to mirrorless cameras and other high-value-added products
Operating loss down
SG&A expenses Cost cuts through reduction of advertising and other sales promotion expenses
Imaging Business―Revised Fiscal 2015 Full-Year Forecasts
Net sales

282014/11/7 No data copy / No data transfer permitted
Supplementary Materials
292014/11/7 No data copy / No data transfer permitted
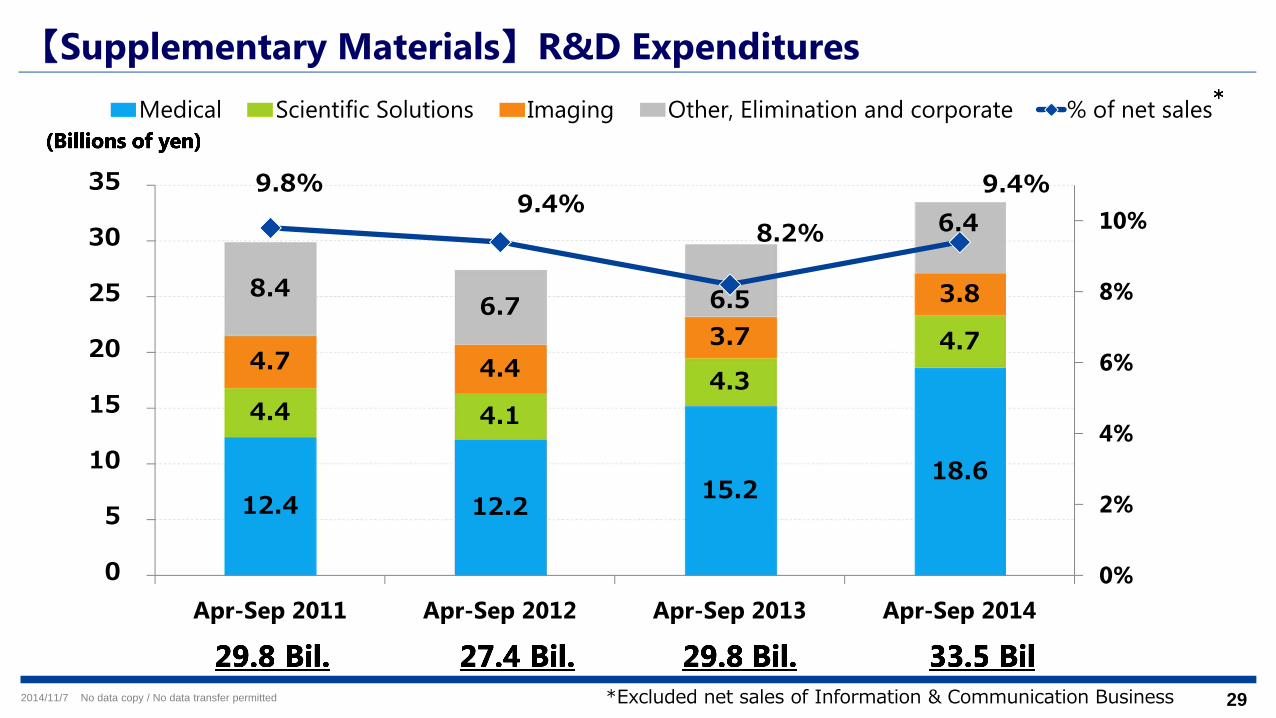
12.4 12.2 15.2 18.6
4.4 4.1 4.3
4.7 4.7 4.4
3.7 3.8 8.4
6.7 6.5
6.4 9.8%
9.4%8.2%
9.4%
0%
2%
4%
6%
8%
10%
0
5
10
15
20
25
30
35
Apr-Sep 2011 Apr-Sep 2012 Apr-Sep 2013 Apr-Sep 2014
Medical Scientific Solutions Imaging Other, Elimination and corporate % of net sales
【Supplementary Materials】R&D Expenditures
*Excluded net sales of Information & Communication Business

302014/11/7 No data copy / No data transfer permitted
【Supplementary Material】Depreciation and Amortization
16.5 Bil 15.7 Bil 16.6 Bil 17.4 Bil

312014/11/7 No data copy / No data transfer permitted
【Supplementary Materials】Capital Expenditures
16.5 Bil. 14.6 Bil. 17.2 Bil. 17.4 Bil.

322014/11/7 No data copy / No data transfer permitted
MedicalScientific Solutions
ImagingOthersTotal
Net Sales
540.0104.0
97.019.0
760.0
650.0135.0100.0
35.0920.0
115.04.5
-3.50
88.0
150.015.0
9.01.0
143.0-28.0 -32.0
548.0104.0
90.018.0
760.0118.5
5.0-7.5
0
88.0-28.0
【Supplementary Materials】Medium-Term Vision-Target by Segment

332014/11/7 No data copy / No data transfer permitted
【Supplementary Materials】Interest-bearing Debt
586.2 596.2 560.4
471.8 430.0 433.6 415.8 399.0
359.9
0.0
100.0
200.0
300.0
400.0
500.0
600.0
700.0
End Sep 2012 End Dec 2012 End Mar 2013 End Jun 2013 End Sep 2013 End Dec 2013 End Mar 2014 End Jun 2014 End Sep 2014
342014/11/7 No data copy / No data transfer permitted
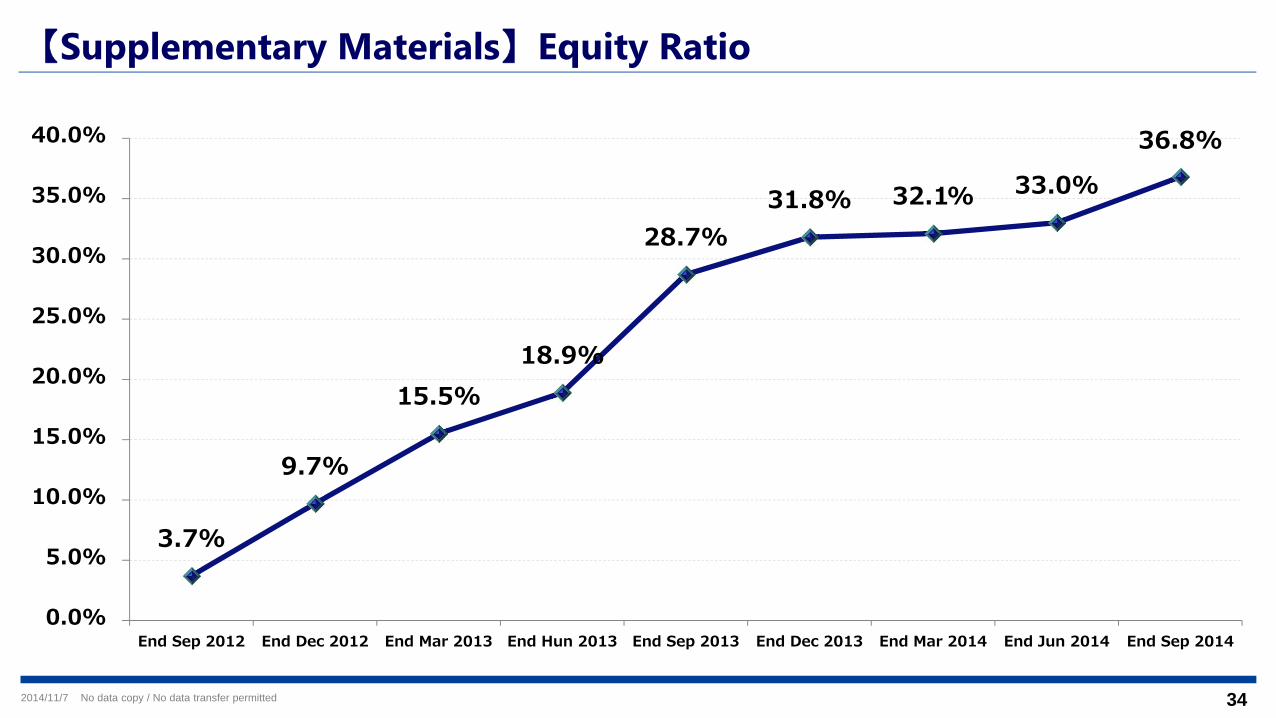
3.7%
9.7%
15.5%18.9%
28.7%31.8% 32.1% 33.0%
36.8%
0.0%
5.0%
10.0%
15.0%
20.0%
25.0%
30.0%
35.0%
40.0%
End Sep 2012 End Dec 2012 End Mar 2013 End Hun 2013 End Sep 2013 End Dec 2013 End Mar 2014 End Jun 2014 End Sep 2014
【Supplementary Materials】Equity Ratio

This material contains forward-looking statements that reflect management’s current views, plans, and expectations based on information available at the time of preparation. These forward-looking statements are not guarantees of future performance and involve known and unknown risks, uncertainties, future business decisions, and other internal and external factors that may cause the Company’s actual results, performance, achievements, or financial position to be materially different from any future results expressed or implied by these forward-looking statements.
Additionally, this information is subject to change without notice. Accordingly, other information should be used in addition to this material when making investment decisions.
Olympus Corporation assumes no responsibility for any damage resulting from the use of this material.