Embed Size (px)
Citation preview

OMA SAVINGS BANK LTD
BALANCE SHEET BOOK 2013
Business Identity Code: 2231936-2 Postal address: Keskustori 3, FI-60100 Seinäjoki Visiting address: Keskustori 3, Seinäjoki Domicile: Parkano


TABLE OF CONTENTS FINANCIAL STATEMENTS AND ANNUAL REPORT 2013 Board of Directors’ Annual Report for the Financial Period of 1 January – 31 December 2013... 1
Bank’s operating activities ........................................................................................................................ 1 Income ...................................................................................................................................................... 3 Balance sheet ........................................................................................................................................... 5 Consolidated financial statements ............................................................................................................ 8 Voluntary ja statutory reserves ................................................................................................................. 8 Solvency management ............................................................................................................................. 8 Risk management ................................................................................................................................... 10 Administration and personnel ................................................................................................................. 14 Corporate social responsibility ................................................................................................................ 16 Events occurring after the balance sheet date ....................................................................................... 16 Development of business operations in 2014 ......................................................................................... 16 Proposal of the Board of Directors on the use of assets eligible for profit distribution ........................... 17 Calculation formulae of the key figures ................................................................................................... 18
Financial statements ................................................................................................................ 19 Income statement of Oma Savings Bank Ltd ......................................................................................... 19 Balance sheet of Oma Savings Bank Ltd ............................................................................................... 19 Financial statement of Oma Savings Bank Ltd ....................................................................................... 22 Notes ....................................................................................................................................................... 23
Signing the financial statements and the annual report ............................................................ 46 List of accounting books and types of receipts used during the financial period ....................... 46

1
Board of Directors’ Annual Report for the Financial Period of 1 January – 31 December 2013 Oma Savings Bank Ltd is an independent Savings Bank. The bank operates in the regions of Southern Ostrobothnia, Pirkanmaa and Satakunta. The majority of the bank’s clientele is formed by private clients and small businesses. Parkano Savings Bank transferred its business operations to Oma Savings Bank Ltd on 30 April 2013. The transfer was implemented in accordance with Sections 90–92 of the Savings Bank Act so that the assets and liabilities of Parkano Savings Bank were transferred to Oma Savings Bank Ltd with carrying amounts. In the same connection, Parkano Savings Bank became the Parkano Savings Bank Foundation that now owns 40.48 per cent of Oma Savings Bank Ltd. The Töysä, Kuortane and Parkano Savings Bank Foundations are the owners of Oma Savings Bank Ltd. The objective of this reform is to strengthen the preconditions of Savings Bank opera-tions in the operating area of the merging Saving Banks by creating a strong Savings Bank that equally represents and serves the different population groups and operating areas of the Sav-ings Bank. The balance sheet book has been prepared based on the official figures of Oma Savings Bank Ltd and, due to the transfer of the business operations of Parkano Savings Bank, it is not direct-ly comparable with the figures of the previous year. The official financial statements of Oma Savings Bank Ltd for the 1 January–31 December 2013 period comprises the bank’s official annual report, income statement, balance sheet, financial statement and notes with comparative information. The bank’s number of clients amounted to over 44,800 at the end of the financial period. The bank has a total of 17 offices in Alajärvi, Alavus, Ilmajoki, Kuortane, Seinäjoki, Parkano, Kihniö, Kankaanpää, Kauhajoki, Jalasjärvi, Kurikka, Karvia and Tampere. In addition to the services offered by the offices, the clients use online banking, self-service machines and cash dispens-ers. The share of self-service out of all basic client services was 94.0 per cent in 2013. At the end of the year, over 15,900 clients had an online banking agreement.
Bank’s operating activities
The growth and income of Oma Savings Bank Ltd’s operating activities met the goals set by the bank in its operating plan for the financial period. Oma Savings Bank Ltd practices basic banking operations and offers its clients diverse banking services both via its own balance and supplies products of its partners. The supplied products include credit, investment and insurance products. The supplied credits comprise Aktia Real Estate Mortgage Bank Plc’s mortgage credits that amounted to MEUR 115.3 at the end of 2013. During the review period, Aktia Real Estate Mort-gage Bank has not given out any new mortgage credits, hence, new lending is done from the banks’ own balances. The bank has a refinancing obligation to the mortgage credits it supplies. The refinancing obligation is implemented as long-term, unsecured senior credit to Aktia Real Estate Mortgage Bank. The credit amount is tied to the amount of supplied credits. The amount is reviewed twice per year. The investment products in the bank’s product selection include Sp-Fund Management Compa-ny Ltd’s funds as well as SEB Wealth Management Finland and SEB’s funds and index credits.

2
The bank also offers its clients trust activity services, where the portfolio manager is SEB Varainhoito Suomi. In addition, the bank offers its clients stock trading services. At the end of the year, the clients had MEUR 61.8 of reserve and insurance savings supplied by the bank.
The pension and life insurance products supplied by the bank are produced by Duo Life Insur-ance Company Ltd, which is owned by the Savings Banks. Previously owned equally by the Savings Banks and Local Insurance Group, Duo Life Insurance Company Ltd was transferred to the full ownership of the Savings Banks in February 2013. The Savings Bank Group and LähiTapiola Group signed an agreement in late January 2013 on ending the co-operation agreement. At the turn of June and July, Duo handed its entire risk life insurance portfolio over to the LähiTapiola Group. The arrangements have no significant impact on the operations of Duo.
In payment intermediation, the bank uses the payment intermediation and clearing services of Bonum Bank Ltd (former ACH Finland Ltd). In June, Säästöpankkien Holding that represents the Savings Banks sold its share in payment centre Bonum Bank Ltd to POP Bank Alliance. Bonum Bank Ltd continues the payment intermediation of the Savings Banks, POP Bank and Aktia Bank until the payment transactions of the Savings Banks and POP Banks is shifted to their own central credit institutions and the central credit institution services provided by Aktia Bank end in 2015. The realtor is the Savings Banks’ own real estate chain, whose central company is Sp-Koti Ltd. The Sp-Koti chain operates on the franchising principle, where independent companies form a national realtor chain operating in co-operation with the bank. The real estate operations that began in the operating area of Oma Savings Bank Ltd (Ilmajoki, Hyllykallio and Seinäjoki) at the end of 2012 have continued actively throughout the year. In addition, the bank holds the majori-ty in a real estate agency called Asuntokamari Ltd operating in the area of the Kuusiokunnat municipalities. In May, the Savings Banks opened an online shop for insurances. The online shop offers the most common accident insurance services for consumers. The insurer is Finnish P&C Insur-ance. In September 2013, the Boards of Directors of Kantasäästöpankki Ltd and Oma Savings Bank Ltd concluded a merger agreement. The Extraordinary General Meetings of Oma Savings Bank and Kantasäästöpankki accepted the project finally in October 2013. The operations of Kantasäästöpankki will be transferred to Oma Savings Bank Ltd on 30 March 2014 and as a compensation the Hauho and Renko Savings Bank Foundations will receive a share of owner-ship in the joint Savings Bank Ltd. In March 2013, the Boards of Directors of Suodenniemi Savings Bank and Oma Savings Bank Ltd concluded a merger agreement. The trustees of Suodenniemi Savings Bank accepted the merger finally in December 2013. The Extraordinary General Meeting of Oma Savings Bank accepted the project finally in February 2014. The operations of Suodenniemi Savings Bank will be transferred to Oma Savings Bank Ltd on 30 May 2014 and as a compensation the Suo-denniemi Savings Bank Foundation will receive a share of ownership in the joint Savings Bank Ltd. In November 2013, the Boards of Directors of Etelä-Karjala Savings Bank and Oma Savings Bank Ltd concluded a merger agreement. The trustees of Etelä-Karjala Savings Bank accepted the merger in January 2014. The operations of Etelä-Karjala Savings Bank will be transferred to Oma Savings Bank Ltd towards the end of 2014 and as a compensation the Etelä-Karjala Sav-ings Bank Foundation will receive a share of ownership in the joint Savings Bank Ltd. In the

3
same connection, the aforementioned banks notified that they will not join the consortium of Savings Banks that is based on unlimited joint responsibility, but they will continue their opera-tions fully independent and as the biggest Savings Bank in Finland called Oma Savings Bank Ltd.
A partner of the Savings Banks, Aktia Bank announced in January the discontinuation of the Savings Banks’ central credit institution services at the beginning of 2015. The Savings Banks and Itella signed a letter of intent in March regarding a share transaction by which the Savings Banks purchased the whole share capital of Itella Bank. The transaction was completed in April. In June, Säästöpankkien Keskuspankki Suomi Oy – Sparbankernas Centralbank Finland Ab – Central Bank of Savings Banks Finland Ltd was registered as the bank’s official name.
Income
The operating profit of Oma Savings Bank Ltd was EUR 5,076,000 (EUR 4,000,000 in 2012). The operating profit grew by 26.9 per cent over last year. The operating profit percentage, based on the annual average of the balance, was 0.9 per cent (1.1). The positive development of the operating result was due to growing business volumes as well as moderate cost devel-opment, even if the merger created one-time cost effects. The bank’s cost/income ratio was 59.2 per cent (56.1). The bank’s key income statement items have developed as follows in comparison with the two previous years:
EUR thousand 01–12/2013 01–12/2012 Change % *) 01–12/2011 Change % **)
Net interest income 9,225 5,796 59.2 5,568 4.1
Net commission income 6,150 3,598 70.9 3,301 9.0
Net income from trading in securities and foreign currencies 27 13 … 19 -35.5
Net income from available-for-sale financial assets 1,036 691
655 5.6
Net income from hedge accounting -13 -10 29.9 12 …
Other income 906 241 … 249 -3.3
Total income 17,332 10,329 67.8 9,805 5.3
Personnel expenses -3,672 -2,444 50.2 -2,213 10.5
Other administrative expenses -4,053 -2,188 85.2 -2,018 8.5
Other expenses -2,543 -1,158 … -1,209 -4.2
Total expenses -10,267 -5,791 77.3 -5,440 6.4
Cost/income ratio 59.24 56.06
55.48
Impairment losses on loans -1,989 -539 … -675 -20.3
Operating profit 5,076 4,000 26.9 3,689 8.4
Profit for the period 3,462 1,855 86.6 2,009 -7.7
*) Change 2013–2012
**) Change 2012–2011

4
The bank’s net interest income was EUR 9,225,000 (5,796,000). The net interest income in-creased by 59.2 per cent over the previous financial period. The net interest income was strengthened by interest from hedging interest-rate derivatives whose amount in the net interest income was EUR 1,048,000 (560,000). The interest income amounted to EUR 14,004,000 (9,999,000), an increase of EUR 4,005,000 over last year. The interest expenses were EUR 4,778,000 (4,203,000). The interest expenses decreased by EUR 575,000 over the previous financial period. The net commission income was EUR 6,150,000 (3,598,000). Here the share of commission income was EUR 6,679,000 (3,900,000) and commission expenses EUR 529,000 (301,000). The commission income include commissions from supplied products in the amount of EUR 1,203,000 (726,000), out of which the commissions received for the supplied credits of the mortgage bank amounted to EUR 331,000 (255,000) and for the other supplied products EUR 872,000 (471,000). The commissions received from the supplied mortgage credits are included in the aforementioned figures in net terms. With regard to the other commission income, the most significant were the commissions for lending EUR 2,197,000 (1,425,000), the commis-sions for payment transactions EUR 2,632,000 (1,405,000) and the commissions for trust activi-ties and judicial tasks EUR 258,000 (145,000). The net income from available-for-sale financial assets was EUR 1,036,000 (691,000). Here the sales profits and losses were EUR 1,036,000 (691,000). The net income from hedge accounting was EUR –13,000 (–10,000). The item is formed by the difference of interest-rate derivatives hedging the fair value and the changes in the fair values of the items being hedged. The other income includes income from equity-based investments, net income from investment property and other operating profit in the amount of EUR 906,000 (241,000). The received divi-dends were EUR 152,000 (151,000), a decrease of EUR 1,000 over the previous year. The net income from investment property was EUR 141,000 (20,000). The other operating income in-creased to EUR 613,000 (69,000). The increase was impacted by the unusually big one-time items in view of the business operations allocated to the period. The personnel expenses were formed by salary expenses as well as pension and other indirect personnel expenses. These expenses amounted to EUR 3,672,000 (2,444,000), which was 50.21 per cent more than the year before. The other administrative expenses increased by 85.2 per cent to EUR 4,052,000 (2,188,000). The other expenses, EUR 2,543,000 (1,158,000), comprise depreciation and impairments of tangible and intangible assets as well as the other operational expenses. The amount of planned depreciation was EUR 496,000 (315,000). The other operating expenses increased to EUR 2,047,000 (846,000). The increase in the other operating expenses was caused by the temporary bank tax that took effect at the beginning of the year. The net amount of impairment losses recorded for loans and guarantees in the financial period income was EUR 1,989,000 (539,000), an increase of EUR 1,450,000 over last year. The gross amount of the impairment losses was EUR 2,008,000 (559,000). The impairment returns on receivables recorded previously as realised credit losses amounted to EUR 19,000 (20,000).

5
Balance sheet
In 2013, the bank’s balance sheet grew fast due to both organic growth and the merger, amounting to MEUR 744.7 (392.6) at the end of the year. The amount of credits on the balance sheet was MEUR 596.2. The amount of deposits was MEUR 556.2. Oma Savings Bank Ltd’s key balance sheet items have developed in comparison to the two previous years as follows:
EUR thousand 31 Dec
2013 31 Dec
2012 Change %
**) 31 Dec
2011 Change %
***)
Receivables from the public and general government 596,199 321,022 85.7 289,596 10.9
Loans 596,199 321,022 85.7 288,792 11.2
Other receivables 0 0 … 804 …
Investments 135,932 63,824 … 64,786 -1.5
Receivables from credit institutions 56,611 20,151 … 30,571 -34.1
Debt securities 28,755 12,345 … 8,107 52.3
Shares and interests 43,412 27,303 59.0 21,968 24.3
Properties 7,154 4,849 77.8 4,456 -2.8
Derivative contracts 3,987 1,930 … 1,660 16.3
Derivative contracts assets 4,015 1,930 … 1,660 16.3
Derivative contracts liabilities -28 0 … 0 …
Deposits by the public *) 556,267 313,755 77.3 293,769 6.8
Liabilities to credit institutions 43,918 22,188 97.9 18,651 19.0
Issued promissory notes 65,703 10,959 … 7,918 38.4
Promissory notes issued to the public *) 41,903 0 … 0 …
Subordinated liabilities 23,800 10,959 … 7,918 38.4
Equity 40,640 21,902 85.6 19,048 15.0
Appropriations 24,751 15,058 64.4 13,492 11.6
ROA % 0.7 0.9
0.9
ROE % 8.3 11.0
10.5
Equity ratio 7.9 8.4
8.0
Solvency ratio 18.04% 16.95%
15.98% *) The figure does not include the change in the fair value resulting from hedging.
**) Change 2013–2012
***) Change 2012–2011
Lending The total amount of lending by Oma Savings Bank Ltd at the end of the financial period was MEUR 711.5 (411.4). The lending includes the credits in the bank’s balance sheet MEUR 596.2 (321.0) as well as the mortgage credits of Aktia Real Estate Mortgage Bank supplied by the bank that are not included in the bank’s balance sheet. The amount of supplied mortgage cred-its was MEUR 115.3 (90.4) at the end of the year. Credit supplied by the bank from public funds are included in the bank’s balance sheet in the item Receivables from the public and general government. They amounted to MEUR 1.0 (0.8) at the end of the year. Including the supplied mortgage credits, credits were taken out and renewed in the amount of MEUR 184.0 during the year. The net increase in lending was 73.9 per cent.

6
The amount of unorganised receivables remained at a moderate level. The unorganised receivables were MEUR 5.8 (2.7) at the end of the year, which corresponds to 0.8 per cent (0.6) of the sum of total lending and guarantees included in commitments outside the balance sheet.
Commitments outside the balance sheet Commitments outside the balance sheet comprise commitments given to a third party on behalf of a client and irrevocable commitments given in favour of a client. The commitments given to a third party on behalf of a client, MEUR 15.8 (12.3), are mainly formed by bank and other guarantees. The other guarantees include the absolute guarantees issued by the bank on behalf of itself and other Savings Banks to Aktia Bank Plc regarding the payment transaction agreement between the banks and to Aktia Real Estate Mortgage Bank Plc regarding compensation for potential losses due to the supplied mortgage credits. The irrevocable commitments given in favour of a client that amounted to MEUR 36.0 (15.5) at the end of the financial period, are mainly formed by granted credit not drawn.
Investments The bank’s investments mainly focus on deposits in other credit institutions, debt securities, shares and interests as well as properties that are included in the balance sheet item Tangible assets. The tangible assets are specified in note 2.9. The bank’s deposits in other credit institutions were MEUR 56.6 (20.5). The amount was MEUR 36.5 greater than the year before. The investments in debt securities were formed by money-market securities and bonds. At the end of the financial period, their amount was MEUR 28.8 (12.3), which is MEUR 16.4 greater than the year before. The investments in shares and interests amounted to MEUR 43.4 (27.3) at the end of the peri-od. Of this, the share of shares and interests considered essential for operations was MEUR 11.2 (5.2) and the share of other shares and reserve units was MEUR 32.2 (22.0). The bank holds no quoted shares for active trading. The bank’s property assets on the balance sheet totalled MEUR 7.2 (4.0). Of this, the value of properties in the bank’s own use was MEUR 5.3 (3.3) and the value of investment property MEUR 1.9 (0.8). The fair values of investment property are presented in Note 2.8. During the financial period, MEUR 0.1 of reconstruction expenses allocated to the properties were activated on the balance sheet. In 2013, the bank sold its property community shares in the amount of MEUR 0.1 and purchased shares in the amount of MEUR 0.4. Selling the proper-ty assets accrued a net sales profit of EUR 38,000.
Derivative contracts The bank uses derivative contracts to hedge its interest rate risks. At the end of the financial period, the positive fair value of the derivatives on the assets side of the balance sheet, in the

7
balance item Derivative contracts, amounted to MEUR 4.0 (1.9), out of which the share of de-rivatives hedging the fair value was MEUR 4.0 (1.9). For hedging the fair value, the bank used a deposit portfolio with at-sight terms. The hedging instrument was formed by interest-rate swaps. On the liabilities side of the balance sheet, in the balance item Derivative contracts and other liabilities held for trading, the negative fair value of the derivatives amounted to EUR –28,000 (0). Hedge accounting is not applied to these derivatives held for trading in bookkeeping. The derivative contracts are specified in Note 2.5. In the solvency calculations, the derivatives are included in the solvency requirement of the credit and counterparty risk.
Deposits by the public The majority of the bank’s fund-raising comes from deposits by the public. The deposits amounted to MEUR 556.3 (313.8) at the end of the year. The deposits increased in the amount of MEUR 242.5, i.e. 77.3 per cent, during the year. The deposits in current accounts and savings accounts increased by MEUR 187.4, i.e. 69.3 per cent, during the year and they amounted to MEUR 457.8 (270.4) at the end of the year. The increase in investment and state-subsidised home purchase savings accounts was MEUR 55.1, and they amounted to MEUR 98.4 (43.3) at the end of the year.
Other liabilities The other liabilities are mainly formed by liabilities to credit institutions and issued promissory notes that include certificates of deposit, bonds and debentures that are subordinated liabilities. The liabilities to credit institutions were MEUR 43.9 (22.2). The item includes deposits made by other credit institutions to the bank as well as the bank’s other liabilities to other credit institu-tions that were MEUR 2.3 (2.2). The other liabilities include, among other things, repo sales that amounted to MEUR 2.3 (2.2) at the end of the year.
During the year, the bank issued certificates of deposit in the amount of MEUR 12.0 and bonds in the amount of MEUR 30.0. During the year, the bank issued together with three other banks a debenture loan where the bank’s share was MEUR 10.0. At the end of the financial period, the amount of issued promissory notes on the bank’s balance sheet totalled MEUR 65.7 (11.0), out of which MEUR 12.0 were certificates of deposit, MEUR 29.9 bonds and MEUR 23.8 debenture loans. The other liabilities were mainly formed by short-term payment intermediation items as well as transitory items of the financial statements’ phase related to the sectioning of income and ex-penses.
Equity and appropriations The bank’s equity was MEUR 40.6 (21.9) at the end of the financial period. This represents an increase of MEUR 18.7 over the last financial period. The amount of fair value reserve included in equity adjusted with deferred taxes was MEUR 2.3 (0.4). The amount was formed by the change in the fair value of the available-for-sale financial assets. The appropriations are the depreciation differences and voluntary provisions that totalled MEUR 24.8 (15.1) at the end of the period. Out of this, the credit loss provision was MEUR 24.7 (14.9).

8
In 2013, the credit loss provision was increased by MEUR 9.9 (increased MEUR 1.9), after which the provision amounted to 4.0 per cent of the receivables in the financial statements. The depreciation difference was decreased by MEUR –0.2.
Consolidated financial statements
Oma Savings Bank Ltd forms a group that comprises the parent bank and its subsidiaries real-estate corporation Töysän Säästökeskus, real-estate corporation Kuortaneen Säästötalo, real-estate corporation Tervalapikas, real-estate corporation Ilmajoen Säästöpankintalo, real-estate corporation Parkanon Säästötalo, Asuntokamari LKV Ltd and SP-Koti Ltd that have been left out of the consolidated financial statements, because they are small subsidiaries as referred to in Section 155(3) of the Act on Credit Institutions. The subsidiaries’ impact on the Group’s in-come and equity is minor.
Voluntary ja statutory reserves
Oma Savings Bank Ltd is a member of Säästöpankkien Vakuusrahasto. The purpose of this security reserve is to secure the stable operations of the Savings Banks. The reserve is free from debt. The reserve has not made any new support decisions during the year. The assets of the reserve total MEUR 23.7 (23.4). In the voluntary security reserve, the bank is not involved in any such joint liability arrangements that would make it liable for debts or commitments of an-other bank. In addition, the Savings Bank is part of the deposit insurance reserve that safeguards the de-positor’s receivables from the bank up to EUR 100,000. The bank’s contribution to the reserve was EUR 284,000. Oma Savings Bank Ltd is also part of the invertors’ compensation reserve that hedges all non-professional investors.
Solvency management
Oma Savings Bank Ltd has determined a solvency management process with the goal of secur-ing the bank’s risk-bearing capacity with regard to all essential risks in its operations. In order to meet this goal, the bank identifies and assesses the risks related to its operations extensively and dimensions its risk-bearing capacity to meet the bank’s total risks. In order to secure its solvency, the bank sets risk-based equity goals and prepares an equity plan in order to meet those goals. Another goal of the solvency management process is to maintain and develop high-quality risk management. The bank operates according to its strategy in retail banking. By only operating in this business area, the bank is able to manage its operations-related risks and keep them minor in view of the operations. Savings Bank’s solvency management is the responsibility of the bank’s Board of Directors that also defines the operations-related risk limits. The bank’s Board of Directors an-nually reviews the risks related to the bank’s solvency management, the equity plan and limits set for the risks. In its solvency management process, the bank prepares, among other things, income, growth and solvency forecasts. Based on the forecasts, the bank maps the actions to be taken to main-tain the solvency level in accordance with the business strategy. The bank applies in its solvency calculations a standard method for the calculation of the credit risk and a basic method for the operative risk. In the standard method, the liabilities are divided into liability groups, and minimum limits required for lending decentralisation are defined in the retail receivables group. Oma Savings Bank Ltd releases the key information for the solvency

9
calculations annually as part of its annual report and notes to the financial statements. The bi-annual interim financial report releases the key solvency information. Oma Savings Bank Ltd’s own assets totalled MEUR 81.9 (42.9), when the minimum require-ment for own assets was MEUR 36.3 (20.2). The amount of primary own assets was MEUR 56.5 (32.1). The secondary own assets amounted to MEUR 25.4 (10.8), out of which the share of the upper secondary own assets was MEUR 2.3 (0.4) and the share of the lower secondary own assets MEUR 23.8 (11.0). During the year, the bank’s solvency ratio increased by 1.10 percentage points to 18.04 per cent. The ratio of primary own assets to risk-weighted items was 12.44 per cent (12.69 per cent).
SOLVENCY CALCULATION
Own assets 2013 2012
Primary own assets before decreases 58,157 32,872
Decreases from primary own assets -1,697 -752
Total primary own assets 56,460 32,121
Secondary own assets before decreases 26,084 11,358
Upper secondary own assets 2,284 399
Lower secondary own assets 23,800 10,959
Decreases from secondary own assets -647 -594
Total secondary own assets 25,437 10,764
Total own assets 81,897 42,885
Total liabilities 795,052 419,750
Risk-weighted liabilities
Credit and counterparty risk 413,716 232,778
Items in the balance sheet 399,003 222,919
Commitments outside the balance sheet 13,670 9,397
Derivatives 1,043 461
Operative risk 30,221 16,437
Market risk 9,939 3,833
Currency risk 9,939 3,833
Total risk-weighted liabilities 453,877 253,047
Minimum requirement for own assets 36,310 20,244
Amount exceeding the minimum require-ment for own assets 45,587 22,641
Solvency ratio (%) 18.04% 16.95%
Ratio of primary own assets (%) 12.44% 12.69%

10
Oma Savings Bank Ltd’s solvency development was also impacted by, besides the income, the growth of the balance, the issue of the debenture loan and changes in the fair value reserve.
The European Union’s new Capital Requirements Regulation and Directive were issued on 27 June 2013. The new regulation takes effect on 1 January 2014 and it is based on the recom-mendations given in 2010 by the Basel Committee on Banking Supervision, i.e. the so-called Basel III framework. The new Capital Requirements Regulation is directly binding legislation for the member states and, along with it, a large part of the standards of the Financial Supervisory Authority’s standards regarding solvency calculation will be revoked. The European Banking Authority (EBA) issues standards that specify the regulation and that are binding in the same way as the regulation. The Basel III solvency reporting in accordance with the new regulation begins as per the status on 31 March 2014. Along with it, banks’ capital requirements become more stringent both via the terms set for capital instruments and additional capital buffers. New requirements are set for liquidity and a new indicator, leverage ratio requirement, will be introduced for monitoring gear-ing. The solvency of local banks is expected to meet the required minimum level of 8 per cent also in the future. In addition to the minimum solvency requirement, a fixed additional capital re-quirement of 2.5 per cent as well as a variable additional capital requirement that the authorities can set between 0 and 2.5 per cent as necessary will be introduced on 1 January 2015. In terms of the new liquidity requirements, monitoring will be implemented in 2014 but the re-quirements will only become binding at a later stage. The binding application of the liquidity coverage ratio (LCR) will begin at a level of 60 per cent on 1 January 2015, from where it will gradually increase to 100 per cent by 1 January 2018. The EU decides on the binding and con-tents of the net stable funding ratio (NSFR) and leverage ratio requirement after the monitoring period. Based on current information, they will only become binding in 2018, at the earliest.
Risk management
Risk management objective The objective of risk management is to ensure that the risks resulting from the bank’s operating activities are identified, assessed and dimensioned to an accepted level and that those risks are monitored and they are correctly proportionate to the bank’s risk-bearing capacity. The key sub-areas in risk management are credit risks, market risks including interest and price risks, finan-cial risks and property risks as well as strategic and operative risks. The bank monitors the de-pendencies between different risks with a risk map.
Principles and organisation Oma Savings Bank Ltd’s risk management strategy is based on the goal confirmed by the Board of Directors for the bank and the business strategy, risk management instructions, man-date system and the risk and deviation reporting produced for the key business sub-areas. The bank focuses its operating activities according to its strategy in the low-risk section of retail banking. The bank has no oversized client or investment risk concentrations with regard to its financial bearing capacity nor will it seek any in accordance with its strategy. The bank keeps its solvency at a safe level. The bank’s solvency and risk-bearing capacity are solidified with profitable operating activities. The bank observes the threat of loss formed by credit risks and other risks in its financial statements with sufficient depreciation and other loss-es.

11
The Board of Directors is regularly provided with information on the bank’s different risks and their levels. The Board of Directors also approves the mandate and framework for risk taking by defining the allowed risk limits for credit and market risks. Within that mandate, the responsibility for daily risk monitoring and supervision belongs to the operative management. The operative management utilises in its monitoring the reports produced by the systems in the different risk sub-areas. The systems and practices dedicated for risk reporting and monitoring meet the re-quirements set for risk management taking into consideration the nature and extent of the bank's operations.
Credit risks The goal of credit risk management is to limit the income and solvency impacts of risks resulting from client liabilities to an acceptable level. The business strategy confirmed by the Board of Directors and the lending instructions define the maximum amounts for risk concentrations and guide lending according to client sectors, fields of operation and creditworthiness classes. The bank’s key client groups include the operating area’s private clients, agriculture entrepre-neurs and small businesses. The majority of the bank’s fund-raising has been lent to the bank’s clients. The combined share of household and entrepreneur credits on the bank’s balance sheet is approx. 65.0 per cent (62.5 per cent). The share of rural entrepreneurs in the credits of the balance sheet is 7.4 per cent (7.5 per cent) and that of others 27.6 per cent (29.1 per cent). The majority of the bank’s credits, 71.2 per cent (71.5 per cent), have been granted against a hous-ing unit serving as guarantee. The management of corporate and agriculture credit risks is based on client monitoring carried out by the person in charge of the client and on the internal creditworthiness classification. The assessment of a private client’s creditworthiness is based on the local bank’s good client knowledge and an assessment done based on that knowledge on the client’s solvency. The bank’s Board of Directors makes the major credit decisions. The Board of Directors has delegated credit mandate onwards to the bank’s credit committee and other appointed employ-ees. Credit decisions are made in accordance with the lending instructions confirmed by the bank’s Board of Directors. The main rule is the principle of at least two decision makers. Credit decisions are based on the client’s creditworthiness and solvency as well as other lending crite-ria, such as meeting the guarantee requirements. The credits have been mainly granted with securing guarantees. Guarantees are cautiously valued to their fair value and their fair values are regularly monitored by utilising both statistics and good knowledge of the field. The bank’s Board of Directors has confirmed instructions for the bank on the valuing of different forms of guarantees and their guarantee values that can be used in lending. The credit risk is constantly assessed by monitoring, for example, delays in repayment and un-organised loans. The amounts of client-specific liabilities and guarantees are tracked by the person in charge of the client based on continuous payment behaviour and monitoring of the client’s activities. All client liabilities and unorganised credits of over MEUR 1.2 are reported to the Board of Directors regularly twice a year. The reporting covers, among other things, the amount and development of risks per client unities, fields and creditworthiness classes. The bank has no client unities, whose liabilities exceed the 25 per cent top limit of the bank’s own assets set by the Act on Credit Institutions. The risks included in the bank’s credit portfolio are, based on the reports made, at a low level in view of the bank’s annual income level and risk-bearing capacity.

12
Financial risk The financial risk is a risk related to the availability and price of refinancing that is created when the maturities of receivables and payables differ from each other. The financial risk is also cre-ated if the receivables and payables are too concentrated on individual counterparties. The fi-nancial risk is assessed according to the maturity classes with the extent of the difference be-tween the receivables and payables of each class. The financial risk is managed, for example, by keeping sufficient liquid assets in order to ensure liquidity. The financial risk is monitored by reporting to the Board of Directors on the bank’s financial and liquidity standing. Oma Savings Bank Ltd acquires the refinancing it needs as deposits within its own field of op-erations. According to the deposit account terms, a significant part of refinancing is subject to at-sight terms, dividing over 39,200 depositor clients. The bank’s goal is to extend the maturity of its refinancing and to maintain an extensive capital base. The bank invests no more than 110 per cent of its fund-raising in lending and keeps its liquidity good by investing liquid assets mainly in financial instruments that are marketable on the sec-ondary market and in short-term deposits in other financial institutions. Out of the credits on the bank’s balance sheet, 16.7 per cent (16.7 per cent) are credits whose period of credit is over 20 years. In 2013, the bank’s financial standing remained stable.
Interest rate risk The interest rate risk means the impact of interest level changes on the bank’s income and sol-vency. The interest rate risk is caused by differing interest basis of receivables and payables as well as non-simultaneous rollover or maturity dates. The bank’s Board of Directors has granted the operative management the mandate to use hedging derivatives. In order to minimise its in-terest rate risk, the bank uses hedging derivative contracts whose use has been reported in more detail under Derivative contracts. The bank’s interest-rate risk is reported regularly to the Board of Directors that has given the maximum amounts for the bank’s interest-rate risk in its confirmed instructions. The bank uses balance sheet analysis for measuring the interest rate risk that measures the impact of one and two percentage point changes of the forward interests over the interest mar-gin forecast for the next 1– 60 months. The forecast is calculated with the forward interests available on the market at the time of reporting for the next five years. The amount of the open interest rate risk is measured with interest rate sensitivity that observes the impact of the afore-mentioned interest rate shocks on net interest income in the upcoming years.
Derivative contracts The bank hedges its liabilities with interest against interest rate changes with interest rate deriv-atives and applies the regulations concerning hedge accounting to them in addition to regular monitoring of the effectiveness of the hedging. In addition, the bank has derivative contracts that it uses to hedge its interest-rate risk operatively, but does not apply hedge accounting to them, so in bookkeeping they are processed as derivatives held for trading. The derivatives are speci-fied in note 2.5. The bank monitors on a monthly basis the risks related to the derivatives, such as changes in the fair value of the derivatives in comparison with interest rate curve changes as well as changes in the bank’s balance sheet standing and in the net interest income sensitivity to interest changes.
Market risk The market risk means the impact of changes in the interest rates and market prices on the bank’s income and own assets. In trading, an interest rate change causes the realisation of a
13
market risk as a change in the market value of securities. The share risk means, among other things, the income impact caused by the changing rates of publicly listed shares and fund units. In securities investment, the bank’s goal is to gain a competitive return on the invested capital in terms of the income–risk ratio. The bank invests in securities only so that the income impact of changing rates does not jeop-ardise the bank’s solvency or profitability. At the balance sheet date, the bank’s income included unrealised changes in value recorded from securities in the net amount of EUR 12,000 (2,000). In addition, unrealised changes in value are included in the fair value reserve, in the amount of MEUR 2.3 (0.4), formed by change in the value of the available-for-sale financial assets. The impact caused by the unrealised changes in value of the securities to the bank’s own assets was EUR 2,296,000 (401,000), which is 2.8 per cent (0.9 per cent) of the bank’s own assets at the end of the financial period. The bank has no securities-related minimum solvency require-ment caused by the settlement risk of the entire operation. The decentralisation of investments is used to reduce the centralisation risk caused by individu-al investments. The bank has no investment unities, where the amount of investments and re-ceivables would exceed the 25 per cent top limit of the bank’s own assets set by the Act on Credit Institutions. The bank monitors the market values of securities acquired in investment purposes and cash flows related to their transactions. The contents and balance sheet standing of the securities portfolio is regularly reported to the Board of Directors. The market risk included in the securities portfolio is assessed in relation to the bank’s income and own assets.
Property risk The property risk means value reduction, income and damage risk facing property assets. Property investment is not part of the bank’s core business. The bank’s property assets are mainly insured with full value insurance. The bank’s investment property assets have been assessed and evaluated in the financial statements by primarily using the purchase price method. The value of the property assets is minor in comparison to the bank’s balance sheet and the bank’s own capital, and the value of the property assets does not, at the moment, face any val-ue reduction needs that would have an essential impact on the bank’s income and solvency in the coming years. The carrying amounts and fair values of the investment property are present-ed in note 2.8 (excluding activations recorded to intangible assets). The capital tied up in properties and property company shares that are used by the bank itself was, at the balance sheet date, MEUR 6.0 (4.7). Capital tied in investment property amounted to MEUR 2.4 (1.8), which is 0.3 per cent out of the bank’s balance sheet total.
Strategic and operative risks The strategic risk means losses generated by a poorly selected business strategy in view of the development of the bank’s operating environment.
The aim is to minimise the strategic risks by regularly updating the strategic and annual plans. The planning makes use of analyses and forecasts of the development of the industry, competi-tion situation and financial operating environment. The operative risks mean losses that can be caused by internal inadequacies in systems, pro-cesses and operations of the personnel or by external factors affecting the operating activities.

14
The realisation of operative risks is minimised by the continuous development of the personnel and comprehensive operating procedures as well as internal monitoring measures, such as separating the preparation of matters, decision-making, implementation and monitoring from each other where possible. The bank is prepared with a special insurance against the potential operative risks in banking and the resulting damage. The realisation of judicial risks is, in part, reduced by the widely ap-plied standard contractual provisions. Continuity planning is used for preparing for risks caused by IT system malfunctions. The operative risks are monitored by collecting data on the financial losses and possible abuse suffered by the bank. The observations on the bank’s operative risks are reported to the Board of Directors at least twice a year. The operative management makes use of the reports on the observance of instructions generated by internal monitoring as well as the data on the changes in the operating environment.
Internal audit The Board of Directors has set an internal audit for the bank and confirmed an audit plan and reporting principles for the internal audit. The purpose of the internal audit is to assess the extent and sufficiency of the internal monitor-ing of the bank’s operative organisation as well as to monitor and assess the functionality of the risk management systems. The internal audit reports its observations to the Chief Executive Officer. The bank’s Board of Directors reviews the audit summaries prepared by the internal audit.
Internal monitoring The purpose of the bank’s internal monitoring is to ensure that the objectives and goals set on different levels at the bank are met in accordance with the instructions agreed and set by the internal monitoring. Internal monitoring is self-observation from within the bank carried out by the administrative bodies and the organisation, and it mainly focusses on the state, quality and results of operations. Internal monitoring is conducted by the Supervisory Board, Board of Di-rectors, Chief Executive Officer, supervisors and employees. In addition, the employees are obligated to report deviations and illegal activities to the upper organisation.
Administration and personnel
The Annual General Meeting of the Savings Bank Ltd was held on 10 April 2013. The Annual General Meeting reviewed the financial statements of 2012. The proposal of the Board of Direc-tors on the profit distribution was accepted. EUR 150,000 of the financial period income was paid as dividend. In addition, the Annual General Meeting granted exemption from liability for the Board members and the Chief Executive Officer. Oma Savings Bank Ltd’s Board of Directors comprises six members. Jyrki Mäkynen has served as the Chair, Tuula Mäkelä as the Deputy Chair and Pasi Sydänlammi as the Chief Executive Officer. Yrjö Koskimäki has served as the Deputy Chief Executive Officer. The Board of Direc-tors assembled 12 times during the year.

15
The ordinary members of the Board of Directors until 30 April 2013: Chair Jyrki Mäkynen Deputy Chair Tuula Mäkelä Member Juhana Saari Member Markku Toivonen Member Ari Yli-Kaatila Member Jarmo Ylä-Vannesluoma The ordinary members of the Board of Directors since 1 May 2013: Chair Jyrki Mäkynen Deputy Chair Kai Tammela Member Riitta Koivunen Member Tuula Mäkelä Member Ari Yli-Kaatila Member Jarmo Ylä-Vannesluoma The Bank employed 82 people at the end of the year. The number of personnel increased in connection with the merger that took place in the spring. Great investments were also made in the development of the personnel’s competence in 2013. The bank’s auditor has been APA Tatu Huhtala. The bank has outsourced the internal audit. Audit Partners Ltd has served as the internal auditor.
Bank’s administrative and guidance system The Annual General Meeting of the joint-stock Savings Bank processes the financial statements of the previous year, profit distribution, granting exemption from liability and selecting the Board members. The decisions on the bank’s operating activities and strategic matters are taken by the bank’s Board of Directors. In addition, the Board of Directors makes decisions on major mat-ters regarding the bank’s operating activities and selects the bank’s Chief Executive Officer. The work of the Board of Directors is based on confirmed procedures. The bank’s Chief Executive Officer takes care of the everyday administration of the bank in accordance with the instruction provided by the Board of Directors. Settlement of the independence of the Board members and the Chief Executive Officer is car-ried out in accordance with the regulations provided by the Financial Supervisory Authority and its predecessor the Financial Supervision. The Board members and the Chief Executive Officer must provide a report on the communities they are involved in at the time of the appointment and from then on annually. In addition, the Board members and the Chief Executive Officer must provide an aptitude and reliability report in accordance with the regulation of the Financial Supervision when accepting the appointment.
Reward systems The terms and benefits of the Chief Executive Officer’s employment are approved by the Board of Directors of the bank. The members of the Board are paid a meeting-specific fee and an an-nual fee. The Chair is paid, in addition to the meeting fee, a monthly fee. The bank has a reward system in place. The goal of the reward system is to reward the performance of the personnel when meeting the goals of the bank’s strategy.

16
Central outsourced operations The bank’s central information systems have been outsourced to Samlink Ltd, where the share majority is held by the Savings Banks. The bank’s books and records are managed by Paikallispankkien PP-Laskenta Ltd, which is fully owned by Samlink. In payment intermediation, the bank uses ACH Finland Ltd’s payment intermediation and clearing services and, in cash management, the cash management system of Automatia Pankkiautomaatit Ltd.
Corporate social responsibility
Oma Savings Bank Ltd’s corporate social responsibility means the bank’s responsibility for the impacts of its business operations on the surrounding society and the company’s interest groups. As a local bank, Oma Savings Bank Ltd deems it necessary for the bank to carry re-sponsibility for the surrounding society. Oma Savings Bank Ltd makes sure that the employer obligations are observed. In 2013, EUR 1,235,000 of corporate tax was paid on the bank’s in-come.
Events occurring after the balance sheet date
Oma Savings Bank Ltd’s Extraordinary General Meeting on 5 February 2014 decided in ac-cordance with the proposal of the Board of Directors to pay dividend in the amount of EUR 252,000. The exceptionally timed dividend decision was due to the merger with Kantasäästöpankki Ltd on 30 March 2014. The bank’s Board of Directors has no knowledge of factors that would essentially impact the bank’s financial position after the completion of the financial statements.
Development of business operations in 2014
The mergers that were announced in autumn and late 2013 will be completed during the finan-cial period. The mergers have a major impact on the bank’s business operations and volumes. The merger of Kantasäästöpankki Ltd will take place at the end of March, the transfer of the business operations of Suodenniemi Savings Banks at the end of May and Etelä-Karjala Sav-ings Bank is likely to merge with Oma Savings Bank at the end of November. Oma Savings Bank Ltd will separate from the Savings Banks Association that will become a central communi-ty of the consortium of Savings Banks. The bank’s business operations are expected to develop favourably in 2014. The bank’s com-parable income development is expected to remain at the level of 2013, if there are no changes in the interest level. If the interest level will increase slightly, it will have a positive impact on the bank’s income. However, a strong increase in the interest level can cause an increase in im-pairment losses. If the competition situation will remain tight, the margins that the bank receives may decrease, having a negative impact on the bank’s income.

17
Proposal of the Board of Directors on the use of assets eligible for profit distribution
Oma Savings Bank Ltd’s assets eligible for profit distribution are EUR 28,356,532.56, out of which the profit of the financial period is EUR 3,461,725.67. The Board of Directors proposes to the Annual General Meeting that no divided be paid and the financial period profit of EUR 3,461,725.67 be transferred to the profit account of previous fi-nancial periods.

18
Calculation formulae of the key figures
Cost/income ratio, % Administrative expenses + depreciation and impairment losses on tangible and intangible assets + other operating expenses x 100 Net interest income + income from equity-based investments + net commission income + net income from trading in securities and foreign currencies + net income from available-for-sale financial assets + net income from hedge accounting + net income from investment property + other operating income + share of the income of the associates
Return on equity (ROE) Operating profit or loss – Taxes on income * 100 Equity and minority interest + appropriations less deferred tax liabilities (average of the year beginning and end)
Return on assets (ROA)
Operating profit or loss – Income taxes * 100 Balance sheet total (average of the year beginning and end)
Equity ratio
Equity and minority interest + Appropriations less deferred tax liabilities * 100 Balance sheet total
Solvency ratio Total own assets……………………………………………* 8% Total minimum requirement of own assets
Ratio of primary own assets to risk-weighted items Total primary own assets * 8% Total minimum requirement of own assets

19
Financial statements
Income statement of Oma Savings Bank Ltd
1 Jan–31 Dec
2013 1 Jan–31 Dec 2012
EUR EUR
Interest income (1.1) 14,003,605.12 9,999,023.23 Interest expenses (1.1) -4,778,146.91 -4,202,917.77
NET INTEREST INCOME 9,225,458.21 5,796,105.46 Income from equity-based investments (1.2) 152,273.40 151,483.32 Fee and commission income (1.3) 6,678,930.05 3,900,365.83 Fee and commission expenses (1.3) -528,686.07 -301,942.46 Net income from trading in securities and foreign cur-rencies
(1.4)
27,112.93 12,549.95 Net income from available-for-sale financial assets (1.5) 1,036,402.25 691,194.91 Net income from hedge accounting (1.6) -13,051.19 -10,044.21 Net income from investment property (1.7) 140,664.71 19,725.53 Other operating profit (1.8) 612,887.69 69,344.89 Administrative expenses -7,724,074.93 -4,632,572.68
Personnel expenses (1.9) -3,671,536.34 -2,444,332.65 Other administrative expenses (1.10) -4,052,538.59 -2,188,240.03
Depreciation and impairment losses on tangible and intangible assets
(1.11)
-496,207.68 -314,824.60 Other operating expenses (1.8) -2,046,864.32 -843,211.91 Impairment losses on credits and other receivables (1.12) -1,988,940.02 -538,553.16
OPERATING PROFIT 5,075,905.03 3,999,620.87 Appropriations -379,347.53 -1,565,817.67 Income taxes -1,234,831.83 -578,961.33
PROFIT (LOSS) OF ACTUAL OPERATIONS AFTER TAXES
3,461,725.67 1,854,841.87
PROFIT (LOSS) OF THE FINANCIAL PERIOD 3,461,725.67 1,854,841.87
Balance sheet of Oma Savings Bank Ltd
ASSETS 31 Dec 2013 31 Dec 2012
EUR EUR Cash and cash equivalents 3,631,078.54 2,338,293.82 Debt securities eligible for refinancing with central banks 5,957,212.78 2,534,048.44

20
Receivables from credit institutions (2.1) 56,611,138.01 20,151,450.55 Receivables from the public and public institutions (2.2) 596,199,336.50 321,021,610.82 Debt securities (2.3) 22,797,519.28 9,811,175.25
From others 22,797,519.28 9,811,175.25
Shares and interests (2.4) 43,412,082.60 27,302,633.26 Derivative contracts (2.5) 4,015,351.26 1,929,637.16 Intangible assets (2.7) 799,351.24 8,072.56 Tangible assets 8,005,392.15 5,576,806.85
Investment property, investment property shares and interests (2.8) 1,874,321.12 803,476.84
Other property and property community shares and interests (2.8) 5,279,406.72 4,045,378.30
Other tangible assets 851,664.31 727,951.71
Other assets (2.10) 92,746.09 33,307.67 Accrued income and prepayments (2.11) 2,953,153.52 1,656,054.30 Deferred tax assets (2.18) 200,949.27 266,697.11
TOTAL ASSETS 744,675,311.24 392,629,787.79

21
LIABILITIES 31 Dec 2013 31 Dec 2012
EUR EUR
LIABILITIES Liabilities to credit institutions (2.12) 43,917,879.88 22,187,737.01 Liabilities to the public and public institutions (2.13) 561,193,811.33 316,484,606.01
Deposits 560,261,259.33 315,684,144.26 Other liabilities 932,552.00 800,461.75
Promissory notes issued to the public (2.14) 41,903,392.41 0.00 Derivative contracts and other liabilities held for trading (2.5) -28,041.00 0.00 Other liabilities (2.15) 4,834,009.71 4,263,023.62 Accrued liabilities and prepayments received (2.16) 2,891,239.26 1,379,012.13 Subordinated liabilities (2.17) 23,800,000.00 10,958,800.00 Deferred tax liabilities (2.18) 771,933.82 396,164.71
TOTAL LIABILITIES 679,284,225.41 355,669,343.48 APPROPRIATIONS Depreciation difference 3,990.34 206,750.72 Voluntary provisions 24,746,624.77 14,851,561.54
TOTAL APPROPRIATIONS 24,750,615.11 15,058,312.26 EQUITY (2.22) Share capital 10,000,000.00 6,500,000.00 Other restricted reserves 2,283,938.16 398,971.57
Fair value reserve 2,283,938.16 398,971.57
Non-restricted reserves 19,567,889.55 9,526,243.14 Reserve for invested non-restricted equity 19,567,889.55 9,526,243.14
Retained profit (loss) 5,326,917.34 3,622,075.47 Profit (loss) for the financial period 3,461,725.67 1,854,841.87
TOTAL EQUITY 40,640,470.72 21,902,132.05
TOTAL LIABILITIES 744,675,311.24 392,629,787.79
COMMITMENTS OUTSIDE THE BALANCE SHEET
31 Dec 2013 31 Dec 2012
EUR EUR Commitments given to a third party on behalf of a client 15,821,883.40 12,319,309.77
Guarantees and pledges 15,522,674.00 9,643,151.48 Others 299,209.40 2,676,158.29
Irrevocable commitments given in favour of a client 35,945,964.31 15,542,040.14
Others 35,945,964.31 15,542,040.14

22
Financial statement of Oma Savings Bank Ltd
1 Jan–31 Dec 2013 1 Jan–31 Dec 2012
EUR EUR Cash flow from operations Profit of actual operations after taxes 3,461,725.67 1,854,841.87 Rectifications for the financial period 4,154,741.10 2,509,251.25 Increase (–) or decrease (+) of operating assets -61,163,357.86 -41,584,212.73
Debt securities -3,838,490.81 -3,959,754.01 Receivables from credit institutions -2,631,852.00 -2,992,703.00 Receivables from the public and public institutions -54,378,514.46 -31,425,675.67 Shares and interests -630,863.06 -3,546,356.26 Other assets 316,362.47 340,276.21
Increase (+) or decrease (–) of operating liabilities 76,235,836.37 23,304,182.83
Liabilities to credit institutions 14,256,828.00 3,536,391.18 Liabilities to the public and public institutions 21,921,950.20 19,704,017.16 Promissory notes issued to the public 41,903,392.41 0.00 Other liabilities -1,846,334.24 63,774.49
Paid income taxes -496,541.58 -463,035.57 Total operating cash flow 22,192,403.70 -14,378,972.35 Cash flow from investments
Investments in shares and interests, increases -2,231,495.13 -543,658.68 Investments in tangible and intangible assets -639,616.50 -3,558,701.20 Assignments of tangible and intangible assets 188,894.22 3,021,564.32
Total cash flow from investments -2,682,217.41 -1,080,795.56
Financing cash flow
Subordinated liabilities, increases 4,941,200.00 5,000,000.00 Subordinated liabilities, decreases 0.00 -1,958,800.00 Paid dividends and other distribution of profit -150,000.00 -150,000.00 Other money increases of equity items 0.00 0.00 Other money decreases of equity items 0.00 0.00
Total financing cash flow 4,791,200.00 2,891,200.00
Net change of cash and cash equivalents 24,301,386.29 -12,568,567.91
Financial assets at the beginning of the financial period 9,683,921.37 22,252,489.28 Financial assets at the end of the financial period 38,009,892.55 9,683,921.37
– Financial assets transferred at the assignment of business operations -4,024,584.89 Financial assets at the end of the financial period without the financial assets transferred at the assignment of business operations 33,985,307.66 9,683,921.37
Financial assets are composed of the following balance sheet items: Cash and cash equivalents 3,631,078.54 2,338,293.82 Receivables from credit institutions paid on demand 34,378,814.01 7,345,627.55 Total 38,009,892.55 9,683,921.37 Additional information on the financial statement: Received interest 12,790,882.40 10,401,910.28 Paid interest 4,256,460.90 4,315,655.38 Received dividends 152,273.40 151,483.32 Rectifications for the financial period: Appropriations 379,347.53 1,565,817.67 Income statement taxes 1,234,831.83 578,961.33 Changes in fair value -37,284.04 10,044.21 Depreciation and impairment losses on tangible and intangible assets 530,406.20 344,334.74 Other rectifications 2,047,439.58 10,093.30 Total 4,154,741.10 2,509,251.25

23
Notes
Accounting principles The financial statements of the bank are made in accordance with the regulations of the Ac-counting Act and the Act on Credit Institutions, the Ministry of Finance Decree (150/2007) on Financial Statements and Consolidated Financial Statements of Credit Institutions as well as the Regulations and Guidelines 1/2013 of the Financial Supervisory Authority on Financial Sector Bookkeeping, Financial Statements and Annual Report. Consolidated financial statements The subsidiaries of the bank are real estate companies and the bank does not have any associ-ates or joint ventures. According to Section 155 of the Act on Credit Institutions, subsidiaries, associates and joint ventures whose balance sheet total is less than 1 per cent of the parent bank’s balance sheet total and less than MEUR 10 can be excluded from the consolidated fi-nancial statements. The subsidiaries do not have a significant impact on the Group's income and balance sheet and, therefore, the financial statements of the bank provide a correct and adequate picture of the operative income and financial standing of the Group. Foreign currency entries Assets and liabilities bound to foreign currencies outside the EU are converted to euros in ac-cordance with the average rate quoted by the European Central Bank on the day of closing the accounts. The differences in currency rates emerging from valuation are entered in the income statement under net income on trading in foreign currencies. Financial instruments
Classification The financial assets are classified in the financial statements in accordance with the Regula-tions and Guidelines 1/2013 of the Financial Supervisory Authority on Financial Sector Bookkeeping, Financial Statements and Annual Report to four valuation classes: - Financial assets entered to fair value with impact on the income - Available-for-sale financial assets - Held-to-maturity investments - Loans and other receivables
The financial assets recorded at fair value through profit and loss consist of compound instru-ments which contain an embedded derivative that has not been separated from the main con-tract and other financial assets recorded at fair value through profit and loss In addition, deriva-tives which have been made for the purpose of hedging but to which hedge accounting is not applied have been classified in this class.

24
Investments held until the maturity date include debt securities with fixed or definable payments that mature on a set date and which the bank is determined and capable to keep until the ma-turity date. The class of loans and receivables contains receivables with fixed or definable payments that are not quoted on the market. The available-for-sale financial assets contain financial assets that have not been classified in the aforementioned valuation classes. The acquisition and sales of financial assets have been entered in the books and records by the trade date and they are included in the balance sheet items Debt securities and Shares and interests. Financial liabilities are divided into two valuation classes: - Financial liabilities held for trading - Other financial liabilities. Derivative contracts to which hedge accounting is not applied and the fair value of which is neg-ative are classified in financial liabilities held for trading. Valuation Financial assets are carried either at fair value or amortised cost. With the exception of deriva-tive contracts, financial liabilities are carried at amortised cost. Changes in the fair value of financial assets recorded at fair value through profit and loss are entered directly in the financial statement item Net income on trading in securities. Available-for-sale financial assets are appraised to their fair value. Changes in their fair value are adjusted by deferred taxes and recorded in the fair value reserve under equity. Foreign ex-change gains and losses are not entered in the fair value reserve but directly to income. The change of value accrued in the fair value reserve is entered under income when an asset be-longing to available-for-sale financial assets is sold or otherwise derecognised. The year's final bid price has been considered to be the fair value of quoted shares. The fair value of unquoted shares has been their acquisition cost when their fair value cannot have been determined reliably. The fair value of debt securities is the year's last bid price if the debt securi-ty has a quotation or, when there is no quotation, the present value of the debt security dis-counted by the market interest rate of the capital or interest flow, or a value calculated by using some other generally approved valuation model or method. If there has been objective proof of the depreciation, held-to-maturity investments as well as loans and receivables are valued at the amortised cost or acquisition cost deducted by the im-pairment loss. The shares and interest in subsidiaries and associates are recorded under the acquisition cost or acquisition cost deducted by the impairment loss in the event that the impairment is consid-ered significant or long-term. Derivative contracts and hedge accounting Derivative contracts in the financial statements are appraised at their fair value, and changes in the value are entered in the balance sheet and income statement.

25
The bank hedges its interest risk from changes in the fair value and applies fair value hedging to it. The hedging is applied to fixed-rate deposits. The change in the fair value of derivatives that are used for hedging the fair value is recorded in the income statement under Net income from hedge accounting. When hedging the fair value, the subject of hedging is also appraised to the fair value for the hedging period, even if it is otherwise appraised at the amortised cost. The change in the fair value of the subject of hedging is recorded in the balance sheet as an adjust-ment of the item in question and in the income statement under Net income from hedge ac-counting. The interests of the hedging derivatives are given as adjustment of interest expenses. The bank also uses derivatives to operatively hedge its interest-rate risk but does not apply hedge accounting to it. In accounting, these derivatives are treated as derivatives held for trad-ing, and the change in their fair value is entered directly to the income statement item Net in-come on trading in securities. Interests are recorded in interest income. Tangible and intangible assets Properties and shares in property communities are divided on the basis of their purpose of use into property in own use and investment property. Properties are entered in the balance sheet with the acquisition cost deducted by planned de-preciation. The shares and interests in property communities are entered in the balance sheet at the acquisition cost. The bank does not apply the possibility to evaluate the investment prop-erty to fair value under Section 153 of the Act on Credit Institutions. The balance values of properties as well as shares and interests in property communities in own use are based on the value of the assets in relation to the income expectations of the actu-al operations. The difference between the carrying amount of the investment property and shares of property communities and the permanently lower probable assignment price is, in case it is significant, entered in impairment loss as an expense under Net income from investment property. Potential cancellations of impairment are entered as adjustments of the same item. The bank's key investment property items are valued using the purchase price method for each property. Appropriations
Depreciation difference and voluntary provisions Depreciation difference entries contain the difference between planned and realised deprecia-tions. The bank uses voluntary provisions, such as credit loss provisions, when planning taxation and the financial statements. Therefore, the amount or change of voluntary provisions does not characterise the risks of the bank. In the bank's financial statements, the appropriations are presented without deducting the relat-ed tax liability. Commitments outside the balance sheet Commitments outside the balance sheet comprise commitments given to a third party on behalf of a client and irrevocable commitments given in favour of a client.

26
Commitments given to a third party on behalf of a client include, for example, guarantees or similar guarantee commitments. The commitments are presented in the amount that the guar-antee or guarantee commitment corresponds to at the moment of closing the accounts. Irrevocable commitments given in favour of a client include, for example, binding credit com-mitments, granted loans not drawn yet and unused credit limits. The commitments are present-ed in the maximum amount that may result in payments at the moment of closing the accounts. Interest income and expenses
Interest income and expenses contain entries of all income and expenses resulting from inter-est-bound assets and liabilities. Interests are entered on an accrual basis except for penalty interests, which are entered after receiving the payment. Interests are deferred by using the method of effective interests. Interest income and expenses also contain the difference between the acquisition price and nominal value of receivables and payables, which is deferred to the exercise period of the re-ceivables or payables by using the method of effective interests. A counter item is entered as a change in the receivables or payables. Interest income is also accrued in the bookings of receivables with decreased value to the re-maining value using the original effective interest rate of the contract. Impairment losses of financial assets Loans and other receivables Impairment losses contain impairment of loans and other receivables when there is objective proof that the capital or interests of the loan or receivable will not be paid and when the guaran-tee of the receivable does not suffice to cover the amount. Estimation of the objective proof is based on estimating the insolvency of the client and sufficiency of the guarantee. When impair-ments are entered, the guarantee is evaluated to the amount that is expected to be gained at the moment of realisation. The amount of impairment losses is defined as the difference be-tween the carrying amount of the receivable and the estimated current value of the incoming cash flow accruable from the receivable by taking into account the fair value of the guarantee. The original effective interest rate of the receivable has been used as the discount rate. Held-to-maturity investments In the event that, on closing the accounts, objective proof has been shown that the value of a debt security classified in held-to-maturity investments may have declined, the debt security must undergo an impairment analysis. If the analysis shows an impairment, for example that the credit risk of the issuer has increased, the impairment is recorded through profit and loss to the item Impairment losses of other finan-cial assets. The amount of the impairment loss is defined as the difference between the carrying amount of the receivable and the estimated current value of the accruable future cash flows. The original effective interest rate of the receivable has been used as the discount rate. Available-for-sale financial assets In the event that, at the closing of accounts, objective proof indicates that the value of securities classified as available-for-sale financial assets may have declined, the securities must undergo an impairment analysis. If the analysis shows impairment – e.g. the credit risk of the issuer has increased or the value of the share has decreased significantly or below the acquisition cost for a long time and the bank estimates that it cannot return the investment – the loss accrued in the

27
fair value reserve is entered with impact on the income under Net income from available-for-sale financial assets. As comes to debt securities, the amount of impairment loss is defined as the difference between the carrying amount of the receivable and the estimated current value of the incoming cash flow accruable from the receivable. The original effective interest rate of the receivable has been used as the discount rate. The cancellation of the impairment losses of debt securities are en-tered with impact on the income. The amount of the impairment losses of shares and interest is estimated as the difference between their carrying amount and the value that the bank esti-mates not to receive. The impairment losses of shares or interests cannot be cancelled with impact on the income but the change in the value is entered in the fair value reserve. Depreciation principles The acquisition cost of buildings and other tangible and intangible assets is depreciated on the basis of the economic holding period, in accordance with the depreciation plan as straight-line depreciation. Depreciation periods range from 10 to 40 years for buildings and structures, and 5 to 8 years for machinery and equipment. Land areas are not subject to depreciation. The development expenses and licences of software programs are activated in Immaterial Rights and depreciated in 3 to 5 years. Long-term expenses are depreciated over their useful lives, which is 5 to 10 years. Income and expenses other than those from ordinary activities and statutory provisions The bank and the Group have not recorded any statutory provisions or income and expenses other than those from ordinary activities. Taxes Income taxes are entered in the bank's financial statements on the basis of taxable income. A positive change in the value included in the fair value reserve is recorded in the balance sheet as a deferred tax liability, and a negative change as a deferred tax asset, respectively. In addi-tion, the negative change in value transferred from the fair value reserve to income is recorded as a deferred tax asset. Other deferred taxes have not been recorded.
Financial assets The financial assets of the financial statements comprise cash and cash equivalents and re-ceivables from credit institutions paid on demand. The financial statements have been prepared using the indirect method.
28
Other notes
NOTES 00000000000000 00000000000000 00000000000000 00000000000000
NOTES ON THE FINANCIAL STATEMENTS
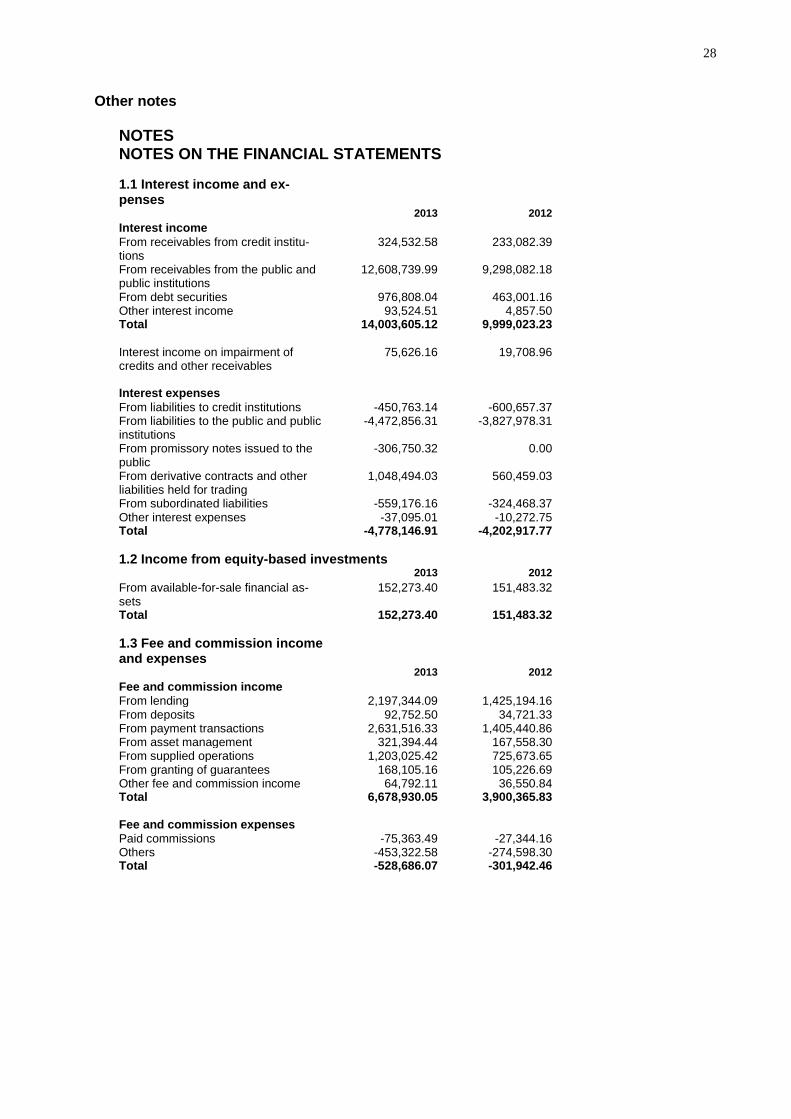
1.1 Interest income and ex-penses
2013 2012
Interest income From receivables from credit institu-tions
324,532.58 233,082.39
From receivables from the public and public institutions
12,608,739.99 9,298,082.18
From debt securities 976,808.04 463,001.16 Other interest income 93,524.51 4,857.50 Total 14,003,605.12 9,999,023.23
Interest income on impairment of credits and other receivables
75,626.16 19,708.96
Interest expenses From liabilities to credit institutions -450,763.14 -600,657.37 From liabilities to the public and public institutions
-4,472,856.31 -3,827,978.31
From promissory notes issued to the public
-306,750.32 0.00
From derivative contracts and other liabilities held for trading
1,048,494.03 560,459.03
From subordinated liabilities -559,176.16 -324,468.37 Other interest expenses -37,095.01 -10,272.75 Total -4,778,146.91 -4,202,917.77
1.2 Income from equity-based investments
2013 2012
From available-for-sale financial as-sets
152,273.40 151,483.32
Total 152,273.40 151,483.32
1.3 Fee and commission income and expenses
2013 2012
Fee and commission income From lending 2,197,344.09 1,425,194.16 From deposits 92,752.50 34,721.33 From payment transactions 2,631,516.33 1,405,440.86 From asset management 321,394.44 167,558.30 From supplied operations 1,203,025.42 725,673.65 From granting of guarantees 168,105.16 105,226.69 Other fee and commission income 64,792.11 36,550.84 Total 6,678,930.05 3,900,365.83
Fee and commission expenses Paid commissions -75,363.49 -27,344.16 Others -453,322.58 -274,598.30 Total -528,686.07 -301,942.46

29
1.4 Net income on trading in securities and foreign currencies
2013
Sales profits and losses (net)
Changes in fair value (net) Total
From debt securities 1,688.00 -41,588.00 -39,900.00
From others 0.00 67,012.93 67,012.93
Total net income on trading in securities
1,688.00 25,424.93 27,112.93
Net income on trading in foreign currencies
0.00 0.00 0.00
Income statement item total
1,688.00 25,424.93 27,112.93
Net income from trading in securities and foreign currencies
2012
Sales profits and losses (net)
Changes in fair value (net) Total
From debt securities 0.00 12,550.00 12,550.00
Total net income on trading in securities
0.00 12,550.00 12,550.00
Net income on trading in foreign currencies
-0.05 0.00 -0.05
Income statement item total
-0.05 12,550.00 12,549.95
1.5 Net income on available-for-sale financial assets
2013
Sales profits and losses (net)
Impairments Transfers from the fair value reserve
Total
From debt securities 18,183.00 0.00 -49,980.03 -31,797.03 From shares and interests
61,794.71 0.00 1,006,404.57 1,068,199.28
Total 79,977.71 0.00 956,424.54 1,036,402.25
Net income on available-for-sale financial assets
2012
Sales profits and losses (net)
Impairments Transfers from the fair value reserve
Total
From debt securities 0.00 0.00 0.00 0.00 From shares and interests
40,883.57 0.00 650,311.34 691,194.91
Total 40,883.57 0.00 650,311.34 691,194.91
1.6 Net income from hedge accounting
2013 2012
Change (net) in the fair value of hedging derivatives
-1,812,840.34 326,229.99
Change (net) in the fair value of hedged items
1,799,789.15 -336,274.20
Total -13,051.19 -10,044.21
1.7 Net income from investment proper-ty
2013 2012
Rental income 238,423.10 146,943.47 Rental expenses -360.00 0.00 Planned depreciation -34,198.52 -29,510.14 Sales profits and losses (net)
37,760.14 -10,692.20
Other income 1,525.23 5,340.00 Other expenses -102,485.24 -92,355.60 Total 140,664.71 19,725.53

30
1.8 Other operating income and expenses
Other operating income 2013 2012
Rental income from property in own use 1,466.28 0.00 Other income 611,421.41 69,344.89 Total 612,887.69 69,344.89
Other operating expenses 2013 2012
Rental expenses -177,653.27 -74,731.11 Expenses from property in own use -420,508.06 -211,545.00 Other expenses -1,448,702.99 -556,935.80 Total -2,046,864.32 -843,211.91
1.9 Personnel expenses
2013 2012
Salaries and fees -2,829,751.22 -1,919,590.86 Indirect employee expenses -841,785.12 -524,741.79 Pension expenses -724,038.97 -462,115.97 Other indirect employee expenses -117,746.15 -62,625.82 Total -3,671,536.34 -2,444,332.65
1.10 Other administrative expenses
2013 2012
Other personnel expenses -298,185.77 -171,420.85 Office expenses -447,927.99 -202,540.07 IT expenses -2,314,589.81 -1,292,883.70 Communications expenses -242,383.13 -131,238.69 Representational and marketing expenses -749,451.89 -390,156.72 Total -4,052,538.59 -2,188,240.03
1.11 Depreciation and impairments on tangible and
intangible assets
2013 2012
Planned depreciation -496,207.68 -314,824.60 Tangible assets -312,544.73 -314,715.02 Intangible assets -183,662.95 -109.58 Total -496,207.68 -314,824.60
1.12 Impairment losses on credits and other commitments as well as other financial assets
Impairment losses on credits and other com-mitments
2013 2012
From receivables from the public and public institutions
-1,988,940.02 -538,553.16
Contract-specific impairment losses -2,007,645.01 -558,752.10 Cancellations and returns (-) on impairments 18,704.99 20,198.94 Total impairment losses on credits and other commitments
-1,988,940.02 -538,553.16
Total impairment losses on financial assets -1,988,940.02 -538,553.16
1.13 Income by operating and market area
2013 2012
Income from banking operations 17,860,678.05 10,630,725.68 Distribution of income, operating profit, assets and liabilities by operating area has not been reported due to a lack of significance. The bank only operates in Finland. The income is presented as non-eliminated.

31
NOTES ON THE BALANCE SHEET
2.1. Receivables from credit institutions
2013 2012
Repayable on demand 34,378,814.01 7,345,627.55 From domestic credit institutions 34,378,814.01 7,345,627.55 Others 22,232,324.00 12,805,823.00 From domestic credit institutions 22,232,324.00 12,805,823.00 Total 56,611,138.01 20,151,450.55
The item Others comprises a long-term, unsecured senior credit granted by the bank to Aktia Real Estate Mortgage Bank Plc. for refinancing of the supplied mortgages.
2.2 Receivables from the public and public institutions
2013 2012
Enterprises and housing communities 161,118,028.14 95,294,031.76 Financing and insurance institutions 1,276,799.52 124,473.97 Public institutions 112,200.00 0.00 Households 431,777,345.81 224,866,377.50 Non-profit communities serving households 1,884,964.93 736,727.59 Foreign 29,998.10 0.00 Total 596,199,336.50 321,021,610.82
– out of which receivables with subordinated liabilities
68,000.00 0.00
Impairment losses recorded during the financial period
2013 2012
Impairment losses at the beginning of the finan-cial period
553,452.52 398,740.27
+ receivable-specific impairment losses recorded during the financial period
3,472,463.30 558,752.10
– receivable-specific impairment losses cancelled during the financial period
-40,437.10 -18,281.01
– credit losses realised during the financial period formerly recorded with a receivable-specific impairment loss
24,622.49 -385,758.84
Impairment losses at the end of the financial period
4,010,101.21 553,452.52
2.3 Debt securities
2013 2012
Total
Of which debt securities
eligible for refinancing with
central banks
Total
Of which debt securities
eligible for refinancing with
central banks
Debt securities held for trading 1,992,210.00 0.00 452,800.00 0.00 Quoted 828,240.00 0.00 0.00 0.00 Others 1,163,970.00 0.00 452,800.00 0.00 Available-for-sale debt securities 22,778,105.28 3,972,796.00 5,909,025.25 550,650.00 Quoted 18,045,690.40 3,972,796.00 5,345,975.25 550,650.00 Others 4,732,414.88 0.00 563,050.00 0.00 Debt securities held to maturity 3,984,416.78 1,984,416.78 5,983,398.44 1,983,398.44 Quoted 1,984,416.78 1,984,416.78 1,983,398.44 1,983,398.44 Others 2,000,000.00 0.00 4,000,000.00 0.00 Total 28,754,732.06 5,957,212.78 12,345,223.69 2,534,048.44
– out of which receivables with subordinated liabilities
869,148.00 0.00 668,004.25 0.00

32
2.4 Shares and interests
2013 2012
Available-for-sale shares and interests 43,356,112.60 27,246,663.26 Quoted 31,894,256.92 21,935,287.49 Others 11,461,855.68 5,311,375.77 Total shares and interests 43,356,112.60 27,246,663.26
– of which in credit institutions 8,314,427.17 4,926,288.37
Shares and interests in companies belonging to the same Group In other companies 55,970.00 55,970.00 Total 55,970.00 55,970.00
Ownership is appraised at acquisition cost.
2.5 Derivative contracts
Nominal values of derivative contracts 2013
Remaining maturity less than 1 year
1 to 5 years more than 5 years
Total
Hedging derivative contracts 0.00 25,000,000.00 20,000,000.00 45,000,000.00 Interest rate derivatives 0.00 25,000,000.00 20,000,000.00 45,000,000.00 Non-hedging derivative contracts 0.00 2,311,200.00 5,000,000.00 7,311,200.00 Interest rate derivatives 0.00 0.00 5,000,000.00 5,000,000.00 Option contracts 0.00 0.00 5,000,000.00 5,000,000.00 Set 0.00 0.00 5,000,000.00 5,000,000.00 Share derivatives 0.00 2,311,200.00 0.00 2,311,200.00
2012
Remaining maturity less than 1 year
1 to 5 years more than 5 years
Total
Hedging derivative contracts 0.00 15,000,000.00 0.00 15,000,000.00 Interest rate derivatives 0.00 15,000,000.00 0.00 15,000,000.00 Option contracts 0.00 0.00 0.00 0.00 Purchased 0.00 0.00 0.00 0.00
Non-hedging derivative contracts 0.00 0.00 0.00 0.00 Interest rate derivatives 0.00 0.00 0.00 0.00 Option contracts 0.00 0.00 0.00 0.00 Set 0.00 0.00 0.00 0.00 Fair values of derivative contracts
2013 2012
Receivables Payables Receivables Payables
Hedging derivative contracts 3,996,592.30 -16,677.70 1,929,637.16 0.00 Interest rate derivatives 3,996,592.30 0.00 1,929,637.16 0.00 Option contracts 38,436.66 0.00 0.00 0.00 Purchased 38,436.66 0.00 0.00 0.00 Share derivatives 0.00 -16,677.70 0.00 0.00 Non-hedging derivative contracts 0.00 -28,041.00 0.00 0.00 Interest rate derivatives 0.00 -28,041.00 0.00 0.00 Option contracts 0.00 -28,041.00 0.00 0.00 Set 0.00 -28,041.00 0.00 0.00 Total 3,996,592.30 -44,718.70 1,929,637.16 0.00
2.6 Related party disclosures
Related party disclosures are presented in connection with the notes on personnel and management. Note 4.4.
2.7 Intangible assets
2013 2012
Other intangible assets 799,351.24 8,072.56 Total 799,351.24 8,072.56

33
2.8 Tangible assets
Carrying amount Fair value
Land and water areas In own use 108,731.39 Invested 63,058.10 58,617.12 Total 171,789.49
Buildings In own use 620,351.81 Invested 164,138.09 166,189.93 Total 784,489.90
Shares and interests in property communities In own use 4,550,323.52 Invested 1,647,124.93 1,697,137.76 Total 6,197,448.45
Other tangible assets 851,664.31 Total tangible assets 8,005,392.15 Investment property is measured at cost.
2.9 Changes in intangible and tangible assets during the financial period
Intangible assets 2013 Acquisition cost 1 Jan 219,903.10 + increases during the financial peri-od
1,527,403.97
– decreases during the financial period
-19,789.31
+/– transfers between items 1,435,714.57 Acquisition cost 31 Dec 3,163,232.33 Accrued depreciation and impair-ments 1 Jan
-211,830.54
+/– accrued depreciation on de-creases and transfers
-1,956,077.52
– depreciation during the financial period
-195,973.03
Accrued depreciation and impair-ments 31 Dec
-2,363,881.09
Carrying amount 31 Dec 799,351.24
Carrying amount 1 Jan 8,072.56 Tangible assets 2013 Investment property
and shares in
investment property
Other property and shares in property
Other tangible assets
Total
Acquisition cost 1 Jan 1,355,795.03 5,232,700.26 1,843,170.03 8,431,665.32 + increases during the financial peri-od
1,339,510.62 2,289,195.68 1,479,906.50 5,108,612.80
– decreases during the financial period
-144,329.27 0.00 0.00 -144,329.27
+/– transfers between items -153,330.53 -1,282,384.04 0.00 -1,435,714.57 Acquisition cost 31 Dec 2,397,645.85 6,239,511.90 3,323,076.53 11,960,234.28 Accrued depreciation and impair-ments 1 Jan
-552,318.19 -1,191,526.65 -1,115,218.32 -2,859,063.16
+/– accrued depreciation on de-creases and transfers
50,881.90 315,582.91 -1,132,015.30 -765,550.49
– depreciation during the financial period
-21,888.44 -88,366.13 -224,178.60 -334,433.17
Accrued depreciation and impair-ments 31 Dec
-523,324.73 -964,309.87 -2,471,412.22 -3,959,046.82
Accrued revaluations 1 Jan 0.00 4,204.69 0.00 4,204.69

34
Accrued revaluations 31 Dec 0.00 4,204.69 0.00 4,204.69 Carrying amount 31 Dec 1,874,321.12 5,279,406.72 851,664.31 8,005,392.15
Carrying amount 1 Jan 803,476.84 4,045,378.30 729,951.71 5,576,806.85 Activated reconstruction expenses of housing company units have been transferred during the financial period of 2013 from tangible assets to intangible assets.
2.10 Other assets
2013 2012
Payment intermediation receivables 1,361.04 618.75 Others 91,385.05 32,688.92 Total 92,746.09 33,307.67
2.11 Accrued income and prepayments
2013 2012
Interests 2,541,621.77 1,328,899.05 Others 411,531.75 327,155.25 Total 2,953,153.52 1,656,054.30
2.12 Liabilities to credit institu-tions
2013 2012
To credit institutions 43,917,879.88 22,187,737.01 Repayable on demand 237,173.38 288,085.01 Others 43,680,706.50 21,899,652.00 Total 43,917,879.88 22,187,737.01
2.13 Liabilities to the public and public institutions
2013 2012
Deposits 560,261,259.33 315,684,144.26 Repayable on demand 461,828,572.17 272,354,082.39 Others 98,432,687.16 43,330,061.87 Other liabilities 932,552.00 800,461.75 Others 932,552.00 800,461.75 Total 561,193,811.33 316,484,606.01
2.14 Promissory notes issued to the public
2013 2012
Carrying amount Nominal value Carrying amount Nominal value
Certificates of deposit 11,962,530.95 12,000,000.00 0.00 0.00 Bonds 29,940,861.46 30,000,000.00 0.00 0.00 Total 41,903,392.41 42,000,000.00 0.00 0.00
2.15 Other liabilities
2013 2012
Liabilities on payment intermediation 4,749,283.33 4,238,523.29 Others 84,726.38 24,500.33 Total 4,834,009.71 4,263,023.62
2.16 Accrued liabilities and prepayments received
2013 2012
Interests 1,377,278.56 865,368.86 Others 1,513,960.70 513,643.27 Total 2,891,239.26 1,379,012.13

35
2.17 Subordinated liabilities
1) Subordinated liabilities whose carrying amount exceeds 10 per cent of the total value of liabilities Identification data of the liabilities Carrying amount Nominal value Interest % Maturity date
Debenture loan of the Savings Banks 1/2011
4,800,000.00 4,800,000.00 3.50 16 May 2016
Debenture loan of the Savings Banks 1/2012
6,400,000.00 6,400,000.00 2.85 7 May 2017
Debenture loan of the Savings Banks 1/2013
10,000,000.00 10,000,000.00 2.35 15 May 2018
Total 21,200,000.00 21,200,000.00
Amount counted
among own assets
Debenture loan of the Savings Banks 1/2011
4,800,000.00
Debenture loan of the Savings Banks 1/2012
6,400,000.00
Debenture loan of the Savings Banks 1/2013
10,000,000.00
Total 21,200,000.00
All liabilities are reported in euros. The reported liabilities are counted in solvency calculation as lower secondary credit institution-respective assets. Terms of prepayment: The bank retains the right of full or partial redemption of all loans prior to the maturity date. However, prepayment is subject to permission from the Financial Supervisory Authority, except for minor redemptions which the bank resells within a short period of redemption. Regulations concerning the subordination of liabilities or the potential change of liabilities to shares: The loans are issued as debenture loans in accordance with Section 34 of the Promissory Notes Act (622/1947). The loans are subordinate in comparison to the other liabilities of the issuer. 2) All liabilities other than those mentioned above subordinate to other liabilities of the credit institution Debenture loans Total sum of liabilities 2,600,000.00
2.18 Deferred tax liabilities and assets
Deferred tax liabilities and assets are recorded on the changes in the fair value of available-for-sale financial assets in the fair value reserve. Other deferred tax liabilities and assets have not been recorded on the bank's balance sheet. Deferred tax liabilities and assets Valuation-based deferred tax assets 200,949.27 Valuation-based deferred tax liabilities 771,933.82

36
2.19 Maturity distribution of financial assets and liabilities
Financial assets
2013
Less than 3 months 3 to 12 months 1 to 5 years
Debt securities eligible for refinancing with central banks
0.00 507,850.00 2,960,446.00
Receivables from credit institutions 39,936,938.01 0.00 0.00
Receivables from the public and gen-eral government
30,824,906.72 62,472,210.99 201,876,968.42
Debt securities 1,663,855.38 3,579,808.00 12,383,984.90 Total 72,425,700.11 66,559,868.99 217,221,399.32
2013
5 to 10 years More than 10 years Total
Debt securities eligible for refinancing with central banks
504,500.00 1,984,416.78 5,957,212.78
Receivables from credit institutions 0.00 16,674,200.00 56,611,138.01
Receivables from the public and gen-eral government
151,670,576.13 149,354,674.24 596,199,336.50
Debt securities 5,169,871.00 0.00 22,797,519.28 Total 157,344,947.13 168,013,291.02 681,565,206.57
Financial assets
2012
Less than 3 months 3 to 12 months 1 to 5 years
Debt securities eligible for refinancing with central banks
0.00 0.00 550,650.00
Receivables from credit institutions 10,240,550.55 0.00 0.00
Receivables from the public and gen-eral government
17,253,704.68 29,317,055.28 117,224,276.06
Debt securities 0.00 0.00 3,595,231.00 Total 27,494,255.23 29,317,055.28 121,370,157.06
Financial assets
2012
5 to 10 years More than 10 years Total
Debt securities eligible for refinancing with central banks
0.00 1,983,398.44 2,534,048.44
Receivables from credit institutions 0.00 9,910,900.00 20,151,450.55
Receivables from the public and gen-eral government
78,116,332.55 79,110,242.25 321,021,610.82
Debt securities 1,547,940.00 4,668,004.25 9,811,175.25 Total 79,664,272.55 95,672,544.94 353,518,285.06
Financial liabilities
2013 Less than 3 months 3 to 12 months 1 to 5 years Liabilities to credit institutions and central banks
32,340,016.69 10,499,185.00 1,078,678.19
Liabilities to the public and public institutions
495,336,485.46 45,999,831.92 18,924,941.95
Promissory notes issued to the public 4,992,931.13 6,969,599.82 29,940,861.46 Subordinated liabilities 0.00 6,700,000.00 17,100,000.00 Total 532,669,433.28 70,168,616.74 67,044,481.60
Financial liabilities
2013 5 to 10 years More than 10 years Total Liabilities to credit institutions and central banks
0.00 0.00 43,917,879.88
Liabilities to the public and public institutions
932,552.00 0.00 561,193,811.33
Promissory notes issued to the public 0.00 0.00 41,903,392.41 Subordinated liabilities 0.00 0.00 23,800,000.00

37
Total 932,552.00 0.00 670,815,083.62
Financial liabilities
2012 Less than 3 months 3 to 12 months 1 to 5 years Liabilities to credit institutions and central banks
15,388,085.01 6,771,421.00 28,231.00
Liabilities to the public and public institutions
289,296,645.06 23,483,511.49 2,903,987.71
Promissory notes issued to the public 0.00 0.00 0.00 Subordinated liabilities 0.00 2,758,800.00 8,200,000.00 Total 304,684,730.07 33,013,732.49 11,132,218.71
Financial liabilities
2012 5 to 10 years More than 10 years Total Liabilities to credit institutions and central banks
0.00 0.00 22,187,737.01
Liabilities to the public and public institutions
800,461.75 0.00 316,484,606.01
Promissory notes issued to the public 0.00 0.00 0.00 Subordinated liabilities 0.00 0.00 10,958,800.00 Total 800,461.75 0.00 349,631,143.02
Liabilities to the public and public institutions repayable on demand: Other than fixed-term deposits and accounts with overdraft allowance are reported in the category Less than 3 months.
2.20 Classification of assets and liabilities based on domestic and foreign currency and those within the same Group
Assets 2013 2012
Domestic currency Foreign currency Domestic currency
Foreign currency
Debt securities eligible for refinancing with central banks
5,957,212.78 0.00 2,534,048.44 0.00
Receivables from credit institutions 56,611,138.01 0.00 20,151,450.55 0.00 Receivables from the public and gen-eral government
596,199,336.50 0.00 321,021,610.82 0.00
Debt securities 22,797,519.28 0.00 9,811,175.25 0.00 Derivative contracts 4,015,351.26 0.00 1,929,637.16 0.00 Other property 59,094,753.44 -0.03 37,181,865.60 -0.03 Total 744,675,311.27 -0.03 392,629,787.82 -0.03
Payables
2013 2012
Domestic currency Foreign currency Domestic currency
Foreign currency
Liabilities to credit institutions and central banks
43,917,879.88 0.00 22,187,737.01 0.00
Liabilities to the public and public institutions
561,193,811.33 0.00 316,484,606.01 0.00
Promissory notes issued to the public 41,903,392.41 0.00 0.00 0.00 Derivative contracts -28,041.00 0.00 0.00 0.00 Subordinated liabilities 23,800,000.00 0.00 10,958,800.00 0.00 Other liabilities 5,605,943.53 0.00 4,659,188.33 0.00 Accrued liabilities and prepayments received
2,891,239.26 0.00 1,379,012.13 0.00
Total 679,284,225.41 0.00 355,669,343.48 0.00

38
2.21 Fair values of financial assets and liabilities
2013 2012
Financial assets Carrying amount Fair value Carrying amount Fair value
Cash and cash equivalents 3,631,078.54 3,631,078.54 2,338,293.82 2,338,293.82 Receivables from credit institutions 56,611,138.01 56,611,138.01 20,151,450.55 20,151,450.55 Receivables from the public and gen-eral government
596,199,336.50 596,199,336.50 321,021,610.82 321,021,610.82
Debt securities 28,754,732.06 28,754,732.06 12,345,223.69 12,345,223.69 Shares and interests 43,356,112.60 43,356,112.60 27,246,663.26 27,246,663.26 Shares and interests in companies belonging to the same Group
55,970.00 55,970.00 55,970.00 55,970.00
Derivative contracts 4,015,351.26 4,015,351.26 1,929,637.16 1,929,637.16 Total 732,623,718.97 732,623,718.97 385,088,849.30 385,088,849.3
0
Financial liabilities
2013 2012
Carrying amount Fair value Carrying amount Fair value
Liabilities to credit institutions 43,917,879.88 43,917,879.88 22,187,737.01 22,187,737.01 Liabilities to the public and public institutions
561,193,811.33 561,193,811.33 316,484,606.01 316,484,606.01
Promissory notes issued to the public 41,903,392.41 41,903,392.41 0.00 0.00 Derivative contracts and other liabilities held for trading -28,041.00 -28,041.00 0.00 0.00 Subordinated liabilities 23,800,000.00 23,800,000.00 10,958,800.00 10,958,800.00 Total 670,787,042.62 670,787,042.62 349,631,143.02 349,631,143.0
2
The fair values of financial asset have primarily been defined using quoted market prices. If the quoted market price has not been available, the valuation has been based on the current value discounted with market interest rate or other commonly accepted valuation model or method. For the fair value of other financial assets, the carrying amount has been used. For the fair value of financial liabilities, the carrying amount has been used. Financial instruments valued at the fair value on the balance sheet
Parent 2013
Level 1 Level 2 Level 3 Total
46,249,046.32 4,996,064.68 9,406,771.46 60,651,882.46 Profits and losses unrealised during the period 133,912.00 Parent 2012 Level 1 Level 2 Level 3 Total
26,247,622.74 1,929,637.16 2,049,490.00 30,226,749.90 Profits and losses unrealised during the period 12,550.00 Essential financial assets measured at cost instead of fair value
Shares and interests are measured at cost in companies considered essential for the operations, which are described in detail in note 5.2. Shares and interests considered essential for the operations are meant to be kept in permanent possession. The fair value of these ownerships cannot be defined in a reliable manner.

39
2.22 Equity increase and decrease during the financial period
Financial period Increase Decrease Financial period
at the beginning at the end
Share capital 6,500,000.00 3,500,000.00 0.00 10,000,000.00 Other restricted reserves 398,971.57 6,856,630.65 -4,971,664.06 2,283,938.16 Fair value reserve 398,971.57 6,856,630.65 -4,971,664.06 2,283,938.16 From valuation to fair value 398,971.57 6,856,630.65 -4,971,664.06 2,283,938.16 Non-restricted reserves 9,526,243.14 10,041,646.41 0.00 19,567,889.55 Reserve for invested non-restricted equity
9,526,243.14 10,041,646.41 0.00 19,567,889.55
Retained profit 3,622,075.47 1,854,841.87 -150,000.00 5,326,917.34 Profit for the period 1,854,841.87 3,461,725.67 -1,854,841.87 3,461,725.67 Total equity 21,902,132.05 25,714,844.60 -6,976,505.93 40,640,470.72
Financial period Increase Decrease Financial period
at the beginning at the end
Equity instruments 388,024.67 5,480,884.13 -4,149,267.20 1,719,641.60 of which deferred taxes -125,915.29 0.00 -303,995.12 -429,910.41 Debt securities 10,946.90 1,375,746.52 -822,396.86 564,296.56 of which deferred taxes -3,552.31 0.00 -137,521.83 -141,074.14 Total fair value reserve 398,971.57 6,856,630.65 -4,971,664.06 2,283,938.16
Increase of equity items at the merger of 30 April 2013
Share capital 3,500,000.00 Fair value reserve 970,547.59 Reserve for invested non-restricted equity 10,041,646.41
2.23 Share capital
The number of Oma Savings Bank Ltd's shares is 168,000, of which the Töysä Savings Bank Foundation owns 60,000, the Kuortane Savings Bank Foundation 40,000 and the Parkano Savings Bank Foundation 68,000. Shareholders have one vote per share.
NOTES CONCERNING GRANTED SECURITY COLLATERALS AND CONTINGENT LIABILITIES
3.1 Securities granted
Granted from own liabilities: Balance sheet item Pledges Mortgages Other securities Total Liabilities to credit institutions 2,299,185.00 0.00 0.00 2,299,185.00 Granted from own liabilities, total 2,299,185.00 0.00 0.00 2,299,185.00
3.2 Pension liabilities
The pension scheme of the personnel has been arranged by Eläke-Fennia pension insurance company, and there is no uncovered pension liability.
3.3 Leasing and other rent liabilities
Minimum rents payable on the basis of non-cancellable leasing
2013 2012
Less than 1 year 114,551.28 125,317.76 1 to 5 years 101,862.94 204,489.51

40
3.4 Commitments outside the balance sheet
2013 2012
Commitments given to a third party on behalf of a client Guarantees 15,522,674.00 9,643,151.48 Other commitments given to a third party on behalf of a client
299,209.40 2,676,158.29
Granted to a client Irrevocable commitments 35,945,964.31 15,542,040.14 of which credit commitments 35,945,964.31 15,542,040.14 Total commitments outside the balance sheet
51,767,847.71 27,861,349.91
The bank has issued an absolute guarantee to Aktia Real Estate Mortgage Bank Plc on behalf of itself and the other Savings Banks included in the intermediation contract on the compensation of potential mortgage credit losses to Aktia Real Estate Mortgage Bank Plc. The amount of guarantee liabilities is restricted. The bank has issued an absolute guarantee to Aktia Pankki Plc in favour of all the other Savings Banks which have concluded a payment transaction contract of similar content with Aktia Pankki Plc. The guarantee concerns the receivables that may be generated to Aktia Pankki Plc on the breach of the terms and conditions of the payment transaction contract. The amount of guarantee liabilities is restricted.
3.5 Other arrangements outside the balance sheet
The bank belongs to the VAT group of Samlink Ltd.
Joint responsibility related to the group VAT registration
1,599,454.59 884,897.32
The Savings Banks Association represents the Savings Banks towards Visa Europe. As a member of Visa Europe (As-sociate Member), the Savings Banks Association is primarily responsible for the potential damage that may incur in the payment card business and for following the rules of the membership and Visa with respect to Visa Europe. On the basis of the membership contract, Visa Europe may submit claims for compensa-tion upon breaching the contract or the rules.
Since the Savings Banks are responsible for all business operations related to the Visa cards, they are also eventually responsible for any compensation to Visa Europe.
NOTES ON PERSONNEL AND MANAGEMENT
4.1 Number of personnel 31 Dec
2013 2012
Permanent full-time personnel 67 37 Permanent part-time personnel 4 2 Fixed-term personnel 11 5 Total 82 44
4.2 Salaries and fees of the management
2013 2012
The Board members and deputies as well as the Chief Executive Officer and his or her deputy
390,531.88 384,806.94
Total 390,531.88 384,806.94
Pension commitments

41
4.3 Loans and guarantees granted to the management
2013 2012
Loans Guarantees Loans Guarantees
The Board members and deputies as well as the Chief Executive Officer and his or her deputy
1,121,533.84 0.00 413,381.66 31,809.40
Total 1,121,533.84 0.00 413,381.66 31,809.40
Increase 479,360.80 78,040.00 Decrease 113,034.06 31,809.40 99,296.25 Loans and guarantees have been granted under terms similar to those applied to clients’ loans and guarantees.
4.4 Related party disclosures
2013 Related party grounds Receivables from
the public and public institu-
tions
Investments Other receivables Guarantees/ securities
Management *) 0.00 0.00 0.00 0.00 Management of the owner community 1,353,012.94 0.00 0.00 28,500.00 Relation 417,707.01 0.00 0.00 15,000.00 Authority 4,984,632.30 0.00 0.00 0.00 Total 6,755,352.25 0.00 0.00 43,500.00
2012 Related party grounds Receivables from
the public and public institu-
tions
Investments Other receivables Guarantees/ securities
Management *) 0.00 0.00 0.00 0.00 Management of the owner community 1,323,000.54 0.00 0.00 45,400.00 Relation 343,979.48 0.00 0.00 42,000.00 Authority 909,983.30 0.00 0.00 188,400.00 Total 2,576,963.32 0.00 0.00 275,800.00
*) Loans and guarantees granted to the management are presented in note 4.3.
OWNERSHIPS IN OTHER COMPANIES
5.1 Small subsidiaries and associates left out of the consolidated financial statements Subsidiaries Pcs Carrying amounts
Housing and real estate companies 5 1,761,688.33 Others 2 55,970.00 Associates Pcs Carrying amounts
Housing and real estate companies 6 3,982,831.44
5.2 Ownerships in other companies
Name and domicile of the company Share of owner-ship, %
Equity* Profit for the financial period*
Aktia Real Estate Mortgage Bank, Helsinki
3.20 107,700,000.00 1,738,724.47
Henkivakuutusosakeyhtiö Duo, Espoo 6.90 24,804,665.73 6,623,227.21
Nooa Savings Bank Ltd, Helsinki 7.01 35,310,395.25 -642,230.68
Sp-Rahastoyhtiö Ltd, Espoo 6.83 1,957,053.86 -359,684.96 Samlink Ltd, Espoo 3.78 11,582,011.78 1,552,187.95
Säästöpankkien Holding Ltd, Espoo 7.04 1,351,008.31 -123.65
Sp-Koti, Espoo 7.64 525,611.66 -534,854.48 Central Bank of Savings Banks Finland,
Espoo 7.94 0.00 0.00
Total 183,230,746.59 8,377,245.86
* Equity and profit of financial period 2012

42
OTHER NOTES
6.1 Trustee operations provided by the credit institution
Trust activity services provided by the credit institution
The bank provides supply and implementation of assignments, trading on its own behalf, trust activities, investment consultation, safekeeping and management of financial instruments as well as safety deposit and related services. The bank does not provide so-called full-service trust activities.
6.2 Auditor fees
2013 Auditor fees by assignment group: Audit 23,941.20 Assignments referred to in Section 1(1)(2) of the Auditing Act
3,506.20
Other services 1,814.50 Total 29,261.90

43
7 NOTES ON SOLVENCY (PILLAR III)
7.1 Classification of own assets
Primary own assets 2013 2012 Paid equity 10,000,000.00 6,500,000.00 Reserves 48,157,024.65 26,372,186.24 – Planned profit distribution -250,000.00 -150,000.00 – Intangible assets -799,351.24 -8,072.56 – Investments in financial institutions -647,287.04 -593,552.05 Total primary own assets 56,460,386.37 32,120,561.63 Secondary own assets Upper secondary own assets 2,283,938.16 398,971.57 Lower secondary own assets 23,800,000.00 10,958,800.00 – Investments in financial institutions -647,287.04 -593,552.05 Total secondary own assets 25,436,651.12 10,764,219.52 Total own assets 81,897,037.49 42,884,781.15
7.2 Minimum amount of own assets
Credit and counterparty risk 2013 2012
Liability group Minimum amount of own assets
Minimum amount of own assets
Receivables from credit institutions and investment service compa-nies
1,131,070.40 431,203.66
Receivables from companies 8,094,785.08 4,999,437.47 Retail receivables 9,993,016.40 5,828,900.94 Property-security receivables 9,567,938.49 4,652,243.98 Matured receivables 524,691.80 263,883.83 Investments in unit trusts 2,203,006.46 1,582,009.66 Other items 1,582,763.89 864,532.37 Total credit risk 33,097,272.52 18,622,211.91
Market risk (currency risk) 795,147.18 306,649.54 Operative risk 2,417,704.00 1,314,929.58
Total minimum amount of own assets 36,310,123.70 20,243,791.03

44
7.3 Total liabilities according to risk weight
Credit and counterparty risk Risk weight (%) 2013 2012 0 36,320,502.07 21,784,125.75 20 68,100,751.77 26,489,906.05 35 342,518,796.70 165,401,157.76 50 3,676,171.18 1,916,855.87 75 178,924,613.39 105,375,586.63 100 163,685,814.54 94,224,119.82 150 1,825,833.52 4,557,781.26 Total 795,052,483.17 419,749,533.14
7.4 Average value of total liabilities by liability group during the financial period Credit and counterparty risk Liability group 2013 2012 Receivables from governments and central banks
17,313,254.88 11,232,286.02
Receivables from regional administration and local authorities
2,165,910.74 504,169.06
Receivables from the general government and public institutions
4,337,602.22 4,077,107.09
Receivables from credit institutions and in-vestment service companies
54,671,274.68 23,898,701.96
Receivables from companies 101,499,133.83 63,517,670.33 Retail receivables 160,755,490.10 104,965,272.65 Property-security receivables 292,510,125.91 159,650,379.82 Matured receivables 5,147,505.25 3,066,867.55 Investments in unit trusts 30,859,988.86 21,676,867.97 Other items 20,832,349.43 13,368,453.67 Total 690,092,635.90 405,957,776.12
7.5 Maturity distribution of total liabilities by liability group *) Credit and counterparty risk
2013 Liability group Total Less than 3
months 3 to 12 months
Property-security receivables 344,196,398.18 3,157,506.02 11,578,540.90 Retail receivables 178,924,613.41 7,128,546.52 4,729,519.84 Receivables from companies 113,169,323.23 7,799,977.28 7,595,869.61 Receivables from credit institutions and investment service companies
71,907,210.75 39,937,748.57 521,596.58
Total other liability groups 80,985,167.56 4,562,651.29 3,641,436.53 Matured receivables 5,869,770.05 2,336,529.30 3,334.86 Total 795,052,483.18 64,922,958.98 28,070,298.32
Liability group 1 to 5 years 5 to 10 years More than 10 years Property-security receivables 35,507,283.65 68,755,623.26 225,197,444.35 Retail receivables 33,666,600.44 43,909,714.16 89,490,232.43 Receivables from companies 23,950,747.66 21,075,492.87 52,747,235.81 Receivables from credit institutions and investment service companies
2,784,095.37 0.00 28,663,770.23
Total other liability groups 1,699,355.99 1,966,048.54 69,115,675.21 Matured receivables 266,102.95 270,836.65 2,992,966.29 Total 97,874,186.06 135,977,715.48 468,207,324.32
Credit and counterparty risk
2012 Liability group Total Less than 3
months 3 to 12 months
Property-security receivables 166,730,036.37 2,235,115.93 2,629,595.42 Retail receivables 105,375,586.65 3,760,755.55 2,519,547.07 Receivables from companies 67,009,557.77 3,066,384.05 2,606,614.71 Receivables from credit institutions and investment service companies
27,716,504.76 10,241,756.77 0.00
Total other liability groups 50,162,887.10 3,046,108.38 166,152.14 Matured receivables 2,754,960.51 1,884,491.10 104,898.88 Total 419,749,533.16 24,234,611.78 8,026,808.22
Liability group 1 to 5 years 5 to 10 years More than 10 years Property-security receivables 17,426,859.72 34,837,469.75 109,600,995.55

45
Retail receivables 17,917,695.97 27,694,207.23 53,483,380.83 Receivables from companies 20,638,983.65 7,558,978.22 33,138,597.14 Receivables from credit institutions and investment service companies
1,044,191.92 20,000.00 16,410,556.07
Total other liability groups 1,128,252.83 914,127.70 44,908,246.05 Matured receivables 20,301.29 71,320.84 673,948.40 Total 58,176,285.38 71,096,103.74 258,215,724.04
*) The table shows the four largest liability groups and matured receivables; the other liability groups are summed up in one item, Total other liability groups.
7.6 Total liabilities by liability group and by counterparty *) Credit and counterparty risk
2013 Liability group Total Private Agriculture Companies Others Property-security receivables 344,196,398.18 257,267,186.65 24,726,674.80 51,562,543.62 10,639,993.11 Retail receivables 178,924,613.40 80,077,504.78 25,955,977.14 67,990,900.39 4,900,231.09 Receivables from companies 113,169,323.24 10,978,069.55 5,911,109.87 64,627,877.58 31,652,266.23 Receivables from credit institutions and investment service companies
71,907,210.75 29,006.62 0.00 20,000.00 71,858,204.13
Total other liability groups 80,985,167.56 12,179,898.83 954,787.65 5,198,652.42 62,651,828.66 Matured receivables 5,869,770.05 3,602,811.16 292,607.92 1,826,822.17 147,528.80 Total 795,052,483.18 364,134,477.59 57,841,157.38 191,226,796.18 181,850,052.02
Credit and counterparty risk
2012 Liability group Total Private Agriculture Companies Others Property-security receivables 166,730,036.36 128,464,982.29 10,514,604.50 24,776,816.29 2,973,633.28 Retail receivables 105,375,586.64 53,168,401.95 14,551,915.70 35,995,532.62 1,659,736.37 Receivables from companies 67,009,557.78 8,958,566.02 3,525,071.53 37,956,128.67 16,569,791.56 Receivables from credit institutions and investment service companies
27,716,504.76 23,078.03 0.00 20,000.00 27,673,426.73
Total other liability groups 50,162,887.11 6,448,910.70 759,190.89 2,145,884.16 40,808,901.36 Matured receivables 2,754,960.51 1,568,657.88 429,833.75 724,900.97 31,567.91 Total 419,749,533.16 198,632,596.87 29,780,616.37 101,619,262.71 89,717,057.21
*) The table shows the four largest liability groups and matured receivables; the other liability groups are summed up in one item, Total other liability groups.
7.7 Imputed operative risk Parent 2013 2012 2011 Minimum amount
of own assets
Total gross income 16,432,633.49 15,885,575.41 16,035,871.08 Income indicator 2,464,895.02 2,382,836.31 2,405,380.66 2,417,704.00
2012 2011 2010 Minimum amount
of own assets
Total gross income 9,770,666.25 9,262,566.02 7,265,359.43 Income indicator 1,465,599.94 1,389,384.90 1,089,803.91 1,314,929.58
The income indicator is calculated according to the basic method presented in standard 4.3i of the Financial Supervisory Authority.
Minimum amount of own assets = sum of positive annual income indicators divided by the number of years with a positive indicator.
Operative risks refer to the risk of loss potentially caused by inadequate or insufficient internal processes, personnel, systems or exter-nal factors.

46
Signing the financial statements and the annual report
Signing the financial statements and the annual report
Seinäjoki, 11 February 2014
Board of Directors of Oma Säästöpankki Ltd
Chief Executive Officer
Adoption of the financial statements
A report of the performed audit has been issued today.
Seinäjoki, 21 February 2014
APA Tatu Huhtala

47
List of accounting books and types of receipts used during the financial period
Accounting books Form of archiving General ledger/journal Electronic archive Balance sheet Bound book Receipts Paper print-out Factoring Sales ledger (automated) Electronic archive Portfolio bookkeeping Electronic archive Accounts payable (eOffice) Electronic archive Accounts payable Paper receipt Cash journal Electronic print-out Cash reports Electronic print-out Payroll accounting Electronic archive Fixed assets accounting Electronic archive Derivative factoring Excel file Rent receivables Excel file Trustee assignments Excel file
Types of receipts 10 Payment transactions in account statement 20 Purchase invoices 21 Expenses of the Chief Executive Officer 22 Personnel expenses 25 Purchase invoice settlements 26 Direct debiting (Samlink) 28 Direct debiting (PP-Laskenta) 30 Purchase invoices, eOffice banks, invoices circulating outside the bank 51 Portfolio bookkeeping 53 Deposits funding, Payment transactions interest 56 Machine-language entries from other factoring, transactions entered at QS cash 58 Machine-language transactions between cost centres 60 Internal accounting receipts 61 Machine-language data transmission of internal accounting 70 Memorandum receipts 71 General ledger entries 75 Salary entries, paid salaries 80 Deferred receipts, distributable entries 82 Machine-language imputations 83 Machine-language imputations, salaries, holiday pay 84 Machine-language imputations, salaries, indirect expenses, social security payments 85 Depreciation write-off 91 Business transactions, items outside the balance sheet 92 Business transactions, adjusting items 94 Business transaction related entries 99 Income entry