Embed Size (px)
Citation preview
ORGANIZATIONALBEHAVIOR
Organizational Behavior and Human Decision Processes 94 (2004) 74–85
AND HUMANDECISION PROCESSES
www.elsevier.com/locate/obhdp
Omission bias, individual differences, and normality
Jonathan Barona,*,1 and Ilana Ritovb
a Department of Psychology, University of Pennsylvania, 3720 Walnut St., Philadelphia, PA 19104–6196, USAb Hebrew University of Jerusalem, Israel
Received 20 August 2003
Available online 15 April 2004
Abstract
Omission bias is the preference for harm caused by omissions over equal or lesser harm caused by acts. Recent articles (Connolly
& Reb, 2003; Patt & Zeckhauser, 2000; Tanner & Medin, in press) have raised questions about the generality of this phenomenon
and have suggested that the opposite bias (action bias) sometimes exists. Prentice and Koehler (2003) have suggested that omission
bias is sometimes confounded with a bias toward what is normal, a bias they find. We review this literature and report new data
showing omission bias with appropriate methods, as well as a small normality bias that cannot explain the omission bias. The data
suggest that the bias is largely based on the distinction between direct and indirect causation, rather than that between action and
inaction as such. We report substantial individual differences: some subjects show action bias. We argue, though, that concern about
omission bias is justified if only a substantial minority of people show it.
� 2004 Elsevier Inc. All rights reserved.
Introduction
In 1736, I lost one of my sons, a fine boy of 4 years old, by the
small-pox, taken in the common way. I long regretted bitterly,
and still regret that I had not given it to him by inoculation.
This I mention for the sake of parents who omit that operation,
on the supposition that they should never forgive themselves if a
child died under it; my example, showing that the regret may be
the same either way, and that, therefore, the safer should be
chosen.Benjamin Franklin (1771–1778)
Omission bias is the preference for harm caused by
omissions over equal or lesser harm caused by acts.
Ritov and Baron (1990) used vaccination to illustrate
the bias: many people consider the risk of harm from
vaccination as more serious than the risk from omitting
vaccination. This bias seems to affect real vaccinationdecisions (Asch et al., 1994; Meszaros et al., 1996), and
it has been found in several other contexts (Baron,
1992, 1996; Baron & Leshner, 2000; Baron & Ritov,
1993, 1994; Cohen & Pauker, 1994; Haidt & Baron,
1996; Petrinovich & O’Neill, 1996; Ritov & Baron,
* Corresponding author.
E-mail address: [email protected] (J. Baron).1 This work was supported by Grant No. 2000209 from the United
States-Israel Binational Science Foundation.
0749-5978/$ - see front matter � 2004 Elsevier Inc. All rights reserved.
doi:10.1016/j.obhdp.2004.03.003
1992, 1995, 1999; Royzman & Baron, 2002; Schweitzer,
1994; Spranca, Minsk, & Baron, 1991).
Recent articles (Connolly & Reb, 2003; Patt & Zec-
khauser, 2000; Tanner & Medin, in press) have raised
questions about the generality of this phenomenon, es-
pecially in the context of vaccination, and have sug-gested that the opposite bias (action bias) exists in some
conditions. Another article (Prentice & Koehler, 2003)
suggests that omission bias is sometimes confounded
with a bias toward what is standard or normal, a bias
reported in the article. Connolly and Reb (2003,
henceforth CR) raise other concerns about the practical
implications of the phenomenon of omission bias.
In the present article, we review this literature andreport new data showing a small omission bias with
appropriate methods, as well as a small normality bias
that cannot explain the omission bias. We also report
substantial individual differences, with some subjects
clearly showing an action bias despite the overall trend
toward omission bias. We argue, though, that concern
about omission bias is justified if only a substantial
minority of people show it, even if, on average, just asmany show the opposite bias.
Our primary interest is in decision making, so we
concentrate on research concerned with choices (hypo-
thetical or real) and with evaluation of choices.
J. Baron, I. Ritov / Organizational Behavior and Human Decision Processes 94 (2004) 74–85 75
However, some research is also concerned with antici-pated emotional reactions, and we discuss this literature
when it might inform us about how people think about
choices.
We try to avoid discussion of the status-quo effect,
which we take to be a different effect from omission bias
(Ritov & Baron, 1992; Schweitzer, 1994). Omission bias
is a greater willingness to accept harms from omission,
the default, than harms from action. Status-quo bias is agreater willingness to accept the status-quo than change.
Ordinarily, the default and the status-quo are the same,
so these two biases work together, but they may be
separated in both experiments and the real world (e.g.,
when all options are new, so none is the status-quo). We
do suggest, however, that an important component of
the act–default distinction is that between direct and
indirect causation (as suggested by Spranca et al., 1991and Royzman & Baron, 2002). In particular, people
seem to treat the risk of vaccine failure as roughly
equivalent to the risk of failing to vaccinate, both less
serious than the risk of causing harm through vaccina-
tion itself.
Methodological criticisms of vaccine studies
CR criticize the methods of several studies showing
omission bias for vaccines. The usual result is that
subjects are unwilling to take some risk of death or se-
rious side effects from a vaccine, when the alternative is
a much greater risk of these same outcomes without
vaccination (Ritov & Baron, 1990). Most of these criti-
cisms have been answered in studies using non-vacci-
nation examples (listed in this article’s first paragraph),and some were even answered in the articles that CR
criticize. We review these criticisms briefly here.
Response scales
Many studies used a limited response scale, in which
the highest acceptable response was that the risk of
vaccination was equal to that of non-vaccination. Atendency to respond anywhere other than the top of the
scale counts as omission bias. The scale itself may sug-
gest that responses at one end are unreasonable or un-
expected. However, even in the original article by Ritov
and Baron (1990), two results that support omission bias
cannot be explained in terms of this scale limitation.
First, we found a large difference between cases in
which the children who would die from the vaccine werenot necessarily the same as those who would die from
the disease and cases in which those who died from the
vaccine would have died from the disease anyway, using
the same response scale. Subjects were much more
willing to vaccinate in the latter case, which serves as a
control condition for the effects of the response scale
itself. Baron and Ritov (1994, Experiment 4) also found
that subjects tolerated greater risk of vaccine deathwhen the vaccine deaths were the result of vaccine fail-
ure rather than side effects. These results indicate that
direct causation of deaths by the vaccine makes people
more reluctant to vaccinate, which is our main claim (as
argued by Spranca et al., 1991).
Second, we found omission bias when the response
scale was open-ended, in Experiment 4, in which the
vaccine risk was given and subjects had to provide adisease risk that was equally unacceptable. We found
that the disease risk was higher. CR criticize Experiment
4 because the responses were ‘‘bounded below at zero,
but unbounded above, so that the means would have
been inflated by any large-number responses partici-
pants used to register reluctance to vaccinate under any
circumstances’’ (p. 189). They might add that the aver-
age ratio of vaccination risk to disease risk and the av-erage ratio of disease risk to vaccination risk might both
be greater than one, leading to different conclusions
depending on which measure was used. It was exactly to
avoid these potential problems that we reported (in
Table 4) an analysis based on logarithms, which showed
a robust omission bias. Logarithms of ratios are un-
bounded at both ends, and inverting the ratios changes
only the sign of the means of their logarithms, so that itis impossible to obtain positive results for both ratios.
Moreover, the fact that subjects were unable to express
an infinite ratio is conservative with respect to the
omission bias hypothesis. When they were asked to
provide a maximum acceptable vaccination risk, many
subjects said zero.
Spranca et al. (1991, Experiments 3 & 4) and Baron
and Ritov (1994, Experiments 2–5) used other methodsto demonstrate omission bias, in ways not subject to the
problem of limited responses scales. Subjects made
judgments about which option was better or more ad-
visable. This question allowed subjects to compare cases
in different choice sets, so that the same outcome could
result from an act or an omission. Cases were counter-
balanced, so that, half the time, the act led to the worse
outcome, and, half the time, the omission did. In almostall of these cases, we found that acts leading to the worse
outcome were rated lower (less advisable) than omis-
sions leading to the worse outcome.
Royzman and Baron (2002, Study 3) also found
omission bias using response options that did not favor
acts or omissions. For example, in one scenario, if
nothing is done, 10 species of rare trees will become
extinct because of an insect infestation. One option wasto destroy the species in which the insects had nested so
far. Subjects were asked, ‘‘Would you do this if the ac-
tion would cut the number of species extinction in half?
. . . lead to the same number of species extinctions?
. . . double the number of species extinctions?’’ In gen-
eral, subjects tended to favor omission across the three
options (and significantly so, whether tested across
76 J. Baron, I. Ritov / Organizational Behavior and Human Decision Processes 94 (2004) 74–85
subjects or scenarios). Interestingly, omission bias wassharply reduced when the effect of action was indirect
rather than direct, e.g., when saving the trees involved
killing the insects, leading to extinctions as a by-product.
Lability and complexity
CR also point out that the magnitude of omission
bias varies considerably from experiment to experiment.We have always thought of the omission bias as result-
ing from the use of a heuristic, rather than as a psy-
chophysical constant. The use of heuristics is
notoriously labile, as shown by much research.
CR also suggest that asking subjects to match vaccine
risk to disease risk is too difficult. In several studies (Asch
et al., 1994; Baron, 1992; Baron & Leshner, 2000) we first
asked whether subjects would vaccinate or not at an in-termediate level of vaccine risk. Many would not even
vaccinate at this level. We then asked for a maximum risk
level, and we eliminated responses in which themaximum
risk was inconsistent with the initial response.
Bias toward action
CR and other articles claim to find a bias towardaction, opposite to omission bias. (CR do not actually
claim this, but they make an effort to control factors that
might justify the choice of vaccination over non-vacci-
nation, and they report a preference for vaccination.)
Biases toward action clearly exist. What is unclear is
when? So far, there seem to be two clear cases. In one,
action is sometimes favored over omission as a way to
achieve the better of two outcomes. This explanationcannot explain the kind of action bias that CR seem to
find. In another, harm from expected actions are not
considered to be as bad as harm arising from unexpected
actions. The expectation account may help to explain
CR’s results.
The better outcome
Landman (1987) and Gleicher et al. (1990) found a
bias toward action in anticipated emotional responses to
good outcomes. They asked people to compare out-
comes in different situations, so that it is possible to
compare cases in which either an act or an omission
leads to the better of the same two outcomes. People
expect to be happier if they gamble and win than if they
refrain from gambling and win the same amount.‘‘Winning’’ in these cases is defined as getting the better
of two outcomes. The same studies found omission bias
for losing: gambling and losing seems worse than not
gambling and getting the same outcome. Thus, act/
omission and better/worse interact, for anticipated
emotion. Spranca et al. (1991, Experiment 3) Baron and
Ritov (1994), and Zeelenberg, van der Pligt, and de
Vries (2000) replicated this interaction, using judgmentsof the quality or advisability of the decision, as well as
emotion ratings, although some of these studies did not
look for an action bias in the better outcomes alone.
Expectation
Ritov and Baron (1994) found an apparent action
bias in judgments of appropriate compensation for in-juries in a train accident, when action was expected. In
particular, subjects awarded more compensation in the
case of an engineer who decided not to stop the train
(thus causing injuries) than in the case of an engineer
who tried to stop and failed, or an engineer who actually
stopped (with the sudden stop causing identical injuries).
We suggested that expectation may, at least partially,
mediate the effects of action vs. omission in otherstudies, since omission is usually expected. Such an ex-
pectation may be at work in the vaccination cases
studied by CR, at least for some of the subjects.
A related example in which omission bias is reduced
or eliminated, but not reversed, is the case of responsi-
bility (Baron, 1996; Haidt & Baron, 1996). When people
are in roles that make them responsible, they have an
equal responsibility to prevent harm through both ac-tion and omission. Perhaps, inaction leading to harm is
actually worse than action (trying to do something) in
cases of responsibility, although Haidt and Baron did
not find any such cases. Another related case involves
inaction resulting in failure to change a losing strategy
(Zeelenberg, van den Bos, van Dijk, & Pieters, 2002),
which increases the regret from a bad outcome. The
anticipation of such regret might lead to an action biasin this case.
Other possible examples of action bias
What is still in doubt is whether action bias exists
when no other factors are present that would make
omissions seem irresponsible or unexpected.
CR cite Ayanian and Berwick (1991) as an exampleof action bias. In this paper, scenarios were selected in
which prior subjects (physicians) were least likely to act.
New subjects, given these selected scenarios, were more
likely to act than the original subjects were. The paper
suggests that this shows a bias toward action, but the
result is also explained by regression to the mean, since
the cases were selected for extremeness. Another expla-
nation is that the subjects followed a rule such as,‘‘About half the patients with this condition need
treatment, so I should set my criterion for action in
order to achieve that result,’’ without knowing that the
cases were selected because they were the least needy, in
the judgment of others.
Tanner and Medin (in press) claim to show an action
bias, in a situation in which action is called for. In fact,
J. Baron, I. Ritov / Organizational Behavior and Human Decision Processes 94 (2004) 74–85 77
Tanner and Medin presented four scenarios, one ofwhich asked the subjects to think of themselves as
‘‘environmental activists’’ and ‘‘to decide if you want to
lobby for the vaccination or not’’ (with no option to
lobby against it). Although no significance test is re-
ported, it appears that this scenario did lead to a pref-
erence for action over omission, but (as the paper
suggests in a footnote) the wording of the scenario may
have favored action. In another situation that showedan apparent action bias involving contamination of the
environment with polychlorinated biphenyls (PCB), the
action/omission distinction was represented as a choice
between two strategies: (1) ‘‘make the plant implement a
cleanup program to remove PCB from products which
have been previously disposed of,’’ or, (2) ‘‘if you don’t
implement the program, the municipality plans to im-
plement a program that should insure proper removal ofPCB from future electrical equipment and products.’’ It
is possible that subjects favored the former program
because the latter would (it seems) leave the company
unpunished (a possibility consistent with the findings of
Baron, Gowda, & Kunreuther, 1993), although the
second program may also have appeared to be less
certain than the first. The other two scenarios appar-
ently showed omission bias.Tanner and Medin also claim to have found action
bias in the subgroup of subjects with protected values, a
reversal of the result reported by Ritov and Baron
(1999). In fact, their measure of ‘‘protected value’’ was
actually a measure of tendency to act. Subjects were
given three options: ‘‘People should only undertake this
action if it leads to some benefits that are great enough’’;
‘‘People should do this no matter how small the bene-fits’’; ‘‘Not undertaking the action is acceptable if it
saves people enough money.’’ Endorsement of the sec-
ond was taken to reflect a protected value. But the
definition of protected values used by Ritov and Baron
(1999) was neutral with respect to the action/inaction
distinction. Following Baron and Spranca (1997), we
defined protected values in terms of unwillingness to
make a trade-off between a protected value and othervalues, without reference to whether the trade-off would
result from an act or an omission. For example, ‘‘letting
people die from starvation,’’ could result from both the
action and inaction options. Further, Ritov and Baron’s
definition required that the subject consider the conse-
quence to be so bad that allowing it to happen (or
making it happen) would not be worth any benefit, no
matter how great. The original definition would havereplaced ‘‘people should do this no matter how small the
benefits’’ with ‘‘people should do this no matter how
great the cost,’’ and it would have been neutral with
respect to action vs. inaction (e.g., ‘‘this outcome is
worth any cost’’).
Still, the results of Tanner and Medin could show
that some subjects are biased toward action, namely,
those who chose the second option (‘‘do this no matterhow small the benefits’’). But only one of the two sce-
narios with wording that clearly did not favor action
shows an overall bias toward action, with 62% of those
who chose the second option favoring action, which is
apparently not significantly higher than 50% (23 out of
37 subjects, p ¼ :19). Hence, this paper fails to demon-
strate the existence of a bias toward action in any group
for any unbiased scenario.Tanner and Medin cite the work of Patt and Zec-
khauser (2000) in support of their claim to find action
bias in environmental decisions. Patt and Zeckhauser
show that, other things being equal, people prefer to
improve the environment from a bad state to a good one
in one area (e.g., reducing water pollution) than to
prevent a decline from good to bad in another area (e.g.,
prevent an increase in water pollution). This effect is notabout act vs. omission but, rather, about maintaining or
changing the status quo. Both options are described as
acts. In one case, however, Patt and Zeckhauser include
a default option, which will be chosen if no action is
taken. (They call this ‘‘strong action bias’’). As they
admit in their fn. 14, however, the action option was
always presented second, and was always introduced
after presenting the problems of the default option bysaying, ‘‘There is an alternative,’’ thus suggesting that
the alternative is the obvious ‘‘way out’’ of the dilemma.
What about CR’s results? Experiment 1 asked sub-
jects, if they would vaccinate their child against a dan-
gerous flu, even if the vaccine could cause dangerous
side effects. A majority of subjects favored vaccination,
even when the analysis was limited to the subjects who
understood that the disease and the side effects wereequally serious. However, the questionnaire did not ask
about their probability. We find it hard to imagine that
subjects would think that a vaccine would be offered
that would not reduce the probability of harm. Subjects
were faced with a conflict between the implications of
the fact that the vaccine was offered at all and the
statement late in the scenario saying that the risks were
equal. Responses may have been influenced by the im-plications of the vaccine being offered, even if subjects
understood the sentence about equal risk.
CR did show that probability information affected at
least some subjects, but only in questions asked after the
initial decision. They also did not show that responses
were ‘‘appropriately related both to relative probabili-
ties and to perceived seriousness.’’ As a first pass, it
would seem that an appropriate response is never tovaccinate when the risks of vaccine are equal to, or
higher than, those of not vaccinating. It may be that
some subjects responded appropriately, and others ig-
nored the probability information.
CR’s Experiment 2 used exactly the same wording for
vaccine effects and side effects, but subjects still tended
to infer, on the average, that flu symptoms were more
3 N’gbala and Branscombe (1997) found a between-subject effect of
78 J. Baron, I. Ritov / Organizational Behavior and Human Decision Processes 94 (2004) 74–85
serious than vaccine side effects. The study used a scaleon which subjects had to indicate a risk premium for
vaccination, i.e., the maximum risk of vaccination at
which they would vaccinate. When the top of the scale
was identical to the risk of the disease (10 in 10,000),
subjects tended to give responses below the top. But
when the scale was extended to double the risk of the
disease (20 in 10,000), subjects often went beyond 10,
thus supporting CR’s criticism of the use of a limitedscale in some previous studies. It is difficult to deter-
mine, whether Experiment 3 showed action bias on the
average or not; the results are not reported separately
for those who thought that the effects of disease and
vaccine were equally serious. Moreover, it would seem
that the risk ratio (or its logarithm) is the relevant
measure, and this was not computed, and, indeed, the
scale was asymmetric, allowing responses of 0 (infiniteratio) on one side and 21 (ratio of 2.1) on the other.
CR’s Experiment 3 shows that the direction of
matching (vaccine risk to disease or the reverse) matters,
and claims that previous studies used one direction.
However, Asch et al. (1994), contrary to the claim,
preceded the matching task with a simple choice task.
Experiment 3 also does not report on the existence of
action bias in subjects who said that the effects of vac-cine and flu were the same.2
In sum, we have as yet no clear evidence for action
bias for negative outcomes that is not explained by ex-
pectation or (ir)responsibility. Still, we suspect that pure
action bias does exist. In addition to CR’s suggestive
results and those of Patt and Zeckhauser (2000), Spr-
anca et al. (1991, Experiment 4, Footnote 4) reported
that some subjects said that ‘‘it was better to do some-thing rather than await the epidemic [in the scenario]
passively.’’
Normality bias
Prentice and Koehler (2003) argued that people may
perceive inaction as more normal than action. This ex-
planation agrees with the explanation in terms of ex-pectation, which may amount to the same thing. They
report two experiments showing that mock jurors find
physicians more blameworthy (by several measures) and
more liable in the legal sense when the physicians use a
non-standard treatment, compared to a standard one.
(The results of the second experiment are not statisti-
cally significant, but in the same direction.) They ma-
nipulated action/omission by telling subjects that thephysician either switched a patient’s protocol (action) or
did not switch (inaction). This manipulation had no
apparent effect in a between-subject design.
2 The reported follow-up studies provide little new information.
The absence of references to action and omission in open-ended
explanations does not imply that this factor is irrelevant.
Switching vs. not switching has been used in severalprevious demonstrations of the effect of omission bias
(Baron & Ritov, 1994; Kahneman & Tversky, 1982;
Ritov & Baron, 1992). Most of these results make no
distinction between what is normal and what is not. For
example, they involve switching from owning one in-
vestment to owning another, when it is clear that some
people own each. Thus, Prentice and Koehler’s failure to
find an effect may result from their use of a between-subject design, which did not call sufficient attention to
the experimental manipulation. (It is interesting,
though, that the normality effect was significant anyway,
in one study. At least in this context it seems that the
normality manipulation is quite salient.) The kind of
omission bias we have shown is clearly not a form that
disappears when subjects are aware of it. It is a ‘‘bias’’ in
the sense that it deviates from the best outcome, not inthe sense that it deviates from the subjects’ own stan-
dards. The contrast between within-subject and be-
tween-subject designs—if it is real—is, however,
interesting in its own right.3
Experiment 1
We report two new experiments, which address sev-
eral issues. First, does omission bias occur when the
risks of action are equal to those of omission? That is,
when people are given a choice between two options
with equal risks, one of which is ‘‘doing nothing,’’ do
they favor that one. We also ask whether this result is
found in anticipated blame and regret. We also look at
cases in which the action that causes deaths causes fewerdeaths than the alternative option. (Experiment 2 ad-
dresses the general issue of symmetry in another way.)
Second, do people favor what is normal or standard?
Like Prentice and Koehler (2003), we manipulate nor-
mality and omission orthogonally, but within subjects.
Third, is omission bias greater for curing than pre-
venting diseases, as suggested by CR.
Fourth, is action as such the critical difference thataccounts for omission bias, or (as suggested by Royz-
man & Baron, 2002, and by Spranca et al., 1991), is it
the perceived direct causal link between action and bad
outcomes? To answer this question, we compare a
direct-cause condition, an act, to two different indirect-
cause conditions. In the direct-cause condition, a treat-
ment causes harm directly from its side effects. One
indirect-cause condition is an omission: the omission
action vs. inaction on anticipated regret, and, in one experiment, on a
composite evaluation of the decision maker. The composite measure
that showed this effect, however, consisted of ‘‘decision making ability,
along with cautiousness and carefulness.’’ Inactions are more obvi-
ously cautious and careful than they are good as decisions.
J. Baron, I. Ritov / Organizational Behavior and Human Decision Processes 94 (2004) 74–85 79
of a treatment leads to death (or brain damage, inExperiment 2) from disease. The other indirect-cause
condition is a treatment that fails, again leading to harm
from the natural disease. When the indirect-cause con-
dition is an omission, the term ‘‘omission bias’’ has its
usual meaning. We continue to use the term ‘‘omission
bias’’ for a bias toward indirect-cause, however, even
when the indirect-cause item is an act, because we argue
that the distinction between direct and indirect causa-tion accounts for most of the omission bias in general,
and we do not want to change terms at this point.
Method
One-hundred twelve subjects completed a question-
naire on the World Wide Web, for $3 (paid by check, so
that they had to provide their email address, name,address, and, if in the US, their Social Security Num-
ber). They were part of a panel that did other studies.
They ranged in age from 20 to 70 (median 39), and 24%
were male. Previous studies in which more detailed in-
formation was collected from members of this panel
indicated that they were roughly representative of the
U.S. population in education and income (although
both extremes of income were underrepresented).The instructions began:
Medical cases
This is about decisions made about treating and
preventing disease. Imagine that they concern a very
serous viral disease. In each case, imagine that you are a
doctor who must decide which of two options to rec-ommend. The patient will accept your recommendation.
The two options you see each time are the only
treatment options. You cannot switch from one to the
other, for example.
Both options have a risk of death. Sometimes the
death is from the disease, and sometimes it is from the
treatment. When the treatment causes death, it is be-
cause the treatment can cause the disease itself. Thus,death from the treatment and death from the disease are
equally bad.
There are 32 screens, with 3 questions each. The
screens differ in:
• whether the treatment is a vaccine that can prevent
the disease or a drug that can cure it;
• whether the deaths in case of treatment are caused by
the treatment or by its failure to cure or prevent thedisease;
• whether one option is to do nothing;
• the probabilities of death, given as the number of
deaths out of 100,000.
You do not need to answer similar questions the same
way.
An example of a screen (with some options in
brackets) is as follows:
A group of 100,000 people have been exposed to[contracted] a new and serious viral disease.
The standard treatment is to give a vaccine [drug]. If
this were given to all 100,000, it would cause no deaths
from side effects, but 15,000 [10,000; 3000; 2000] would
die from the disease, because the vaccine [drug] is not
completely effective.
The alternative is another vaccine [drug]. If the al-
ternative were given to all 100,000, it would prevent[cure] the disease in all 100,000, but it would cause death
from side effects in 10,000 [2000].
How would you make this decision for your
patient?
• I would choose the standard treatment.
• It is a toss-up.
• I would choose the alternative.
Who do you think would feel more regret if a patientdied?
• A doctor who chose the standard treatment.
• Both would feel the same amount of regret, or no
regret.
• A doctor who chose the alternative.
Who do you think would more likely to be blamed if
a patient died?
• A doctor who chose the standard treatment.• Equally likely, or not likely at all.
• A doctor who chose the alternative.
The experiment consisted of 32 conditions, in a
2� 2� 2� 2� 2 design, in an order chosen at random
for each subject. Each case presented a direct-cause
option, an act that could cause death, and an indirect-
cause option.
• The indirect-cause option was either an imperfectdrug or vaccine or no treatment (an omission), e.g.,
‘‘The standard treatment is to do nothing. If nothing
were done for the group of 100,000, 10,000 would
die. . .’’• The number of deaths from the direct-cause treat-
ment (act) was either 2000 or 10,000.
• The number of deaths from the indirect-cause condi-
tion (either an omission or a treatment that failed)was either the same as the number of deaths from
the treatment that caused deaths (on half the trials)
or 50% more (e.g., 15,000 when the other number
was 10,000).
• The standard treatment was either direct-cause (un-
like the example above) or indirect-cause. The stan-
dard treatment was always presented first.
• The treatment was either a vaccine that prevents thedisease or a drug that cures it.
Because each question had three answers, one of
which was neutral, we treated all measures as 1 (favoring
the hypothesis of omission bias or normality), 0, or )1(opposing the hypothesis). We calculated the mean score
for each subject of the relevant cases. The means thus
ranged from 1 to )1.
80 J. Baron, I. Ritov / Organizational Behavior and Human Decision Processes 94 (2004) 74–85
Results
Omission bias when consequences of both options are the
same
Choice. When the consequences of the two options
were the same, the choice question showed omission bias
on the average (mean 0.09, t111 ¼ 2:57, p ¼ :0114). Therewas no significant difference between ‘‘cure’’ and ‘‘pre-
vent’’ (vaccinate) in the magnitude of the bias (0.10 and0.08, respectively), no significant difference between
treatment failure and omission as indirect causes of
death (0.11 and 0.08, respectively), and no effect of
probability (.09 with both probability levels).
Blame and regret. The corresponding bias for the
blame and regret questions was smaller and not signifi-
cant overall (means of 0.05 and 0.04, respectively), but
the mean of all three questions (choice, blame, and re-gret) was still significant overall (t111 ¼ 2:44, p ¼ :0161).Because the blame and regret questions were highly
correlated, they were combined for analysis. (The main
difference was that regret had more ‘‘equally likely’’ re-
sponses: 82 vs. 69%.)
The blame-regret questions, like the choice question,
showed no significant effect of cure vs. prevent, but,
unlike the choice question, they showed a large effect ofwhether the indirect option was ‘‘do nothing’’ (omis-
sion) or treatment failure (action). Omission bias was
higher for the treatment-failure items than for the
omission items (means of 0.10 and )0.01, respectively;t111 ¼ 3:83, p ¼ :0002), and it was significant for the
treatment-failure items alone (t111 ¼ 3:83, p ¼ :0002). Incomments, some subjects said that they thought that a
doctor ought to do something. But when both optionsinvolved action, the causal role of one option in causing
death led to greater regret and blame. Thus, some sub-
jects seem to think of a doctor ‘‘doing nothing’’ as
blameworthy and regrettable. The blame and regret
questions showed no effects of probability (number of
deaths in the base case).4
Omission bias when the indirect-cause option leads to
more deaths
Choice. When the indirect-cause option led to more
deaths than the direct-cause option (e.g., 15,000 com-
pared to 10,000), subjects generally preferred the direct-
cause option (the action), as shown in much lower scores
on omission bias: )0.74, where )1 would represent al-
ways choosing the best consequences.
The scores on these items were higher (less in favorof the direct-cause option) for the cure items than for
the prevent items ().72 vs. ).76, t111 ¼ 2:39,p ¼ 0:0184); we cannot explain this difference. The na-
4 The pattern of results and statistical significance described in this
paragraph was also found in another study, which we do not report
because of flaws in a part of the design that does not affect this pattern.
ture of the indirect option (treatment failure or omis-sion) had no effect. The scores were also higher for the
low probability items than for the high probability
items ().72 vs. ).76, t111 ¼ 2:12, p ¼ :0359). This
probability effect might be explained in terms of ex-
pectations. High probability of the bad outcome makes
it more expected, therefore less bad (although it is hard
to say this about death). At the same time if the better
outcome occurs it generates more extreme good feel-ings. The difference (in negative emotions) between a
bad outcome of omission and of action may be out-
weighed by the difference (in positive emotions) of a
good outcome of action and of omission. Alternatively,
it could more simply be the case that in general, the
greater the risk of a bad outcome the more people feel
that they have to do something about it.
Blame and regret. The results for blame and regret(again, combined) for these items (where the direct-
cause option lead to fewer deaths) also showed a strong
effect of less blame and regret for the direct-cause option
(mean ).28, t111 ¼ �6:26, p ¼ :0000). Blame and regret
showed no effect of probability and cure vs. prevent. But
blame/regret for the direct option was relatively greater
when the indirect option was treatment failure than
when it was omission ().24 vs. ).32, t111 ¼ 3:42,p ¼ :0009). This result parallels the result in the equal-
consequences condition.
Normality
We found no significant normality effect for choice.
The mean score was 0.01 (t111 ¼ 1:08). There was also no
effect for regret (mean 0.01). However, we did find a
normality effect for blame (0.03, t111 ¼ 2:44, p ¼ :0163—and the combined effect for all three measures was also
significant: t111 ¼ 2:50, p ¼ :0139).
Individual differences
Although subjects strongly favored action on these
items (where action led to better consequences), a few
subjects seemed to show consistent omission bias even
when the consequences were worse. Other subjectsseemed to show an action bias even when consequences
were equal, going against the mean results. To test
whether any subjects showed significant action bias, we
carried out a t test for each subject and then adjusted the
p-levels for multiple tests, using the step-down resam-
pling procedure of Westfall and Young (1993) as im-
plemented by Dudoit and Ge (2003).
Same consequences. By this test, 6 subjects showedsignificant action bias at p < :05 (one tailed—p ¼ :0132for the weakest of these 6), compared to 14 subjects who
showed significant omission bias (again, one tailed, with
p ¼ :0368 for the weakest).
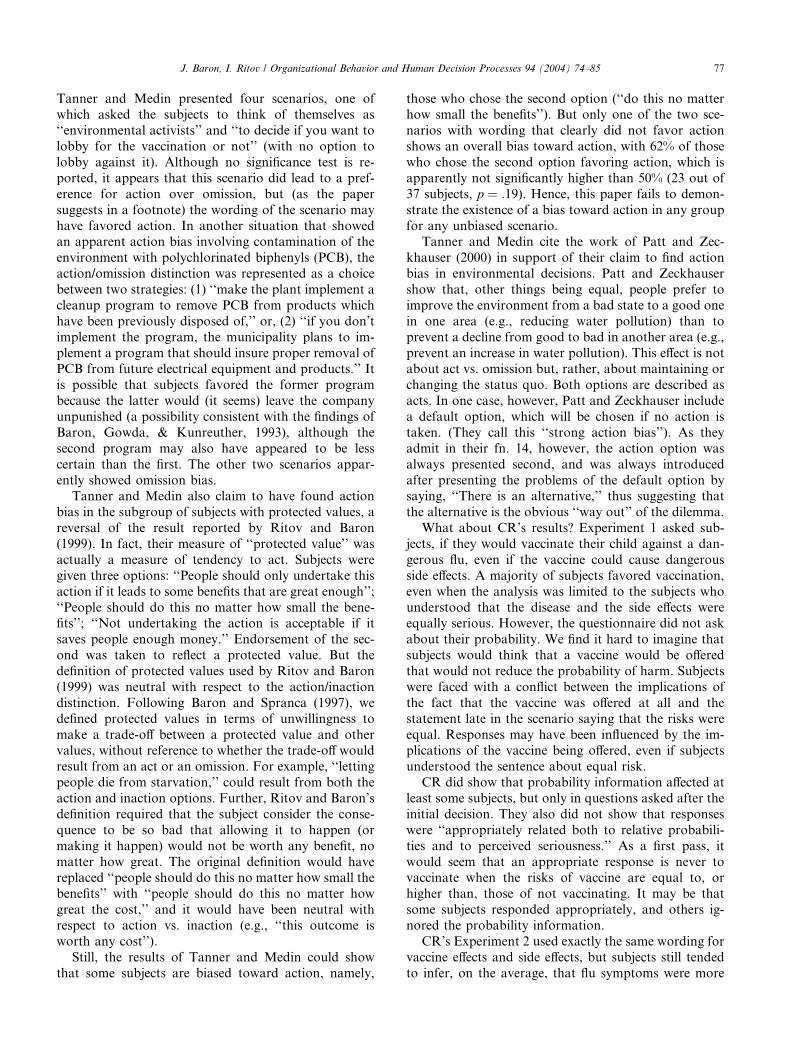
To display these result graphically, we treated the
experiment as a test with 16 items, and we estimated
each subject’s true score, that is the mean of the 16
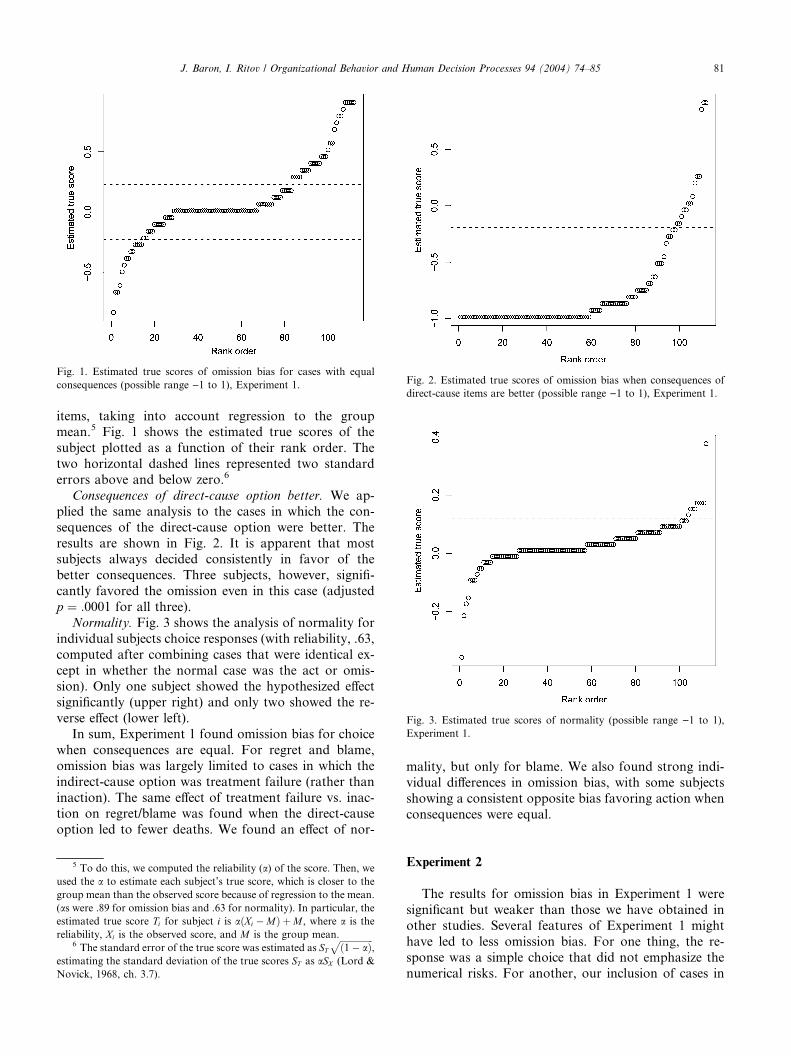
Fig. 1. Estimated true scores of omission bias for cases with equal
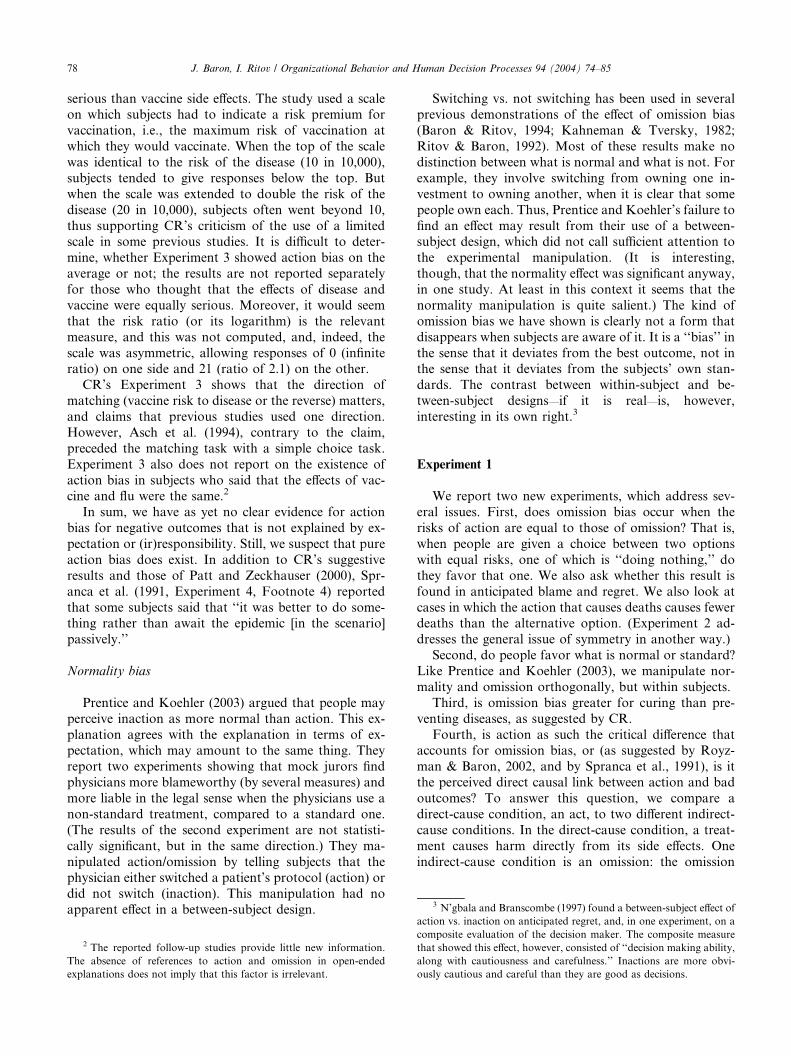
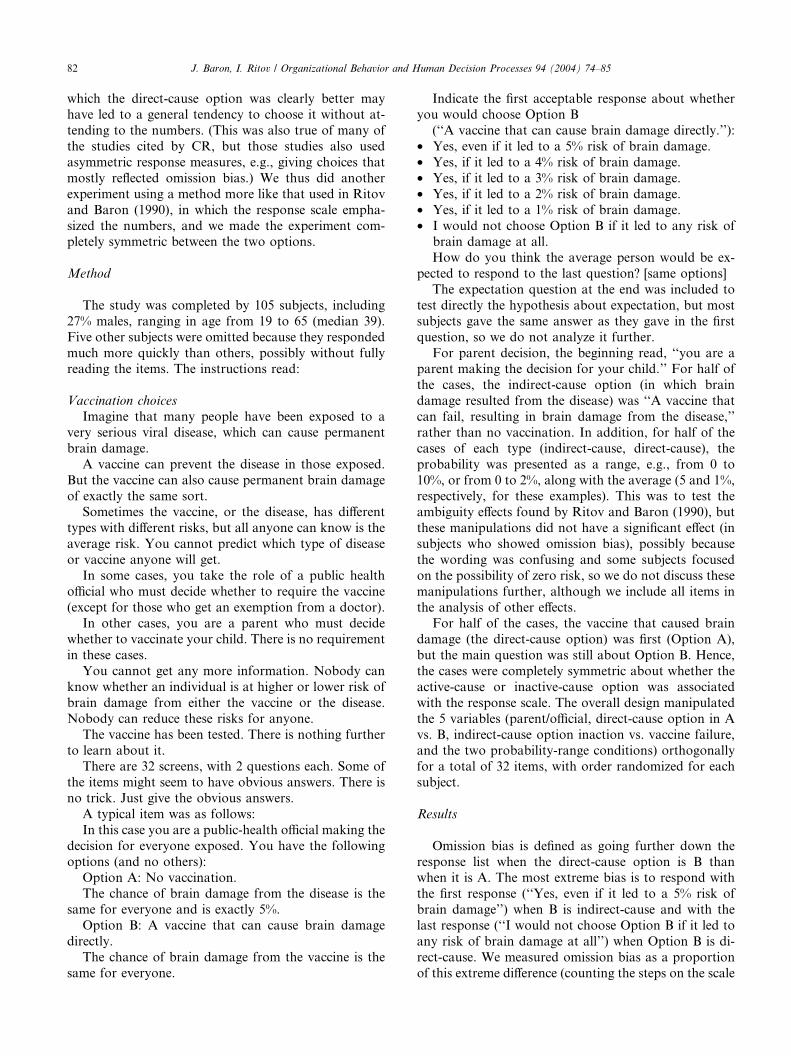
consequences (possible range )1 to 1), Experiment 1. Fig. 2. Estimated true scores of omission bias when consequences of
direct-cause items are better (possible range )1 to 1), Experiment 1.
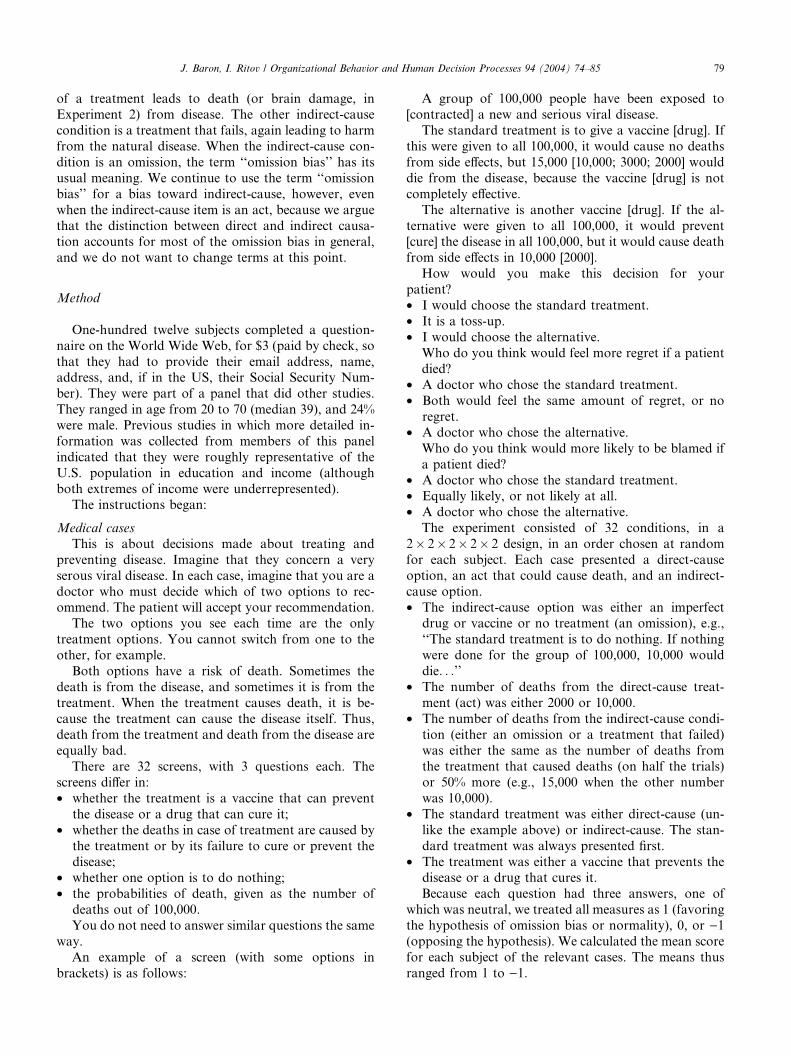
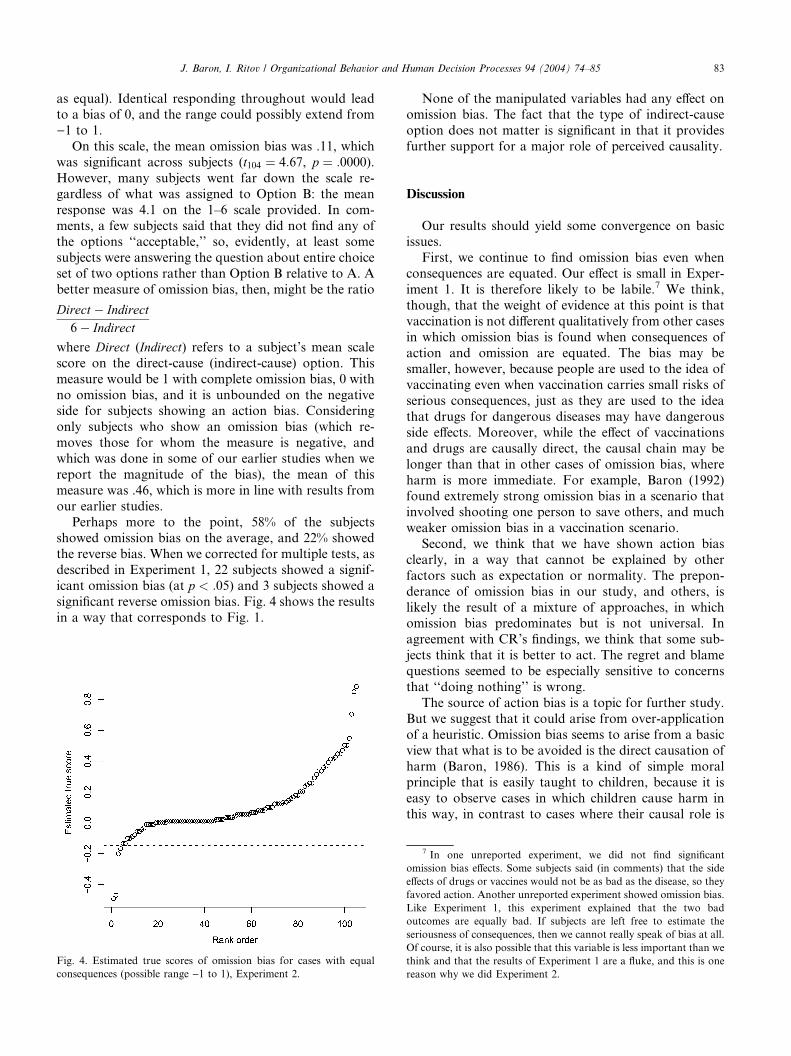
Fig. 3. Estimated true scores of normality (possible range )1 to 1),
Experiment 1.
J. Baron, I. Ritov / Organizational Behavior and Human Decision Processes 94 (2004) 74–85 81
items, taking into account regression to the groupmean.5 Fig. 1 shows the estimated true scores of the
subject plotted as a function of their rank order. The
two horizontal dashed lines represented two standard
errors above and below zero.6
Consequences of direct-cause option better. We ap-
plied the same analysis to the cases in which the con-
sequences of the direct-cause option were better. The
results are shown in Fig. 2. It is apparent that mostsubjects always decided consistently in favor of the
better consequences. Three subjects, however, signifi-
cantly favored the omission even in this case (adjusted
p ¼ :0001 for all three).
Normality. Fig. 3 shows the analysis of normality for
individual subjects choice responses (with reliability, .63,
computed after combining cases that were identical ex-
cept in whether the normal case was the act or omis-sion). Only one subject showed the hypothesized effect
significantly (upper right) and only two showed the re-
verse effect (lower left).
In sum, Experiment 1 found omission bias for choice
when consequences are equal. For regret and blame,
omission bias was largely limited to cases in which the
indirect-cause option was treatment failure (rather than
inaction). The same effect of treatment failure vs. inac-tion on regret/blame was found when the direct-cause
option led to fewer deaths. We found an effect of nor-
5 To do this, we computed the reliability (a) of the score. Then, weused the a to estimate each subject’s true score, which is closer to the
group mean than the observed score because of regression to the mean.
(as were .89 for omission bias and .63 for normality). In particular, the
estimated true score Ti for subject i is aðXi �MÞ þM , where a is the
reliability, Xi is the observed score, and M is the group mean.6 The standard error of the true score was estimated as ST
ffiffiffiffiffiffiffiffiffiffiffiffiffiffiffið1� aÞ
p,
estimating the standard deviation of the true scores ST as aSX (Lord &
Novick, 1968, ch. 3.7).
mality, but only for blame. We also found strong indi-
vidual differences in omission bias, with some subjects
showing a consistent opposite bias favoring action when
consequences were equal.
Experiment 2
The results for omission bias in Experiment 1 were
significant but weaker than those we have obtained in
other studies. Several features of Experiment 1 might
have led to less omission bias. For one thing, the re-
sponse was a simple choice that did not emphasize the
numerical risks. For another, our inclusion of cases in
82 J. Baron, I. Ritov / Organizational Behavior and Human Decision Processes 94 (2004) 74–85
which the direct-cause option was clearly better mayhave led to a general tendency to choose it without at-
tending to the numbers. (This was also true of many of
the studies cited by CR, but those studies also used
asymmetric response measures, e.g., giving choices that
mostly reflected omission bias.) We thus did another
experiment using a method more like that used in Ritov
and Baron (1990), in which the response scale empha-
sized the numbers, and we made the experiment com-pletely symmetric between the two options.
Method
The study was completed by 105 subjects, including
27% males, ranging in age from 19 to 65 (median 39).
Five other subjects were omitted because they responded
much more quickly than others, possibly without fullyreading the items. The instructions read:
Vaccination choices
Imagine that many people have been exposed to a
very serious viral disease, which can cause permanent
brain damage.
A vaccine can prevent the disease in those exposed.
But the vaccine can also cause permanent brain damage
of exactly the same sort.Sometimes the vaccine, or the disease, has different
types with different risks, but all anyone can know is the
average risk. You cannot predict which type of disease
or vaccine anyone will get.
In some cases, you take the role of a public health
official who must decide whether to require the vaccine
(except for those who get an exemption from a doctor).
In other cases, you are a parent who must decidewhether to vaccinate your child. There is no requirement
in these cases.
You cannot get any more information. Nobody can
know whether an individual is at higher or lower risk of
brain damage from either the vaccine or the disease.
Nobody can reduce these risks for anyone.
The vaccine has been tested. There is nothing further
to learn about it.There are 32 screens, with 2 questions each. Some of
the items might seem to have obvious answers. There is
no trick. Just give the obvious answers.
A typical item was as follows:
In this case you are a public-health official making the
decision for everyone exposed. You have the following
options (and no others):
Option A: No vaccination.The chance of brain damage from the disease is the
same for everyone and is exactly 5%.
Option B: A vaccine that can cause brain damage
directly.
The chance of brain damage from the vaccine is the
same for everyone.
Indicate the first acceptable response about whetheryou would choose Option B
(‘‘A vaccine that can cause brain damage directly.’’):
• Yes, even if it led to a 5% risk of brain damage.
• Yes, if it led to a 4% risk of brain damage.
• Yes, if it led to a 3% risk of brain damage.
• Yes, if it led to a 2% risk of brain damage.
• Yes, if it led to a 1% risk of brain damage.
• I would not choose Option B if it led to any risk ofbrain damage at all.
How do you think the average person would be ex-
pected to respond to the last question? [same options]
The expectation question at the end was included to
test directly the hypothesis about expectation, but most
subjects gave the same answer as they gave in the first
question, so we do not analyze it further.
For parent decision, the beginning read, ‘‘you are aparent making the decision for your child.’’ For half of
the cases, the indirect-cause option (in which brain
damage resulted from the disease) was ‘‘A vaccine that
can fail, resulting in brain damage from the disease,’’
rather than no vaccination. In addition, for half of the
cases of each type (indirect-cause, direct-cause), the
probability was presented as a range, e.g., from 0 to
10%, or from 0 to 2%, along with the average (5 and 1%,respectively, for these examples). This was to test the
ambiguity effects found by Ritov and Baron (1990), but
these manipulations did not have a significant effect (in
subjects who showed omission bias), possibly because
the wording was confusing and some subjects focused
on the possibility of zero risk, so we do not discuss these
manipulations further, although we include all items in
the analysis of other effects.For half of the cases, the vaccine that caused brain
damage (the direct-cause option) was first (Option A),
but the main question was still about Option B. Hence,
the cases were completely symmetric about whether the
active-cause or inactive-cause option was associated
with the response scale. The overall design manipulated
the 5 variables (parent/official, direct-cause option in A
vs. B, indirect-cause option inaction vs. vaccine failure,and the two probability-range conditions) orthogonally
for a total of 32 items, with order randomized for each
subject.
Results
Omission bias is defined as going further down the
response list when the direct-cause option is B thanwhen it is A. The most extreme bias is to respond with
the first response (‘‘Yes, even if it led to a 5% risk of
brain damage’’) when B is indirect-cause and with the
last response (‘‘I would not choose Option B if it led to
any risk of brain damage at all’’) when Option B is di-
rect-cause. We measured omission bias as a proportion
of this extreme difference (counting the steps on the scale
J. Baron, I. Ritov / Organizational Behavior and Human Decision Processes 94 (2004) 74–85 83
as equal). Identical responding throughout would leadto a bias of 0, and the range could possibly extend from
)1 to 1.
On this scale, the mean omission bias was .11, which
was significant across subjects (t104 ¼ 4:67, p ¼ :0000).However, many subjects went far down the scale re-
gardless of what was assigned to Option B: the mean
response was 4.1 on the 1–6 scale provided. In com-
ments, a few subjects said that they did not find any ofthe options ‘‘acceptable,’’ so, evidently, at least some
subjects were answering the question about entire choice
set of two options rather than Option B relative to A. A
better measure of omission bias, then, might be the ratio
Direct � Indirect6� Indirect
where Direct (Indirect) refers to a subject’s mean scale
score on the direct-cause (indirect-cause) option. This
measure would be 1 with complete omission bias, 0 with
no omission bias, and it is unbounded on the negativeside for subjects showing an action bias. Considering
only subjects who show an omission bias (which re-
moves those for whom the measure is negative, and
which was done in some of our earlier studies when we
report the magnitude of the bias), the mean of this
measure was .46, which is more in line with results from
our earlier studies.
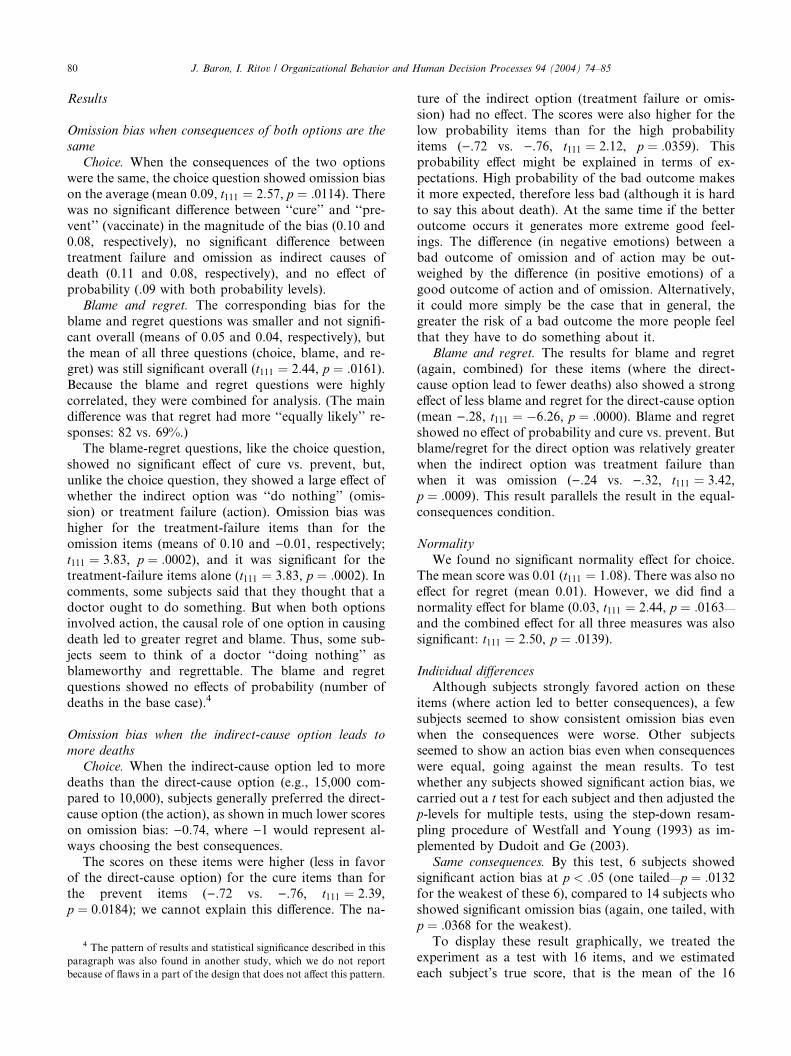
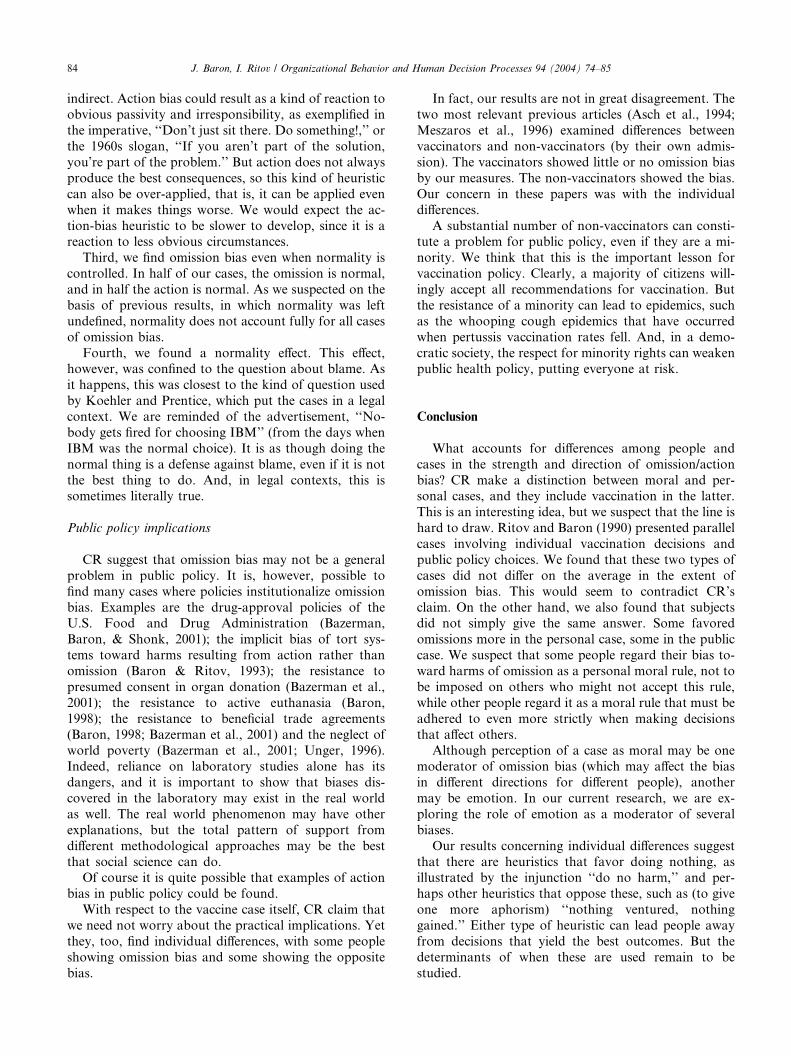
Perhaps more to the point, 58% of the subjectsshowed omission bias on the average, and 22% showed
the reverse bias. When we corrected for multiple tests, as
described in Experiment 1, 22 subjects showed a signif-
icant omission bias (at p < :05) and 3 subjects showed a
significant reverse omission bias. Fig. 4 shows the results
in a way that corresponds to Fig. 1.
Fig. 4. Estimated true scores of omission bias for cases with equal
consequences (possible range )1 to 1), Experiment 2.
None of the manipulated variables had any effect onomission bias. The fact that the type of indirect-cause
option does not matter is significant in that it provides
further support for a major role of perceived causality.
Discussion
Our results should yield some convergence on basicissues.
First, we continue to find omission bias even when
consequences are equated. Our effect is small in Exper-
iment 1. It is therefore likely to be labile.7 We think,
though, that the weight of evidence at this point is that
vaccination is not different qualitatively from other cases
in which omission bias is found when consequences of
action and omission are equated. The bias may besmaller, however, because people are used to the idea of
vaccinating even when vaccination carries small risks of
serious consequences, just as they are used to the idea
that drugs for dangerous diseases may have dangerous
side effects. Moreover, while the effect of vaccinations
and drugs are causally direct, the causal chain may be
longer than that in other cases of omission bias, where
harm is more immediate. For example, Baron (1992)found extremely strong omission bias in a scenario that
involved shooting one person to save others, and much
weaker omission bias in a vaccination scenario.
Second, we think that we have shown action bias
clearly, in a way that cannot be explained by other
factors such as expectation or normality. The prepon-
derance of omission bias in our study, and others, is
likely the result of a mixture of approaches, in whichomission bias predominates but is not universal. In
agreement with CR’s findings, we think that some sub-
jects think that it is better to act. The regret and blame
questions seemed to be especially sensitive to concerns
that ‘‘doing nothing’’ is wrong.
The source of action bias is a topic for further study.
But we suggest that it could arise from over-application
of a heuristic. Omission bias seems to arise from a basicview that what is to be avoided is the direct causation of
harm (Baron, 1986). This is a kind of simple moral
principle that is easily taught to children, because it is
easy to observe cases in which children cause harm in
this way, in contrast to cases where their causal role is
7 In one unreported experiment, we did not find significant
omission bias effects. Some subjects said (in comments) that the side
effects of drugs or vaccines would not be as bad as the disease, so they
favored action. Another unreported experiment showed omission bias.
Like Experiment 1, this experiment explained that the two bad
outcomes are equally bad. If subjects are left free to estimate the
seriousness of consequences, then we cannot really speak of bias at all.
Of course, it is also possible that this variable is less important than we
think and that the results of Experiment 1 are a fluke, and this is one
reason why we did Experiment 2.
84 J. Baron, I. Ritov / Organizational Behavior and Human Decision Processes 94 (2004) 74–85
indirect. Action bias could result as a kind of reaction toobvious passivity and irresponsibility, as exemplified in
the imperative, ‘‘Don’t just sit there. Do something!,’’ or
the 1960s slogan, ‘‘If you aren’t part of the solution,
you’re part of the problem.’’ But action does not always
produce the best consequences, so this kind of heuristic
can also be over-applied, that is, it can be applied even
when it makes things worse. We would expect the ac-
tion-bias heuristic to be slower to develop, since it is areaction to less obvious circumstances.
Third, we find omission bias even when normality is
controlled. In half of our cases, the omission is normal,
and in half the action is normal. As we suspected on the
basis of previous results, in which normality was left
undefined, normality does not account fully for all cases
of omission bias.
Fourth, we found a normality effect. This effect,however, was confined to the question about blame. As
it happens, this was closest to the kind of question used
by Koehler and Prentice, which put the cases in a legal
context. We are reminded of the advertisement, ‘‘No-
body gets fired for choosing IBM’’ (from the days when
IBM was the normal choice). It is as though doing the
normal thing is a defense against blame, even if it is not
the best thing to do. And, in legal contexts, this issometimes literally true.
Public policy implications
CR suggest that omission bias may not be a general
problem in public policy. It is, however, possible to
find many cases where policies institutionalize omission
bias. Examples are the drug-approval policies of theU.S. Food and Drug Administration (Bazerman,
Baron, & Shonk, 2001); the implicit bias of tort sys-
tems toward harms resulting from action rather than
omission (Baron & Ritov, 1993); the resistance to
presumed consent in organ donation (Bazerman et al.,
2001); the resistance to active euthanasia (Baron,
1998); the resistance to beneficial trade agreements
(Baron, 1998; Bazerman et al., 2001) and the neglect ofworld poverty (Bazerman et al., 2001; Unger, 1996).
Indeed, reliance on laboratory studies alone has its
dangers, and it is important to show that biases dis-
covered in the laboratory may exist in the real world
as well. The real world phenomenon may have other
explanations, but the total pattern of support from
different methodological approaches may be the best
that social science can do.Of course it is quite possible that examples of action
bias in public policy could be found.
With respect to the vaccine case itself, CR claim that
we need not worry about the practical implications. Yet
they, too, find individual differences, with some people
showing omission bias and some showing the opposite
bias.
In fact, our results are not in great disagreement. Thetwo most relevant previous articles (Asch et al., 1994;
Meszaros et al., 1996) examined differences between
vaccinators and non-vaccinators (by their own admis-
sion). The vaccinators showed little or no omission bias
by our measures. The non-vaccinators showed the bias.
Our concern in these papers was with the individual
differences.
A substantial number of non-vaccinators can consti-tute a problem for public policy, even if they are a mi-
nority. We think that this is the important lesson for
vaccination policy. Clearly, a majority of citizens will-
ingly accept all recommendations for vaccination. But
the resistance of a minority can lead to epidemics, such
as the whooping cough epidemics that have occurred
when pertussis vaccination rates fell. And, in a demo-
cratic society, the respect for minority rights can weakenpublic health policy, putting everyone at risk.
Conclusion
What accounts for differences among people and
cases in the strength and direction of omission/action
bias? CR make a distinction between moral and per-sonal cases, and they include vaccination in the latter.
This is an interesting idea, but we suspect that the line is
hard to draw. Ritov and Baron (1990) presented parallel
cases involving individual vaccination decisions and
public policy choices. We found that these two types of
cases did not differ on the average in the extent of
omission bias. This would seem to contradict CR’s
claim. On the other hand, we also found that subjectsdid not simply give the same answer. Some favored
omissions more in the personal case, some in the public
case. We suspect that some people regard their bias to-
ward harms of omission as a personal moral rule, not to
be imposed on others who might not accept this rule,
while other people regard it as a moral rule that must be
adhered to even more strictly when making decisions
that affect others.Although perception of a case as moral may be one
moderator of omission bias (which may affect the bias
in different directions for different people), another
may be emotion. In our current research, we are ex-
ploring the role of emotion as a moderator of several
biases.
Our results concerning individual differences suggest
that there are heuristics that favor doing nothing, asillustrated by the injunction ‘‘do no harm,’’ and per-
haps other heuristics that oppose these, such as (to give
one more aphorism) ‘‘nothing ventured, nothing
gained.’’ Either type of heuristic can lead people away
from decisions that yield the best outcomes. But the
determinants of when these are used remain to be
studied.
J. Baron, I. Ritov / Organizational Behavior and Human Decision Processes 94 (2004) 74–85 85
References
Asch, D., Baron, J., Hershey, J. C., Kunreuther, H., Meszaros, J.,
Ritov, I., & Spranca, M. (1994). Determinants of resistance to
pertussis vaccination. Medical Decision Making, 14, 118–123.
Ayanian, J. Z., & Berwick, D. M. (1991). Do physicians have a bias
toward action? Medical Decision Making, 11, 154–158.
Baron, J. (1986). Tradeoffs among reasons for action. Journal for the
Theory of Social Behavior, 16, 173–195.
Baron, J. (1992). The effect of normative beliefs on anticipated emotions.
Journal of Personality and Social Psychology, 63, 320–330.
Baron, J. (1996). Do no harm. In D. M. Messick & A. E. Tenbrunsel
(Eds.), Codes of conduct: Behavioral research into business ethics
(pp. 197–213). New York: Russell Sage Foundation.
Baron, J. (1998). Judgment misguided: Intuition and error in public
decision making. New York: Oxford University Press.
Baron, J., Gowda, R., & Kunreuther, H. (1993). Attitudes toward
managing hazardous waste: What should be cleaned up and who
should pay for it? Risk Analysis, 13, 183–192.
Baron, J., & Leshner, S. (2000). How serious are expressions of
protected values. Journal of Experimental Psychology: Applied, 6,
183–194.
Baron, J., & Ritov, I. (1993). Intuitions about penalties and compen-
sation in the context of tort law. Journal of Risk and Uncertainty, 7,
17–33.
Baron, J., & Ritov, I. (1994). Reference points and omission bias.
Organizational Behavior andHumanDecisionProcesses, 59, 475–498.
Baron, J., & Spranca, M. (1997). Protected values. Organizational
Behavior and Human Decision Processes, 70, 1–16 (Reprinted in M.
Bazerman [Ed.], Negotiation, Decision Making and Conflict Man-
agement. Cheltenham, UK: Edward Elgar, 2003).
Bazerman, M. H., Baron, J., & Shonk, K. (2001). You can’t enlarge the
pie: The psychology of ineffective government. New York: Basic
Books.
Cohen, B. J., & Pauker, S. G. (1994). How do physicians weigh
iatrogenic complications? Journal of General Internal Medicine, 9,
20–23.
Connolly, T., & Reb, J. (2003). Omission bias in vaccination decisions:
Where’s the ‘‘omission’’? Where’s the ‘‘bias’’? Organizational
Behavior and Human Decision Processes, 91, 186–202.
Dudoit, S., & Ge, Y. (2003). Bioconductor R packages for multiple
hypothesis testing: multtest. Available: http://www.bioconduc-
tor.org.
Franklin, B. (1771–1778). The autobiography of Benjamin Franklin
Electronic Text Center, University of Virginia Library. Available:
http://etext.lib.virginia.edu/toc/modeng/public/Fra2Aut.html.
Gleicher, F., Kost, K. A., Baker, S. M., Strathman, A. J., Richman, S.
A., & Sherman, S. J. (1990). The role of counterfactual thinking in
judgments of affect. Personality and Social Psychology Bulletin, 16,
284–295.
Haidt, J., & Baron, J. (1996). Social roles and the moral judgment of
acts and omissions. European Journal of Social Psychology, 26,
201–218.
Kahneman, D., & Tversky, A. (1982). The psychology of preferences.
Scientific American, 246, 160–173.
Landman, J. (1987). Regret and elation following action and inaction:
Affective responses to positive versus negative outcomes. Person-
ality and Social Psychology Bulletin, 13, 524–536.
Lord, F. M., & Novick, M. R. (1968). Statistical theories of mental test
scores. Reading, MA: Addison-Wesley.
Meszaros, J. R., Asch, D. A., Baron, J., Hershey, J. C., Kunreuther,
H., & Schwartz-Buzaglo, J. (1996). Cognitive processes and the
decisions of some parents to forego pertussis vaccination for their
children. Journal of Clinical Epidemiology, 49, 697–703.
N’gbala, A., & Branscombe, A. (1997). When does action elicit more
regret than inaction and is counterfactual mutation the mediator of
this effect? Journal of Experimental Social Psychology, 33, 324–343.
Patt, A., & Zeckhauser, R. (2000). Action bias and environmental
decisions. Journal of Risk and Uncertainty, 21, 45–72.
Petrinovich, L., & O’Neill, P. (1996). Influence of wording and framing
effects on moral intuitions. Ethology and Sociobiology, 17, 145–171.
Prentice, R. A., & Koehler, J. J. (2003). A normality bias in legal
decision making. Cornell Law Review, 88, 583–650.
Ritov, I., & Baron, J. (1990). Reluctance to vaccinate: Omission bias
and ambiguity. Journal of Behavioral Decision Making, 3, 263–277.
Ritov, I., & Baron, J. (1992). Status-quo and omission bias. Journal of
Risk and Uncertainty, 5, 49–61.
Ritov, I., & Baron, J. (1994). Judgments of compensation for
misfortune: The role of expectation. European Journal of Social
Psychology, 24, 525–539.
Ritov, I., & Baron, J. (1995). Outcome knowledge, regret, and
omission bias. Organizational Behavior and Human Decision
Processes, 64, 119–127.
Ritov, I., & Baron, J. (1999). Protected values and omission bias.
Organizational Behavior and Human Decision Processes, 79, 79–94.
Royzman, E. B., & Baron, J. (2002). The preference for indirect harm.
Social Justice Research, 15, 165–184.
Schweitzer, M. (1994). Disentangling status quo and omission effects:
Experimental evidence. Organizational Behavior and Human Deci-
sion Processes, 58, 457–476.
Spranca, M., Minsk, E., & Baron, J. (1991). Omission and commission
in judgment and choice. Journal of Experimental Social Psychology,
27, 76–105.
Tanner, C., & Medin, D. L. (in press). Protected values: No omission
bias and no framing effects. Psychonomic Bulletin and Review.
Unger, P. (1996). Living high and letting die: Our illusion of innocence.
Oxford: Oxford University Press.
Westfall, P. H., & Young, S. S. (1993). Resampling-based multiple
testing: Examples and methods for p-value adjustment. New York:
John Wiley & Sons.
Zeelenberg, M., van den Bos, K., van Dijk, E., & Pieters, R. (2002).
The inaction effect in the psychology of regret. Journal of
Personality and Social Psychology, 82, 314–327.
Zeelenberg, M., van der Pligt, J., & de Vries, N. K. (2000).
Attributions of responsibility and affective reactions to decision
outcomes. Acta Psychologica, 104, 303–315.