Embed Size (px)
Citation preview

Fiscal Year ended June 30, 2012
comprehensive annual Financial report
E x c e l l e n c e i n E d u c a t i o n
Capitol Region Education Council n 111 Charter Oak Avenue, Hartford, CT 06106 n (860) 247-CREC n www.crec.org
PDF processed with CutePDF evaluation edition www.CutePDF.comPDF processed with CutePDF evaluation edition www.CutePDF.com

CAPITOL REGION EDUCATION COUNCILHartford, Connecticut
COMPREHENSIVE ANNUAL FINANCIAL REPORTFOR THE YEAR ENDED JUNE 30, 2012
Capitol Region Education Council111 Charter Oak AvenueHartford, CT 06106860-247-CRECfax [email protected]
Prepared by:Business Services Department
E x c e l l e n c e i n E d u c a t i o n

This page is intentionally left blank

CAPITOL REGION EDUCATION COUNCIL
COMPREHENSIVE ANNUAL FINANCIAL REPORT
JUNE 30, 2012
TABLE OF CONTENTS
Page INTRODUCTORY SECTION Organizational Chart i Mission Statement ii Council Members iii Certificate of Achievement for Excellence in Financial Reporting iv Letter of Transmittal v-xiv FINANCIAL SECTION Independent Auditors’ Report 1-2 Management’s Discussion and Analysis 3-10 Exhibit Basic Financial Statements: Government-Wide Financial Statements: I Statement of Net Assets 11 II Statement of Activities 12 Fund Financial Statements: Governmental Funds: III Balance Sheet 13-14 IV Statement of Revenues, Expenditures and Changes in Fund Balances 15-16 Proprietary Funds: V Statement of Net Assets 17 VI Statement of Revenues, Expenses and Changes in Fund Net Assets 18 VII Statement of Cash Flows 19 Fiduciary Funds: VIII Statement of Fiduciary Net Assets 20 Notes to Financial Statements 21-41 Required Supplementary Information: General Fund and Major Special Revenue Fund: RSI-1 Schedule of Revenues and Expenditures - Budget and Actual 42 Combining and Individual Fund Statements and Schedules: General Fund: A-1 Balance Sheet - By Program 43-48 A-2 Schedule of Revenues, Expenditures and Changes in Fund Balances - By Program 49-54 A-3 Schedule of Revenues and Expenditures - Budget and Actual 55-56
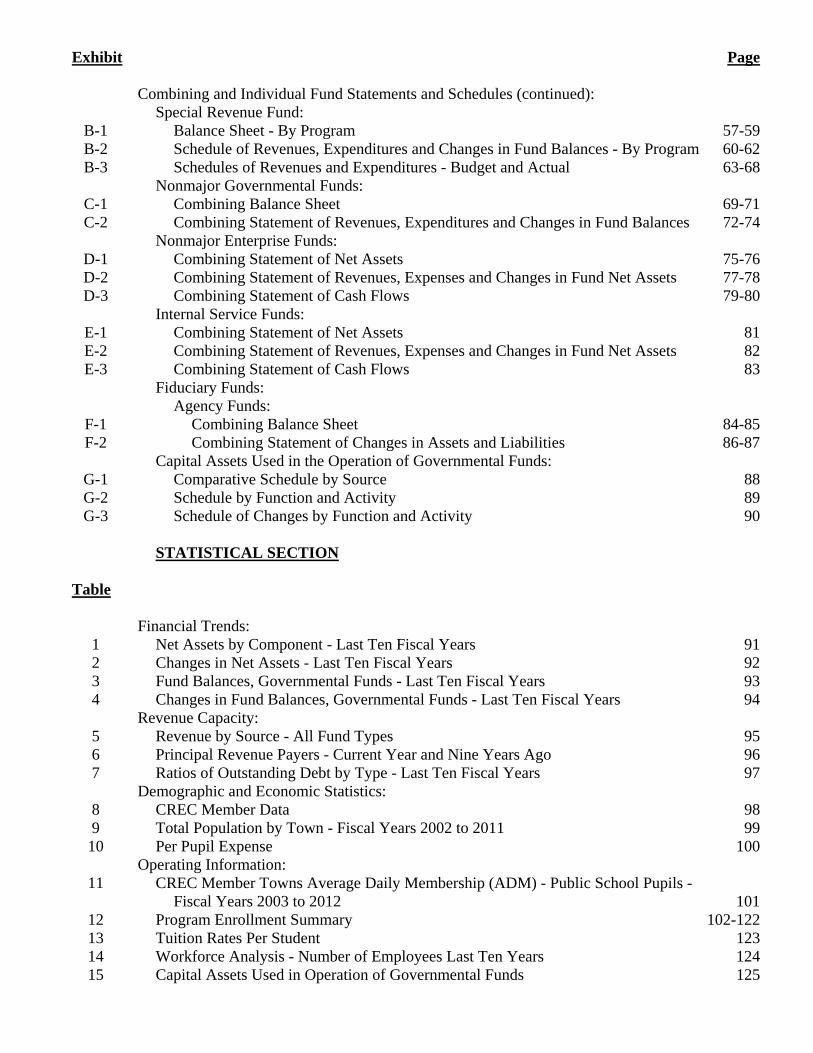
Exhibit Page Combining and Individual Fund Statements and Schedules (continued): Special Revenue Fund: B-1 Balance Sheet - By Program 57-59 B-2 Schedule of Revenues, Expenditures and Changes in Fund Balances - By Program 60-62 B-3 Schedules of Revenues and Expenditures - Budget and Actual 63-68 Nonmajor Governmental Funds: C-1 Combining Balance Sheet 69-71 C-2 Combining Statement of Revenues, Expenditures and Changes in Fund Balances 72-74 Nonmajor Enterprise Funds: D-1 Combining Statement of Net Assets 75-76 D-2 Combining Statement of Revenues, Expenses and Changes in Fund Net Assets 77-78 D-3 Combining Statement of Cash Flows 79-80 Internal Service Funds: E-1 Combining Statement of Net Assets 81 E-2 Combining Statement of Revenues, Expenses and Changes in Fund Net Assets 82 E-3 Combining Statement of Cash Flows 83 Fiduciary Funds: Agency Funds: F-1 Combining Balance Sheet 84-85 F-2 Combining Statement of Changes in Assets and Liabilities 86-87 Capital Assets Used in the Operation of Governmental Funds: G-1 Comparative Schedule by Source 88 G-2 Schedule by Function and Activity 89 G-3 Schedule of Changes by Function and Activity 90 STATISTICAL SECTION Table Financial Trends: 1 Net Assets by Component - Last Ten Fiscal Years 91 2 Changes in Net Assets - Last Ten Fiscal Years 92 3 Fund Balances, Governmental Funds - Last Ten Fiscal Years 93 4 Changes in Fund Balances, Governmental Funds - Last Ten Fiscal Years 94 Revenue Capacity: 5 Revenue by Source - All Fund Types 95 6 Principal Revenue Payers - Current Year and Nine Years Ago 96 7 Ratios of Outstanding Debt by Type - Last Ten Fiscal Years 97 Demographic and Economic Statistics: 8 CREC Member Data 98 9 Total Population by Town - Fiscal Years 2002 to 2011 99 10 Per Pupil Expense 100 Operating Information: 11 CREC Member Towns Average Daily Membership (ADM) - Public School Pupils - Fiscal Years 2003 to 2012 101 12 Program Enrollment Summary 102-122 13 Tuition Rates Per Student 123 14 Workforce Analysis - Number of Employees Last Ten Years 124 15 Capital Assets Used in Operation of Governmental Funds 125

Introductory Section


ii
CREC Mission, Vision, Goal, and Objectives
Mission
To work with boards of education of the Capitol Region to improve the quality of public education for all learners. To achieve its mission, CREC will:
Promote cooperation and collaboration with local school districts and other organizations committed to the improved quality of public education;
Provide cost effective services to member districts and clients;
Listen and respond to client needs for the improved quality of public education; and
Provide leadership in the region through the quality of its services and its ability to identify and share quality services of its member districts and other organizations committed to public education.
Vision
Every student can and shall learn at high levels and therefore must have access to all educational resources of the region through the system of public schools served by CREC. Goal CREC staff and programs will work with local school systems to meet their needs and the needs of students.
Each student in the public schools of the Capitol Region will demonstrate learning at ever higher levels.
Each student in the public schools of the Capitol Region will demonstrate, by the end of grade 3, high levels of literacy.
Each student in the public schools of the Capitol Region will participate in learning environments that more nearly reflect the diversity of the region’s population.
Objectives
To identify the educational needs of CREC member school systems.
To bring together resources to help local school districts.
To solve common problems.
To stimulate local educational activities and develop new CREC programs which address the student goals of the CT Board of Education.
To assist Local Boards of Education in providing a continuum of student services and settings that facilitates the education of all children.
To provide quality direct services to identified students using an array of specialized cooperative, integrated and stand alone settings.
To improve the quality of staff in CREC and its member districts for the purpose of improving learner achievement.
To inform CREC membership, governmental bodies and the community at large about the contribution of CREC to the “Educational Enterprise”.
To achieve continued improvement in the conduct of all CREC internal and external services.
Member Districts
Avon, Berlin, Bloomfield, Bolton, Bristol, Canton, CREC, Cromwell, East Granby, East Hartford, East Windsor, Ellington, Enfield, Farmington, Glastonbury, Granby, Hartford, Hartland, Manchester, New Britain, New Hartford, Newington, Plainville, Portland, Region 10 Burlington and Harwinton , Rocky Hill, Simsbury, Somers, Southington, South Windsor, Suffield, Vernon, West Hartford, Wethersfield, Windsor, and Windsor Locks

2011 - 2012 Governance
Board of Directors Avon - Barbara Zuras Bristol - Christopher C. Wilson Bolton- Dr. John Hambrook, Chair Hartford - Elizabeth Brad Noel Newington - Sharon Braverman Plainville - Becky Tyrrell Southington - Jill Notar-Francesco, Vice Chair West Hartford - Terry Schmitt, Sec/Treasurer Wethersfield -Tristan Stanziale Windsor Locks - TBD
Council Representatives Avon - Barbara Zuras Berlin - John M. Richards Bloomfield - Shirley Thompson Bolton- Dr. John Hambrook Bristol- Christopher C. Wilson Canton- Leslee Hill Cromwell- Shirley Banic East Granby - Jeff Clark East Hartford- Mary Alice Dwyer Hughes East Windsor - John Pica-Sneeden Ellington - Kristen Picard-Wambolt Enfield - Joyce P. Hall Farmington - Mary Grace Reed Glastonbury- Jeremy Grieveson Granby - Cal Heminway Hartford - Elizabeth Brad Noel Hartland- Amy Bourque Manchester - Mary Jane Pazda New Britain - Sharon Beloin-Saavedra New Hartford - TBD Newington - Sharon Braverman Plainville - Becky Tyrrell Portland - Chris Phelps Region 10- Beth Duffy Rocky Hill - Dilip Desai Simsbury- Lydia Tedone Somers - Joan Formeister Southington - Jill Notar-Francesco South Windsor - Sheila Appleton Suffield - Mary Lou Sanborn Vernon- TBD West Hartford - Terry Schmitt Wethersfield- Tristan Stanziale Windsor Locks - TBD Windsor - Paul Panos
CREC Administration Bruce E. Douglas, Ph.D., Executive Director
Sarah J. Barzee, Ph.D., Assistant Executive Director
Donald P. Walsh, Deputy Executive Director Finance & Operations
Denise Gallucci, Deputy Executive Director and Superintendent of Magnet Schools
Regina Terrell, Director of Human Resources
Sandy Cruz-Serrano, Director, Operations
Deborah Richards, Director, Student Services
Dina Crowl, Director of Teaching & Learning
Douglas Casey, Director of Technology Services
Margaret MacDonald, Ph.D., Director, Technical Assistance & Brokering Services
Andrew Tyskiewicz, Director, Community Education, Training and Employment Services
Aura Alvarado, Director, Communications and Community Relations
John Mena, Director, School Construction
iii

This page is intentionally left blank

This page is intentionally left blank.
v
December 10, 2012 To the Board of Directors and Council, Capitol Region Education Council: This is the Comprehensive Annual Financial Report (CAFR) of the Capitol Region Education Council (CREC) for the fiscal year ended June 30, 2012. The purpose of this report is to provide citizens, member boards of education, funders, grantor agencies and other interested parties with reliable financial information about CREC. CREC’s Business Services Division is responsible for both the accuracy of the presented data and the completeness and fairness of the presentation, including all disclosures. We believe that the data presented in this annual report is accurate in all material aspects; it is presented in a manner designed to fairly set forth the financial position and results of operations of CREC, as measured by the financial activity of its funds. The report contains all disclosures necessary to enable the reader to gain an understanding of CREC’s financial affairs. Management’s discussion and analysis (MD&A) immediately follows the independent auditor’s report and provides a narrative introduction, overview, and analysis of the basic financial statements. The MD&A complements this letter of transmittal and should be read in conjunction with it. REPORTING ENTITY CREC is the oldest and largest of Connecticut’s six regional educational service centers (RESCs). CREC is governed by, and serves, its members - 35 public school districts of North Central Connecticut. CREC’s mission is to improve the quality of public education through cooperative programs. CREC was established in 1966 as a cooperative effort of local school districts, organized under the provisions of the Connecticut General Statutes, Section 10-66 a.-n. Pursuant to C.G.S. 10-66c, CREC, as a regional educational service center, is a public educational authority acting on behalf of the State of Connecticut. The Internal Revenue Service has determined CREC to be an organization described in Section 170 (c) (1) of the Code. The Connecticut State Department of Education (SDE) is CREC’s primary regulatory agency. Publicly elected board of education members appointed by each member school district serve on CREC’s Council. The term of office of Council directors may not exceed three years. The Council appoints an executive director to serve as the executive agent of CREC. CREC provides a diverse range of services in education, health and human services. Major services provided to member districts include regional programs providing education and related health services for children with disabilities in the least restrictive environment, magnet schools promoting integrated and quality education, early childhood intervention initiatives, staff development programs and technical assistance services. The financial information provided in the CAFR includes all CREC funds.
vi
ECONOMIC CONDITION AND OUTLOOK The agency’s economic condition is dependent upon the extent to which its primary customers (local boards of education and the State) continue their utilization of CREC services. CREC responds to, and tries to anticipate, the needs of its member districts. CREC’s challenge is to identify and meet the changing and expanding requirements of its region. Through their purchase of CREC’s services, both the State and the local school districts recognize the benefits of delivering educational services on a regional, cooperative basis. CREC’s services remain in demand, even as the State and member school districts continue to address budgetary challenges. CREC’s tradition of providing essential services with the flexibility to develop and modify program offerings based on market factors will continue, and CREC’s consistent and significant growth over the past ten years suggests that growth may continue. FUTURE PLANS Quality and Integrated Education: Public Act 97-290, An Act Enhancing Educational Choices and Opportunities, sets forth the basis for much of the continued growth expected in quality and integrated education program activities. Specifically, this act requires each school district to immediately provide educational opportunities for students to interact with students and teachers from varied racial, ethnic and economic backgrounds and from other communities. CREC has long held quality, integrated education as its primary focus. As a leader in promoting diversity, the application of CREC’s core beliefs, mission, goals and objectives has resulted in tangible progress toward achieving this goal in our region. We expect that our magnet school program, the Choice program, Interdistrict grants and other funding will continue to increase through 2013 and beyond, as the State responds to racial and ethnic isolation in the Capitol Region through the 2008 Settlement Agreement in Sheff v. O’Neill. CREC’s Magnet Schools Division enrollment continues to grow. In 2012-2013, we are operating the Metropolitan Learning Center Magnet School in Bloomfield; the Glastonbury/East Hartford Elementary Magnet School in Glastonbury; the Greater Hartford Academy of the Arts in Hartford; the Greater Hartford Academy of Math and Science in Hartford; the Academy of Aerospace & Engineering in Hartford and Bloomfield; the Montessori Magnet School in Hartford; Two Rivers Magnet Middle School in East Hartford; the University of Hartford Magnet School in Hartford; the Museum Academy (formerly Charter School for Young Children) in Bloomfield; the International Magnet School for Global Citizenship in East Hartford; the Reggio Magnet School of the Arts in Avon; the CREC Public Safety Academy in Enfield, the Medical Professions and Teacher Preparation Academy in Windsor, and the Discovery Academy in Hartford. In 2012-2013 the Greater Hartford Academy of the Arts Elementary school in Bloomfield, Greater Hartford Academy of the Arts Middle school in Hartford and Two Rivers Magnet High School in Hartford were opened. CREC magnet school enrollment has grown to over 6,300 students and our magnet school budgets total $101,247,883. The Magnet Schools Division will continue to grow because of the market demand and benchmarks of the 2008 Sheff agreement. It will continue to retain and attract new students by allowing them to focus on specific talents or interests, while studying a challenging core curriculum of language arts, mathematics, science, social studies and languages in a diverse environment. The CREC Magnet Schools Division is now in the third year of the Federal Magnet School Assistance Program. This grant for $11.5 million supports magnet school development, recruitment and expansion in the region. The Hartford Region Open Choice program continues to serve Hartford students attending schools in 28 suburban districts and suburban students attending schools in the city of Hartford. With funding provided by the Connecticut State Department of Education, the program serves 1,760 students, attending 130 schools in 29 districts for the 2012-2013 school year. Students in the program may remain in their district through high school graduation and are offered the opportunity to participate in all activities at their schools. Support

vii
specialists, as advocates for program participants, work closely with districts to help ensure a successful transition and a positive and enriching educational experience for all students. The Early Beginnings program continues to support preschool and kindergarten children. Middle and high school students are able to take advantage of the Student Support Center, where certified teachers and mentors are available after school to provide assistance with academics, life skills challenges and a new videography program. Elementary and middle school students are encouraged to participate in the Open Choice Summer Academy, which offers exposure to science, math and language arts curriculum and weekly field trips. The Open Choice program initiated several new professional development opportunities for districts to take advantage of including a book club discussion, Welcoming Schools Initiative and the Summer Leadership Institute. The Interdistrict grants program continues to respond to racial and ethnic isolation in the Capitol Region through 13 awarded grants in 2012-2013 totaling $971,508. Community Education Division: The Community Education Division addresses the needs of adults and families in the Capitol Region and beyond through its operation of many community-based programs and by leading several statewide professional development initiatives. Direct service programs provide job-embedded training combining technical and academic skills, GED and literacy training, English as a Second Language classes, family literacy, continuing education and programs for adults facing special challenges. The Division also delivers comprehensive training and technical assistance for Connecticut’s adult educators, college transition programs, an organization for adult learners, K-12 career educators and history teachers, staff of non-profit organizations and corporate employees. The Division also serves as co-manager of the new Capital Region Adult Literacy Partnership. The work of the division extends throughout the region, the state, and beyond Connecticut’s borders, with a diverse clientele from the public and private sectors. Student Services Division: The Student Services Division serves a diverse population of students and their families. While much of the effort has been to ensure the quality of existing programs, there has been significant expansion of programming and services over the past school year. River Street School provides day and extended day and year services to students with autism and significant developmental delays, with a strong emphasis on applied behavioral analysis and a variety of support services based on individual student need. River Street’s annex building, the Marcia Yulo Howard Center for Autism, houses classrooms for younger students transitioning to River Street School, the PASC (Program for the Assessment of Special Children), the Children’s Therapy Services Clinic for children with sensory issues, and also contains the administrative offices for River Street’s Autism Outreach program and the Integrated Program Models (IPM). The Outreach program expanded significantly to serve over 500 children throughout the state. River Street School also worked with the Bureau of Rehabilitation Services to provide job-embedded training to adults. The Farmington Valley Diagnostic Center (FVDC) enhanced its transitional services for students and is providing additional opportunities for community internships and work experiences. In conjunction with the FVDC Advisory Committee, the Center continues to explore the feasibility of the expansion of services for students with social, emotional and behavioral concerns. This past summer, the Center expanded the summer school program to serve younger children in a second location in Simsbury. The Center will be relocated to a state of the art facility in Simsbury in January 2013.

viii
The John J. Allison Jr. Polaris Center expanded the services in its Mental Health Outpatient Clinic to serve young adults ages 18-21 and adults. The Polaris School continues to provide high quality educational and therapeutic services for students with social, emotional and behavioral concerns. The Lincoln Academy served students from ten towns. In addition, the Center has started a new academy serving 5th year students in need of more job- embedded programming and skill development All of the programs under the John J. Allison Jr. Polaris Center umbrella have developed a stronger focus on transition and job-related services, including a large catering business. CREC continues to provide the educational program for the Hartford Juvenile Detention Center (JDC). CREC is working with the educational and residential programs of the JDC to implement Positive Behavioral Interventions and Supports (PBIS) in both settings. Soundbridge continues to provide a continuum of services, including programs for young children who are hearing-impaired, in its state of the art facility, in public school classrooms, and through many consultation services for students in their local districts. In addition, Soundbridge provides audiological services, as well as maintenance of hearing technology, for students throughout the state. This past year, Soundbridge expanded its services to include audiological equipment rental to local school districts. CREC’s Birth to Three and Family Enrichment Programs continue to provide direct service to families and children in the Hartford area. Family Enrichment conducts parent education through instructional sessions and support groups. In response to a request from the Department of Developmental Services’ Birth to Three Program, CREC expanded its Birth to Three Program capacity to serve an additional 100 infants and toddlers with special needs as well as their families. In addition, the Birth to Three Program sponsors professional development sessions for its staff and early interventionists throughout the region. The Division of Student Services received a grant from the State Department of Bureau of Rehabilitation Services (BRS) to hire a Transition Resource Counselor to work with districts and families to prepare students for access to competitive employment, adult service agencies or community resources upon graduation.
Construction Division:
CREC continues to provide school districts with planning, project management, and construction-related services to construct magnet schools, a service which CREC began to offer in 1996. Market demand and CREC’s track record have resulted in our growth in this service area. Our construction staff serves districts throughout Connecticut that are either contemplating or actively engaged in school construction projects. To date, we have served as the sole project manager/owner’s representative on over 22 projects, comprising over $700 million in project costs.
CREC’s construction services range from early master plan development, including education specifications and pre-construction services, to handling the entire construction process as a project/program manager and/or owner’s representative. Our services also provide for verification of compliance with the educational program, financial reporting to the State Department of Education, project closeout and final audit. Our other construction-related services include facility audits, capital replacement plans, feasibility studies, educational specifications development, operations plans, and grant applications.
The City of New London expanded our initial scope of services to now include project management services for both the Nathan Hale Elementary School and the Winthrop Elementary Magnet School. In addition, we recently were selected to be the project managers for West Haven’s high school renovations and East Hampton’s high school renovation projects.
We provided owners representative services to the Town of Glastonbury, as the Glastonbury-East Hartford Elementary Magnet School opened its permanent facility in August, 2012.

ix
We continue to assist Goodwin College by providing project management services for the Connecticut River Academy, the Academy of Advanced Design and Technology, and their Early Childhood School. We also successfully completed our contractual obligations as owner’s representative in Bloomfield for the Laurel School.
We have successfully completed renovations of both the start-up and expansion of facilities for ten magnet schools including the Public Safety Academy, Reggio Arts Magnet, International Magnet School for Global Citizenship, Medical Professions and Teacher Preparation Academy, Museum Academy, Academy of Aerospace & Engineering, Discovery Academy, Greater Hartford Academy of the Arts Middle School, Greater Hartford Academy of the Arts High School and Two Rivers Magnet High School. In addition, we oversee the permanent construction for the first seven schools mentioned above, which involves site acquisition, planning and zoning approval, design oversight, bidding, construction, and closeout. We have submitted grant applications to the State Department of Education for permanent school construction funding approval for the last three schools mentioned above.
Institute of Teaching and Learning: The Institute of Teaching and Learning continues to provide many workshops, consultation services and consortium memberships to meet the needs of our partner districts. The diversely talented staff represents the spectrum of educational experience in all content areas and with all school age groups. Additionally, the staff is well-versed in both national and state initiatives that connect with local district school improvement plans. Apart from its many planned workshops, the Institute can tailor services to meet a school district's particular professional objectives. Teaching and Learning consultants facilitate regional and content-specific curriculum councils. District leaders and department heads in the disciplines of science, math, and language arts meet monthly at CREC to network, share and deepen their knowledge of best practices, identify mutual needs and share resources. Additionally, a robust CREC Curriculum Council for assistant superintendents and curriculum directors meets monthly and is facilitated through CREC T&L. The Institute’s education specialists provide ongoing services to multiple districts in Greater Hartford, community-based preschool programs, and districts outside the Hartford area. Requests for services have included presentations for scheduled professional development days, program evaluations, on-site coaching and modeling for instructional strategies in the areas of literacy, numeracy, science, and Early Childhood education. The Institute also sponsors notable national and international speakers, educational authors and researchers for presentations throughout the school year. The Institute continues to enjoy a dynamic partnership with the Connecticut State Department of Education and the Regional Education Service Centers (RESC) Alliance. The partnership provides direct professional development and technical support to schools and districts that have been designated as needing improvement. The services requested include: data team training and facilitation, support for using protocols to examine student work, implementing effective teaching strategies, differentiating instruction and curriculum development and school climate. The Institute has provided leadership and fiscal management for the Connecticut System for Educator Evaluation and Development (SEED). It provides training to pilot districts and technical assistance to non-pilot districts in the development of teacher and administrator evaluation systems.

x
The Institute has been a leader with a rollout plan for the Common Core State Standards (CCSS). The CREC Common Assessment Consortium (CAC) was established in response to the needs of regional districts to develop standards-driven assessments. The overarching goal is to provide common tools for measuring progress toward the standards that are grade level appropriate, so that all students can achieve at high levels. CAC work and other professional development activities address the new state standards and the “Smarter Balance” performance based assessments. Other work of the Institute includes initiatives for the RESC Minority Teacher Recruiting Alliance, Montessori teacher training, management of Title III activities for CREC districts, professional development for the Sheff Management Plan and Hartford Region Open Choice Programs, Youth and Family Development Projects and school turnaround efforts through our Office for School Transformation. Technical Assistance and Brokering Services Division (TABS): The Technical Assistance and Brokering Services Division continues to respond to the needs of non-profit organizations in the region and around the state by providing high quality, timely, professional learning opportunities, staffing and executive services. TABS is working with other CREC divisions to expand the customer base to non-profit and for-profit organizations nationally and internationally. In addition, TABS has been working to develop new products and services such as the National CREC Leadership Network, The Blueprint for IEP development training curriculum, a Program Review Manual, and training modules for teachers who work with special education ELL students. TABS’ Special Services Support Team (SSST) is in its seventh year of offering Connecticut’s Advanced Alternate Route to Certification Program in Special Education and is approved by the State Department of Education to operate through 2014. This exciting, innovative course of study provides training and practical experiences for certified teachers in order to earn a cross endorsement in special education. This program has been very successful, with an average of 99% of the students completing the program. Districts that are interested in obtaining an independent review of their programs and services, such as special education, RTI (Response to Intervention), secondary transition, early intervention, student achievement, and related services (i.e. speech and language) have sought assistance from CREC’s TABS division. We have provided over 44 reviews throughout Connecticut. TABS has also done feasibility studies for districts considering the reorganization of schools and programs. We have worked closely with five boards of education to provide data, facilitation and problem-solving support in determining school closures. TABS continues to work with the State Department of Education to provide leadership in the training of RESC, SDE and district staff on the COMPASS paraprofessional training curriculum. Since the participants became certified trainers in October 2008, over 2,300 paraprofessionals across the state have been trained in the COMPASS modules. This year, we worked collaboratively with SDE to develop and provide training on a module to enhance instruction using Common Core Standards. The COMPASS modules have sold nationally and internationally. We are in the fourth year of providing an Assistive Technology (AT) Consortium to Connecticut districts and organizations. Membership in the consortium allows the 10 districts currently enrolled to send three staff to six professional development training sessions, receive a quarterly newsletter, and be connected to online discussion groups. AT Consortium members also are entitled to borrow assistive technology equipment from the lending library. The assistive technology library continues to grow, thanks to support from the CT Assistive Technology Project and donations from private vendors. We now can offer iPads that are loaded with useful applications for students with disabilities.

xi
As part of an initiative to assist districts in designing and implementing positive school climate, TABS’ Support Team is providing training to 23 schools and over 70 staff on Positive Behavior Intervention Supports (PBIS). PBIS provides a framework for schools to use that reinforces positive student behavior through changes in school structure and staff behaviors. This is the fourth year of the program, and we have added alternate settings to our customer mix, such as USD 2 and the Juvenile Detention Center. Other professional learning opportunities that TABS provides this year include Leadership Networks on Scientific Research Based Interventions, Special Education and a new network this year for community leaders on School and Community Climate. TABS also provides training and coaching to districts on issues of special education, behavior, school climate, co-teaching, and leadership. This year, we partnered with United Illuminating and CL&P to provide staffing to the Smart Living Center as well as energy efficiency training to teachers across the state. Twenty workshops will be conducted, and TABS will promote the many services available through the Smart Living Center and EESmarts programs. TABS’ REACT (Regional Assessment and Consultation Team) service continues to provide highly qualified, certified professionals to help public schools, private schools and special educational agencies meet their staffing needs. Currently, TABS provides 15 districts and agencies with over 45 full and part- time paraprofessionals, associate instructors and speech language pathology assistants. 18 interim administrators, paraprofessionals, transition coordinators, behavior specialists, occupational therapists, tutors, energy specialists, literacy coaches, and speech language pathologists are working for TABS in educational organizations across the state. In addition to interim services, TABS continues to provide student evaluations in a number of related service areas. For the current school year (2012-13), TABS has contracts to conduct 25 evaluations in areas such as: assistive technology (AT) or augmentative alternative communication (AAC), vocational, occupational, bilingual speech language, bilingual psycho-educational or psychological assessments. TABS continues to offer two online learning programs. Virtual Learning Academy provides over 80 courses for students in grades 2 through 12 to recover credits and stay on course for graduation. Students work at their own pace in their individual courses, and can take as many courses as needed throughout the year. Virtual High School offers over 140 AP, honors-level and career exploration courses to high school and gifted middle school students. These students interact with peers worldwide. CREC’s Office of Grants and Development, which is part of TABS, continues to serve school districts and organizations in their efforts to secure funding for a wide variety of programs. Currently, we continue to develop a cadre of grant writers and “vetters” who work on proposals for both CREC and districts across the state. CREC’s relationships with corporate and private funders continues to grow through the work of the CREC Foundation. The Grants and Development Office seeks private funding for programs as well as support two annual campaigns for a Soundbridge lending library and magnet school sports program. TABS continues to support the Connecticut Technical High School System by providing related services such as speech and language pathologists, clinical psychologists, psychiatrists, and occupational and physical therapists. We also coordinate most of their professional development, and develop and implement training such as Scientific Research Based Interventions (SRBI). We hire and provide GED examiners and tutors, technology specialists, and coordinate professional development and purchase materials and equipment for Department of Corrections. Data, Analysis Research and Technology Division: The Data, Analysis Research and Technology Division (DART) has expanded its delivery of services in response to evolving district needs. The division has launched a technology consortium that will help enable schools to maintain support and professional development services despite district budget cuts. Components of the consortium include shared professional development resources, volume software discounts, library of technology policies, and tools to foster regional growth and collaboration. Both directly and through the consortium, CREC specialists work with district leaders to integrate 21st Century skills into new and existing curriculum.

xii
DART trainers can help align curriculum with state, national, and international student achievement and technology standards using the Curriculum Unit Revision Infusing Technology (CURIT) methodology. DART is also expanding its capacity to support the development of online and blended course design for “flipping the classroom,” which allows instructors to use class time for personalized, hands-on instruction, as well as supporting the rollout of iPads and iPods in the classroom, and “bring your own device” (BYOD) programs. In the area of research and data analysis, DART staff helps develop research questions, conducts the necessary analyses, and writes focused final reports. DART provides support for analyzing, collecting, and reporting district and State assessment data, such as cohort performance numbers, academic growth, and vertical scale scores. Further, because sometimes a research or policy question cannot be answered with existing data, DART staff is trained in all aspects of survey design, implementation, and validation. A hands-on workshop called “Data Analysis for School Leaders” also provides building leaders with a framework for approaching school-level data. With respect to data system procurement and maintenance, significant improvements have occurred in the area of student and operational data collection, automation, and analysis. DART has aligned itself with key system providers - such as Microsoft, Naviance, Pearson, and ProTraxx - to provide volume purchasing discounts, contract negotiating, hosting, development, implementation, and management services to districts. In the area of information technology, DART has expanded its consulting services beyond operational support to more strategic areas of systems planning and development. DART has conducted a number of extensive technology audits to assess districts’ readiness for integrating 21st-Century skills into the classroom while introducing ways to reduce operational risks and expenses. The IT team provides end-to-end as well as contract support for districts and non-profit organizations across the state, resulting in accolades and employee performance awards for outstanding service. Business Services Division: CREC’s Cooperative Purchasing effort continues to grow, offering school districts and other organizations a three-part program to save money and time. Locally, we bid on behalf of our clients for school, classroom, art and medical supplies, multi-purpose paper, audiovisual equipment and office machines, and HVAC filters and belts. In Connecticut and other New England states, CREC also promotes the PEPPM technology savings program, which is part of a nationwide offer of over 300,000 technology items. Finally, CREC has also joined 24 other states, through the Association of Educational Purchasing Agencies (AEPA), to offer nationally bid items such as athletic surfaces, copiers, custodial and kitchen supplies, and roofing. Schools, towns and other organizations purchase over $22M annually through these programs. Human Resources Division: The Human Resources Division continues to serve districts with the Minority Teacher Recruiting Program, which places certified candidates on a year-round basis. Our annual Career Fair attracts students from area colleges and universities, veteran teachers, career changers and teachers who are relocating to Connecticut from other states.
FINANCIAL INFORMATION CREC’s management is responsible for establishing and maintaining an internal control structure designed to ensure that the assets of CREC are protected from loss, theft, or misuse, and to ensure that adequate accounting data is compiled to allow for the preparation of financial statements in conformity with generally accepted accounting standards. The internal control structure is designed to provide reasonable, but not absolute, assurance that these objectives are met. The concept of reasonable assurance recognizes that: a) the cost of a control should not exceed the benefits likely to be derived, and b) the valuation of costs and benefits requires estimates and judgments by management.

xiii
Single Audit: As a recipient of federal and state funds, CREC is required to undergo a single audit in conformance with: a) the provisions of the Federal Single Audit Act of 1984 as amended in 1996, b) the U.S. Office of Management and Budget Circular A-133, Audits of State, Local Governments and Non-Profit Organizations and c) the Connecticut State Single Audit Act. Information related to these single audits, including the schedule of federal and state financial assistance, the findings and recommendations and auditors’ reports on the internal control structure, and our compliance with applicable laws and regulations, is issued under separate cover and is not included in this report. As part of CREC’s single audit described above, tests are conducted to determine the adequacy of the internal control structure, including that portion related to federal and state financial assistance programs, as well as to determine that CREC has complied with applicable laws and regulations. The results of CREC’s single audit for the fiscal year ended June 30, 2012 provided no instances of material weakness in the internal control structure or significant violations of applicable laws and regulations. Budgetary Controls: CREC maintains budgetary control at the program level. The objective of our budgetary control is to ensure compliance with legal provisions embodied in the annual appropriated budget, as presented by the management of CREC and approved by the Council. The Business Services Division supports CREC’s management in budget administration. CREC maintains a formal encumbrance system during the course of the fiscal year. Outstanding encumbrances lapse at year-end and are not recorded as budgetary expenditures. They may be re-encumbered in the succeeding year as expenditures against the newly-adopted budget.
OTHER INFORMATION Independent Audit: State statute requires an annual audit of the books of account, financial records and transactions of all CREC programs by independent certified public accountants appointed by the representative Council. This requirement has been complied with, and the independent auditor’s report has been included in this report. Awards and Acknowledgements: The Government Finance Officers Association (GFOA) awarded a Certificate of Achievement for Excellence in Financial Reporting to the Capitol Region Education Council for its Comprehensive Annual Financial Report (CAFR) for the fiscal year ended June 30, 2011. This was the nineteenth consecutive year that CREC has received this award. In order to be awarded a Certificate of Achievement, CREC must publish an easily readable and efficiently organized CAFR that satisfies both accounting principles generally accepted in the United States and applicable legal requirements. A Certificate of Achievement is valid for a period of one year. We believe that our current CAFR continues to meet the Certificate of Achievement Program’s requirements, and we are submitting this CAFR to the GFOA to determine its eligibility for another certificate. The preparation of this report would not have been possible without the dedicated service of the staff of the Business Services Division. We wish to express our appreciation to them.
xiv
We are grateful to our independent auditors, Blum, Shapiro & Company, P.C., for their professional assistance and advice during the course of this audit. Finally, we thank the members of our Council and our executive director for their support of CREC’s financial operations. Respectfully submitted, Donald P. Walsh Jeffrey E. Ivory Deputy Executive Director Comptroller Finance and Operations

Financial Section


29 South Main StreetP.O. Box 272000West Hartford, CT 06127-2000
Tel 860.561.4000Fax 860.521.9241blumshapiro.com
2 Enterprise DriveP.O. Box 2488Shelton, CT 06484-1488
Tel 203.944.2100Fax 203.944.2111blumshapiro.com
An Independent Member of Baker Tilly International
1
Independent Auditors’ Report
To the Board of Directors and Council Capitol Region Education Council Hartford, Connecticut We have audited the accompanying financial statements of the governmental activities, the business-type activities, each major fund and the aggregate remaining fund information of the Capitol Region Education Council as of and for the year ended June 30, 2012, which collectively comprise the Capitol Region Education Council’s basic financial statements as listed in the table of contents. These financial statements are the responsibility of the Capitol Region Education Council’s management. Our responsibility is to express opinions on these financial statements based on our audit. We conducted our audit in accordance with auditing standards generally accepted in the United States of America and the standards applicable to financial audits contained in Government Auditing Standards issued by the Comptroller General of the United States. Those standards require that we plan and perform the audit to obtain reasonable assurance about whether the financial statements are free of material misstatement. An audit includes consideration of internal control over financial reporting as a basis for designing audit procedures that are appropriate in the circumstances, but not for the purpose of expressing an opinion on the effectiveness of the Capitol Region Education Council’s internal control over financial reporting. Accordingly, we express no such opinion. An audit also includes examining, on a test basis, evidence supporting the amounts and disclosures in the financial statements, assessing the accounting principles used and the significant estimates made by management, as well as evaluating the overall financial statement presentation. We believe that our audit provides a reasonable basis for our opinions. In our opinion, the financial statements referred to above present fairly, in all material respects, the respective financial position of the governmental activities, the business-type activities, each major fund and the aggregate remaining fund information of the Capitol Region Education Council as of June 30, 2012 and the respective changes in financial position and, where applicable, cash flows thereof, for the year then ended, in conformity with accounting principles generally accepted in the United States of America.

2
In accordance with Government Auditing Standards, we have also issued our report dated December 10, 2012 on our consideration of the Capitol Region Education Council’s internal control over financial reporting and our tests of its compliance with certain provisions of laws, regulations, contracts, grant agreements and other matters. The purpose of that report is to describe the scope of our testing of internal control over financial reporting and compliance and the results of that testing, and not to provide an opinion on internal control over financial reporting or on compliance. That report is an integral part of an audit performed in accordance with Government Auditing Standards and should be considered in assessing the results of our audit. Accounting principles generally accepted in the United States of America require that the management’s discussion and analysis on pages 3 through 10 and the budgetary comparison information on page 42 be presented to supplement the basic financial statements. Such information, although not a part of the basic financial statements, is required by the Governmental Accounting Standards Board, who consider it to be an essential part of financial reporting for placing the basic financial statements in an appropriate operational, economic or historical context. We have applied certain limited procedures to the required supplementary information in accordance with auditing standards generally accepted in the United States of America, which consisted of inquiries of management about the methods of preparing the information and comparing the information for consistency with management’s responses to our inquiries, the basic financial statements and other knowledge we obtained during our audit of the basic financial statements. We do not express an opinion or provide any assurance on the information because the limited procedures do not provide us with sufficient evidence to express an opinion or provide any assurance. Our audit was conducted for the purpose of forming opinions on the financial statements that collectively comprise the Capitol Region Education Council’s financial statements as a whole. The introductory section, combining and individual nonmajor fund financial statements and schedules, and statistical section are presented for purposes of additional analysis and are not a required part of the financial statements. Such information is the responsibility of management and was derived from and relates directly to the underlying accounting and other records used to prepare the basic financial statements. The combining and individual nonmajor fund financial statements and schedules have been subjected to the auditing procedures applied in the audit of the basic financial statements and certain additional procedures, including comparing and reconciling such information directly to the underlying accounting and other records used to prepare the basic financial statements or to the basic financial statements themselves, and other additional procedures in accordance with auditing standards generally accepted in the United States of America. In our opinion, the combining and individual nonmajor fund financial statements and schedules are fairly stated in all material respects in relation to the basic financial statements as a whole. The introductory and statistical sections have not been subjected to the auditing procedures applied in the audit of the basic financial statements, and, accordingly, we do not express an opinion or provide any assurance on them. December 10, 2012

3
CAPITOL REGION EDUCATION COUNCIL MANAGEMENT’S DISCUSSION AND ANALYSIS
JUNE 30, 2012 This section of the Capitol Region Education Council’s (CREC) Comprehensive Annual Financial Report (CAFR) presents our discussion and analysis of the financial performance of CREC for the fiscal year ended June 30, 2012. Readers should refer to the transmittal letter at the beginning of this report and the financial statements that immediately follow this section. FINANCIAL HIGHLIGHTS
The total cost of CREC’s programs was $191.4 million. The General Fund reported a fund balance this year of $19.2 million, up from $14.4 million last year. During the year, CREC’s governmental revenues of $212 million were $23.6 million greater than
expenses for governmental activities (before transfers). CREC’s net assets increased by $23.8 million as a result of this year’s operations. While net assets of our
business-type activities increased by $435 thousand, net assets of our governmental activities increased by nearly $23.4 million.
Overall, the growth in CREC’s net assets reflected an increased magnet enrollment, demand by school districts for CREC’s special education services and other specialized services, which include new programs.
OVERVIEW OF THE FINANCIAL STATEMENTS The CAFR contains general introductory information, the basic financial statements, and additional financial, economic and demographic information. The basic financial statements have three components: 1) government-wide financial statements, 2) fund financial statements, and 3) notes to the financial statements. The first two statements are government-wide statements that provide both short-term and long-term information about CREC’s overall financial health. The fund financial statements provide detailed information about the individual parts of CREC - its governmental, proprietary and fiduciary funds. Government-Wide Financial Statements CREC is analyzed as a whole in Exhibits I and II. Exhibit I, the Statement of Net Assets, and Exhibit II, the Statement of Activities, present comprehensive financial information about all of the activities of CREC (except fiduciary activities) and provide short-term and long-term information about CREC’s finances. Accounting methods used are similar to those of private sector companies. These statements report CREC’s net assets and changes in them. CREC’s net assets (the difference between assets and liabilities) are one way to measure CREC’s financial health, or financial status. Over time, increases or decreases in CREC’s net assets are one indicator of whether its financial health is improving or declining. CREC’s funds are divided into two types of activities:
Governmental activities - Most of CREC’s basic services are reported here, including education, health and human services. CREC’s major services include regional programs that provide education and related health services for children with disabilities in the least restrictive environment, magnet schools that promote integrated and quality education, and early childhood programs that provide intervention initiatives. Federal and state grants, contracts, tuition, and room and board charges finance most of these activities.
Business-type activities - CREC provides products and services directly to the public and other
governmental agencies in exchange for fees. CREC’s business activities include technical assistance consulting services, technology services, training, school facility services, and teaching and learning professional development workshops.

4
Fund Financial Statements The fund financial statements begin with Exhibit III, and provide detailed information about the major funds – not CREC as a whole. CREC establishes categories of funds comprised of many individual funds to help control and manage financial activities for particular purposes, such as the Grants and Contracts Fund, to show that it is meeting its legal responsibilities for using revenues such as grants received for education from the State Department of Education. CREC’s funds are divided into three categories: governmental, proprietary and fiduciary.
Governmental Funds (Exhibits III and IV) - Most of CREC’s basic programs and services are reported in governmental funds, and the exhibits focus on how money flows into and out of those funds and the balances left at year-end that are available for spending. A fund represents a group of related accounts that are segregated for specific activities or objectives. These funds are reported using an accounting method called modified accrual accounting, which measures cash and all other financial assets that can readily be converted to cash. The governmental fund statements provide a detailed, short-term view of CREC’s general government operations and the basic services it provides. Governmental fund information helps the reader determine whether there are greater or fewer financial resources that can be spent in the near future to finance CREC’s programs. The relationship (or differences) between the information provided in the government-wide statements, where there is a longer term view, and the information presented in the governmental funds statements is described in a reconciliation included with the governmental fund financial statements.
CREC operates 82 governmental programs. The individual programs are described and their fund accounts are detailed in the Combining and Individual Fund Statements and Schedules section. The CREC Council adopts an annual budget for each of its governmental programs. A budgetary comparison statement has been provided for the General Fund and the Special Revenue Fund to demonstrate compliance with the adopted budget.
Proprietary Funds (Exhibits V, VI and VII) - Proprietary funds are reported in the same way as the
government-wide statements. CREC has two types of proprietary funds:
CREC’s 15 enterprise funds provide products and services directly to other Regional Education Service Centers (RESC), school districts and the public in exchange for fees. CREC regularly identifies specific service needs within the community and then establishes a means of delivery and pricing. The enterprise funds are the same as the business-type activities reported in the government-wide statements, but provide more detail and additional information, such as cash flows. Internal service funds are created to provide goods or services to other CREC programs, such as staff development and training, document reproduction, wide area network services, the defined contribution plan, a self-insured health insurance and workers’ compensation plan and a self-funded unemployment compensation plan.
Fiduciary Funds (Exhibit VIII) - Fiduciary funds are used to account for assets CREC holds for the
benefit of outside parties in a trustee or agency capacity. Examples of fiduciary funds are scholarship funds and student activities funds. These activities are excluded from CREC’s other financial statements, because CREC cannot use these assets to finance its operations. CREC is responsible for ensuring that these reported assets are used for their intended purposes.

5
GOVERNMENT-WIDE FINANCIAL ANALYSIS CREC’s combined net assets increased $23.8 million, or 29.1%, to $105.6 million. This was due to greater demand for CREC services, which resulted in increased revenue as well as increased investment in capital assets. Current assets were also partially funded by an increase in current liabilities.
TABLE 1 NET ASSETS
(In Thousands)
Governmental Business-TypeActivities Activities Total
2012 2011 2012 2011 2012 2011
Current assets $ 74,779 $ 36,675 $ 890 $ 1,938 $ 75,669 $ 38,613 Capital assets, net of accumulated depreciation 78,795 62,272 26 14 78,821 62,286 Total assets 153,574 98,947 916 1,952 154,490 100,899
Current liabilities 43,186 12,089 617 2,088 43,803 14,177 Long-term liabilities outstanding 5,106 4,965 5,106 4,965 Total liabilities 48,292 17,054 617 2,088 48,909 19,142
Net Assets: Invested in capital assets, net of related debt 76,673 59,554 26 14 76,699 59,568 Restricted for: Trust purposes: Nonexpendable 17 17 17 17 Unrestricted 28,592 22,322 273 (150) 28,865 22,172
Total Net Assets $ 105,282 $ 81,893 $ 299 $ (136) $ 105,581 $ 81,757
Net assets of CREC’s governmental activities increased 28.6%, to $105 million, which reflected an increase in net assets invested in capital assets net of related debt due in large part from construction, equipment and leasehold improvement in the magnet schools. Net assets of governmental activities without the capital assets increased $6.9 million primarily due to higher magnet student enrollment and larger increases in special education services. With regard to the financial position of the business-type activities, net assets increased by 312.6%, to $299 thousand. This increase was primarily due to Construction Services, Cooperative Purchasing and the Virtual High School program. Almost all the other business-type activities increased their net assets through increased revenue. Governmental unrestricted net assets, the portion of net assets that can be used to finance day-to-day operations without constraints established by debt covenants, enabling legislation or other legal requirements, increased from $22.3 million at June 30, 2011 to $28.6 million at June 30, 2012. The unrestricted net assets of business-type activities increased by $423 thousand, from a deficit of $150 thousand to a surplus of $273 thousand. This was due primarily to increased sales in construction services.
The adjusted revenues in governmental activities, net of the State of Connecticut contribution for teacher’s retirement, was $202 million this year and $160.2 million last year, representing an increase of 26%. Expenses remained stable, and related primarily to educating and providing services for CREC students and member districts. CREC’s administrative activities represented 2.83% of total costs.

6
TABLE 2 CHANGES IN NET ASSETS
(In Thousands)
Governmental Business-TypeActivities Activities Total
2012 2011 2012 2011 2012 2011Revenues: Program revenues: Charges for services $ 73,261 $ 65,444 $ 3,043 $ 2,906 $ 76,304 $ 68,350 Operating grants and contributions 108,671 99,498 77 78 108,748 99,576 Capital grants and contributions 29,897 1,761 29,897 1,761 General revenues: Grants and contributions not restricted to specific programs 226 217 226 217 Unrestricted investment earnings 69 42 69 42 Total revenues 212,124 166,962 3,120 2,984 215,244 169,946
Program Expenses: Education 182,121 152,266 182,121 152,266 Facilities 911 824 911 824 Administration 5,422 5,235 5,422 5,235 Interest on debt 87 114 87 114 Montessori Training Center of New England 159 176 159 176 Learning Corridor Theatre 93 74 93 74 Cooperative purchasing 50 32 50 32 Regional fingerprinting services 136 123 136 123 Property rental 1 1 1 1 CASBO Support Services 1 2 1 2 Conference services 186 196 186 196 Technology sale of services 367 383 367 383 Technical assistance and brokering services 222 202 222 202 Community education 201 143 201 143 School facility services 501 881 501 881 School improvement center 962 749 962 749 Total program expenses 188,541 158,439 2,879 2,962 191,420 161,401
Change in net assets before transfers 23,583 8,523 241 22 23,824 8,545 Transfers (194) (286) 194 286 - -
Increase in Net Assets $ 23,389 $ 8,237 $ 435 $ 308 $ 23,824 $ 8,545
The most significant increases in government-wide expenses were in salaries, which increased by $10.6 million (13%) and other purchased services, which increased $9.1 million (37.9%). These increased costs were for general wages for additional teachers and paraprofessionals in the expanding magnet school program, and transportation costs, which continues to increase because of the expansion of the Transportation Services program.

7
Governmental Activities Governmental activities revenue increased by $45.2 million, or 27%. Approximately 34.5% of revenues came from charges for services and approximately 65.3% came from operating and capital grants and contributions:
An increase of 908 magnet students and related tuitions fueled the increase in revenues. New programs as well as growth in existing programs and magnet schools in 2012 included Aerospace/Greater Hartford Academy of Math and Science ($4.4 million), Museum Academy ($1.6 million), Public Safety Academy ($2 million), Reggio Magnet School ($1.4 million) and the Discovery Academy ($2.8 million) programs, the division total together generated $13 million in increased revenue.
The River Street School ($1.7 million) and John J. Allison Polaris Center ($731 thousand) were primarily
responsible for the growth of revenue in the Student Services Division. Along with the increased revenues, governmental expenditures increased by $30.1 million, or 19%. This increase was caused by expenditures for new and expanding programs, general increases in salaries and benefits, and higher utility and transportation costs. Business-Type Activities Revenues of CREC’s business-type activities (see Table 2) increased by 4.6% ($3.1 million in 2012 compared to $3 million in 2011) and expenses decreased by 2.8%. Revenue exceeded expenses by $435 thousand (after transfers). Construction Services, School Improvement Center, Cooperative Purchasing and Virtual High School expansion provided for the largest increase in business-type activities. We continue efforts to increase sales and lower expenses to make all services self-sufficient. FUNDS FINANCIAL ANALYSIS Governmental Funds Governmental Funds (as presented on Exhibit III, the Balance Sheet) reported a combined fund balance of $19.7 million, which increased from last year’s $14.7 million. The net change in the fund balance of the General Fund was an increase of $4.8 million. Program charges for leadership were $1.9 million greater than expenditures, which increased the fund balance in the General Fund. The Magnet School Division had combined revenues exceeding expenditures of $2.2 million providing the largest fund balance growth. The Public Safety Academy, Greater Hartford Academy of Math and Science/Academy of Aerospace & Engineering, Two Rivers Magnet Middle School, Museum Academy, International Magnet School for Global Citizenship, Medical Professions and Teacher Preparation Academy all contributed to increased fund balance. The Greater Hartford Academy of the Arts continues to have a negative fund balance due to its student enrollment and inefficient multi-site operations. The Student Services Division, which operates all of CREC’s special education schools and programs, had combined revenues exceeding expenditures of $847 thousand, which also provided fund balance growth in the General Fund. River Street School and Integrated Program Models were the largest contributor to fund balance growth in this division because of increased needs for special education services. The Grants and Contracts Fund had a net increase in fund balance of $136 thousand. The gains in Related Services, the Special Services Support Team, CT Technical High Schools and Birth to Three totaled $190 thousand, as a result of increased services and district sales. Two programs in the Grant and Contracts Fund were the major contributors to lower growth in fund balance, as a result of reduced grant revenue and increasing expenditures. The Choice program and Employment Training program decreased fund balance growth by $95 thousand. State and local funds were not adequate to pay for the expenditures in these programs.

8
TABLE 3 GOVERNMENTAL FUND BALANCES
(In Thousands)
Fund Balance Fund BalanceJune 30, 2012 June 30, 2011
General fund $ 19,186 $ 14,428Grants and contracts fund (1,239) (1,375)Special revenue fund 1 Capital projects funds 777 680Debt service funds 934 934Permanent fund 17 17
Totals $ 19,676 $ 14,684
Budget versus Actual An over-estimation of expenditures for both CREC’s transportation services accounted for the largest variance of $1.7 million in the budget-versus-actual amounts. In the Student Services Division, $1.2 million of CREC’s Coltsville facility’s actual expenses were charged directly to the River Street School cost center. Original Budget versus Amended Budget Expanding enrollments and increased grant revenue were major factors in the amended budget increases. Capital Projects The increase of $97 thousand in fund balance was largely attributable to the special education schools fund balance allocation from the schools to Capital Projects as the buildings age and capital repairs increase. The most significant item in the Capital Projects Fund in fiscal year 2012 was the continued construction of seven magnet schools in the Hartford region. These construction projects will make up most of the Capital Projects fund activity in the coming years. The Debt Service Fund and Permanent Fund remained relatively unchanged. Proprietary Funds Proprietary fund net assets were $11.8 million at the end of fiscal 2012, an increase of $2.5 million, or 27.1%. As previously mentioned, enterprise funds increased by $435 thousand primarily due to School Construction Services, Cooperative Purchasing and the Virtual High School program revenues.

9
TABLE 4 PROPRIETARY FUND NET ASSETS
(In Thousands)
Balance BalanceJune 30, 2012 June 30, 2011
Enterprise Fund $ 299 $ (136)Internal Service Fund 11,549 9,458
Totals $ 11,848 $ 9,322
Net assets for the Internal Service Fund increased $2.1 million, or 22.1%. This was mostly attributable to CREC’s self-insurance fund, which realized a $1.7 million increase in net income. Budgeted charges to CREC’s programs for medical insurance remained flat, but due to the large increase in employees in the expanding magnet school programs, revenues grew. CREC’s unemployment fund net assets increased $280 thousand and the workers’ compensation net income increased by $145 thousand. Most of CREC’s internal service funds net assets also increased because expenses were lower than anticipated. CAPITAL ASSET AND DEBT ADMINISTRATION Capital Assets As of June 30, 2012, CREC had $78.8 million invested in a broad range of capital assets, including land, buildings, vehicles and equipment (see Table 5). Capital assets net of depreciation increased by $16.5 million, or 26.5%. Current year additions totaled $20.2 million, which included land, leasehold and building improvements, technology, equipment and vehicles. Depreciation expense was $3.7 million as of June 30, 2012. Magnet school construction, leasehold improvements in the magnet schools and furniture and equipment purchases were the primary causes for the increase in capital assets from the previous year.
TABLE 5 CAPITAL ASSETS AT YEAR-END (Net of Depreciation)
(In Thousands)
Governmental Business-TypeActivities Activities Total
2012 2011 2012 2011 2012 2011
Land $ 10,008 $ 2,225 $ $ $ 10,008 $ 2,225 Buildings and improvements 54,260 55,268 54,260 55,268 Vehicles 685 558 685 558 Furniture, fixtures and equipment 3,159 2,460 26 14 3,185 2,474 Construction in progress 10,683 1,761 10,683 1,761
Total $ 78,795 $ 62,272 $ 26 $ 14 $ 78,821 $ 62,286
More detailed information about CREC’s capital assets is presented in Note 1 and Note 5 to the financial statements.
10
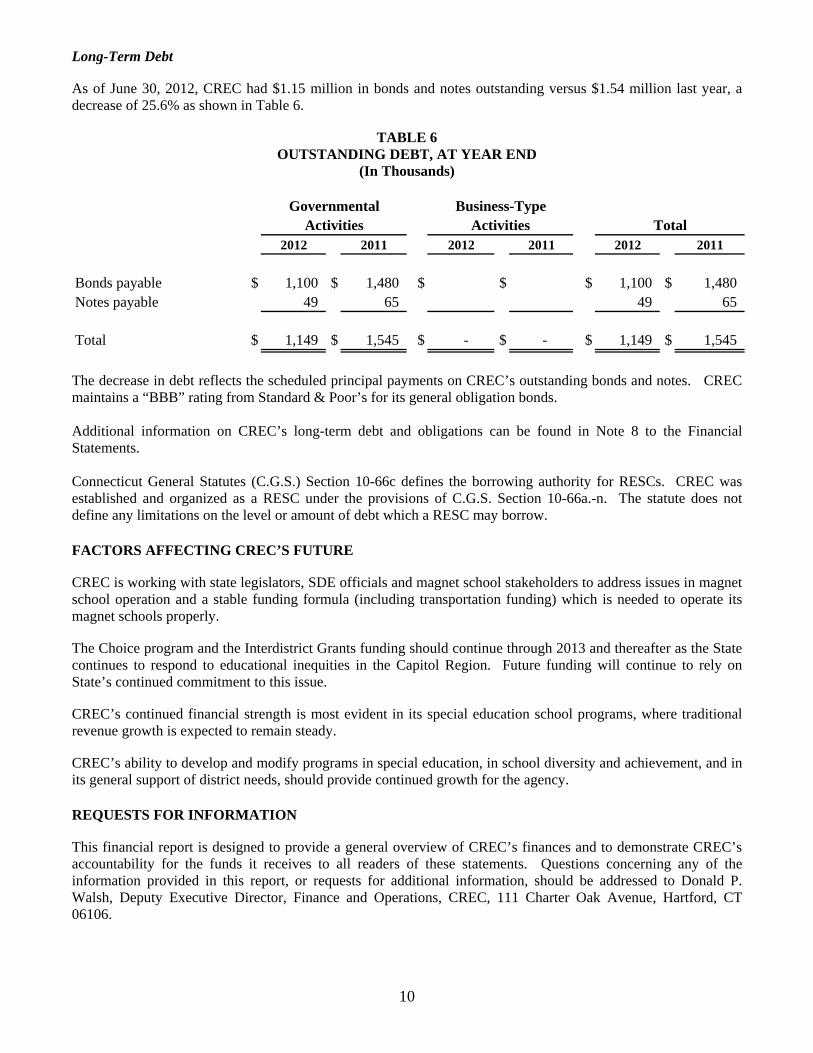
Long-Term Debt As of June 30, 2012, CREC had $1.15 million in bonds and notes outstanding versus $1.54 million last year, a decrease of 25.6% as shown in Table 6.
TABLE 6 OUTSTANDING DEBT, AT YEAR END
(In Thousands)
Governmental Business-TypeActivities Activities Total
2012 2011 2012 2011 2012 2011
Bonds payable $ 1,100 $ 1,480 $ $ $ 1,100 $ 1,480 Notes payable 49 65 49 65
Total $ 1,149 $ 1,545 $ - $ - $ 1,149 $ 1,545
The decrease in debt reflects the scheduled principal payments on CREC’s outstanding bonds and notes. CREC maintains a “BBB” rating from Standard & Poor’s for its general obligation bonds. Additional information on CREC’s long-term debt and obligations can be found in Note 8 to the Financial Statements. Connecticut General Statutes (C.G.S.) Section 10-66c defines the borrowing authority for RESCs. CREC was established and organized as a RESC under the provisions of C.G.S. Section 10-66a.-n. The statute does not define any limitations on the level or amount of debt which a RESC may borrow. FACTORS AFFECTING CREC’S FUTURE CREC is working with state legislators, SDE officials and magnet school stakeholders to address issues in magnet school operation and a stable funding formula (including transportation funding) which is needed to operate its magnet schools properly. The Choice program and the Interdistrict Grants funding should continue through 2013 and thereafter as the State continues to respond to educational inequities in the Capitol Region. Future funding will continue to rely on State’s continued commitment to this issue. CREC’s continued financial strength is most evident in its special education school programs, where traditional revenue growth is expected to remain steady. CREC’s ability to develop and modify programs in special education, in school diversity and achievement, and in its general support of district needs, should provide continued growth for the agency. REQUESTS FOR INFORMATION This financial report is designed to provide a general overview of CREC’s finances and to demonstrate CREC’s accountability for the funds it receives to all readers of these statements. Questions concerning any of the information provided in this report, or requests for additional information, should be addressed to Donald P. Walsh, Deputy Executive Director, Finance and Operations, CREC, 111 Charter Oak Avenue, Hartford, CT 06106.

Basic Financial Statements

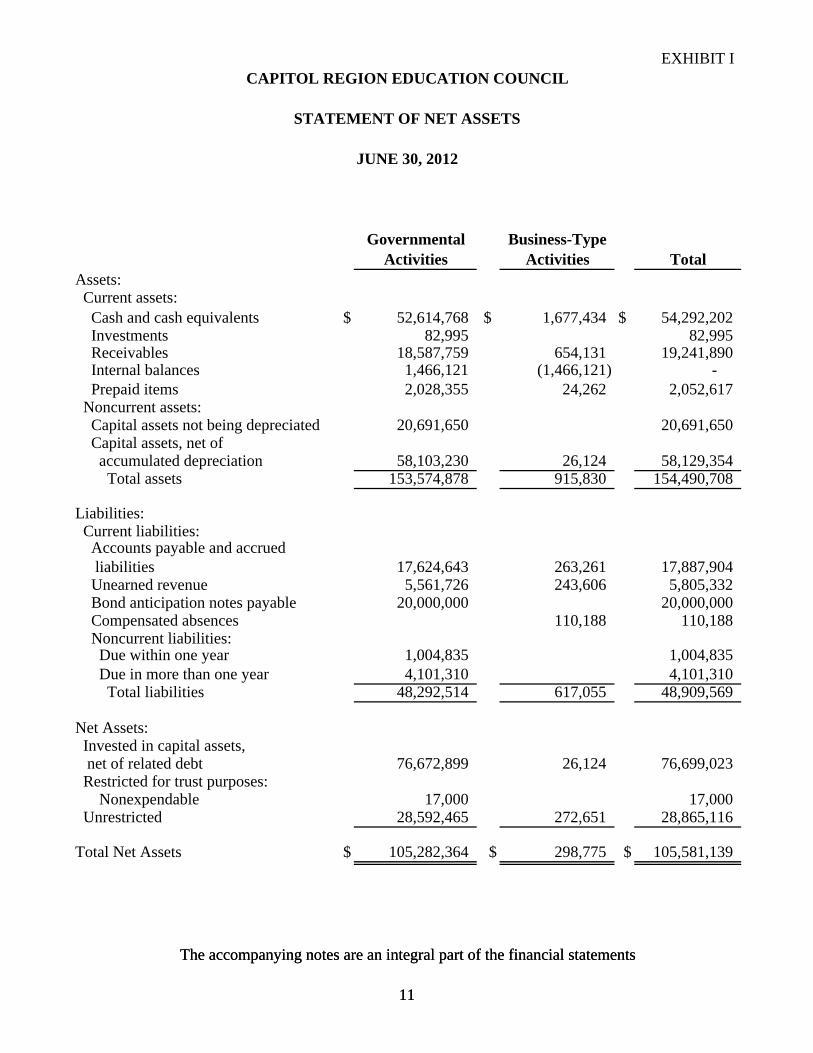
EXHIBIT ICAPITOL REGION EDUCATION COUNCIL
STATEMENT OF NET ASSETS
JUNE 30, 2012
Governmental Business-TypeActivities Activities Total
Assets: Current assets: Cash and cash equivalents $ 52,614,768 $ 1,677,434 $ 54,292,202 Investments 82,995 82,995 Receivables 18,587,759 654,131 19,241,890 Internal balances 1,466,121 (1,466,121) - Prepaid items 2,028,355 24,262 2,052,617 Noncurrent assets: Capital assets not being depreciated 20,691,650 20,691,650 Capital assets, net of accumulated depreciation 58,103,230 26,124 58,129,354 Total assets 153,574,878 915,830 154,490,708
Liabilities: Current liabilities:
The accompanying notes are an integral part of the financial statements
11
Accounts payable and accrued liabilities 17,624,643 263,261 17,887,904 Unearned revenue 5,561,726 243,606 5,805,332 Bond anticipation notes payable 20,000,000 20,000,000 Compensated absences 110,188 110,188 Noncurrent liabilities: Due within one year 1,004,835 1,004,835 Due in more than one year 4,101,310 4,101,310 Total liabilities 48,292,514 617,055 48,909,569
Net Assets: Invested in capital assets, net of related debt 76,672,899 26,124 76,699,023 Restricted for trust purposes: Nonexpendable 17,000 17,000 Unrestricted 28,592,465 272,651 28,865,116
Total Net Assets $ 105,282,364 $ 298,775 $ 105,581,139
The accompanying notes are an integral part of the financial statements
11
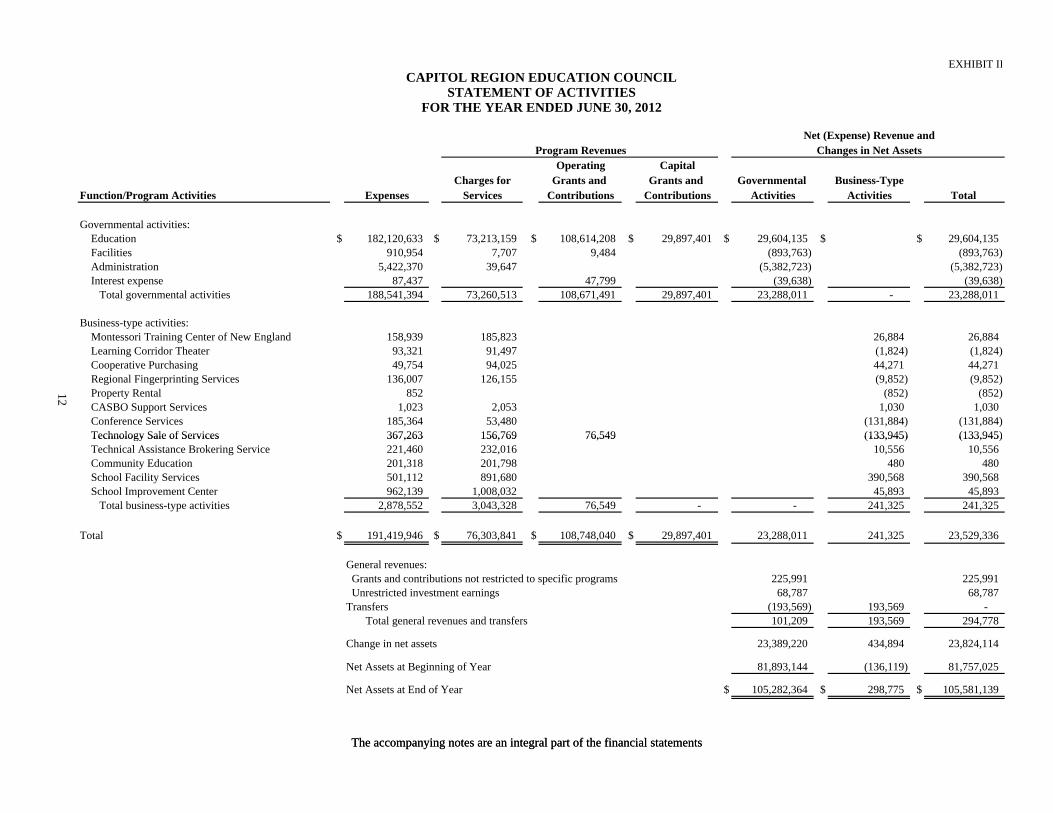
EXHIBIT IICAPITOL REGION EDUCATION COUNCIL
STATEMENT OF ACTIVITIESFOR THE YEAR ENDED JUNE 30, 2012
Net (Expense) Revenue andProgram Revenues Changes in Net Assets
Operating CapitalCharges for Grants and Grants and Governmental Business-Type
Function/Program Activities Expenses Services Contributions Contributions Activities Activities Total
Governmental activities: Education $ 182,120,633 $ 73,213,159 $ 108,614,208 $ 29,897,401 $ 29,604,135 $ $ 29,604,135 Facilities 910,954 7,707 9,484 (893,763) (893,763) Administration 5,422,370 39,647 (5,382,723) (5,382,723) Interest expense 87,437 47,799 (39,638) (39,638) Total governmental activities 188,541,394 73,260,513 108,671,491 29,897,401 23,288,011 - 23,288,011
Business-type activities: Montessori Training Center of New England 158,939 185,823 26,884 26,884 Learning Corridor Theater 93,321 91,497 (1,824) (1,824) Cooperative Purchasing 49,754 94,025 44,271 44,271 Regional Fingerprinting Services 136,007 126,155 (9,852) (9,852) Property Rental 852 (852) (852) CASBO Support Services 1,023 2,053 1,030 1,030 Conference Services 185,364 53,480 (131,884) (131,884) Technology Sale of Services 367,263 156,769 76,549 (133,945) (133,945)
12
The accompanying notes are an integral part of the financial statements
Technology Sale of Services 367,263 156,769 76,549 (133,945) (133,945) Technical Assistance Brokering Service 221,460 232,016 10,556 10,556 Community Education 201,318 201,798 480 480 School Facility Services 501,112 891,680 390,568 390,568 School Improvement Center 962,139 1,008,032 45,893 45,893 Total business-type activities 2,878,552 3,043,328 76,549 - - 241,325 241,325
Total $ 191,419,946 $ 76,303,841 $ 108,748,040 $ 29,897,401 23,288,011 241,325 23,529,336
General revenues: Grants and contributions not restricted to specific programs 225,991 225,991 Unrestricted investment earnings 68,787 68,787 Transfers (193,569) 193,569 - Total general revenues and transfers 101,209 193,569 294,778
Change in net assets 23,389,220 434,894 23,824,114
Net Assets at Beginning of Year 81,893,144 (136,119) 81,757,025
Net Assets at End of Year $ 105,282,364 $ 298,775 $ 105,581,139
The accompanying notes are an integral part of the financial statements

EXHIBIT III CAPITOL REGION EDUCATION COUNCIL
BALANCE SHEET - GOVERNMENTAL FUNDS
Grants and Nonmajor TotalGeneral Contracts Governmental Governmental
Fund Fund Funds FundsASSETS
Cash and cash equivalents $ 34,924,535 $ 1,737,832 $ 3,557,521 $ 40,219,888 Investments 65,514 17,481 82,995 Accounts receivable 10,696,408 3,543,717 4,070,467 18,310,592 Due from other funds 7,817,034 7,817,034 Prepaid items 1,950,092 18,816 1,000 1,969,908
Total Assets $ 55,453,583 $ 5,300,365 $ 7,646,469 $ 68,400,417
LIABILITIES AND FUND BALANCES
Liabilities: Accounts payable and accrued liabilities $ 11,652,250 $ 2,127,696 $ 1,544,688 $ 15,324,634 Due to other funds 1,145,574 1,974,906 4,372,707 7,493,187 Deferred revenue 3,469,727 2,436,495 375 5,906,597 Bond anticipation notes payable 20,000,000 20,000,000
Total liabilities 36,267,551 6,539,097 5,917,770 48,724,418
Fund Balances:Nonspendable 1,950,092 18,816 18,000 1,986,908 Restricted 1,099,089 933,944 2,033,033 Committed 1,531,854 1,531,854 Assigned 4,925,000 845 4,925,845 Unassigned 12,310,940 (2,356,637) (755,944) 9,198,359
Total fund balances 19,186,032 (1,238,732) 1,728,699 19,675,999
Total Liabilities and Fund Balances $ 55,453,583 $ 5,300,365 $ 7,646,469 $ 68,400,417
JUNE 30, 2012
(Continued on next page)
13

EXHIBIT III
Reconciliation of the Balance Sheet - Governmental Funds to the Statement of Net Assets:
Amounts reported for governmental activities in the statement of net assets (Exhibit I) are different because of the following:
Fund balances - total governmental funds $ 19,675,999
Capital assets used in governmental activities are not financial resources and, therefore, are not reported in the funds:
Governmental capital assets $ 112,112,371Less accumulated depreciation (33,371,481)Net capital assets 78,740,890
Other long-term assets are not available to pay for current-period expenditures and, therefore, are not recorded in the funds:
Receivable from the state for school construction projects 366,371
Internal service funds are used by management to charge the costs of risk management to individual funds. The assets and liabilities of the internal service funds are reported with governmental activities in the statement of net assets. 11,549,159
Long-term liabilities, including bonds payable, are not due and payable in the current period and, therefore, are not reported in the funds:
Bonds payable (1,100,000)Interest payable on bonds (10,313)Notes payable (49,050)Compensated absences (1,200,461)Capital lease (972,931)Net OPEB Obligation (1,717,300)
Net Assets of Governmental Activities (Exhibit I) $ 105,282,364
CAPITOL REGION EDUCATION COUNCIL
BALANCE SHEET - GOVERNMENTAL FUNDS (CONTINUED)
JUNE 30, 2012
The accompanying notes are an integral part of the financial statements
14

EXHIBIT IV
Grants and Nonmajor TotalGeneral Contracts Governmental Governmental
Fund Funds Funds FundsRevenues: Tuition $ 28,738,030 $ 21,405 $ $ 28,759,435 Grants in aid 96,086,211 23,273,435 17,591,819 136,951,465 Room and board 1,502,013 1,502,013 Sales of services 39,251,251 3,387,679 42,638,930 Investment income 68,721 66 68,787 Other local revenues 2,048,485 243,048 2,291,533 Total revenues 167,694,711 26,925,567 17,591,885 212,212,163
Expenditures: Current: Salaries 82,732,941 9,854,165 92,587,106 Employee benefits 30,225,747 2,225,058 32,450,805 Purchased professional and technical services 4,746,852 1,673,978 6,420,830 Purchased property services 10,171,661 134,307 10,305,968 Other purchased services 22,563,081 10,581,005 33,144,086 Supplies 7,371,222 638,717 8,009,939 Property 5,954,429 109,875 6,064,304 Other objects 128,372 13,355 885,313 1,027,040 Debt service: Principal 396,350 396,350 Interest and fiscal charges 90,999 90,999 Capital outlay 17,075,293 17,075,293 Total expenditures 163,894,305 25,230,460 18,447,955 207,572,720
Excess (Deficiency) of Revenues over Expenditures 3,800,406 1,695,107 (856,070) 4,639,443
Other Financing Sources (Uses): Transfers in 2,423,073 281,741 583,982 3,288,796 Transfers out (1,465,075) (1,840,794) (110,635) (3,416,504) Capital lease 480,000 480,000 Total other financing sources (uses) 957,998 (1,559,053) 953,347 352,292
Net Change in Fund Balances 4,758,404 136,054 97,277 4,991,735
Fund Balances at Beginning of Year 14,427,628 (1,374,786) 1,631,422 14,684,264
Fund Balances at End of Year $ 19,186,032 $ (1,238,732) $ 1,728,699 $ 19,675,999
FOR THE YEAR ENDED JUNE 30, 2012
CAPITOL REGION EDUCATION COUNCIL
STATEMENT OF REVENUES, EXPENDITURES AND CHANGES IN FUND BALANCES - GOVERNMENTAL FUNDS
(Continued on next page)
15
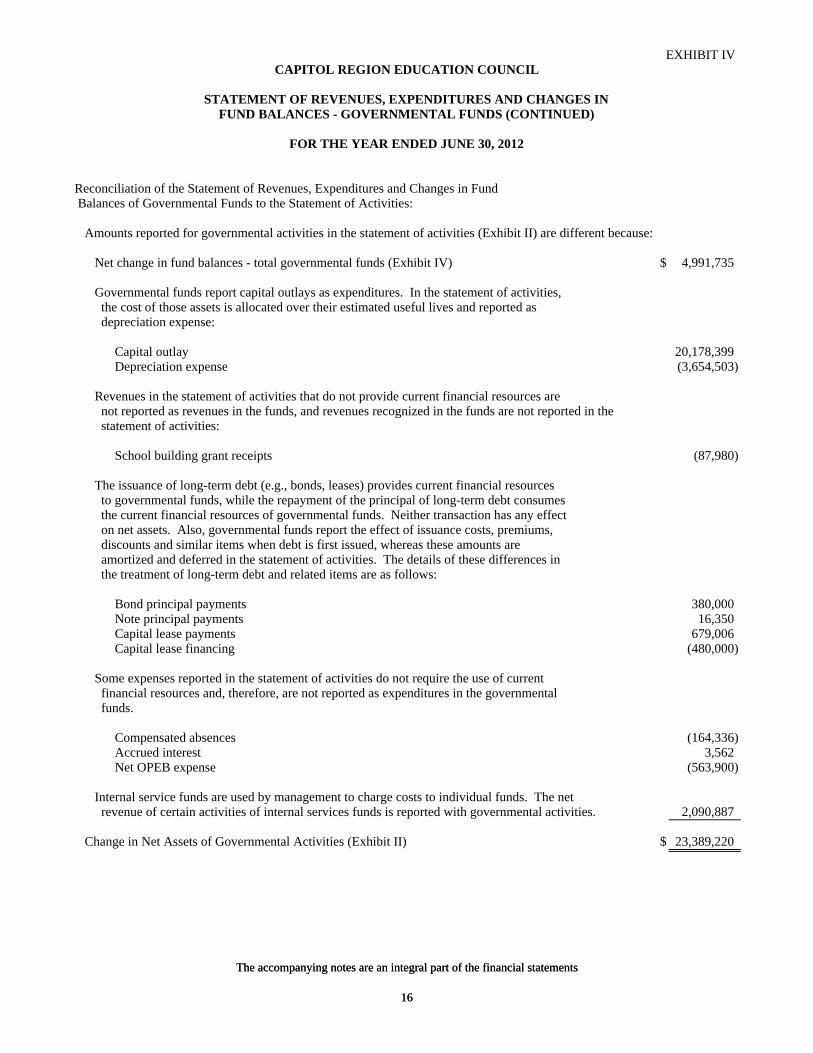
EXHIBIT IV CAPITOL REGION EDUCATION COUNCIL
STATEMENT OF REVENUES, EXPENDITURES AND CHANGES INFUND BALANCES - GOVERNMENTAL FUNDS (CONTINUED)
FOR THE YEAR ENDED JUNE 30, 2012
Reconciliation of the Statement of Revenues, Expenditures and Changes in Fund Balances of Governmental Funds to the Statement of Activities:
Amounts reported for governmental activities in the statement of activities (Exhibit II) are different because:
Net change in fund balances - total governmental funds (Exhibit IV) $ 4,991,735 Governmental funds report capital outlays as expenditures. In the statement of activities, the cost of those assets is allocated over their estimated useful lives and reported as depreciation expense:
Capital outlay 20,178,399Depreciation expense (3,654,503)
Revenues in the statement of activities that do not provide current financial resources are not reported as revenues in the funds, and revenues recognized in the funds are not reported in the statement of activities:
School building grant receipts (87,980)
The issuance of long-term debt (e.g., bonds, leases) provides current financial resources to governmental funds, while the repayment of the principal of long-term debt consumes the current financial resources of governmental funds. Neither transaction has any effect on net assets. Also, governmental funds report the effect of issuance costs, premiums,
di d i il i h d b i fi i d h h
The accompanying notes are an integral part of the financial statements
16
discounts and similar items when debt is first issued, whereas these amounts are amortized and deferred in the statement of activities. The details of these differences in the treatment of long-term debt and related items are as follows:
Bond principal payments 380,000Note principal payments 16,350Capital lease payments 679,006Capital lease financing (480,000)
Some expenses reported in the statement of activities do not require the use of current financial resources and, therefore, are not reported as expenditures in the governmental funds.
Compensated absences (164,336)Accrued interest 3,562Net OPEB expense (563,900)
Internal service funds are used by management to charge costs to individual funds. The net revenue of certain activities of internal services funds is reported with governmental activities. 2,090,887
Change in Net Assets of Governmental Activities (Exhibit II) $ 23,389,220
The accompanying notes are an integral part of the financial statements
16
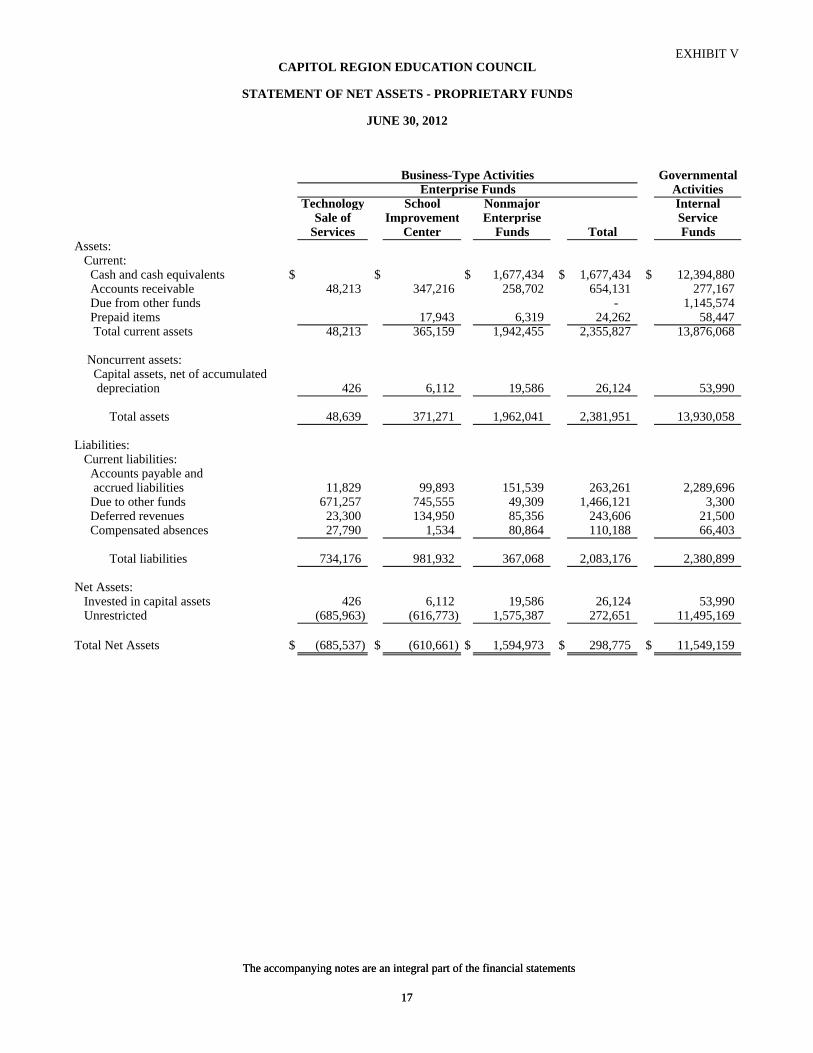
EXHIBIT VCAPITOL REGION EDUCATION COUNCIL
STATEMENT OF NET ASSETS - PROPRIETARY FUNDS
JUNE 30, 2012
Business-Type Activities GovernmentalEnterprise Funds Activities
Technology School Nonmajor InternalSale of Improvement Enterprise Service
Services Center Funds Total FundsAssets:
Current: Cash and cash equivalents $ $ $ 1,677,434 $ 1,677,434 $ 12,394,880 Accounts receivable 48,213 347,216 258,702 654,131 277,167 Due from other funds - 1,145,574 Prepaid items 17,943 6,319 24,262 58,447
Total current assets 48,213 365,159 1,942,455 2,355,827 13,876,068
Noncurrent assets: Capital assets, net of accumulated depreciation 426 6,112 19,586 26,124 53,990
Total assets 48,639 371,271 1,962,041 2,381,951 13,930,058
Liabilities: Current liabilities:
Accounts payable and accrued liabilities 11,829 99,893 151,539 263,261 2,289,696 Due to other funds 671,257 745,555 49,309 1,466,121 3,300 Deferred revenues 23,300 134,950 85,356 243,606 21,500 Compensated absences 27,790 1,534 80,864 110,188 66,403
The accompanying notes are an integral part of the financial statements
17
Total liabilities 734,176 981,932 367,068 2,083,176 2,380,899
Net Assets: Invested in capital assets 426 6,112 19,586 26,124 53,990 Unrestricted (685,963) (616,773) 1,575,387 272,651 11,495,169
Total Net Assets $ (685,537) $ (610,661) $ 1,594,973 $ 298,775 $ 11,549,159
The accompanying notes are an integral part of the financial statements
17

EXHIBIT VICAPITOL REGION EDUCATION COUNCIL
STATEMENT OF REVENUES, EXPENSES ANDCHANGES IN FUND NET ASSETS - PROPRIETARY FUNDS
FOR THE YEAR ENDED JUNE 30, 2012
GovernmentalActivities
Technology School Nonmajor InternalSale of Improvement Enterprise Service
Services Center Funds Total Funds
Operating Revenues: Sales of services $ 156,769 $ 975,532 $ 1,849,226 $ 2,981,527 $ 21,476,338Other local revenues 32,500 29,301 61,801 2,569,969
Total operating revenues 156,769 1,008,032 1,878,527 3,043,328 24,046,307
Operating Expenses: Salaries 276,333 639,151 693,001 1,608,485 1,550,169Employee benefits 77,147 111,732 166,492 355,371 19,429,068Purchased professional and technical services 4,172 140,557 326,707 471,436 76,981Purchased property services 52,813 52,813 55,962Other purchased services 8,132 38,403 182,003 228,538 674,621Supplies 845 23,383 102,820 127,048 41,666Property 997 12,121 13,118 39,390Depreciation 222 1,532 2,737 4,491 21,461Other 412 6,384 10,456 17,252 241
Total operating expenses 367,263 962,139 1,549,150 2,878,552 21,889,559
Operating Income (Loss) (210,494) 45,893 329,377 164,776 2,156,748
Business-Type ActivitiesEnterprise Funds
The accompanying notes are an integral part of the financial statements
18
Operating Income (Loss) (210,494) 45,893 329,377 164,776 2,156,748
Nonoperating Revenues: Grants in aid 76,549 76,549
Income (Loss) Before Transfers (133,945) 45,893 329,377 241,325 2,156,748
Transfers In 216,281 111,239 268,373 595,893 3,459
Transfers Out (65,850) (126,746) (209,728) (402,324) (69,320)
Change in Net Assets 16,486 30,386 388,022 434,894 2,090,887
Net Assets at Beginning of Year (702,023) (641,047) 1,206,951 (136,119) 9,458,272
Net Assets at End of Year $ (685,537) $ (610,661) $ 1,594,973 $ 298,775 $ 11,549,159
The accompanying notes are an integral part of the financial statements
18

EXHIBIT VII CAPITOL REGION EDUCATION COUNCIL
STATEMENT OF CASH FLOWS - PROPRIETARY FUNDS
FOR THE YEAR ENDED JUNE 30, 2012
GovernmentalActivities
Technology School Nonmajor InternalSale of Improvement Enterprise ServiceServices Center Funds Total Funds
Cash Flows from Operating Activities: Receipts from customers and users $ 189,338 $ 979,830 $ 2,009,882 $ 3,179,050 $ 24,080,352 Receipts from interfund services provided 23,551 23,551 3,300 Payments to suppliers (13,658) (168,205) (615,563) (797,426) (791,210) Payments to employees (355,064) (751,207) (823,866) (1,930,137) (20,464,094) Payments for interfund services used (47,596) (43,449) (91,045) (453,146) Net cash provided by (used in) operating activities (226,980) 16,969 594,004 383,993 2,375,202
Cash Flows from Noncapital Financing Activities: Grants in aid 76,549 76,549 Transfers from other funds 216,281 111,239 268,373 595,893 (9,214) Transfers out to other funds (65,850) (126,746) (209,728) (402,324) (69,320) Net cash provided by (used in) noncapital financing activities 226,980 (15,507) 58,645 270,118 (78,534)
Cash Flows from Capital and Related Financing Activities: Additions to property, plant and equipment (1,462) (15,279) (16,741) (8,183)
Net Increase in Cash and Cash Equivalents - - 637,370 637,370 2,288,485
Cash and Cash Equivalents at Beginning of Year - - 1,040,064 1,040,064 10,106,395
Cash and Cash Equivalents at End of Year $ - $ - $ 1,677,434 $ 1,677,434 $ 12,394,880
Reconciliation of Operating Income (Loss) to Net Cash Provided by (Used in) Operating Activities: Operating income (loss) $ (210,494) $ 45,893 $ 329,377 $ 164,776 $ 2,156,748 Adjustments to reconcile operating income (loss) to net cash provided by (used in) operating activities: Depreciation 222 1,532 2,737 4,491 21,461 Change in assets and liabilities: (Increase) decrease in accounts receivable 16,769 (14,771) 236,064 238,062 38,695 (Increase) decrease in other assets (17,943) (17,943) 95,727 (Increase) decrease in due from other funds - (453,146) Increase (decrease) in accounts payable and accrued liabilities (97) 59,462 71,357 130,722 508,885 Increase (decrease) in compensated absences (1,584) (324) 35,627 33,719 8,182 Increase (decrease) in due to other funds (47,596) (43,449) 23,551 (67,494) 3,300 Increase (decrease) in deferred revenues 15,800 (13,431) (104,709) (102,340) (4,650) Total adjustments (16,486) (28,924) 264,627 219,217 218,454
Net Cash Provided by (Used in) Operating Activities $ (226,980) $ 16,969 $ 594,004 $ 383,993 $ 2,375,202
Business-Type ActivitiesEnterprise Funds
The accompanying notes are an integral part of the financial statements
19

EXHIBIT VIII CAPITOL REGION EDUCATION COUNCIL
STATEMENT OF FIDUCIARY NET ASSETS - FIDUCIARY FUNDS
JUNE 30, 2012
AgencyFunds
Assets: Cash and cash equivalents $ 451,803 Other assets 530
Total Assets $ 452,333
Liabilities: Accounts payable $ 1,692 Fiduciary deposits 450,641
Total Liabilities $ 452,333
The accompanying notes are an integral part of the financial statements
20

21
CAPITOL REGION EDUCATION COUNCIL
NOTES TO FINANCIAL STATEMENTS
JUNE 30, 2012
1. SUMMARY OF SIGNIFICANT ACCOUNTING POLICIES The financial statements of the Capitol Region Education Council (CREC) have been prepared in conformity with accounting principles generally accepted in the United States of America (GAAP) as applied to government units. The Governmental Accounting Standards Board (GASB) is the accepted standard setting body for establishing governmental accounting and financial reporting principles. The more significant policies of CREC are described below. A. Reporting Entity
The Capitol Region Education Council, a Regional Educational Service Center, was organized in 1966 under the provisions of the Connecticut General Statutes, Section 10-66a, as amended. CREC operates under a representative Council (one Council person from each member town) with a Board of Directors and an appointed Executive Director and provides the following services as authorized by statute: as a center for towns or regional boards of education to establish cooperative arrangements to provide special services, programs or activities to enable such boards to carry out the duties specified in the General Statutes.
Blended Component Unit - Capitol Region Education Council Foundation, Inc. (the Corporation) serves CREC and its members by providing financial and other support and it is governed by a Board of Directors comprised in majority by CREC’s Board of Directors. The Corporation is reported as a special revenue fund.
B. Government-Wide and Fund Financial Statements
The government-wide financial statements (i.e., the statement of net assets and the statement of activities) report information on all of the nonfiduciary activities of CREC. For the most part, the effect of interfund activity has been removed from these statements. Governmental activities, which normally are supported by tuition, room and board and intergovernmental revenues, are reported separately from business-type activities, which rely to a significant extent on fees and charges for support.
The statement of activities demonstrates the degree to which the direct expenses of a given function or segment are offset by program revenues. Direct expenses are those that are clearly identifiable with a specific function or segment. Program revenues include: 1) charges to customers or applicants who purchase, use or directly benefit from goods, services or privileges provided by a given function or segment and 2) grants and contributions that are restricted to meeting the operational or capital requirements of a particular function or segment. Other items not properly included among program revenues are reported instead as general revenues.
Separate financial statements are provided for governmental funds, proprietary funds and fiduciary funds, even though the latter are excluded from the government-wide financial statements. Major individual governmental funds and major individual enterprise funds are reported as separate columns in the fund financial statements.
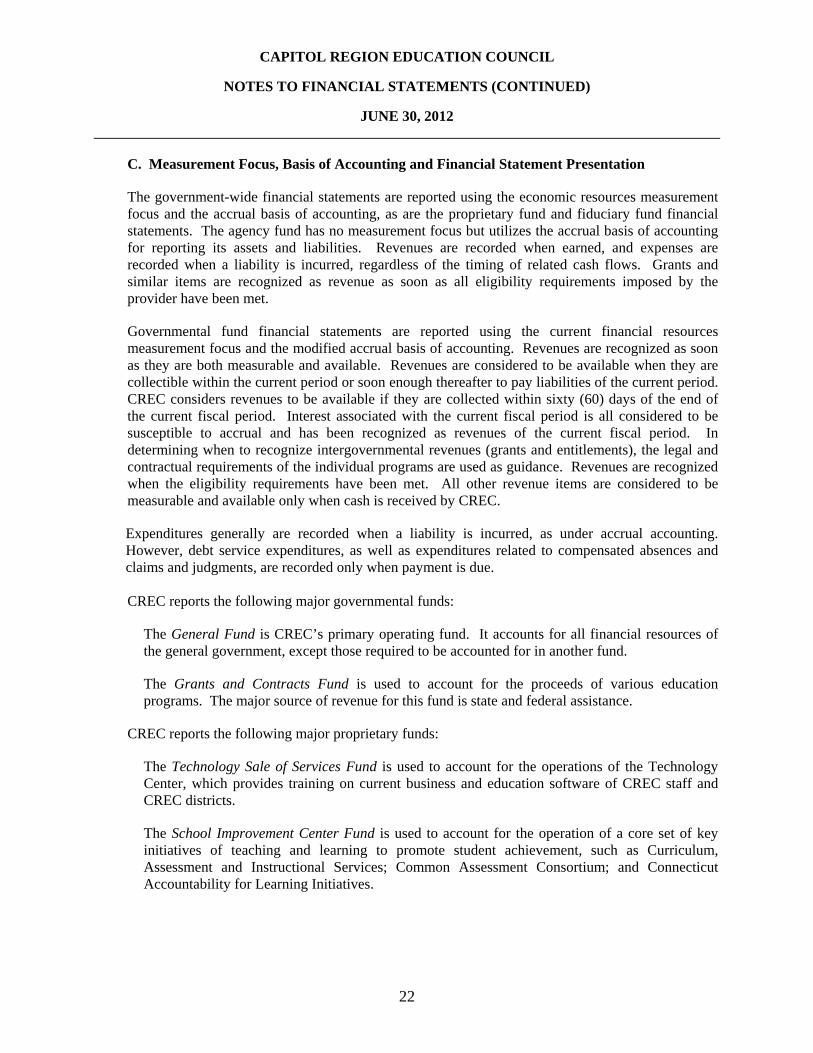
CAPITOL REGION EDUCATION COUNCIL
NOTES TO FINANCIAL STATEMENTS (CONTINUED)
JUNE 30, 2012
22
C. Measurement Focus, Basis of Accounting and Financial Statement Presentation
The government-wide financial statements are reported using the economic resources measurement focus and the accrual basis of accounting, as are the proprietary fund and fiduciary fund financial statements. The agency fund has no measurement focus but utilizes the accrual basis of accounting for reporting its assets and liabilities. Revenues are recorded when earned, and expenses are recorded when a liability is incurred, regardless of the timing of related cash flows. Grants and similar items are recognized as revenue as soon as all eligibility requirements imposed by the provider have been met.
Governmental fund financial statements are reported using the current financial resources measurement focus and the modified accrual basis of accounting. Revenues are recognized as soon as they are both measurable and available. Revenues are considered to be available when they are collectible within the current period or soon enough thereafter to pay liabilities of the current period. CREC considers revenues to be available if they are collected within sixty (60) days of the end of the current fiscal period. Interest associated with the current fiscal period is all considered to be susceptible to accrual and has been recognized as revenues of the current fiscal period. In determining when to recognize intergovernmental revenues (grants and entitlements), the legal and contractual requirements of the individual programs are used as guidance. Revenues are recognized when the eligibility requirements have been met. All other revenue items are considered to be measurable and available only when cash is received by CREC.
Expenditures generally are recorded when a liability is incurred, as under accrual accounting. However, debt service expenditures, as well as expenditures related to compensated absences and claims and judgments, are recorded only when payment is due. CREC reports the following major governmental funds:
The General Fund is CREC’s primary operating fund. It accounts for all financial resources of the general government, except those required to be accounted for in another fund.
The Grants and Contracts Fund is used to account for the proceeds of various education programs. The major source of revenue for this fund is state and federal assistance.
CREC reports the following major proprietary funds:
The Technology Sale of Services Fund is used to account for the operations of the Technology Center, which provides training on current business and education software of CREC staff and CREC districts.
The School Improvement Center Fund is used to account for the operation of a core set of key initiatives of teaching and learning to promote student achievement, such as Curriculum, Assessment and Instructional Services; Common Assessment Consortium; and Connecticut Accountability for Learning Initiatives.

CAPITOL REGION EDUCATION COUNCIL
NOTES TO FINANCIAL STATEMENTS (CONTINUED)
JUNE 30, 2012
23
Additionally, CREC reports the following fund types:
The Enterprise Funds are used to account for the operations that are financed through user charges. The nonmajor Enterprise Funds include Montessori Training Center of New England, Learning Corridor Theater, Cooperative Purchasing, Regional Fingerprinting Services, Office of Communications, Staff Development, BEST Services, Property and Equipment Rental, CASBO Support Services, Conference Services, Technical Assistance Brokering Service, Community Education and Construction Services.
The Internal Service Funds are used to account for operations that are financed on a cost-reimbursement basis to programs within CREC’s financial reporting entity. The Internal Service Funds include CREC Staff Development, CREC Wide Area Network, Copy Center, Self Insurance, CREC Unemployment, Workers’ Compensation and Employee Benefit Fund.
The Agency Funds are used to account for assets held by CREC in an agent capacity for individuals, private organizations or other governments. These funds are custodial in nature (assets equal liabilities) and do not involve measurement of results of operations. The Agency Funds include RSS Equipment Escrow, River Street/Coltsville, Greater Hartford Academy of the Arts, Metropolitan Learning Center, Special Education Escrow, River Street School, Great Path Academy, Statewide RESCS Escrow, AAE/GHAMAS Escrow, Integrated Program Model, East Hartford/Glastonbury Magnet School Escrow, RESC Alliance Minority Recruiting, CREC Charter Oak Escrow, Polaris Student Activity, Choice Escrow, Two Rivers Escrow, Montessori Magnet School, IMS Escrow, Reggio Escrow, HASA Escrow and Discovery Academy Escrow.
Private-sector standards of accounting and financial reporting issued prior to December 1, 1989 are generally followed in both the government-wide and proprietary fund financial statements to the extent that those standards do not conflict with or contradict guidance of the Governmental Accounting Standards Board. Governments also have the option of following subsequent private-sector guidance for their business-type activities and enterprise funds, subject to this same limitation. CREC has elected not to follow subsequent private-sector guidance.
As a general rule, the effect of interfund activity has been eliminated from the government-wide financial statements. Exceptions to this general rule are charges between the enterprise funds and various other functions of the government. Elimination of these charges would distort the direct costs and program revenues reported for the various functions concerned.
Amounts reported as program revenues include: 1) charges to customers or applicants for goods, services or privileges provided, 2) operating grants and contributions, and 3) capital grants and contributions, including special assessments. Internally dedicated resources are reported as general revenues rather than as program revenues.
Proprietary funds distinguish operating revenues and expenses from nonoperating items. Operating revenues and expenses generally result from providing services and delivering goods in connection with a proprietary fund’s principal ongoing operations. The principal operating revenues of the proprietary funds are charges to customers for services. Operating expenses for enterprise funds and internal service funds include the cost of sales and services, administrative expenses and depreciation on capital assets. All revenues and expenses not meeting this definition are reported as nonoperating revenues and expenses.

CAPITOL REGION EDUCATION COUNCIL
NOTES TO FINANCIAL STATEMENTS (CONTINUED)
JUNE 30, 2012
24
When both restricted and unrestricted resources are available for use, it is CREC’s policy to use restricted resources first, then unrestricted resources as they are needed. Unrestricted resources are used in the following order: committed, assigned then unassigned.
D. Deposits and Investments
CREC’s cash and cash equivalents are considered to be cash on hand, demand deposits and short-term investments with original maturities of three months or less from the date of acquisition.
Investments are stated at fair value.
E. Receivables and Payables
Activity between funds that are representative of lending/borrowing arrangements outstanding at the end of the fiscal year are referred to as either “due to/from other funds” (i.e., the current portion of interfund loans) or “advances to/from other funds” (i.e., the noncurrent portion of interfund loans). All other outstanding balances between funds are reported as “due to/from other funds.” Any residual balances outstanding between the governmental activities and business-type activities are reported in the government-wide financial statements as “internal balances.”
Advances between funds, as reported in the fund financial statements, are offset by a fund balance reserve account in applicable governmental funds to indicate that they are not available for appropriation and are not expendable available financial resources.
F. Prepaid Items Certain payments to vendors reflect costs applicable to future accounting periods and are recorded as prepaid items in both government-wide and fund financial statements. G. Capital Assets
Capital assets, which include property, plant and equipment, are reported in the applicable governmental or business-type activities columns in the government-wide financial statements. Capital assets are defined by the government as assets with an initial individual cost of more than $1,000 and an estimated useful life of more than two years. Such assets are recorded at historical cost or estimated historical cost if purchased or constructed. Donated capital assets are recorded at estimated fair market value at the date of donation.
The costs of normal maintenance and repairs that do not add to the value of the asset or materially extend lives are not capitalized.
Major outlays for capital assets and improvements are capitalized as projects are constructed. Interest incurred during the construction phase of capital assets of business-type activities is included as part of the capitalized value of the assets constructed.

CAPITOL REGION EDUCATION COUNCIL
NOTES TO FINANCIAL STATEMENTS (CONTINUED)
JUNE 30, 2012
25
Property, plant and equipment of CREC is depreciated using the straight-line method over the following estimated useful lives:
Assets Years Buildings 39 Building improvements 39 Land Nondepreciable Vehicles 7 Office equipment 7 Computer equipment 5 Machinery and equipment 7
H. Compensated Absences
Vacation benefits accumulate throughout the employment of an individual up to varying maximums. Earned vacation time accumulated by employees must be used in the subsequent year or it is forfeited. Employees in programs do not receive vacation pay for time not taken prior to the close of the program.
All vacation is accrued when incurred in the government-wide, proprietary and fiduciary fund financial statements. A liability for these amounts is reported in governmental funds only if they have matured, for example, as a result of employee resignations and retirements.
I. Long-Term Obligations
In the government-wide financial statements and proprietary fund types in the fund financial statements, long-term debt and other long-term obligations are reported as liabilities in the applicable governmental activities, business-type activities or proprietary fund type statement of net assets.
J. Equity
Equity in the government-wide financial statements is defined as “net assets” and is classified in the following categories:
Invested in Capital Assets, Net of Related Debt - This component of net assets consists of capital assets, net of accumulated depreciation and reduced by the outstanding balances of any bonds, notes or other borrowings that are attributable to the acquisition, construction or improvement of those assets. Restricted Net Assets - Net assets restrictions are externally imposed by creditors (such as through debt covenants), grantors, contributors or laws or regulations of other governments or imposed by law through constitutional provisions or enabling legislation. Unrestricted Net Assets - This component consists of net assets that do not meet the definition of “restricted” or “invested in capital assets, net of related debt.”
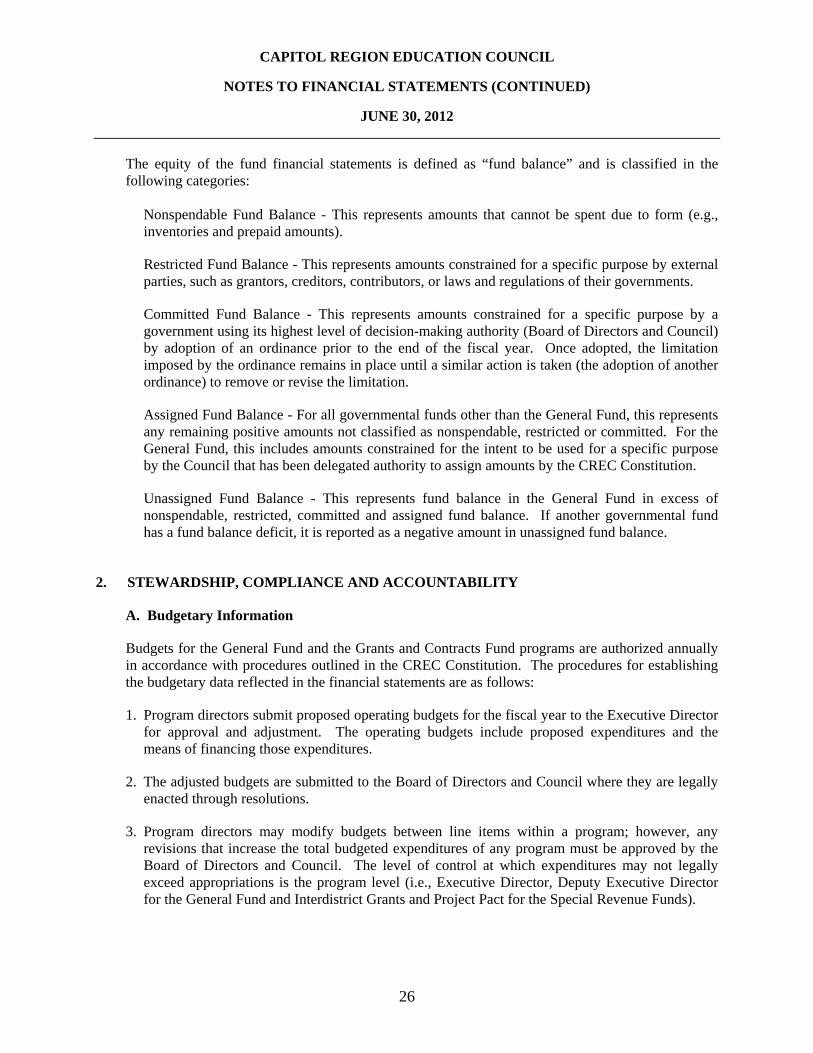
CAPITOL REGION EDUCATION COUNCIL
NOTES TO FINANCIAL STATEMENTS (CONTINUED)
JUNE 30, 2012
26
The equity of the fund financial statements is defined as “fund balance” and is classified in the following categories:
Nonspendable Fund Balance - This represents amounts that cannot be spent due to form (e.g., inventories and prepaid amounts).
Restricted Fund Balance - This represents amounts constrained for a specific purpose by external parties, such as grantors, creditors, contributors, or laws and regulations of their governments.
Committed Fund Balance - This represents amounts constrained for a specific purpose by a government using its highest level of decision-making authority (Board of Directors and Council) by adoption of an ordinance prior to the end of the fiscal year. Once adopted, the limitation imposed by the ordinance remains in place until a similar action is taken (the adoption of another ordinance) to remove or revise the limitation.
Assigned Fund Balance - For all governmental funds other than the General Fund, this represents any remaining positive amounts not classified as nonspendable, restricted or committed. For the General Fund, this includes amounts constrained for the intent to be used for a specific purpose by the Council that has been delegated authority to assign amounts by the CREC Constitution.
Unassigned Fund Balance - This represents fund balance in the General Fund in excess of nonspendable, restricted, committed and assigned fund balance. If another governmental fund has a fund balance deficit, it is reported as a negative amount in unassigned fund balance.
2. STEWARDSHIP, COMPLIANCE AND ACCOUNTABILITY
A. Budgetary Information
Budgets for the General Fund and the Grants and Contracts Fund programs are authorized annually in accordance with procedures outlined in the CREC Constitution. The procedures for establishing the budgetary data reflected in the financial statements are as follows:
1. Program directors submit proposed operating budgets for the fiscal year to the Executive Director for approval and adjustment. The operating budgets include proposed expenditures and the means of financing those expenditures.
2. The adjusted budgets are submitted to the Board of Directors and Council where they are legally enacted through resolutions.
3. Program directors may modify budgets between line items within a program; however, any revisions that increase the total budgeted expenditures of any program must be approved by the Board of Directors and Council. The level of control at which expenditures may not legally exceed appropriations is the program level (i.e., Executive Director, Deputy Executive Director for the General Fund and Interdistrict Grants and Project Pact for the Special Revenue Funds).

CAPITOL REGION EDUCATION COUNCIL
NOTES TO FINANCIAL STATEMENTS (CONTINUED)
JUNE 30, 2012
27
The budgets are prepared on a modified accrual basis of accounting. On a budgetary basis, operating transfers in and out are classified as revenues and expenditures, respectively. All appropriations lapse at the end of the budget year. CREC has a formal purchase order system. CREC uses encumbrance accounting during the course of the year but cancels all unliquidated encumbrances prior to closing books.
Budgeted amounts are as originally adopted or as amended by the Board of Directors and Council. Supplemental appropriations were necessary during the year as new grants were received and new programs added.
The accompanying statement of revenues and expenditures - General Fund and Major Special Revenue Fund - budget and actual (non-GAAP budgetary basis) presents comparisons of the legally adopted budget with actual data on a budgetary basis. Also, CREC does not recognize the contribution by the State of Connecticut for teachers’ retirement (as discussed in Note 13) for budgetary purposes. Since not all programs included in the General Fund financial statements are budgeted, a reconciliation of the resultant accounting basis entity differences in excess of revenues and other sources over expenditures and other uses for the General Fund for the year ended June 30, 2012 is presented below.
General FundNon-Budgeted Non-GAAP
General Fund Interprogram CREC General Budgetary GAAP Basis Eliminations Program Basis
General Fund: Revenues and other financing sources $ 170,117,784 $ 20,596,065 $ (18,424,530) $ 172,289,319 Expenditures and other financing uses 165,359,380 20,596,065 (16,510,718) 169,444,727
Net Change in Fund Balance $ 4,758,404 $ - $ (1,913,812) $ 2,844,592

CAPITOL REGION EDUCATION COUNCIL
NOTES TO FINANCIAL STATEMENTS (CONTINUED)
JUNE 30, 2012
28
B. Deficit Fund Equity
Fund balance and net asset deficits existed as of June 30, 2012 in the following funds/programs:
General Fund Programs: Grants and Development Office $ 556,978 Administrative Building Cost Center 695,250 Minority Teacher Recruiting 44,240 Project Literacy 49,449 Learning Corridor Cost Center 614,774 Aerospace/GHAMAS Magnet School 114,458 Polaris Center 1,147,183 Magnet School Cost Center 836,377 Special Education Transportation 36,403 Greater Hartford Academy of the Arts 4,673,755 School Transportation Management Services 49,196 Reggio Magnet School for the Arts 1,892,692 Charter School for Young Children on Asylum Hill
Lincoln Academy 1,058,612
36,727 Discovery Academy 308,187 Special Revenue Fund: Grants and Contracts Fund: Capitol Region Choice Program 1,387,071 Suburban Youth Programs 2,875 Regional School Choice Office 679 Family Enrichment Services 57,149 Employment Training Program 451,722 Early Education Programs 442,935 Capital Projects Funds: Soundbridge Construction 754,944 Technology Sale of Services 685,537 School Improvement Center 610,661 Enterprise Funds: Learning Corridor Theater
Conference Services 2,507
37,478
These deficits will be covered by transfers from the General Fund.

CAPITOL REGION EDUCATION COUNCIL
NOTES TO FINANCIAL STATEMENTS (CONTINUED)
JUNE 30, 2012
29
3. CASH, CASH EQUIVALENTS AND INVESTMENTS
The deposit of public funds is controlled by the Connecticut General Statutes (Section 7-402). Deposits may be made in a “qualified public depository” as defined by Statute, or, in amounts not exceeding the Federal Deposit Insurance Corporation insurance limit in an “out of state bank,” as defined by the Statutes, which is not a “qualified public depository.” The Connecticut General Statutes (Section 7-400) permit CREC to invest in: 1) obligations of the United States and its agencies; 2) highly rated obligations of any state of the United States or of any political subdivision, authority or agency thereof; and 3) shares or other interests in custodial arrangements or pools maintaining constant net asset values and in highly rated no-load open end money market and mutual funds (with constant or fluctuating net asset values) whose portfolios are limited to obligations of the United States and its agencies, and repurchase agreements fully collateralized by such obligations. Other provisions of the Statutes cover specific funds with particular investment authority. The Statutes (Sections 3-24f and 3-27f) also provide for investment in shares of the State Short-Term Investment Fund (STIF) and the State Tax Exempt Proceeds Fund (TEPF). These investment pools are under the control of the State Treasurer, with oversight provided by the Treasurer’s Cash Management Advisory Board, and are regulated under the State Statutes and subject to annual audit by the Auditors of Public Accounts. Investment yields are accounted for on an amortized-cost basis with an investment portfolio that is designed to attain a market-average rate of return throughout budgetary and economic cycles. Investors accrue interest daily based on actual earnings, less expenses and transfers to the designated surplus reserve, and the fair value of the position in the pool is the same as the value of the pool shares.
A. Cash and Cash Equivalents
Deposits
Deposit Custodial Credit Risk - Custodial credit risk is the risk that, in the event of a bank failure, CREC’s deposit will not be returned. CREC does not have a deposit policy for custodial credit risk. The deposit of public funds is controlled by the Connecticut General Statutes. Deposits may be placed with any qualified public depository that has a place of business in the State of Connecticut. Connecticut General Statutes require that each depository maintain segregated collateral (not required to be based on a security agreement between the depository and the municipality and, therefore, not perfected in accordance with federal law) in an amount equal to a defined percentage of its public deposits based upon the depository’s risk based capital ratio. Based on the criteria described in GASB Statement No. 40, Deposits and Investment Risk Disclosures, $57,161,617 of CREC’s bank balance of $57,942,902 was exposed to custodial credit risk as follows:
Uninsured and uncollateralized $ 51,416,855 Uninsured and collateral held by the pledging bank’s trust department, not in the CREC’s name 5,744,762
Total Amount Subject to Custodial Credit Risk $ 57,161,617

CAPITOL REGION EDUCATION COUNCIL
NOTES TO FINANCIAL STATEMENTS (CONTINUED)
JUNE 30, 2012
30
Cash Equivalents
Cash equivalents are short-term, highly liquid investments that are both readily convertible to known amounts of cash and purchased within 90 days of maturity. At June 30, 2012, CREC’s cash equivalents amounted to $506,498 and all are U.S. government guaranteed obligations. B. Investments
Investments as of June 30, 2012 in all funds are as follows:
Investment Maturities (Years) Credit Fair Less More
Investment Type Rating Value Than 1 1 - 10 Than 10 Interest-bearing investments:
Certificates of deposit * $ 82,995 $ 65,548 $ 17,447 $ - * Subject to coverage by federal depository insurance and collateralization as described under “Deposits” above.
Interest Rate Risk - CREC’s investments have maximum final stated maturities of 15 years, unless specific authority is given to exceed. To the extent possible, CREC will attempt to match its investments with anticipated cash flow requirements.
Credit Risk - Investments - As indicated above, State Statutes limit the investment options. CREC has an investment policy that allows the same type of investments as State Statutes. Concentration of Credit Risk - CREC has no policy limiting an investment in any one issuer that is in excess of 5% of the CREC’s total investments.
Custodial Credit Risk - Custodial credit risk for an investment is the risk that, in the event of the failure of the counterparty (the institution that pledges collateral or repurchase agreement securities to CREC or that sells investments to or buys them for CREC), CREC will not be able to recover the value of its investments or collateral securities that are in the possession of an outside party. CREC does not have a policy for custodial credit risk. At June 30, 2012, CREC did not have any uninsured and unregistered securities held by the counterparty, or by its trust department or agent, that were not in CREC’s name.
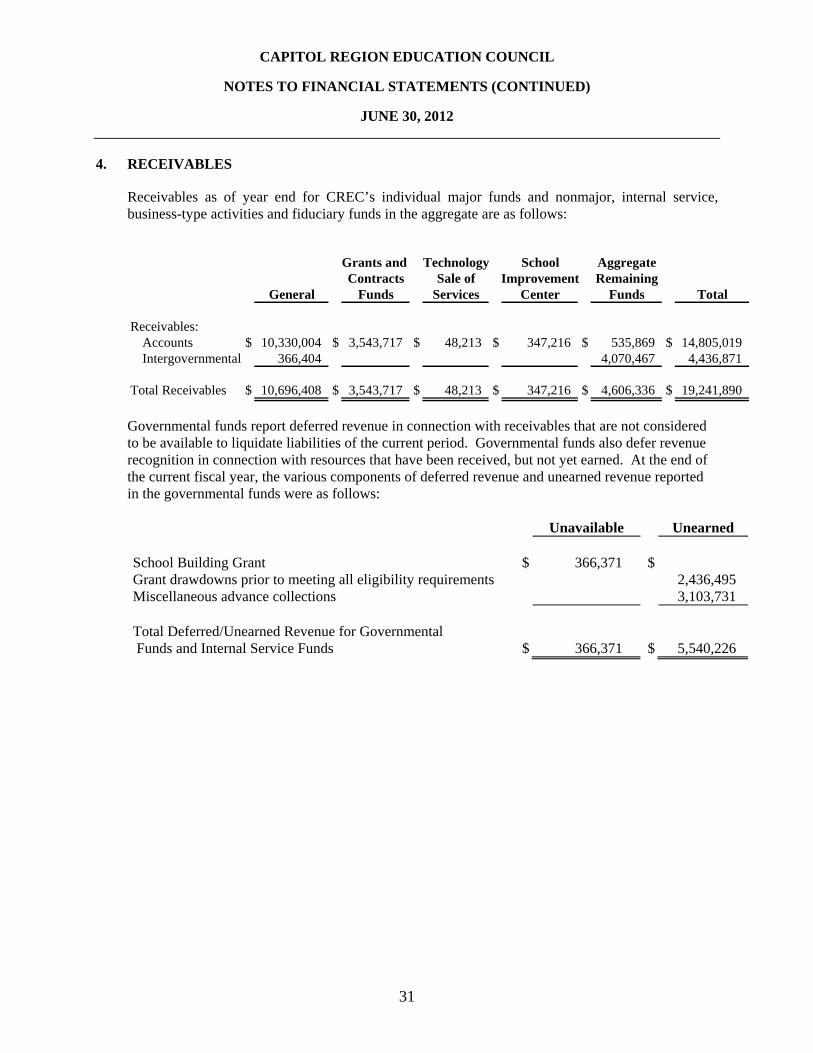
CAPITOL REGION EDUCATION COUNCIL
NOTES TO FINANCIAL STATEMENTS (CONTINUED)
JUNE 30, 2012
31
4. RECEIVABLES
Receivables as of year end for CREC’s individual major funds and nonmajor, internal service, business-type activities and fiduciary funds in the aggregate are as follows:
Grants and Technology School AggregateContracts Sale of Improvement Remaining
General Funds Services Center Funds Total
Receivables: Accounts $ 10,330,004 $ 3,543,717 $ 48,213 $ 347,216 $ 535,869 $ 14,805,019Intergovernmental 366,404 4,070,467 4,436,871
Total Receivables $ 10,696,408 $ 3,543,717 $ 48,213 $ 347,216 $ 4,606,336 $ 19,241,890
Governmental funds report deferred revenue in connection with receivables that are not considered to be available to liquidate liabilities of the current period. Governmental funds also defer revenue recognition in connection with resources that have been received, but not yet earned. At the end of the current fiscal year, the various components of deferred revenue and unearned revenue reported in the governmental funds were as follows:
Unavailable Unearned School Building Grant $ 366,371 $ Grant drawdowns prior to meeting all eligibility requirements 2,436,495 Miscellaneous advance collections 3,103,731 Total Deferred/Unearned Revenue for Governmental Funds and Internal Service Funds $ 366,371 $ 5,540,226

CAPITOL REGION EDUCATION COUNCIL
NOTES TO FINANCIAL STATEMENTS (CONTINUED)
JUNE 30, 2012
32
5. CAPITAL ASSETS
Capital asset activity for the year ended June 30, 2012 was as follows:
Beginning EndingBalance Increases Decreases Balance
Governmental activities: Capital assets not being depreciated:
Land $ 2,224,925 $ 7,783,250 $ $ 10,008,175Construction in progress 1,760,797 8,922,678 10,683,475
Total capital assets not being depreciated 3,985,722 16,705,928 - 20,691,650
Capital assets being depreciated: Buildings and improvements 80,040,028 1,841,753 81,881,781Vehicles 1,679,985 283,920 1,963,905 Furniture, fixtures and equipment 8,104,067 1,367,654 (1,470,881) 8,000,840
Total capital assets being depreciated 89,824,080 3,493,327 (1,470,881) 91,846,526
Less accumulated depreciation for: Buildings and improvements (24,772,014) (2,850,117) (27,622,131)Vehicles (1,121,893) (156,695) (1,278,588) Furniture, fixtures and equipment (5,644,306) (669,152) 1,470,881 (4,842,577)
Total accumulated depreciation (31,538,213) (3,675,964) 1,470,881 (33,743,296)
Total capital assets being depreciated, net 58,285,867 (182,637) - 58,103,230
Governmental Activities Capital Assets, Net $ 62,271,589 $ 16,523,291 $ - $ 78,794,880
Business-type activities: Furniture, fixtures and equipment $ 88,947 $ 16,741 $ (13,355) $ 92,333 Less accumulated depreciation (75,073) (4,491) 13,355 (66,209)
Business-Type Activities Capital Assets, Net $ 13,874 $ 12,250 $ - $ 26,124
Depreciation expense was charged to functions/programs of the government as follows:
Governmental activities: Education $ 3,532,098 Facilities 134,601 Administration 9,265
Total Depreciation Expense - Governmental Activities $ 3,675,964
Business-type activities: Technology Sale of Services $ 222 School Improvement Center 1,532 Learning Corridor Theater 693 Property and Equipment Rental 852 Construction Services 1,192
Total Depreciation Expense - Business-Type Activities $ 4,491

CAPITOL REGION EDUCATION COUNCIL
NOTES TO FINANCIAL STATEMENTS (CONTINUED)
JUNE 30, 2012
33
6. INTERFUND RECEIVABLES, PAYABLES AND TRANSFERS
Interfund loans generally are a result of negative equity in pooled cash. The composition of interfund balances as of June 30, 2012 is as follows:
Receivable Fund Payable Fund Amount General Fund Grants and Contracts Fund $ 1,974,906 Nonmajor Governmental Funds 4,372,707 Technology Sale of Services 671,257 School Improvement Center 745,555 Nonmajor Enterprise Funds 49,309 Internal Service Funds 3,300Internal Service Funds General Fund 1,145,574 Total $ 8,962,608
All balances are expected to be repaid within a year. Interfund transfers are used to 1) to move revenues from the fund with collection authorization to the debt service funds as debt service principal and interest payments become due, and 2) to supplement revenues of other funds. The transfers that occurred during the year are as follows:
Transfers In
Grants Nonmajorand Technology School Nonmajor Governmental
General Contracts Sale of Improvement Enterprise and OtherFund Fund Services Center Funds Funds Total
Transfers out:
General Fund $ $ 281,741 $ 216,281 $ 111,239 $ 268,373 $ 587,441 $ 1,465,075
Grants and Contracts Fund 1,840,794 1,840,794
Technology Sale of Services 65,850 65,850
School Improvement Center 126,746 126,746
Nonmajor Enterprise Funds 209,728 209,728
Nonmajor Governmental and
Other Funds 179,955 179,955
Total Transfers Out $ 2,423,073 $ 281,741 $ 216,281 $ 111,239 $ 268,373 $ 587,441 $ 3,888,148

CAPITOL REGION EDUCATION COUNCIL
NOTES TO FINANCIAL STATEMENTS (CONTINUED)
JUNE 30, 2012
34
7. LEASES
Operating Leases
CREC conducts a significant portion of its operations from leased facilities which include several schools or portions of schools, other educational facilities and office space. In addition, CREC leases copiers for use in various schools. The leases are classified as operating leases, which do not give rise to property rights or lease obligations. In most cases, management expects leases will be renewed or replaced by other leases in the normal course of business.
Rental expense for all operating leases, including facility leases with terms of one year or less, for the year ended June 30, 2012 was $3,822,914.
Capital Leases
CREC leases computer equipment and building improvements under capital leases. These lease agreements qualify as capital leases for accounting purposes and, therefore, have been recorded at the present value of their future minimum lease payments as of the inception date.
Governmental Activities Assets: Equipment $ 1,489,295 Building and improvement 432,876 Total assets 1,922,171 Less accumulated depreciation for: Equipment (823,442) Building and improvement (148,394) Total accumulated depreciation (971,836) Total $ 950,335
The future minimum lease obligations and the net present value of these payments as of June 30, 2012 were as follows:
Year Ending June 30 Amount 2013 $ 550,809 2014 292,393 2015 121,064 2016 43,105 2017 13,850 Total minimum lease payments 1,021,221 Less amount representing interest (48,290) Present Value of Minimum Lease Payments $ 972,931

CAPITOL REGION EDUCATION COUNCIL
NOTES TO FINANCIAL STATEMENTS (CONTINUED)
JUNE 30, 2012
35
8. LONG-TERM DEBT
Bond Anticipation Notes
On June 13, 2012, CREC issued $20,000,000 in bond anticipation notes bearing interest at 2% with a maturity date of March 7, 2013. These notes were issued to finance the ongoing school construction projects.
General Obligation Bonds
Bonds represent a 20-year bond with original outstanding amount of $6,650,000 and with a variable interest rate ranging from 4.5% to 6.75% due October 15, 2015. The bond was issued for school building renovation. The bond is secured by the general revenue-raising powers of CREC, and payment will be provided by General Fund and Debt Service Fund revenues.
Annual debt service requirements to maturity for the general obligation bond are as follows:
Governmental Activities Principal Interest
2013 $ 275,000 $ 64,969 2014 275,000 46,406 2015 275,000 27,844 2016 275,000 9,281 Total $ 1,100,000 $ 148,500
Notes payable represent a 20-year mortgage payable due in annual installments of $16,350 plus interest at 6% due in monthly installments through April 12, 2015. The loan with original amount of $327,000 was issued to finance the purchase of a parking lot. Annual debt service requirements to maturity for notes payable are as follows:
Governmental Activities Principal Interest 2013 $ 16,350 $ 2,943 2014 16,350 1,962 2015 16,350 981 Total $ 49,050 $ 5,886
In addition, CREC has a credit line agreement that provides for borrowings up to $10,000,000 as a revolving line of credit, with interest charged at the London Interbank Offering Rate. There was no balance due at June 30, 2012. The agreement contains various financial covenants.

CAPITOL REGION EDUCATION COUNCIL
NOTES TO FINANCIAL STATEMENTS (CONTINUED)
JUNE 30, 2012
36
Changes in Long-Term Liabilities
Long-term liability activity for the year ended June 30, 2012 was as follows:
Beginning Ending Due WithinBalance Increases Decreases Balance One Year
Governmental Activities: Bonds payable $ 1,480,000 $ $ (380,000) $ 1,100,000 $ 275,000 Notes payable 65,400 (16,350) 49,050 16,350 Capital leases 1,171,937 480,000 (679,006) 972,931 522,082 Net OPEB obligation 1,153,400 563,900 1,717,300 Compensated absences 1,094,346 355,739 (183,221) 1,266,864 191,403
Total Governmental Activities Long-Term Liabilities $ 4,965,083 $ 1,399,639 $ (1,258,577) $ 5,106,145 $ 1,004,835
For the governmental activities, compensated absences are generally liquidated by the General Fund.
9. RISK MANAGEMENT
CREC self-insures its employee health coverage. The plan is administered by an insurance company that processes and pays all claims, which are limited by stop-loss agreements, from the plan bank account. CREC maintains a balance in the account sufficient to fund the maximum allowable withdrawal by the insurance company. Claims are accrued at June 30, 2012 based on claims received subsequent to year-end within the allowable claim period. Claims of $990,415 are reflected in the accrued expenses of the Internal Service Fund at June 30, 2012. All claims are reflected in the statement of net assets as current liabilities. Liabilities of the fund are reported when it is probable that a loss has occurred and the amount of the loss can be reasonably estimated. Liabilities include an amount for claims that has been incurred but not reported (IBNR). The result of the process to estimate the claims liability is not an exact amount as it depends on many complex factors, such as inflation, changes in legal doctrines and damage awards. Accordingly, claims are reevaluated periodically to consider the effects of inflation, recent claim settlement trends (including frequency and amount of pay-outs) and other economic and social factors. The estimate of the claims liability also includes amounts for incremental claim adjustment expenses related to specific claims and other claim adjustment expenses regardless of whether allocated to specific claims. Estimated recoveries, for example for salvage or subrogation, are another component of the claims liability estimate. Changes in the claims liability for the past two years are as follows:
Accrued Current Year Accrued Accrued Liability Claims and Liability Liability Beginning of Changes in Claim End of Fiscal Year Estimates Payments Fiscal Year
2010-11 $ 732,950 $ 14,232,297 $ 14,184,497 $ 780,750 2011-12 780,750 17,037,631 16,827,966 990,415

CAPITOL REGION EDUCATION COUNCIL
NOTES TO FINANCIAL STATEMENTS (CONTINUED)
JUNE 30, 2012
37
As of January 1, 1995, CREC self-insures its contributions to the State’s unemployment fund. CREC maintains a balance in an account sufficient to fund expected unemployment claims. Claims paid through June 30, 2012 were $456,933.
CREC purchases commercial insurance for other risks. There has been no reduction in insurance coverage and there have been no settlements that exceeded insurance coverage in the past three fiscal years.
10. FUND BALANCE
The components of fund balance for the governmental funds at June 30, 2012 are as follows:
Grants and NonmajorGeneral Contracts Governmental
Fund Fund Funds TotalFund balances:
Nonspendable: Prepaids $ 1,950,092 $ 18,816 $ 1,000 $ 1,969,908 Permanent fund 17,000 17,000
Restricted for: Education 1,099,089 1,099,089 Debt obligations 933,944 933,944
Committed to: School construction projects 1,531,854 1,531,854
Assigned to: Future obligations 2,950,000 2,950,000 Debt obligations 800,000 800,000 Capital improvements 50,000 50,000 Legal costs 50,000 50,000 Venture capital 75,000 75,000 Payroll 1,000,000 1,000,000 Education 845 845
Unassigned 12,310,940 (2,356,637) (755,944) 9,198,359
Total Fund Balances $ 19,186,032 $ (1,238,732) $ 1,728,699 $ 19,675,999
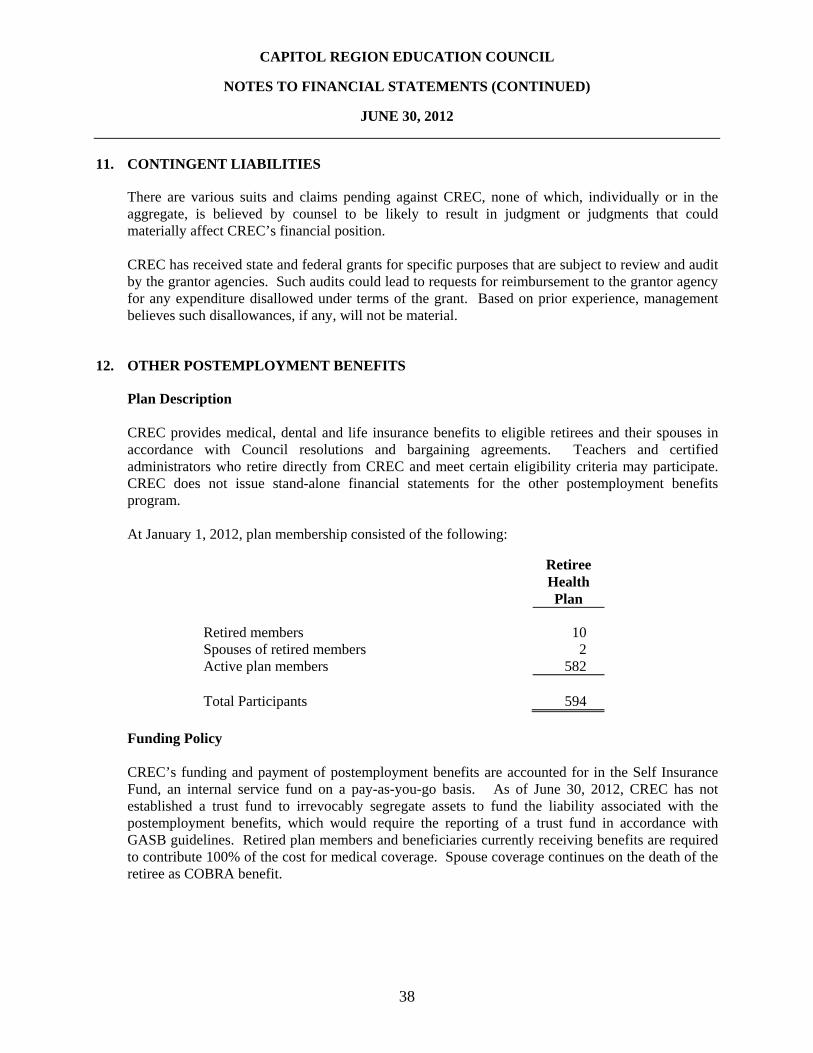
CAPITOL REGION EDUCATION COUNCIL
NOTES TO FINANCIAL STATEMENTS (CONTINUED)
JUNE 30, 2012
38
11. CONTINGENT LIABILITIES
There are various suits and claims pending against CREC, none of which, individually or in the aggregate, is believed by counsel to be likely to result in judgment or judgments that could materially affect CREC’s financial position. CREC has received state and federal grants for specific purposes that are subject to review and audit by the grantor agencies. Such audits could lead to requests for reimbursement to the grantor agency for any expenditure disallowed under terms of the grant. Based on prior experience, management believes such disallowances, if any, will not be material.
12. OTHER POSTEMPLOYMENT BENEFITS
Plan Description CREC provides medical, dental and life insurance benefits to eligible retirees and their spouses in accordance with Council resolutions and bargaining agreements. Teachers and certified administrators who retire directly from CREC and meet certain eligibility criteria may participate. CREC does not issue stand-alone financial statements for the other postemployment benefits program. At January 1, 2012, plan membership consisted of the following:
Retiree Health Plan
Retired members 10 Spouses of retired members 2 Active plan members 582
Total Participants 594
Funding Policy CREC’s funding and payment of postemployment benefits are accounted for in the Self Insurance Fund, an internal service fund on a pay-as-you-go basis. As of June 30, 2012, CREC has not established a trust fund to irrevocably segregate assets to fund the liability associated with the postemployment benefits, which would require the reporting of a trust fund in accordance with GASB guidelines. Retired plan members and beneficiaries currently receiving benefits are required to contribute 100% of the cost for medical coverage. Spouse coverage continues on the death of the retiree as COBRA benefit.

CAPITOL REGION EDUCATION COUNCIL
NOTES TO FINANCIAL STATEMENTS (CONTINUED)
JUNE 30, 2012
39
Annual OPEB Cost and Net OPEB Obligations
CREC’s annual other postemployment benefit (OPEB) cost is calculated based on the annual required contribution (ARC), an amount actuarially determined in accordance with the parameters of GASB Statement 45. The ARC represents a level of funding that, if paid on an ongoing basis, is projected to cover normal costs each year and amortize any unfunded actuarial liabilities (or funding excess) over a period not to exceed 30 years. The following table shows the components of the CREC’s annual OPEB cost for the year, the amount actually contributed to the plan and changes in the CREC’s net OPEB obligation:
Retiree Health Plan
Annual required contribution (ARC) $ 648,200 Interest on net OPEB obligation 46,100 Adjustment to annual required contribution (64,100) Annual OPEB cost 630,200 Contributions made 66,300 Increase in net OPEB obligation 563,900 Net OPEB obligation, beginning of year 1,153,400 Net OPEB Obligation, End of Year $ 1,717,300
CREC’s annual OPEB cost, the percentage of annual OPEB cost contributed to the plan, and the net OPEB obligation (asset) for the fiscal years ended June 30, 2012 are presented below.
Fiscal Annual Percentage NetYear OPEB Actual of AOC OPEB
Ended Cost (AOC) Contribution Contributed Obligation
6/30/10 $ 471,100 $ 150,400 31.9% $ 715,8006/30/11 622,600 185,000 29.7 1,153,4006/30/12 630,200 66,300 10.2 1,717,300
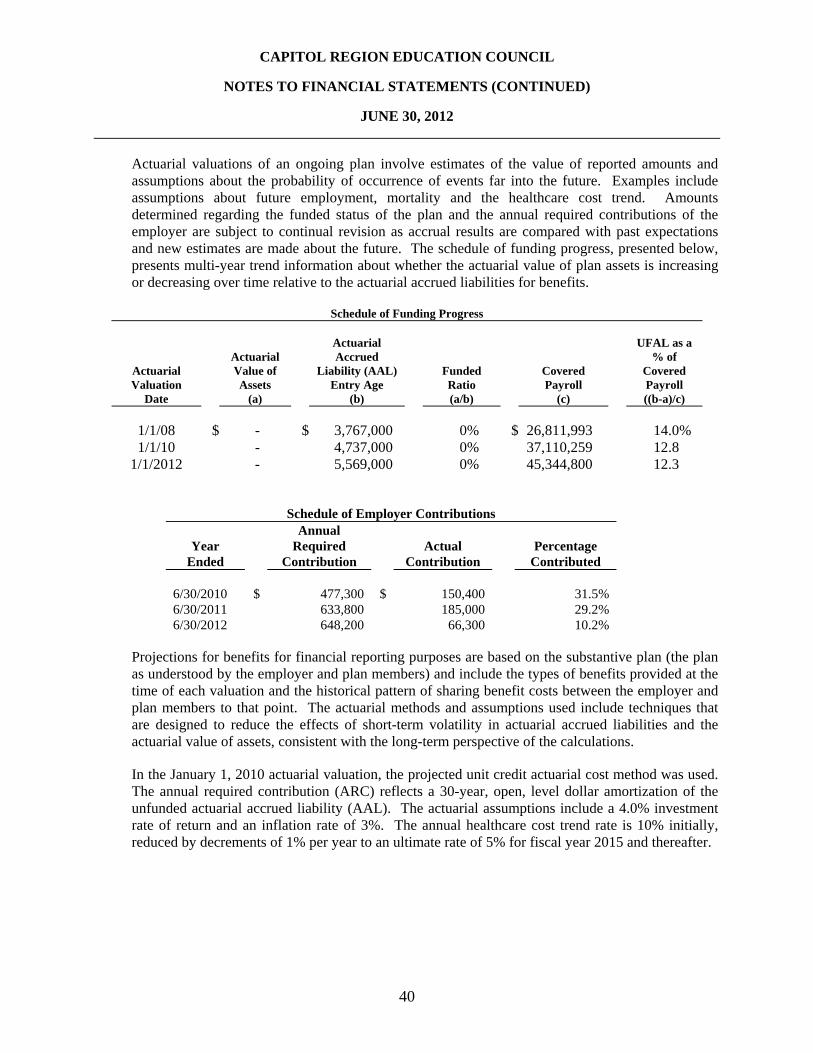
CAPITOL REGION EDUCATION COUNCIL
NOTES TO FINANCIAL STATEMENTS (CONTINUED)
JUNE 30, 2012
40
Actuarial valuations of an ongoing plan involve estimates of the value of reported amounts and assumptions about the probability of occurrence of events far into the future. Examples include assumptions about future employment, mortality and the healthcare cost trend. Amounts determined regarding the funded status of the plan and the annual required contributions of the employer are subject to continual revision as accrual results are compared with past expectations and new estimates are made about the future. The schedule of funding progress, presented below, presents multi-year trend information about whether the actuarial value of plan assets is increasing or decreasing over time relative to the actuarial accrued liabilities for benefits.
Schedule of Funding Progress Actuarial UFAL as a Actuarial Accrued % of
Actuarial Value of Liability (AAL) Funded Covered Covered Valuation Assets Entry Age Ratio Payroll Payroll
Date (a) (b) (a/b) (c) ((b-a)/c)
1/1/08 $ - $ 3,767,000 0% $ 26,811,993 14.0% 1/1/10 - 4,737,000 0% 37,110,259 12.8
1/1/2012 - 5,569,000 0% 45,344,800 12.3
Schedule of Employer Contributions Annual
Year Required Actual Percentage Ended Contribution Contribution Contributed
6/30/2010 $ 477,300 $ 150,400 31.5% 6/30/2011 633,800 185,000 29.2% 6/30/2012 648,200 66,300 10.2%
Projections for benefits for financial reporting purposes are based on the substantive plan (the plan as understood by the employer and plan members) and include the types of benefits provided at the time of each valuation and the historical pattern of sharing benefit costs between the employer and plan members to that point. The actuarial methods and assumptions used include techniques that are designed to reduce the effects of short-term volatility in actuarial accrued liabilities and the actuarial value of assets, consistent with the long-term perspective of the calculations.
In the January 1, 2010 actuarial valuation, the projected unit credit actuarial cost method was used. The annual required contribution (ARC) reflects a 30-year, open, level dollar amortization of the unfunded actuarial accrued liability (AAL). The actuarial assumptions include a 4.0% investment rate of return and an inflation rate of 3%. The annual healthcare cost trend rate is 10% initially, reduced by decrements of 1% per year to an ultimate rate of 5% for fiscal year 2015 and thereafter.

CAPITOL REGION EDUCATION COUNCIL
NOTES TO FINANCIAL STATEMENTS (CONTINUED)
JUNE 30, 2012
41
13. EMPLOYEE RETIREMENT PLAN
Defined Contribution Pension Plan The Capitol Region Education Council sponsors the CREC Savings and Retirement Plan, a 403(b)
defined contribution pension plan established July 1, 1997 to provide benefits at retirement to all noncertified employees of CREC.
Plan members may elect to contribute up to the IRS maximum. CREC matches eligible member
contributions up to 5% of covered salary. At June 30, 2012, there were 1,006 plan members. Diversified Investment Advisors administer the retirement plan. Plan provisions and contribution requirements are established and may be amended by the CREC Board.
Employer and plan member contributions are recognized in the period contributions are due.
Employer and employee contributions for the year ended June 30, 2012 were $1,194,379 and $4,393,728, respectively.
Plan investments are participant directed. CREC has no fiduciary responsibility for the plan assets. Teacher Retirement Teachers participate in the State of Connecticut Teacher’s Retirement System, a cost-sharing plan
with a special funding situation, under Section 10.183 of the General Statutes of the State of Connecticut. This is a multiple employer PERS. A teacher is eligible to receive a normal retirement benefit if he or she has:
Attained age 60 and has accumulated 20 years of credited service in the public schools of
Connecticut, or;
Attained any age and has accumulated 35 years of credited service, at least 25 years of which are service in the public schools of Connecticut.
CREC withholds 7.25% of all certified teachers’ annual earnings and transmits the funds to the
State Teachers’ Retirement Board. CREC does not contribute to the plan. Prior to July 1, 1989, teachers were vested in their contributions up to 5% of their earnings prior to five years of service. After five years of service, teachers were fully vested in their own contributions. After 10 years of service, teachers are fully vested and entitled to a monthly pension benefit that is payable at the age of 60. The State of Connecticut contributes amounts based on the actuarial reserve basis described in C.G.S. Sections 10-183 b (7). The State’s contribution to the plan on behalf of CREC for the fiscal year ended June 30, 2012 was $9,962,511 and is recognized in the governmental funds GAAP-basis statement of revenues, expenditures and changes in fund balances. For the year ended June 30, 2012, teachers of CREC contributed $3,557,756 to the plan, and covered payroll for the year was $49,068,400.
The State of Connecticut Teacher Retirement System is considered to be a part of the State of
Connecticut financial reporting entity and is included in the State’s financial reports as a pension trust fund. Those reports may be obtained by writing to the State of Connecticut, Office of the State Comptroller, 55 Elm Street, Hartford, Connecticut 06106.

This page is intentionally left blank.

Required Supplementary Information

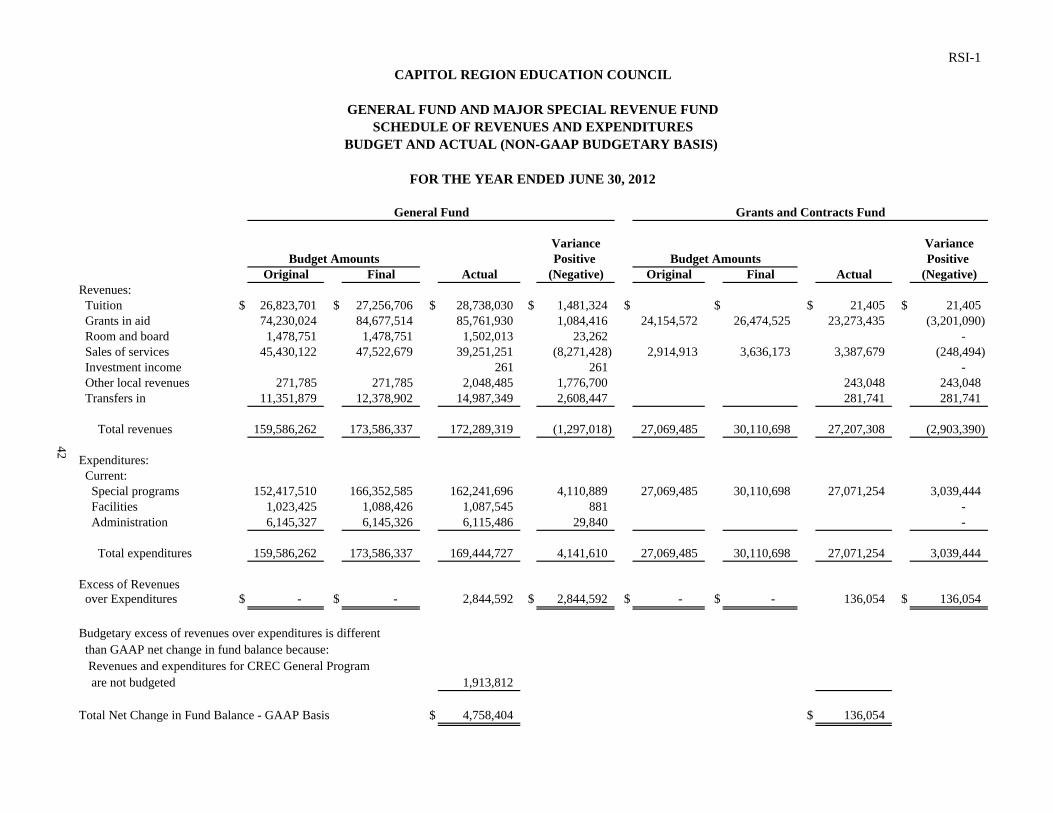
RSI-1CAPITOL REGION EDUCATION COUNCIL
GENERAL FUND AND MAJOR SPECIAL REVENUE FUNDSCHEDULE OF REVENUES AND EXPENDITURES
BUDGET AND ACTUAL (NON-GAAP BUDGETARY BASIS)
FOR THE YEAR ENDED JUNE 30, 2012
Variance VariancePositive Positive
Original Final Actual (Negative) Original Final Actual (Negative)Revenues: Tuition $ 26,823,701 $ 27,256,706 $ 28,738,030 $ 1,481,324 $ $ $ 21,405 $ 21,405 Grants in aid 74,230,024 84,677,514 85,761,930 1,084,416 24,154,572 26,474,525 23,273,435 (3,201,090) Room and board 1,478,751 1,478,751 1,502,013 23,262 - Sales of services 45,430,122 47,522,679 39,251,251 (8,271,428) 2,914,913 3,636,173 3,387,679 (248,494) Investment income 261 261 - Other local revenues 271,785 271,785 2,048,485 1,776,700 243,048 243,048 Transfers in 11,351,879 12,378,902 14,987,349 2,608,447 281,741 281,741
Total revenues 159,586,262 173,586,337 172,289,319 (1,297,018) 27,069,485 30,110,698 27,207,308 (2,903,390)
Expenditures: Current: Special programs 152,417,510 166,352,585 162,241,696 4,110,889 27,069,485 30,110,698 27,071,254 3,039,444 Facilities 1,023,425 1,088,426 1,087,545 881 - Administration 6,145,327 6,145,326 6,115,486 29,840 -
Total expenditures 159,586,262 173,586,337 169,444,727 4,141,610 27,069,485 30,110,698 27,071,254 3,039,444
Excess of Revenues over Expenditures $ - $ - 2,844,592 $ 2,844,592 $ - $ - 136,054 $ 136,054
Budgetary excess of revenues over expenditures is different than GAAP net change in fund balance because: Revenues and expenditures for CREC General Program are not budgeted 1,913,812
Total Net Change in Fund Balance - GAAP Basis $ 4,758,404 $ 136,054
42
Budget Amounts
General Fund
Budget Amounts
Grants and Contracts Fund

This page is intentionally left blank.

Combining and Individual Fund Statements and Schedules


General Fund


GENERAL FUND ADMINISTRATION PROGRAMS
CREC GENERAL - This program accounts for administrative revenues and Council-designated special purpose funds. EXECUTIVE DIRECTOR - The Executive Director directs the entire agency subject to the governance of its Council. ASSISTANT EXECUTIVE DIRECTOR - The Assistant Executive Director is responsible for the supervision and continued development of CREC’s divisions of Community Education, Institute of Teaching and Learning, Technical Assistance and Brokering Services, Instructional Technology and Grants. BUSINESS SERVICES - Business Services, which includes the offices of the Deputy Executive Director, Finance and Operations and the Comptroller, manages the receipt, accounting, investment and expenditure of monetary resources and the acquisition, inventory and disposition of physical resources and facilities of CREC. Accounting services, accounts payable, payroll services, accounts receivable, treasury, grants and budget management and loss prevention operate under the direction of Business Services. HUMAN RESOURCES - Human Resources provides all personnel services to employees and programs, including hiring, benefit and salary administration, record keeping, and employee policy and procedure administration. CREC’s Human Resources division also provides hiring and interviewing training to CREC LEAs, with particular emphasis on the Americans with Disabilities Act and sexual harassment awareness. COMMUNICATIONS - Communications promotes CREC’s mission, initiatives and accomplishments to school districts and other agencies. The office is also responsible for the production of CREC’s Annual Report, media relations and internal communications. STUDENT SERVICES - Student Services manages programs that offer highly specialized services for children with autism, adolescents experiencing emotional and/or behavioral difficulties, children with hearing impairment, and students who are medically fragile. The division also offers an array of early childhood services, including services to children from birth to age three who demonstrate developmental difficulties. The division offers school-based health clinics in magnet schools, and an array of mental health interventions. It also oversees educational services to pre-adjudicated adolescents at the three Hartford detention centers. Finally, the Student Services’ Integrated Program Model program provides high-quality occupational therapy, physical therapy and speech therapy to districts and families in need. INSTITUTE OF TEACHING AND LEARNING - The Institute of Teaching and Learning provides services and support to local school districts and CREC schools in curriculum, instruction and school leadership. GRANTS AND DEVELOPMENT OFFICE - Grants and Development identifies funding sources from grants, contracts, foundations and benefactors and provides leadership and technical assistance in the preparation of grant proposals internally and externally. TECHNICAL ASSISTANCE BROKERING SERVICES - Technical Assistance and Brokering Services offers training, technical assistance and staffing services to assist school administrators and educators. The division provides highly customized consultation to meet the specific needs of districts and agencies in Response to Intervention, student and program evaluations, special education and related services, online learning, staff brokering and other areas.
FACILITIES
ADMINISTRATIVE BUILDINGS COST CENTER - The costs of operating CREC’s central administrative buildings are met by rent paid on a proportionate basis by each of the programs using space at the facility.
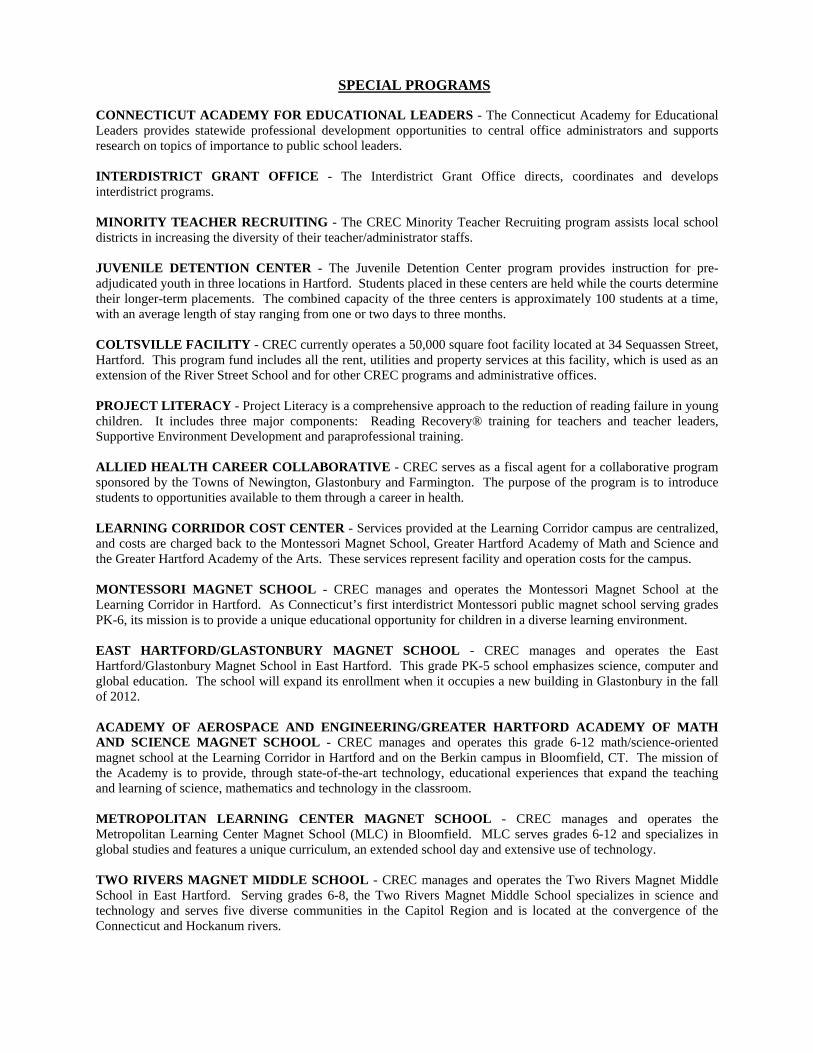
SPECIAL PROGRAMS
CONNECTICUT ACADEMY FOR EDUCATIONAL LEADERS - The Connecticut Academy for Educational Leaders provides statewide professional development opportunities to central office administrators and supports research on topics of importance to public school leaders. INTERDISTRICT GRANT OFFICE - The Interdistrict Grant Office directs, coordinates and develops interdistrict programs. MINORITY TEACHER RECRUITING - The CREC Minority Teacher Recruiting program assists local school districts in increasing the diversity of their teacher/administrator staffs. JUVENILE DETENTION CENTER - The Juvenile Detention Center program provides instruction for pre-adjudicated youth in three locations in Hartford. Students placed in these centers are held while the courts determine their longer-term placements. The combined capacity of the three centers is approximately 100 students at a time, with an average length of stay ranging from one or two days to three months. COLTSVILLE FACILITY - CREC currently operates a 50,000 square foot facility located at 34 Sequassen Street, Hartford. This program fund includes all the rent, utilities and property services at this facility, which is used as an extension of the River Street School and for other CREC programs and administrative offices. PROJECT LITERACY - Project Literacy is a comprehensive approach to the reduction of reading failure in young children. It includes three major components: Reading Recovery® training for teachers and teacher leaders, Supportive Environment Development and paraprofessional training. ALLIED HEALTH CAREER COLLABORATIVE - CREC serves as a fiscal agent for a collaborative program sponsored by the Towns of Newington, Glastonbury and Farmington. The purpose of the program is to introduce students to opportunities available to them through a career in health. LEARNING CORRIDOR COST CENTER - Services provided at the Learning Corridor campus are centralized, and costs are charged back to the Montessori Magnet School, Greater Hartford Academy of Math and Science and the Greater Hartford Academy of the Arts. These services represent facility and operation costs for the campus. MONTESSORI MAGNET SCHOOL - CREC manages and operates the Montessori Magnet School at the Learning Corridor in Hartford. As Connecticut’s first interdistrict Montessori public magnet school serving grades PK-6, its mission is to provide a unique educational opportunity for children in a diverse learning environment. EAST HARTFORD/GLASTONBURY MAGNET SCHOOL - CREC manages and operates the East Hartford/Glastonbury Magnet School in East Hartford. This grade PK-5 school emphasizes science, computer and global education. The school will expand its enrollment when it occupies a new building in Glastonbury in the fall of 2012. ACADEMY OF AEROSPACE AND ENGINEERING/GREATER HARTFORD ACADEMY OF MATH AND SCIENCE MAGNET SCHOOL - CREC manages and operates this grade 6-12 math/science-oriented magnet school at the Learning Corridor in Hartford and on the Berkin campus in Bloomfield, CT. The mission of the Academy is to provide, through state-of-the-art technology, educational experiences that expand the teaching and learning of science, mathematics and technology in the classroom. METROPOLITAN LEARNING CENTER MAGNET SCHOOL - CREC manages and operates the Metropolitan Learning Center Magnet School (MLC) in Bloomfield. MLC serves grades 6-12 and specializes in global studies and features a unique curriculum, an extended school day and extensive use of technology. TWO RIVERS MAGNET MIDDLE SCHOOL - CREC manages and operates the Two Rivers Magnet Middle School in East Hartford. Serving grades 6-8, the Two Rivers Magnet Middle School specializes in science and technology and serves five diverse communities in the Capitol Region and is located at the convergence of the Connecticut and Hockanum rivers.

CREC PUBLIC SAFETY ACADEMY - CREC manages and operates the CREC Public Safety Academy in Enfield. The school is the first of its kind in Connecticut, and was developed in partnership with state and local public safety agencies. This school serves grades 6-12 students. These students receive a rigorous academic curriculum and learn about careers in public safety from experts throughout the state. These careers include law enforcement, firefighting, emergency medical services, public safety communications and homeland security. UNIVERSITY OF HARTFORD MAGNET SCHOOL - CREC manages and operates the University of Hartford Magnet School (UHMS) in Hartford. The curriculum focus for UHMS is the infusion of Dr. Howard Gardner’s Theory of Multiple Intelligences into a PreK-fifth-grade school environment. SOUNDBRIDGE - Soundbridge is a highly specialized auditory and oral program for hearing impaired children from birth to 21 years of age. The program serves children in 90 Connecticut towns, with more than two-thirds of the children served in their home districts. The program also operates an Early Childhood Learning Center for typical and hearing impaired three-to-five year olds. RIVER STREET SCHOOL - River Street School offers highly specialized educational programming for students who require a very predictable, structured environment. The school responds to the needs of school districts that are hard-pressed to provide these resources locally, during the school year and over the summer. River Street serves autistic, developmentally delayed, learning disabled, pervasive developmentally delayed and behaviorally disordered students. The school also operates two residential facilities, both licensed by the State Department of Developmental Services. The residential facilities provide services for students attending the River Street School. POLARIS CENTER - The John J. Allison Polaris Center serves day students with severe emotional and behavior problems, through comprehensive treatment services and special education at middle school and high school levels. Services include individual, group and family therapy, adventure-based experiences and a full range of therapeutic activities. MAGNET SCHOOL COST CENTER - This program provides for the central office services required exclusively for the magnet schools. It includes the office of the Superintendent of Magnet Schools, curriculum and instruction services, pupil services, special education services, transportation, and facilities operations for the CREC Magnet Schools. These costs are allocated to the magnet schools. INTEGRATED PROGRAM MODEL - The Integrated Program Model provides a transdisciplinary approach of special education services to students with physical, cognitive and/or behavioral disabilities. The classrooms are located in public school settings where students can interact with their typical peers. FARMINGTON VALLEY DIAGNOSTIC CENTER - The Farmington Valley Diagnostic Center provides specialized diagnostic and education services for children who are having difficulties in achieving success in their local school districts. CREC works in collaboration with local school districts in the Farmington Valley area to design and provide effective strategies to increase student learning. SPECIAL EDUCATION TRANSPORTATION - This program serves districts by transporting special education students to their out-of-district school destinations. The program objectives are to increase service quality and reduce district costs. This is achieved by pairing neighboring districts whose students go to the same out-of-district schools and providing CREC vehicles driven by well-trained CREC employees. GREATER HARTFORD ACADEMY OF THE ARTS - CREC manages and operates the Greater Hartford Academy of the Arts at the Learning Corridor and the Sawtooth Building at Coltsville in Hartford. The Academy teaches grade 9-12 students vocal and instrumental music, theater, dance and creative writing. In addition to the beneficial arts experience, a major outcome of the program is the understanding that develops among students relating to cultural similarities. Relationships between the Academy and area universities have been developed to explore college credit and tuition abatement for Academy students. CENTER FOR CREATIVE YOUTH - The Center for Creative Youth (CCY), located at Wesleyan University in Middletown, Connecticut, is an intensive, pre-college summer residential arts program that achieves quality and integrated education through a comprehensive multicultural curriculum. CCY is a national model program that has served thousands of students since 1977.

GREAT PATH ACADEMY - CREC manages and operates the Great Path Academy, located at Manchester Community College. Great Path is a grade 10 through 12 high school with a learning environment that provides students from diverse backgrounds with academic and life skills gained in a blend of high school and college experiences. SCHOOL TRANSPORTATION MANAGEMENT SERVICES - This program centralizes the costs related to suburban transportation for the Hartford Public Magnet Schools. INTERNATIONAL MAGNET SCHOOL FOR GLOBAL CITIZENSHIP - CREC manages and operates this school, which serves preschool through third grade students and will expand in the future to serve students in PK-grade 5. The school focuses on developing knowledgeable, inquiring and caring young people who help create a better and more peaceful world through intercultural understanding and respect. REGGIO MAGNET SCHOOL OF THE ARTS - CREC manages and operates this school, which serves preschool through third grade students and will expand in the future to serve students in PK-grade 5. The school is based on four guiding principles: children must have control over the direction of their learning; children must be able to learn through experiences of touching, moving, listening, seeing and hearing; children have a relationship with other children and with material items in the world that children must be allowed to explore; and children must have endless ways and opportunities to express themselves. CHARTER SCHOOL FOR YOUNG CHILDREN ON ASYLUM HILL - CREC managed and operated this charter school, which was the result of a collaborative effort involving SDE, the Asylum Hill Congregational Church, Saint Joseph’s College and CREC. The school was developed to help meet the benchmarks of the 2008 Sheff Settlement Agreement. CREC operated the school and was accountable to its independent board of directors. The charter school was designed to educate children from preschool through grade 3. The program served 225 students from Hartford and its suburbs in an economically, racially and ethnically diverse setting. The charter school closed as of June 30, 2011 and reopened as the Museum Academy magnet school as of July 1, 2011. LINCOLN ACADEMY - Working in collaboration with 10 local school districts, the Lincoln Academy provides short term, specialized diagnostic and education services for children who are having difficulty achieving success in their local school districts. The program serves up to 30 middle and high school-aged students at any one time. Students will participate in a 5.25 hour day of instructional, recreational and group activities. Individual, group and family counseling, as well as ongoing psychiatric consultation, is provided to the students. MEDICAL PROFESSIONS AND TEACHER PREPARATION ACADEMY - CREC manages and operates the Medical Professions and Teacher Preparation Academy, which is located in Windsor. The Academy is designed to address the current and projected shortage areas in the medical and teaching professions. The Academy will expand in the future to serve students in grades 6-12 by Academy program offerings developed with the assistance of two partnering institutions, St. Francis Hospital and Medical Center and the University of Hartford. DISCOVERY ACADEMY - CREC manages and operates the Discovery Academy, which opened in September 2011 serving preschool and kindergarten students, and, in the future, will serve PK-grade 5. The Academy focuses on developing strong foundational knowledge for students in four interrelated domains of STEM literacy: science, technology, engineering and mathematics. MUSEUM ACADEMY - CREC manages and operates the Museum Academy (formerly The Charter School for Young Children on Asylum Hill) which opened July 1, 2011 and serves elementary school students and in the future, will serve PK-grade 5. The Academy focuses on providing a culturally diverse learning environment in collaboration with museums throughout the community. GREATER HARTFORD ACADEMY OF THE ARTS ELEMENTARY SCHOOL - CREC will manage and operate this elementary school which in the future, will serve PK-grade 5 and open in the fall of 2012. The school will provide students with the opportunity to explore vocal and instrumental music, visual art, dance, theatre, creative writing and interdisciplinary arts.

GREATER HARTFORD ACADEMY OF THE ARTS MIDDLE SCHOOL - CREC will manage and operate this middle school which in the future, will serve grades 6-8 and open in the fall of 2012. The school will provide students with the opportunity to explore vocal and instrumental music, visual art, dance, theatre, creative writing and interdisciplinary arts. TWO RIVERS MAGNET HIGH SCHOOL - CREC will manage and operate this high school, which, in the future, will serve grades 9-12 and open in the fall of 2012. The school will focus on environmental science and environmental engineering. Utilizing research-based teaching and learning practices in reading, mathematics, science and technology, students make interdisciplinary connections.

This page is intentionally left blank

EXHIBIT A-1
CAPITOL REGION EDUCATION COUNCILGENERAL FUND
BALANCE SHEET - BY PROGRAMJUNE 30, 2012
Administration
Assistant Institute of Grants andCREC Executive Executive Business Human Communications Student Teaching and Development
General Director Director Services Resources Services Services Learning Office
ASSETS
Cash and cash equivalents $ 21,979,261 $ 10,864 $ 11,195 $ 31,065 $ 45,006 $ 44,336 $ 24,304 $ 13,564 $ InvestmentsAccounts receivable 366,404 4,371 2,915 97 Due from other funds 8,912,884 365,842 Prepaid items 44,693
Total Assets $ 31,258,549 $ 15,235 $ 11,195 $ 441,600 $ 45,006 $ 44,336 $ 27,219 $ 13,564 $ 97
LIABILITIES AND FUND BALANCES
Liabilities: Accounts payable and accrued liabilities $ 282,498 $ 8,646 $ 9,017 $ 364,059 $ 27,006 $ 20,240 $ 12,006 $ 5,066 $ 8,916 Due to other funds 548,159 Deferred revenues 403 038 1 339 30 554
43
Deferred revenues 403,038 1,339 30,554 Bond anticipation notes payable 20,000,000 Total liabilities 20,685,536 9,985 9,017 394,613 27,006 20,240 12,006 5,066 557,075
Fund Balances:Nonspendable 44,693 Assigned 4,925,000 Unassigned 5,648,013 5,250 2,178 2,294 18,000 24,096 15,213 8,498 (556,978)
Total fund balances 10,573,013 5,250 2,178 46,987 18,000 24,096 15,213 8,498 (556,978)
Total Liabilities and Fund Balances $ 31,258,549 $ 15,235 $ 11,195 $ 441,600 $ 45,006 $ 44,336 $ 27,219 $ 13,564 $ 97
(Continued on next page)
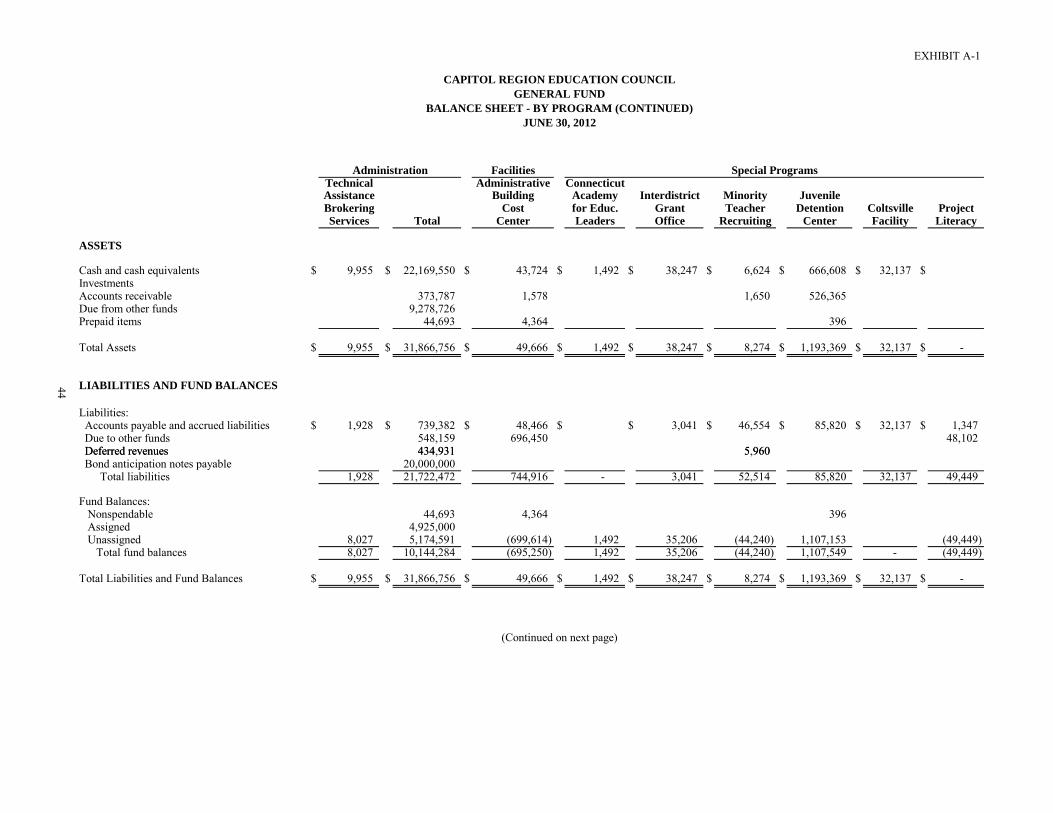
EXHIBIT A-1
ASSETS
Cash and cash equivalentsInvestmentsAccounts receivableDue from other fundsPrepaid items
Total Assets
LIABILITIES AND FUND BALANCES
Liabilities: Accounts payable and accrued liabilities Due to other fundsDeferred revenues
44
CAPITOL REGION EDUCATION COUNCILGENERAL FUND
BALANCE SHEET - BY PROGRAM (CONTINUED)JUNE 30, 2012
Administration Facilities Special ProgramsTechnical Administrative ConnecticutAssistance Building Academy Interdistrict Minority JuvenileBrokering Cost for Educ. Grant Teacher Detention Coltsville ProjectServices Total Center Leaders Office Recruiting Center Facility Literacy
$ 9,955 $ 22,169,550 $ 43,724 $ 1,492 $ 38,247 $ 6,624 $ 666,608 $ 32,137 $
373,787 1,578 1,650 526,365 9,278,726
44,693 4,364 396
$ 9,955 $ 31,866,756 $ 49,666 $ 1,492 $ 38,247 $ 8,274 $ 1,193,369 $ 32,137 $ -
$ 1,928 $ 739,382 $ 48,466 $ $ 3,041 $ 46,554 $ 85,820 $ 32,137 $ 1,347 548,159 696,450 48,102 434 931 5 960 Deferred revenues
Bond anticipation notes payable Total liabilities
Fund Balances:NonspendableAssignedUnassigned
Total fund balances
Total Liabilities and Fund Balances
434,931 5,960 20,000,000
1,928 21,722,472 744,916 - 3,041 52,514 85,820 32,137 49,449
44,693 4,364 396 4,925,000
8,027 5,174,591 (699,614) 1,492 35,206 (44,240) 1,107,153 (49,449) 8,027 10,144,284 (695,250) 1,492 35,206 (44,240) 1,107,549 - (49,449)
$ 9,955 $ 31,866,756 $ 49,666 $ 1,492 $ 38,247 $ 8,274 $ 1,193,369 $ 32,137 $ -
(Continued on next page)

EXHIBIT A-1
ASSETS
Cash and cash equivalentsInvestmentsAccounts receivableDue from other fundsPrepaid items
Total Assets
LIABILITIES AND FUND BALANCES
Liabilities: Accounts payable and accrued liabilities Due to other fundsDeferred revenues
45
CAPITOL REGION EDUCATION COUNCILGENERAL FUND
BALANCE SHEET - BY PROGRAM (CONTINUED)JUNE 30, 2012
Special ProgramsAllied Learning Aerospace/ Metropolitan Two Rivers CRECHealth Corridor Montessori East Hartford/ GHAMAS Learning Magnet PublicCareer Cost Magnet Glastonbury Magnet Center Middle Safety
Collaborative Center School Magnet School School Magnet School School Academy
$ 11,758 $ 417,963 $ 540,747 $ 631,401 $ 386,607 $ 1,405,693 $ 2,803,960 $ 992,302
2,000 172,667 6,203 113,819 117,458 162,024 218,428
495 313,180
$ 13,758 $ 417,963 $ 713,414 $ 638,099 $ 813,606 $ 1,523,151 $ 2,965,984 $ 1,210,730
$ $ 1,032,737 $ 175,762 $ 115,340 $ 762,934 $ 540,500 $ 833,702 $ 298,257
5 076 1 960 30 313 165 130 28 930 97 829 Deferred revenues Bond anticipation notes payable Total liabilities
Fund Balances:NonspendableAssignedUnassigned
Total fund balances
Total Liabilities and Fund Balances
5,076 1,960 30,313 165,130 28,930 97,829
5,076 1,032,737 177,722 145,653 928,064 569,430 833,702 396,086
495 313,180
8,682 (614,774) 535,692 491,951 (427,638) 953,721 2,132,282 814,644 8,682 (614,774) 535,692 492,446 (114,458) 953,721 2,132,282 814,644
$ 13,758 $ 417,963 $ 713,414 $ 638,099 $ 813,606 $ 1,523,151 $ 2,965,984 $ 1,210,730
(Continued on next page)
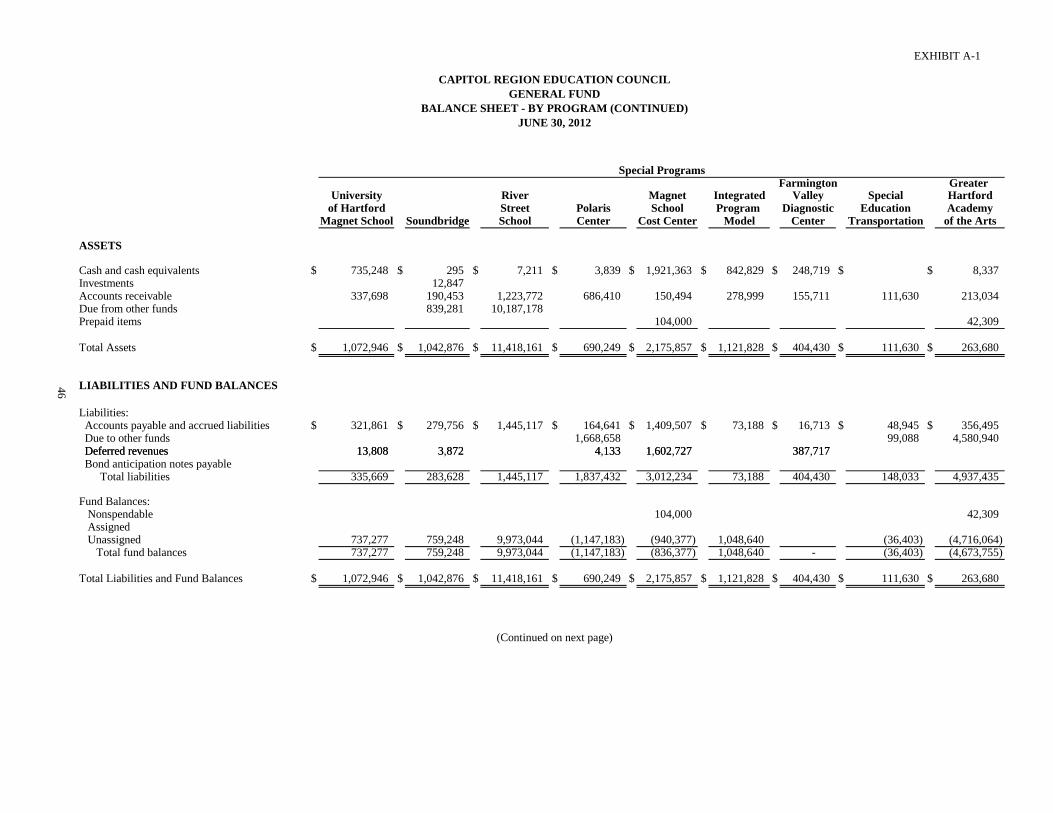
EXHIBIT A-1
ASSETS
Cash and cash equivalentsInvestmentsAccounts receivableDue from other fundsPrepaid items
Total Assets
LIABILITIES AND FUND BALANCES
Liabilities: Accounts payable and accrued liabilities Due to other fundsDeferred revenues
46
CAPITOL REGION EDUCATION COUNCILGENERAL FUND
BALANCE SHEET - BY PROGRAM (CONTINUED)JUNE 30, 2012
Special ProgramsFarmington Greater
University River Magnet Integrated Valley Special Hartfordof Hartford Street Polaris School Program Diagnostic Education Academy
Magnet School Soundbridge School Center Cost Center Model Center Transportation of the Arts
$ 735,248 $ 295 $ 7,211 $ 3,839 $ 1,921,363 $ 842,829 $ 248,719 $ $ 8,337 12,847
337,698 190,453 1,223,772 686,410 150,494 278,999 155,711 111,630 213,034 839,281 10,187,178
104,000 42,309
$ 1,072,946 $ 1,042,876 $ 11,418,161 $ 690,249 $ 2,175,857 $ 1,121,828 $ 404,430 $ 111,630 $ 263,680
$ 321,861 $ 279,756 $ 1,445,117 $ 164,641 $ 1,409,507 $ 73,188 $ 16,713 $ 48,945 $ 356,495 1,668,658 99,088 4,580,940
13 808 3 872 4 133 1 602 727 387 717 Deferred revenues Bond anticipation notes payable Total liabilities
Fund Balances:NonspendableAssignedUnassigned
Total fund balances
Total Liabilities and Fund Balances
13,808 3,872 4,133 1,602,727 387,717
335,669 283,628 1,445,117 1,837,432 3,012,234 73,188 404,430 148,033 4,937,435
104,000 42,309
737,277 759,248 9,973,044 (1,147,183) (940,377) 1,048,640 (36,403) (4,716,064) 737,277 759,248 9,973,044 (1,147,183) (836,377) 1,048,640 - (36,403) (4,673,755)
$ 1,072,946 $ 1,042,876 $ 11,418,161 $ 690,249 $ 2,175,857 $ 1,121,828 $ 404,430 $ 111,630 $ 263,680
(Continued on next page)

EXHIBIT A-1
ASSETS
Cash and cash equivalentsInvestmentsAccounts receivableDue from other fundsPrepaid items
Total Assets
LIABILITIES AND FUND BALANCES
Liabilities: Accounts payable and accrued liabilities Due to other fundsDeferred revenues
47
CAPITOL REGION EDUCATION COUNCILGENERAL FUND
BALANCE SHEET - BY PROGRAM (CONTINUED)JUNE 30, 2012
Special ProgramsSchool International Reggio Charter School Medical
Center for Great Transportation Magnet School Magnet for Young ProfessionsCreative Path Management for Global School of Children Lincoln and TeacherYouth Academy Services Citizenship the Arts on Asylum Hill Academy Prep Academy
$ 500 $ 257,222 $ $ $ $ $ $ 269,008 52,667 18,138 52,518 4,650,587 124,242 227,628 164,511 195,424
404,553 1,316,779 906 1,087,509 57,710
$ 475,858 $ 309,740 $ 4,650,587 $ 1,441,927 $ 1,315,137 $ - $ 164,511 $ 522,142
$ 5,740 $ 306,335 $ 177,392 $ 213,310 $ 1,504,351 $ $ 17,976 $ 205,949 4,522,391 1,703,478 1,058,612 183,262
430 343 18 452 12 754 Deferred revenues Bond anticipation notes payable Total liabilities
Fund Balances:NonspendableAssignedUnassigned
Total fund balances
Total Liabilities and Fund Balances
430,343 18,452 12,754
436,083 306,335 4,699,783 231,762 3,207,829 1,058,612 201,238 218,703
906 1,087,509 57,710
39,775 3,405 (49,196) 1,209,259 (2,980,201) (1,058,612) (36,727) 245,729 39,775 3,405 (49,196) 1,210,165 (1,892,692) (1,058,612) (36,727) 303,439
$ 475,858 $ 309,740 $ 4,650,587 $ 1,441,927 $ 1,315,137 $ - $ 164,511 $ 522,142
(Continued on next page)
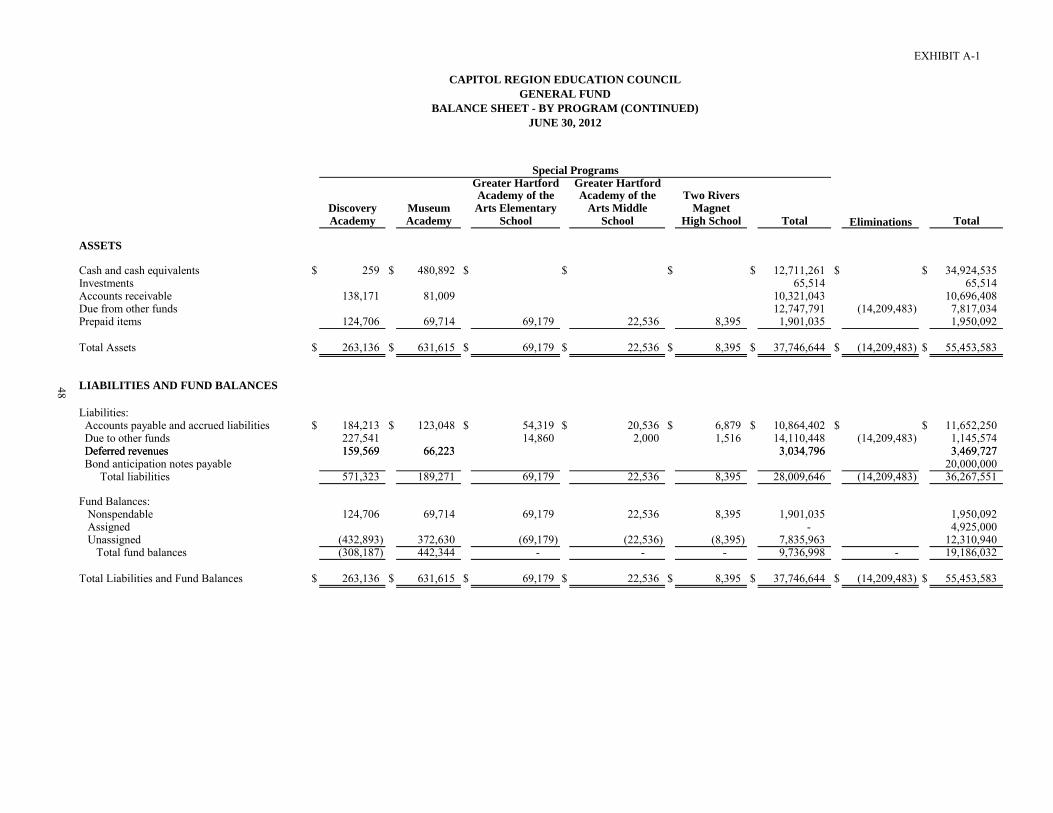
EXHIBIT A-1
ASSETS
Cash and cash equivalentsInvestmentsAccounts receivableDue from other fundsPrepaid items
Total Assets
LIABILITIES AND FUND BALANCES
Liabilities: Accounts payable and accrued liabilities Due to other fundsDeferred revenues
48
CAPITOL REGION EDUCATION COUNCILGENERAL FUND
BALANCE SHEET - BY PROGRAM (CONTINUED)JUNE 30, 2012
Special ProgramsGreater Hartford Greater HartfordAcademy of the Academy of the Two Rivers
Discovery Museum Arts Elementary Arts Middle MagnetAcademy Academy School School High School Total Eliminations Total
$ 259 $ 480,892 $ $ $ $ 12,711,261 $ $ 34,924,535 65,514 65,514
138,171 81,009 10,321,043 10,696,408 12,747,791 (14,209,483) 7,817,034
124,706 69,714 69,179 22,536 8,395 1,901,035 1,950,092
$ 263,136 $ 631,615 $ 69,179 $ 22,536 $ 8,395 $ 37,746,644 $ (14,209,483) $ 55,453,583
$ 184,213 $ 123,048 $ 54,319 $ 20,536 $ 6,879 $ 10,864,402 $ $ 11,652,250 227,541 14,860 2,000 1,516 14,110,448 (14,209,483) 1,145,574 159 569 66 223 3 034 796 3 469 727 Deferred revenues
Bond anticipation notes payable Total liabilities
Fund Balances:NonspendableAssignedUnassigned
Total fund balances
Total Liabilities and Fund Balances
159,569 66,223 3,034,796 3,469,727 20,000,000
571,323 189,271 69,179 22,536 8,395 28,009,646 (14,209,483) 36,267,551
124,706 69,714 69,179 22,536 8,395 1,901,035 1,950,092 - 4,925,000
(432,893) 372,630 (69,179) (22,536) (8,395) 7,835,963 12,310,940 (308,187) 442,344 - - - 9,736,998 - 19,186,032
$ 263,136 $ 631,615 $ 69,179 $ 22,536 $ 8,395 $ 37,746,644 $ (14,209,483) $ 55,453,583

EXHIBIT A-2CAPITOL REGION EDUCATION COUNCIL
GENERAL FUNDSCHEDULE OF REVENUES, EXPENDITURES AND CHANGES IN
FUND BALANCES - BY PROGRAMFOR THE YEAR ENDED JUNE 30, 2012
Assistant Institute of Grants andCREC Executive Executive Business Human Communications Student Teaching and Development
General Director Director Services Resources Services Services Learning OfficeRevenues: Tuition $ $ $ $ $ $ $ $ $ Grants in aid 10,324,281 Room and board Sales of services 2,432 872 2,915 241 Investment income 68,460 Other local revenues 28,643 4,544
Total revenues 10,392,741 28,643 - 6,976 - 872 2,915 241 -
Expenditures: Current: Salaries 237,788 173,868 1,817,947 617,236 185,662 120,294 94,722 133,214 Employee benefits 9,962,511 18,692 17,323 490,955 173,604 41,711 25,629 13,439 37,830 Purchased professional and technical services 549 1,649 502,632 16,965 2,255 11,891 1,350 10,907 Purchased property services 7,878 174 21,523 430 79 Other purchased services 54,932 5,873 7,093 193,738 21,352 24,437 14,266 6,848 8,415 Supplies 981 3,278 28,203 3,905 3,962 3,333 1,109 3,637
49
Administration
Property 827 117,200 3,272 8,864 2,353 2,801 Other uses of funds 7,082 1,774 24,737 1,540 516 1,068 103 595
Total expenditures 10,017,443 278,843 205,986 3,196,935 838,304 267,407 178,913 120,372 194,598
Excess (Deficiency) of Revenues over Expenditures 375,298 (250,200) (205,986) (3,189,959) (838,304) (266,535) (175,998) (120,131) (194,598)
Other Financing Sources (Uses): Transfers in 8,031,789 332,500 308,655 3,458,035 971,947 285,986 217,578 134,484 139,535 Transfers out (6,493,275) (80,977) (102,669) (261,050) (133,424) (13,951) (37,810) (14,103) (50)
Total other financing sources (uses) 1,538,514 251,523 205,986 3,196,985 838,523 272,035 179,768 120,381 139,485
Net Change in Fund Balances 1,913,812 1,323 - 7,026 219 5,500 3,770 250 (55,113)
Fund Balances at Beginning of Year 8,659,201 3,927 2,178 39,961 17,781 18,596 11,443 8,248 (501,865)
Fund Balances at End of Year $ 10,573,013 $ 5,250 $ 2,178 $ 46,987 $ 18,000 $ 24,096 $ 15,213 $ 8,498 $ (556,978)
(Continued on next page)

EXHIBIT A-2
Revenues: Tuition Grants in aid Room and board Sales of services Investment income Other local revenues
Total revenues
Expenditures: Current: Salaries Employee benefits Purchased professional and technical services Purchased property services Other purchased services Supplies
50
CAPITOL REGION EDUCATION COUNCILGENERAL FUND
SCHEDULE OF REVENUES, EXPENDITURES AND CHANGES INFUND BALANCES - BY PROGRAM (CONTINUED)
FOR THE YEAR ENDED JUNE 30, 2012
FacilitiesTechnical Administrative ConnecticutAssistance Building Academy Interdistrict Minority JuvenileBrokering Cost for Educ. Grant Teacher Detention Coltsville ProjectServices Total Center Leaders Office Recruiting Center Facility Literacy
$ $ - $ $ $ $ $ 1,599,646 $ $10,324,281 9,484 313,181
- 6,460 7,682 993 14,760 1,992 54,000
68,460 33,187 25
- 10,432,388 17,191 - 993 327,941 1,601,638 - 54,000
79,977 3,460,708 82,836 43,313 58,092 1,136,434 7,040 17,691 10,799,385 33,298 20,873 14,223 241,561 2,581
1,053 549,251 1,560 156 23,843 17,256 16,460 73 30,157 439,129 3,777
6,202 343,156 45,099 666 209,316 10,918 2,139 2,509 50,917 168,324 2,932 588 20,100
Special ProgramsAdministration
Property Other uses of funds
Total expenditures
Excess (Deficiency) of Revenues over Expenditures
Other Financing Sources (Uses): Transfers in Transfers out
Total other financing sources (uses)
Net Change in Fund Balances
Fund Balances at Beginning of Year
Fund Balances at End of Year
2,335 137,652 155,595 17,190 1,454 38,869 630 829 1,218 1,520
111,294 15,410,095 926,471 - 68,769 306,062 1,448,454 - 29,740
(111,294) (4,977,707) (909,280) - (67,776) 21,879 153,184 - 24,260
190,094 14,070,603 947,102 67,812 (78,800) (7,216,109) (161,074) (36) (21,879) (174,243) (5,400)
111,294 6,854,494 786,028 - 67,776 (21,879) (174,243) - (5,400)
- 1,876,787 (123,252) - - - (21,059) - 18,860
8,027 8,267,497 (571,998) 1,492 35,206 (44,240) 1,128,608 - (68,309)
$ 8,027 $ 10,144,284 $ (695,250) $ 1,492 $ 35,206 $ (44,240) $ 1,107,549 $ - $ (49,449)
(Continued on next page)
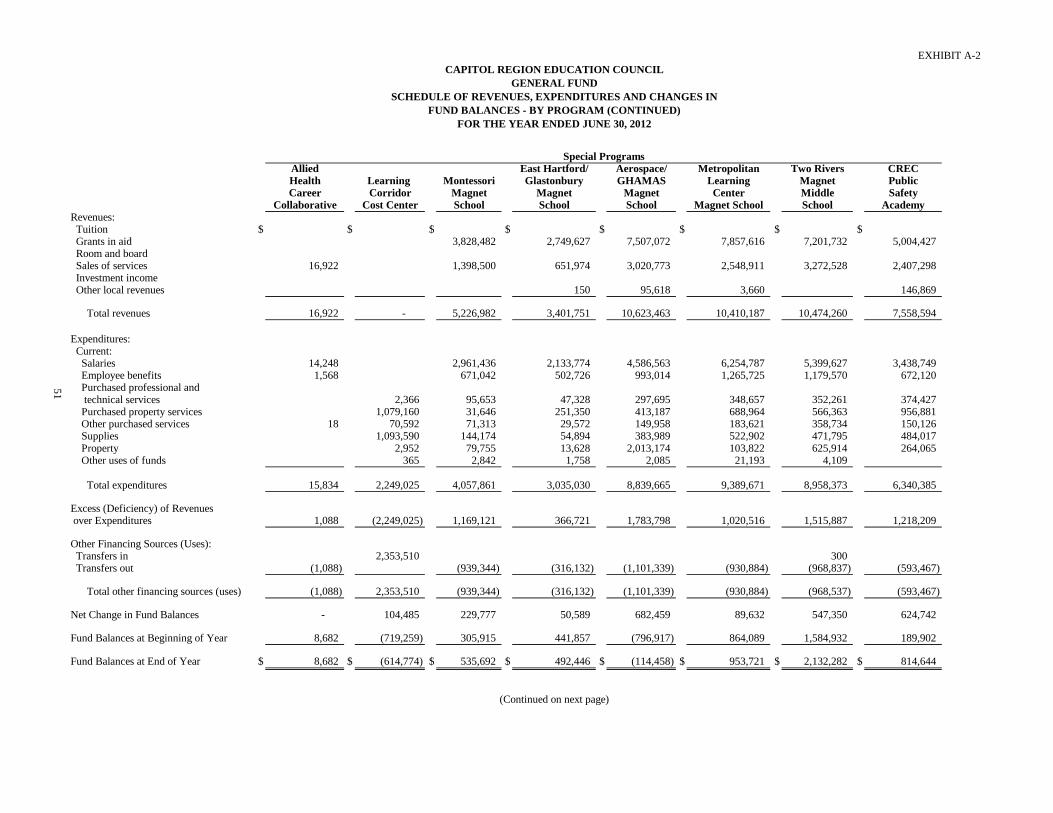
EXHIBIT A-2
Revenues: Tuition Grants in aid Room and board Sales of services Investment income Other local revenues
Total revenues
Expenditures: Current: Salaries Employee benefits Purchased professional and technical services Purchased property services Other purchased services Supplies
51
CAPITOL REGION EDUCATION COUNCILGENERAL FUND
SCHEDULE OF REVENUES, EXPENDITURES AND CHANGES INFUND BALANCES - BY PROGRAM (CONTINUED)
FOR THE YEAR ENDED JUNE 30, 2012
Special ProgramsAllied East Hartford/ Aerospace/ Metropolitan Two Rivers CRECHealth Learning Montessori Glastonbury GHAMAS Learning Magnet PublicCareer Corridor Magnet Magnet Magnet Center Middle Safety
Collaborative Cost Center School School School Magnet School School Academy
$ $ $ $ $ $ $ $3,828,482 2,749,627 7,507,072 7,857,616 7,201,732 5,004,427
16,922 1,398,500 651,974 3,020,773 2,548,911 3,272,528 2,407,298
150 95,618 3,660 146,869
16,922 - 5,226,982 3,401,751 10,623,463 10,410,187 10,474,260 7,558,594
14,248 2,961,436 2,133,774 4,586,563 6,254,787 5,399,627 3,438,749 1,568 671,042 502,726 993,014 1,265,725 1,179,570 672,120
2,366 95,653 47,328 297,695 348,657 352,261 374,427 1,079,160 31,646 251,350 413,187 688,964 566,363 956,881
18 70,592 71,313 29,572 149,958 183,621 358,734 150,126 1,093,590 144,174 54,894 383,989 522,902 471,795 484,017
Property Other uses of funds
Total expenditures
Excess (Deficiency) of Revenues over Expenditures
Other Financing Sources (Uses): Transfers in Transfers out
Total other financing sources (uses)
Net Change in Fund Balances
Fund Balances at Beginning of Year
Fund Balances at End of Year
2,952 79,755 13,628 2,013,174 103,822 625,914 264,065 365 2,842 1,758 2,085 21,193 4,109
15,834 2,249,025 4,057,861 3,035,030 8,839,665 9,389,671 8,958,373 6,340,385
1,088 (2,249,025) 1,169,121 366,721 1,783,798 1,020,516 1,515,887 1,218,209
2,353,510 300 (1,088) (939,344) (316,132) (1,101,339) (930,884) (968,837) (593,467)
(1,088) 2,353,510 (939,344) (316,132) (1,101,339) (930,884) (968,537) (593,467)
- 104,485 229,777 50,589 682,459 89,632 547,350 624,742
8,682 (719,259) 305,915 441,857 (796,917) 864,089 1,584,932 189,902
$ 8,682 $ (614,774) $ 535,692 $ 492,446 $ (114,458) $ 953,721 $ 2,132,282 $ 814,644
(Continued on next page)

EXHIBIT A-2
Revenues: Tuition Grants in aid Room and board Sales of services Investment income Other local revenues
Total revenues
Expenditures: Current: Salaries Employee benefits Purchased professional and technical services Purchased property services Other purchased services Supplies
52
CAPITOL REGION EDUCATION COUNCILGENERAL FUND
SCHEDULE OF REVENUES, EXPENDITURES AND CHANGES INFUND BALANCES - BY PROGRAM (CONTINUED)
FOR THE YEAR ENDED JUNE 30, 2012
Special ProgramsMagnet Farmington Greater
University River School Integrated Valley Special Hartfordof Hartford Street Polaris Cost Program Diagnostic Education Academy
Magnet School Soundbridge School Center Center Model Center Transportation of the Arts
$ $ 2,177,907 $ 19,042,840 $ 3,374,324 $ $ 1,072,201 $ 1,001,988 $ $ 79,607 4,840,478 527,688 155,576 9,707,929 6,418,676
1,492,313 2,280,898 2,877,740 7,097,138 281,709 47,480 1,988,697 1,300 503,930 3,205,407
55 172,908 156,740 5,904 350,216 60,103 86,993 171,859
7,294,284 5,740,130 27,638,195 4,161,825 9,815,512 3,147,891 1,003,288 503,930 9,875,549
4,444,886 3,513,340 16,159,981 2,641,087 3,170,482 2,288,507 564,387 620,210 5,793,992 920,763 952,684 4,758,566 756,108 408,652 575,441 166,905 252,141 1,711,925
155,033 29,808 455,528 152,761 571,321 18,781 10,795 6,520 123,894 361,720 208,087 1,029,918 92,561 36,930 53,114 138,003 49,612 879,158
73,150 221,794 138,874 51,742 8,507,815 26,895 6,406 54,150 120,194 405,067 160,834 710,625 332,267 83,489 15,799 26,120 226,335 556,614
Property Other uses of funds
Total expenditures
Excess (Deficiency) of Revenues over Expenditures
Other Financing Sources (Uses): Transfers in Transfers out
Total other financing sources (uses)
Net Change in Fund Balances
Fund Balances at Beginning of Year
Fund Balances at End of Year
34,857 321,468 1,051,395 17,283 52,200 721 809 118,193 116,410 5,592 46 6,285 3,108 20,229 150 1,107 3,235
6,401,068 5,408,061 24,311,172 4,046,917 12,851,118 2,979,258 913,575 1,328,268 9,305,422
893,216 332,069 3,327,023 114,908 (3,035,606) 168,633 89,713 (824,338) 570,127
92,499 26,165 311,042 3,934,291 280,408 934,845 (615,058) (566,290) (2,670,648) (410,424) (898,685) (89,178) (89,713) (125,493) (1,599,866)
(615,058) (473,791) (2,644,483) (99,382) 3,035,606 191,230 (89,713) 809,352 (1,599,866)
278,158 (141,722) 682,540 15,526 - 359,863 - (14,986) (1,029,739)
459,119 900,970 9,290,504 (1,162,709) (836,377) 688,777 - (21,417) (3,644,016)
$ 737,277 $ 759,248 $ 9,973,044 $ (1,147,183) $ (836,377) $ 1,048,640 $ - $ (36,403) $ (4,673,755)
(Continued on next page)

EXHIBIT A-2
Revenues: Tuition Grants in aid Room and board Sales of services Investment income Other local revenues
Total revenues
Expenditures: Current: Salaries Employee benefits Purchased professional and technical services Purchased property services Other purchased services Supplies
53
CAPITOL REGION EDUCATION COUNCILGENERAL FUND
SCHEDULE OF REVENUES, EXPENDITURES AND CHANGES INFUND BALANCES - BY PROGRAM (CONTINUED)
FOR THE YEAR ENDED JUNE 30, 2012
Special ProgramsSchool International Reggio Charter School Medical
Center for Great Transportation Magnet School Magnet for Young ProfessionsCreative Path Management for Global School of Children Lincoln and TeacherYouth Academy Services Citizenship the Arts on Asylum Hill Academy Prep Academy
$ 389,517 $ $ $ $ $ $ $148,000 2,757,552 11,614,065 3,346,331 3,320,655 3,416,705
9,700 5,081 947,311 12,437 1,467,324 1,417,994 483,665 1,296,964
206 92,017 238,280 127,119 102,184 46,352
644,521 3,943,143 11,626,502 4,940,774 4,840,833 - 483,665 4,760,021
243,460 2,252,401 758,635 2,400,205 2,721,642 362,515 1,923,993 39,118 500,955 59,398 625,939 664,535 85,873 457,144
38,544 41,562 100,596 142,574 6,434 345,665 1,003 162,709 102 532,916 522,005 13,528 817,529
281,990 442,675 10,790,923 48,143 43,592 4,632 54,277 4,892 160,720 357 162,976 391,229 14,129 262,355
Property Other uses of funds
Total expenditures
Excess (Deficiency) of Revenues over Expenditures
Other Financing Sources (Uses): Transfers in Transfers out
Total other financing sources (uses)
Net Change in Fund Balances
Fund Balances at Beginning of Year
Fund Balances at End of Year
580 31,951 60,476 242,156 6,482 132,246 50 1,794 8,452 518 450
609,637 3,594,767 11,609,415 3,939,703 4,728,251 - 493,593 3,993,659
34,884 348,376 17,087 1,001,071 112,582 - (9,928) 766,362
(34,678) (348,376) (66,283) (544,844) (479,720) (41,602) (360,694)
(34,678) (348,376) (66,283) (544,844) (479,720) - (41,602) (360,694)
206 - (49,196) 456,227 (367,138) - (51,530) 405,668
39,569 3,405 - 753,938 (1,525,554) (1,058,612) 14,803 (102,229)
$ 39,775 $ 3,405 $ (49,196) $ 1,210,165 $ (1,892,692) $ (1,058,612) $ (36,727) $ 303,439
(Continued on next page)
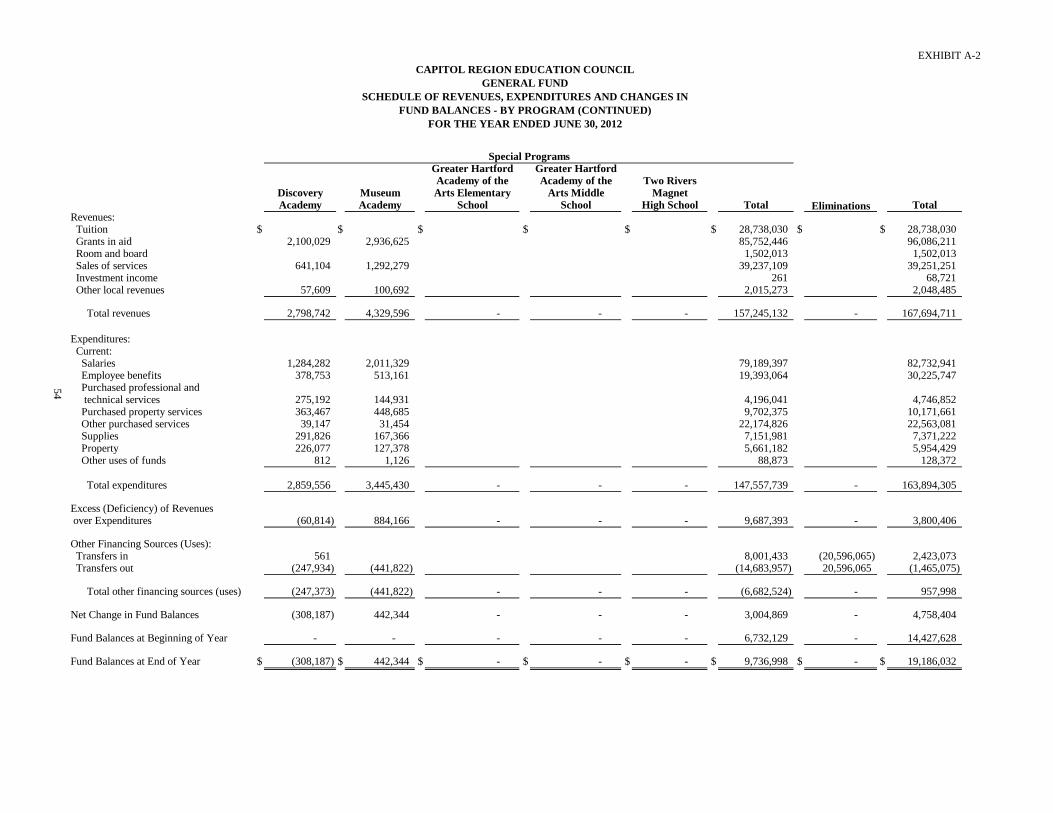
EXHIBIT A-2
Revenues: Tuition Grants in aid Room and board Sales of services Investment income Other local revenues
Total revenues
Expenditures: Current: Salaries Employee benefits Purchased professional and technical services Purchased property services Other purchased services Supplies
54
CAPITOL REGION EDUCATION COUNCILGENERAL FUND
SCHEDULE OF REVENUES, EXPENDITURES AND CHANGES INFUND BALANCES - BY PROGRAM (CONTINUED)
FOR THE YEAR ENDED JUNE 30, 2012
Special ProgramsGreater Hartford Greater HartfordAcademy of the Academy of the Two Rivers
Discovery Museum Arts Elementary Arts Middle MagnetAcademy Academy School School High School Total Eliminations Total
$ $ $ $ $ $ 28,738,030 $ $ 28,738,0302,100,029 2,936,625 85,752,446 96,086,211
1,502,013 1,502,013641,104 1,292,279 39,237,109 39,251,251
261 68,72157,609 100,692 2,015,273 2,048,485
2,798,742 4,329,596 - - - 157,245,132 - 167,694,711
1,284,282 2,011,329 79,189,397 82,732,941378,753 513,161 19,393,064 30,225,747
275,192 144,931 4,196,041 4,746,852363,467 448,685 9,702,375 10,171,66139,147 31,454 22,174,826 22,563,081
291,826 167,366 7,151,981 7,371,222 Property Other uses of funds
Total expenditures
Excess (Deficiency) of Revenues over Expenditures
Other Financing Sources (Uses): Transfers in Transfers out
Total other financing sources (uses)
Net Change in Fund Balances
Fund Balances at Beginning of Year
Fund Balances at End of Year
226,077 127,378 5,661,182 5,954,429812 1,126 88,873 128,372
2,859,556 3,445,430 - - - 147,557,739 - 163,894,305
(60,814) 884,166 - - - 9,687,393 - 3,800,406
561 8,001,433 (20,596,065) 2,423,073(247,934) (441,822) (14,683,957) 20,596,065 (1,465,075)
(247,373) (441,822) - - - (6,682,524) - 957,998
(308,187) 442,344 - - - 3,004,869 - 4,758,404
- - - - - 6,732,129 - 14,427,628
$ (308,187) $ 442,344 $ - $ - $ - $ 9,736,998 $ - $ 19,186,032

EXHIBIT A-3CAPITOL REGION EDUCATION COUNCILGENERAL FUND
SCHEDULE OF REVENUES AND EXPENDITURESBUDGET (NON-GAAP BUDGETARY BASIS) AND ACTUAL
FOR THE YEAR ENDED JUNE 30, 2012
Variance withFinal Budget -
Positive Original Final Actual (Negative)
Revenues:
Special Programs:
Tuition $ 26,823,701 $ 27,256,706 $ 28,738,030 $ 1,481,324
Grants in aid 74,230,024 84,677,514 85,752,446 1,074,932
Room and board 1,478,751 1,478,751 1,502,013 23,262
Sales of services 45,430,122 47,522,679 39,237,109 (8,285,570)
Investment income 261 261
Other local revenues 271,785 271,785 2,015,273 1,743,488
Transfers 4,183,128 5,145,151 8,001,433 2,856,282
Total special programs 152,417,511 166,352,586 165,246,565 (1,106,021)
Administration/Facilities:
Grants in aid 9,484 9,484
Sales of services 14,142 14,142
Other local revenues 33,212 33,212
Transfers 7,168,751 7,233,751 6,985,916 (247,835)
Total administration/facilities 7,168,751 7,233,751 7,042,754 (190,997)
T l 159 586 262 173 586 337 172 289 319 (1 297 018)
Budget Amounts
55
Total revenues 159,586,262 173,586,337 172,289,319 (1,297,018)
Expenditures:
Administration:
Executive Director 362,520 362,520 359,820 2,700
Assistant Executive Director 308,655 308,655 308,655 -
Business Services 3,458,037 3,458,037 3,457,985 52
Human Resources 971,947 971,947 971,728 219
Communications Services 281,487 281,487 281,358 129
Student Services 217,578 217,578 216,723 855
Institute of Teaching and Learning 134,484 134,484 134,475 9
Grants and Development Office 220,525 220,525 194,648 25,877
Technical Assistance Brokering Services 190,094 190,093 190,094 (1)
Total administration 6,145,327 6,145,326 6,115,486 29,840
Facilities:
Administrative Building Cost Center 1,023,425 1,088,426 1,087,545 881
(Continued on next page)
55
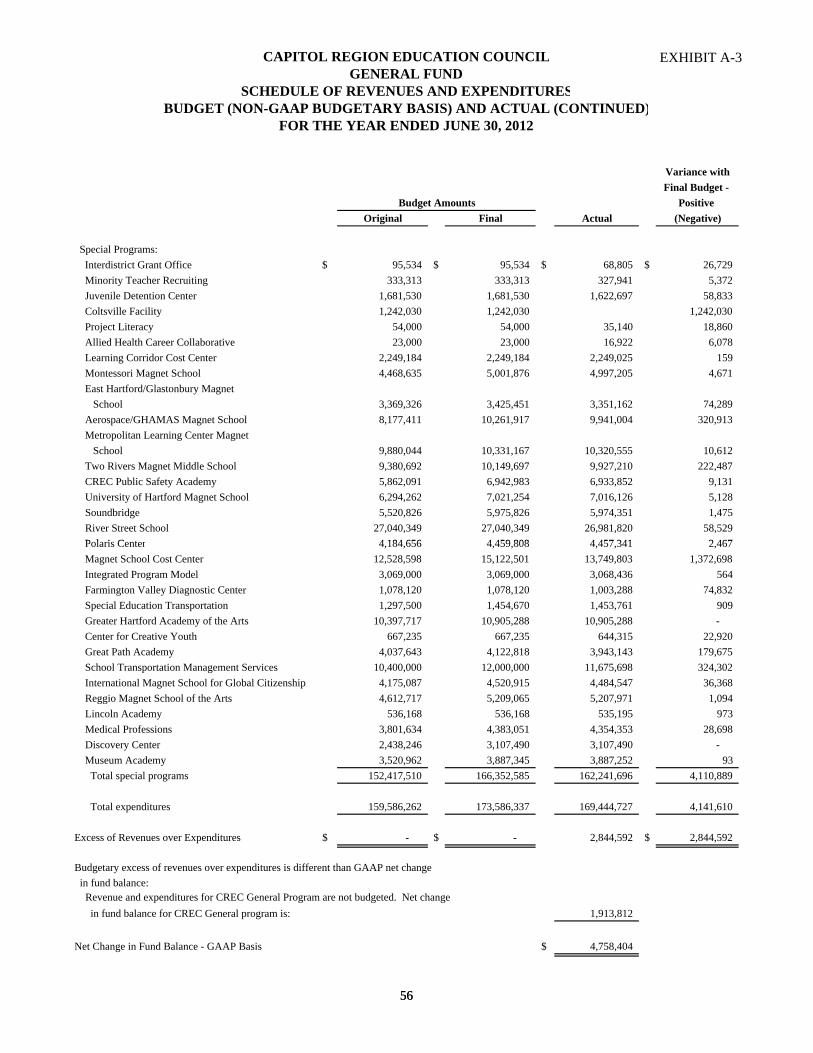
EXHIBIT A-3CAPITOL REGION EDUCATION COUNCILGENERAL FUND
SCHEDULE OF REVENUES AND EXPENDITURESBUDGET (NON-GAAP BUDGETARY BASIS) AND ACTUAL (CONTINUED)
FOR THE YEAR ENDED JUNE 30, 2012
Variance withFinal Budget -
Positive Original Final Actual (Negative)
Special Programs:
Interdistrict Grant Office $ 95,534 $ 95,534 $ 68,805 $ 26,729
Minority Teacher Recruiting 333,313 333,313 327,941 5,372
Juvenile Detention Center 1,681,530 1,681,530 1,622,697 58,833
Coltsville Facility 1,242,030 1,242,030 1,242,030
Project Literacy 54,000 54,000 35,140 18,860
Allied Health Career Collaborative 23,000 23,000 16,922 6,078
Learning Corridor Cost Center 2,249,184 2,249,184 2,249,025 159
Montessori Magnet School 4,468,635 5,001,876 4,997,205 4,671
East Hartford/Glastonbury Magnet
School 3,369,326 3,425,451 3,351,162 74,289
Aerospace/GHAMAS Magnet School 8,177,411 10,261,917 9,941,004 320,913
Metropolitan Learning Center Magnet
School 9,880,044 10,331,167 10,320,555 10,612
Two Rivers Magnet Middle School 9,380,692 10,149,697 9,927,210 222,487
CREC Public Safety Academy 5,862,091 6,942,983 6,933,852 9,131
University of Hartford Magnet School 6,294,262 7,021,254 7,016,126 5,128
Soundbridge 5,520,826 5,975,826 5,974,351 1,475
River Street School 27,040,349 27,040,349 26,981,820 58,529
P l i C t 4 184 656 4 459 808 4 457 341 2 467
Budget Amounts
56
Polaris Center 4,184,656 4,459,808 4,457,341 2,467
Magnet School Cost Center 12,528,598 15,122,501 13,749,803 1,372,698
Integrated Program Model 3,069,000 3,069,000 3,068,436 564
Farmington Valley Diagnostic Center 1,078,120 1,078,120 1,003,288 74,832
Special Education Transportation 1,297,500 1,454,670 1,453,761 909
Greater Hartford Academy of the Arts 10,397,717 10,905,288 10,905,288 -
Center for Creative Youth 667,235 667,235 644,315 22,920
Great Path Academy 4,037,643 4,122,818 3,943,143 179,675
School Transportation Management Services 10,400,000 12,000,000 11,675,698 324,302
International Magnet School for Global Citizenship 4,175,087 4,520,915 4,484,547 36,368
Reggio Magnet School of the Arts 4,612,717 5,209,065 5,207,971 1,094
Lincoln Academy 536,168 536,168 535,195 973
Medical Professions 3,801,634 4,383,051 4,354,353 28,698
Discovery Center 2,438,246 3,107,490 3,107,490 -
Museum Academy 3,520,962 3,887,345 3,887,252 93
Total special programs 152,417,510 166,352,585 162,241,696 4,110,889
Total expenditures 159,586,262 173,586,337 169,444,727 4,141,610
Excess of Revenues over Expenditures $ - $ - 2,844,592 $ 2,844,592
Budgetary excess of revenues over expenditures is different than GAAP net change
in fund balance: Revenue and expenditures for CREC General Program are not budgeted. Net change
in fund balance for CREC General program is: 1,913,812
Net Change in Fund Balance - GAAP Basis $ 4,758,404
56


SPECIAL REVENUE FUND
GRANTS AND CONTRACTS FUND
INTERDISTRICT GRANTS - CREC receives a variety of special purpose SDE funded grants to promote and support collaborative cooperative efforts among CREC member towns. PROJECT PACT - Project PACT (Perkins Access Consultation Team) provides consortium members with services that improve vocational programs in the area of technology education for all students, including those who are disadvantaged, have disabilities or have limited English proficiency. TEACHING AMERICAN HISTORY - The Teaching American History program, funded under the Elementary and Secondary Education Act, is designed to raise student achievement by improving teachers’ knowledge, understanding and appreciation of American history. CREC’s initiative includes partnerships with school districts (Bolton, East Hartford, Manchester, Plainville, Regional District 10, Vernon and West Hartford), the University of Connecticut (the History Department, Neag School of Education and the Thomas J. Dodd Research Center), as well as a number of local museums and historical societies. MAGNET SCHOOLS ASSISTANCE PROGRAM - CREC was awarded a three-year $11.5 million grant in 2010 to serve as lead agency for the Magnet Schools Assistance Program (MSAP). It is a consortium grant in partnership with the Hartford Public Schools, the State Department of Education and Goodwin College for the purpose of developing or restructuring eight (8) magnet schools in the Capitol Region. Funds are to be used primarily for activities associated with school startup, including curriculum and professional development, marketing, outreach and recruitment and partnership development. SPECIAL SERVICES SUPPORT TEAM - Services provided by this program include consultation, training and staff development to State agencies and local school districts in special education and regular education initiatives. RELATED SERVICES - Professional development, staffing and other services are provided for state agency programs. In addition, diagnostic services and grant coordination services are also provided. CONNECTICUT TECHNICAL HIGH SCHOOLS PROFESSIONAL DEVELOPMENT - This program is supported by a three-year contract from the Department of Education to provide professional development to the State Technical High Schools. SUMMER YOUTH EMPLOYMENT - CREC Summer Youth Employment Program serves students in the Greater Hartford area from July to August. This program focuses on project-based initiatives and service learning projects in partnership with other agencies. CAPITOL REGION CHOICE PROGRAM - The Capitol Region Choice Program enables the voluntary attendance of children in schools beyond their traditional attendance borders in an effort to reduce racial, ethnic and economic isolation. This program includes administration and transportation costs. SCHOOL TO CAREER INITIATIVES - School To Career Initiatives provide support to CREC school districts and others in the implementation of regional planning, school-based coordination, professional development, marketing and data collection. The Federal implementation funds received from the SDE allow CREC to disseminate guidance and curriculum materials to adult educators in the region. SUBURBAN YOUTH PROGRAMS - Capital Workforce Partners funds CREC to serve in-school and out-of-school youth between the ages of 14 and 21 under the Workforce Investment Act. PUPIL PARTNERS - Pupil Partners provides grant awards to schools whose proposals create partnerships between urban and suburban classrooms and/or schools for an integrated experience with a curricular focus. ENTITLEMENT GRANTS ARRA FUNDS - CREC was awarded Federal ARRA entitlement grants: Title I, Improving Basic Programs; Title II-D Improving Technology; a National School Lunch Equipment Assistance Grant; and an Enhancing Education Through Technology Grant. The funds are to be used to improve student achievement and help close the achievement gap through teacher quality, assessment standards, school improvements and data systems. ENTITLEMENT GRANTS FUNDS - CREC was awarded Federal entitlement grants: Title I, Improving Basic Programs; Title II-A, Teacher and Principal Training. The funds are used to reach one or more of five goals designed to improve student performance that the State Board of Education has adopted as part of the No Child Left Behind Act of 2001. DEPARTMENT OF CORRECTIONS PROFESSIONAL DEVELOPMENT - A contract from the State Department of Corrections was awarded to provide a comprehensive program of professional development and training to faculty and administrators of the Unified School District Number 1.

COMMUNITY EDUCATION - Community Education provides leadership, training and consulting services to improve the quality of adult education throughout Connecticut. METACOMET RIDGE ACADEMY - Metacomet Ridge Academy brings together high school students from ten school districts to collaborate on an interdisciplinary study of the Metacomet Ridge, a unique geological asset that has played a significant role in the economic, social, political and historical development of Connecticut. EQUAL SUMMER - EQUAL is a summer academic program that afforded students the opportunity to study one of three distinct curricula within a student population that is racially, ethnically and socioeconomically integrated. Funding is through an Interdistrict Cooperative Grant and small grants from private foundations. REGIONAL SCHOOL CHOICE OFFICE - The State Department of Education has awarded CREC a contract to assist with the development and implementation of the major components of the Sheff Comprehensive Management Plan (CMP). Items in the plan include marketing, transportation, the magnet school lottery, surveys, a parent intake center and professional development. FAMILY ENRICHMENT PROGRAM - Family Enrichment Program provides home-based family education and case management services to Hartford families who can benefit from a variety of services. The program serves families who have children between the ages of birth to 18 years old. HARTFORD ASSOCIATION FOR THE EDUCATION OF YOUNG CHILDREN (HAEYC) - This program is a local membership organization of the National Association for the Education of Young Children. HAEYC provides training opportunities, educational events and resources to members and to the general early childhood teacher community. BIRTH TO THREE - The Birth to Three program receives funds from the State Department of Developmental Services to provide home-based early intervention services to infants, toddlers and their families. The Birth to Three program collaborates with school districts and health and social service agencies on behalf of the children/families served. EMPLOYMENT TRAINING PROGRAM - CREC uses a variety of special purpose funds from SDE and the Federal Job Training Partnership Program to support efforts such as remedial reading instruction for students and to train and place young adults in the human services field. EARLY EDUCATION PROGRAMS - The CREC Early Education initiative works to support, coordinate, enhance and expand the existing CREC Early Childhood programs. CREC recognizes that a significant number of children in Greater Hartford do not have the benefit of high-quality early childhood educational experiences, and these children enter kindergarten with developmental and learning deficits that are difficult or impossible to overcome. With this in mind, CREC’s Early Education initiative works in partnership with the Connecticut State Department of Education, the U.S. Department of Education, local school districts and community agencies to improve existing services and support the establishment of early education centers that will expand the opportunities for all children in need of these programs. SUPPLEMENTAL SERVICES - CREC received a contract to create an Early Childhood Assessment and develop high-quality assessments for all K-2 students for language arts, mathematics and science that are age appropriate, valid, reliable, and align with the Connecticut Grade Level Expectations (GLEs). In addition, CREC received a contract to support the new Teacher Education and Mentoring (TEAM) program by developing the professional growth modules, delivering training for mentors and other district personnel; and providing technical assistance in creating TEAM infrastructures.

EXHIBIT B-1CAPITOL REGION EDUCATION COUNCIL
SPECIAL REVENUE FUND BALANCE SHEET - BY PROGRAM
JUNE 30, 2012
Special Connecticut CapitolTeaching Services Technical Summer Region
Interdistrict Project American MSAP Support Related High Youth ChoiceGrants PACT History Grant Team Services Schools Employment Program
ASSETS
Cash and cash equivalents $ 156,563 $ 29,225 $ $ $ 62,544 $ $ $ 7,994 $ 755,037 Accounts receivable 700 71,999 1,426,348 255,073 693,562 191,101 1,880 Prepaid items 1,657 14,206
Total Assets $ 157,263 $ 29,225 $ 71,999 $ 1,426,348 $ 317,617 $ 695,219 $ 191,101 $ 7,994 $ 771,123
LIABILITIES AND FUND BALANCES
Liabilities:
57
Grants and Contracts Fund
Accounts payable and accrued liabilities $ 58,941 $ 29,225 $ 23,594 $ 988,189 $ 89,425 $ 57,392 $ 27,361 $ 1,009 $ 252,375 Due to other funds 48,405 438,159 169,732 68,751 Deferred revenues 94,843 140,578 1,905,819
Total liabilities 153,784 29,225 71,999 1,426,348 230,003 227,124 96,112 1,009 2,158,194
Fund Balances:Nonspendable 1,657 14,206 Restricted 3,479 87,614 466,438 94,989 6,985 Unassigned (1,401,277)
Total fund balances 3,479 - - - 87,614 468,095 94,989 6,985 (1,387,071)
Total Liabilities and Fund Balances $ 157,263 $ 29,225 $ 71,999 $ 1,426,348 $ 317,617 $ 695,219 $ 191,101 $ 7,994 $ 771,123
(Continued on next page)
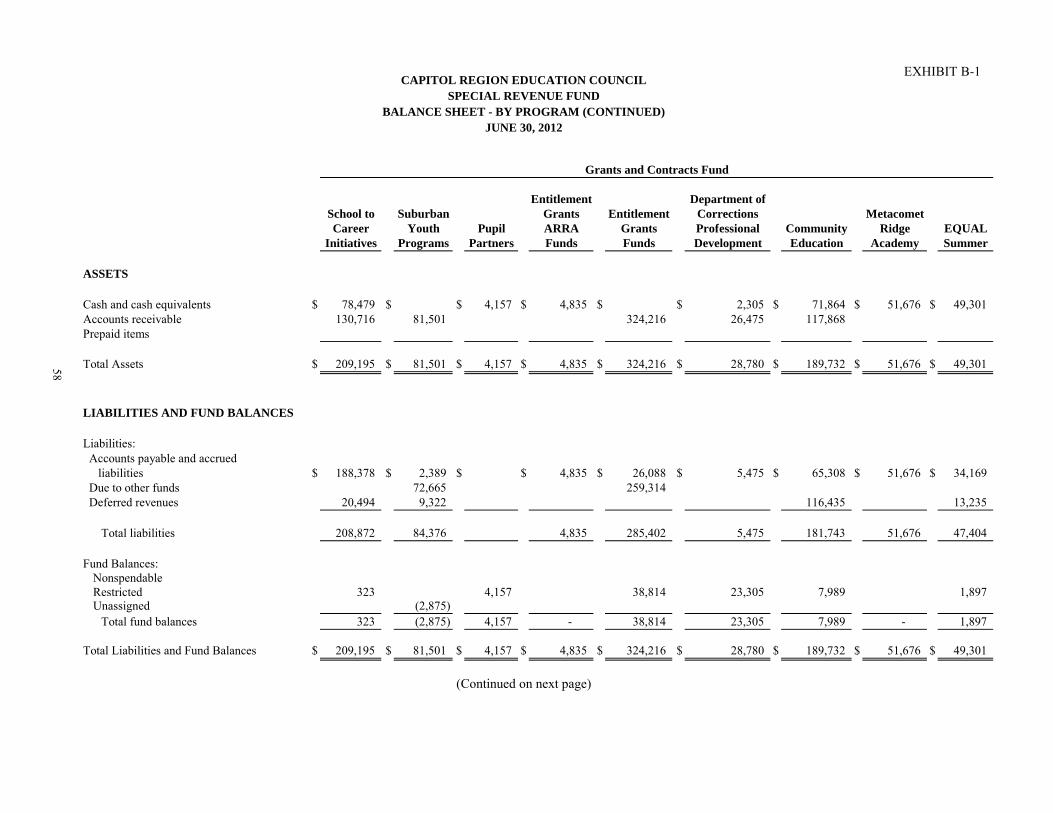
EXHIBIT B-1
ASSETS
Cash and cash equivalentsAccounts receivablePrepaid items
Total Assets
LIABILITIES AND FUND BALANCES
Liabilities:
58
CAPITOL REGION EDUCATION COUNCILSPECIAL REVENUE FUND
BALANCE SHEET - BY PROGRAM (CONTINUED)JUNE 30, 2012
Grants and Contracts Fund
Entitlement Department ofSchool to Suburban Grants Entitlement Corrections MetacometCareer Youth Pupil ARRA Grants Professional Community Ridge EQUAL
Initiatives Programs Partners Funds Funds Development Education Academy Summer
$ 78,479 $ $ 4,157 $ 4,835 $ $ 2,305 $ 71,864 $ 51,676 $ 49,301 130,716 81,501 324,216 26,475 117,868
$ 209,195 $ 81,501 $ 4,157 $ 4,835 $ 324,216 $ 28,780 $ 189,732 $ 51,676 $ 49,301
Accounts payable and accrued liabilities Due to other funds Deferred revenues
Total liabilities
Fund Balances:NonspendableRestrictedUnassigned
Total fund balances
Total Liabilities and Fund Balances
$ 188,378 $ 2,389 $ $ 4,835 $ 26,088 $ 5,475 $ 65,308 $ 51,676 $ 34,169 72,665 259,314
20,494 9,322 116,435 13,235
208,872 84,376 4,835 285,402 5,475 181,743 51,676 47,404
323 4,157 38,814 23,305 7,989 1,897
(2,875) 323 (2,875) 4,157 - 38,814 23,305 7,989 - 1,897
$ 209,195 $ 81,501 $ 4,157 $ 4,835 $ 324,216 $ 28,780 $ 189,732 $ 51,676 $ 49,301
(Continued on next page)
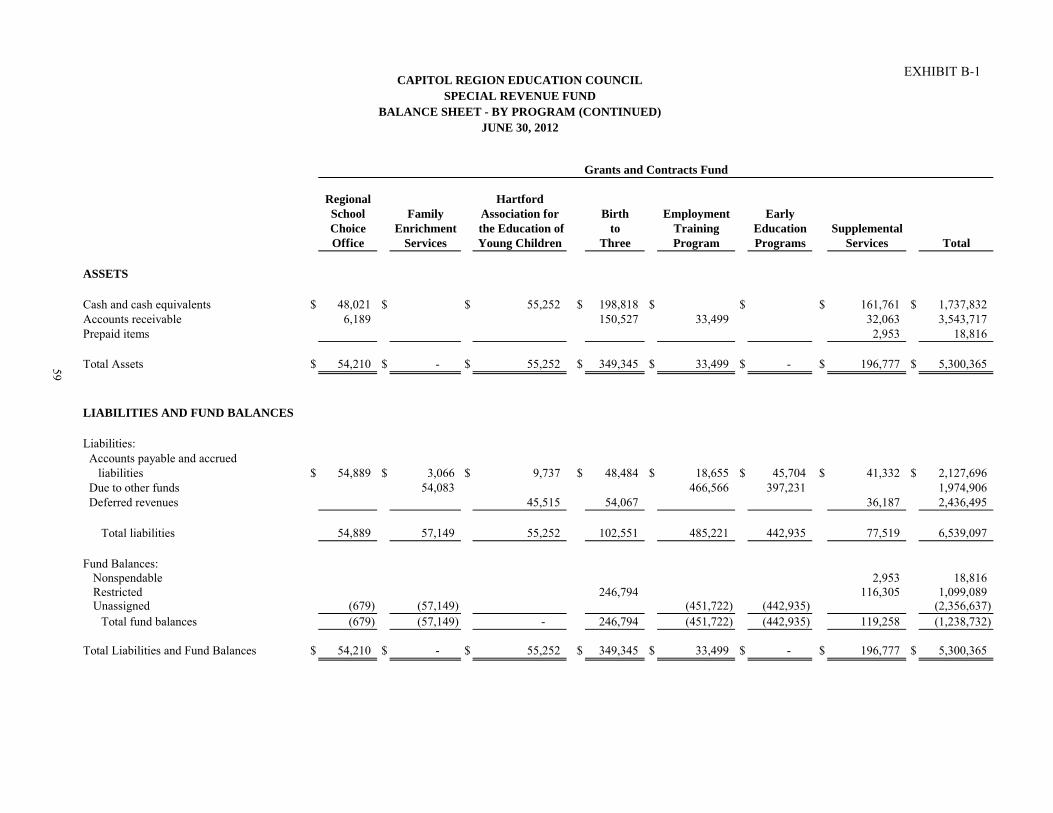
EXHIBIT B-1
ASSETS
Cash and cash equivalentsAccounts receivablePrepaid items
Total Assets
LIABILITIES AND FUND BALANCES
Liabilities:
59
CAPITOL REGION EDUCATION COUNCILSPECIAL REVENUE FUND
BALANCE SHEET - BY PROGRAM (CONTINUED)JUNE 30, 2012
Grants and Contracts Fund
Regional HartfordSchool Family Association for Birth Employment EarlyChoice Enrichment the Education of to Training Education SupplementalOffice Services Young Children Three Program Programs Services Total
$ 48,021 $ $ 55,252 $ 198,818 $ $ $ 161,761 $ 1,737,832 6,189 150,527 33,499 32,063 3,543,717
2,953 18,816
$ 54,210 $ - $ 55,252 $ 349,345 $ 33,499 $ - $ 196,777 $ 5,300,365
Accounts payable and accrued liabilities Due to other funds Deferred revenues
Total liabilities
Fund Balances:NonspendableRestrictedUnassigned
Total fund balances
Total Liabilities and Fund Balances
$ 54,889 $ 3,066 $ 9,737 $ 48,484 $ 18,655 $ 45,704 $ 41,332 $ 2,127,696 54,083 466,566 397,231 1,974,906
45,515 54,067 36,187 2,436,495
54,889 57,149 55,252 102,551 485,221 442,935 77,519 6,539,097
2,953 18,816 246,794 116,305 1,099,089
(679) (57,149) (451,722) (442,935) (2,356,637) (679) (57,149) - 246,794 (451,722) (442,935) 119,258 (1,238,732)
$ 54,210 $ - $ 55,252 $ 349,345 $ 33,499 $ - $ 196,777 $ 5,300,365

EXHIBIT B-2CAPITOL REGION EDUCATION COUNCIL
SPECIAL REVENUE FUNDSCHEDULE OF REVENUES, EXPENDITURES ANDCHANGES IN FUND BALANCES - BY PROGRAM
FOR THE YEAR ENDED JUNE 30, 2012
Special Connecticut CapitolTeaching Services Technical Summer Region
Interdistrict Project American MSAP Support Related High Youth ChoiceGrants PACT History Grant Team Services Schools Employment Program
Revenues: Tuition $ 4,475 $ $ $ $ $ $ $ $ Grants in aid 656,982 33,265 274,199 3,756,145 50,434 860,552 972,343 212,961 6,972,934 Sales of services 400 1,245,132 1,675,136 540 Other local revenues 1,220 78,121
Total revenues 663,077 33,265 274,199 3,756,145 1,295,566 2,535,688 972,343 212,961 7,051,595
Expenditures: Current: Salaries 23,619 5,014 37,555 730,745 1,020,104 1,217,532 65,192 182,871 1,433,092 Employee benefits 2,407 1,765 6,641 155,135 144,980 357,507 21,117 17,890 223,350 Purchased professional and technical services 8,700 16,270 110,445 46,813 63,044 485,292 409,896 33 62,215 Purchased property services 2,000 23,617 Other purchased services 532,002 3,350 82,355 2,432,202 69,419 8,107 340,740 2,592 4,940,254 Supplies 21,082 5,282 14,078 255,305 19,676 17,598 6,492 655 36,158 Property 3,955 7,744 19,305 12,717 Other objects 199 370 182 53
Total expenditures 587,810 31,681 251,074 3,624,354 1,325,337 2,105,523 843,437 206,041 6,731,456
Excess (Deficiency) of Revenues over Expenditures 75,267 1,584 23,125 131,791 (29,771) 430,165 128,906 6,920 320,139
Other Financing Sources (Uses): Transfers in 600 182,083 59,679 1,890 Transfers out (75,867) (1,584) (23,125) (131,791) (135,249) (412,243) (98,827) (6,920) (357,575)
Total other financing sources (uses) (75,267) (1,584) (23,125) (131,791) 46,834 (352,564) (98,827) (6,920) (355,685)
Net Change in Fund Balances - - - - 17,063 77,601 30,079 - (35,546)
Fund Balances at Beginning of Year 3,479 - - - 70,551 390,494 64,910 6,985 (1,351,525)
Fund Balances at End of Year $ 3,479 $ - $ - $ - $ 87,614 $ 468,095 $ 94,989 $ 6,985 $ (1,387,071)
(Continued on next page)
60
Grants and Contracts Fund

EXHIBIT B-2
Revenues: Tuition Grants in aid Sales of services Other local revenues
Total revenues
Expenditures: Current: Salaries Employee benefits Purchased professional and technical services Purchased property services Other purchased services Supplies Property Other objects
Total expenditures
Excess (Deficiency) of Revenues over Expenditures
Other Financing Sources (Uses): Transfers in Transfers out
Total other financing sources (uses)
Net Change in Fund Balances
Fund Balances at Beginning of Year
Fund Balances at End of Year
61
CAPITOL REGION EDUCATION COUNCILSPECIAL REVENUE FUND
SCHEDULE OF REVENUES, EXPENDITURES ANDCHANGES IN FUND BALANCES - BY PROGRAM (CONTINUED)
FOR THE YEAR ENDED JUNE 30, 2012
Grants and Contracts Fund
Entitlement Department ofSchool to Suburban Grants Entitlement Corrections MetacometCareer Youth Pupil ARRA Grants Professional Community Ridge EQUAL
Initiatives Programs Partners Funds Funds Development Education Academy Summer
$ $ $ $ $ $ $ $ $ 716,284 98,805 93,228 432,496 168,063 1,873,579 120,384 77,000
25,422 7,740 86,438 40,000 500
741,706 138,805 - 93,228 440,736 168,063 1,960,017 120,384 77,000
117,325 63,337 51,669 121,866 107,041 792,421 61,670 20,406 38,896 14,962 9,426 23,379 15,039 216,724 6,116 1,459
42,254 33,015 14,416 77,053 13,068 177,160 10,500 750 328 2,038 5,000
425,082 15,377 275 34,760 521 631,725 22,133 14,721 26,298 10,086 351 34,904 1,534 69,072 13,398 11,154 29,637 16,810 850
405
679,820 136,777 - 92,947 291,962 137,203 1,890,395 113,817 53,490
61,886 2,028 - 281 148,774 30,860 69,622 6,567 23,510
595 10,000 10,600 (62,415) (12,028) (281) (112,558) (30,860) (80,222) (6,567) (23,510)
(61,820) (2,028) - (281) (112,558) (30,860) (69,622) (6,567) (23,510)
66 - - - 36,216 - - - -
257 (2,875) 4,157 - 2,598 23,305 7,989 - 1,897
$ 323 $ (2,875) $ 4,157 $ - $ 38,814 $ 23,305 $ 7,989 $ - $ 1,897
(Continued on next page)

EXHIBIT B-2
Revenues: Tuition Grants in aid Sales of services Other local revenues
Total revenues
Expenditures: Current: Salaries Employee benefits Purchased professional and technical services Purchased property services Other purchased services Supplies Property Other objects
Total expenditures
Excess (Deficiency) of Revenues over Expenditures
Other Financing Sources (Uses): Transfers in Transfers out
Total other financing sources (uses)
Net Change in Fund Balances
Fund Balances at Beginning of Year
Fund Balances at End of Year
62
CAPITOL REGION EDUCATION COUNCILSPECIAL REVENUE FUND
SCHEDULE OF REVENUES, EXPENDITURES ANDCHANGES IN FUND BALANCES - BY PROGRAM (CONTINUED)
FOR THE YEAR ENDED JUNE 30, 2012
Regional HartfordSchool Family Association Birth Employment EarlyChoice Enrichment for the Education to Training Education SupplementalOffice Services of Young Children Three Program Programs Services Total
$ $ $ $ $ 16,930 $ $ $ 21,4051,693,640 130,514 158,143 1,507,041 267,847 1,422,757 723,839 23,273,435
3,712 1,845 10,073 290,098 41,143 3,387,679 50 111,907 11,250 243,048
1,693,640 134,226 160,038 1,629,021 586,125 1,422,757 764,982 26,925,567
1,090,270 81,495 104,999 1,014,746 449,811 589,569 471,816 9,854,165365,055 29,388 21,596 278,476 109,692 107,602 56,456 2,225,058
11,621 205 3,296 21,632 1,580 3,033 61,687 1,673,97820,000 7,000 296 26,486 43,751 3,791 134,307
181,634 4,920 13,488 60,613 10,991 691,620 62,124 10,581,0058,453 938 359 6,010 15,676 21,354 42,804 638,7171,396 5,572 8,774 3,115 109,8758,650 50 234 90 103 3,019 13,355
1,687,079 123,996 144,268 1,413,535 631,591 1,422,055 704,812 25,230,460
6,561 10,230 15,770 215,486 (45,466) 702 60,170 1,695,107
16,294 281,741(6,561) (6,518) (15,770) (150,557) (30,064) (702) (59,000) (1,840,794)
(6,561) (6,518) (15,770) (150,557) (13,770) (702) (59,000) (1,559,053)
- 3,712 - 64,929 (59,236) - 1,170 136,054
(679) (60,861) - 181,865 (392,486) (442,935) 118,088 (1,374,786)
$ (679) $ (57,149) $ - $ 246,794 $ (451,722) $ (442,935) $ 119,258 $ (1,238,732)
Grants and Contracts Fund

EXHIBIT B-3CAPITOL REGION EDUCATION COUNCIL
SPECIAL REVENUE FUNDSCHEDULES OF REVENUES AND EXPENDITURES
BUDGET (NON-GAAP BUDGETARY BASIS) AND ACTUALFOR THE YEAR ENDED JUNE 30, 2012
Variance withFinal Budget -
Positive Original Final Actual (Negative)
Grants and Contracts Fund
Interdistrict Grants
Revenues: Grants in aid $ 693,482 $ 693,482 $ 656,982 $ (36,500) Tuition 4,475 4,475 Sales of service 400 400 Other local revenue 1,220 1,220 Transfers 600 600
Total revenues 693,482 693,482 663,677 (29,805)
Total expenditures 693,482 693,482 663,677 29,805
Excess of Revenues over Expenditures $ - $ - $ - $ -
Project PACT
Revenues: Grants in aid $ 30,000 $ 33,265 $ 33,265 $ -
Total expenditures 30,000 33,265 33,265 -
Excess of Revenues over Expenditures $ - $ - $ - $ -
Teaching American History
Revenues: Grants in aid $ 388,333 $ 388,333 $ 274,199 $ (114,134)
Total expenditures 388,333 388,333 274,199 114,134
Excess of Revenues over Expenditures $ - $ - $ - $ -
MSAP Grant
Revenues: Grants in aid $ 3,870,307 $ 3,870,307 $ 3,756,145 $ (114,162)
Total expenditures 3,870,307 3,870,307 3,756,145 114,162
Excess of Revenues over Expenditures $ - $ - $ - $ -
Special Services Support Team
Revenues: Grants in aid $ $ $ 50,434 $ 50,434 Sales of services 1,243,313 1,466,064 1,245,132 (220,932) Transfers 182,083 182,083
Total revenues 1,243,313 1,466,064 1,477,649 11,585
Total expenditures 1,243,313 1,466,064 1,460,586 5,478
Excess of Revenues over Expenditures $ - $ - $ 17,063 $ 17,063
Budget Amounts
(Continued on next page)
63

EXHIBIT B-3CAPITOL REGION EDUCATION COUNCIL
SPECIAL REVENUE FUNDSCHEDULES OF REVENUES AND EXPENDITURES
BUDGET (NON-GAAP BUDGETARY BASIS) AND ACTUAL (CONTINUED)FOR THE YEAR ENDED JUNE 30, 2012
Variance withFinal Budget -
Positive Original Final Actual (Negative)
Related Services
Revenues: Grants in aid $ 500,000 $ 850,000 $ 860,552 $ 10,552 Sales of services 1,379,603 1,738,112 1,675,136 (62,976) Transfers 59,679 59,679
Total revenues 1,879,603 2,588,112 2,595,367 7,255
Total expenditures 1,879,603 2,588,112 2,517,766 70,346
Excess of Revenues over Expenditures $ - $ - $ 77,601 $ 77,601
Connecticut Technical High Schools
Revenues: Grants in aid $ 400,000 $ 942,263 $ 972,343 $ 30,080
Total expenditures 400,000 942,263 942,264 (1)
Excess of Revenues over Expenditures $ - $ - $ 30,079 $ 30,079
Summer Youth Employment
Revenues: Grants in aid $ 194,500 $ 219,926 $ 212,961 $ (6,965)
Total expenditures 194,500 219,926 212,961 6,965
Excess of Revenues over Expenditures $ - $ - $ - $ -
Capitol Region Choice Program
Revenues: Grants in aid $ 9,029,112 $ 9,029,112 $ 6,972,934 $ (2,056,178) Sales of services 540 540 Other local revenues 78,121 78,121 Transfers 1,890 1,890
Total revenues 9,029,112 9,029,112 7,053,485 (1,975,627)
Total expenditures 9,029,112 9,029,112 7,089,031 1,940,081
Deficiency of Revenues over Expenditures $ - $ - $ (35,546) $ (35,546)
(Continued on next page)
Budget Amounts
64
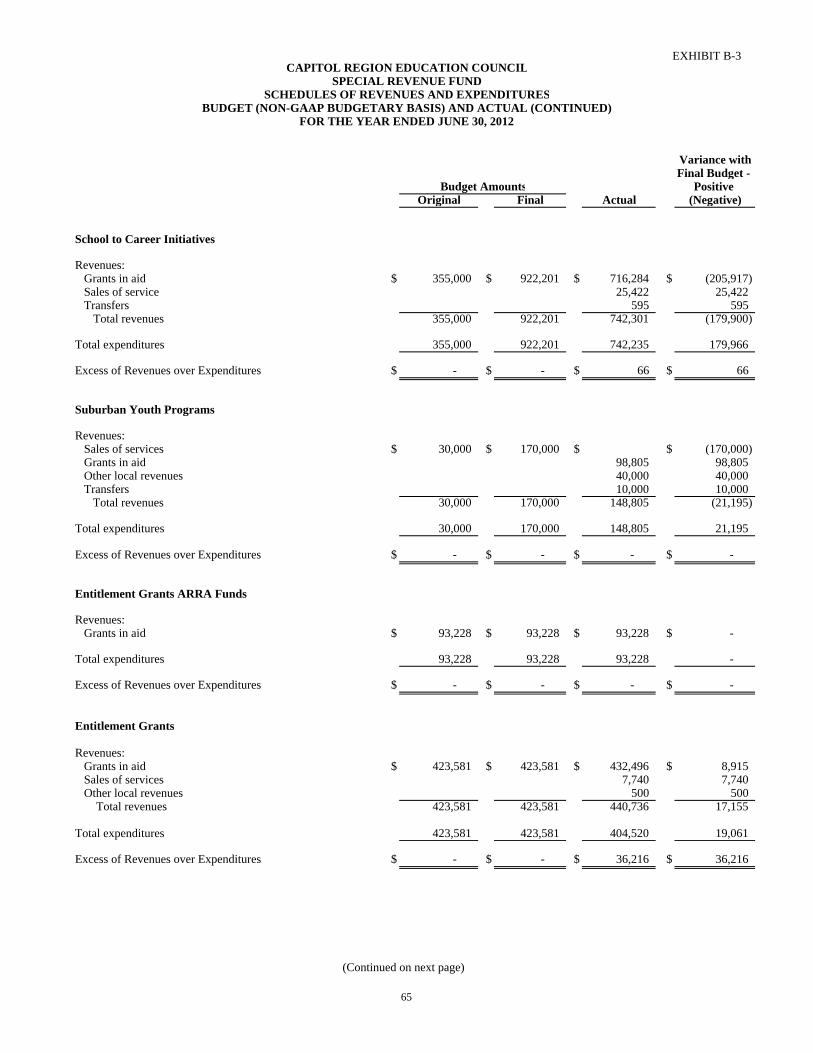
EXHIBIT B-3CAPITOL REGION EDUCATION COUNCIL
SPECIAL REVENUE FUNDSCHEDULES OF REVENUES AND EXPENDITURES
BUDGET (NON-GAAP BUDGETARY BASIS) AND ACTUAL (CONTINUED)FOR THE YEAR ENDED JUNE 30, 2012
Variance withFinal Budget -
Positive Original Final Actual (Negative)
School to Career Initiatives
Revenues: Grants in aid $ 355,000 $ 922,201 $ 716,284 $ (205,917) Sales of service 25,422 25,422 Transfers 595 595
Total revenues 355,000 922,201 742,301 (179,900)
Total expenditures 355,000 922,201 742,235 179,966
Excess of Revenues over Expenditures $ - $ - $ 66 $ 66
Suburban Youth Programs
Revenues: Sales of services $ 30,000 $ 170,000 $ $ (170,000) Grants in aid 98,805 98,805 Other local revenues 40,000 40,000 Transfers 10,000 10,000 Total revenues 30,000 170,000 148,805 (21,195) Total expenditures 30,000 170,000 148,805 21,195
Excess of Revenues over Expenditures $ - $ - $ - $ -
Entitlement Grants ARRA Funds
Revenues: Grants in aid $ 93,228 $ 93,228 $ 93,228 $ -
Total expenditures 93,228 93,228 93,228 -
Excess of Revenues over Expenditures $ - $ - $ - $ -
Entitlement Grants
Revenues: Grants in aid $ 423,581 $ 423,581 $ 432,496 $ 8,915 Sales of services 7,740 7,740 Other local revenues 500 500
Total revenues 423,581 423,581 440,736 17,155
Total expenditures 423,581 423,581 404,520 19,061
Excess of Revenues over Expenditures $ - $ - $ 36,216 $ 36,216
(Continued on next page)
Budget Amounts
65

EXHIBIT B-3CAPITOL REGION EDUCATION COUNCIL
SPECIAL REVENUE FUNDSCHEDULES OF REVENUES AND EXPENDITURES
BUDGET (NON-GAAP BUDGETARY BASIS) AND ACTUAL (CONTINUED)FOR THE YEAR ENDED JUNE 30, 2012
Variance withFinal Budget -
Positive Original Final Actual (Negative)
Department of Corrections Professional Development
Revenues: Grants in aid $ 230,000 $ 230,000 $ 168,063 $ (61,937)
Total expenditures 230,000 230,000 168,063 61,937
Excess of Revenues over Expenditures $ - $ - $ - $ -
Community Education
Revenues: Grants in aid $ 1,729,453 $ 2,187,322 $ 1,873,579 $ (313,743) Sales of services 86,438 86,438 Transfers 10,600 10,600
Total revenues 1,729,453 2,187,322 1,970,617 (216,705)
Total expenditures 1,729,453 2,187,322 1,970,617 216,705
Excess of Revenues over Expenditures $ - $ - $ - $ -
Metacomet Ridge Academy
Revenues: Grants in aid $ 120,384 $ 120,384 $ 120,384 $ -
Total expenditures 120,384 120,384 120,384 -
Excess of Revenues over Expenditures $ - $ - $ - $ -
EQUAL Summer
Revenues: Grants in aid $ 77,000 $ 77,000 $ 77,000 $ -
Total expenditures 77,000 77,000 77,000 -
Excess of Revenues over Expenditures $ - $ - $ - $ -
(Continued on next page)
Budget Amounts
66
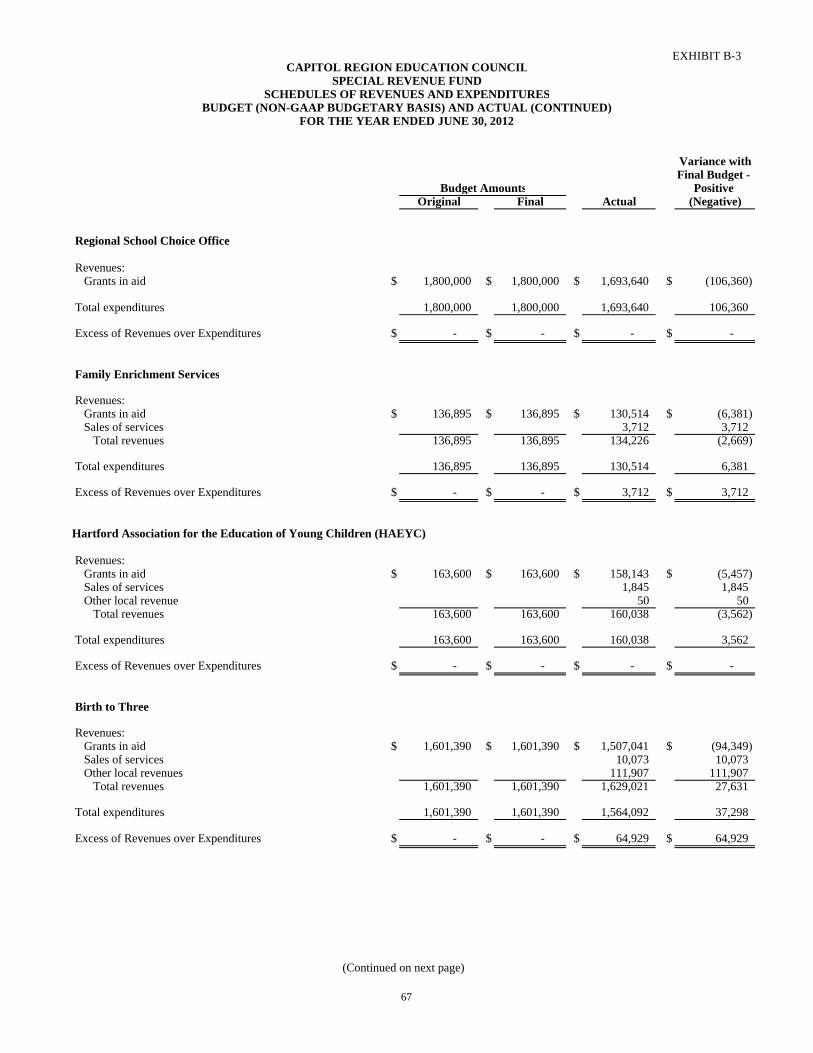
EXHIBIT B-3CAPITOL REGION EDUCATION COUNCIL
SPECIAL REVENUE FUNDSCHEDULES OF REVENUES AND EXPENDITURES
BUDGET (NON-GAAP BUDGETARY BASIS) AND ACTUAL (CONTINUED)FOR THE YEAR ENDED JUNE 30, 2012
Variance withFinal Budget -
Positive Original Final Actual (Negative)
Regional School Choice Office
Revenues: Grants in aid $ 1,800,000 $ 1,800,000 $ 1,693,640 $ (106,360)
Total expenditures 1,800,000 1,800,000 1,693,640 106,360
Excess of Revenues over Expenditures $ - $ - $ - $ -
Family Enrichment Services
Revenues: Grants in aid $ 136,895 $ 136,895 $ 130,514 $ (6,381) Sales of services 3,712 3,712
Total revenues 136,895 136,895 134,226 (2,669)
Total expenditures 136,895 136,895 130,514 6,381
Excess of Revenues over Expenditures $ - $ - $ 3,712 $ 3,712
Hartford Association for the Education of Young Children (HAEYC)
Revenues: Grants in aid $ 163,600 $ 163,600 $ 158,143 $ (5,457) Sales of services 1,845 1,845 Other local revenue 50 50
Total revenues 163,600 163,600 160,038 (3,562)
Total expenditures 163,600 163,600 160,038 3,562
Excess of Revenues over Expenditures $ - $ - $ - $ -
Birth to Three
Revenues: Grants in aid $ 1,601,390 $ 1,601,390 $ 1,507,041 $ (94,349) Sales of services 10,073 10,073 Other local revenues 111,907 111,907
Total revenues 1,601,390 1,601,390 1,629,021 27,631
Total expenditures 1,601,390 1,601,390 1,564,092 37,298
Excess of Revenues over Expenditures $ - $ - $ 64,929 $ 64,929
(Continued on next page)
Budget Amounts
67
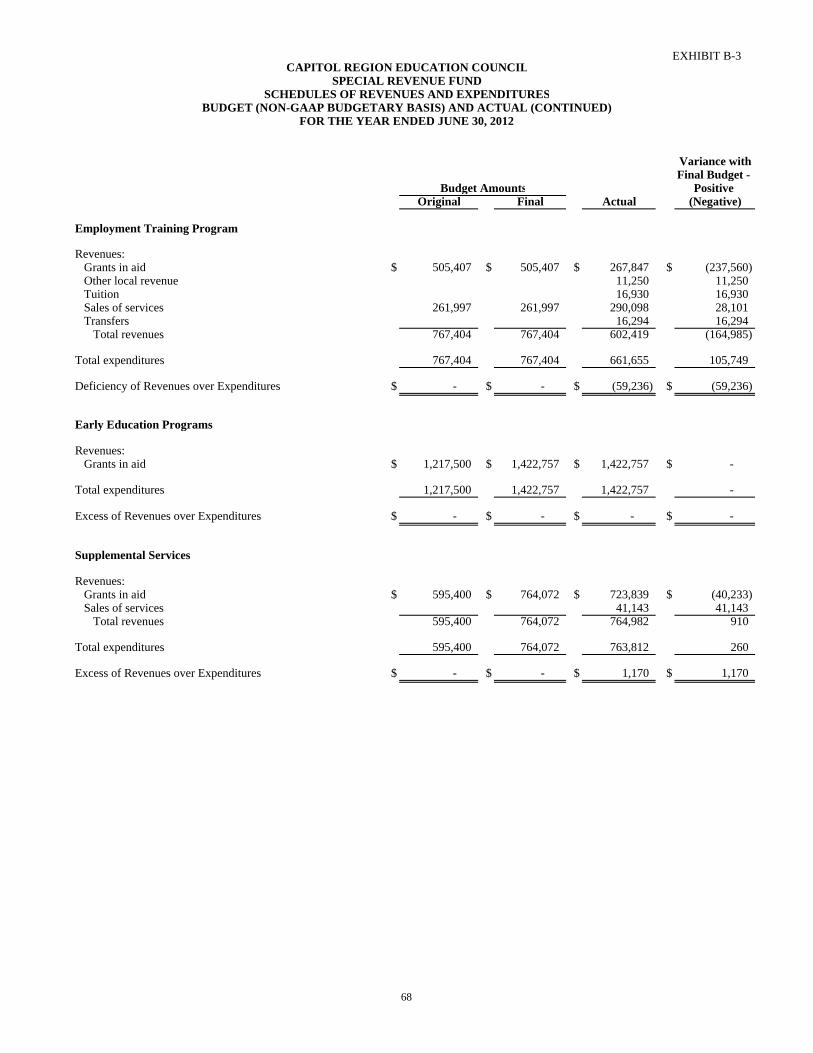
EXHIBIT B-3CAPITOL REGION EDUCATION COUNCIL
SPECIAL REVENUE FUNDSCHEDULES OF REVENUES AND EXPENDITURES
BUDGET (NON-GAAP BUDGETARY BASIS) AND ACTUAL (CONTINUED)FOR THE YEAR ENDED JUNE 30, 2012
Variance withFinal Budget -
Positive Original Final Actual (Negative)
Employment Training Program
Revenues: Grants in aid $ 505,407 $ 505,407 $ 267,847 $ (237,560) Other local revenue 11,250 11,250 Tuition 16,930 16,930 Sales of services 261,997 261,997 290,098 28,101 Transfers 16,294 16,294
Total revenues 767,404 767,404 602,419 (164,985)
Total expenditures 767,404 767,404 661,655 105,749
Deficiency of Revenues over Expenditures $ - $ - $ (59,236) $ (59,236)
Early Education Programs
Revenues: Grants in aid $ 1,217,500 $ 1,422,757 $ 1,422,757 $ -
Total expenditures 1,217,500 1,422,757 1,422,757 -
Excess of Revenues over Expenditures $ - $ - $ - $ -
Supplemental Services
Revenues: Grants in aid $ 595,400 $ 764,072 $ 723,839 $ (40,233) Sales of services 41,143 41,143
Total revenues 595,400 764,072 764,982 910
Total expenditures 595,400 764,072 763,812 260
Excess of Revenues over Expenditures $ - $ - $ 1,170 $ 1,170
Budget Amounts
68

Nonmajor Governmental Funds


NONMAJOR GOVERNMENTAL FUNDS
CAPITAL PROJECTS FUND
SPECIAL EDUCATION SCHOOLS CAPITAL PROJECTS - Accounts for the special education schools’ renovations. PUBLIC SAFETY ACADEMY CONSTRUCTION - Accounts for the site acquisition and construction of a school facility for the Public Safety Academy. Eligible and recognized costs are reimbursable by an SDE facilities grant. INTERNATIONAL MAGNET CONSTRUCTION - Accounts for the site acquisition and construction of a school facility for the International Magnet School for Global Citizenship. Eligible and recognized costs are reimbursable by an SDE facilities grant. REGGIO MAGNET SCHOOL CONSTRUCTION - Accounts for the site acquisition and construction of a school facility for the Reggio Magnet School. Eligible and recognized costs are reimbursable by an SDE facilities grant. SOUNDBRIDGE CONSTRUCTION - Accounts for renovation of the Soundbridge school facility in Wethersfield, Connecticut. MEDICAL PROFESSIONS AND TEACHER PREPARATION ACADEMY CONSTRUCTION - Accounts for the site acquisition and construction of a school facility for the Medical Professions and Teacher Preparation Academy. Eligible and recognized costs are reimbursable by an SDE facilities grant. RIVER STREET CONSTRUCTION - Accounts for site acquisition and renovation of a school facility for the River Street Program. ACADEMY OF AEROSPACE AND ENGINEERING CONSTRUCTION - Accounts for the site acquisition and construction of a school facility for the Aerospace and Engineering Magnet School. Eligible and recognized costs are reimbursable by an SDE facilities grant. MUSEUM ACADEMY CONSTRUCTION - Accounts for the site acquisition and construction of a school facility for the Museum Academy. Eligible and recognized costs are reimbursable by an SDE facilities grant. DISCOVERY CENTER CONSTRUCTION - Accounts for the site acquisition and construction of a school facility for the Discovery Academy. Eligible and recognized costs are reimbursable by an SDE facilities grant. CAPITAL LEASES - Accounts for CREC’s capital leases.

PERMANENT FUND NARKIN SCHOLARSHIP FUND - The Alvina Narkin Student Scholarship provides one yearly scholarship to students from CREC Soundbridge who are graduating from high school and are planning to go on to any post-secondary program.
DEBT SERVICE FUNDS
ADMINISTRATION CENTER PARKING LOT - Accounts for service of the debt on property of the Council located at 111 Charter Oak Avenue, Hartford. BOND ISSUE COST CENTER - Accounts for the consolidated debt of the agency.
SPECIAL REVENUE FUND
CAPITOL REGION EDUCATION COUNCIL FOUNDATION INC. - The foundation supports CREC’s public purpose of improving the quality of public education within Greater Hartford.
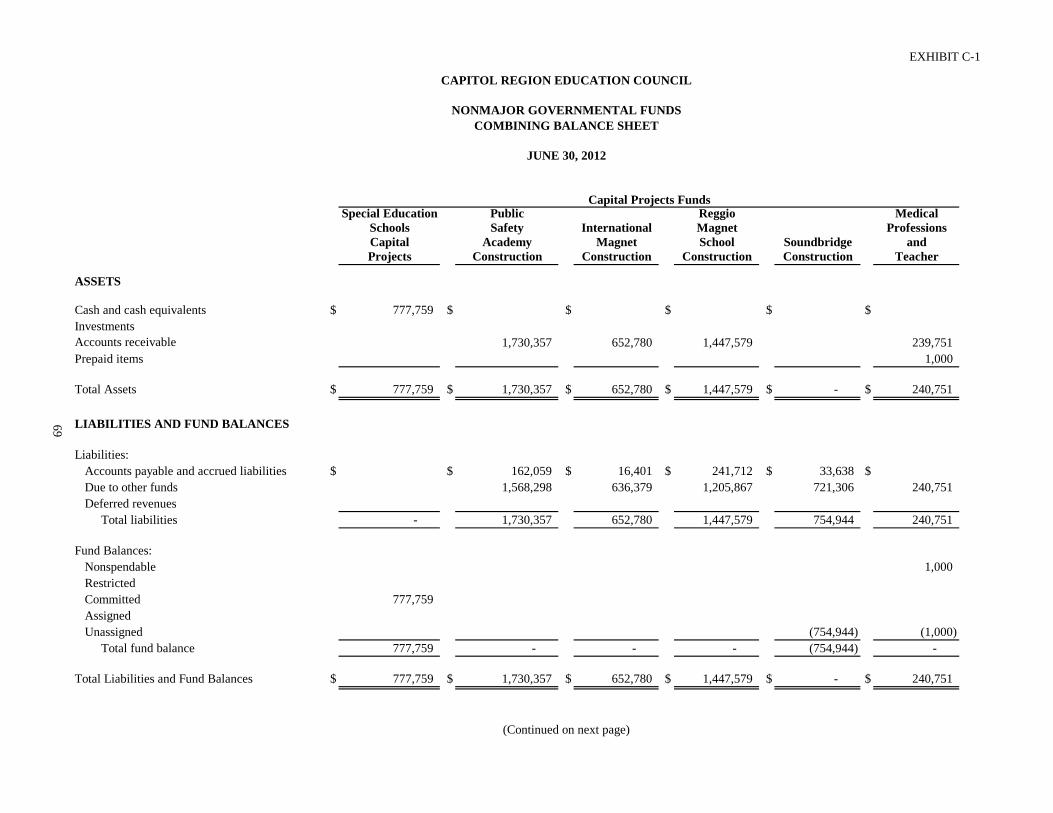
EXHIBIT C-1
CAPITOL REGION EDUCATION COUNCIL
NONMAJOR GOVERNMENTAL FUNDSCOMBINING BALANCE SHEET
JUNE 30, 2012
Capital Projects FundsSpecial Education Public Reggio Medical
Schools Safety International Magnet ProfessionsCapital Academy Magnet School Soundbridge andProjects Construction Construction Construction Construction Teacher
ASSETS
Cash and cash equivalents $ 777,759 $ $ $ $ $ Investments Accounts receivable 1,730,357 652,780 1,447,579 239,751 Prepaid items 1,000
Total Assets $ 777,759 $ 1,730,357 $ 652,780 $ 1,447,579 $ - $ 240,751
LIABILITIES AND FUND BALANCES
Li biliti
69
Liabilities: Accounts payable and accrued liabilities $ $ 162,059 $ 16,401 $ 241,712 $ 33,638 $ Due to other funds 1,568,298 636,379 1,205,867 721,306 240,751 Deferred revenues
Total liabilities - 1,730,357 652,780 1,447,579 754,944 240,751
Fund Balances: Nonspendable 1,000 RestrictedCommitted 777,759 Assigned Unassigned (754,944) (1,000)
Total fund balance 777,759 - - - (754,944) -
Total Liabilities and Fund Balances $ 777,759 $ 1,730,357 $ 652,780 $ 1,447,579 $ - $ 240,751
(Continued on next page)

EXHIBIT C-1
ASSETS
Cash and cash equivalentsInvestmentsAccounts receivablePrepaid items
Total Assets
LIABILITIES AND FUND BALANCES
Li biliti
70
CAPITOL REGION EDUCATION COUNCIL
NONMAJOR GOVERNMENTAL FUNDSCOMBINING BALANCE SHEET (CONTINUED)
JUNE 30, 2012
Capital Projects FundsAerospace Total
River and Museum Discovery Capital Street Engineering Academy Center Capital Projects
Construction Construction Construction Construction Lease Funds
$ 754,095 $ 194,654 $ 468,879 $ 427,345 $ $ 2,622,732 -
4,070,467 1,000
$ 754,095 $ 194,654 $ 468,879 $ 427,345 $ - $ 6,694,199
Liabilities: Accounts payable and accrued liabilitiesDue to other funds Deferred revenues
Total liabilities
Fund Balances: NonspendableRestrictedCommittedAssignedUnassigned
Total fund balance
Total Liabilities and Fund Balances
$ $ 194,654 $ 468,879 $ 427,345 $ $ 1,544,688 4,372,601
- - 194,654 468,879 427,345 - 5,917,289
1,000 -
754,095 1,531,854 -
(755,944) 754,095 - - - - 776,910
$ 754,095 $ 194,654 $ 468,879 $ 427,345 $ - $ 6,694,199
(Continued on next page)
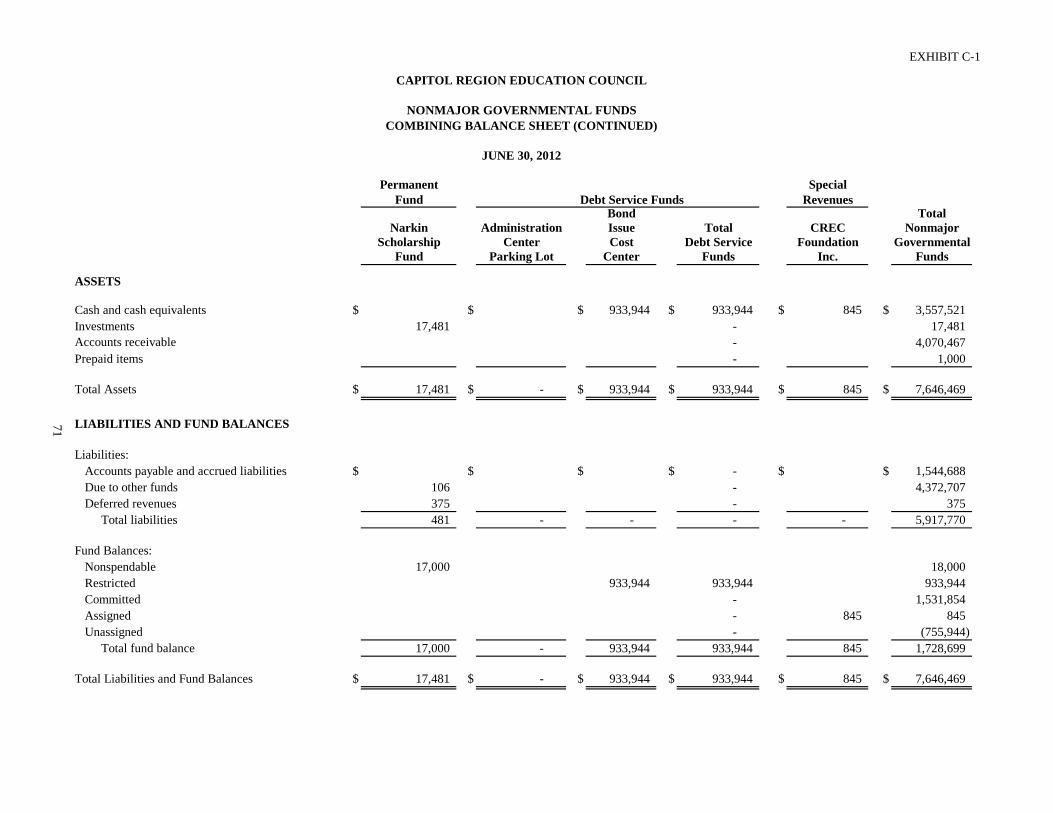
EXHIBIT C-1
ASSETS
Cash and cash equivalentsInvestmentsAccounts receivablePrepaid items
Total Assets
LIABILITIES AND FUND BALANCES
Li biliti
71
CAPITOL REGION EDUCATION COUNCIL
NONMAJOR GOVERNMENTAL FUNDSCOMBINING BALANCE SHEET (CONTINUED)
JUNE 30, 2012
Permanent SpecialFund Debt Service Funds Revenues
Bond TotalNarkin Administration Issue Total CREC Nonmajor
Scholarship Center Cost Debt Service Foundation GovernmentalFund Parking Lot Center Funds Inc. Funds
$ $ $ 933,944 $ 933,944 $ 845 $ 3,557,521 17,481 - 17,481
- 4,070,467 - 1,000
$ 17,481 $ - $ 933,944 $ 933,944 $ 845 $ 7,646,469
Liabilities: Accounts payable and accrued liabilitiesDue to other funds Deferred revenues
Total liabilities
Fund Balances: NonspendableRestrictedCommittedAssignedUnassigned
Total fund balance
Total Liabilities and Fund Balances
$ $ $ $ - $ $ 1,544,688 106 - 4,372,707 375 - 375 481 - - - - 5,917,770
17,000 18,000 933,944 933,944 933,944
- 1,531,854 - 845 845
- (755,944) 17,000 - 933,944 933,944 845 1,728,699
$ 17,481 $ - $ 933,944 $ 933,944 $ 845 $ 7,646,469

EXHIBIT C-2
CAPITOL REGION EDUCATION COUNCIL
NONMAJOR GOVERNMENTAL FUNDS
COMBINING STATEMENT OF REVENUES, EXPENDITURESAND CHANGES IN FUND BALANCES
FOR THE YEAR ENDED JUNE 30, 2012
Special Education Public Reggio MedicalSchools Safety International Magnet ProfessionsCapital Academy Magnet School Soundbridge andProjects Construction Construction Construction Construction Teacher
Revenues: Grants in aid $ $ 3,692,605 $ 3,040,639 $ 4,096,303 $ $ 3,738,294 Investment income
Total revenues - 3,692,605 3,040,639 4,096,303 - 3,738,294
Expenditures: Current: Other objects
Debt service: Principal Interest and fiscal charges Capital outlay 3,668,151 3,020,502 4,069,175 3,713,537
T t l dit 3 668 151 3 020 502 4 069 175 3 713 537
72
Capital Projects Funds
Total expenditures - 3,668,151 3,020,502 4,069,175 - 3,713,537
Excess (Deficiency) of Revenues over Expenditures - 24,454 20,137 27,128 - 24,757
Other Financing Sources (Uses): Transfers in 96,633 - Transfers out (24,454) (20,137) (27,128) (24,757) Proceeds from capital lease
Total other financing sources (uses) 96,633 (24,454) (20,137) (27,128) - (24,757)
Net Change in Fund Balances 96,633 - - - - -
Fund Balances at Beginning of Year 681,126 - - - (754,944) -
Fund Balances at End of Year $ 777,759 $ - $ - $ - $ (754,944) $ -
(Continued on next page)
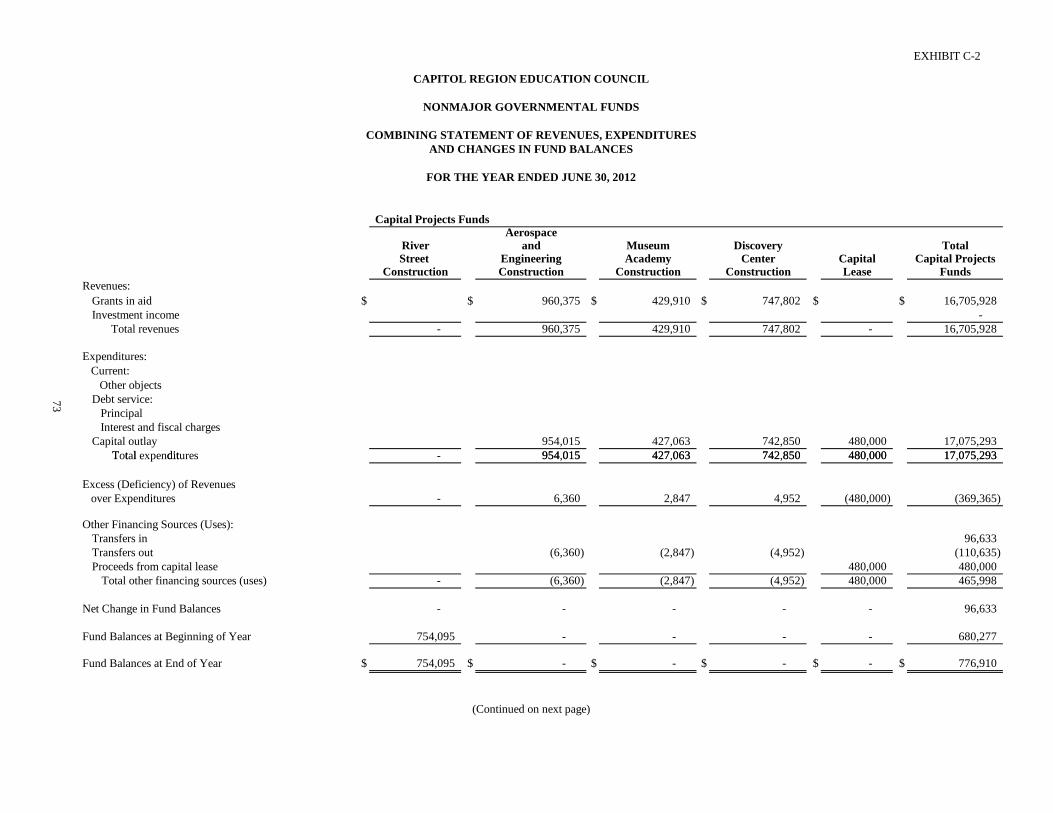
EXHIBIT C-2
Revenues: Grants in aid Investment income
Total revenues
Expenditures: Current: Other objects
Debt service: Principal Interest and fiscal charges Capital outlay
T t l dit
73
CAPITOL REGION EDUCATION COUNCIL
NONMAJOR GOVERNMENTAL FUNDS
COMBINING STATEMENT OF REVENUES, EXPENDITURESAND CHANGES IN FUND BALANCES
FOR THE YEAR ENDED JUNE 30, 2012
Capital Projects FundsAerospace
River and Museum Discovery TotalStreet Engineering Academy Center Capital Capital Projects
Construction Construction Construction Construction Lease Funds
$ $ 960,375 $ 429,910 $ 747,802 $ $ 16,705,928 -
- 960,375 429,910 747,802 - 16,705,928
954,015 427,063 742,850 480,000 17,075,293 954 015 427 063 742 850 480 000 17 075 293 Total expenditures
Excess (Deficiency) of Revenues over Expenditures
Other Financing Sources (Uses): Transfers inTransfers outProceeds from capital lease
Total other financing sources (uses)
Net Change in Fund Balances
Fund Balances at Beginning of Year
Fund Balances at End of Year
- 954,015 427,063 742,850 480,000 17,075,293
- 6,360 2,847 4,952 (480,000) (369,365)
96,633 (6,360) (2,847) (4,952) (110,635)
480,000 480,000 - (6,360) (2,847) (4,952) 480,000 465,998
- - - - - 96,633
754,095 - - - - 680,277
$ 754,095 $ - $ - $ - $ - $ 776,910
(Continued on next page)

EXHIBIT C-2
Revenues: Grants in aid Investment income
Total revenues
Expenditures: Current: Other objects
Debt service: Principal Interest and fiscal charges Capital outlay
T t l dit
74
CAPITOL REGION EDUCATION COUNCIL
NONMAJOR GOVERNMENTAL FUNDS
COMBINING STATEMENT OF REVENUES, EXPENDITURESAND CHANGES IN FUND BALANCES (CONTINUED)
FOR THE YEAR ENDED JUNE 30, 2012
Permanent SpecialFund Revenues
Bond TotalNarkin Administration Issue Total CREC Nonmajor
Scholarship Center Cost Debt Service Foundation GovernmentalFund Parking Lot Center Funds Inc. Funds
$ $ $ $ - $ 885,891 $ 17,591,819 66 66 66
- - 66 66 885,891 17,591,885
- 885,313 885,313
16,350 380,000 396,350 396,350 3,924 87,075 90,999 90,999
- 17,075,293 20 274 467 075 487 349 885 313 18 447 955
Debt Service Funds
Total expenditures
Excess (Deficiency) of Revenues over Expenditures
Other Financing Sources (Uses): Transfers inTransfers outProceeds from capital lease
Total other financing sources (uses)
Net Change in Fund Balances
Fund Balances at Beginning of Year
Fund Balances at End of Year
- 20,274 467,075 487,349 885,313 18,447,955
- (20,274) (467,009) (487,283) 578 (856,070)
20,274 467,075 487,349 583,982 - (110,635) - 480,000
- 20,274 467,075 487,349 - 953,347
- - 66 66 578 97,277
17,000 - 933,878 933,878 267 1,631,422
$ 17,000 $ - $ 933,944 $ 933,944 $ 845 $ 1,728,699

Nonmajor Enterprise Funds


NONMAJOR ENTERPRISE FUNDS MONTESSORI TRAINING CENTER OF NEW ENGLAND (MTCNE) - This program was created to provide individuals the opportunity to become AMI (Association Montessori Internationale) certified teachers. The training center serves to promote education through the scientific discoveries of child development based on Maria Montessori’s theories. LEARNING CORRIDOR THEATER - The Theater of the Performing Arts was built at the Learning Corridor and is part of the Greater Hartford Academy of the Arts complex. The Theater has many performances given by professional/visiting artists. COOPERATIVE PURCHASING - CREC’s Cooperative Purchasing Program pools district purchasing power - statewide and nationally - to offer aggressive, pre-bid prices on a wide array of supplies and equipment to participating school districts throughout Connecticut and, to a lesser extent, other states. REGIONAL FINGERPRINTING SERVICES - A law enacted in 1994 requires Connecticut school districts to fingerprint all new hires for state and national criminal history checks. CREC provides a fingerprinting service to its member districts. OFFICE OF COMMUNICATIONS - This office helps our divisions communicate effectively with internal and external audiences and also offers its writing, editing, public relations, marketing, advertising and graphic design services to external clients. STAFF DEVELOPMENT - Staff Development provides professional development opportunities, training and technical assistance to the educators in CREC’s 35 districts. Revenue is provided by sales of program services. BEST SERVICES - Funds collected are used to support the training of school district teachers as part of the Beginning Educators Support Training program. PROPERTY AND EQUIPMENT RENTAL - CREC has tenants renting available office space at some of its facilities. Equipment rental is also provided to programs. CONNECTICUT ASSOCIATION OF SCHOOL BUSINESS OFFICIALS (CASBO) - CREC provides administrative and financial support services to the Connecticut Association of School Business Officials. CONFERENCE SERVICES - Conference facilities and the CREC cafeteria at the CREC Central facility are made available to CREC programs and outside agencies. The related financial activity is accounted for in this fund. TECHNICAL ASSISTANCE BROKERING SERVICES - This fund is used to account for the general provision of services TABS provides outside the scope of technical assistance and brokering. This fund currently includes online student services, employee assistance to districts and study skills programs for students. COMMUNITY EDUCATION - The division of Community Education provides leadership, training and consulting services to improve the quality of adult education and deliver effective adult educator training and development across the state. CONSTRUCTION SERVICES - CREC provides school construction-related technical assistance to school districts throughout Connecticut. These services include the development of educational specifications, planning, SDE filings, architectural review assistance, budgeting and construction program management. This fund also provides services to internal CREC construction projects.
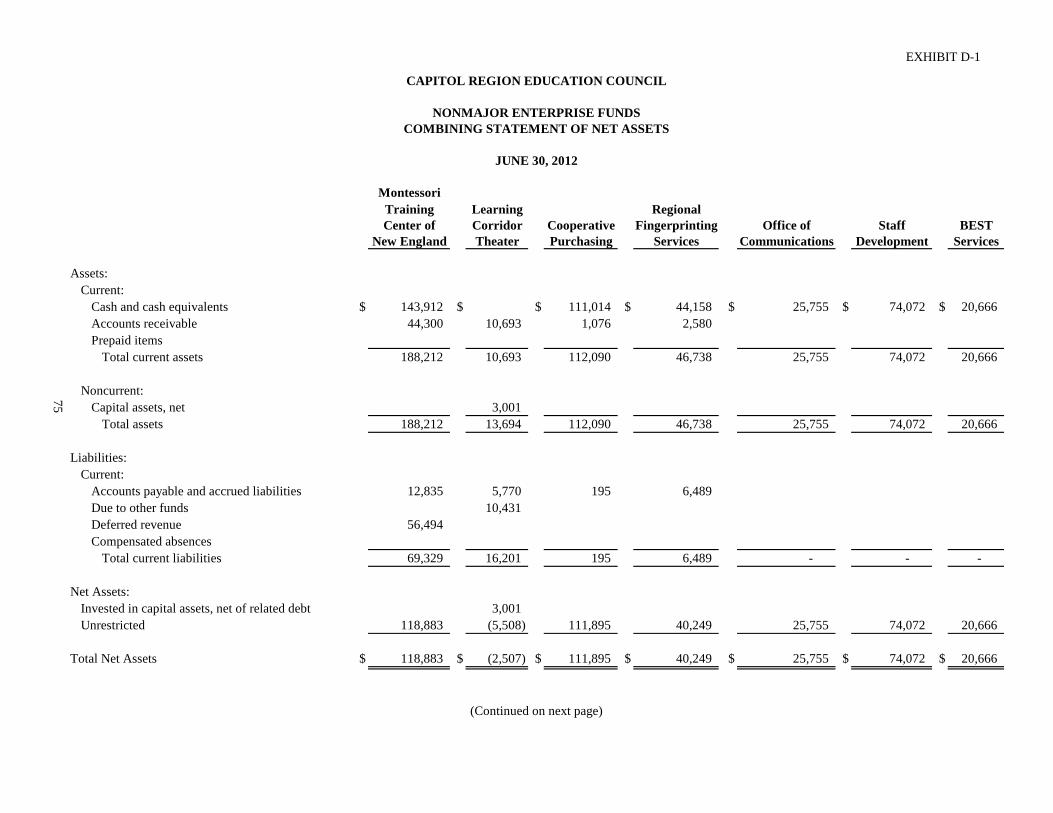
EXHIBIT D-1
CAPITOL REGION EDUCATION COUNCIL
NONMAJOR ENTERPRISE FUNDSCOMBINING STATEMENT OF NET ASSETS
JUNE 30, 2012
MontessoriTraining Learning RegionalCenter of Corridor Cooperative Fingerprinting Office of Staff BEST
New England Theater Purchasing Services Communications Development Services
Assets:Current:
Cash and cash equivalents $ 143,912 $ $ 111,014 $ 44,158 $ 25,755 $ 74,072 $ 20,666 Accounts receivable 44,300 10,693 1,076 2,580 Prepaid items
Total current assets 188,212 10,693 112,090 46,738 25,755 74,072 20,666
Noncurrent:Capital assets, net 3,001
Total assets 188,212 13,694 112,090 46,738 25,755 74,072 20,666
75
Liabilities:Current:
Accounts payable and accrued liabilities 12,835 5,770 195 6,489 Due to other funds 10,431 Deferred revenue 56,494 Compensated absences
Total current liabilities 69,329 16,201 195 6,489 - - -
Net Assets:Invested in capital assets, net of related debt 3,001 Unrestricted 118,883 (5,508) 111,895 40,249 25,755 74,072 20,666
Total Net Assets $ 118,883 $ (2,507) $ 111,895 $ 40,249 $ 25,755 $ 74,072 $ 20,666
(Continued on next page)

EXHIBIT D-1
Assets:Current:
Cash and cash equivalentsAccounts receivablePrepaid items
Total current assets
Noncurrent:Capital assets, net
Total assets
76
CAPITOL REGION EDUCATION COUNCIL
NONMAJOR ENTERPRISE FUNDSCOMBINING STATEMENT OF NET ASSETS (CONTINUED)
JUNE 30, 2012
TechnicalProperty CASBO Assistance
and Equipment Support Conference Brokering Community ConstructionRental Services Services Service Education Services Total
$ 32,399 $ 25,513 $ $ 276,949 $ 81,968 $ 841,028 $ 1,677,434 3,245 20,445 19,423 156,940 258,702
6,319 6,31932,399 25,513 9,564 297,394 101,391 997,968 1,942,455
2,312 14,273 19,58634,711 25,513 9,564 297,394 101,391 1,012,241 1,962,041
Liabilities:Current:
Accounts payable and accrued liabilitiesDue to other fundsDeferred revenueCompensated absences
Total current liabilities
Net Assets:Invested in capital assets, net of related debtUnrestricted
Total Net Assets
20 5,408 6,126 37,815 76,881 151,53938,878 49,309
28,862 85,3562,756 2,439 75,669 80,864
20 - 47,042 6,126 69,116 152,550 367,068
2,312 14,273 19,58632,379 25,513 (37,478) 291,268 32,275 845,418 1,575,387
$ 34,691 $ 25,513 $ (37,478) $ 291,268 $ 32,275 $ 859,691 $ 1,594,973

EXHIBIT D-2
CAPITOL REGION EDUCATION COUNCIL
NONMAJOR ENTERPRISE FUNDSCOMBINING STATEMENT OF REVENUES, EXPENSES
AND CHANGES IN FUND NET ASSETS
FOR THE YEAR ENDED JUNE 30, 2012
MontessoriTraining Learning RegionalCenter of Corridor Cooperative Fingerprinting Office of Staff BEST
New England Theater Purchasing Services Communications Development Services
Operating Revenues:Sales of services $ 185,823 $ 91,355 $ 94,025 $ 126,155 $ $ $ Other local revenues 142
Total operating revenues 185,823 91,497 94,025 126,155 - - -
Operating Expenses:Salaries 86,212 36,008 20,104 47,798 Employee benefits 8,757 11,247 2,765 19,465 Purchased professional and technical
services 30,762 11,991 Purchased property services 4,938 23,966 7,200
77
Other purchased services 18,902 551 11,063 60,879 Supplies 2,483 12,035 585 665 Property 8,821 1,077 Depreciation 693 Other 6,885 2,169
Total operating expenses 158,939 93,321 49,754 136,007 - - -
Income (Loss) Before Transfers 26,884 (1,824) 44,271 (9,852) - - -
Transfers In 8,000 805 Transfers Out (25,577) (10,316) (246)
Change in Net Assets 9,307 (11,335) 44,025 (9,852) - - -
Net Assets at Beginning of Year 109,576 8,828 67,870 50,101 25,755 74,072 20,666
Net Assets and End of Year $ 118,883 $ (2,507) $ 111,895 $ 40,249 $ 25,755 $ 74,072 $ 20,666
(Continued on next page)

EXHIBIT D-2
Operating Revenues:Sales of servicesOther local revenues
Total operating revenues
Operating Expenses:SalariesEmployee benefitsPurchased professional and technical
servicesPurchased property services
78
CAPITOL REGION EDUCATION COUNCIL
NONMAJOR ENTERPRISE FUNDSCOMBINING STATEMENT OF REVENUES, EXPENSES AND CHANGES IN FUND NET ASSETS (CONTINUED)
FOR THE YEAR ENDED JUNE 30, 2012
TechnicalProperty CASBO Assistance
and Equipment Support Conference Brokering Community ConstructionRental Services Services Service Education Services Total
$ $ 2,053 $ 53,480 $ 232,016 $ 172,639 $ 891,680 $ 1,849,226 29,159 29,301
- 2,053 53,480 232,016 201,798 891,680 1,878,527
710 91,393 24,490 79,952 306,334 693,00154 22,778 7,490 37,119 56,817 166,492
250 154,801 27,999 100,904 326,707 2,559 14,150 52,813
Other purchased servicesSuppliesPropertyDepreciationOther
Total operating expenses
Income (Loss) Before Transfers
Transfers InTransfers Out
Change in Net Assets
Net Assets at Beginning of Year
Net Assets and End of Year
259 2,995 34,664 35,216 17,474 182,003 65,675 15 18,473 2,889 102,820
2,223 12,121852 1,192 2,737
50 1,352 10,456852 1,023 185,364 221,460 201,318 501,112 1,549,150
(852) 1,030 (131,884) 10,556 480 390,568 329,377
99,105 30,425 19,403 110,635 268,373(1,021) (8,942) (16,976) (146,650) (209,728)
(852) 9 (32,779) 32,039 2,907 354,553 388,022
35,543 25,504 (4,699) $ 259,229 29,368 505,138 1,206,951
$ 34,691 $ 25,513 $ (37,478) $ 291,268 $ 32,275 $ 859,691 $ 1,594,973

EXHIBIT D-3
CAPITOL REGION EDUCATION COUNCIL
NONMAJOR ENTERPRISE FUNDSCOMBINING STATEMENT OF CASH FLOWS
FOR THE YEAR ENDED JUNE 30, 2012
MontessoriTraining Learning Regional
Center of Corridor Cooperative Fingerprinting Office of Staff BESTNew England Theater Purchasing Services Communications Development Services
Cash Flows from Operating Activities:Cash received from customers and users $ 208,739 95,943 93,399 124,715 $ $ $Cash received from interfund services provided 3,019 Cash payments to suppliers (63,193) (42,196) (27,543) (68,653) Cash payments to employees (94,969) (47,255) (22,869) (67,263)
Net cash provided by (used in) operating activities 50,577 9,511 42,987 (11,201) - - -
Cash Flows from Noncapital Financing Activities: Transfers from other funds 8,000 805 Transfers to other funds (25,577) (10,316) (246)
Net cash provided by (used in) noncapital financing activities (17,577) (9,511) (246) - - - -
Cash Flows from Capital and Related Financing Activities: Additions to property, plant and equipment
Net Increase in Cash and Cash Equivalents 33,000 - 42,741 (11,201) - - -
Cash and Cash Equivalents at Beginning of Year 110,912 - 68,273 55,359 25,755 74,072 20,666
Cash and Cash Equivalents at End of Year $ 143,912 $ - $ 111,014 $ 44,158 $ 25,755 $ 74,072 $ 20,666
Reconciliation of Operating Income (Loss) to Net Cash Provided by (Used in) Operating Activities:
Operating income (loss) $ 26,884 $ (1,824) $ 44,271 $ (9,852) $ $ $ Adjustments to reconcile operating income (loss) to net cash provided by (used in) operating activities:
Depreciation 693 Change in assets and liabilities:
(Increase) decrease in accounts receivable 72,616 4,446 (626) (1,440) Increase (decrease) in accounts payable and accrued liabilities 777 3,177 (658) 91 Increase (decrease) in compensated absences Increase (decrease) in due to other funds 3,019 Increase (decrease) in deferred revenues (49,700)
Total adjustments 23,693 11,335 (1,284) (1,349) - - -
Net Cash Provided by (Used in) Operating Activities $ 50,577 $ 9,511 $ 42,987 $ (11,201) $ - $ - $ -
(Continued on next page)
79
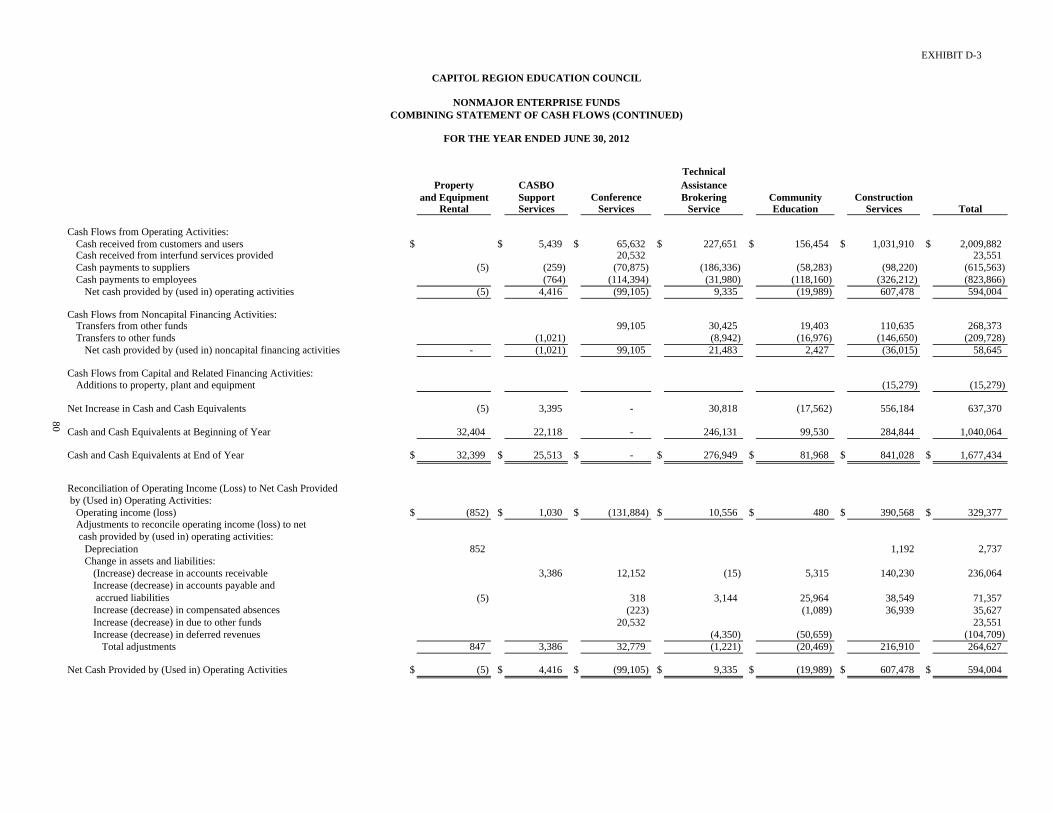
EXHIBIT D-3
Cash Flows from Operating Activities:Cash received from customers and users Cash received from interfund services provided Cash payments to suppliers Cash payments to employees
Net cash provided by (used in) operating activities
Cash Flows from Noncapital Financing Activities: Transfers from other fundsTransfers to other funds
Net cash provided by (used in) noncapital financing activities
Cash Flows from Capital and Related Financing Activities: Additions to property, plant and equipment
Net Increase in Cash and Cash Equivalents
Cash and Cash Equivalents at Beginning of Year
Cash and Cash Equivalents at End of Year
Reconciliation of Operating Income (Loss) to Net Cash Provided by (Used in) Operating Activities:
Operating income (loss)Adjustments to reconcile operating income (loss) to net cash provided by (used in) operating activities:
DepreciationChange in assets and liabilities:
(Increase) decrease in accounts receivable Increase (decrease) in accounts payable and accrued liabilitiesIncrease (decrease) in compensated absences Increase (decrease) in due to other funds Increase (decrease) in deferred revenues
Total adjustments
Net Cash Provided by (Used in) Operating Activities
80
CAPITOL REGION EDUCATION COUNCIL
NONMAJOR ENTERPRISE FUNDSCOMBINING STATEMENT OF CASH FLOWS (CONTINUED)
FOR THE YEAR ENDED JUNE 30, 2012
TechnicalProperty CASBO Assistance
and Equipment Support Conference Brokering Community ConstructionRental Services Services Service Education Services Total
$ $ 5,439 $ 65,632 $ 227,651 $ 156,454 $ 1,031,910 $ 2,009,882 20,532 23,551
(5) (259) (70,875) (186,336) (58,283) (98,220) (615,563) (764) (114,394) (31,980) (118,160) (326,212) (823,866)
(5) 4,416 (99,105) 9,335 (19,989) 607,478 594,004
99,105 30,425 19,403 110,635 268,373 (1,021) (8,942) (16,976) (146,650) (209,728)
- (1,021) 99,105 21,483 2,427 (36,015) 58,645
(15,279) (15,279)
(5) 3,395 - 30,818 (17,562) 556,184 637,370
32,404 22,118 - 246,131 99,530 284,844 1,040,064
$ 32,399 $ 25,513 $ - $ 276,949 $ 81,968 $ 841,028 $ 1,677,434
$ (852) $ 1,030 $ (131,884) $ 10,556 $ 480 $ 390,568 $ 329,377
852 1,192 2,737
3,386 12,152 (15) 5,315 140,230 236,064
(5) 318 3,144 25,964 38,549 71,357 (223) (1,089) 36,939 35,627
20,532 23,551 (4,350) (50,659) (104,709)
847 3,386 32,779 (1,221) (20,469) 216,910 264,627
$ (5) $ 4,416 $ (99,105) $ 9,335 $ (19,989) $ 607,478 $ 594,004

This page is intentionally left blank.

Internal Service Funds

INTERNAL SERVICE FUNDS CREC STAFF DEVELOPMENT - Funds contributed by all CREC operating programs that support a coordinated internal staff development program for all CREC staff members. CREC WIDE AREA NETWORK - This fund centralizes organization-wide technology costs and allocates costs to the internal users of these services. COPY CENTER - The CREC Copy Center offers a variety of services including copying, offset printing, mailing and assembly of printed materials to CREC programs, interested school systems and nonprofit organizations. SELF INSURANCE - CREC’s employee health insurance is primarily provided by a self-insured fund administered by Blue Cross/Blue Shield of Connecticut. This program accounts for all CREC health insurance activity and is responsible for maintaining the required reserves to provide health insurance coverage. CREC UNEMPLOYMENT - The CREC Unemployment Fund is a self-funded program to cover unemployment compensation costs incurred by the agency. CREC funds its unemployment claims to the State Unemployment Compensation Fund under the reimbursement method as opposed to the taxable method. WORKERS’ COMPENSATION - The Workers’ Compensation Fund is a self-insured program to cover workers’ compensation costs incurred by the agency. This program started on July 1, 2010 and accounts for all CREC workers compensation activity. It funds the required reserves and excess insurance coverage. EMPLOYEE BENEFIT FUND - CREC sponsors the CREC 403(b) Retirement Plan, which was established July 1, 1997. It provides benefits at retirement to all noncertified employees of CREC. CREC matches eligible member contributions up to 5% of covered salary.

EXHIBIT E-1CAPITOL REGION EDUCATION COUNCIL
INTERNAL SERVICE FUNDSCOMBINING STATEMENT OF NET ASSETS
CREC CREC Employee Staff Wide Area Copy Self CREC Workers’ Benefit
Development Network Center Insurance Unemployment Compensation Fund Total
Assets:Current:
Cash and cash equivalents $ 293,932 $ 110,946 $ 202,533 $ 9,170,213 $ 1,367,533 $ $ 1,249,723 $ 12,394,880 Accounts receivable 270,285 6,882 277,167 Due from other funds 1,145,574 1,145,574 Prepaid items 8,447 50,000 58,447
Total current assets 293,932 381,231 210,980 9,177,095 1,367,533 1,195,574 1,249,723 13,876,068
Noncurrent:Capital assets, net 41,612 12,378 53,990
Total assets 293,932 422,843 223,358 9,177,095 1,367,533 1,195,574 1,249,723 13,930,058
i bili i
81
JUNE 30, 2012
Liabilities:Current:
Accounts payable and accrued liabilities 16,036 78,773 4,124 1,009,764 85,695 1,057,308 37,996 2,289,696 Due to other funds 3,300 3,300 Deferred revenue 21,500 21,500 Compensated absences 64,954 1,449 66,403
Total liabilities 37,536 143,727 5,573 1,013,064 85,695 1,057,308 37,996 2,380,899
Net Assets:Invested in capital assets, net of related debt 41,612 12,378 53,990 Unrestricted 256,396 237,504 205,407 8,164,031 1,281,838 138,266 1,211,727 11,495,169
Total Net Assets $ 256,396 $ 279,116 $ 217,785 $ 8,164,031 $ 1,281,838 $ 138,266 $ 1,211,727 $ 11,549,159
1
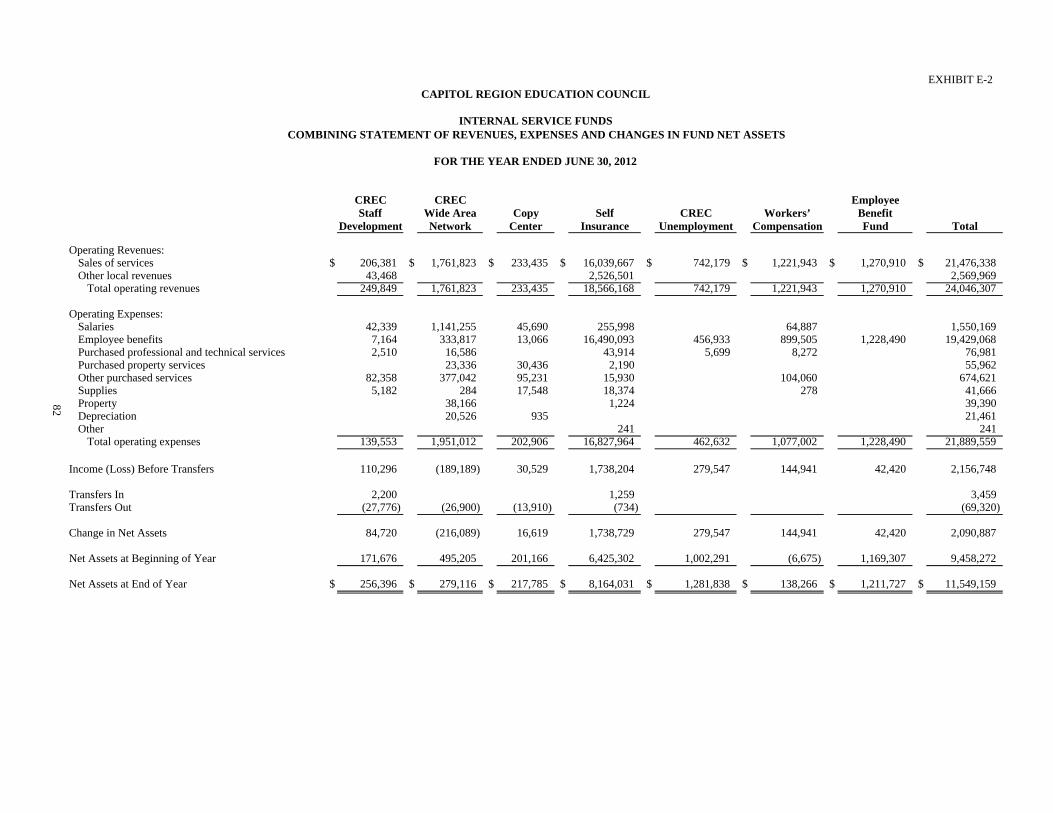
EXHIBIT E-2CAPITOL REGION EDUCATION COUNCIL
INTERNAL SERVICE FUNDSCOMBINING STATEMENT OF REVENUES, EXPENSES AND CHANGES IN FUND NET ASSETS
FOR THE YEAR ENDED JUNE 30, 2012
CREC CREC Employee Staff Wide Area Copy Self CREC Workers’ Benefit
Development Network Center Insurance Unemployment Compensation Fund Total
Operating Revenues: Sales of services $ 206,381 $ 1,761,823 $ 233,435 $ 16,039,667 $ 742,179 $ 1,221,943 $ 1,270,910 $ 21,476,338 Other local revenues 43,468 2,526,501 2,569,969
Total operating revenues 249,849 1,761,823 233,435 18,566,168 742,179 1,221,943 1,270,910 24,046,307
Operating Expenses: Salaries 42,339 1,141,255 45,690 255,998 64,887 1,550,169 Employee benefits 7,164 333,817 13,066 16,490,093 456,933 899,505 1,228,490 19,429,068 Purchased professional and technical services 2,510 16,586 43,914 5,699 8,272 76,981 Purchased property services 23,336 30,436 2,190 55,962 Other purchased services 82,358 377,042 95,231 15,930 104,060 674,621 Supplies 5,182 284 17,548 18,374 278 41,666 Property 38,166 1,224 39,390 Depreciation 20,526 935 21,461 Other 241 241
Total operating expenses 139,553 1,951,012 202,906 16,827,964 462,632 1,077,002 1,228,490 21,889,559
82
Income (Loss) Before Transfers 110,296 (189,189) 30,529 1,738,204 279,547 144,941 42,420 2,156,748
Transfers In 2,200 1,259 3,459Transfers Out (27,776) (26,900) (13,910) (734) (69,320)
Change in Net Assets 84,720 (216,089) 16,619 1,738,729 279,547 144,941 42,420 2,090,887
Net Assets at Beginning of Year 171,676 495,205 201,166 6,425,302 1,002,291 (6,675) 1,169,307 9,458,272
Net Assets at End of Year $ 256,396 $ 279,116 $ 217,785 $ 8,164,031 $ 1,281,838 $ 138,266 $ 1,211,727 $ 11,549,159

EXHIBIT E-3CAPITOL REGION EDUCATION COUNCIL
INTERNAL SERVICE FUNDSCOMBINING STATEMENT OF CASH FLOWS
FOR THE YEAR ENDED JUNE 30, 2012
CREC CREC Employee Staff Wide Area Copy Self CREC Workers’ Benefit
Development Network Center Insurance Unemployment Compensation Fund TotalCash Flows from Operating Activities:
Cash received from customers and users $ 245,199 $ 1,804,430 $ 233,435 $ 18,562,256 $ 742,179 $ 1,221,943 $ 1,270,910 $ 24,080,352 Cash received from interfund services provided 3,300 3,300 Cash payments to suppliers (102,451) (463,495) (117,651) (74,800) (5,699) (65,110) 37,996 (791,210) Cash payments to employees (48,435) (1,448,822) (58,842) (16,541,437) (434,381) (703,687) (1,228,490) (20,464,094) Cash payments for interfund services used (453,146) (453,146)
Net cash provided by (used in) operating activities 94,313 (107,887) 56,942 1,949,319 302,099 - 80,416 2,375,202
Cash Flows from Noncapital Financing Activities: Transfers from other funds 2,200 (12,673) 1,259 (9,214) Transfers to other funds (27,776) (26,900) (13,910) (734) (69,320)
Net cash provided by (used in) noncapital financing activities (25,576) (26,900) (26,583) 525 - - - (78,534)
Cash Flows from Capital and Related Financing Activities: Additions to property, plant and equipment (8,183) (8,183)
Net Increase (Decrease) in Cash and Cash Equivalents 68,737 (142,970) 30,359 1,949,844 302,099 - 80,416 2,288,485
Cash and Cash Equivalents at Beginning of Year 225,195 253,916 172,174 7,220,369 1,065,434 - 1,169,307 10,106,395
83
Cash and Cash Equivalents at End of Year $ 293,932 $ 110,946 $ 202,533 $ 9,170,213 $ 1,367,533 $ - $ 1,249,723 $ 12,394,880
Reconciliation of Operating Income (Loss) to Net Cash Provided by (Used in) Operating Activities:
Operating income (loss) $ 110,296 $ (189,189) $ 30,529 $ 1,738,204 $ 279,547 $ 144,941 $ 42,420 $ 2,156,748 Adjustments to reconcile operating income (loss) to net cash provided by (used in) operating activities:
Depreciation 20,526 935 21,461 Change in assets and liabilities:
(Increase) decrease in accounts receivable 42,607 (3,912) 38,695 (Increase) decrease in other assets 21,060 27,167 47,500 95,727 (Increase) decrease in due from other funds (453,146) (453,146) Increase (decrease) in accounts payable and accrued liabilities (32,393) 9,395 (1,401) 212,031 22,552 260,705 37,996 508,885 Increase (decrease) in compensated absences 8,774 (288) (304) 8,182 Increase (decrease) in due to other funds 3,300 3,300 Increase (decrease) in deferred revenues (4,650) (4,650)
Total adjustments (15,983) 81,302 26,413 211,115 22,552 (144,941) 37,996 218,454
Net Cash Provided by (Used in) Operating Activities $ 94,313 $ (107,887) $ 56,942 $ 1,949,319 $ 302,099 $ - $ 80,416 $ 2,375,202

Fiduciary Funds


FIDUCIARY FUNDS RIVER STREET SCHOOL EQUIPMENT ESCROW - Earnings from activities for equipment and contributions from others held by CREC on behalf of the River Street School. RIVER STREET SCHOOL-COLTSVILLE - Earnings from student activity projects and contributions from others held by CREC on behalf of the River Street School students at Coltsville. GREATER HARTFORD ACADEMY OF THE ARTS - Student activity funds held on behalf of the students of the Academy to be used to further special activities at the school.
METROPOLITAN LEARNING CENTER - Funds earned by the students of MLC from special projects, held by CREC to be used to finance future projects and activities.
SPECIAL EDUCATION ESCROW - Funds held on behalf of member districts for special education.
RIVER STREET SCHOOL - Earnings from student activity projects and contributions from others held by CREC on behalf of the River Street School students.
GREAT PATH ACADEMY - Funds held on behalf of the students of the school.
STATEWIDE RESCS ESCROW - Funds held by CREC as fiduciary of the CT RESC Alliance to be used to support joint activities.
ACADEMY OF AEROSPACE AND ENGINEERING/GREATER HARTFORD ACADEMY OF MATHEMATICS AND SCIENCE MAGNET SCHOOL ESCROW - Student activity funds held on behalf of the students of the Academy to be used to further special activities at the school.
INTEGRATED PROGRAM MODEL - Student activity funds held on behalf of the students of the program.
EAST HARTFORD/GLASTONBURY MAGNET SCHOOL ESCROW - Student activity funds held on behalf of the students of the school.
RESC ALLIANCE MINORITY RECRUITING - Member district funds, held by CREC, used to further the Minority Recruiting Program.
CREC CHARTER OAK ESCROW - Funds contributed by CREC staff housed in the Central Administrative Building are used to support monthly staff activities.
POLARIS STUDENT ACTIVITY FUND - Funds held on behalf of the students of the Polaris Center.
CHOICE ESCROW - Funds held on behalf of the students of the Choice program.
TWO RIVERS ESCROW - Student activity funds held on behalf of the students of the school. MONTESSORI MAGNET SCHOOL - Student activity funds held on behalf of the students of the school. INTERNATIONAL MAGNET SCHOOL FOR GLOBAL CITIZENSHIP ESCROW - Student activity funds held on behalf of the students of the school. REGGIO MAGNET SCHOOL OF THE ARTS ESCROW - Student activity funds held on behalf of the students of the school. HARTFORD AREA SUPERINTENDENTS’ ASSOCIATION - Activity funds held on behalf of the local superintendents association. DISCOVER ACADEMY ESCROW - Student activity funds held on behalf of the students of the school.

EXHIBIT F-1
CAPITOL REGION EDUCATION COUNCIL
FIDUCIARY FUNDSCOMBINING BALANCE SHEET
JUNE 30, 2012
Greater East Hartford/RSS Hartford Metropolitan Special River Great Statewide AAE/ Integrated Glastonbury
Equipment River Street/ Academy Learning Education Street Path RESCS GHAMAS Program Magnet SchoolEscrow Coltsville of the Arts Center Escrow School Academy Escrow Escrow Model Escrow
Assets:Cash and cash equivalents $ 11,940 $ 16,375 $ 59,156 $ 22,963 $ 108,531 $ 132,298 $ $ $ 9,639 $ 235 $ 2,773 Other assets
Total Assets $ 11,940 $ 16,375 $ 59,156 $ 22,963 $ 108,531 $ 132,298 $ - $ - $ 9,639 $ 235 $ 2,773
Liabilities:Accounts payable $ $ $ $ $ $ $ 291 $ 976 $ $ $ Fiduciary deposits 11,940 16,375 59,156 22,963 108,531 132,298 (291) (976) 9,639 235 2,773
Total Liabilities $ 11,940 $ 16,375 $ 59,156 $ 22,963 $ 108,531 $ 132,298 $ - $ - $ 9,639 $ 235 $ 2,773
84
(Continued on next page)

EXHIBIT F-1
Assets:Cash and cash equivalentsOther assets
Total Assets
Liabilities:Accounts payableFiduciary deposits
Total Liabilities
85
CAPITOL REGION EDUCATION COUNCIL
FIDUCIARY FUNDSCOMBINING BALANCE SHEET (CONTINUED)
JUNE 30, 2012
RESC CRECAlliance Charter Polaris Two Montessori DiscoveryMinority Oak Student Choice Rivers Magnet IMS Reggio HASA Academy
Recruiting Escrow Activity Escrow Escrow School Escrow Escrow Escrow Escrow Total
$ 744 $ 4,334 $ 6,625 $ 189 $ 31,043 $ 11,681 $ $ 6,550 $ 26,411 $ 316 $ 451,803 530 530
$ 744 $ 4,334 $ 6,625 $ 189 $ 31,043 $ 11,681 $ - $ 6,550 $ 26,411 $ 846 $ 452,333
$ $ $ 351 $ $ $ $ 74 $ $ $ $ 1,692 744 4,334 6,274 189 31,043 11,681 (74) 6,550 26,411 846 450,641
$ 744 $ 4,334 $ 6,625 $ 189 $ 31,043 $ 11,681 $ - $ 6,550 $ 26,411 $ 846 $ 452,333

EXHIBIT F-2
Balance BalanceJuly 1, 2011 Additions Deductions June 30, 2012
ASSETS
Cash and Cash Equivalents:RSS Equipment Escrow $ 11,515 $ 425 $ $ 11,940 River Street/Coltsville 18,001 700 2,326 16,375 Greater Hartford Arts Academy 72,110 64,821 77,775 59,156 Metropolitan Learning Center 20,905 2,300 242 22,963 Special Education Escrow 46,160 208,848 146,477 108,531 River Street School 137,666 13,787 19,155 132,298 Great Path Academy 6,143 291 6,434 - Statewide RESCS Escrow (6,667) 64,976 58,309 - AAE/GHAMAS Escrow 11,746 1,330 3,437 9,639 Integrated Program Model 235 235 East Hartford/Glastonbury Magnet School Escrow 3,109 60 396 2,773 RESC Alliance Minority Recruiting 744 744 CREC Charter Oak Escrow 3,266 1,068 4,334 Polaris Student Activity 4,514 3,759 1,648 6,625 Choice Escrow 4 185 189 Two Rivers Escrow 23,802 7,241 31,043 Montessori Magnet School 15,251 922 4,492 11,681 IMS Escrow (74) 74 -
Reggio Escrow 580 7,889 1,919 6,550 HASA Escrow 14,031 18,025 5,645 26,411
Discovery Academy Escrow 845 529 316
Total cash and cash equivalents 383,041 397,546 328,784 451,803
Other Assets:Discovery Academy Escrow 530 530
Total Assets $ 383,041 $ 398,076 $ 328,784 $ 452,333
FOR THE YEAR ENDED JUNE 30, 2012
CAPITOL REGION EDUCATION COUNCIL
AGENCY FUNDS
COMBINING STATEMENT OF CHANGES INASSETS AND LIABILITIES
(Continued on next page)
86
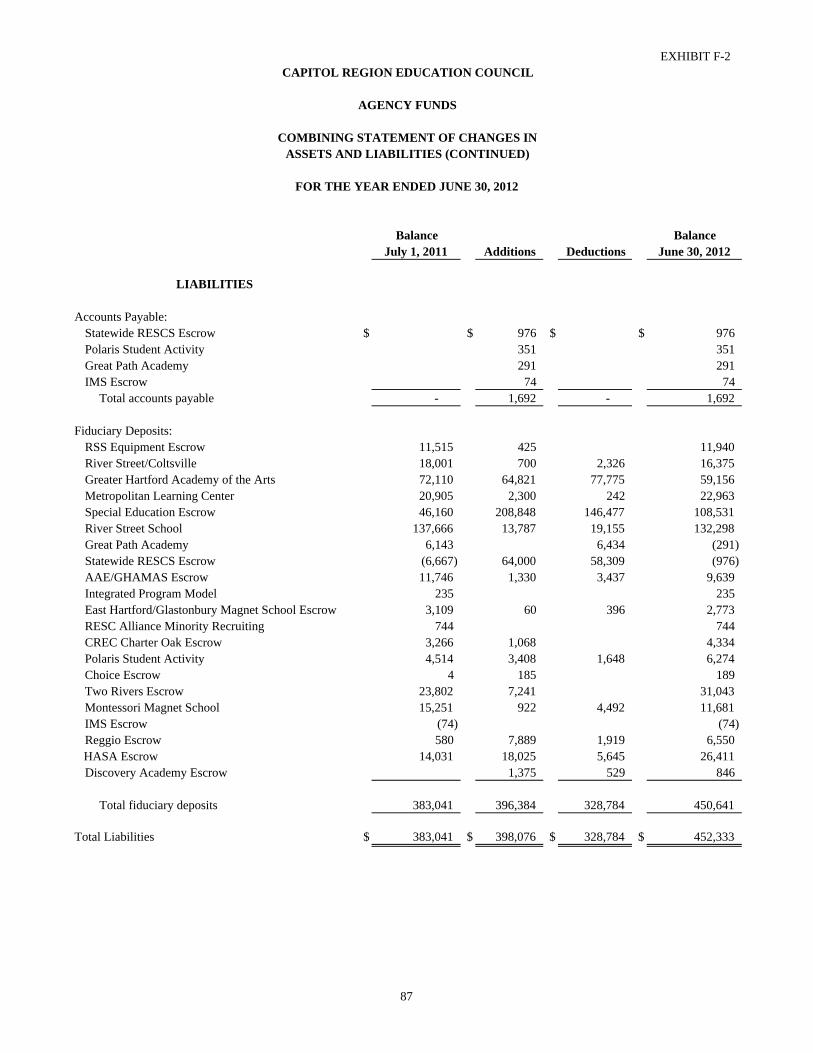
EXHIBIT F-2CAPITOL REGION EDUCATION COUNCIL
Balance BalanceJuly 1, 2011 Additions Deductions June 30, 2012
LIABILITIES
Accounts Payable:Statewide RESCS Escrow $ $ 976 $ $ 976 Polaris Student Activity 351 351 Great Path Academy 291 291 IMS Escrow 74 74
Total accounts payable - 1,692 - 1,692
Fiduciary Deposits:RSS Equipment Escrow 11,515 425 11,940 River Street/Coltsville 18,001 700 2,326 16,375 Greater Hartford Academy of the Arts 72,110 64,821 77,775 59,156 Metropolitan Learning Center 20,905 2,300 242 22,963 Special Education Escrow 46,160 208,848 146,477 108,531 River Street School 137,666 13,787 19,155 132,298 Great Path Academy 6,143 6,434 (291) Statewide RESCS Escrow (6,667) 64,000 58,309 (976) AAE/GHAMAS Escrow 11,746 1,330 3,437 9,639 Integrated Program Model 235 235 East Hartford/Glastonbury Magnet School Escrow 3,109 60 396 2,773 RESC Alliance Minority Recruiting 744 744 CREC Charter Oak Escrow 3,266 1,068 4,334 Polaris Student Activity 4,514 3,408 1,648 6,274 Choice Escrow 4 185 189 Two Rivers Escrow 23,802 7,241 31,043 Montessori Magnet School 15,251 922 4,492 11,681 IMS Escrow (74) (74) Reggio Escrow 580 7,889 1,919 6,550
HASA Escrow 14,031 18,025 5,645 26,411 Discovery Academy Escrow 1,375 529 846
Total fiduciary deposits 383,041 396,384 328,784 450,641
Total Liabilities $ 383,041 $ 398,076 $ 328,784 $ 452,333
COMBINING STATEMENT OF CHANGES INASSETS AND LIABILITIES (CONTINUED)
FOR THE YEAR ENDED JUNE 30, 2012
AGENCY FUNDS
87

This page is intentionally left blank.

Capital Assets Used in the Operation of Governmental Funds


CAPITAL ASSETS USED IN THE OPERATION OF GOVERNMENTAL FUNDS
The following schedules present only the capital asset balances related to governmental funds. The assets are reported at historical cost or estimated historical cost. CREC’s capitalization policy requires the recording of capital assets with original cost of $1,000 or more and an estimated useful life in excess of two years. Provision for depreciation is not included in the schedules.

This page is intentionally left blank.

EXHIBIT G-1CAPITOL REGION EDUCATION COUNCIL
CAPITAL ASSETS USED IN THE OPERATION OF GOVERNMENTAL FUNDS
COMPARATIVE SCHEDULE BY SOURCE
JUNE 30, 2012 AND 2011
2012 2011
Governmental Funds Capital Assets: Land $ 10,008,175 $ 2,224,925
Buildings and improvements 81,881,781 80,040,028
Vehicles 1,963,905 1,679,985
Furniture, fixtures and improvements 7,611,439 7,699,117
Construction in progress 10,683,475 1,760,797
Total $ 112,148,775 $ 93,404,852
Investments in Governmental Funds Capital Assets by Source:
General Fund $ 9,373,552 $ 10,881,079
Special Revenue Fund 201,792 258,821
Capital Projects Fund 102,573,431 82,264,952
Total $ 112,148,775 $ 93,404,852
88
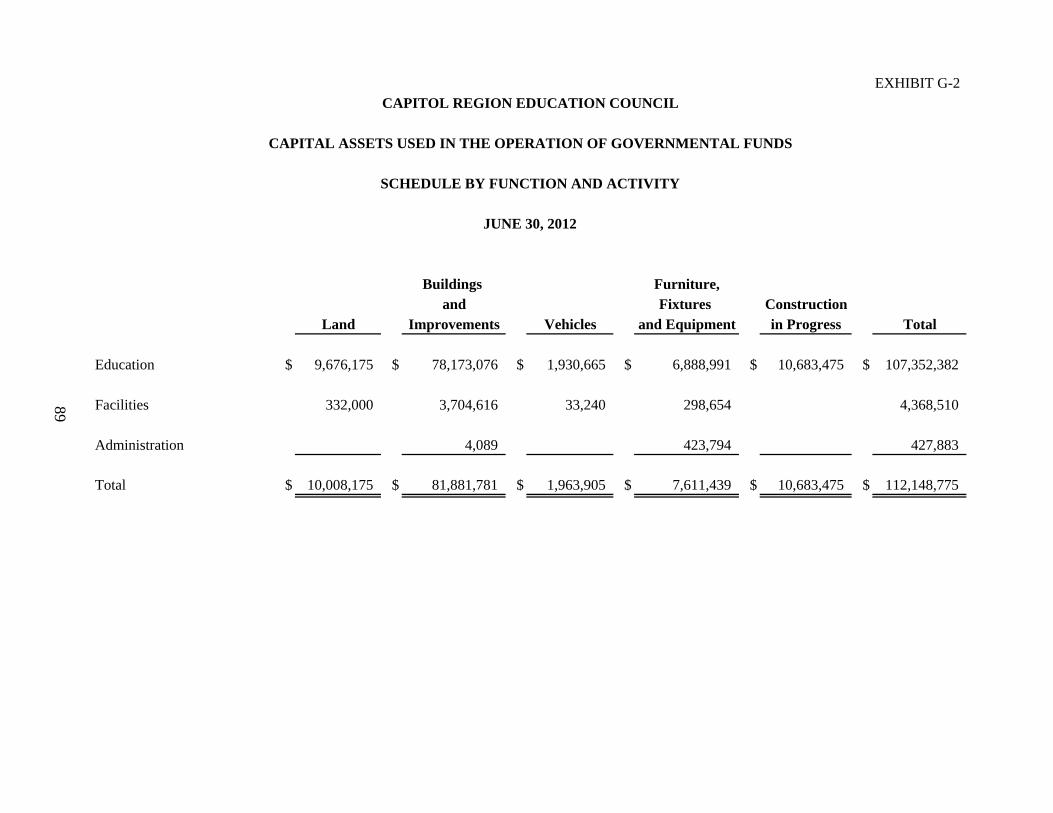
EXHIBIT G-2CAPITOL REGION EDUCATION COUNCIL
CAPITAL ASSETS USED IN THE OPERATION OF GOVERNMENTAL FUNDS
SCHEDULE BY FUNCTION AND ACTIVITY
JUNE 30, 2012
Buildings Furniture,and Fixtures Construction
Land Improvements Vehicles and Equipment in Progress Total
Education $ 9,676,175 $ 78,173,076 $ 1,930,665 $ 6,888,991 $ 10,683,475 $ 107,352,382
Facilities 332,000 3,704,616 33,240 298,654 4,368,510
Administration 4,089 423,794 427,883
Total $ 10,008,175 $ 81,881,781 $ 1,963,905 $ 7,611,439 $ 10,683,475 $ 112,148,775
89

EXHIBIT G-3CAPITOL REGION EDUCATION COUNCIL
CAPITAL ASSETS USED IN THE OPERATION OF GOVERNMENTAL FUNDS
SCHEDULE OF CHANGES BY FUNCTION AND ACTIVITY
Governmental GovernmentalFunds Funds
Capital Assets Capital AssetsJuly 1, 2011 Additions Deductions June 30, 2012
Education $ 88,591,469 $ 20,124,546 $ (1,363,633) $ 107,352,382
Facilities 4,335,962 39,095 (6,547) 4,368,510
Administration 477,421 14,757 (64,295) 427,883
Total $ 93,404,852 $ 20,178,398 $ (1,434,475) $ 112,148,775
FOR THE YEAR ENDED JUNE 30, 2012
90

This page is intentionally left blank.

Statistical Section


Statistical Section Information
The objectives of statistical section information are to provide financial statement users with historical context and detail, to assist in the use of the information contained in the financial statements, the notes to the financial statements and the required supplementary information.
Statistical section information is presented in the following categories:
Financial trends information is intended to assist users in understanding and assessing how financial position has changed over time.
Revenue capacity information is intended to assist users in understanding and assessing the factors affecting the ability to generate own-source revenues (property taxes, charges for services, etc.).
Debt capacity information is intended to assist users in understanding and assessing debt burden and the ability to issue additional debt.
Demographic and economic information is intended 1) to assist users in understanding the socioeconomic environment and 2) to provide information that facilitates comparisons of financial statement information over time and among governments.
Operating information is intended to provide contextual information about operations and resources to assist readers in using financial statement information to understand and assess economic condition.
The accompanying tables are presented in the above order. Refer to the Table of Contents for applicable page number locations.
Sources: Unless otherwise noted, the information in the tables is derived from the comprehensive annual financial reports for the relevant year.

TABLE 1CAPITOL REGION EDUCATION COUNCIL
NET ASSETS BY COMPONENTLAST TEN FISCAL YEARS
(In Thousands)
2012 2011 2010 2009 2008 2007 2006 2005 2004 2003
Governmental activities:Invested in capital assets, net of related debt $ 76,673 $ 59,554 $ 56,113 $ 55,600 $ 49,911 $ 51,159 $ 51,855 $ 54,229 $ 54,212 $ 49,973 Restricted 17 17 17 17 17 17 17 17 17 Unrestricted 28,592 22,322 17,526 17,688 18,917 17,039 15,556 13,058 11,509 11,430
Total Governmental Activities Net Assets $ 105,282 $ 81,893 $ 73,656 $ 73,305 $ 68,845 $ 68,215 $ 67,428 $ 67,304 $ 65,738 $ 61,403
Business-type activities:91 Invested in capital assets, net of related debt $ 26 $ 14 $ 12 $ 8 $ 9 $ 13 $ 17 $ 37 $ 45 $ 75 Unrestricted 273 (150) (456) (759) (929) (849) (635) (300) 175 475
Total Business-Type Activities Net Assets $ 299 $ (136) $ (444) $ (751) $ (920) $ (836) $ (618) $ (263) $ 220 $ 550
Primary government:Invested in capital assets, net of related debt $ 76,699 $ 59,568 $ 56,125 $ 55,608 $ 49,920 $ 51,172 $ 51,872 $ 54,266 $ 54,257 $ 50,048
FISCAL YEAR
Invested in capital assets, net of related debt $ 76,699 $ 59,568 $ 56,125 $ 55,608 $ 49,920 $ 51,172 $ 51,872 $ 54,266 $ 54,257 $ 50,048 Restricted 17 17 17 17 17 17 17 17 17 Unrestricted 28,865 22,172 17,070 16,929 17,988 16,190 14,921 12,758 11,684 11,905
Total Primary Government Net Assets $ 105,581 $ 81,757 $ 73,212 $ 72,554 $ 67,925 $ 67,379 $ 66,810 $ 67,041 $ 65,958 $ 61,953
Notes: (1) Schedule prepared on the accrual basis of accounting.
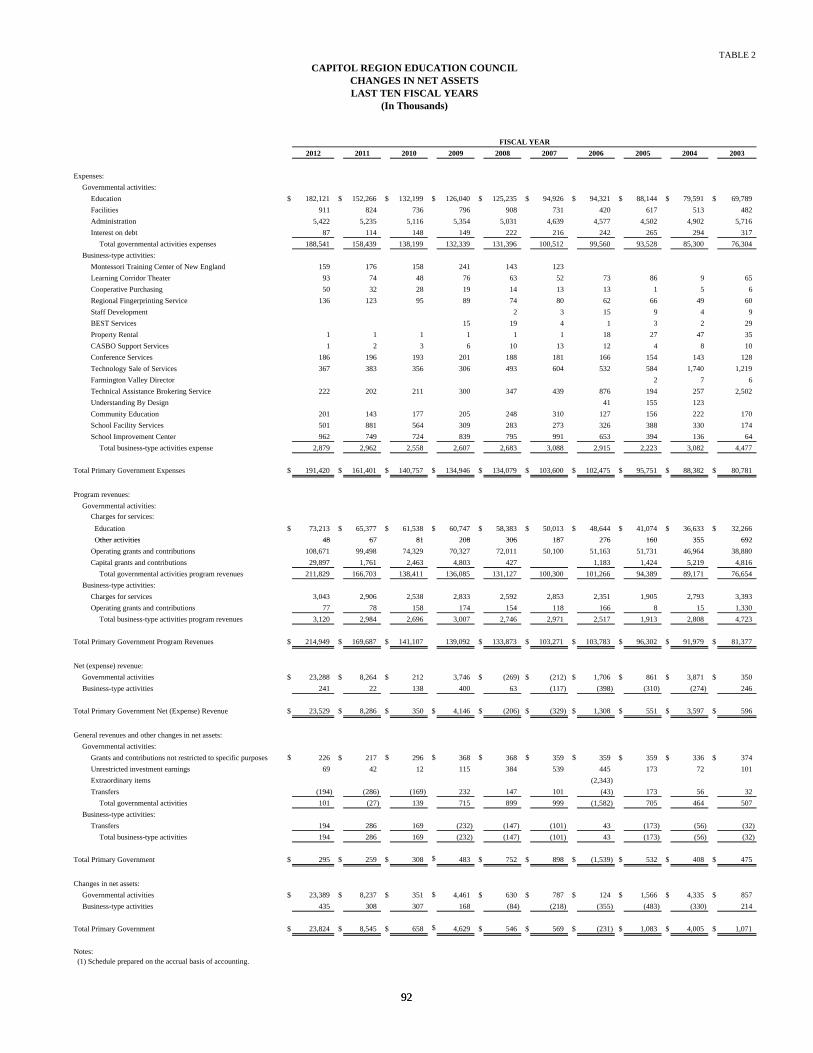
TABLE 2
CAPITOL REGION EDUCATION COUNCILCHANGES IN NET ASSETSLAST TEN FISCAL YEARS
(In Thousands)
2012 2011 2010 2009 2008 2007 2006 2005 2004 2003
Expenses:
Governmental activities:
Education $ 182,121 $ 152,266 $ 132,199 $ 126,040 $ 125,235 $ 94,926 $ 94,321 $ 88,144 $ 79,591 $ 69,789
Facilities 911 824 736 796 908 731 420 617 513 482
Administration 5,422 5,235 5,116 5,354 5,031 4,639 4,577 4,502 4,902 5,716
Interest on debt 87 114 148 149 222 216 242 265 294 317
Total governmental activities expenses 188,541 158,439 138,199 132,339 131,396 100,512 99,560 93,528 85,300 76,304
Business-type activities:
Montessori Training Center of New England 159 176 158 241 143 123
Learning Corridor Theater 93 74 48 76 63 52 73 86 9 65
Cooperative Purchasing 50 32 28 19 14 13 13 1 5 6
Regional Fingerprinting Service 136 123 95 89 74 80 62 66 49 60
Staff Development 2 3 15 9 4 9
BEST Services 15 19 4 1 3 2 29
Property Rental 1 1 1 1 1 1 18 27 47 35
CASBO Support Services 1 2 3 6 10 13 12 4 8 10
Conference Services 186 196 193 201 188 181 166 154 143 128
Technology Sale of Services 367 383 356 306 493 604 532 584 1,740 1,219
Farmington Valley Director 2 7 6
Technical Assistance Brokering Service 222 202 211 300 347 439 876 194 257 2,502
Understanding By Design 41 155 123
Community Education 201 143 177 205 248 310 127 156 222 170
School Facility Services 501 881 564 309 283 273 326 388 330 174
School Improvement Center 962 749 724 839 795 991 653 394 136 64
Total business-type activities expense 2,879 2,962 2,558 2,607 2,683 3,088 2,915 2,223 3,082 4,477
Total Primary Government Expenses $ 191,420 $ 161,401 $ 140,757 $ 134,946 $ 134,079 $ 103,600 $ 102,475 $ 95,751 $ 88,382 $ 80,781
Program revenues:
Governmental activities:
Charges for services:
Education $ 73,213 $ 65,377 $ 61,538 $ 60,747 $ 58,383 $ 50,013 $ 48,644 $ 41,074 $ 36,633 $ 32,266
Other activities 48 67 81 208 306 187 276 160 355 692
FISCAL YEAR
92
Other activities 48 67 81 208 306 187 276 160 355 692
Operating grants and contributions 108,671 99,498 74,329 70,327 72,011 50,100 51,163 51,731 46,964 38,880
Capital grants and contributions 29,897 1,761 2,463 4,803 427 1,183 1,424 5,219 4,816
Total governmental activities program revenues 211,829 166,703 138,411 136,085 131,127 100,300 101,266 94,389 89,171 76,654
Business-type activities:
Charges for services 3,043 2,906 2,538 2,833 2,592 2,853 2,351 1,905 2,793 3,393
Operating grants and contributions 77 78 158 174 154 118 166 8 15 1,330
Total business-type activities program revenues 3,120 2,984 2,696 3,007 2,746 2,971 2,517 1,913 2,808 4,723
Total Primary Government Program Revenues $ 214,949 $ 169,687 $ 141,107 139,092 $ 133,873 $ 103,271 $ 103,783 $ 96,302 $ 91,979 $ 81,377
Net (expense) revenue:
Governmental activities $ 23,288 $ 8,264 $ 212 3,746 $ (269) $ (212) $ 1,706 $ 861 $ 3,871 $ 350
Business-type activities 241 22 138 400 63 (117) (398) (310) (274) 246
Total Primary Government Net (Expense) Revenue $ 23,529 $ 8,286 $ 350 $ 4,146 $ (206) $ (329) $ 1,308 $ 551 $ 3,597 $ 596
General revenues and other changes in net assets:
Governmental activities:
Grants and contributions not restricted to specific purposes $ 226 $ 217 $ 296 $ 368 $ 368 $ 359 $ 359 $ 359 $ 336 $ 374
Unrestricted investment earnings 69 42 12 115 384 539 445 173 72 101
Extraordinary items (2,343)
Transfers (194) (286) (169) 232 147 101 (43) 173 56 32
Total governmental activities 101 (27) 139 715 899 999 (1,582) 705 464 507
Business-type activities:
Transfers 194 286 169 (232) (147) (101) 43 (173) (56) (32)
Total business-type activities 194 286 169 (232) (147) (101) 43 (173) (56) (32)
Total Primary Government $ 295 $ 259 $ 308 $ 483 $ 752 $ 898 $ (1,539) $ 532 $ 408 $ 475
Changes in net assets:
Governmental activities $ 23,389 $ 8,237 $ 351 $ 4,461 $ 630 $ 787 $ 124 $ 1,566 $ 4,335 $ 857
Business-type activities 435 308 307 168 (84) (218) (355) (483) (330) 214
Total Primary Government $ 23,824 $ 8,545 $ 658 $ 4,629 $ 546 $ 569 $ (231) $ 1,083 $ 4,005 $ 1,071
Notes: (1) Schedule prepared on the accrual basis of accounting.
92
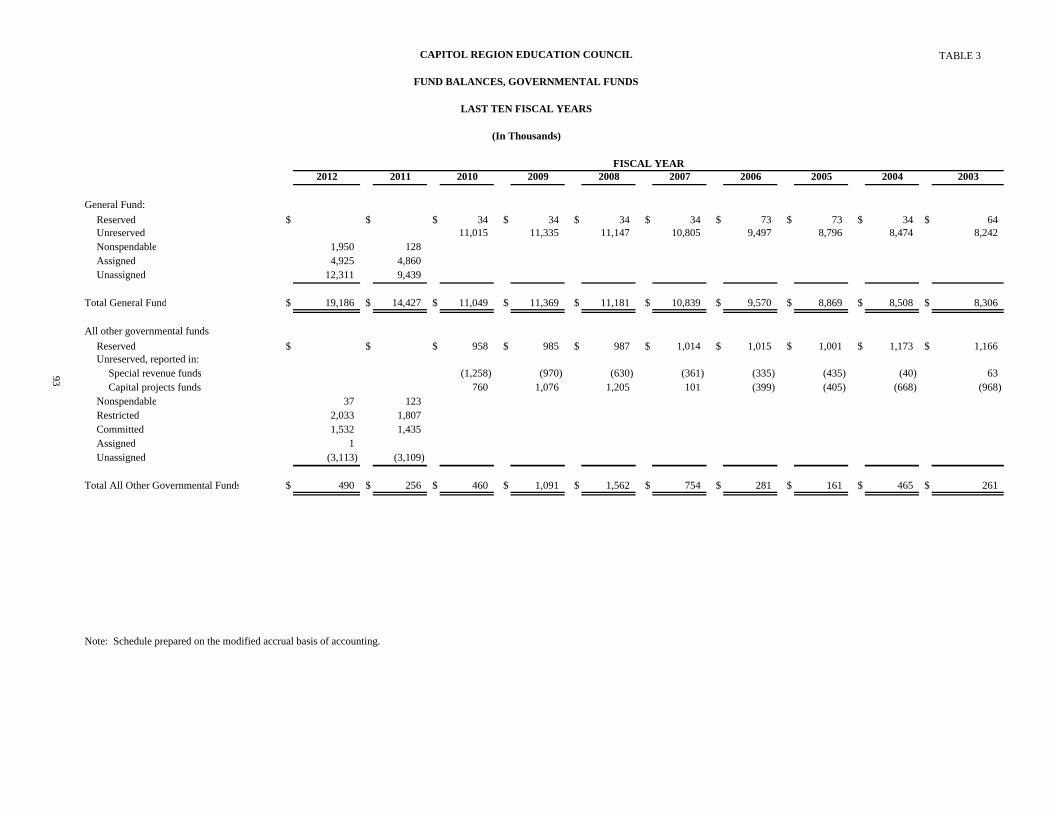
CAPITOL REGION EDUCATION COUNCIL
FUND BALANCES, GOVERNMENTAL FUNDS
LAST TEN FISCAL YEARS
(In Thousands)
TABLE 3
2012 2011 2010 2009 2008 2007 2006 2005 2004 2003
General Fund:
Reserved $ $ $ 34 $ 34 $ 34 $ 34 $ 73 $ 73 $ 34 $ 64Unreserved 11,015 11,335 11,147 10,805 9,497 8,796 8,474 8,242Nonspendable 1,950 128Assigned 4,925 4,860Unassigned 12,311 9,439
Total General Fund $ 19,186 $ 14,427 $ 11,049 $ 11,369 $ 11,181 $ 10,839 $ 9,570 $ 8,869 $ 8,508 $ 8,306
All other governmental funds:
Reserved $ $ $ 958 $ 985 $ 987 $ 1,014 $ 1,015 $ 1,001 $ 1,173 $ 1,166Unreserved, reported in:
Special revenue funds (1,258) (970) (630) (361) (335) (435) (40) 63Capital projects funds 760 1,076 1,205 101 (399) (405) (668) (968)
Nonspendable 37 123 Restricted 2,033 1,807 Committed 1,532 1,435 Assigned 1
93
FISCAL YEAR
Unassigned (3,113) (3,109)
Total All Other Governmental Funds $ 490 $ 256 $ 460 $ 1,091 $ 1,562 $ 754 $ 281 $ 161 $ 465 $ 261
Note: Schedule prepared on the modified accrual basis of accounting.
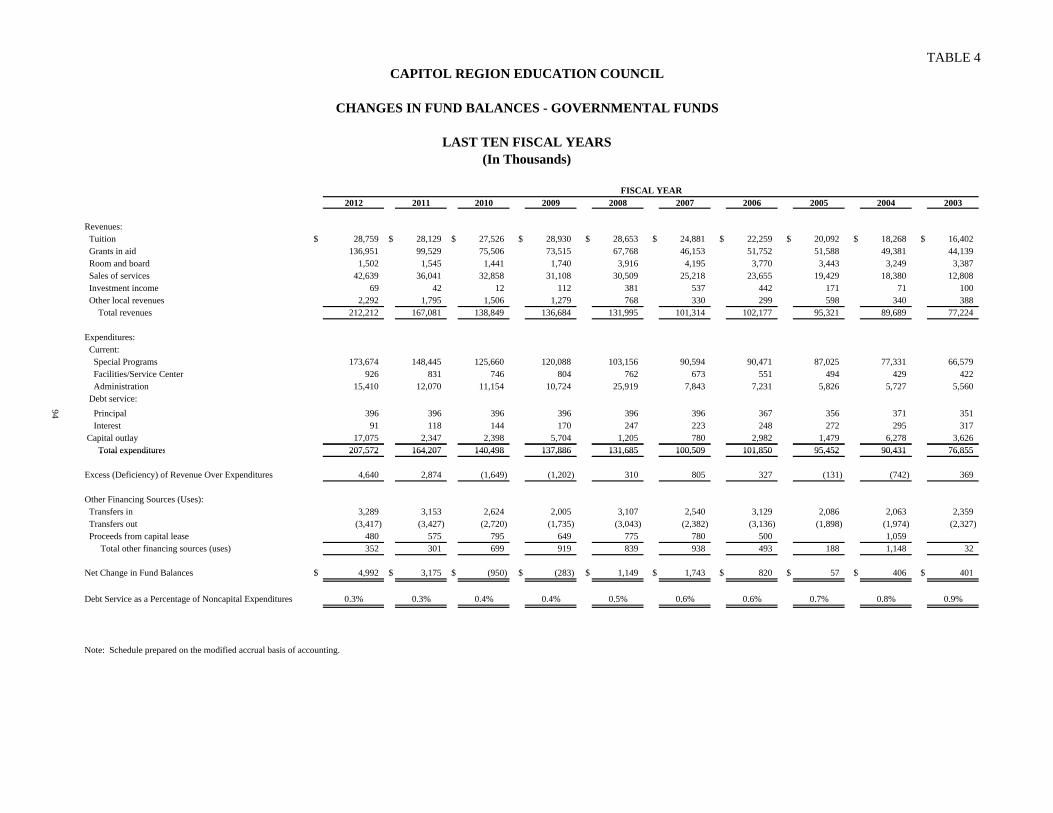
CAPITOL REGION EDUCATION COUNCIL
CHANGES IN FUND BALANCES - GOVERNMENTAL FUNDS
LAST TEN FISCAL YEARS(In Thousands)
TABLE 4
2012 2011 2010 2009 2008 2007 2006 2005 2004 2003
Revenues: Tuition $ 28,759 $ 28,129 $ 27,526 $ 28,930 $ 28,653 $ 24,881 $ 22,259 $ 20,092 $ 18,268 $ 16,402 Grants in aid 136,951 99,529 75,506 73,515 67,768 46,153 51,752 51,588 49,381 44,139 Room and board 1,502 1,545 1,441 1,740 3,916 4,195 3,770 3,443 3,249 3,387 Sales of services 42,639 36,041 32,858 31,108 30,509 25,218 23,655 19,429 18,380 12,808 Investment income 69 42 12 112 381 537 442 171 71 100 Other local revenues 2,292 1,795 1,506 1,279 768 330 299 598 340 388 Total revenues 212,212 167,081 138,849 136,684 131,995 101,314 102,177 95,321 89,689 77,224
Expenditures: Current: Special Programs 173,674 148,445 125,660 120,088 103,156 90,594 90,471 87,025 77,331 66,579 Facilities/Service Center 926 831 746 804 762 673 551 494 429 422
Administration 15,410 12,070 11,154 10,724 25,919 7,843 7,231 5,826 5,727 5,560 Debt service:
94 Principal 396 396 396 396 396 396 367 356 371 351 Interest 91 118 144 170 247 223 248 272 295 317 Capital outlay 17,075 2,347 2,398 5,704 1,205 780 2,982 1,479 6,278 3,626 Total expenditures 207,572 164,207 140,498 137,886 131,685 100,509 101,850 95,452 90,431 76,855
FISCAL YEAR
Total expenditures 207,572 164,207 140,498 137,886 131,685 100,509 101,850 95,452 90,431 76,855
Excess (Deficiency) of Revenue Over Expenditures 4,640 2,874 (1,649) (1,202) 310 805 327 (131) (742) 369
Other Financing Sources (Uses): Transfers in 3,289 3,153 2,624 2,005 3,107 2,540 3,129 2,086 2,063 2,359 Transfers out (3,417) (3,427) (2,720) (1,735) (3,043) (2,382) (3,136) (1,898) (1,974) (2,327) Proceeds from capital lease 480 575 795 649 775 780 500 1,059 Total other financing sources (uses) 352 301 699 919 839 938 493 188 1,148 32
Net Change in Fund Balances $ 4,992 $ 3,175 $ (950) $ (283) $ 1,149 $ 1,743 $ 820 $ 57 $ 406 $ 401
Debt Service as a Percentage of Noncapital Expenditures 0.3% 0.3% 0.4% 0.4% 0.5% 0.6% 0.6% 0.7% 0.8% 0.9%
Note: Schedule prepared on the modified accrual basis of accounting.

TABLE 5
Member Boards of Education 2012 2011 2010 2009 2008
Avon $ 651,844 $ 548,712 $ 579,641 $ 509,459 $ 411,644Berlin 629,152 742,160 726,204 657,617 602,847Bloomfield 1,239,409 1,139,277 1,140,537 1,195,271 1,080,427Bolton 223,071 225,870 284,310 341,121 445,621Bristol 1,469,510 936,771 977,271 1,053,757 949,988Canton 216,982 158,256 203,650 109,770 86,471Cromwell 194,919 138,847 158,573 92,149 70,232East Granby 295,638 264,326 313,790 242,423 308,632East Hartford 2,534,687 2,496,924 1,843,998 1,737,077 1,231,268East Windsor 676,268 633,544 807,616 784,166 640,913Ellington 785,844 714,953 580,350 469,247 408,981Enfield 1,210,901 937,047 958,631 985,477 706,461Farmington 1,130,747 1,038,033 748,938 866,012 815,686Glastonbury 2,267,880 2,280,294 2,013,650 1,855,129 1,723,785Granby 331,702 296,598 301,230 356,496 238,508Hartford 12,560,787 11,259,478 10,084,944 9,709,037 11,748,752Hartland 8,615 795 48 47 195Manchester 2,772,705 2,113,986 1,922,503 2,201,824 2,103,398New Britain 3,254,495 2,857,201 2,048,833 1,539,669 1,155,155New Hartford 61,174 149,434 108,282 34,142 25,227Newington 1,085,962 994,352 893,253 824,313 599,836Plainville 410,035 498,222 398,034 441,249 500,873Portland 211,394 110,652 118,385 231,044 163,000Rocky Hill 792,657 683,043 734,365 526,987 465,500Simsbury 1,608,598 1,146,014 1,611,403 1,111,469 1,067,371Somers 580,707 594,394 473,200 402,289 318,045South Windsor 1,539,400 1,429,102 1,147,482 1,158,877 839,836Southington 2,354,062 2,287,214 2,160,268 1,484,531 1,350,307Suffield 923,902 856,628 648,704 693,565 502,231Vernon 1,251,977 1,301,144 1,093,255 892,226 1,098,644West Hartford 1,996,819 1,512,521 1,360,541 780,713 803,273Wethersfield 1,653,503 1,579,678 1,605,587 1,063,339 631,898Windsor 927,056 2,288,517 2,577,284 1,963,023 1,692,897Windsor Locks 2,671,224 572,338 458,985 435,466 525,145Regional District #10 357,633 437,340 391,081 187,447 355,341
Revenue from Member Boards of Education 50,881,259 45,223,666 41,474,825 36,936,428 35,668,388
Other Sources
Other LEAs and Agencies 63,284,540 53,949,072 46,852,209 50,892,112 63,781,900State Grants 114,197,251 84,486,594 63,233,476 62,181,044 43,520,547Federal Grants 8,314,740 5,544,364 4,394,233 3,899,042 3,802,135Other Special Revenues 2,700,557 2,189,685 1,902,252 1,612,148 1,636,212
Revenue from Other Sources 188,497,088 146,169,715 116,382,170 118,584,346 112,740,794
Total Revenues $ 239,378,347 $ 191,393,381 $ 157,856,995 $ 155,520,774 $ 148,409,182
Source: Capitol Region Education Council Business Services Department
CAPITOL REGION EDUCATION COUNCILREVENUE BY SOURCE
ALL FUND TYPES
95

TABLE 6CAPITOL REGION EDUCATION COUNCIL
PRINCIPAL REVENUE PAYERS
CURRENT YEAR AND NINE YEARS AGO
Clients 2012 2003
Hartford $ 12,560,787 $ 6,480,270New Britain 3,254,495 720,051Manchester 2,772,705 921,369Windsor 2,671,224 1,056,167East Hartford 2,534,687 604,779Southington 2,354,062 1,042,358Glastonbury 2,267,880 912,324West Hartford 1,996,819 478,771Wethersfield 1,653,503 755,510Simsbury 1,608,598 739,135South Windsor 1,539,400 486,828Bristol 1,469,510 693,221Vernon 1,251,977 1,007,655Bloomfield 1,239,409 899,317Enfield 1,210,901 573,644Farmington 1,130,747 510,099Newington 1,085,962 494,962Windsor Locks 927,056 503,820Suffield 923,902 124,834
96

TABLE 7CAPITOL REGION EDUCATION COUNCIL
RATIOS OF OUTSTANDING DEBT BY TYPE
LAST TEN FISCAL YEARS(In Thousands, Except per Capita)
Governmental ActivitiesGeneral Total Debt
Fiscal Obligation Notes Capital Primary Program PerYear Bonds Payable Leases Government Enrollment Capita
2012 $ 1,100 $ 49 $ 973 $ 2,122 5,976 0.36 %
2011 1,480 65 1,172 2,717 5,071 0.54
2010 1,860 82 1,314 3,256 4,472 0.73
2009 2,240 98 1,240 3,578 4,008 0.89
2008 2,620 114 1,258 3,992 3,395 1.18
2007 3,000 131 993 4,124 3,361 1.23
2006 3,380 147 441 3,968 3,251 1.22
2005 3,730 167 373 4,270 3,228 1.32
2004 4,070 197 719 4,986 3,040 1.64
2003 4,425 229 88 4,742 2,719 1.74
97
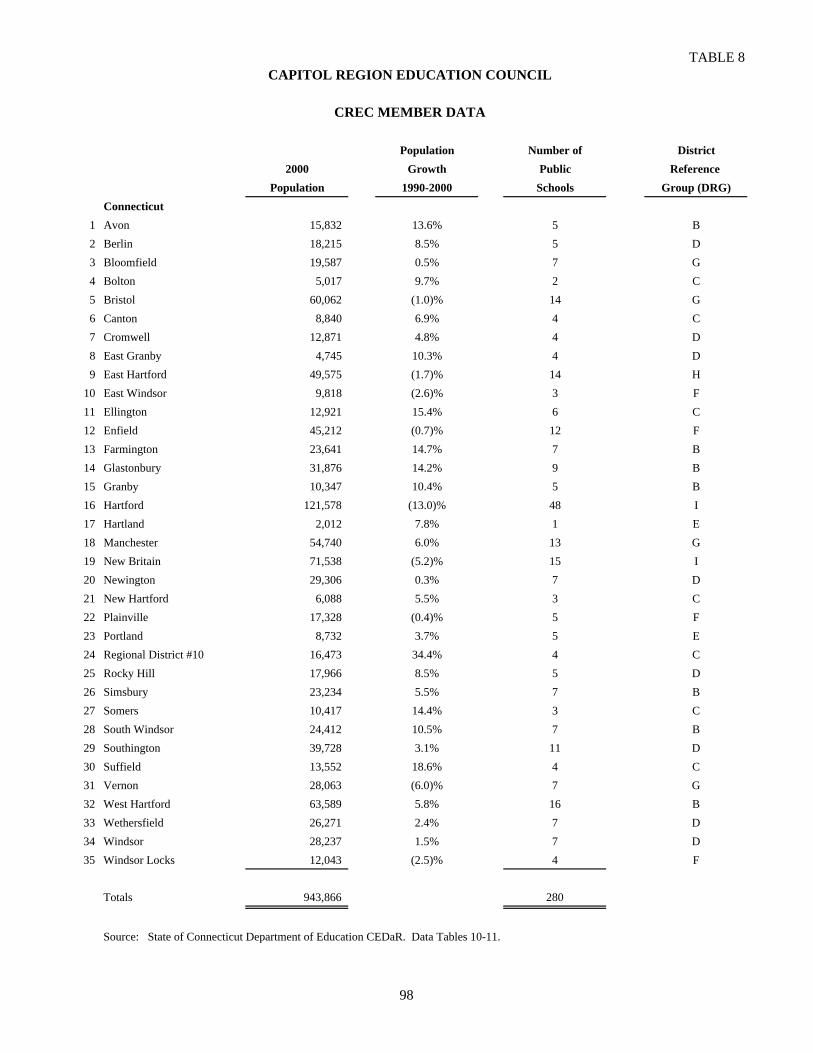
TABLE 8
Population Number of District2000 Growth Public Reference
Population 1990-2000 Schools Group (DRG)Connecticut
1 Avon 15,832 13.6% 5 B
2 Berlin 18,215 8.5% 5 D
3 Bloomfield 19,587 0.5% 7 G
4 Bolton 5,017 9.7% 2 C
5 Bristol 60,062 (1.0)% 14 G
6 Canton 8,840 6.9% 4 C
7 Cromwell 12,871 4.8% 4 D
8 East Granby 4,745 10.3% 4 D
9 East Hartford 49,575 (1.7)% 14 H
10 East Windsor 9,818 (2.6)% 3 F
11 Ellington 12,921 15.4% 6 C
12 Enfield 45,212 (0.7)% 12 F
13 Farmington 23,641 14.7% 7 B
14 Glastonbury 31,876 14.2% 9 B
15 Granby 10,347 10.4% 5 B
16 Hartford 121,578 (13.0)% 48 I
17 Hartland 2,012 7.8% 1 E
18 Manchester 54,740 6.0% 13 G
19 New Britain 71,538 (5.2)% 15 I
20 Newington 29,306 0.3% 7 D
21 New Hartford 6,088 5.5% 3 C
22 Plainville 17,328 (0.4)% 5 F
23 Portland 8,732 3.7% 5 E
24 Regional District #10 16,473 34.4% 4 C
25 Rocky Hill 17,966 8.5% 5 D
26 Simsbury 23,234 5.5% 7 B
27 Somers 10,417 14.4% 3 C
28 South Windsor 24,412 10.5% 7 B
29 Southington 39,728 3.1% 11 D
30 Suffield 13,552 18.6% 4 C
31 Vernon 28,063 (6.0)% 7 G
32 West Hartford 63,589 5.8% 16 B
33 Wethersfield 26,271 2.4% 7 D
34 Windsor 28,237 1.5% 7 D
35 Windsor Locks 12,043 (2.5)% 4 F
Totals 943,866 280
Source: State of Connecticut Department of Education CEDaR. Data Tables 10-11.
CAPITOL REGION EDUCATION COUNCIL
CREC MEMBER DATA
98

TABLE 9
Town 2011 2010 2009 2008 2007 2006 2005 2004 2003 2002
Avon 18,113 18,145 17,357 17,328 17,333 17,342 17,209 16,992 16,709 16,346Berlin 19,881 19,901 20,467 20,364 20,254 20,137 19,590 19,471 19,322 19,116Bloomfield 20,502 20,525 20,696 20,727 20,693 20,643 20,581 20,414 19,803 19,794Bolton 4,974 4,977 5,155 5,117 5,116 5,142 5,170 5,173 5,199 5,154Bristol 60,525 60,510 61,027 60,927 60,911 61,258 61,353 60,994 60,722 60,541Canton 10,300 10,337 10,125 10,104 10,086 10,081 9,932 9,603 9,413 9,061Cromwell 14,037 14,038 13,669 13,600 13,552 13,540 13,594 13,520 13,471 13,370East Granby 5,152 5,155 5,210 5,155 5,122 5,082 5,058 5,018 4,977 4,910East Hartford 51,293 51,318 48,634 48,571 48,697 48,934 49,173 49,416 49,596 49,650East Windsor 11,170 11,201 11,041 10,822 10,617 10,563 10,447 10,261 10,185 10,095Ellington 15,582 15,679 14,829 14,568 14,426 14,370 14,217 14,141 13,952 13,571Enfield 44,686 44,635 45,259 44,895 45,011 45,297 45,441 45,567 45,539 45,379Farmington 25,361 25,368 25,144 25,116 25,084 25,040 24,941 24,682 24,507 24,189Glastonbury 34,454 34,467 33,353 33,263 33,169 33,077 33,089 32,852 32,789 32,575Granby 11,291 11,292 11,220 11,219 11,215 11,187 11,088 10,989 10,869 10,696Hartford 124,867 124,744 124,060 124,062 124,563 124,699 124,397 125,053 124,387 124,558Hartland 2,116 2,114 2,087 2,079 2,077 2,090 2,082 2,078 2,068 2,053Manchester 58,287 58,354 56,388 56,385 55,857 55,738 55,572 55,563 55,390 55,084New Britain 73,261 73,253 70,548 70,486 70,664 70,855 71,254 71,832 71,572 71,589New Hartford 6,929 6,994 6,763 6,728 6,736 6,794 6,746 6,662 6,548 6,413Newington 30,586 30,599 29,818 29,699 29,619 29,586 29,676 29,646 29,695 29,623Plainville 17,730 17,724 17,284 17,221 17,193 17,312 17,382 17,371 17,461 17,407Portland 9,530 9,522 9,577 9,551 9,537 9,595 9,543 9,340 9,264 9,125Regional District #10 14,917 14,980 14,774 14,710 14,707 14,749 14,668 14,478 14,303 14,069Rocky Hill 19,723 19,754 18,827 18,852 18,808 18,835 18,760 18,620 18,528 18,305Simsbury 23,528 23,507 23,648 23,615 23,659 23,660 23,656 23,460 23,496 23,421Somers 11,433 11,469 11,215 10,984 10,850 10,888 10,877 10,888 10,870 10,608Southington 43,103 43,130 42,534 42,250 42,142 42,249 42,077 41,723 41,397 40,943South Windsor 25,729 25,751 26,258 25,966 25,940 26,030 25,985 25,586 25,270 24,846Suffield 15,747 15,789 15,163 15,136 15,104 15,127 14,704 14,539 14,217 14,021Vernon 29,139 29,205 30,182 29,839 29,620 29,672 29,491 29,338 29,206 28,718West Hartford 63,317 63,362 60,852 60,495 60,486 60,794 61,173 61,392 61,424 61,365Wethersfield 26,690 26,695 25,767 25,719 25,781 26,057 26,220 26,358 26,398 26,390Windsor 29,067 29,060 29,014 28,851 28,754 28,703 28,778 28,652 28,565 28,519Windsor Locks 12,507 12,502 12,517 12,495 12,491 12,444 12,411 12,333 12,256 12,237
Total CREC Membership 985,527 986,056 970,462 966,899 965,874 967,570 966,335 964,005 959,368 953,741
Source: State of Connecticut Department of Health - Estimated Population.
CAPITOL REGION EDUCATION COUNCIL
TOTAL POPULATION BY TOWN
FISCAL YEARS 2002 TO 2011
99
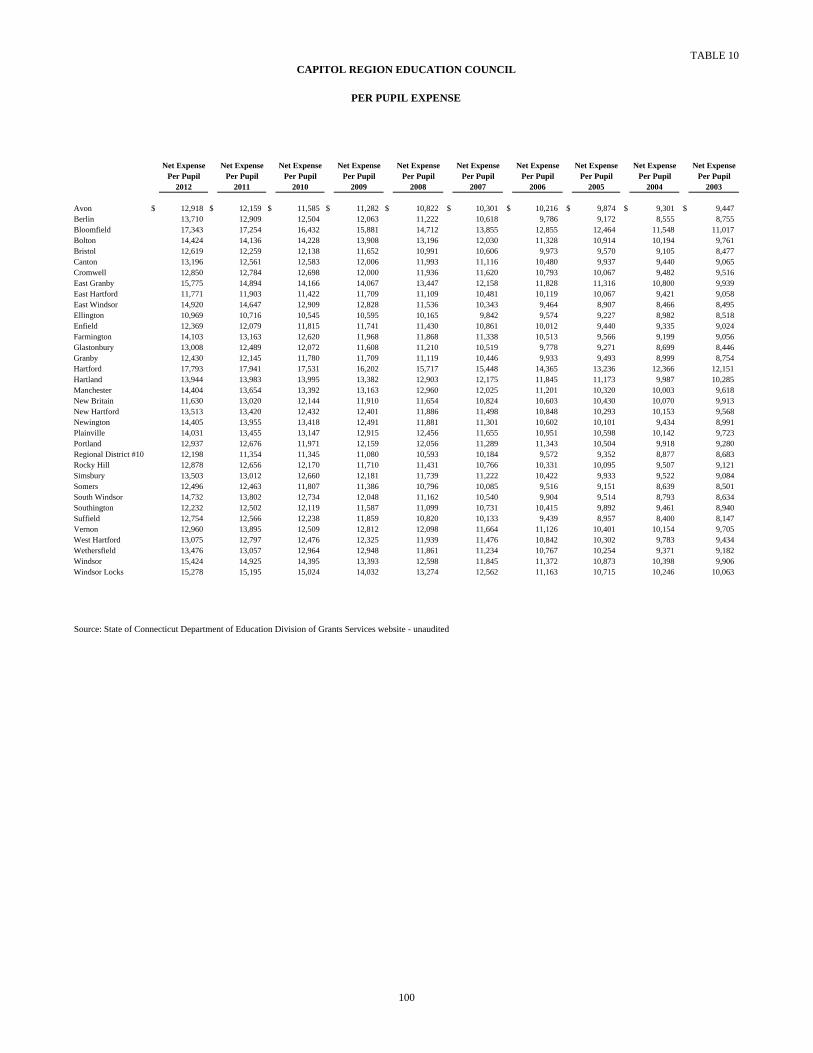
TABLE 10
Net Expense Net Expense Net Expense Net Expense Net Expense Net Expense Net Expense Net Expense Net Expense Net ExpensePer Pupil Per Pupil Per Pupil Per Pupil Per Pupil Per Pupil Per Pupil Per Pupil Per Pupil Per Pupil
2012 2011 2010 2009 2008 2007 2006 2005 2004 2003
Avon $ 12,918 $ 12,159 $ 11,585 $ 11,282 $ 10,822 $ 10,301 $ 10,216 $ 9,874 $ 9,301 $ 9,447Berlin 13,710 12,909 12,504 12,063 11,222 10,618 9,786 9,172 8,555 8,755Bloomfield 17,343 17,254 16,432 15,881 14,712 13,855 12,855 12,464 11,548 11,017Bolton 14,424 14,136 14,228 13,908 13,196 12,030 11,328 10,914 10,194 9,761Bristol 12,619 12,259 12,138 11,652 10,991 10,606 9,973 9,570 9,105 8,477Canton 13,196 12,561 12,583 12,006 11,993 11,116 10,480 9,937 9,440 9,065Cromwell 12,850 12,784 12,698 12,000 11,936 11,620 10,793 10,067 9,482 9,516East Granby 15,775 14,894 14,166 14,067 13,447 12,158 11,828 11,316 10,800 9,939East Hartford 11,771 11,903 11,422 11,709 11,109 10,481 10,119 10,067 9,421 9,058East Windsor 14,920 14,647 12,909 12,828 11,536 10,343 9,464 8,907 8,466 8,495Ellington 10,969 10,716 10,545 10,595 10,165 9,842 9,574 9,227 8,982 8,518Enfield 12,369 12,079 11,815 11,741 11,430 10,861 10,012 9,440 9,335 9,024Farmington 14,103 13,163 12,620 11,968 11,868 11,338 10,513 9,566 9,199 9,056Glastonbury 13,008 12,489 12,072 11,608 11,210 10,519 9,778 9,271 8,699 8,446Granby 12,430 12,145 11,780 11,709 11,119 10,446 9,933 9,493 8,999 8,754Hartford 17,793 17,941 17,531 16,202 15,717 15,448 14,365 13,236 12,366 12,151Hartland 13,944 13,983 13,995 13,382 12,903 12,175 11,845 11,173 9,987 10,285Manchester 14,404 13,654 13,392 13,163 12,960 12,025 11,201 10,320 10,003 9,618New Britain 11,630 13,020 12,144 11,910 11,654 10,824 10,603 10,430 10,070 9,913New Hartford 13,513 13,420 12,432 12,401 11,886 11,498 10,848 10,293 10,153 9,568Newington 14,405 13,955 13,418 12,491 11,881 11,301 10,602 10,101 9,434 8,991Plainville 14,031 13,455 13,147 12,915 12,456 11,655 10,951 10,598 10,142 9,723Portland 12,937 12,676 11,971 12,159 12,056 11,289 11,343 10,504 9,918 9,280Regional District #10 12,198 11,354 11,345 11,080 10,593 10,184 9,572 9,352 8,877 8,683Rocky Hill 12,878 12,656 12,170 11,710 11,431 10,766 10,331 10,095 9,507 9,121Simsbury 13,503 13,012 12,660 12,181 11,739 11,222 10,422 9,933 9,522 9,084Somers 12,496 12,463 11,807 11,386 10,796 10,085 9,516 9,151 8,639 8,501South Windsor 14,732 13,802 12,734 12,048 11,162 10,540 9,904 9,514 8,793 8,634Southington 12,232 12,502 12,119 11,587 11,099 10,731 10,415 9,892 9,461 8,940Suffield 12,754 12,566 12,238 11,859 10,820 10,133 9,439 8,957 8,400 8,147Vernon 12,960 13,895 12,509 12,812 12,098 11,664 11,126 10,401 10,154 9,705West Hartford 13,075 12,797 12,476 12,325 11,939 11,476 10,842 10,302 9,783 9,434Wethersfield 13,476 13,057 12,964 12,948 11,861 11,234 10,767 10,254 9,371 9,182Windsor 15,424 14,925 14,395 13,393 12,598 11,845 11,372 10,873 10,398 9,906Windsor Locks 15,278 15,195 15,024 14,032 13,274 12,562 11,163 10,715 10,246 10,063
Source: State of Connecticut Department of Education Division of Grants Services website - unaudited
CAPITOL REGION EDUCATION COUNCIL
PER PUPIL EXPENSE
100
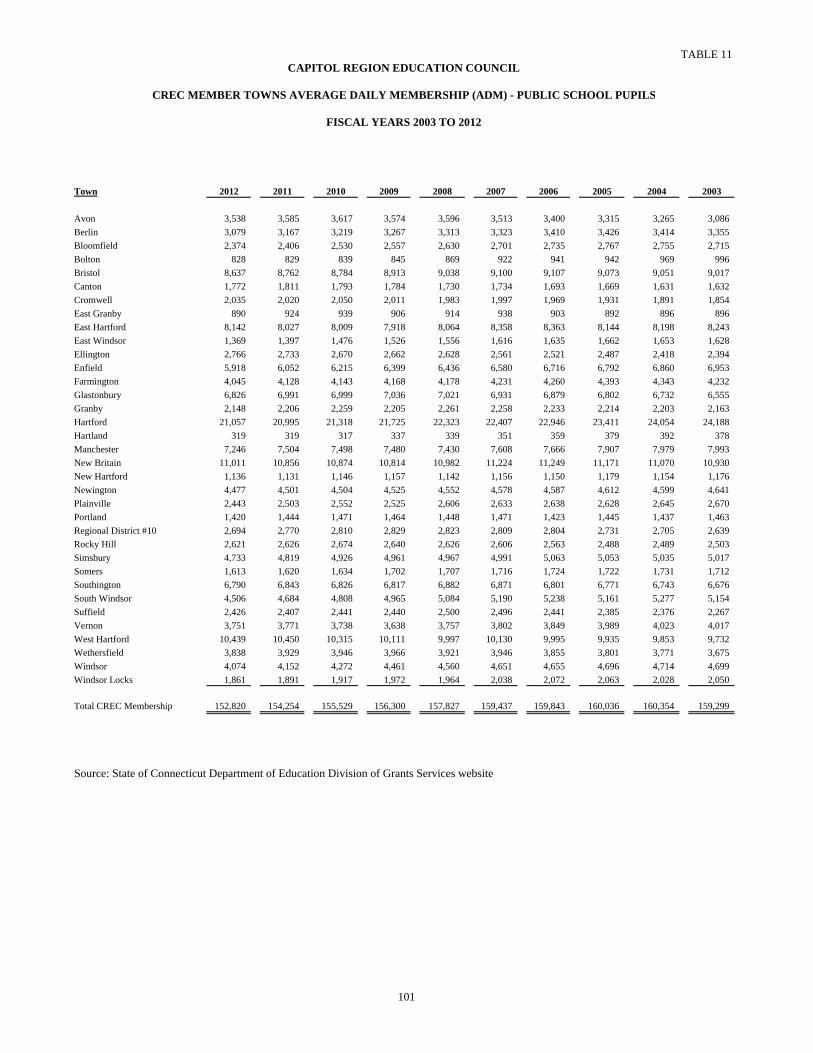
TABLE 11
Town 2012 2011 2010 2009 2008 2007 2006 2005 2004 2003
Avon 3,538 3,585 3,617 3,574 3,596 3,513 3,400 3,315 3,265 3,086
Berlin 3,079 3,167 3,219 3,267 3,313 3,323 3,410 3,426 3,414 3,355
Bloomfield 2,374 2,406 2,530 2,557 2,630 2,701 2,735 2,767 2,755 2,715
Bolton 828 829 839 845 869 922 941 942 969 996
Bristol 8,637 8,762 8,784 8,913 9,038 9,100 9,107 9,073 9,051 9,017
Canton 1,772 1,811 1,793 1,784 1,730 1,734 1,693 1,669 1,631 1,632
Cromwell 2,035 2,020 2,050 2,011 1,983 1,997 1,969 1,931 1,891 1,854
East Granby 890 924 939 906 914 938 903 892 896 896
East Hartford 8,142 8,027 8,009 7,918 8,064 8,358 8,363 8,144 8,198 8,243
East Windsor 1,369 1,397 1,476 1,526 1,556 1,616 1,635 1,662 1,653 1,628
Ellington 2,766 2,733 2,670 2,662 2,628 2,561 2,521 2,487 2,418 2,394
Enfield 5,918 6,052 6,215 6,399 6,436 6,580 6,716 6,792 6,860 6,953
Farmington 4,045 4,128 4,143 4,168 4,178 4,231 4,260 4,393 4,343 4,232
Glastonbury 6,826 6,991 6,999 7,036 7,021 6,931 6,879 6,802 6,732 6,555
Granby 2,148 2,206 2,259 2,205 2,261 2,258 2,233 2,214 2,203 2,163
Hartford 21,057 20,995 21,318 21,725 22,323 22,407 22,946 23,411 24,054 24,188
Hartland 319 319 317 337 339 351 359 379 392 378
Manchester 7,246 7,504 7,498 7,480 7,430 7,608 7,666 7,907 7,979 7,993
New Britain 11,011 10,856 10,874 10,814 10,982 11,224 11,249 11,171 11,070 10,930
New Hartford 1,136 1,131 1,146 1,157 1,142 1,156 1,150 1,179 1,154 1,176
Newington 4,477 4,501 4,504 4,525 4,552 4,578 4,587 4,612 4,599 4,641
Plainville 2,443 2,503 2,552 2,525 2,606 2,633 2,638 2,628 2,645 2,670
Portland 1,420 1,444 1,471 1,464 1,448 1,471 1,423 1,445 1,437 1,463
Regional District #10 2,694 2,770 2,810 2,829 2,823 2,809 2,804 2,731 2,705 2,639
Rocky Hill 2,621 2,626 2,674 2,640 2,626 2,606 2,563 2,488 2,489 2,503
Simsbury 4,733 4,819 4,926 4,961 4,967 4,991 5,063 5,053 5,035 5,017
Somers 1,613 1,620 1,634 1,702 1,707 1,716 1,724 1,722 1,731 1,712
Southington 6,790 6,843 6,826 6,817 6,882 6,871 6,801 6,771 6,743 6,676
South Windsor 4,506 4,684 4,808 4,965 5,084 5,190 5,238 5,161 5,277 5,154
Suffield 2,426 2,407 2,441 2,440 2,500 2,496 2,441 2,385 2,376 2,267
Vernon 3,751 3,771 3,738 3,638 3,757 3,802 3,849 3,989 4,023 4,017
West Hartford 10,439 10,450 10,315 10,111 9,997 10,130 9,995 9,935 9,853 9,732
Wethersfield 3,838 3,929 3,946 3,966 3,921 3,946 3,855 3,801 3,771 3,675
Windsor 4,074 4,152 4,272 4,461 4,560 4,651 4,655 4,696 4,714 4,699
Windsor Locks 1,861 1,891 1,917 1,972 1,964 2,038 2,072 2,063 2,028 2,050
Total CREC Membership 152,820 154,254 155,529 156,300 157,827 159,437 159,843 160,036 160,354 159,299
Source: State of Connecticut Department of Education Division of Grants Services website
CAPITOL REGION EDUCATION COUNCIL
CREC MEMBER TOWNS AVERAGE DAILY MEMBERSHIP (ADM) - PUBLIC SCHOOL PUPILS
FISCAL YEARS 2003 TO 2012
101

TABLE 12
PROGRAM 2011 2010 2009 2008 2007 2006 2005 2004 2003 2002
Discovery Academy 150
East Hartford/Glastonbury Magnet School 259 262 261 251 257 255 249 258 258 259
Farmington Valley Diagnostic Center 24 21 25 16 32 15 16 17 11 13
Great Path Academy 246 283 234 165 111 89 84 83 Greater Hartford Academy of the Arts 639 620 616 507 424 412 393 387 380 325
Academy of Aerospace & Engineering and Greater Hartford Academy of Math and Science 568 410 348 283 211 232 202 204 211 199
Integrated Program Model 5 5 9 24 26 32 32 31 32 35
International Magnet School for Global Citizenship 311 244 182 125
Lincoln Academy 8 9 3
Medical Professions and Teaching Preparation Academy 279 179
Metropolitan Learning Center 719 711 713 683 676 681 675 681 573 500
Montessori Magnet School 350 337 336 332 331 330 331 305 295 264
Museum Academy 271
Polaris Center 47 47 53 68 89 82 68 56 65 53
Public Safety Academy 389 293 216 105
Reggio Magnet School of the Arts 284 255 173 152
River Street School 205 204 204 198 190 185 178 165 157 150
Soundbridge 97 103 89 98 61 57 59 64 65 69
Two Rivers Magnet Middle School 684 658 592 589 581 609 583 594 598 425
Tunxis Middle College High School 76
University of Hartford Magnet School 441 430 418 412 406 382 381 383 395 351
TOTAL 5,976 5,071 4,472 4,008 3,395 3,361 3,251 3,228 3,040 2,719
Source: Capitol Region Education Council Business Services Department-Enrollment October 1
(Details provided on following pages)
102
CAPITOL REGION EDUCATION COUNCIL
PROGRAM ENROLLMENT SUMMARY

TABLE 12CAPITOL REGION EDUCATION COUNCIL
Discovery AcademyStudent Enrollment by LEA (Continued)
LEA 2011
Avon 1Berlin 1Bloomfield 4Bolton 2Bristol 4Canton 2CromwellEast GranbyEast Hartford 11East WindsorEllington 1Enfield 4Farmington 3Glastonbury 1GranbyHartford 48HartlandManchester 10New Britain 5New HartfordNewington 3Plainville 4PortlandRocky Hill 5SimsburySomersSouth Windsor 5Southington 2SuffieldVernonWest Hartford 9Wethersfield 10Windsor 5Windsor Locks 1Region #10Non-Member LEAs 9
TOTAL 150
(Continued on following page)
103

TABLE 12
LEA 2011 2010 2009 2008 2007 2006 2005 2004 2003 2002
AvonBerlinBloomfieldBoltonBristolCantonCromwellEast GranbyEast Hartford 128 124 134 136 133 137 134 151 149 155East WindsorEllingtonEnfieldFarmingtonGlastonbury 106 123 120 115 124 118 115 107 109 104GranbyHartford 23 12 7HartlandManchesterNew BritainNew HartfordNewingtonPlainville 1PortlandRocky HillSimsburySomersSouth Windsor 2 2SouthingtonSuffieldVernonWest HartfordWethersfieldWindsorWindsor LocksRegion #10Non-Member LEAs
TOTAL 259 262 261 251 257 255 249 258 258 259
(Continued on following page)
104
CAPITOL REGION EDUCATION COUNCIL
EAST HARTFORD/GLASTONBURY MAGNET SCHOOLStudent Enrollment by LEA (Continued)

TABLE 12
LEA 2011 2010 2009 2008 2007 2006 2005 2004 2003 2002
Avon 3 2 1 5 2 2 3 1BerlinBloomfield 1 BoltonBristol Canton 2 4 1 2 1CromwellEast Granby 1 1 3 1 1 1East HartfordEast WindsorEllingtonEnfieldFarmington 2 6 1 4 4 2 2 4 2 2GlastonburyGranby 1 2 2 3 2Hartford 1 HartlandManchesterNew Britain New HartfordNewingtonPlainville 1 1 2 3 4 3 2 1 2PortlandRocky HillSimsbury 4 4 5 4 8 2 6 5 1 2SomersSouth WindsorSouthington 10 2 4 1 2 1 1 1 2Suffield 1 VernonWest Hartford Wethersfield WindsorWindsor Locks 1Region #10 4 4 4 2 4 1 3 2 2Non-Member LEAs 0
TOTAL 24 21 25 16 32 15 16 17 11 13
(Continued on following page)
105
CAPITOL REGION EDUCATION COUNCIL
FARMINGTON VALLEY DIAGNOSTIC CENTERStudent Enrollment by LEA (Continued)

TABLE 12
LEA 2011 2010 2009 2008 2007 2006 2005 2004
AvonBerlin 1 1Bloomfield 12 17 6 2 2Bolton 4 7 7 5 7 4 6BristolCantonCromwellEast GranbyEast Hartford 45 37 27 23 27 20 22 20East Windsor 2 2Ellington 3 3 5 4Enfield 1FarmingtonGlastonbury 4 5 7 15 15 12 12 12Granby 2 3 1 1 5Hartford 67 114 103 59 19 14 14 14HartlandManchester 67 43 32 22 24 16 15 17New Britain 4 9 6 4New HartfordNewington 2 3PlainvillePortlandRocky HillSimsbury 1Somers 1South Windsor 7 10 9 6 2Southington 1SuffieldVernon 5 7 1 2West Hartford 1 1 1Wethersfield 10 3Windsor 4 5 4 1 1Windsor Locks 2 1 1Region #10Non-Member LEAs 15 20 22 19 14 12 12 10
Total 246 283 234 165 111 89 84 83
(Continued on following page)
CAPITOL REGION EDUCATION COUNCIL
GREAT PATH ACADEMYStudent Enrollment by LEA (Continued)
106

TABLE 12
LEA 2011 2010 2009 2008 2007 2006 2005 2004 2003 2002
Avon 13 9 8 8 5 6 4 3 3 3Berlin 23 26 16 7 8 4 3 2Bloomfield 2 4 3 3 2 4 3 8 7 7Bolton 3 3 3 3 2 6 4 5 5Bristol 12 10 5 3 2 2 2 2Canton 11 5 4 7 11 10 12 12 8 3Cromwell 7 2 4 2 4 6 3 2 6 2East Granby 2 3 1 2 2 2 2 3 2East Hartford 15 9 18 15 7 7 8 5 6 5East Windsor 3 1 4 2 1 3 4 1Ellington 4 4 4 6 6 5 5 2Enfield 7 6 7 6 7 5 5 10 10 10Farmington 11 11 14 9 7 4 5 5 5 4Glastonbury 18 26 28 22 19 19 25 21 25 23Granby 11 12 13 8 6 4 6 9 9 12Hartford 203 200 167 114 63 59 53 63 69 52Hartland 1 2 2 2Manchester 9 11 14 20 17 13 12 12 12 10New Britain 23 22 26 11 11 18 17 13 16 18New Hartford 2 1 2 2 1 1 1Newington 16 15 8 8 11 12 16 14 17 14Plainville 3 4 2 2 1 1Portland 9 10 7 3 4 3 5 3 1Rocky Hill 8 12 19 22 26 24 22 19 15 12Simsbury 27 12 25 25 28 27 21 22 19 12Somers 1 1 1 1South Windsor 10 7 9 5 4 7 7 6 7 8Southington 33 29 21 12 15 16 10 12 14 15Suffield 10 9 5 5 7 6 6 6 4 2Vernon 7 12 13 10 8 4 5 6 5 3West Hartford 25 27 31 27 26 25 19 27 25 20Wethersfield 11 17 19 20 20 15 15 14 10 8Windsor 5 9 11 13 15 11 12 8 8 6Windsor Locks 8 5 6 4 4 6 9 9 9 8Region #10 5 5 5 2 3 2 2 1 1Non-Member LEAs 83 82 89 99 78 81 70 62 56 55
TOTAL 639 620 616 507 424 412 393 387 380 325
(Continued on following page)
107
CAPITOL REGION EDUCATION COUNCIL
GREATER HARTFORD ACADEMY OF THE ARTSStudent Enrollment by LEA (Continued)

TABLE 12
LEA 2011 2010 2009 2008 2007 2006 2005 2004 2003 2002
Avon 6 4 4 6 6 6 3 2 1Berlin 13 7 2Bloomfield 6 5 8 9 10 11 10 10 12 10Bolton 1 2 2 2 2Bristol 14 5 1 1Canton 3 4 5 4 3 3 1 1Cromwell 1 2 1 1East Granby 3 1 1East Hartford 20 10 2East Windsor 1 2 1 1Ellington 8 3 4 6 2 5 9 7 5 3Enfield 10 1 3 1Farmington 13 12 9 8 7 8 6 8 8 8Glastonbury 6 5 6 4 1 3 5 4Granby 10 9 9 11 13 10 6 6 3 4Hartford 171 117 114 87 49 62 56 64 77 71HartlandManchester 24 15 18 17 21 21 20 21 20 21New Britain 34 22 16 12 15 16 16 16 14 16New HartfordNewington 24 21 17 11 9 11 8 8 9 8Plainville 5 4 3 1Portland 4 4 4 4Rocky Hill 37 31 31 25 24 27 24 24 26 22Simsbury 3 4 7 8 9 10 8 8 8 5Somers 1South Windsor 2 2 1Southington 31 25 23 12 12 10 4 4 4 5Suffield 10 12 9 12 6 3 3Vernon 6 4 4 1 2 2 2West Hartford 21 18 12 10 4 3 3 1 2 2Wethersfield 23 19 11 13 13 13 8 8 5 9Windsor 14 10 7 8 6 8 7 9 6 7Windsor Locks 5 3 2 Region #10 3 1 3 1Non-Member LEAs 35 28 12 7 2 4 3 3 2 2
TOTAL 568 410 348 283 211 232 202 204 211 199
108
(Continued on following page)
CAPITOL REGION EDUCATION COUNCIL
ACADEMY OF AEROSPACE & ENGINEERING AND GREATER HARTFORD ACADEMY OF MATH & SCIENCEStudent Enrollment by LEA (Continued)

TABLE 12
LEA 2011 2010 2009 2008 2007 2006 2005 2004 2003 2002
AvonBerlin 1 1 1 1 1 1Bloomfield 1 1Bolton 1Bristol 1 Canton 1 1 1CromwellEast GranbyEast Hartford 1East WindsorEllington 1 1 1EnfieldFarmington 1 1 1GlastonburyGranbyHartford 1 1 1 3 2 2 2HartlandManchesterNew Britain 2 1 1 3 3 1 1 1New Hartford 1NewingtonPlainville 1 2 1 2 2 3 3 3 2 2Portland 1 1 1 1 1 1Rocky Hill 1 1 1 1 2Simsbury 1 1SomersSouth WindsorSouthingtonSuffieldVernon 1 1 1 1 4West HartfordWethersfield 1 1 1 WindsorWindsor Locks 1 1 1Region #10 1Non-Member LEAs 1 1 5 15 18 21 19 18 20 17
TOTAL 5 5 9 24 26 32 32 31 32 35
(Continued on following page)
109
CAPITOL REGION EDUCATION COUNCIL
INTEGRATED PROGRAM MODELStudent Enrollment by LEA (Continued)

TABLE 12CAPITOL REGION EDUCATION COUNCIL
INTERNATIONAL MAGNET SCHOOL FOR GLOBAL CITIZENSHIPStudent Enrollment by LEA (Continued)
LEA 2011 2010 2009 2008
Avon Berlin 3 3 1Bloomfield 3 Bolton 1 Bristol 3 1Canton 1 Cromwell 2 1 1 1East GranbyEast Hartford 43 31 14 8East Windsor 1 1Ellington 13 5 2Enfield 3 2 2 1Farmington 1 1Glastonbury 28 34 27 13Granby Hartford 107 88 78 60HartlandManchester 23 15 5 5New Britain 1 1 1 1New Hartford Newington 4 4 5 4Plainville 1Portland 1 1 2 2Rocky Hill 3 1 3 4Simsbury SomersSouth Windsor 18 14 13 5Southington SuffieldVernon 10 10 7 5West Hartford 5 2 2 5Wethersfield 11 11 5 4Windsor 1 1 Windsor Locks Region #10Non-Member LEAs 25 20 14 3
TOTAL 311 244 182 125
(Continued on following page)
110
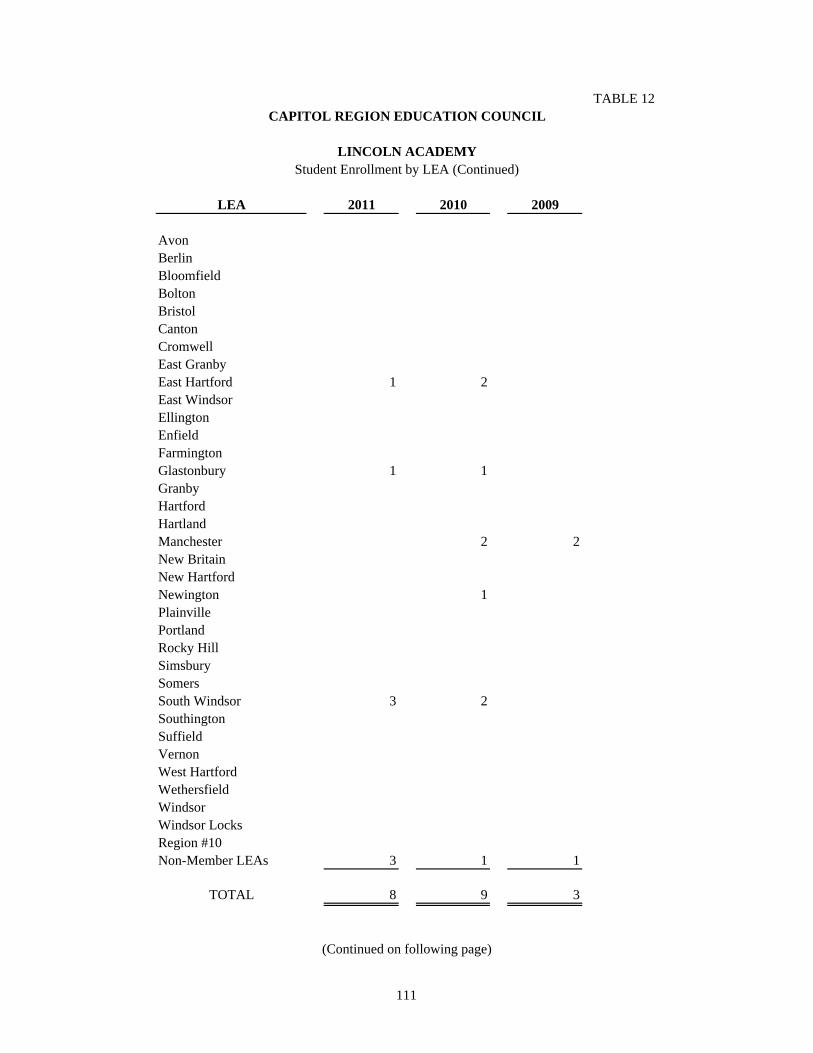
TABLE 12CAPITOL REGION EDUCATION COUNCIL
LINCOLN ACADEMYStudent Enrollment by LEA (Continued)
LEA 2011 2010 2009
AvonBerlinBloomfieldBoltonBristolCantonCromwellEast GranbyEast Hartford 1 2East WindsorEllingtonEnfieldFarmingtonGlastonbury 1 1GranbyHartfordHartlandManchester 2 2New BritainNew HartfordNewington 1PlainvillePortlandRocky HillSimsburySomersSouth Windsor 3 2SouthingtonSuffieldVernonWest HartfordWethersfieldWindsorWindsor LocksRegion #10Non-Member LEAs 3 1 1
TOTAL 8 9 3
(Continued on following page)
111

TABLE 12CAPITOL REGION EDUCATION COUNCIL
MEDICAL PROFESSIONS AND TEACHING PREPARATION ACADEMYStudent Enrollment by LEA (Continued)
LEA 2011 2010
AvonBerlin 1 3Bloomfield 10 6BoltonBristol 2 3CantonCromwellEast GranbyEast Hartford 24 10East Windsor 1Ellington 3Enfield 18 7Farmington 1 1Glastonbury 3 1Granby 2Hartford 81 70HartlandManchester 14 9New Britain 45 31New HartfordNewington 5 4Plainville 2 2PortlandRocky Hill 2 2Simsbury 2Somers 2South Windsor 9 4Southington 1Suffield 3 1Vernon 6 7West Hartford 8 8Wethersfield 2 2Windsor 14Windsor Locks 4 2Region #10Non-Member LEAs 15 5
TOTAL 279 179
(Continued on following page)
112

TABLE 12
LEA 2011 2010 2009 2008 2007 2006 2005 2004 2003 2002
AvonBerlinBloomfield 117 129 141 138 136 141 138 134 105 92BoltonBristol 3 1Canton 1CromwellEast Granby 7 3 2 1East Hartford 34 27 24 4 9East Windsor 43 42 47 42 40 46 41 44 38 29Ellington 2 1 1 1Enfield 64 58 43 42 40 43 38 41 33 28FarmingtonGlastonbury 1Granby 3 1 2Hartford 188 207 214 221 209 200 197 191 173 149HartlandManchester 7 3 2 1 5New Britain 25 21 12 6 1New HartfordNewington 1Plainville 1 1PortlandRocky HillSimsbury 1 2 2 1SomersSouth Windsor 1 1SouthingtonSuffield 1 1 1 1Vernon 2 2 1 1West Hartford 8 3 4 8Wethersfield 3 3 3 2Windsor 154 152 150 150 168 186 200 203 160 147Windsor Locks 50 51 63 64 67 65 61 68 64 55Region #10 1Non-Member LEAs 4 1
TOTAL 719 711 713 683 676 681 675 681 573 500
(Continued on following page)
113
CAPITOL REGION EDUCATION COUNCIL
METROPOLITAN LEARNING CENTERStudent Enrollment by LEA (Continued)
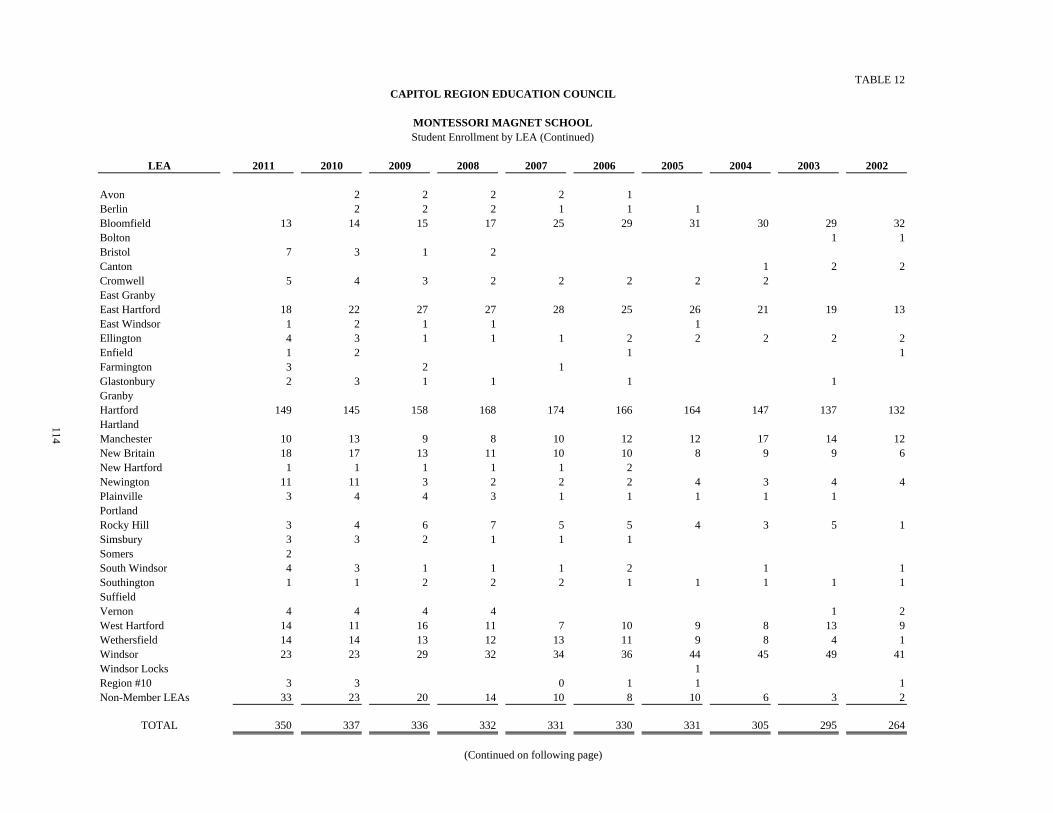
TABLE 12
LEA 2011 2010 2009 2008 2007 2006 2005 2004 2003 2002
Avon 2 2 2 2 1 Berlin 2 2 2 1 1 1Bloomfield 13 14 15 17 25 29 31 30 29 32Bolton 1 1Bristol 7 3 1 2Canton 1 2 2Cromwell 5 4 3 2 2 2 2 2East GranbyEast Hartford 18 22 27 27 28 25 26 21 19 13East Windsor 1 2 1 1 1Ellington 4 3 1 1 1 2 2 2 2 2Enfield 1 2 1 1Farmington 3 2 1 Glastonbury 2 3 1 1 1 1GranbyHartford 149 145 158 168 174 166 164 147 137 132HartlandManchester 10 13 9 8 10 12 12 17 14 12New Britain 18 17 13 11 10 10 8 9 9 6New Hartford 1 1 1 1 1 2Newington 11 11 3 2 2 2 4 3 4 4Plainville 3 4 4 3 1 1 1 1 1PortlandRocky Hill 3 4 6 7 5 5 4 3 5 1Simsbury 3 3 2 1 1 1 Somers 2South Windsor 4 3 1 1 1 2 1 1Southington 1 1 2 2 2 1 1 1 1 1SuffieldVernon 4 4 4 4 1 2West Hartford 14 11 16 11 7 10 9 8 13 9Wethersfield 14 14 13 12 13 11 9 8 4 1Windsor 23 23 29 32 34 36 44 45 49 41Windsor Locks 1Region #10 3 3 0 1 1 1Non-Member LEAs 33 23 20 14 10 8 10 6 3 2
TOTAL 350 337 336 332 331 330 331 305 295 264
(Continued on following page)
114
CAPITOL REGION EDUCATION COUNCIL
MONTESSORI MAGNET SCHOOLStudent Enrollment by LEA (Continued)

TABLE 12CAPITOL REGION EDUCATION COUNCIL
MUSEUM ACADEMYStudent Enrollment by LEA (Continued)
LEA 2011
Avon 2Berlin 2Bloomfield 10Bolton 2Bristol 2CantonCromwell 1East GranbyEast Hartford 17East Windsor 2EllingtonEnfield 4Farmington 2Glastonbury 2GranbyHartford 121HartlandManchester 6New Britain 5New HartfordNewington 12Plainville 4Portland 3Rocky Hill 3SimsburySomers 2South WindsorSouthington 2SuffieldVernonWest Hartford 27Wethersfield 5Windsor 21Windsor Locks 1Region #10Non-Member LEAs 13
TOTAL 271
(Continued on following page)
115

TABLE 12
LEA 2011 2010 2009 2008 2007 2006 2005 2004 2003 2002
AvonBerlin 1 2Bloomfield 1 2 1 1 1 2 1 1 1 3Bolton 1 2 1 1 1 Bristol 1 2 1 2 2CantonCromwell 1 1 1 1East Granby 1 1East Hartford 2 1 1 2 2 1 3East Windsor 3 1 2 1 2 4 1 1 1Ellington 1 1 1Enfield 1 1 1 2 1 Farmington 1 Glastonbury 1 3 3 1Granby 2 1 1 1 1Hartford 18 17 22 27 24 25 16 13 14 6HartlandManchester 3 9 9 4 7 1 7 4New Britain 5 3 4 7 7 7 8 3 6 4New HartfordNewington 3 1 2 2 1 1Plainville 1 PortlandRocky Hill 1Simsbury 1 1Somers 1South Windsor 2 1 1 2 1 2 2 Southington 1 1 1Suffield Vernon 2 4 4 1 1 1 3 1 1 West Hartford 1 1 1 1 1 1Wethersfield 2 1 Windsor 1 3 5 4 1 1 2 2 2Windsor Locks 3 3 1Region #10 1 Non-Member LEAs 13 12 4 5 26 27 21 23 22 21
TOTAL 47 47 53 68 89 82 68 56 65 53
(Continued on following page)
116
CAPITOL REGION EDUCATION COUNCIL
POLARIS CENTERStudent Enrollment by LEA (Continued)
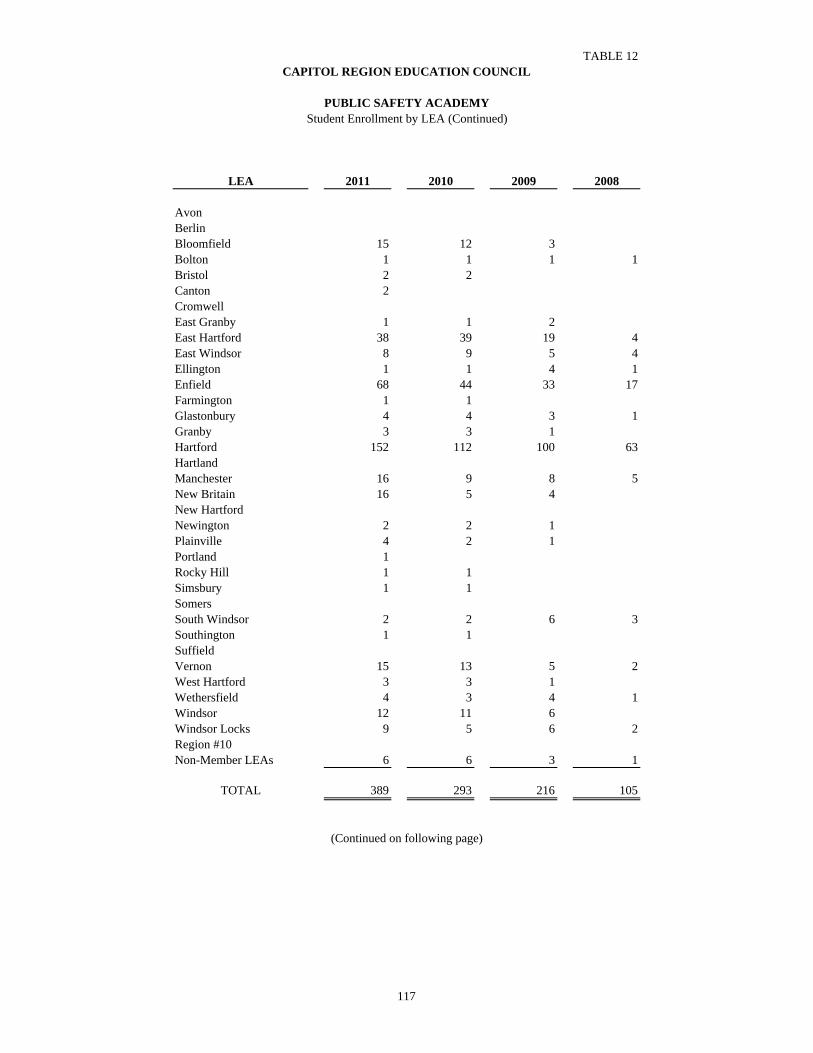
TABLE 12CAPITOL REGION EDUCATION COUNCIL
PUBLIC SAFETY ACADEMYStudent Enrollment by LEA (Continued)
LEA 2011 2010 2009 2008
Avon Berlin Bloomfield 15 12 3 Bolton 1 1 1 1Bristol 2 2 Canton 2 Cromwell East Granby 1 1 2East Hartford 38 39 19 4East Windsor 8 9 5 4Ellington 1 1 4 1Enfield 68 44 33 17Farmington 1 1 Glastonbury 4 4 3 1Granby 3 3 1 Hartford 152 112 100 63Hartland Manchester 16 9 8 5New Britain 16 5 4 New Hartford Newington 2 2 1 Plainville 4 2 1 Portland 1 Rocky Hill 1 1 Simsbury 1 1 Somers South Windsor 2 2 6 3Southington 1 1 SuffieldVernon 15 13 5 2West Hartford 3 3 1 Wethersfield 4 3 4 1Windsor 12 11 6 Windsor Locks 9 5 6 2Region #10Non-Member LEAs 6 6 3 1
TOTAL 389 293 216 105
(Continued on following page)
117

TABLE 12CAPITOL REGION EDUCATION COUNCIL
REGGIO MAGNET SCHOOL OF THE ARTSStudent Enrollment by LEA (Continued)
LEA 2011 2010 2009 2008
Avon 28 28 22 22Berlin 1 1 1Bloomfield 3 2 Bolton Bristol 13 9 3 3Canton 9 12 11 4CromwellEast GranbyEast Hartford 6 5 3 4East WindsorEllingtonEnfieldFarmington 9 8 6 11Glastonbury Granby Hartford 149 131 82 58Hartland 1Manchester 2 1 New Britain 4 2 4 3New Hartford 9 2 2 3Newington 1Plainville 1 2PortlandRocky HillSimsbury 7 13 18 17SomersSouth Windsor Southington 3 4 3 3SuffieldVernon 3 3West Hartford 11 15 15 15Wethersfield 2 2Windsor 2 1 1Windsor Locks Region #10 8 8 1Non-Member LEAs 16 8 1 3
TOTAL 284 255 173 152
(Continued on following page)
118
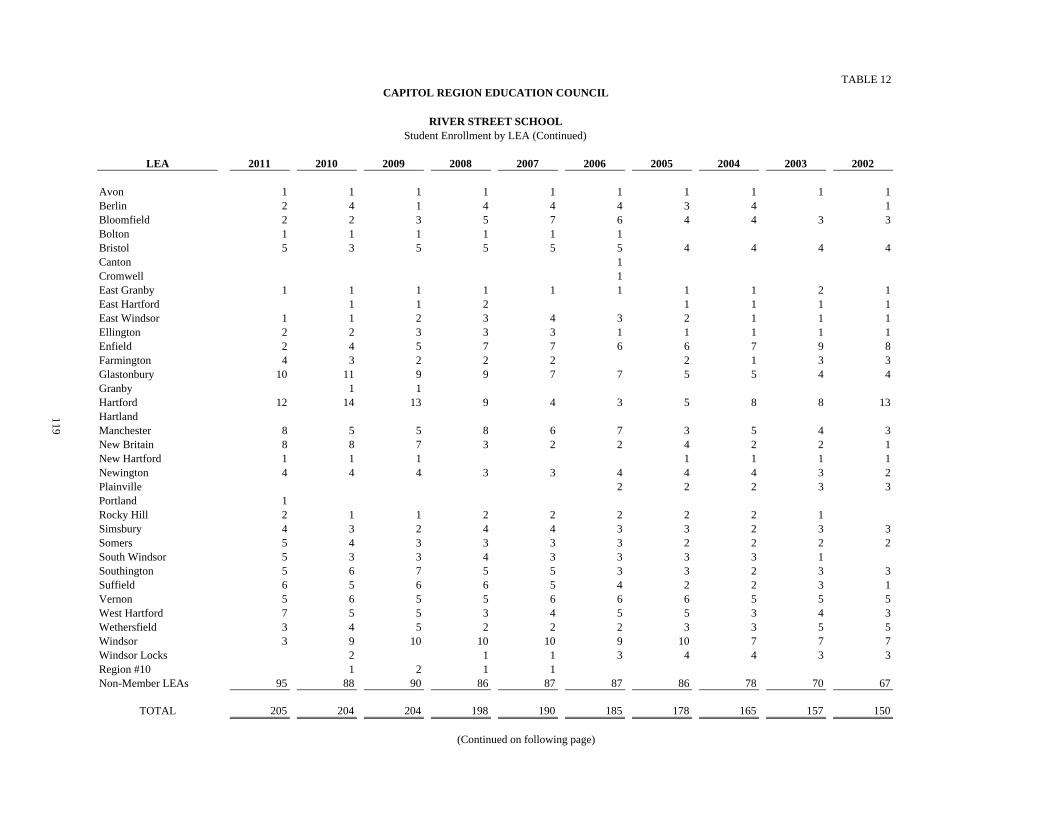
TABLE 12
LEA 2011 2010 2009 2008 2007 2006 2005 2004 2003 2002
Avon 1 1 1 1 1 1 1 1 1 1Berlin 2 4 1 4 4 4 3 4 1Bloomfield 2 2 3 5 7 6 4 4 3 3Bolton 1 1 1 1 1 1Bristol 5 3 5 5 5 5 4 4 4 4Canton 1Cromwell 1East Granby 1 1 1 1 1 1 1 1 2 1East Hartford 1 1 2 1 1 1 1East Windsor 1 1 2 3 4 3 2 1 1 1Ellington 2 2 3 3 3 1 1 1 1 1Enfield 2 4 5 7 7 6 6 7 9 8Farmington 4 3 2 2 2 2 1 3 3Glastonbury 10 11 9 9 7 7 5 5 4 4Granby 1 1Hartford 12 14 13 9 4 3 5 8 8 13HartlandManchester 8 5 5 8 6 7 3 5 4 3New Britain 8 8 7 3 2 2 4 2 2 1New Hartford 1 1 1 1 1 1 1Newington 4 4 4 3 3 4 4 4 3 2Plainville 2 2 2 3 3Portland 1Rocky Hill 2 1 1 2 2 2 2 2 1Simsbury 4 3 2 4 4 3 3 2 3 3Somers 5 4 3 3 3 3 2 2 2 2South Windsor 5 3 3 4 3 3 3 3 1Southington 5 6 7 5 5 3 3 2 3 3Suffield 6 5 6 6 5 4 2 2 3 1Vernon 5 6 5 5 6 6 6 5 5 5West Hartford 7 5 5 3 4 5 5 3 4 3Wethersfield 3 4 5 2 2 2 3 3 5 5Windsor 3 9 10 10 10 9 10 7 7 7Windsor Locks 2 1 1 3 4 4 3 3Region #10 1 2 1 1Non-Member LEAs 95 88 90 86 87 87 86 78 70 67
TOTAL 205 204 204 198 190 185 178 165 157 150
(Continued on following page)
119
CAPITOL REGION EDUCATION COUNCIL
RIVER STREET SCHOOLStudent Enrollment by LEA (Continued)

TABLE 12
LEA 2011 2010 2009 2008 2007 2006 2005 2004 2003 2002
AvonBerlin 3 1 2 1 3 2 2Bloomfield 3 4 5 5 4BoltonBristol 4 4 4 6 6 5 3 5 6 5CantonCromwell 2East Granby 1 1 1East Hartford 4 3 2 3 3 3 3 1 2 1East WindsorEllington 1 1Enfield 1 1 2 2 2 2Farmington 1 1 Glastonbury 2 1 1 1GranbyHartford 1 4 5 6 6 6 7 8 11 14HartlandManchester 1 2 1 1 1 3 1 1 New Britain 2 4 4 2 4 5 6 4 4 5New HartfordNewington 8 6 9 9 3 4 4 4 4 4Plainville 2 1 1 1 1 1Portland 2Rocky Hill 4 8 4 4 2 2 2 2 2Simsbury 1 3 3 3 2SomersSouth Windsor 2 2 1 1 1 1 1 2Southington 2 4 4 4 4 3 1 3 2 2SuffieldVernon 1 1 1 West Hartford 2Wethersfield 38 33 28 33 5 4 6 6 6 6Windsor 4 4 3 3 1 Windsor Locks 1 1 1 1 1 1 1 1 1 1Region #10 1 Non-Member LEAs 17 21 18 21 25 18 10 13 12 14
TOTAL 97 103 89 98 61 57 59 64 65 69
(Continued on following page)
120
CAPITOL REGION EDUCATION COUNCIL
SOUNDBRIDGEStudent Enrollment by LEA (Continued)
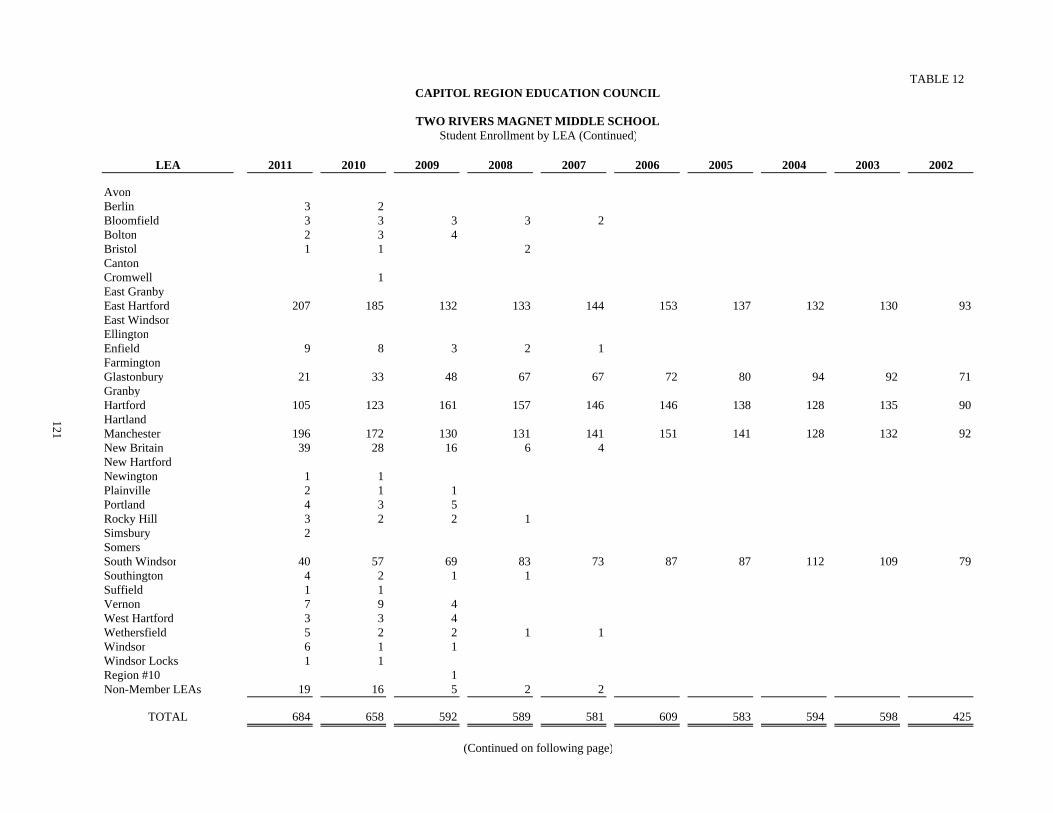
TABLE 12
LEA 2011 2010 2009 2008 2007 2006 2005 2004 2003 2002
AvonBerlin 3 2Bloomfield 3 3 3 3 2Bolton 2 3 4Bristol 1 1 2CantonCromwell 1East GranbyEast Hartford 207 185 132 133 144 153 137 132 130 93East WindsorEllingtonEnfield 9 8 3 2 1FarmingtonGlastonbury 21 33 48 67 67 72 80 94 92 71GranbyHartford 105 123 161 157 146 146 138 128 135 90HartlandManchester 196 172 130 131 141 151 141 128 132 92New Britain 39 28 16 6 4New HartfordNewington 1 1Plainville 2 1 1Portland 4 3 5Rocky Hill 3 2 2 1Simsbury 2SomersSouth Windsor 40 57 69 83 73 87 87 112 109 79Southington 4 2 1 1Suffield 1 1Vernon 7 9 4West Hartford 3 3 4Wethersfield 5 2 2 1 1Windsor 6 1 1Windsor Locks 1 1Region #10 1Non-Member LEAs 19 16 5 2 2
TOTAL 684 658 592 589 581 609 583 594 598 425
121
(Continued on following page)
CAPITOL REGION EDUCATION COUNCIL
TWO RIVERS MAGNET MIDDLE SCHOOLStudent Enrollment by LEA (Continued)
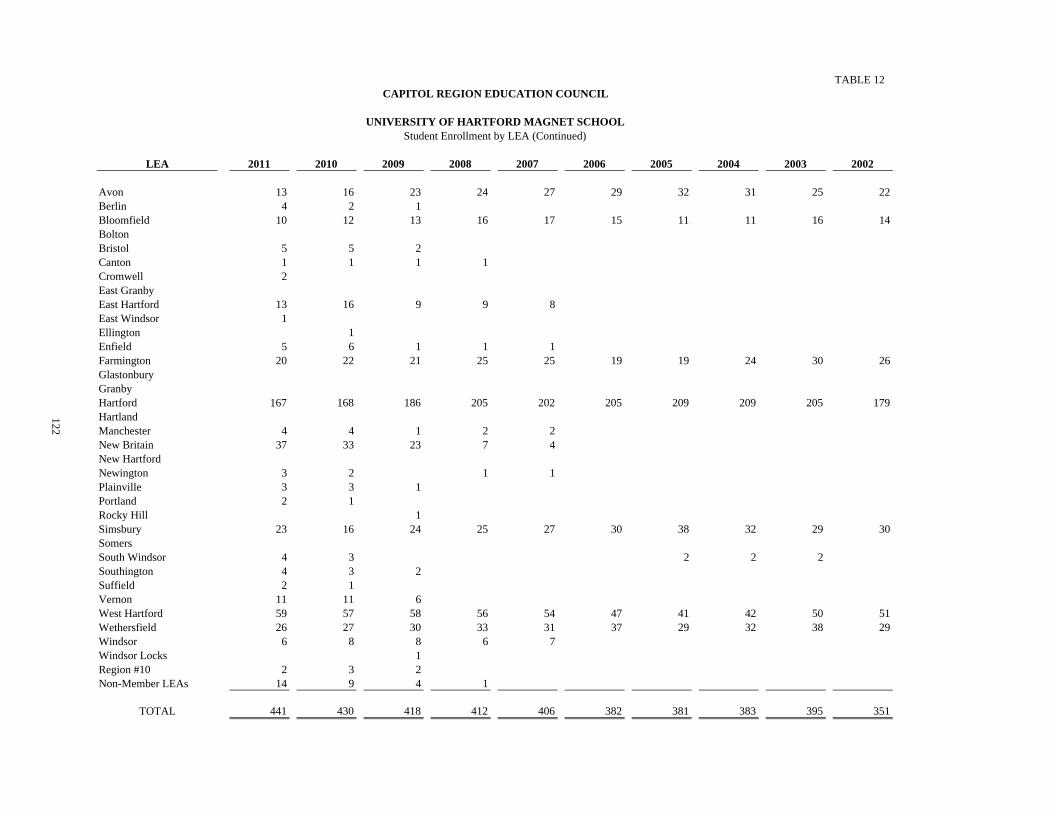
TABLE 12
LEA 2011 2010 2009 2008 2007 2006 2005 2004 2003 2002
Avon 13 16 23 24 27 29 32 31 25 22Berlin 4 2 1Bloomfield 10 12 13 16 17 15 11 11 16 14BoltonBristol 5 5 2 Canton 1 1 1 1Cromwell 2East GranbyEast Hartford 13 16 9 9 8East Windsor 1Ellington 1Enfield 5 6 1 1 1Farmington 20 22 21 25 25 19 19 24 30 26GlastonburyGranbyHartford 167 168 186 205 202 205 209 209 205 179HartlandManchester 4 4 1 2 2New Britain 37 33 23 7 4 New HartfordNewington 3 2 1 1Plainville 3 3 1 Portland 2 1Rocky Hill 1Simsbury 23 16 24 25 27 30 38 32 29 30Somers South Windsor 4 3 2 2 2Southington 4 3 2 Suffield 2 1 Vernon 11 11 6West Hartford 59 57 58 56 54 47 41 42 50 51Wethersfield 26 27 30 33 31 37 29 32 38 29Windsor 6 8 8 6 7 Windsor Locks 1Region #10 2 3 2 Non-Member LEAs 14 9 4 1
TOTAL 441 430 418 412 406 382 381 383 395 351
122
CAPITOL REGION EDUCATION COUNCIL
UNIVERSITY OF HARTFORD MAGNET SCHOOLStudent Enrollment by LEA (Continued)

TABLE 13
Program Name 2012 2011 2010 2009 2008 2007 2006 2005 2004 2003
River Street Day Program $ 58,212 $ 58,212 $ 56,516 $ 54,341 $ 51,754 $ 49,289 $ 46,942 $ 44,708 $ 42,578 $ 40,550
River Street Extended Day Program Summer 4,339 4,256 4,132 3,973 3,784 3,604 3,432 3,269 3,113 2,965
Group Home Regular 15,713 15,403 14,944 14,368 13,684 13,033 12,412 11,821 11,258 10,722
Academic Regular 19,343 18,963 18,412 17,704 16,861 16,058 15,293 14,565 13,872 13,211
River Street Summer Program 5,620 5,510 5,352 5,147 4,902 4,668 4,446 4,235 4,034 3,841
Soundbridge Program Full Day 43,782 42,594 41,744 39,756 38,044 36,669 33,953 31,732 29,732 27,658
Half Day 23,638 22,950 22,500 21,531 20,703 19,955 18,477 17,268 15,268 14,203
Integrated Program Model 109,543 109,543 91,285 76,070 69,155 62,868 57,153 51,957 47,234 44,144
Integrated Program Model Summer Program 22,307 22,307 18,589 14,299 12,434 10,812 9,402 8,395 7,495 6,692
Polaris Center 58,113 56,417 54,247 52,161 49,677 47,311 45,058 42,912 40,869 38,923
Source: Capitol Region Education Council Business Services Department
123
CAPITOL REGION EDUCATION COUNCIL
TUITION RATES PER STUDENT

TABLE 14
2012 2011 2010 2009 2008 2007 2006 2005 2004 2003
Job Categories: Officials and managers 129 119 99 107 105 100 84 82 76 77
Professionals 764 659 614 639 603 511 504 487 497 448 Technicians 118 110 78 77 80 76 74 72 76 75 Office and clerical 100 98 88 87 88 86 82 81 79 80 Operatives (semi-skilled) 8 8 8 7 7 9 9 9 8 8 Service workers 435 380 353 389 345 325 315 276 282 274
Total Workforce Analysis 1,554 1,374 1,240 1,306 1,228 1,107 1,068 1,007 1,018 962
Source: CREC’s Human Resource Department
124
CAPITOL REGION EDUCATION COUNCIL
WORKFORCE ANALYSIS
NUMBER OF EMPLOYEES LAST TEN YEARS

TABLE 15
2012 2011 2010 2009 2008 2007 2006 2005 2004 2003 2002
Education:Land $ 9,676,175 $ 1,892,925 $ 1,892,925 $ 1,892,925 $ 1,892,925 $ 1,892,925 $ 1,892,925 $ 1,892,925 $ 2,171,178 $ 2,171,178 $ 2,171,178 Buildings and improvements 78,173,076 76,359,973 67,113,954 66,059,698 64,044,935 63,985,134 60,529,341 51,681,596 52,418,497 52,282,372 51,689,327 Vehicles 1,930,665 1,630,345 1,464,195 1,241,764 1,045,797 1,061,739 909,719 747,816 864,380 769,287 769,287 Furniture, fixtures and equipment 6,888,991 6,931,029 5,226,655 5,389,902 5,024,525 4,841,774 5,380,876 4,818,264 4,073,652 2,872,151 3,589,895 Construction in progress 10,683,475 1,760,797 6,842,058 5,292,089 489,523 62,657 3,336,379 12,097,958 10,640,432 5,623,531 2,981,072
Facilities:Land 332,000 332,000 332,000 332,000 332,000 332,000 332,000 332,000 332,000 332,000 332,000 Buildings and improvements 3,704,616 3,680,055 3,669,966 3,669,966 3,660,566 3,367,706 3,276,720 3,123,235 3,123,235 3,123,235 3,124,220 Vehicles 33,240 49,640 33,240 14,435 14,435 14,435 14,435 14,435 3,085 3,085 3,085 Furniture, fixtures and equipment 298,654 294,756 294,756 298,841 288,464 279,107 278,143 273,421 249,248 215,660 1,246,047
Administration:Buildings and improvements 4,089 2,961 VehiclesFurniture, fixtures and equipment 423,794 473,332 463,663 579,360 606,219 590,207 784,661 773,350 686,648 627,627 585,578 Construction in progress 4,700 4,700
Total $ 112,148,775 $ 93,404,852 87,333,412 $ 84,770,980 $ 77,399,389 $ 76,427,684 $ 76,739,899 $ 75,759,700 $ 74,562,355 $ 68,020,126 $ 66,494,650
125
CAPITOL REGION EDUCATION COUNCIL
CAPITAL ASSETS USED IN THE OPERATION OF GOVERNMENTAL FUNDS