Embed Size (px)
Citation preview

.FILE COpyDO NOT REMOVE
249-75
NSTTUTE FORRESEARCH· ON·PO~ IERiT\/DISCUSSION. IV ,I l PAPERS
RELATIVE TEST PERFORMANCES OVER TIME OF BLACK, SPANISH,
AND ANGLO STUDENTS: A CASE STUDY
Barbara S. Zoloth
- --- ---- --- ----- --------- ~ - - -- --------_._----------------_._---
. ;'''..(..
"..
. ;1." '';J... . r~·)\..\
.,. j \r, : .,I' • ~ ~i:
. .
~. <~"'J';1'
UNIVERSITY OF WISCONSIN -MADiSON j

_._-'-' --- - - -_ ..~._'.-,..... .. "_._ .._- -_._-_.~.__ . _.__._-_._-------_. --- -_.- -- ----- --_.. __ .__.. ~._--~---_. __ .._---_._-_._---_. -_. -- -_ .. -------_ .. __._-_....__._----- --_. _._. _._------ _._-,
RELATIVE TEST PERFORMANCES OVER TIME OF BLACK, SPANISH,
AND ANGLO STUDENTS: A CASE STUDY
Barbara S. Zoloth
January 1975
The research reported here was supported in part by funds granted to theInstitute for Research on Poverty at the University of Wisconsin-Madison bythe office of Economic Opportunity pursuant to the Economic Opportunity Actof 1964. The vi'ews expressed here are solely those of the author ..

_. - --- _. --- ---_.,- .._-,._--_._----~---------_._---------_.__ .•. _"._--_....:....-.--- -,--_._- - ---
ABSTRACT
This paper examines the relative test performances over time of
Black, Spanish, .and Anglo students in a particular school dis tric t. The
major issue investigated is whether or not any change appears over a five
year period in the·differences in performance between minority and non
minority students in that district. Since the relative performance ad
vantage of non-minority students is frequently ascribed to their better
backgrounds, socioeconomic factors are held constant. The data used
consist of test scores obtained for each student in the third~ fifth,
and seventh grades, plus a measure of the socioeconomic status of that
student's family. Unfortunately, the test scores are·avai1ab1e only as
stanines, which obscures a large amount of their variation. Multiple
regression analysis is applied to these data to determine whether or not
grade level and/or socioeconomic status affect racial/ethnic differences
in test performance.
The study concludes that the test scores of minority students relative
to those of non-minority students do not appear to change much over time'.
Although Anglo students score higher than Black or Spanish students, socio
economic factors, while accounting for a significant portion of test-score
differences, do not account for all racial/ethnic differences. The persis
tence of significant test-performance differences between Anglos and minor
ities over time leads one to conclude that the school system described in
this study succeeded in maintaining the relative performance position of
the three major racial/ethnic groups but did not substantially succeed in
eliminating the performance deficiency exhibited by minority students.

INTRODUCTION
The edu~ation of children who are members of racial or ethnic
minority groups in this country. has been discussed on many different
levels during the last decade. One focus of these concerns has been
the extent to which the educational sys tem has succeeded. in elimhl' ;.1
nating the relative deficiency generally exhibited by minority students
when they first enter school. An important and.unresolved policy issue
is whether the elimination of this deficiency is, indeed, the responsi-
bility of our schools. Resolution of this question requires what is,
in part, a value judgement: the choice of an operational definition
for equal educational opportunity. Three alternatives come to mind,
listed below in increasing order of the degree of responsibility that
each imputes to the schooling process:
(1) The level of educational inputs provided must beessentially the same for students in all racial/ethnic groups.
(2) The rate at which students' performances improveover time must be essentially the same for allracial/ethnic groups.
(3) The outcomes of the educational process must be .'essentially the same for students in all racial/ethnic groups.
We will not concern ourselves here with the philosophical choice
of definitions. Clearly the choice of appropriate policy measures
depends closely on which of the three goals is accepted. Although no
clear formal statement of goals is available from the powers that be,
there is evidence that definition (1) has been given a substantial amount of
attention via educational spending programs,: while interest in (2)
and (3) has been implicitly expressed through the use of measures
of educational outcomes as indicators of programsuccess~2 Our

2
interest here is in the outcome of the educational process, which we shall
examine in a very limited sense for a particular school district. We are
primarily interested in the second and third definitions of equal educa-
tional opportunity. If data indicate that the gap between minority and
non-minority student performance increases over time, then the schools
have failed to achieve either (2) or (3). On the other hand, if the gap
remains reasonably constant over time, then one may conclude that (2) has
been achieved. Only if there is evidence that the gap is closing may one
argue that equality of educational outcomes is being approached.
This paper presents a small-scale examination of the relative perfor-
mances over time of minority students in a particular school district.
The purpose is not to determine whether or not that district has succeeded
in attempts to equalize educational opportunity,3 but rather to simply
examine and describe student performance. The major question to be ad-
dressed is whether or not any change appears over time in the differences
in performance between minority and non-minority students in that dis-
trict. Since the relative performance advantage of non-minority students
4is frequently ascribed to their better backgrounds, this question is
also examined after controlling socioeconomic factors.
I. PROBLEMS IN ANALYZING 'TEST SCORES
Despite the absence of a universally accepted measure of educational out-
come, and amidst a substantial amount of controversy, standardized achieve-
ment and ability test scores are the most frequently used indicators of the
educational effects of our schools. 5 In spite of the acknowledged (and
admitted by most test publishers) "cultural bias" inherent in most testing
instruments,6 these test scores are used in studies comparing the academic

-- -- ---- ---- -------------------------------------------- ------J--------------- ------------------------------ -------------- --
performance of minority with non-minQr~~y students. This study also
uses student test />cores as the means -of compar:j.son, _although the short~"-·
comings of this approach are recognized. Perha.ps:the _bes.t justification
for focusing on test scores is -the continued use of them by both schools
and paren~s.as measures of tlie effectiveness of education.
The test scores used in this study are scaled in the form of
stanines-. A stanine is a 9-point scale, ranging from 1 to 9, with a
mean of 5 and a standard deviation of 2. Raw scores are converted to
stanine scores by the test publisher on the basis of a national norming
sample. The major disadvantage of stanines is the resulting obfusca
tion of differential performance within anyone stanine point. In
addition, a small difference in raw scores can result in the relative
ly large difference of a full stanine point. Unfortunately, the test
scores used here are available only in this form.
An important controversy over the use of scaled scores, such as
the stanine, vs. the use of grade-equivalent types of scores has received
some attention in the literature. The consensus seems to be
- equivalent scores do not lend themselves well to statistical
_that grade
7analysis.
In particular, the computational definition of grade-equivalent scores
implies that: if a student's scaled score remains, say, one standard
deviation beiow the mean over time, then the corresponding grade
equivalent score will show that student falling farther behind the
"norm" over that same time period. 8 Thus, the use of grade-~quivalent
scores would bias the expected results of a study such as this toward
establishing the existence of an "increasing gap" between minority and
non-minority test performance.
4
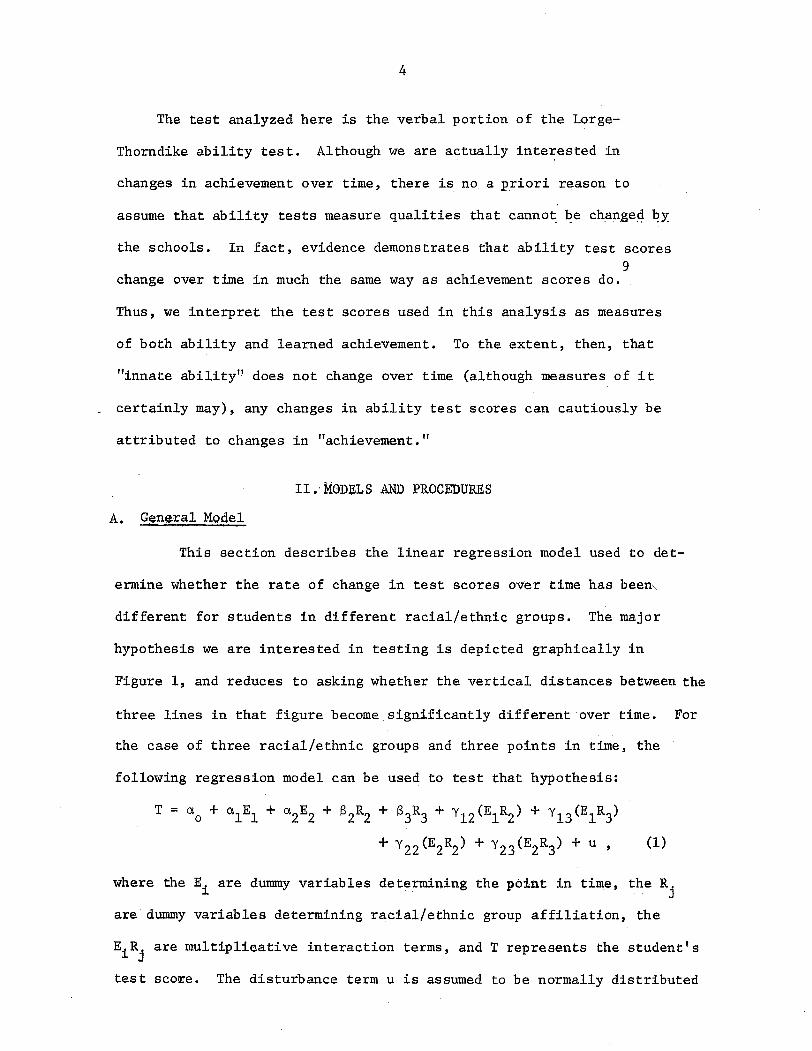
The test analyzed here is the verbal portion of the Lorge-
Thorndike ability test. Although we are actually interested in
changes in achievement over time, there is no a priori reason to
assume that ability tests measure qualities that canno~ ~e ch~nge4 ~y.
the schools. In fact, evidence demonstrates that ability test scores9
change over time in much the same way as achievement scores do.
Thus, we interpret the test scores used in this analysis as measures
of both ability and learned achievement. To the extent, then, that
"innate ability" does not change over time (although measures of it
certainly may), any changes in ability test scores can cautiously be
attributed to changes in "achievement."
II. MODELS AND PROCEDURES
A. General Model
This section describes the linear regression model used to det-
ermine whether the rate of change in test scores over time has been\
different for students in different racial/ethnic groups. The major
hypothesis we are interested in testing is depicted graphically in
Figure 1, and reduces to asking whether the vertical distances between the
three lines in that figure become significantly different over time. For
the case of three racial/ethnic groups and three points in time, the
following regression model can be used to test that hypothesis:
T = ao + aIEl + a2E2 + S2R2 + S3R3 + Y12(E1R2) + yI3 (E1R3)
+ Y22 (E2R2) + Y23 (E2R3) + u, (1)
where the Ei are dummy variables determining the point in time, the Rj
are dummy variables determining racial/ethnic group affiliation, the
EiRj are multiplicative interaction terms, and T represents the student's
test sco~e. The disturbance term u is assumed to be normally distributed

TestScore
Figure 1: Graphical Depiction of General Model(Hypothetical Data)
Racial/Ethnic Group 3
__-rl I----- I -J Racial/Ethnic Group 1
I II I1 II 1I II II I
El E2 E3 Time
I-
lJl
-:.;-.

6
with zero mean and constant variance. (The results of a test of the
homoskedasticity assumption are presented and discussed in Section IV,)
Note that each student is represented by three observations, one for
each of the three points in time.
The null hypothesis of interest, then, is that all y .. in~J
equation (1) are simultaneously equal to zero. If this were true, one
could conclude that the test-score differences between the various racial/
ethnic groups remain the same, on the average, over time. To clarify by
example, Y12 can be interpreted as the difference between time periods El and
E3
in the test score gap between racial/ethnic groups I and 2. Thus, if
Y12 = 0, this gap is not significantly different between these two points
in time. Note that the model does not constrain the slopes of any of the
lines drawn in Figure I to be the same between EI and E2 as between E2 and E3
Note also that ~he null hypothesis requires a two-tailed test. If it is
rejected, we. can then check the signs of the coefficients to determine
whether the gaps have been widening or narrowing.
Since each student enters the regression model as three separate
observations, we are not using the information that the test score data
are, in fact, longitudinal. Although it would certainly be both useful
and appropriate to incorporate this information, there seems to be no
method available for doing so.
B. Controlling tor. Socioeconomic Status
It has frequently been argued theoretically and demonstrated em-
pirically that a student's socioeconomic status is significantly related
to academic achievement and, in particular, to test performance.
There are th~ee different ways in which socioeconomic status
(SES) can be controlled for in the context of our current concerns:

7
(1) allowing test scores to vary between SES groups but bythe same amounts for each racial/ethnic group and foreach year;
(2) allowing differences in test scores resulting from SESto be different within each year;
(3) allowing differences in test scores resulting from SESto be different for each racial/ethnic group.
In terms of the regression model presented in equation (1) above,
these are equivalent, respectively, to:
(1) including SES additively as a separate variable;
(2) including multiplicative interaction terms between SESand the E. ;
l.
(3) including multiplicative interaction te~s between SESand the R.•
J
All three effects could be simultaneously allowed by stratifying the
sample on SES and running separate regressions. However, since the
nature of· the effect of SES is of interest and since there is no
a priori reason for choosing any of the·above possibilities over the
others, it was decided to include the additive and multiplicative
terms in the model using the entire sample. Since the SES variable
in the data used here is a discrete ordinal variable with a finite
number of categories, the regression model becomes:
T = a +o
(2)
wherek equals the number of SES categories.

8
III. DATA
The school district for which data are analyzed in this study
includes all public elementary schools in a middle-sized southwestern city.
The city had a 1970 population of about 300,000, of whom slightly more than
20 percent were identified by the 1970 Census as persons of Spanish origin,
while 3 percent were identified as Blacks. Median family income of the city
was about $8,800 in 1970, and slightly more than 10 percent of all families
were below the poverty line at that time (including 25 percent of Black
families and 17 percent of Spanish families).
Ninety-three percent of all students enrolled in elementary schools
(grades 1-8) in this district were in public schools in -1970. Total enroll
ment in the district's public elementary schools increased between 1968 and
1972 by about 17 percent, to more than 43,000. While minority students lO
represented a fairly constant one-third of the public elementary school
enrollment over those years, they accounted for over 40 percent of the in-
creased enrollment. By far the predominant minority group in the district
schools is composed of children of Spanish origin (about 27 percent), with
Black students representing less than 6 percent of the total and American
Indians and Orientals each less than 2 percent.
From 1968 to 1972, the elementary schools remained substantially
segregated. By 1972, about 62 percent of the minority students would have
needed to be transferred between schools in order to equalize the minority
percentage across all schools. This figure in 1968 was about 70 percent.
The data analyzed in this study were provided to the Office for
Civil Rights in HEW by the district during the course of a civil rights
compliance review. The school district provided historical test records
for all current (as of spring, 1973) eighth-grade students for whom the
following information was available:

9
(1) Lorge-Thorndike verbal-ability test scores for grades 3, 5, .and 7;
(2) reading test scores for grades 3 and 4.
In addition, a survey of these students was conducted, from which the dis-
trict calculated an index of socioeconomic status (SES) for each student.
The survey included information on the sex, occapatiQn, education level,
and source of income (full~time work, part-time work, or other compensa-
tion) as reported by each student for the adult.head of his or her house-
hold. A ranking was constructed based on statewide Census data relating
these characteristics to income levels. The resulting index was a ten-
point scale with the value I representing the lowest SES category..' In
order to avoid imposing a cardinal interpretation on this index, SES
is represented mn all regression analyses as a set of dummy variables.
Only data for Black, Spanish-surnamed, and Angloll students are
included in the following analyses, since the other two racial/ethnic
categories (American Indians and Orientals) were represented by very
few students. Although data were provided for five separate test scores;
only three are analyzed here: third-, fifth-, and seventh-grade Lorge-
Thorndike scores. The third- .and fourth-grade reading scores are not
analyzed for two reasons: first, the span of time covered by the scores,
(third to fourth grade) is felt to be too small to reveal reliable patterns
of change; second, and more important, the scores are from two different
reading tests and. therefore are not strictly compar~bledespite the stand-
ardized form of the scores.
Of almost 5,400 students enrolled in e~ghth grade in -the school year
1972-73, 2,397 (45 percent) were found to have a complete set of the three
Lorge-Thorndike test scores available. Thus a total of 7,191 observations
was used in the regression analyses, since the' specification requires that

10
each student be represented by three observations.
Table 1 presents the means and standard deviations of Lorge-Thorndike
scores for each racia1/ethmic group broken down by SES category. Two
interesting and predictable patterns emerge from this table. First,
mean test score increases as SES'rises within each racia1/ethmic group.
Second, within SES categories, mean test scores for Anglos are higher
than those for Spanish students, which are, in turn, higher than those
for Blacks. Those patterns are consistent with other empirical in
vestigations of test scores. Another point of interest is the apparent
relationship between SES level and racial/ethnic affiliation. Figure 2
indicates that the SES levels of minority students tend to be lower
than those of the Anglo students.
At the same time that this analysis was being conducted for the
Office for Civil Rights, the school district's research department was
performing a similar analysis of the same data. Their results were
basically the same, but they had the benefit of an additional set of
test scores: eighth-grade reading-achievement scores. Table 2 pre
sents the simple correlation coefficients as reported by the district
between all six test scores and SES level based on the 2,066 students
for whom all of these scores were avai1ab&e. Note that the SES index
was collapsed from ten to ~our categories in their analysis.
It appears from Table 2 that 58 to 70 percent of the variance in
reading~achi~ve~ent scores can be accounted for by the variance in ver
bal-ability scores from previous years when no other factor is held
constant. On the other hand, past reading scores explain only slightly
less of the variance in later reading scores than do past verbal-ability
scores. Furthermore, the intercorre1ations between verbal scores in

11
TABLE 1.
Sample Means and Standard Deviations of Test Scores
a. Black students
Number ofSES Level Students Grade 3 Grade 5 Grade 7
2 .s 2.200 2.600 2.400
0.748 0.490 ,1. 020
3 14 2.429 3.286 2.714
1.348 0.958 1.160
4 19 2.421 3.526 3.105
1.091 1. 094 1.334
5 32 3.281 3.625 3.344
1. 807 1. 596 1.651
6 20 3.600 3.850 ,3.700
1.530 1.492 1.616
7 26 3.500 3.885 3.769
1.715 1.450 1.280
8 5 3.400 3.200 2.800
1.625 0.748 1.166
9 13 3.385 3.538 3.769
1.546 1.447 1.120
10 9 4.444 5.000 4.333
2.061 1.886 1.633
All 143 3.217 3.685 3.427
1. 686 1.465 1.489
Note: ,For each subgroup of the sam~le, the first number presented is thatsubgroup's mean score (T') and the second is the standard deviation forthat subgroup(s).

12
TABLE 1. (continued)
b. Spanish-surnamed students
N1iJmber ofSES Level Students Grade 3 Grade 5 Grade 7
2 9 4.333 4.111 3.778
1. 054 0.994 1.133
3 151 3.404 3.570 3.338
1. 708 1.498 1. 366
4 131 3.282 3.580 3.443
1.668 1.493 1.415
5 112 3.875 4.098 3.732
1.8S7 1.506 1.336
6 113 4.133 4.416 3.965
1. 907 1.533 1.463
7 75 4.413 4.360 3.960
1.826 1. 614 1.492
8 39 4.513 4.974 4.590
1.838 1. 747 1.822
9 25 4.720 4.840 4.440
1.755 1.869 1. 722
10 24 4.458 4.500 4.333
2.020 2.062 1.908
All 679 3.,.853 4.054 3.750
1.849 1.630 1.511

13
TABLE 1. (continued)
c. Anglo students
Number ofSES Level Students Grade 3 Grade 5 Grade 7
2 1 2.000 3.000 1.000
0.000 0.000 0.000
3 31 4.677 4.742 4.581
2.161 1.917 1. 774
4 59 4.593 4.814 4.525
1. 708 1. 790 1.500
5 151 4.934 5.033 4.748
1.918 1.839 1.645
6 167 5.317 5.485 5.138
1. 880 1.520 1.492
7 311 5.633 5.614 5.203
1.848 1. 703 1.618
8 230 5.796 5.752 5.391
1. 812 1;548 1.484
9 196 6.240 6.153 5.776
1. 761 1.521 1.623
10 429 6.455 6.431 6.098
1. 769 1.621 1. 54'9
All 1575 5.796 5.806 5.455
1.911 1. 717 1.649

.30
Proportion of Students
in Each SES Group
.35
Figure 2
Distribution of Racial/Ethnic Grouns Across SES Categories
.20
•15
.10
.05
.00 . 2*3 4 5 6 7 8 9 SES Group
I-'~
~ Blacks and Spanish Combined
~ Anglos
Note: Includes only students for whom all threeLorge-Thornrlike scores were available.
*The proportion of Anglos in SES groun 2 was less than ·01,

TABLE 2 ,.
Simple Correlations Between SES Index and Various Test Scores(Sample Includes All Eighth-Grade Students for Whom
All Information was Available)N = 2066
Verbal Ability Readin£ Achievement
SES 3rd Grade 5th Grade 7th Grade 3rd Grade 4th Grade3rd Grade .43
Verbal 5th Grade .42 .84Ability
7th Grade .43 .81 .86
......\JI
3rd Grade .36 .77 .74 .72
Reading 4th Grade .• 41 .78 .78 .77 .83Achievement
8th Grade .44 .76 .80 .84 .72 .77
Note: The SES index was collapsedby the school district's researchers into four discrete categories
corresponding to SES levels 1-3, 4-5, 6-7, and 8-10.

16
different years are only slightly higher than those for reading-achieve-
ment scores. Although one would like to interpret verbal-ability scores
as measurements of reading-achievement potential, it is not clear that
this assumption is warranted. No assumptions are made in any of the fol-
lowing analyses concerning the reliability of the Lorge-Thorndike test
as a measure of innate "ability." As discussed in Section I, we interpret
the test scores as measures of current ability to perform on tests, which
we assert to be some combination of inherent and learned "ability." Thus,
we accept the Lorge-Thorndike results as a reasonably reliable measure of
the gross effects of both the students' backgrounds and the "value added"
by their schools.
IV. REGRESSION RESULTS
The following variable notation is used throughout this section:
Notation
T
SESii=2, ..• ,10
Description
Stanine value of student's Lorge-Thorndikeverbal test score
A dummy variable defined on third grade(= 1 for a third-grade score, = 0 otherwise)
A dummy variable defined on fifth grade(= 1 for a fifth-grade score, = 0 otherwise)
A dummy variable defined on Spanish-surname(= 1 if student identified as Spanishsurnamed, = 0 otherwise)
A dummy variable defined on Anglo (= 1 ifstudent identified as Anglo, = 0 otherwise)
Nine dummy variables defined on socioeconomiclevel (= 1 if student's SES value equals i,= 0 othen1ise)
All of the regression models are normalized on racial/ethnic group
1 (Blacks), grade 7, and socioeconomic group 6. Variables for these
categories are therefore omitted from the estimated equations, and the

17
when SES is controlled for, for seventh-grade Black students in SES
group 6.
One of the assumptions required for the regression analysis per-
formed here is t~at the variance of the test scores be the same within
each subgroup. A test for heteroskedasticity was performed and resulted
in rejecting ,the null hypothesis of equal variances at the .05 level of
i 'f' 12S gn1 1cance. Although the coefficient estimates are unbiased and
consistent under heteroskedasticity, the standard errors will be both
biased and inconsistent. Characteristics of the data imply that this
bias is negative and, therefore, that the probability of rejecting any null
hypothesis based on the standard errors of the estimates will be higher
h h h 1 1 f . , f" . d' 13t an t e c osen eve 0 s1gn1 1cance 1n 1cates. Rather than adjusting'
for the heteroskedasticity, therefore, 'it was decided to use extra caution
in hypothesis testing. Thus, null hypotheses tested from the regression
results are rejected only when the appropriate test statistic exceeds the
.005 critical value.
A; , General Model
Table 3a presents the regression results from equation (1) above.
The results of the two F-tests presented at the bottom of the table
imply that the test-score gap between racial/ethnic groups changed
significantly between third and fifth grades but not between fifth and
seventh grades. Furthermore, the positive signs on the estimates of 112
Md YI3 indicate that the gap actually narrowed between the two lower
grades. Thus, there is certainly no indication that the relative test
performance of minority students declined over time. The top half of
Figure 3 shows this conclusion clearly. The significance and relative

18
TABLE 3 •
, Results of Regression AnalysisWithout Controlling for Socioeconomic Status
a. No restrictions
Model 1a: T = a 0 + al E1 + a2E2 + S2R2 + S3R3 + Y12(EI R2) + Y13(E1R3)
+ y22
(E2R
2) + y
23(E
2R
3) + u
Estimated ' Standall'dVariable Coefficient Error t-Ratio
Constant 3.4266 .1443 23.747
E1
-.2098 .2041 -1.028
E2 .2587 .2041 1.268
R2 .3231 .1588 2.035
R3
2.0280 .1507 13.457
E1R
2.3129 .2245 1.394
EIR
3.5507 .2131 2.584
E2R2
.0461 .2245 .205
E2R3
.0924 .2131 .433
R2 = .2177 F(9, 7182) = 249.826
Adjusted R2 = .2168
Hypothesis Tests:
Mar ina1 R2
.0001
.0026
.0025
.2088
.0002
.0034
.0000*
.0000*
*Less than .0001.
= 0
F(2, 7182) = 0.1547 ~cannot reject HOat .005 level
F(4, 7182) = 2.7585 =9reject H at .05level but cannot reject HOqt .005level

19
TABLE 3. (continued)
b. Score changes from grade 5 to grade 7 restricted tobe the same for all three racial/ethnic groups
Model 1b:
R2
= .2177
Adjusted R2 = .2170
Variable
Constant
E1E
2R
2R3E
1R
2E
1R
3
EstimatedCoefficient
3.3897
-.1729
.3325
.3461
2.0742
~2898
.5046
Standard 2Error t-Ratio Mar ina1 R
.1050 32.278
.1784 -.969 .0001
.0498 6.672 .0026
.1122 3.084 .0025
.1066 19.467 .2088
.1944 1.491 .0002
.1846 2.734 .0034
F(7, 7184) = 333.1283
"
Hypothesis Tests:
F(2, 7184) = 5.3635 ~reject HO at.005 level

Figure 3: Test Scores Predicted from Re9ressions WithNo Control for SES
TestScore 6.0
Grade
5.0
4.0
3,0
2.0
\ Anglo
/
spanish
____________ / Black
3 S 75.800 5.806 5.4553.853 4.054 3.7503.217 3.685 3.427
3 5 7 Grnrle
With No Restrictions (model la)
Grade
3 5 75.796 5.796 5.4643.853 4.068 3.7363.217 3.722 3.390
TestScore
2.0
3 5 7 Grade
Restricting Score Changes from Grade 5 to Grade 7 to bethe Same for all Three Racial/Ethnic Groups U10del lb)

21
sizes of the coefficients on both race dummies indicate simply that
Anglo mean scores are higher than Spanish mean scores, which are
higher than Black mean scores.
Part b of Table 3 presents results for the same model but with Y22
and Y23 constrained to be zero. Inspection of the coefficient estimates
reveals· little change from Part a, as the lower part Glf Figure 3 empha~izes.
~~ C~ntrolling for SES
Table 4 presents the regression results for equatmon (2). There
is no dummy variable for SES group 1 since there are no observations
in that group. Note that the basic model corresponds ·to that in Table
3b, that is, that Y22 and Y23 are again constrained to be zero. The results·
of hypothesis tests indicate that there is no significant interaction
between grade level and SES category, that is, that test-score differences
resulting from SES are not significantly different within each year. On the
other hand, the coefficients on the SES and race interaction terms were
jointly different from zero, indicating that socioeconomic factors (to
the extent that they are accurately measured by our SES index) alone do
not fully account for racial/ethnic performance differences. This last
point is further substantiated by the significance of the coefficients
on R2 and R3
in Table 4.
Model 2b, presented in Table 5, constrains those coefficients to
be zero that were found to be not significantly otherwise, namely the
coefficients on the SES and grade level interaction variables. The
hypothesis test results presented at the bottom of this table again sub
stantiate the claim that, while SES does indeed significantly affect test
scores within grade and racial/ethnic groups, differences in test scores
between those racial/ethnic groups persist even when this interaction is
accounted for.

Model 2a:
22
TABLE 4.
Results of Regression Analysis
Controlling for Socioeconomic Status
With No Restrictions
+ 03SES3 + 04SES4 + 05SES5 + 07SES7 + 08SES8 + 09SES 9 + °10SES10
+ R2( ~2SES2 + ~3SES3 + ~4SES4 + ~5SES5 + ~7SES7 + ~8SES8 + ~9SES9 + ~10SES10).
+ R3 ( ~2SES2 + ~3SES3 + ~4SES4 + ~5SES5 + ~7SES7 + ~8SES8 + ~9SES9 + ~10SES10)
+ E1 ( £2SES2 + £3SES3 + £4SES4 + £5SES5 + £7 SES7 + £8SES8 + £9 SES 9 + £10SES10)
+ E2( ~2SES2 + ~3SES3 + ~4SES4 + ~5SES5 + ~7SES7 + ~8SES8 + ~9SES9 + ~10SESIO)
+u
Estimated Standard 2Variable Coefficient Error t-Ratio Marginal R
Constant 3.6649 .2341 15.658
E1
-.2179 .2134 -1.021 .0001
E2 .3733 .1352 2.762 .0026
R2
.3422 .2402 1.425 .0039
R3
1.4483 .2342 6.158 .2088
E1R
2.3367 .1886 1. 785 .0002
E1R
3 .4451 .1823 2.441 .0034
SES2 -1. 4321 .5971 -2.398 .0003
SES3
-.8424 .3557 -2.368 .0043
SES4
-.5558 .3296 -1.686 .0025
SES5
-.2822 .2941 -.960 .0001
SES7 -.0750 .3023 -.248 .0062
SES8
-.6580 .4911 -1.274 .0057
SES9
-.2124 .3604 -.589 .0106
SES10
.8477 .3967 2.137 .OZ83
RZSES Z1. 2196 .5813 2.098 .0004
R2SES3
.1731 .3536 .490 .0000*
.0000* "R2SES4
-.0368 .3298 -.112
R2
SES5
.0307 .3007 .102 .0005

23
TABLE 4. (continued)
Variable
R2
SES7
R2
SES8
R2
SES9
R2SES10
R3
SES2
R3
SES3
R3
SES4
R3
SES5
R3SES7R
3SES
8R
3SES
9R
3SES
10E
1SES
2E
1SES
3E1
SES4
E1
SES5
E1
SES7
E1
SES8
E1
SES9
E1
SES10
E2SES2E2SES
3E2SES
4E2SES5EZSES7E2SESSE2SES
9E2SES10
EstimatedCoefficient
.0721
1.1045
.6481
-.6165
-1. 9967
.2604
.0298
-.1083
.1687
.9163
.8953
.1386
.3196
-.0659
-.2623
.0046
.2114
.1358
.2066
.1270
.0267
-.1284
-.1676
-.0581
. 0174
-.0084
-.0272
-.0422
StandardError
.3179
.5097
.4007
.4396
1.0710
.3819
.3386
.2928
.2987
.4876
.3550
.3934
.6222
.2193
.2128
.1921
.1790
.1978
.2064
.1778
.6193
.2150
.2109
.1919.
.1777
.1956
.2042
.1736
t-Ratio
.227
2.167
1.618
-1.402
-1.864
.682
.088
-.370
.565
1.879
2.522
.352
.514
-.301 .
-1.232
.024
1.181
.687
1.001
.714
, .043
-.597
-.795
-.393
.098' .
-.043
-.133
-.243
2Marginal R
.0000*
.0002
.0003
.0010
.0012
.• 0000*
.0000*
.0018
.0000*
.0003
.0004
.0000*
.0000*
.0000*
.0004
.0000*
.0001
.0001
.0001
.0001
.0000*
.0000*
.0001
.OOOO)~
.0000*
.0000*
.0000*
.0000*
i
I
F(47, 7144) = 61.5716:RZ = .2839
R2 = .2793Adjusted
Hypothesis Tests:
HO: Ei = ~r = 0 for all i
*Less than .0001
F(16, 7144) = .6843 ~cannot reject HOat .005 level
.._---_.----~-----

24
TABLE 5.
Controlling for Socioeconomic Status and
.Restricting I.nteraction between SES and Grade to Be Zero
Model 2b:
T = aO + aIEl + a2E2 + S2R2 + S3R3 + Y12(E1R2) + y13 (E1R3)
+ 02SES2 + 03SES3 + 04SES4 + 05 SES5 + 07 SES 7 + 08 SES8 + 09 SES9'+ °10SES10
+ R.2( ~2SES2 + ~3SES3 + ~4SES4 + ~5SES5 + ~7SES7 + W8SES8 + W9SES9 + W10SES10)
+ R3 ( .2SES2 + .3SES3 + .4SES4 + .5~ES5 + .7SES7 + .8SES8 + .9SES9 + .10SES10)
+. u
Estimated Standard1,
Variable Coefficient Error t-Ratio
Constant 3.6635 .2222 16.487
E1 -.1729 .1711 -1.011
E2 .3325 .0478 6.958
R2 .3578 .2399 1.492
R3 1.4285 .2336 6.116
E1R2 .2898 .1864 1.555
E1R3 .5046 .1770 2.851
SES 2 -1. 3167 .4776 -2.757
SES 3 -.9071 .3328 -2.726
SES 4 -.6991 .3060 -2.285
SES5 -.3000 .2722 -1.102
SES7 .0013 .2841 .005
SES8 -.5833 .4776 -1.221
SES9 -.1526 .3403 -.448
SES10 .8759 .3834 2.285
R2SES2 1.2196 .5809 2.099
R2SES3 .1731 .3534 .490
R2SES4 -.0368 .3296 -.112
R2SES5 .0307 .3006 .102
R2SES 7 .0721 ,.3177 .227
R2SES8 1.1045 .5094 :·:2.168
R2SES 9 .6481 .4004 1.619
R2SES10 -.6165 .4394 -1.403
Marginal R2
.0001
.0026
.00:39
.2088
.0002
.0034
.0003
.0043
.0025
.0001
.0062
.0057
.0106
.0283
.0004
.0000*
.0000*
•0005'~
.0000*
.0002
.0003
.0010

25
TABLE 5. (continued)
R2= .2831
Adjusted R2= .2801
'variable
R3SES2R
3SES 3
R3
SES4R
3SES
5R3SES 7R
3SES8
R3
SES9
R3SES10
EstimatedCoefficient
-1. 9967
,n604
.0298
-.1083
.1687
.9163
.8953
.1386
StandardMargina1l'R2Error t-Ratio
1.0704 -1. 865] .0012
.3817 .682 .0000*
.3384 .088 .0000*
.2926 -.370 .0018
.2985 .565 .0000*
.4873 1.880 .0003
.'3548 2.523 .0004
.3931 ".353 .0000*
F(31, 7160) = 94.2562
Hypothesis Tests:
HO: tjJi = ~i = 0 for all i
HO: °i = tjJi = ~. = 0 for all i~ ,
F(16, 7160) = 2.7402 ==>reject HO:at.005 level
Ji:(24, 7160) = 26.9551 =lr.treject HO at.005 level
*Less than .0001.

26Figure 4
Grade
Grade7
15
5
SES 4
-----.....---. Anglo (59)
e-----=--=-.... Spani sh (131).----- ---. 131 ack (9)
SES 6
---------. Anglo (167)
~ Snanish (113)Black (20)
3
3
6.0 SES 3 6.0
5.0-----.....---. Ang 10
5.0(31)
4.0 4.0
3.0 :----:.----:: Spanish (151) 3.0131 ack (14)
2.0 2.0
3 5 7 Grade
6.0 SES 5 6.0
---------. Anglo (151)5,0
4.0 • :. :----. Spanish (112) 4,0
~ "'Black (32)3.0 3.0
2.0 2.0
3 5 7 Grade
..--------.. Black (5)
6.0
5.0
4.0
3.0
2.0
SES 7
• •
~~ ::Snanish (75)Black (26)
6.0
5.0
4.0
3.0
2.0
••
SES 8
•----'Sni'lnish (39)
3 5 7 Grade 3
Grade7
... I\nello (429)•
5
SES 10
3
•
.~ Black (9)
Soanish (24)
3.0
2,0
Grade7
•
5
SES 9
3
• ~ Anqlo (196)
---------------Snanish (25)
~Black (13)
7.0
6.0
5.0
4.0
3.0
2.0

27.·
Figure 4 graphically presents the results of estimating Model 2b,
from ~hich we can see the differences between racial/ethnic groups within
the various SES categories. Again it is readily apparent that the test
score gap narrows somewhat from third to fifth grades and remains about
the same from fifth to seventh grades across all SES groups.
An equation similar to Model 2b but combining Spanish and Black
students into one group was also estimated. The results were quali
tatively the same as those reported above with the resulting "minority"
group behaving essentially the same as the Spanish group. This is not
surprising, because of the relative sizes of the two groups and because.
within SES groups, there is not always a significant difference between
Black and Spanish scores.
V. CONCLUSIONS
A. Change in Racial/Ethnic Test-Score Differences Over Time
(i) Anglo-Black and Anglo-Spanish test~score differences tend to
decrease somewhat between third and fifth grades. This time
period is characterized by rising scores for Black and Spanish
students and by unchanging Anglo scores •. The gap between. . . ... . .."
. Anglo and Black scores closes by more (about 1/2 of a stanine
point) than does the gap between Anglo and Spanish scores
(about 1/5 of a stanine point) over this period of time.
(ii) Anglo-Black and Anglo-Spanish test-score differences do not
a-hange s!gnif~.can_~y in either direction between fifth and
seventh grades. This time period is characterized by falling
test scores for all three racial/ethnic groups.
(iii) S~anish scores are consistently higher than Black scores on
average, but this difference (approximately 1/3 of a stanine
point) is not statistically significant.

28
(iv) Anglo test scores are always significantly higher than both
Spanish and Black scores on the average (by about 2 and 2 1/3
stanine points respectively).
B. Effects of Controlling For Socioeconomic Status
All of conclusions (i) through (iv) remain qualitatively
identical after the socioeconomic status of the students is controlled
for. Furthermore, the only change in the numbers mentioned above is
that the average diffe~ence between Anglo and Spanish scores drops to
about 1i4 stanines (in conclusion (iv» when interaction between
SES and racial/ethnic group is allowed. This difference, however,
remains statistically significant in all specifications of the model.
C. General Commentsi
The results of this study are consistent with others on the same
topic in finding that the scaled scores of minority students relative
to these of non-minority students do not appear to change much over time.
The interesting additional finding is that socioeconomic factors, while
accounting for a significant portion of test-score differences, do not
account for all racial/ethnic differences. Finally, the persistence
of significant test-performance differences between Anglos and minor-
ities over time leads one to conclude that the school system described
in this study succeeded in maintaining the relative performance posi-
tion of the three major racial/ethnic groups but did not substantially
succeed in eliminating the performance deficiency exhibited by minor-
ity students.

29
FOOTNOTES
lThese primarily include compensatory education prqgrams, such as Title Iof the Elementary and Secondary Education Act, as well as judicial resolution of educational finance issues.
2This results from the commonly accepted presumption of a positive relation-ship between educational inputs and outcomes. Appendix A in Averch et al.contains sunimaries of nineteen separate studies of variations on this hypothesis.
3Indeed, it is not clear whether the district involved had made anysignificant commitment to this goal during the relevant time period.
4Again see the Appendix in Averch et al.
50ther indicators used by researchers include student attitudes, laterearnings, the level of schooling eventually obtained, and assorted attemptsto measure non-cognitive outcomes.
6 Averch, et aI., . 22-23.See pp.
7 Coleman and Karweit, 7-16; and Cronbach, 98.See pp. p.
8 Coleman et al,., . 21; and Averch. al:. , 20-21.See p. et pp.
9See Coleman and Karweit, pp. 23-25.
10M, . . d f' d1nor1ty 1S e 1neCivil Rights surveyNegro, Oriental, or
here as all students identified in the Office forof public schools as either American Indian,Spanish-surnamed.
11The term "Anglo" is used to identify all students who were neither Biack,Spanish-surnamed, Oriental, nor American Indian.
l2For a description of the test used, see Kmenta, pp. 267-269.
l3The bias will be negative when the squared means and the variances of thesubgroups are positively related. See Kmenta, p. 256.

31
BIBLIOGRAPHY
Averch, Harvey A., et al. How Effective is Schooling? Publication no.R-956-PCSFjRC. Santa Monica, Calif.: Rand Corporation, 1972.
Coleman, James S., and Nancy L. Karweit. Measures of School Performance.Publication no. R-488-RC. Santa Monica, Calif.: Rand Corporation,1970.
Coleman, James S., et al. Equality of Educational Opportunity. Publicationno. OE-3800l. Washington, D.C.: U.S. Department of Health, Education,and Welfare, Office of Education, 1966.
Cronba~, L.J. Essentials of Psychological Testing. New York: Harper andRow, 1970.
Kmenta, Jan. Elements of Econometrics. New York: MacMdll1an, 1971.