Embed Size (px)
Citation preview

www.ertrac.orgwww.ertrac.org
European Roadmap
Future Light and Heavy Duty Internal Combustion Engine Technologiesfor CO2 reduction and near zero
pollutant emissions
Zissis Samaras, Professor
on behalf of theERTRAC Working Group on
Energy & Environment
1 09/03/2017

www.ertrac.org
System’s approach to reach EU & ERTRAC SRA objectives
2 09/03/2017
Stra
tegi
c Re
sear
ch A
gend
a (S
RA)
Ove
rall
Targ
ets
deca
rbon
isat
ion
vehi
cles
infr
astr
uctu
re
Logi
stic
/
Mob
il. s
ervi
ces
ener
gy /
re
sour
ces
- which solutions can help?- which CO2-Effect do they have?- which targets are realistic?- which research work is needed?

www.ertrac.org
Vision for the future of internal combustion engines
3 09/03/2017
Highly efficient and ultra clean internal combustion engine that uses renewable low carbon fuel as key
element of an electrified powertrain.

www.ertrac.org
Target of the advanced technologies for the ICE
• Extend the ICE efficiency as close as possible to its thermodynamic boundaries – Similarly to target setting in other parts of the world
Japan’s R&D Program on Internal Combustion Engines
US DoE Super Truck Program
4 09/03/2017

www.ertrac.org
ERTRAC targets for spark‐ and compression ignition engines to reach 50%/55% efficiency
5 09/03/2017
Question: How the above translate in terms of cycle fuel consumption? They should be complemented with a wider range of good efficiency. Closure of the gap between real world and cycle fuel consumption

www.ertrac.org
Further research needs clustered:Technologies
Further development of components and systems, based on existing engine
technologies
New combustion processes / engine concepts, new combustion sensing & control
Development of dedicated ICEs for electrified powertrains
Efficient dedicated combustion engines for alternative/low carbon fuels
6 09/03/2017

www.ertrac.org
“50% peak engine efficiency”
Application in three different engine typesü SI, ~35% peak engine efficiencyü CI, ~38% peak engine efficiencyü CV CI, ~40% peak engine efficiency
7 09/03/2017

Database from the WLTP‐NEDC Correlation Exercise
8
Ø Division of vehicle fleet into characteristic segments, measurement of representative vehicles in NEDC and WLTP and develop/validate a vehicle simulation model.
q Vehicle pool in this exerciseØ 23 passenger cars (M1) and 5 light duty vehicles (N1)Ø 25 conventional, 1 Hybrid, 2 PHEVØ 15 gasoline and 13 diesel Ø 14 with manual transmissions and 14 with automatic transmission
Vehicle fleet
1 representative vehicle per segment
NEDC and WLTP measurements Simulation model
Validation Criteria
www.ertrac.org
ICE improvement areas towards higher energy efficiency – Example Diesel Engine
9 09/03/2017

www.ertrac.org
Example: diesel light-duty engine
New map with 0.5 peak engine efficiency
Original map with 0.40+ peak engine efficiency
10 09/03/2017
www.ertrac.org
Simulation of CO2 Emissions (1.6 TC SI engine)
NEDC WLTP
CO2 = 156.5 g/km@WLTPCO2 = 135.3 g/km@NEDC
CO2 = 116.0 g/km@NEDC CO2 = 122.5 g/km@WLTP
Orig
inal map
50% efficiency map
11 09/03/2017

www.ertrac.org
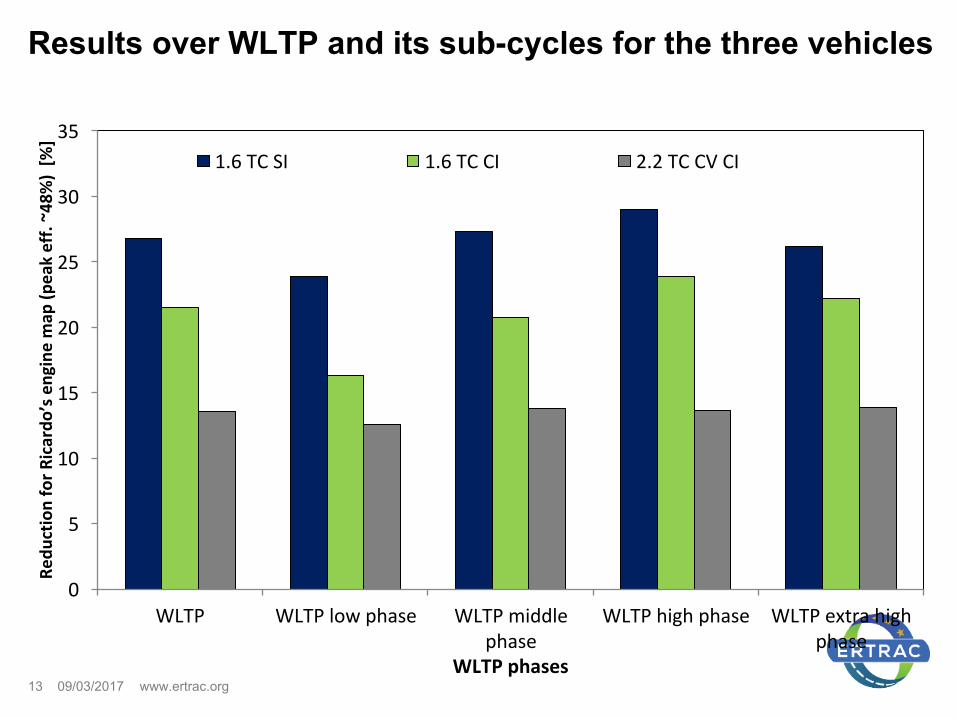
Results over WLTP and its sub-cycles for the three vehicles WLTP WLTP low
phaseWLTP middle
phaseWLTP high phase
WLTP extra high phase
Average speed with stops [km/h] 46.5 18.9 39.5 56.6 92
1.6 TC SI (peak engine efficiency = 0.351)Baseline engine map [g/km] 156.7 190.3 151.2 138.5 163.2
New engine map (peak eff. ~48%) [g/km] 114.8 144.9 109.9 98.4 120.4
Reduction [g/km] 42.0 45.5 41.3 40.1 42.7Reduction [%] 26.8 23.9 27.3 29.0 26.2
1.6 TC CI (peak engine efficiency = 0.377 )Baseline engine map [g/km] 127.7 146.5 118.6 111.6 140.0
New engine map (peak eff. ~48%) [g/km] 100.3 122.6 93.9 85.0 108.9
Reduction [g/km] 27.4 23.9 24.6 26.6 31.1Reduction [%] 21.5 16.3 20.8 23.9 22.2
2.2 TC CV CI (peak engine efficiency = 0.417 )Baseline engine map [g/km] 251.9 282.1 240.9 218.0 276.4
New engine map (peak eff. ~48%) [g/km] 217.6 246.6 207.8 188.3 238.0
Reduction [g/km] 34.3 35.5 33.2 29.7 38.4Reduction [%] 13.6 12.6 13.8 13.6 13.9
12 09/03/2017
www.ertrac.org
Results over WLTP and its sub-cycles for the three vehicles
13 09/03/2017WLTP phases
Reduction for R
icardo’s engine map (peak eff. ~48%
) [%]
WLTP WLTP low phase WLTP middle phase
WLTP high phase WLTP extra high phase
0
5
10
15
20
25
30
351.6 TC SI 1.6 TC CI 2.2 TC CV CI

www.ertrac.org
Effect of Weight, Rolling resistance and Electrical system
NEDC US‐Combined (USC) JC08 WLTC[g/km] [g/mile] [g/km] [g/km]
Otto Diesel Otto Diesel Otto Diesel Otto Diesel
BMW AVL LAT small BMW AVL LAT small LAT medium BMW AVL BMW AVL BMW AVL BMW AVL BMW AVL LAT small BMW AVL LAT small LAT
mediumWeight Δm 100 kg 1.5 3.5 1.8 1.5 3.5 2.0 2.14 3 5.9 3 5.9 1.5 4.2 1.5 4.2 1.5 3.8 2.5 1.5 3.8 2.5 2.3
Aerodynamics ∆cx*A 0.03 m² 1 1.1 1.5 1 1.1 1.3 1.91 2 2.3 2 2.3 0.5 0.5 0.5 0.5 1.5 1.4 2.6 1.5 1.4 3.1 3.1Tyre rolling resistance 10 points 2 2.6 2.1 2 2.6 2.3 3.08 3 3.9 3 3.9 1.5 2 1.5 2 1.5 2.4 3.6 1.5 2.4 3.9 4.9
Vehicle electric system 100 W 2 3.3 1 2 3.3 1 1.4 2.5 3.4 2.5 3.4 2.5 4.5 2.5 4.5 1 2.4 1 1 2.4 0.8 1.1
14 09/03/2017
www.ertrac.org
“55% peak engine efficiency”
Application in two different HDV typesü Reference Vehicles from Commission’s
tool VECTOü CV CI, ~45% peak engine efficiency

www.ertrac.org
Baseline vehicle characteristics
16 09/03/2017
Vehicle type
Rigid truck Tractor
Gross vehicle mass rating [t] 11.99 18
Curb vehicle weight [kg] 4670 8229
cdxA [m2] 4.83 5.3
Axle & wheel drive 4x2 4x2
Engine displacement [cm3] 6871 12740
Max. Torque [Nm] 956 2134
Max. Power [kW] 175 325
Peak engine efficiency [-] 0.44 0.46
Gearbox 6 MT 12 AMT

www.ertrac.org
VECTO – Driving cycles
17 09/03/2017
• Driving cycle is selected based on the mission of each vehicle
• In declaration mode there are three velocity profiles– Long Haul– Regional Delivery– Urban Delivery
Time [s]
Velocity [km/h]
0 400 800 1200 16000
102030405060708090
100 Regional Delivery
Time [s]
Velocity [km/h]
0 1000 2000 3000 4000 50000
102030405060708090
100 Long Haul
Time [s]
Velocity [km/h]
0 500 1000 1500 2000 2500 3000 35000
102030405060708090 Urban Delivery
www.ertrac.org
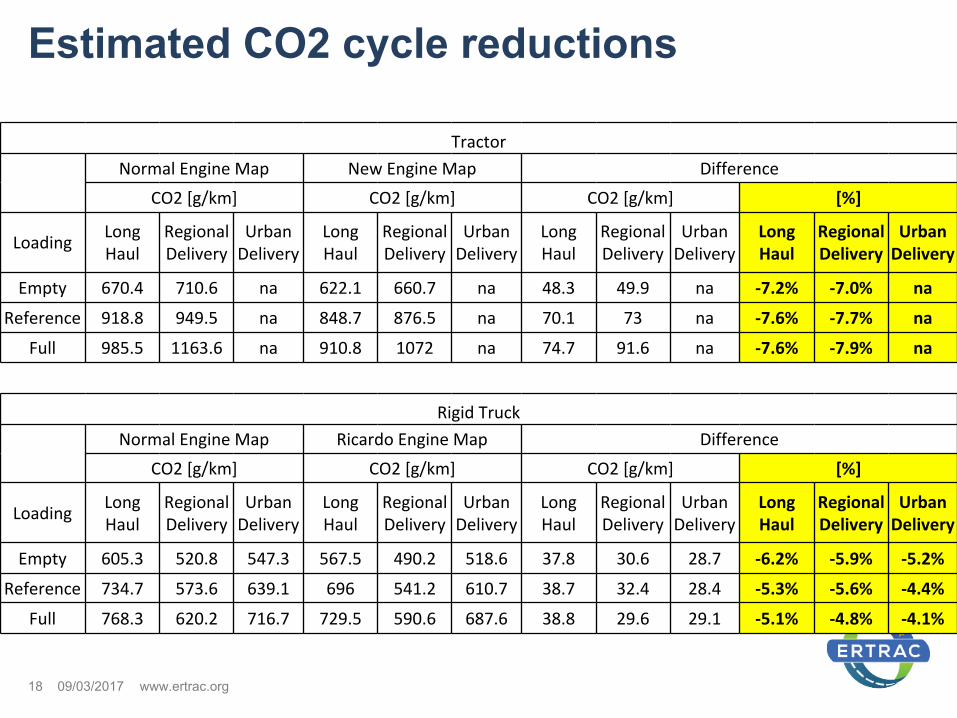
Estimated CO2 cycle reductions
18 09/03/2017
Tractor
Normal Engine Map New Engine Map Difference
CO2 [g/km] CO2 [g/km] CO2 [g/km] [%]
Loading Long Haul
Regional Delivery
Urban Delivery
Long Haul
Regional Delivery
Urban Delivery
Long Haul
Regional Delivery
Urban Delivery
Long Haul
Regional Delivery
Urban Delivery
Empty 670.4 710.6 na 622.1 660.7 na 48.3 49.9 na ‐7.2% ‐7.0% na
Reference 918.8 949.5 na 848.7 876.5 na 70.1 73 na ‐7.6% ‐7.7% na
Full 985.5 1163.6 na 910.8 1072 na 74.7 91.6 na ‐7.6% ‐7.9% na
Rigid Truck
Normal Engine Map Ricardo Engine Map Difference
CO2 [g/km] CO2 [g/km] CO2 [g/km] [%]
Loading Long Haul
Regional Delivery
Urban Delivery
Long Haul
Regional Delivery
Urban Delivery
Long Haul
Regional Delivery
Urban Delivery
Long Haul
Regional Delivery
Urban Delivery
Empty 605.3 520.8 547.3 567.5 490.2 518.6 37.8 30.6 28.7 ‐6.2% ‐5.9% ‐5.2%
Reference 734.7 573.6 639.1 696 541.2 610.7 38.7 32.4 28.4 ‐5.3% ‐5.6% ‐4.4%
Full 768.3 620.2 716.7 729.5 590.6 687.6 38.8 29.6 29.1 ‐5.1% ‐4.8% ‐4.1%

www.ertrac.org
Pollutant emissions ‐ 1
• For regulated pollutants (NOx and PN) emissions much better than Euro 6 emission limits in RDE conditions (i.e. excellent performance all over the engine map and under – most – driving conditions)
• No increase of non-regulated pollutants (i.e. NH3, N2O etc.)
19 09/03/2017

www.ertrac.org
Pollutant emissions ‐ 2
• Challenges of highly efficient ICEs: – Higher NOx emissions and – Low exhaust temperatures
• Combining exhaust gas after-treatment and engine needs further and intense research work
• New fuel chemistries• New boundary conditions from the electrified system
20 09/03/2017

www.ertrac.org
Air Quality Targets: NOx emissions
“To what extent emissions will eventually decrease will largely depend on future real‐driving emissions from light duty diesel vehicles. If unit emissions of future vehicles are within 150% of the type approval from 2018, there will be 900 kt more NOx emissionsin 2030”
All road vehicles
Source: Thematic Strategy on Air Pollution Report 4, 2012. The potential for further controls of emissions from mobile sources in Europe
Impact of NOx evolution on exceedances
21 09/03/2017

www.ertrac.org
Air Quality Targets: PM emissions
Generally a success story: Reductions until 2030
Remaining issues:• Particle number
emissions in particular in RDE from GDIs
• Non exhaust emissions (tyre, clutch and brake wear) increase
22 09/03/2017

www.ertrac.org
Current regulation on PM10: no more than 35 days/year with more than 50 g/m3Turin registered 99 days over threshold in 2015
23 09/03/2017
www.ertrac.org
ERTRAC Working Group on Energy & Environment:
• Stefan Schmerbeck (VW) - chair• Heather Hamjer (Concawe) – co-chair• Rainer Aust (VW/Eofer)• Penny Atkins, Simon Edwards, Andy Ward (Ricardo)• Peter Prenninger (AVL)• Andrea Gerini (CRF) • Gaetano de Paola (IFPEN)• …and many others
24 09/03/2017

www.ertrac.orgwww.ertrac.org
Thank you for your attention!
25 09/03/2017