Embed Size (px)
Citation preview

Morphological taxonomy, DNA barcoding, and species diversity in southern Rocky Mountainheadwater streamsAuthor(s): Brian A. Gill, Rachel A. Harrington, Boris C. Kondratieff, Kelly R. Zamudio, N.LeRoy Poff, and W. Chris FunkSource: Freshwater Science, Vol. 33, No. 1 (March 2014), pp. 288-301Published by: The University of Chicago Press on behalf of Society for Freshwater ScienceStable URL: http://www.jstor.org/stable/10.1086/674526 .
Accessed: 11/03/2014 17:33
Your use of the JSTOR archive indicates your acceptance of the Terms & Conditions of Use, available at .http://www.jstor.org/page/info/about/policies/terms.jsp
.JSTOR is a not-for-profit service that helps scholars, researchers, and students discover, use, and build upon a wide range ofcontent in a trusted digital archive. We use information technology and tools to increase productivity and facilitate new formsof scholarship. For more information about JSTOR, please contact [email protected].
.
The University of Chicago Press and Society for Freshwater Science are collaborating with JSTOR to digitize,preserve and extend access to Freshwater Science.
http://www.jstor.org
This content downloaded from 129.82.52.192 on Tue, 11 Mar 2014 17:33:47 PMAll use subject to JSTOR Terms and Conditions

MOLECULAR APPROACHES IN FRESHWATER ECOLOGY
Morphological taxonomy, DNA barcoding, and speciesdiversity in southern Rocky Mountain headwater streams
Brian A. Gill1,4, Rachel A. Harrington1,5, Boris C. Kondratieff2,6, Kelly R. Zamudio3,7,N. LeRoy Poff1,8, and W. Chris Funk1,9
1Department of Biology and Graduate Degree Program in Ecology, Colorado State University, Fort Collins, Colorado 80523 USA2Department of Bioagricultural Sciences and Pest Management and Graduate Degree Program in Ecology, Colorado State
University, Fort Collins, Colorado 80523 USA3Department of Ecology and Evolutionary Biology, Cornell University, Ithaca, New York 14853 USA
Abstract: Elevation gradients allow scientists to observe changes in fauna over a range of abiotic conditions. Avariety of trends in aquatic insect diversity patterns across elevation have been reported. However, many of thesestudies are confounded because they include streams at lower elevations, which are often larger in size and morepolluted than their higher-elevation counterparts. Moreover, such studies always relied solely on morphologicaldelineation of taxa, thereby potentially overlooking cryptic diversity. We reduced these limitations by samplingonly minimally impacted wadeable streams across an elevation gradient and by combining morphological taxon-omy with deoxyribonucleic acid (DNA) barcoding to identify taxa. We collected numerically abundant Epheme-roptera, Plecoptera, and Trichoptera (EPT) from single streams at ∼200-m elevation intervals across >1000-mtransects in 3 watersheds draining the eastern slope of the Colorado Rocky Mountains. Based on morphologyalone, we identified 49 numerically abundant EPT morphospecies across 26 sites. Using DNA barcoding, wefound 69 distinct lineages that probably represent distinct species. EPT species richness was highest at mid-elevations, and rates of turnover along elevation transects showed no consistent elevation trend or trendamong ecological zones defined by vegetation. β-diversity across sites at comparable elevations in different wa-tersheds showed a negative trend with increasing elevation that was marginally significant for DNA barcodetaxa (p = 0.051) but not for morphospecies. Furthermore, significant ( p < 0.05) differences in taxon richness,turnover, and lateral β-diversity values generated by DNA barcoding underscore the ability of molecular toolsto quantify patterns in aquatic insect diversity across elevations.Key words: diversity, elevation, DNA barcoding, taxonomy, aquatic insect, EPT, southern Rocky Mountain
Elevation gradients provide unique opportunities to studyhow communities respond to changes in abiotic condi-tions within relatively small geographic areas. Typically,ecologists have found that species richness decreases withincreasing elevation (MacArthur 1972, Brown and Gibson1983, Begon et al. 1990, Brown 1988, Stevens 1992), a pat-tern analogous to that of latitudinal diversity, where spe-cies richness decreases with increasing latitude for mosttaxonomic groups (Stevens 1989). However, Vinson andHawkins (2004) and Pearson and Boyero (2009) pointedout that taxa of the orders Ephemeroptera, Plecoptera,and Trichoptera (EPT) provide notable exceptions to thisgeneral latitudinal pattern. Elevation transects are latitudi-nal analogs, so these taxa also may exhibit different richness
trends across elevation gradients. A variety of elevationtrends in diversity have been shown for terrestrial andaquatic taxa, including plants (e.g., Bhattarai and Vetaas2003), vertebrates (e.g., Rahbek 1997), and invertebrates(e.g., Janzen 1976), leading some investigators to concludethat the negative trend might not be a general one, butrather might be caused by a small number of empiricalstudies demonstrating a compelling trend (Rahbek 1995).
Stream ecologists have found a variety of trends instream insect richness along elevation gradients (Allan1975, Minshall et al. 1985, Ward 1986, Perry and Schaef-fer 1987, Flowers 1991, Lang and Reymond 1993, Orme-rod et al. 1994, Suren 1994, Brewin et al. 1995, Tate andHeiny 1995, Grubaugh et al. 1996, Jacobsen et al. 1997,
e-mail addresses: [email protected]; [email protected]; [email protected]; [email protected];[email protected]; [email protected]
DOI: 10.1086/674526. Received 4 February 2013; Accepted 27 August 2013; Published online 12 November 2013.Freshwater Science. 2014. 33(1):288–301. © 2014 by The Society for Freshwater Science.
This content downloaded from 129.82.52.192 on Tue, 11 Mar 2014 17:33:47 PMAll use subject to JSTOR Terms and Conditions

Figure 1. Map of study area showing collection localitiesand elevation in the Cache La Poudre, Big Thompson, andSaint Vrain watersheds in northern Colorado, USA.
Monaghan et al. 2000, Jacobsen 2003). Thus far, nearlyevery pattern in richness across elevations has been re-ported for lotic insect taxa, from hump-shaped (Minshallet al. 1985, Brewin et al. 1995, Grubaugh et al. 1996), toincreasing (Lang and Reymond 1993, Tate and Heiny1995) or decreasing with elevation (Allan 1975, Ward1986, Perry and Schaeffer 1987, Ormerod et al. 1994,Suren 1994, Jacobsen et al. 1997, Monaghan et al. 2000,Jacobsen 2003), to cases where no trend is evident (Flow-ers 1991). In the Colorado Rocky Mountains, positive(Tate and Heiny 1995) and negative (Allan 1975, Ward1986, Perry and Schaeffer 1987) patterns of richness withelevation have been reported.
β-diversity along elevation gradients also is important forunderstanding regional-scale diversity patterns. β-diversityis a measure of the similarity of communities among mul-tiple sites, and turnover is a specific form of β-diversitythat is a measure of the similarity of adjacent sites (Whit-taker 1960, 1972, Tuomisto 2010). Both β-diversity andturnover can explain the degree of heterogeneity of biotaand habitats across a region (Wilson and Shmida 1984).However, few investigators have examined turnover alongelevation gradients, and most have focused on terrestrialtaxa (Wilson and Shmida 1984, Rahbek 1997, Mena andVázquez-Domínguez 2005, Finn et al. 2013). Some investi-gators have found that, with increasing elevation, loss ofaquatic taxa increases while gain of taxa remains low, apattern suggesting that rates of turnover may be generallylower at lower elevations (Allan 1975,Ward 1986, Jacobsen2004). Finn et al. (2013) found higher rates of turnoveramong high and mid-elevation than among low-elevationcommunities. Others have hypothesized that turnover, orfaunal replacement, should be highest in regions of transi-tion between distinct vegetation zones (ecozones; Doddsand Hisaw 1925).
Jacobsen (2004) argued that many studies of streaminsect diversity patterns across elevation had inappropri-ate sampling designs and identified several reasons whydesigns might obscure detectable patterns. Examples in-clude sampling too few sites or human-impacted sites,sampling an insufficient elevation gradient, and failure tocontrol for stream order (Jacobsen 2004). In addition, in-consistent taxonomic resolution of stream insect identifi-cation can confound comparisons (Jacobsen 2004).
Dexoyribonucleic acid (DNA) barcoding has the po-tential to improve our understanding of diversity patternsby addressing the common problem of inconsistent taxo-nomic identification in studies of stream insects (Bairdand Sweeney 2011). Species-level units can be delimitedby pairwise comparison of mitochondrial cytochrome coxidase subunit I gene (COI) sequences (Hebert et al.2003), a technique that has been used effectively to aid inthe description of communities and to reveal hidden diver-sity (Zhou et al. 2009, 2010, 2011, Sweeney et al. 2011).Specimens that typically are difficult to identify morpho-
logically, such as early instars or adult females, can be as-sociated with expertly identified adult male material,thereby increasing the taxonomic resolution of descrip-tions of stream insect communities (e.g., Zhou et al. 2007,Pauls et al. 2010). Moreover, researchers doing DNA bar-coding can query their sequences against online databases,such as the Barcode of Life Data System (BOLD) (Ratna-singham andHebert 2007) to aid in identification.
To understand elevation trends in stream insect diver-sity, we used an integrated taxonomic approach combin-ing morphological taxonomy and DNA barcoding forspecies-level identifications of taxa, controlled for changesin stream size across elevations by sampling only wade-able tributaries to a mainstem river, and sampled onlyminimally impacted sites. We addressed several questionsabout stream insect diversity: 1) How does the richness ofthe orders Ephemeroptera, Plecoptera, and Trichoptera(EPT) change across elevation? 2) How broadly or narrowlyare EPT species distributed across elevation? 3) Does spe-cies turnover increase linearly with elevation, or is turn-over highest between distinct ecozones defined by ele-vation and vegetation? 4) How similar are communitiesat comparable elevations across 3 adjacent watersheds?5) How does species-level assessment with DNA barcod-ing affect our interpretation of these elevation trends inaquatic insect diversity?
METHODSStudy area and collection
We selected sites in watersheds of 3 major riversdraining the eastern slope of Colorado Rocky Mountains(Fig. 1): the Cache La Poudre (CLP), Big Thompson(BT), and Saint Vrain (SV). Starting at the base of themountain front (1500 m asl), we selected minimally im-
Volume 33 March 2014 | 289
This content downloaded from 129.82.52.192 on Tue, 11 Mar 2014 17:33:47 PMAll use subject to JSTOR Terms and Conditions

pacted wadeable streams in different watersheds andproceeded upward within each watershed to find compa-rable tributaries at every 200 m of elevation. We chosethe 200-m increment to capture changes in species com-position and to detect major environmental gradientsacross elevation. No trend related to elevation was appar-ent in stream size (i.e., larger streams were not sampledpreferentially at lower elevations). If minimally impactedsites were not available at a particular elevation, no siteswere included for that elevation.
We sampled a total of 26 sites (Fig. 1) between 27 June2011 and 10 August 2011: 8 sites in CLP from 1992 to3397 m asl, 10 in BT from 1556 to 3478 m asl, and 8 in SVfrom 2015 to 3348 m asl. These sites spanned 5 ecozonesdefined primarily by vegetation: plains (1500 to 1650 masl), foothills (1650 to 2440 m asl), lodgepole pine (Pinuscontorta Douglas) (2440 to 3050 m asl), spruce–fir (3050to 3300 m asl), and alpine (>3300 m asl). Plains and foot-hill ecozone designations were adapted fromWard (1986),whereas montane zones followed descriptions by Peattie(1936) and used by Finn and Poff (2005). We sampled2 plains, 9 foothill, 7 lodgepole pine, 4 spruce–fir, and4 alpine sites.
At each site, we collected immature EPT individuals(aquatic larvae) for a standardized period of 2 h from allavailable microhabitats with a 500-μm kick net and byhaphazardly picking up rocks within a 100-m reach. Wesorted the collected material coarsely in the field and de-fined dominant taxa by numerical abundance. In manyinstances, taxa could be identified only to the family orgeneric level in the field. In these cases, we sampled hier-archically by collecting more specimens of taxa identi-fied at higher levels (i.e., family) and fewer when we wereconfident of a lower-level identification (i.e., monotypicspecies). This collection method ensured that we had ade-quate and representative material for morphological anal-ysis in the laboratory. We also used a beating sheet andaerial net to collect adult specimens from riparian vege-tation until no new taxa were found. We preserved allspecimens initially in ≥95% EtOH, which was replacedwithin 24 h (Baird et al. 2011).
IdentificationIn the laboratory, we sorted numerically abundant EPT
taxa to the lowest possible taxonomic level using availabletaxonomic literature (see Merritt et al. 2008). The aquaticinsect fauna of the southern Rocky Mountains is relativelywell known (Ward et al. 2002), so we made generic- andmany species-level identifications. An exception was veryimmature Chloroperlidae, which we left at the family level.Adult Ephemeroptera and Plecoptera were identified byBCK, and Trichoptera were identified by D. E. Ruiter(Grants Pass, Oregon). Expertly identified material for alltaxa and stages was available for comparison at the C. P.
Gillette Museum of Arthropod Diversity, Colorado StateUniversity.
We used a numerical threshold for dominance toscreen taxa. We required that ≥10 individuals/morpho-species be found at ≥1 study site for that taxon to beconsidered numerically abundant and, therefore, eligiblefor DNA barcoding. In consequence, we excluded 18 lar-val taxa from our analysis that were collected in muchlower numbers (mean ± SE, 3 ± 0.52) than those we iden-tified as numerically abundant EPT taxa (21 ± 3). We se-lected up to 5 individuals from each numerically abundantmorphospecies and sampling site for barcoding. This sub-sampling protocol is comparable to that used in otherbarcoding studies (e.g., Ward et al. 2005) and increased ormaximized geographic and taxonomic coverage and ourability to detect cryptic species, while minimizing cost.
We used standard protocols from the Canadian Centerfor DNA Barcoding (CCDB) for extraction (Ivanova et al.2006), polymerase chain reaction (PCR), and sequencing(Ivanova et al. 2005, Hajibabaei et al. 2005, deWaard et al.2008). For PCR, we first used the primer sets LCO1490/HCO2198 (Folmer et al. 1994) and LepF1/LepR1 (Hebertet al. 2004) to amplify a 658 base pair (bp) fragment of theCOI gene. If these primer sets failed for Ephemeropteraand Plecoptera, we switched to the degenerate Folmerprimer set (Meyer 2003), which amplifies the same gene.If the standard primer sets failed for Trichoptera, we usedCOI 1709Fg (Zhou et al. 2007) and COI 2191R (Kjer et al.2001), which amplify a smaller 441-bp fragment of thesame Folmer region. Following PCR, we visualized suc-cessful amplicons on a 2% agarose gel. PCR products werecleaned using ExoSAP-IT® (Affymetrix, Santa Clara, Cali-fornia) according to manufacturer’s protocol. Purified PCRproducts were cycle-sequenced using Big Dye v3.1 dye ter-mination kit, purified using Sephadex, and sequenced bi-directionally on an ABI 3730 sequencer (Applied Biosys-tems, Foster City, California).
AnalysesSpecies delimitation We trimmed and assembled COIsequences in Sequencher 5.0.1 (Gene Codes, Ann Arbor,Michigan) and made them publicly available with associ-ated collection and taxonomy information on the Barcodefor Life Data system (BOLD; Ratnasingham and Hebert2007) under the project name Diversity of Rocky Moun-tain Stream Insects (DRMSI). We aligned sequences inMEGA (version 5; Tamura et al. 2011) using the ClustalWalgorithm with default parameters. We checked sequencesmanually. We calculated pairwise genetic distances amongall specimens using Kimura’s 2-parameter model with1000 bootstrap replicates (Kimura 1980), and plotted thefrequency of these distances by order to visualize the bar-code gap and establish a threshold for species delimita-
290 | Rocky Mountain stream insect diversity B.A. Gill et al.
This content downloaded from 129.82.52.192 on Tue, 11 Mar 2014 17:33:47 PMAll use subject to JSTOR Terms and Conditions

tion (Fig. 2). Consequently, we chose a 2% divergence cri-terion, a threshold demonstrated here to be exceeded onlyrarely by members of the same species and historicallycongruent with morphological identification of aquatic in-sect taxa (Avise 2000, Zhou et al. 2007, 2009, Ball et al.2009).
We examined each group of immatures to determinefinal identification. In cases where we collected an asso-
ciated adult specimen (expertly identified) that clusteredwith other specimens at a higher level of identification(e.g., an adult male of the chloroperlid Sweltsa lamba(Banks) clustered with Sweltsa sp. nymphs), we changedthe higher-order identifications to reflect the species-level identity (in the above example, the identification ofSweltsa sp. nymphs would have been changed to Sweltsalamba). Otherwise, we queried sequences for each groupin BOLD (Ratnasingham and Hebert 2007) to match oursequence to a specimen in the database. When we couldmake a match with confidence, we changed the identityof the appropriate specimens accordingly. Otherwise wedesignated group members as having insufficient data todetermine their identification (ISD) or as cryptic species.Specimens gained status as cryptic species only if COIsequences were available for all sympatric congenericspecies in our sequence library or in BOLD (Ratnasing-ham and Hebert 2007), and the sequences of these speci-mens showed >2% divergence from these known taxa.We used the appendices of Ward et al. (2002) to deter-mine the set of known taxa for Colorado.
Richness across elevations We estimated numericallyabundant EPT richness at the genus/species (morpho-species) and barcode-taxon (genetic lineages presumablyrepresenting true species) levels for each site. We calcu-lated morphospecies richness according to the methods ofSweeney et al. (2011), who synonymized higher-level withlower-level identifications if more-developed (i.e., later-instar) or later life-stage (i.e., adult) specimens were avail-able (e.g., records for adult males of heptageniid mayflyCinygmula mimus (Eaton) and immature/damaged Cinyg-mula sp. at a locality, but only C. mimus [the lowestlevel identification] counted for richness). This approachprevents inflation of richness values by the presence ofimmature or damaged specimens and integrates identifi-cations from the collection of both adults and immatures.We estimated richness of barcode taxa as the number oftaxa differing by >2% sequence divergence.
We plotted estimated richness as a function of eleva-tion and used polynomial regression to determine se-quentially the best fit for the data at the morphospeciesand barcode-taxon levels. We compared morphospeciesand barcode-taxon richness values with a paired t-test.After checking our data for normality and homogeneityof variance, we compared mean richness of sites in the5 ecozones with analysis of variance (ANOVA) followedby Least Significant Difference (LSD) tests to comparemeans among ecozones.
Elevation ranges We estimated elevation ranges foreach taxon by subtracting the minimum elevation collec-tion record from the maximum elevation collection rec-ord for each taxon at the lowest morphological and
Figure 2. Number of pairwise comparisons vs genetic diver-gence among specimens calculated using Kimura’s 2-parametermodel for Ephemeroptera (A), Plecoptera (B), and Trichoptera(C). White portions of bars represent comparisons amongmembers purported to be of the same barcode species designa-tion, gray portions are comparisons among members of thesame purported genus, and black portions are comparisonsamong members of the same purported family. The 2 meanvalues for each order are average % genetic divergence for in-traspecific and interspecific comparisons, respectively. Verticaldashed line indicates the value of genetic divergence (2%) usedto separate barcode taxa.
Volume 33 March 2014 | 291
This content downloaded from 129.82.52.192 on Tue, 11 Mar 2014 17:33:47 PMAll use subject to JSTOR Terms and Conditions
barcode-taxon levels. We used a Wilcoxon rank-sum testto test whether elevation ranges differed between mor-phospecies and barcode taxa. For this analysis, we in-cluded all morphological taxa (e.g., elevation ranges werecalculated for both Sweltsa borealis (Banks) and Sweltsasp. specimens).
Species turnover We calculated species turnover be-tween consecutive sites ascending each elevation transectwith Whittaker’s species turnover index (βW = [γ – α]/α;Whittaker 1972, Tuomisto 2010), which measures thesimilarity between 2 sites based on presence/absencedata (Koleff et al. 2003). For our study, γ is the total tax-onomic richness within an elevation and α is the mean ofthe taxonomic richness among sites within an elevationband. We used βW because it is independent of speciesrichness and reflects differences in community compo-sition (Koleff et al. 2003, Tuomisto 2010). βW is used com-monly in studies along elevation gradients (Mena andVázquez-Domínguez 2005). On a scale from 0 to 1, higherβW values indicate a higher turnover rate of taxa betweensites. We calculated pairwise βW values for morphospe-cies and barcode-taxon data sets and plotted values as afunction of elevation. We used linear regression to test fora linear trend in βW across elevations and polynomial re-gression and goodness-of-fit tests to test whether higher-order polynomial regressions could better describe thedata. Because we calculated βW based on adjacent pairs ofsites, taxonomic data for some sites are unavoidably usedin >1 calculation. Thus, we violated the assumption of in-dependence of data points, and we used this test to de-scribe the likelihood of a pattern in βW, not to draw strictinference.
We separated βW values into 2 groups, those betweensites within an ecozone and those between sites in differ-ent ecozones. We used a t-test to test for a difference inβW values from sites within vs spanning ecozones. Last,we compared βW values for morphospecies and barcodetaxa with a Wilcoxon signed-rank test.
Among-watershed β-diversity We used Whittaker’s trueβ-diversity index (β = γ/α) (Whittaker 1960, Tuomisto2010) to test for similarity among sites in different water-sheds but at comparable elevations. Higher β-diversityvalues for an elevation band indicate fewer shared taxaamong sites in different watersheds at that elevation.We excluded the highest- and 2 lowest-elevation sites (of26 sites total) from this comparison because we lackedmultiple sites at an equivalent elevation.
We calculated β-diversity values for morphospecies andbarcode-taxon data sets, plotted them together againstelevation, and tested for linear trends in β-diversity withlinear regression. We used polynomial regression and agoodness-of-fit tests to evaluate the alternative that a higher-
order function could better describe the relationship be-tween β-diversity and elevation. We used a paired t-testto compare values of β-diversity with and without bar-coding.
RESULTSSequencing
We amplified DNA barcodes ≥500 bp for all 1224 spec-imens sequenced and used to delimit barcode taxa. Morethan 99% of these sequences met the barcode-compliancecriteria elected by the Consortium for DNA Barcodingand used to evaluate the quality of records uploaded tothe BOLD database (Ratnasingham and Hebert 2007).The <1% (4 sequences) that did not meet the barcode-compliance criteria were based on a single high-qualityread (>500 bp, 0 ambiguous base calls) and were not di-vergent from other compliant records. No relationshipbetween final consensus sequence lengths and insect or-der was indicated.
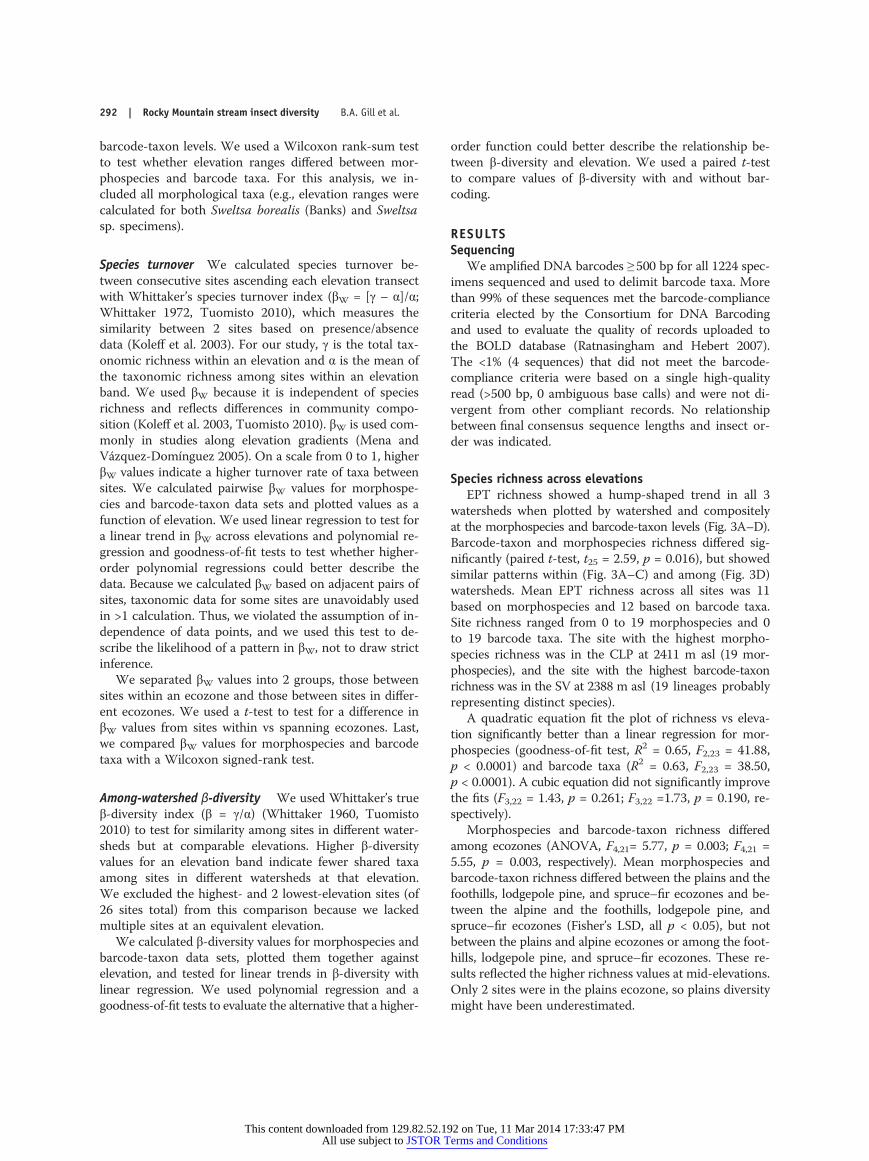
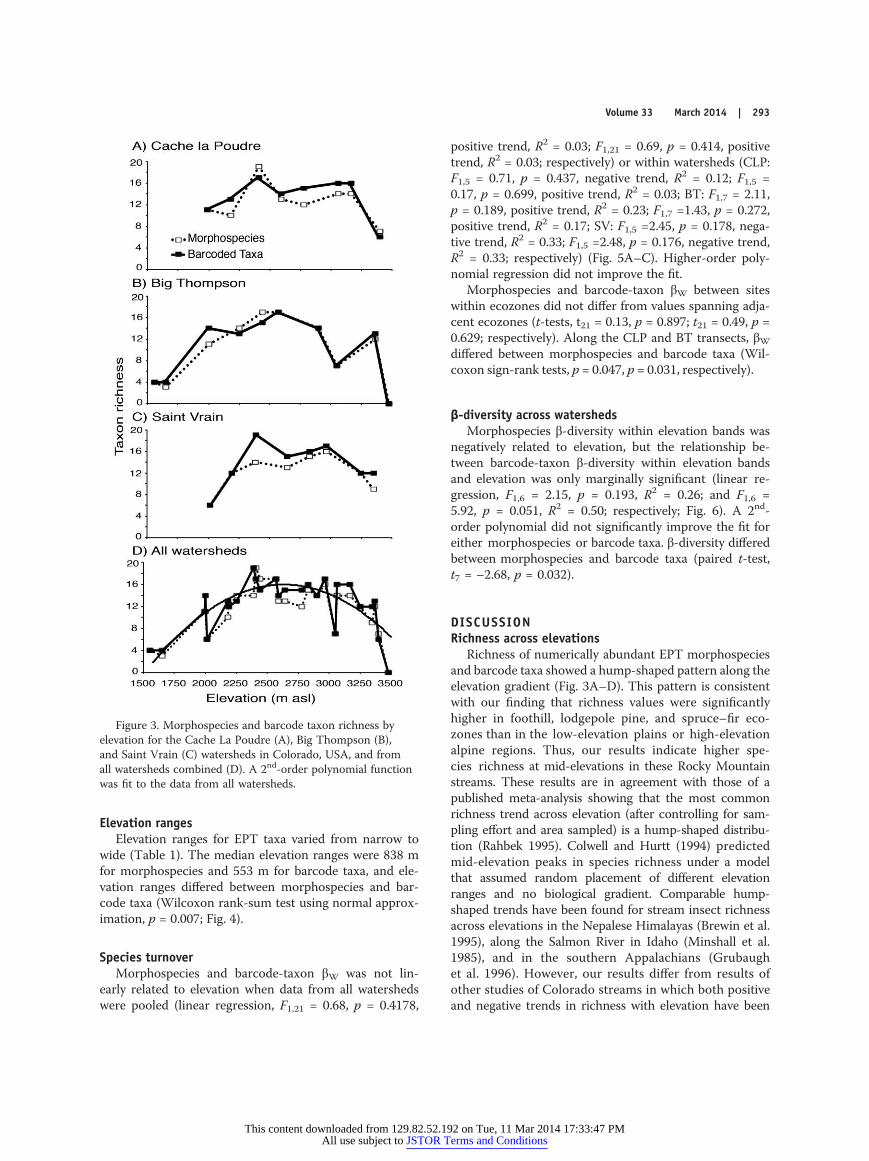
Species richness across elevationsEPT richness showed a hump-shaped trend in all 3
watersheds when plotted by watershed and compositelyat the morphospecies and barcode-taxon levels (Fig. 3A–D).Barcode-taxon and morphospecies richness differed sig-nificantly (paired t-test, t25 = 2.59, p = 0.016), but showedsimilar patterns within (Fig. 3A–C) and among (Fig. 3D)watersheds. Mean EPT richness across all sites was 11based on morphospecies and 12 based on barcode taxa.Site richness ranged from 0 to 19 morphospecies and 0to 19 barcode taxa. The site with the highest morpho-species richness was in the CLP at 2411 m asl (19 mor-phospecies), and the site with the highest barcode-taxonrichness was in the SV at 2388 m asl (19 lineages probablyrepresenting distinct species).
A quadratic equation fit the plot of richness vs eleva-tion significantly better than a linear regression for mor-phospecies (goodness-of-fit test, R2 = 0.65, F2,23 = 41.88,p < 0.0001) and barcode taxa (R2 = 0.63, F2,23 = 38.50,p < 0.0001). A cubic equation did not significantly improvethe fits (F3,22 = 1.43, p = 0.261; F3,22 =1.73, p = 0.190, re-spectively).
Morphospecies and barcode-taxon richness differedamong ecozones (ANOVA, F4,21= 5.77, p = 0.003; F4,21 =5.55, p = 0.003, respectively). Mean morphospecies andbarcode-taxon richness differed between the plains and thefoothills, lodgepole pine, and spruce–fir ecozones and be-tween the alpine and the foothills, lodgepole pine, andspruce–fir ecozones (Fisher’s LSD, all p < 0.05), but notbetween the plains and alpine ecozones or among the foot-hills, lodgepole pine, and spruce–fir ecozones. These re-sults reflected the higher richness values at mid-elevations.Only 2 sites were in the plains ecozone, so plains diversitymight have been underestimated.
292 | Rocky Mountain stream insect diversity B.A. Gill et al.
This content downloaded from 129.82.52.192 on Tue, 11 Mar 2014 17:33:47 PMAll use subject to JSTOR Terms and Conditions
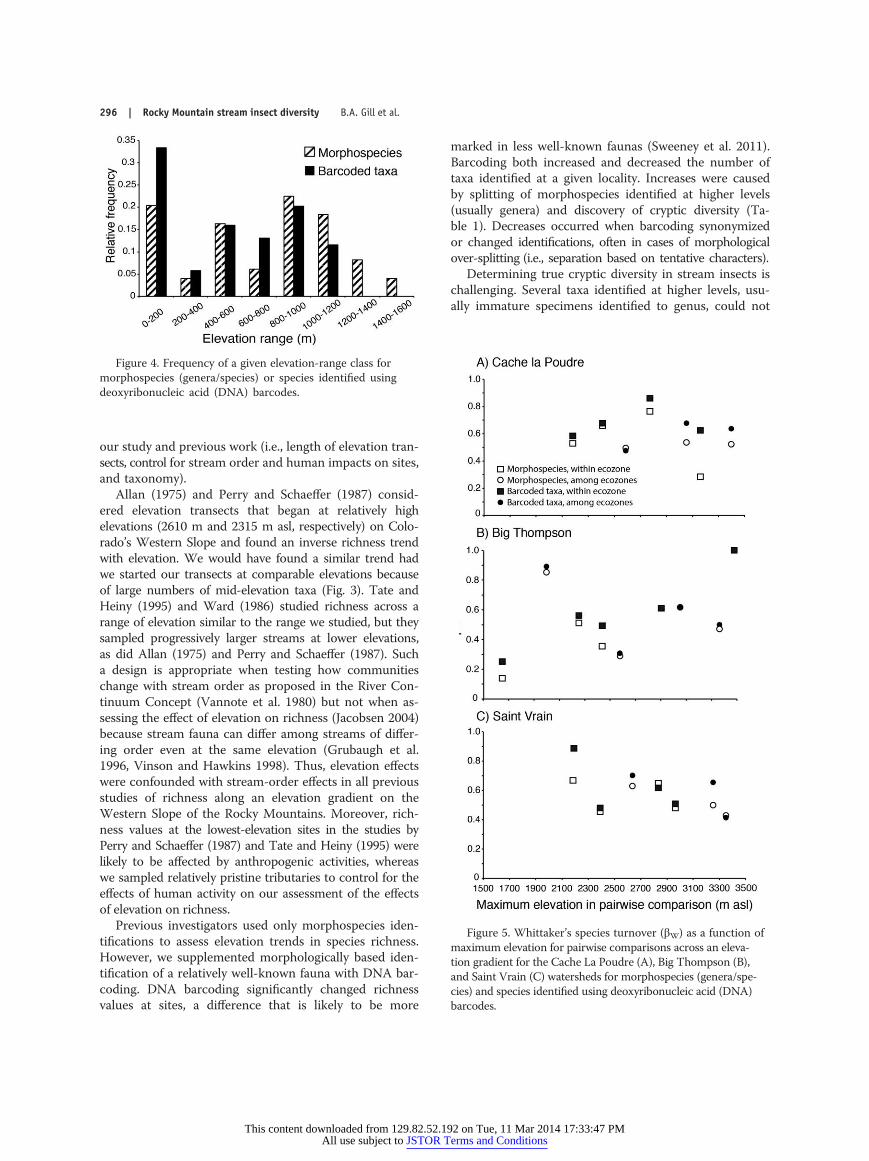
Elevation rangesElevation ranges for EPT taxa varied from narrow to
wide (Table 1). The median elevation ranges were 838 mfor morphospecies and 553 m for barcode taxa, and ele-vation ranges differed between morphospecies and bar-code taxa (Wilcoxon rank-sum test using normal approx-imation, p = 0.007; Fig. 4).
Species turnoverMorphospecies and barcode-taxon βW was not lin-
early related to elevation when data from all watershedswere pooled (linear regression, F1,21 = 0.68, p = 0.4178,
positive trend, R2 = 0.03; F1,21 = 0.69, p = 0.414, positivetrend, R2 = 0.03; respectively) or within watersheds (CLP:F1,5 = 0.71, p = 0.437, negative trend, R2 = 0.12; F1,5 =0.17, p = 0.699, positive trend, R2 = 0.03; BT: F1,7 = 2.11,p = 0.189, positive trend, R2 = 0.23; F1,7 =1.43, p = 0.272,positive trend, R2 = 0.17; SV: F1,5 =2.45, p = 0.178, nega-tive trend, R2 = 0.33; F1,5 =2.48, p = 0.176, negative trend,R2 = 0.33; respectively) (Fig. 5A–C). Higher-order poly-nomial regression did not improve the fit.
Morphospecies and barcode-taxon βW between siteswithin ecozones did not differ from values spanning adja-cent ecozones (t-tests, t21 = 0.13, p = 0.897; t21 = 0.49, p =0.629; respectively). Along the CLP and BT transects, βWdiffered between morphospecies and barcode taxa (Wil-coxon sign-rank tests, p = 0.047, p = 0.031, respectively).
β-diversity across watershedsMorphospecies β-diversity within elevation bands was
negatively related to elevation, but the relationship be-tween barcode-taxon β-diversity within elevation bandsand elevation was only marginally significant (linear re-gression, F1,6 = 2.15, p = 0.193, R2 = 0.26; and F1,6 =5.92, p = 0.051, R2 = 0.50; respectively; Fig. 6). A 2nd-order polynomial did not significantly improve the fit foreither morphospecies or barcode taxa. β-diversity differedbetween morphospecies and barcode taxa (paired t-test,t7 = –2.68, p = 0.032).
DISCUSSIONRichness across elevations
Richness of numerically abundant EPT morphospeciesand barcode taxa showed a hump-shaped pattern along theelevation gradient (Fig. 3A–D). This pattern is consistentwith our finding that richness values were significantlyhigher in foothill, lodgepole pine, and spruce–fir eco-zones than in the low-elevation plains or high-elevationalpine regions. Thus, our results indicate higher spe-cies richness at mid-elevations in these Rocky Mountainstreams. These results are in agreement with those of apublished meta-analysis showing that the most commonrichness trend across elevation (after controlling for sam-pling effort and area sampled) is a hump-shaped distribu-tion (Rahbek 1995). Colwell and Hurtt (1994) predictedmid-elevation peaks in species richness under a modelthat assumed random placement of different elevationranges and no biological gradient. Comparable hump-shaped trends have been found for stream insect richnessacross elevations in the Nepalese Himalayas (Brewin et al.1995), along the Salmon River in Idaho (Minshall et al.1985), and in the southern Appalachians (Grubaughet al. 1996). However, our results differ from results ofother studies of Colorado streams in which both positiveand negative trends in richness with elevation have been
Figure 3. Morphospecies and barcode taxon richness byelevation for the Cache La Poudre (A), Big Thompson (B),and Saint Vrain (C) watersheds in Colorado, USA, and fromall watersheds combined (D). A 2nd-order polynomial functionwas fit to the data from all watersheds.
Volume 33 March 2014 | 293
This content downloaded from 129.82.52.192 on Tue, 11 Mar 2014 17:33:47 PMAll use subject to JSTOR Terms and Conditions

Table 1. Morphospecies (MS, bolded) and deoxyribonucleic acid (DNA)-barcode identified (BT, *) species list for all sites. Numbersof morphospecies barcoded, final numbers of specimens representing each barcode taxon, and elevation ranges are presented for bothmorphospecies and DNA-barcode taxa. In the cryptic species column, Y (cryptic species) or ISD (insufficient genetic data) indicatestaxa for which a specific identification could not be determined based on morphology or DNA barcodes. N = number.
Order Family Genus SpeciesN MS
barcodedFinal Nbarcoded
RangeMS
Range BCtaxon
Crypticspecies
Ephemeroptera Ameletidae Ameletus sp. 50 – 2252–3364 –
celer* – 22 – 2775–3364
doddsianus* – 14 – 2252–2590
sp. A* – 2 – 2643 (ISD)
sp. B* – 10 – 2643–3348 (ISD)
sp. C* – 1 – 3060 (ISD)
Baetidae Baetis bicaudatus* 75 75 2252–3364 2252–3364
flavistriga* 8 8 1556–1650 1556–1650
magnus 10 – 2015–3060 –
sp. A* – 16 – 2015–3060 Y
sp. B* – 26 – 2001–2590 Y
sp. C* – 1 – 2388 Y
tricaudatus* 46 13 1556–2830 1556–2181
Diphetor hageni* – 14 – 2189–2590
Fallceon quilleri 24 – 1556–2590 –
sp. A* – 7 – 1556–1650 Y
sp. B* – 3 – 1650 Y
Ephemerellidae Drunella coloradensis* 44 2 2388–3348 3166
doddsii* 25 25 2411–2964 2411–2964
grandis* 25 26 1992–2830 1992–2830
sp. A* – 42 – 2388–3348 Y
Ephemerella dorotheainfrequens* 40 4 2001–3060 2001–2181
sp. A* – 36 – 2001–3060 Y
tibialis* 27 27 1992–2830 1992–2830
Heptageniidae Cinygmula sp. 73 – 2181–3397 –
mimus* – 8 – 2181–2830
sp. A* – 29 – 2388–3166 (ISD)
sp. B* – 19 – 2775–3397 (ISD)
sp. C* – 17 – 2443–3348 (ISD)
Epeorus albertae* 13 8 1992–3397 1992–2181
deceptivus* – 5 – 3060
longimanus* 55 48 1992–3060 1992–2964
sp. A* – 6 – 1992–2015 Y
Rhithrogena robusta* 30 29 2411–3364 2643–3364
sp. A* – 2 – 2181–2411 (ISD)
Leptohyphidae Tricorythodes explicatus* 5 5 1556 1556
Leptophlebiidae Paraleptophlebia heteronea* 19 19 1992–2830 1992–2830
Siphlonuridae Siphlonurus occidentalis* 21 21 2015–2590 2015–2964
Plecoptera Chloroperlidae Alloperla pilosa* 10 18 2900–3397 2900–3397
thalia* 5 5 2181 2181
Genus sp. 38 – 2189–3397 –
Suwallia sp. A* – 14 – 2189–3364 (ISD)
sp. B* – 8 – 2189–3364 (ISD)
This content downloaded from 129.82.52.192 on Tue, 11 Mar 2014 17:33:47 PMAll use subject to JSTOR Terms and Conditions

found (Allan 1975, Ward 1986, Perry and Schaeffer 1987,Tate and Heiny 1995). Theory (Colwell and Hurtt 1994,Rahbek 1995) and a few empirical studies support theidea of a mid-elevation peak in species richness of aquaticinsects (Minshall et al. 1985, Brewin et al. 1995, Grubaugh
et al. 1996), but discrepancies between our work and stud-ies from the same region (Allan 1975, Ward 1986, Perryand Schaeffer 1987, Tate and Heiny 1995) remain un-explained. These differences might be a consequence offundamental differences in experimental design between
Order Family Genus SpeciesN MS
barcodedFinal Nbarcoded
RangeMS
Range BCtaxon
Crypticspecies
Sweltsa borealis* 33 71 2443–3397 2443–3397
coloradensis* 22 23 1992–2411 1992–2411
lamba* 66 79 2252–3397 2252–3397
sp. 44 – 2443–3397 –
Triznaka pintada* 12 16 1992–2590 2001–2590
signata* 14 10 1992–2181 1992–2181
Leuctridae Paraleuctra vershina – – 2189–3364 –
Nemouridae Malenka coloradensis* – 2 – 2590
flexura* 15 15 2573–3364 2573–3364
Podmosta decepta* 7 7 2643–2775 2643–2775
delicatula* 20 18 2411–2964 2411–2964
Zapada sp. 38 – 2573–3364 –
oregonensis* – 10 – 2643–3249
oregonensisgroup* – 28 – 2573–3397
Perlidae Hesperoperla pacifica* 36 36 2001–3249 2001–3060
Perlodidae Isoperla fulva* 25 26 2001–2964 2001–2964
sobria* 15 15 2388–3364 2388–3364
Kogotus modestus* 57 56 2189–3249 2189–3249
Megarcys signata* 29 6 2643–3397 2643–2775
sp. A* – 23 – 2900–3397 Y
Pictetiella expansa* 5 5 3348 3348
Trichoptera Brachycentridae Brachycentrus americanus* 5 1 2001 2001
sp. A* – 4 2001 Y
Hydropsychidae Arctopsyche grandis* 12 12 2411–2830 2411–2830
Hydropsyche oslari* 11 10 1992–2001 1992–2001
slossonae* – 1 1992
Lepidostomatidae Lepidostoma sp. 13 – 2001–2388 –
unicolor* – 13 – 2001–2388
Limnephilidae Hesperophylax
designatus* – 15 – 1992–2015
occidentalis 15 – 1992 –
Rhyacophilidae Rhyacophila angelita* 18 17 2189–3166 2189–3060
brunnea* 36 10 2189–3166 2189–3060
harmstoni* 5 5 2900–3249 2900–3249
hyalinata* 17 18 2900–3348 2900–3348
sp. A* – 26 – 2252–3166 (ISD)
Uenoidae Neothremma alicia* 11 11 2443–2573 2443–3166
Total 1224 1224
Table 1 (Continued )
Volume 33 March 2014 | 295
This content downloaded from 129.82.52.192 on Tue, 11 Mar 2014 17:33:47 PMAll use subject to JSTOR Terms and Conditions
our study and previous work (i.e., length of elevation tran-sects, control for stream order and human impacts on sites,and taxonomy).
Allan (1975) and Perry and Schaeffer (1987) consid-ered elevation transects that began at relatively highelevations (2610 m and 2315 m asl, respectively) on Colo-rado’s Western Slope and found an inverse richness trendwith elevation. We would have found a similar trend hadwe started our transects at comparable elevations becauseof large numbers of mid-elevation taxa (Fig. 3). Tate andHeiny (1995) and Ward (1986) studied richness across arange of elevation similar to the range we studied, but theysampled progressively larger streams at lower elevations,as did Allan (1975) and Perry and Schaeffer (1987). Sucha design is appropriate when testing how communitieschange with stream order as proposed in the River Con-tinuum Concept (Vannote et al. 1980) but not when as-sessing the effect of elevation on richness (Jacobsen 2004)because stream fauna can differ among streams of differ-ing order even at the same elevation (Grubaugh et al.1996, Vinson and Hawkins 1998). Thus, elevation effectswere confounded with stream-order effects in all previousstudies of richness along an elevation gradient on theWestern Slope of the Rocky Mountains. Moreover, rich-ness values at the lowest-elevation sites in the studies byPerry and Schaeffer (1987) and Tate and Heiny (1995) werelikely to be affected by anthropogenic activities, whereaswe sampled relatively pristine tributaries to control for theeffects of human activity on our assessment of the effectsof elevation on richness.
Previous investigators used only morphospecies iden-tifications to assess elevation trends in species richness.However, we supplemented morphologically based iden-tification of a relatively well-known fauna with DNA bar-coding. DNA barcoding significantly changed richnessvalues at sites, a difference that is likely to be more
marked in less well-known faunas (Sweeney et al. 2011).Barcoding both increased and decreased the number oftaxa identified at a given locality. Increases were causedby splitting of morphospecies identified at higher levels(usually genera) and discovery of cryptic diversity (Ta-ble 1). Decreases occurred when barcoding synonymizedor changed identifications, often in cases of morphologicalover-splitting (i.e., separation based on tentative characters).
Determining true cryptic diversity in stream insects ischallenging. Several taxa identified at higher levels, usu-ally immature specimens identified to genus, could not
Figure 4. Frequency of a given elevation-range class formorphospecies (genera/species) or species identified usingdeoxyribonucleic acid (DNA) barcodes.
Figure 5. Whittaker’s species turnover (βW) as a function ofmaximum elevation for pairwise comparisons across an eleva-tion gradient for the Cache La Poudre (A), Big Thompson (B),and Saint Vrain (C) watersheds for morphospecies (genera/spe-cies) and species identified using deoxyribonucleic acid (DNA)barcodes.
296 | Rocky Mountain stream insect diversity B.A. Gill et al.
This content downloaded from 129.82.52.192 on Tue, 11 Mar 2014 17:33:47 PMAll use subject to JSTOR Terms and Conditions

be positively associated with adult specimens identifiedto species or with available BOLD records (Ratnasinghamand Hebert 2007). In these situations, we designated ataxon as a cryptic species only when reference sequenceswere available for all sympatric congeneric species fromour streams. Otherwise, we designated the taxon as ISD toindicate the absence of sufficient genetic data to differen-tiate between extant described species and cryptic species.In many cases, taxa were designated ISD because ref-erence sequences were not available on BOLD (Ratna-singham and Hebert 2007).
Our integrative approach increased taxonomic resolu-tion and our ability to characterize patterns of stream in-sect diversity. However, we acknowledge several caveats inour study. First, our study was based only on numericallyabundant EPT taxa. These 3 insect orders constitute alarge proportion (∼75%) of the fauna in this region (Ward1986, Zuellig et al. 2012), and thus should be represen-tative of the community as a whole. However, Diptera isalso a numerically abundant order in Colorado mountainstreams. Diptera followed a richness trend similar to thatof Ephemeroptera and Trichoptera in a study by Ward(1986). Thus, the exclusion of Diptera should not affectour overall conclusions, but this hypothesis remains to betested using DNA barcoding. Second, our data reflect a sin-gle intensive sampling event in early summer. Ward (1986)pointed out that year-round sampling in Colorado streamswould not have an overall effect on relative taxon rich-ness of Ephemeroptera, but would add Trichoptera taxaat mid-elevations and would reveal more winter/spring-emerging Plecoptera, which had a hump-shaped richnesstrend when sampled at multiple times (Ward 1986). Thus,although sampling on 1 occasion limited the number oftaxa analyzed, the overall richness trend appears to bevalid, and year-round sampling probably would furtherincrease richness values only at mid-elevations.
Elevation rangesSpecies elevation distributions across the watersheds we
surveyed were similar to those reported by Ward (1986).However, some differences arose because of our methods.We probably underestimated elevation ranges for 2 rea-sons. First, we included only numerically abundant taxa,and elevation ranges might have been larger had we in-cluded vagrant individuals and low-density populationsat the margins of elevation ranges. Second, we barcodedonly 5 individuals per taxon per locality, so our abilityto detect true elevation ranges of rare cryptic taxa waslimited. However, our approach provided fine-scale taxo-nomic resolution by using barcoding when estimatingspecies-level elevation ranges.
In agreement with Ward’s study (1986), most Plecop-tera had broad elevation ranges. However, S. borealisgenerally was restricted to high-elevation sites and Triz-naka signata (Banks) was found only at lower-elevationsites. Like Ward (1986), we did not observe many broadlydistributed Trichoptera taxa. Arctopsyche grandis (Banks)and Hydropsyche spp. were restricted to high- and low-elevation sites, respectively. Diversity of Trichoptera waslow at low elevations, a result that could be related tostream size. We controlled for increasing stream size withdecreasing elevation, and the small wadeable streams inour study may support a lower diversity of Trichopterathan the larger low-elevation streams sampled in otherstudies. Ward (1986) commented on a progressive increasein richness of Ephemeroptera with decreasing elevation.In contrast, we found a variety of taxa with broad eleva-tion ranges that generally spanned mid-elevations, and de-creasing richness at low elevations, a finding likely to be re-lated to differences in community structure between smalland large low-elevation streams.
DNA barcoding significantly changed estimates of ele-vation ranges primarily because it increased our ability todetect taxa with small elevation ranges (Fig. 4). Thus,DNA barcoding increased our ability to estimate speciesdistributions and is a tool that may be particularly usefulfor describing diversity patterns in areas where the taxo-nomic composition of stream insect communities is poorlycharacterized.
Species turnoverBased on previous studies reporting loss of taxa with
increasing elevation, we expected to see increasing turn-over with elevation. However, we found no consistent in-crease in turnover of morphospecies or barcode taxa(Fig. 5A–C). High variation in turnover across elevationssuggests that compositional similarity at adjacent sitesmay not be determined by the position of taxa alongthese elevation gradients (Fig. 5A–C). Our results con-trast with our interpretation of previous studies that sug-gested high rates of turnover at mid to high elevations
Figure 6. Whittaker’s β-diversity as a function of meanelevation for sites of comparable elevation across the 3 water-sheds in the study area. The x-axis denotes the elevation classfor which β-diversity was calculated. A trend line is fitted to thebarcode-taxon data showing a marginally significant relation-ship between β-diversity and elevation.
Volume 33 March 2014 | 297
This content downloaded from 129.82.52.192 on Tue, 11 Mar 2014 17:33:47 PMAll use subject to JSTOR Terms and Conditions

(Allan 1975, Ward 1986). These discrepancies might beexplained by differences in sampling design because dif-ferences in stream size could lead to the appearance ofincreased turnover by confounding elevation and stream-size effects. We might have seen higher turnover at higherelevations had we included non-EPT species. However,we think it reasonable that the absence of a general trendin turnover could be explained by heterogeneous pattern-ing of aquatic insects across the landscape, resulting froma combination of limited dispersal ability, population struc-ture, and isolation by distance (Bilton et al. 2001, Bohonakand Jenkins 2003, Hughes et al. 2009, Patrick and Swan2011).
Turnover between adjacent sites within ecozones didnot differ from turnover between adjacent sites in differ-ent ecozones. These results indicate that communitiesdid not change any more at sites near ecozone transitionsthan at sites within ecozones, and by extension, that ter-restrial vegetation may not strongly influence communitycomposition. Allan (1975) found that vegetation zones onthe Western Slope of the Rockies did not affect faunalreplacement (as hypothesized by Dodds and Hisaw 1925).Turnover differed between morphospecies and barcodetaxa in 2 watersheds (CLP and BT), indicating that bar-coding can enhance our ability to interpret communityvariability.
β-diversityβ-diversity among communities in different water-
sheds (CLP, BT, SV) at comparable elevations tended tobe negatively related to elevation (Fig. 6), but the regres-sion slope for β-diversity of barcode taxa as a functionof elevation was only marginally different from 0. R2 val-ues for these regressions were moderately high and sug-gested more-homogeneous species composition amonghigher-elevation than among lower-elevation sites.We sam-pled only numerically abundant EPT taxa, so our findingssupport the idea that only a small number of these speciescan tolerate conditions at high elevations (Ward 1994),and therefore, only those taxa are found across all wa-tersheds at these elevations. Finn and Poff (2005) foundthat weedy traits, such as long-distance dispersal ability andhigh fecundity, were more common at high-elevation sites,a result indicating that species at high-elevation sites maybe filtered by possession of the functional traits necessaryfor survival in these environments (Poff 1997). In con-trast, a larger pool of potential taxa may inhabit lower-elevation streams (Ward 1986).
In contrast to our results, Finn and Poff (2005) foundthe lowest community similarity among high-elevationstreams. This difference between our results and theirsmay be a consequence of our use of DNA barcoding orof exclusion of rare taxa and insects from orders otherthan EPT. In addition, Finn and Poff (2005) sampled
streams of increasing order at lower elevations. Thus,changes in community composition with stream ordercomplicate a direct comparison between their results andours. Moreover, analysis of genetic population structuremay show different diversity patterns than analysis oftaxonomic community because high levels of genetic dif-ferentiation have been found at high elevations under sev-eral models of stream insect population structure (Hugheset al. 2009).
β-diversity of barcode taxa tended to be negatively re-lated to elevation and was significantly different than β-diversity of morphospecies. Thus, use of barcoding canchange β-diversity disproportionately to changes in α-diversity causing values of β-diversity to differ. Finer de-lineation of taxa may increase richness estimates andestimates of the degree of heterogeneity between com-munities at a regional scale, especially when barcodingdivides morphospecies into multiple taxa with differentelevation ranges.
ConclusionsOur study design and taxonomic approach provided
unique and ecologically important views of stream insectdiversity patterns across streams in the same region thatdiffer in elevation. Richness data showed strong evidencefor a hump-shaped trend (higher richness at mid-levelelevations) in numerically abundant EPT taxa richnessacross elevations. Elevation ranges of taxa were similar tothose reported previously, but generally were smaller.We found no consistent trend in species turnover, andβ-diversity of sites at comparable elevations in 3 adjacentwatersheds tended to be negatively related to elevation.
DNA barcoding was helpful in standardizing disparatelevels of taxonomic identification with species-level units.We found evidence that this tool can change how weinterpret trends in diversity. Taxon richness, the distribu-tion of elevation ranges, and similarity of communitiesin adjacent sites along ascending elevation transects andbetween sites at comparable elevations in different wa-tersheds differed significantly between analyses based onDNA barcoding and analyses based on morphospecies.We argue, as have others, that the approach we used couldbe even more informative in regions, such as the tropics,where the fauna is relatively unknown (Sweeney et al.2011).
ACKNOWLEDGEMENTSWe thank Associate Editor Bernard W. Sweeney and an an-
onymous referee for comments that improved this manuscript;Kayce Anderson for organizing field work and general support;Alisha Shah, Monica Paez, Dave Martin, and Joel Sholtes forfield assistance; Dave Ruiter and Joe Giersch for identificationsof Trichoptera; Dustin Gannon and Mengyan Li for molecular
298 | Rocky Mountain stream insect diversity B.A. Gill et al.
This content downloaded from 129.82.52.192 on Tue, 11 Mar 2014 17:33:47 PMAll use subject to JSTOR Terms and Conditions

work; Matt Pyne for assistance with data management and geo-graphic information system support; CCDB, BOLD, Xin Zhou,and Karl Kjer for assistance with methods; Deb Finn and theFunk–Hoke laboratory for discussions of our work; Ann Hessfor assistance with statistical analyses; and the staff of the Con-tinental Divide Research Learning Center, Rocky Mountain Na-tional Park (RMNP) for access to sites. This work was sup-ported by National Science Foundation award DEB-1046408(Dimensions: An integrative trait based approach to predictingvariation in vulnerability of tropical and temperate biodiversityto climate change). BAG is supported by a NSF Graduate Re-search Fellowship.
LITERATURE CITEDAllan, J. D. 1975. The distributional ecology and diversity of
benthic insects in Cement Creek, Colorado. Ecology 56:1040–1053.
Avise, J. C. 2000. Phylogeography: the history and formation ofspecies. Harvard University Press, Cambridge, Massachusetts.
Baird, D. J., and B. W. Sweeney. 2011. Applying DNA bar-coding in benthology: the state of the science. Journal ofthe North American Benthological Society 30:122–124.
Baird, D. J., T. J. Pascoe, X. Zhou, and M. Hajibabaei. 2011.Building freshwater macroinvertebrate DNA-barcode librar-ies from reference collection material: formalin preservationvs specimen age. Journal of the North American Bentho-logical Society 30:125–130.
Ball, S. L., P. D. N. Hebert, S. K. Burian, and J. M. Webb. 2009.Biological identifications of mayflies (Ephemeroptera) usingDNA barcodes. Journal of the North American Bentholog-ical Society 24:508–524.
Begon, M., J. L. Harper, and C. R. Townsend. 1990. Ecology: indi-viduals, populations and communities. Blackwell, Oxford, UK.
Bhattarai, K. R., and O. R. Vetaas. 2003. Variation in plantspecies richness of different life forms along a subtropicalelevation gradient in the Himalayas, East Nepal. Global Ecol-ogy and Biogeography 12:327–340.
Bilton, D. T., J. R. Freeland, and B. Okamura. 2001. Dispersal infreshwater invertebrates. Annual Review of Ecology and Sys-tematics 32:159–181.
Bohonak, A. J., and D. G. Jenkins. 2003. Ecological and evolu-tionary significance of dispersal by freshwater invertebrates.Ecology Letters 6:783–796.
Brewin, P. A., T. M. L. Newman, and S. J. Ormerod. 1995.Patterns of macroinvertebrate distribution in relation to alti-tude, habitat structure and land-use in streams of the Ne-palese Himalaya. Archiv für Hydrobiologie 135:79–100.
Brown, J. H. 1988. Species diversity. Pages 57–89 in A. A.Myers and P. S. Giller (editors). Analytical biogeography: anintegrated approach to the study of animal and plant distri-bution. Chapman and Hall, New York.
Brown, J. H., and A. C. Gibson. 1983. Biogeography. Mosby, StLouis, Missouri.
Colwell, R. K., and G. C. Hurtt. 1994. Nonbiological gradientsin species richness and a spurious Rapoport effect. Ameri-can Naturalist 144:570–595.
deWaard, J. R., N. V. Ivanova, M. Hajibabaei, and P. D. N.Hebert. 2008. Assembling DNA barcodes: analytical pro-
tocols. Pages 275–293 in C. C. Martin (editor). Environmen-tal genomics. Methods in molecular biology. Volume 410.Humana Press, Totowa, New Jersey.
Dodds, G. S., and F. L. Hisaw. 1925. Ecological studies onaquatic insects. IV. Altitudinal range and zonation of may-flies, stoneflies, and caddisflies in the Colorado Rockies.Ecology 6:380–390.
Finn, D. S., K. Khamis, and A. M. Milner. 2013. Loss of smallglaciers will diminish beta diversity in Pyrenean streams attwo levels of biological organization. Global Ecology and Bio-geography 22:40–51.
Finn, D. S., and N. L. Poff. 2005. Variability and convergence inbenthic communities along the longitudinal gradients offour physically similar Rocky Mountain streams. FreshwaterBiology 50:243–261.
Flowers, R. W. 1991. Diversity of stream-living insects in North-western Panama. Journal of the North American Benthologi-cal Society 10:322–334.
Folmer, O., M. Black, W. Hoeh, R. Lutz, and R. Vrijenhoek.1994. DNA primers for amplification of mitochondrial cyto-chrome c oxidase subunit I from diverse metazoan inver-tebrates. Molecular Marine Biology and Biotechnology 3:294–299.
Grubaugh, J. W., J. B. Wallace, and E. S. Houston. 1996. Longi-tudinal changes of macroinvertebrate communities along anAppalachian stream continuum. Canadian Journal of Fisher-ies and Aquatic Sciences 53:896–909.
Hajibabaei, M., J. R. deWaard, N. V Ivanova, S. Ratnasingham,R. T. Dooh, S. L. Kirk, P. M. Mackie and P. D. N. Hebert.2005. Critical factors for assembling a high volume of DNAbarcodes. Philosophical Transactions of the Royal Society ofLondon Series B: Biological Sciences 360:1959–1967.
Hebert, P. D. N., A. Cywinska, S. L. Ball, and J. R. deWaard.2003. Biological identifications through DNA barcodes. Pro-ceedings of the Royal Society of London Series B: BiologicalSciences 270:313–321.
Hebert, P. D. N., E. H. Penton, J. M. Burns, D. H. Janzen, andW. Hallwachs. 2004. Ten species in one: DNA barcodingreveals cryptic species in the neotropical skipper butterflyAstraptes fulgerator. Proceedings of the National Academy ofSciences of the United States of America 101:14812–14817.
Hughes, J. M., D. J. Schmidt, and D. S. Finn. 2009. Genes instreams: using DNA to understand the movement of fresh-water fauna and their riverine habitat. BioScience 59:573–583.
Ivanova, N. V., J. R. deWaard, M. Hajibabaei, and P. D. N. Hebert.2005. Protocols for high volume DNA barcoding. Draft sub-mission to: DNA working group Consortium for the Barcodeof Life. Consortium for the Barcode of Life, Washington,DC. (Available online from: http://www.dnabarcoding.ca/)
Ivanova, N. V., J. R. deWaard, and P. D. N. Hebert. 2006. An in-expensive, automation-friendly protocol for recovering high-quality DNA. Molecular Ecology Notes 6:998–1002.
Jacobsen, D. 2003. Altitudinal changes in diversity of macro-invertebrates from small streams in the Ecuadorian Andes.Archiv für Hydrobiologie 158:145–167.
Jacobsen, D. 2004. Contrasting patterns in local and zonal fam-ily richness of stream invertebrates along an Andean altitu-dinal gradient. Freshwater Biology 49:1293–1305.
Volume 33 March 2014 | 299
This content downloaded from 129.82.52.192 on Tue, 11 Mar 2014 17:33:47 PMAll use subject to JSTOR Terms and Conditions

Jacobsen, D., R. Schultz, and A. Encalada. 1997. Structure anddiversity of stream invertebrate assemblages: the influence oftemperature with altitiude and latitude. Freshwater Biology38:247–261.
Janzen, D. H., V. M. Ataro, M. Farinas, S. Reyes, N. Rincon, A.Soler, P. Soriano, and M. Vera. 1976. Changes in the arthro-pod community along an elevational transect in the Vene-zuelan Andes. Biotropica 8:193–203.
Kimura, M. 1980. A simple method for estimating evolution-ary rates of base substitutions through comparative studiesof nucleotide sequences. Journal of Molecular Evolution16:111–120.
Kjer, K. M., R. J. Blahnik, and R. W. Holzenthal. 2001. Phylogenyof Trichoptera (caddisflies): characterization of signal andnoise within multiple datasets. Systematic Biology 50:781–816.
Koleff, P., K. J. Gaston, and J. J. Lennon. 2003. Measuring betadiversity for presence-absence data. Journal of Animal Ecol-ogy 72:367–382.
Lang, C., and O. Reymond. 1993. Empirical relationships be-tween diversity of invertebrate communities and altitude inrivers: application to biomonitoring. Aquatic Sciences 55:188–196.
MacArthur, R. H. 1972. Geographical ecology. Harper andRow, New York.
Mena, J. L., and E. Vázquez-Domínguez. 2005. Species turnoveron elevational gradients in small rodents. Global Ecology andBiogeography 14:539–547.
Merritt, R. W., K. W. Cummins, and M. B. Berg (editors). 2008.An introduction to the aquatic insects of North America.4th edition. Kendall/Hunt, Dubuque, Iowa.
Meyer, C. P. 2003. Molecular systematics of cowries (Gastro-poda: Cypraeidae) and diversification patterns in the tropics.Biological Journal of the Linnean Society 79:401–459.
Minshall, G. W., R. C. Petersen, and C. F. Nimz. 1985. Speciesrichness in streams of different size from the same drainagebasin. American Naturalist 125:16–38.
Monaghan, K. A., M. R. Peck, P. A. Brewin, M. Masiero, E. Zarate,P. Turcotte, and S. J. Ormerod. 2000. Macroinvertebrate dis-tribution in Ecuadorian hill streams: effects of altitude andland use. Archiv für Hydrobiologie 149:421–440.
Ormerod, S. J., S. D. Rundle, S. M. Wilkinson, G. P. Daly, K. M.Dale, and I. Juttner. 1994. Altitudinal trends in the diatoms,bryophytes, macroinvertebrates and fish of a Nepalese riversystem. Freshwater Biology 32:309–322.
Pauls, S. U., R. J. Blahnik, X. Zhou, C. T. Wardwell, and R. W.Holzenthal. 2010. DNA barcode data confirm new speciesand reveal cryptic diversity in Chilean Smicridea (Smicridea)(Trichoptera: Hydropsychidae). Journal of the North Ameri-can Benthological Society 29:1058–1074.
Patrick, C. J., and C. M. Swan. 2011. Reconstructing the assem-bly of a stream-insect metacommunity. Journal of North Amer-ican Benthological Society 30:259–272.
Pearson, R. G., and L. Boyero. 2009. Gradients in regional diversityof freshwater taxa. Journal of North American Benthologi-cal Society 28:504–514.
Peattie, R. 1936. Mountain geography: a critique and field study.Greenwood Press, New York.
Perry, J. A., and D. J. Schaeffer. 1987. The longitudinal distribu-tion of riverine benthos: a river dis-continuum? Hydrobiolo-gia 148:257–268.
Poff, N. L. 1997. Landscape filters and species traits: towardsmechanistic understanding and prediction in stream ecol-ogy. Journal of the North American Benthological Society16:391–409.
Rahbek, C. 1995. The elevational gradient of species richness:a uniform pattern? Ecography 18:200–205.
Rahbek, C. 1997. The relationship among area, elevation, andregional species richness in neotropical birds. American Nat-uralist 149:875–902.
Ratnasingham, S., and P. D. N. Hebert. 2007. BOLD: the Barcodeof Life Data System (http://www.barcodinglife.org). Molecu-lar Ecology Notes 7:355–364.
Stevens, G. C. 1989. The latitudinal gradient in geographicalrange: how so many species coexist in the tropics. AmericanNaturalist 133:240–256.
Stevens, G. 1992. The elevational gradient in altitudinal range:an extension of Rapoport’s latitudinal rule to altitude. Amer-ican Naturalist 140:893–911.
Suren, A. M. 1994. Macroinvertebrate communities of streamsin Western Nepal: effects of altitude and land-use. Freshwa-ter Biology 32:323–336.
Sweeney, B. W., J. M. Battle, J. K. Jackson, and T. Dapkey. 2011.Can DNA barcodes of stream macroinvertebrates improvedescriptions of community structure and water quality? Jour-nal of the North American Benthological Society 30:195–216.
Tamura, K., D. Peterson, N. Peterson, G. Stecher, M. Nei, andS. Kumar. 2011. MEGA5: molecular evolutionary geneticsanalysis using maximum likelihood, evolutionary distance,and maximum parsimony methods. Molecular Biology andEvolution 28:2731–2739.
Tate, C. M., and J. S. Heiny. 1995. The ordination of benthicinvertebrate communities in the South Platte River Basin inrelation to environmental factors. Freshwater Biology 33:439–454.
Tuomisto, H. 2010. A diversity of beta diversities: straighteningup a concept gone awry. Part 1. Defining beta diversity as afunction of alpha and gamma diversity. Ecography 33:2–22.
Vannote, R. L., G. W. Minshall, K. W. Cummins, J. R. Sedell,and C. E. Cushing. 1980. The River Continuum Concept.Canadian Journal of Fisheries and Aquatic Sciences 37:130–137.
Vinson, M. R., and C. P. Hawkins. 1998. Biodiversity of streaminsects: variation at local, basin, and regional scales. AnnualReview of Entomology 43:271–293
Vinson, M. R., and C. P. Hawkins. 2004. Broad-scale geographi-cal patterns in local stream insect genera richness. Ecography26:751–767
Ward, J. V. 1986. Altitudinal zonation in a Rocky Mountainstream. Archiv für Hydrobiologie Supplement 74:133–199.
Ward, J. V. 1994. Ecology of Alpine streams. Freshwater Biology32: 277–294.
Ward, J. V., B. C. Kondratieff, and R. E. Zuellig. 2002. An il-lustrated guide to the mountain stream insects of Colorado.University Press of Colorado, Boulder, Colorado.
300 | Rocky Mountain stream insect diversity B.A. Gill et al.
This content downloaded from 129.82.52.192 on Tue, 11 Mar 2014 17:33:47 PMAll use subject to JSTOR Terms and Conditions
Ward, R. D., T. S. Zemlak, B. H. Innes, P. R. Last, and P. D. N.Hebert. 2005. DNA barcoding Australia’s fish species. Philo-sophical Transactions of the Royal Society of London SeriesB: Biological Sciences 360:1847–1857.
Wilson, M. V., and A. Shmida. 1984. Measuring beta diversitywith presence-absence data. Journal of Ecology 72:1055–1064.
Whittaker, R. H. 1960. Vegetation of the Siskiyou Moun-tains, Oregon and California. Ecological Monographs 30:279–338.
Whittaker, R. H. 1972. Evolution and measurements of speciesdiversity. Taxon 21:213–251.
Zhou, X., S. J. Adamowicz, L. M. Jacobus, R. E. DeWalt, andP. D. N. Hebert. 2009. Towards a comprehensive barcodelibrary for arctic life - Ephemeroptera, Plecoptera, and Tri-choptera of Churchill, Manitoba, Canada. Frontiers in Zool-ogy 6:30.
Zhou, X., L. M. Jacobus, R. E. DeWalt, S. J. Adamowicz, andP. D. N. Hebert. 2010. Ephemeroptera, Plecoptera, andTrichoptera fauna of Churchill (Manitoba, Canada): in-
sights into biodiversity patterns from DNA barcoding.Journal of the North American Benthological Society 29:814–837.
Zhou, X., K. M. Kjer, and J. C. Morse. 2007. Associating larvaeand adults of Chinese Hydropsychidae caddisflies (Insecta:Trichoptera) using DNA sequences. Journal of the NorthAmerican Benthological Society 26:719–742.
Zhou, X., J. L. Robinson, C. J. Geraci, C. R. Parker, O. S. Flint, D.Etnier, D. Ruiter, R. E. DeWalt, L. M. Jacobus, and P. D. N.Hebert. 2011. Accelerated construction of a regional DNA-barcode reference library: caddisflies (Trichoptera) in theGreat Smoky Mountains National Park. Journal of the NorthAmerican Benthological Society 30:131–162.
Zuellig, R. E., B. D. Heinold, B. C. Kondratieff, and D. E. Ruiter.2012. Diversity and distribution of mayflies (Ephemerop-tera), stoneflies (Plecoptera), and caddisflies (Trichoptera)of the South Platte River Basin, Colorado, Nebraska, andWyoming, 1873-2010. U.S. Geological Survey Data Series606. US Geological Survey, Reston, Virginia.
Volume 33 March 2014 | 301
This content downloaded from 129.82.52.192 on Tue, 11 Mar 2014 17:33:47 PMAll use subject to JSTOR Terms and Conditions