Embed Size (px)
Citation preview

Building the futureTM
2005 ANNUAL REPORT
growing
ON

Exchange listings Bolsa Mexicana de Valores (BMV), Mexico New York Stock Exchange (NYSE), United States Share series CPO (representing two A shares and one B share) ADR (representing ten CPOs)
BMV ticker symbol CEMEX CPO
NYSE ticker symbol CX
Media relations contact [email protected] Phone: (52-81) 8888-4334 Fax: (52-81) 8888-4417
Investor relations [email protected] From the US: 1 877 7CX NYSE From other countries: (212) 317-6000 Fax: (212) 317-6047
informationinvestor and media
Headquarters Av. Ricardo Margáin Zozaya 325 CP 66265 San Pedro Garza García, N.L. México Phone: (52-81) 8888-8888 Fax: (52-81) 8888-4417
Mexico City office Av. Presidente Masarik 101 - 18 CP 11570 México, D.F. México Phone: (52-55) 5726-9040 Fax: (52-55) 5203-2542
New York office 590 Madison Ave., 41st floor New York, NY 10022 USA Phone: (212) 317-6000 Fax: (212) 317-6047
Web addresswww.cemex.com
The information presented herein contains certain forward-looking statements and information relating to CEMEX, S.A. de C.V. and its subsidiaries (collectively, “CEMEX”) that are based on the beliefs of its management as well as assumptions made by and information currently available to CEMEX. Such statements reflect the current views of CEMEX with respect to future events and are subject to certain risks, uncertainties, and assumptions. Many factors could cause the actual results, performance, or achievements of CEMEX to be materially different from any future results, performance, or achievements that may be expressed or implied by such forward-looking statements, including, among others, changes in general economic, political, governmental, and business conditions globally and in the countries in which CEMEX does business; changes in interest rates; changes in inflation rates; changes in exchange rates; the level of construction generally; changes in cement demand and prices; changes in raw material and energy prices; changes in business strategy; and various other factors. Should one or more of these risks or uncer-tainties materialize, or should underlying assumptions prove incorrect, actual results may vary materially from those described herein as anticipated, believed, estimated, or expected. CEMEX does not intend, and does not assume any obligation, to update these forward-looking statements. In addition, certain information presented herein was extracted from information published by various official sources. This information includes statistical information relating to the cement industry, certain reported rates of inflation, exchange rates, and information relating to the countries in which CEMEX operates. CEMEX has not participated in the preparation or compilation of any of such information and accepts no responsibility therefor.de
sign
: si
gni |
pho
to: H
. H
erre
ra -
M. G
reen
- an
d ot
hers
| pr
intin
g w
etm
ore
… and

… and

Table of contents
4 | Financial highlights
6 | To our shareholders
10 | Improvement and innovation
12 | Track record of growth
14 | Culture of growth
16 | Opportunity space for growth
18 | Selected fi nancial information
20 | Management discussion and analysis
33 | Financial statements
80 | Management team
82 | The terms we use
83 | Investor and media information

As we commemorate our
100th anniversary, we
are optimistic about the
prospects that lie ahead
of us. We have the people,
the culture, and the
opportunities to continue
on our path of disciplined,
profi table growth.
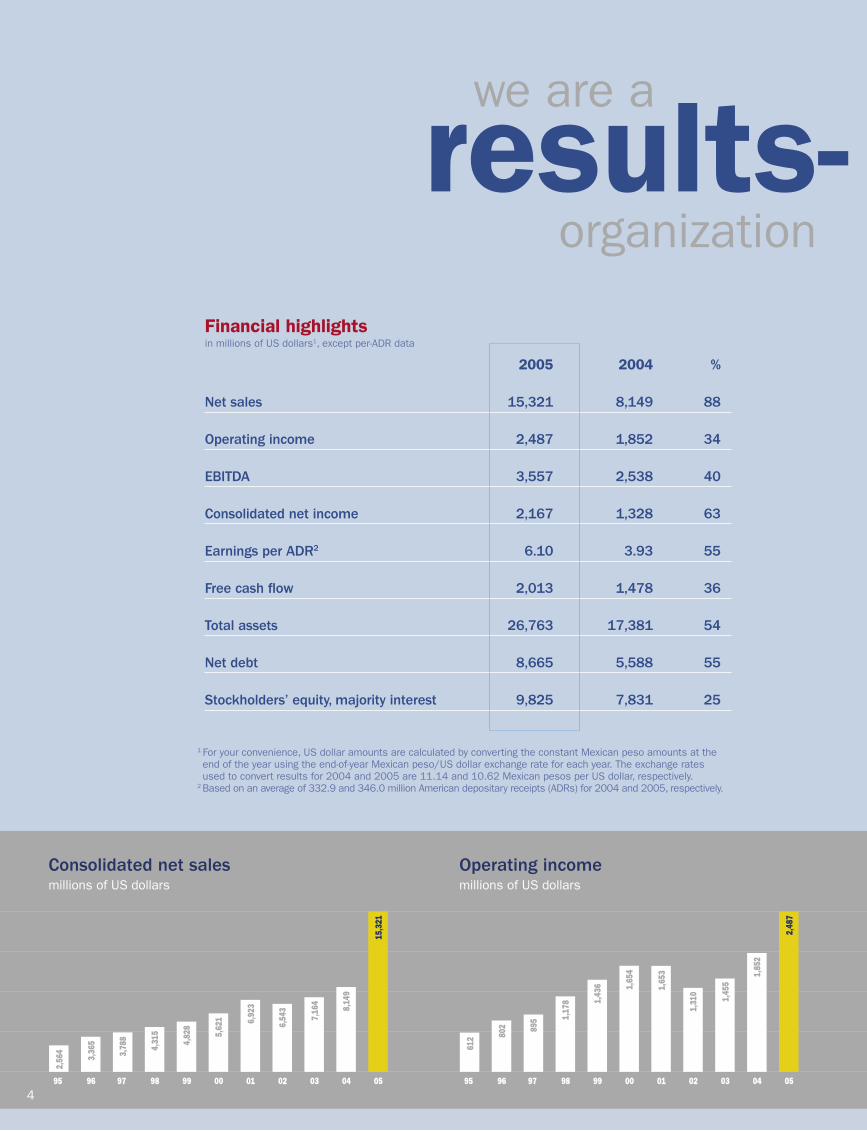
Financial highlights
2005 2004 %
Net sales 15,321 8,149 88
Operating income 2,487 1,852 34
EBITDA 3,557 2,538 40
Consolidated net income 2,167 1,328 63
Earnings per ADR2 6.10 3.93 55
Free cash flow 2,013 1,478 36
Total assets 26,763 17,381 54
Net debt 8,665 5,588 55
Stockholders’ equity, majority interest 9,825 7,831 25
Consolidated net salesmillions of US dollars
Operating incomemillions of US dollars
we are a
organizationresults- oriented
4 95 96 97 98 99 00 01 02 03 04 05
15,3
21
8,14
9
7,16
4
6,54
3
6,92
3
5,62
1
4,82
8
4,31
5
3,78
8
3,36
5
2,56
4
95 96 97 98 99 00 01 02 03 04 05
2,48
7
1,85
2
1,45
5
1,31
0
1,65
3
1,65
4
1,43
6
1,17
8
895
802
612
in millions of US dollars1, except per-ADR data
1 For your convenience, US dollar amounts are calculated by converting the constant Mexican peso amounts at the end of the year using the end-of-year Mexican peso/US dollar exchange rate for each year. The exchange rates used to convert results for 2004 and 2005 are 11.14 and 10.62 Mexican pesos per US dollar, respectively.
2 Based on an average of 332.9 and 346.0 million American depositary receipts (ADRs) for 2004 and 2005, respectively.

Free cash flowmillions of US dollars
Total assetsmillions of US dollars
2005 relevant events
March
CEMEX concludes the US$5.8 billion acquisition of RMC Group, one of Europe’s largest producers of cement and aggregates and the world’s largest supplier of ready-mix concrete.
June Ninety-two percent of CEMEX shareholders elect to receive stock (CPOs) under the company’s stock-dividend program.
October CEMEX completes a nondilutive equity offering in which 31 million CEMEX ADRs are sold for US$1.5 billion.
December After the completion of the RMC acquisition, CEMEX reduces its net debt by almost US$1.8 billion over the last three quarters of 2005.
On December 14, CEMEX stock hits a high of US$61.27 per ADR.
organizationresults- oriented
5 95 96 97 98 99 00 01 02 03 04 05
1,47
8
1,14
3
9481,
145
886
860
559
383
149
(31)
95 96 97 98 99 00 01 02 03 04 05
26,7
63
17,3
81
16,0
16
15,9
34
16,2
30
15,7
59
11,8
64
10,4
60
10,2
31
9,94
2
8,37
0
2,01
3

growthdisciplined
Dear fellow stockholders:
The year 2005 was very important for CEMEX. With the acquisition of RMC, we literally doubled in size. We signifi cantly extended our business along our industry’s value chain. We executed the largest, fastest, and most success-ful integration we have ever attempted, creating considerable shareholder value in the process. And we produced record operating results.
Our numbers speak for themselves:
> Our sales reached US$15.3 billion, a compounded annual growth rate of 22 percent over the past 20 years, and we produced operating cash fl ow of US$3.6 billion, a 20-year compounded annual growth rate of 21 percent.
> We sold approximately 81 million metric tons of cement, 70 million cubic meters of ready-mix concrete, and 160 million metric tons of aggregates, as well as signifi cant volumes of other products for many thousands of customers in more than 50 countries. We reached those customers through a robust mix of traditional distribution channels, our own and our wholesalers’, including multiproduct storefronts, mobile telephones, the Internet, and other innovative platforms. And we provided them with a broad array of services designed to help them complete their construction projects, on time and on budget.
> We expanded our operations in Europe, in particular the United Kingdom, France, Germany, and Eastern Europe; signifi cantly increased our footprint in the United States; and acquired promising operations in Malaysia and several other countries through our acquisition of RMC. We succeeded in
6

Lorenzo H. Zambrano
CX
S&P 500 Index
CX vs. S&P 500 Index (total cumulative return)
By the end of 2005, our stock had outperformed the S&P 500 Index by more than 200 percentage points since we fi rst listed our shares on the NYSE in September of 1999.
7
0
-50
-100
9/99 12/00 12/01 12/02 12/03 12/04 12/05
50
100
150
200
250
We are committed to producing profi table growth
for our stockholders through the disciplined
execution of our business strategy.

01 02 03 04 05
Earnings per ADR1
In 2005 our earnings per ADR rose 55% to US$6.10 from US$3.93 in 2004. This gain was driven mainly by our strong operating performance and our consoli-dation of RMC Group.
retaining the great bulk of RMC’s talent, and today we employ more than 50,000 people worldwide. This means we are developing our most impor-tant asset—our people—as we grow our business.
There is no great magic underlying this performance, only a continuing commit-ment to producing profitable growth for our stockholders through the disciplined execution of our business strategy. In essence, that means we constantly strive to achieve operational excellence at the lowest possible cost and to provide our customers with innovative solutions to their building materials needs.
By following this strategy, I am confident that we will also continue to achieve the kinds of results that we produced in 2005 and that you have come to expect from CEMEX.
CEMEX is a growth company. I do not, however, believe in growth for its own sake. We don’t grow to get bigger; we grow to create value for our stockholders.
Our return on capital employed has consistently—and by a widening mar-gin—exceeded our cost of capital. Our two largest acquisitions, Southdown and RMC, both made in the past decade, were immediately accretive to stockholders’ interests. We have significantly and steadily increased our free-cash-flow generation while strengthening our balance sheet. Since we first listed on the New York Stock Exchange in 1999, the total return on our stock has grown at a compounded annual growth rate of more than 20 percent, with increasing dividends.
The highlight of the year was the acquisition and integration of RMC. The March 1 closing of the transaction kicked off the largest and most complex integration process in our history, involving thousands of employees spread across more than 20 countries, speaking more than a dozen languages, and operating in different segments of the business.
During that process, we identified and documented recurring synergies of US$360 million, including US$260 million in Europe and US$100 million in the United States, that we will fully realize in 2007. Eighty percent of these synergies have come from changing processes, repositioning business opera-tions, and implementing our management platforms and systems—in other words, from sources other than headcount reductions.
In fact, the underlying story of the RMC integration has been repositioning good businesses and keeping good employees. Retaining RMC talent is critical to our future.
The ultimate financial measure of the success of the RMC acquisition is our ability to meet our announced objective to produce a return on capital
8
4.14
1.74 1.
99
3.93
6.10
1 The average number of ADRs outstanding used for the calculation of earnings per ADR was 346.0 million for full-year 2005, 332.9 million for full-year 2004, 315.2 million for full-year 2003, 299.2 million for full-year 2002, and 284.4 million for full-year 2001.

employed of at least 10 percent before the end of 2006. That is a full year earlier than that to which we committed when we fi rst announced the trans-action. What’s more, it is a tribute to the hard work of the integration teams and the commitment of CEMEX’s newest employees.
Of course, our performance in 2005 benefi ted from the ongoing strength of the US economy—the United States is now CEMEX’s largest market in rev-enue terms—as well as healthy economies in many other parts of the world. We will continue to take full advantage of the strong economic tailwinds while they last. Yet we know that one of the keys to managing a business for long-term value creation is to reduce, as much as possible, vulnerability to cyclical downturns. At CEMEX we do that through a constant focus on keeping costs down and improving our performance through geographic diversifi cation, by positioning ourselves across our industry’s value chain, and by making highly selective investments in existing businesses.
We will continue to invest signifi cant resources in order to grow our existing markets. We will do so as part of a highly disciplined, return-driven process that ensures that our discretionary capital investments are aligned with our corporate objectives and help increase our profi tability.
I am sure that we will fi nd additional opportunities that meet our strict invest-ment criteria for sustaining our rapid and profi table growth. I assure you that, as these opportunities arise, we will apply the same rigor and discipline as we did with RMC—and aim for equivalent, or even better, results.
In the meantime, we will continue to devote our free cash fl ow to enhance the profi tability of our existing operations and improve our fi nancial fl exibility. At the beginning of 2005, we committed to using most of our free cash fl ow to reduce debt—and we delivered. After completing the acquisition of RMC on March 1, we reduced our leverage ratio, as measured by net debt to trailing-twelve-month, pro-forma EBITDA, from 3.2 times to 2.4 times in December 2005. This is the kind of fi nancial discipline and performance you can continue to expect from us.
During 2006 CEMEX will celebrate its fi rst 100 years, an important milestone in any company’s history. I am proud of the value we have created over the years for our shareholders, customers, employees, and communities and in our industry.
Looking forward, we are enthusiastic about the challenges and opportunities that await us. We are a company with an important past but an even more promising future. As we continue on our path of disciplined, profi table growth, we welcome you to come along with us.
Sincerely,
Lorenzo H. ZambranoChairman of the Board and Chief Executive Offi cer
9
22%sales compounded
annual growth rate over the past 20 years
5,0
00
1,0
00
2
,00
0
3,0
00
10
,00
0
15
,00
0
5,0
00
1,0
00
2
,00
0
3,0
00
10
,00
0
15
,00
0
85 86 87 88 89 90 91 92 93 94 95 96 97 98 99 00 01 02 03 04 05
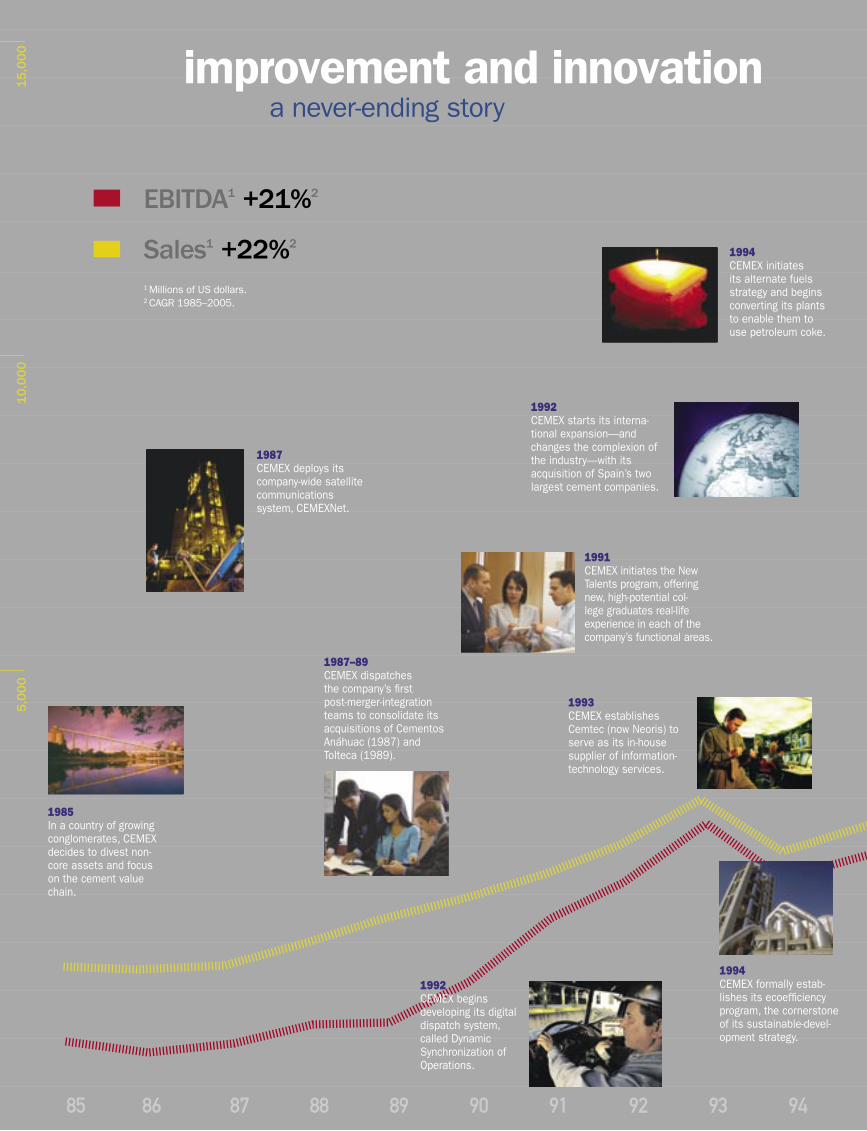
EBITDA1 +21%2
Sales1 +22%2
1 Millions of US dollars.2 CAGR 1985–2005.
improvement and innovation a never-ending story
1993CEMEX establishes Cemtec (now Neoris) to serve as its in-house supplier of information-technology services.
1994CEMEX formally estab-lishes its ecoefficiency program, the cornerstone of its sustainable-devel-opment strategy.
1991CEMEX initiates the New Talents program, offering new, high-potential col-lege graduates real-life experience in each of the company’s functional areas.
1985In a country of growing conglomerates, CEMEX decides to divest non-core assets and focus on the cement value chain.
1987CEMEX deploys its company-wide satellite communications system, CEMEXNet.
1987–89CEMEX dispatches the company’s first post-merger-integration teams to consolidate its acquisitions of Cementos Anáhuac (1987) and Tolteca (1989).
1992CEMEX starts its interna-tional expansion—and changes the complexion of the industry—with its acquisition of Spain’s two largest cement companies.
1994CEMEX initiates its alternate fuels strategy and begins converting its plants to enable them to use petroleum coke.
1992CEMEX begins developing its digital dispatch system, called Dynamic Synchronization of Operations.

5,0
00
1,0
00
2
,00
0
3,0
00
10
,00
0
15
,00
0
5,0
00
1,0
00
2
,00
0
3,0
00
10
,00
0
15
,00
0
85 86 87 88 89 90 91 92 93 94 95 96 97 98 99 00 01 02 03 04 05
2005CEMEX acquires RMC Group, doubling the company’s size and considerably enhancing the company’s business across the industry’s value chain.
1999CEMEX lists on the New York Stock Exchange (NYSE) under the ticker symbol “CX.”
1995CEMEX launches its corporate website to facilitate stakeholder communications.
1999CEMEX develops its special antibacterial concrete for facilities requiring a germ-free environment.
2001CEMEX rolls out its Construrama com-mercial network, which by year-end grows into Mexico’s largest construction-materials chain.
1998CEMEX establishes Patrimonio Hoy, the company’s flagship initiative to facilitate and expedite home building for low-income families.
2001CEMEX initiates online customer service, enabling clients to place orders, purchase products, and access services electronically.
2003CEMEX launches its company-wide procurement process and global sourcing office for consolidated international negotiations.
2000The company launches its CEMEX Way initiative to identify, incorporate, and execute standardized best practices throughout the organization.
2000The company’s acquisition and integration of US-based Southdown provides CEMEX with a better-diversified portfolio and a stronger platform on which to grow.

12
11%
average return on capital employed over the past fi ve
years

recordour track
of growth
Our record of growth is unparalleled in our industry. Twenty years ago, we employed 6,500 people, operated only in Mexico, and had the capacity to produce 8 million metric tons of cement annually. We generated revenue of US$275 million and EBITDA of US$84 mil-lion—and that was a good year!
Today we are one of the largest integrated building-solutions com-panies in the world. We employ more than 50,000 people, operate in more than 50 countries, and each year produce 160 million metric tons of aggregates and 70 million cubic meters of ready-mix concrete and have the capacity to produce 98 million metric tons of cement. We also enjoy strong positions across other segments of our industry’s value chain.
More importantly, we have the proven capacity to prosper through economic upturns and downturns—we produce consistently good results in bad times and great results in good times. Over the past 20 years, we have increased our sales and EBITDA at compounded annual growth rates of 22 percent and 21 percent to US$15.3 bil-lion and US$3.6 billion, respectively.
We have also delivered consistently superior returns to our stock-holders. Since we fi rst listed our shares on the NYSE in September 1999, the total compounded annual return of our stock has aver-aged more than 20 percent per year. In addition, we have realized an average return on capital employed of over 11 percent for the past fi ve years.
The numbers, though, tell only part of our story. We have the people, the culture, and the opportunities to continue our record of disci-plined, profi table growth.
13

culture of growth
Our quick, smooth, and systematic integration of RMC Group’s international operations network illustrates how different cul-tures can collaborate and turn common challenges into shared accomplishments. By focusing its efforts on clearly defi ned targets, our team of more than 500 executives—from more than 17 countries—completed phase one of the consolidation process ahead of schedule and simultaneously assured continu-ity of service to our customers.
Among the keys to our team’s success thus far have been its preparedness, discipline, and teamwork. Well before we close an acquisition, we assemble and train a multinational, multicul-tural team of professionals—from accountants to engineers to information-technology analysts. This team studies the new op-erations and identifi es talent, best practices, and opportunities for improvement. This information enables us to cultivate strong relationships with our new colleagues, rapidly integrate our new operations, and ensure unwavering service to our customers.
As is our practice, we have also identifi ed, shared, and imple-mented best practices—ours as well as those of our new opera-tions—throughout our expanded organization. Consequently, in addition to the more than US$360 million of synergies that we have detected, we have identifi ed numerous best practices for the benefi t of our whole organization. These practices include our German plants’ extensive use of alternative fuels, our UK operations’ profi table quarry-rehabilitation programs, and the distinctive logistics system of our French aggregates business.
“More with less” is a core element of our corporate philoso-phy. This approach is evident in our team’s turnaround of the UK-based Rugby plant. In 90 days, the team improved the effi ciency of this modern facility from 74 percent to 90 percent and allowed us to produce an additional 500,000 metric tons of cement and reduce our cement imports into the United Kingdom.
14
culture

15
90
days to improve the effi ciency of our
UK-based Rugby plant from 74%
to 90%

16
opportunityspace for growth
Our growing use of alternative fuels benefi ts our
company and our communities. By consuming
more of our communities’ waste, we reduce our
energy cost and environmental impact.

In a consolidating global industry, our larger scale, wider geographic reach, and greater vertical integration position us to grow more profi tably, better serve our customers, and generate greater value for all of our stakeholders.
We see considerable opportunities for growth within our global portfolio. For ex-ample, our presence in Central and Eastern European markets such as Poland, the Czech Republic, and Hungary positions us to capture the growing demand for cement and related products, especially as these countries’ convergence with the European Union accelerates. In addition, our increased geographic diversifi cation in Europe, North America, and Asia enhances our cash-fl ow stability, strengthens our balance sheet, and gives us the fi nancial fl exibility to expand our positions across the value chain.
Our wider, more vertically integrated portfolio of assets offers opportunities to deepen and grow our customer relationships. In the United States and Europe, ready-mix concrete is the main distribution channel for aggregates and cement. Our stronger position in this key business segment puts us closer to our cus-tomers, where we can leverage the knowledge we gain to enhance our relation-ships as their needs grow. For example, in the United States, our broader array of products—we now produce 250 million concrete blocks each year—and our superior geographic coverage enable us to meet national customers’ demand for a one-stop solution and provide reliable and convenient service across the country.
We are continually improving and adding to the opportunities available to our employees. Among other advantages, our global scale and diversity give em-ployees at all levels of our organization opportunities to interact with different cultures and nationalities, exposure to a broader spectrum of disciplines, and greater potential for international assignments and career advancement.
17
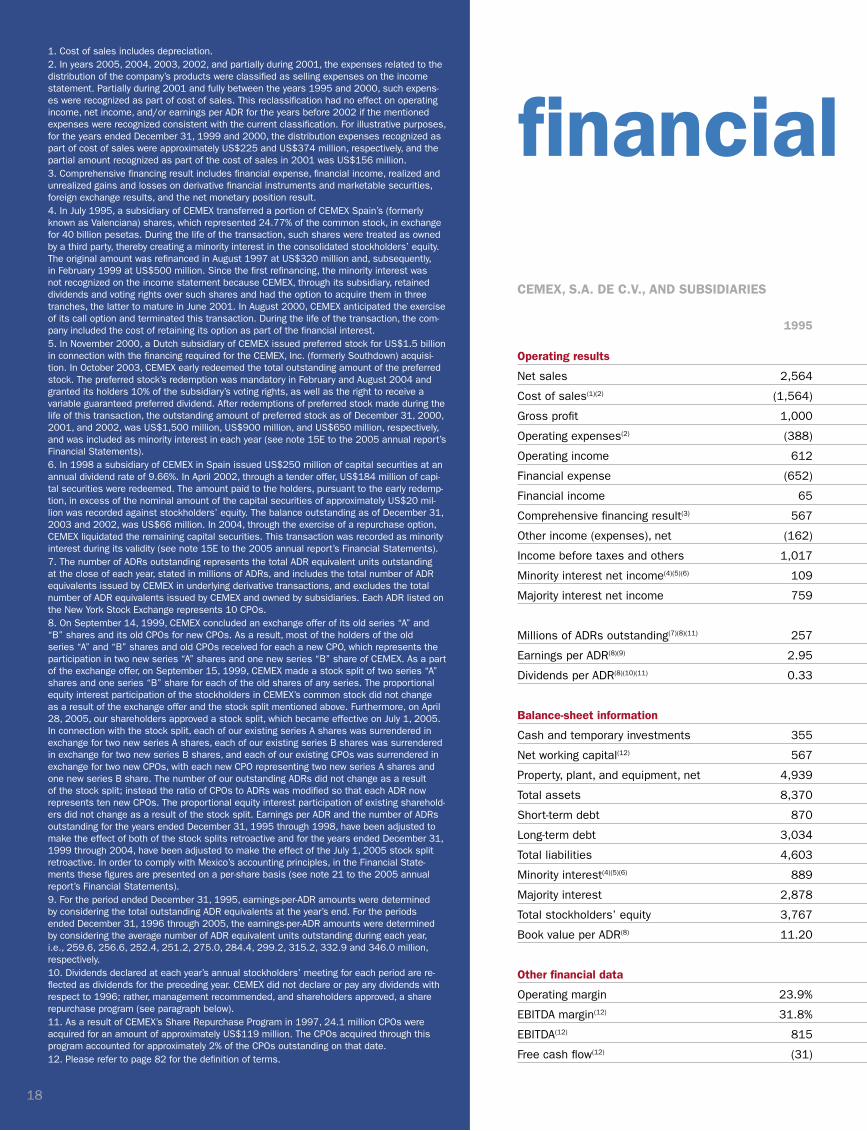
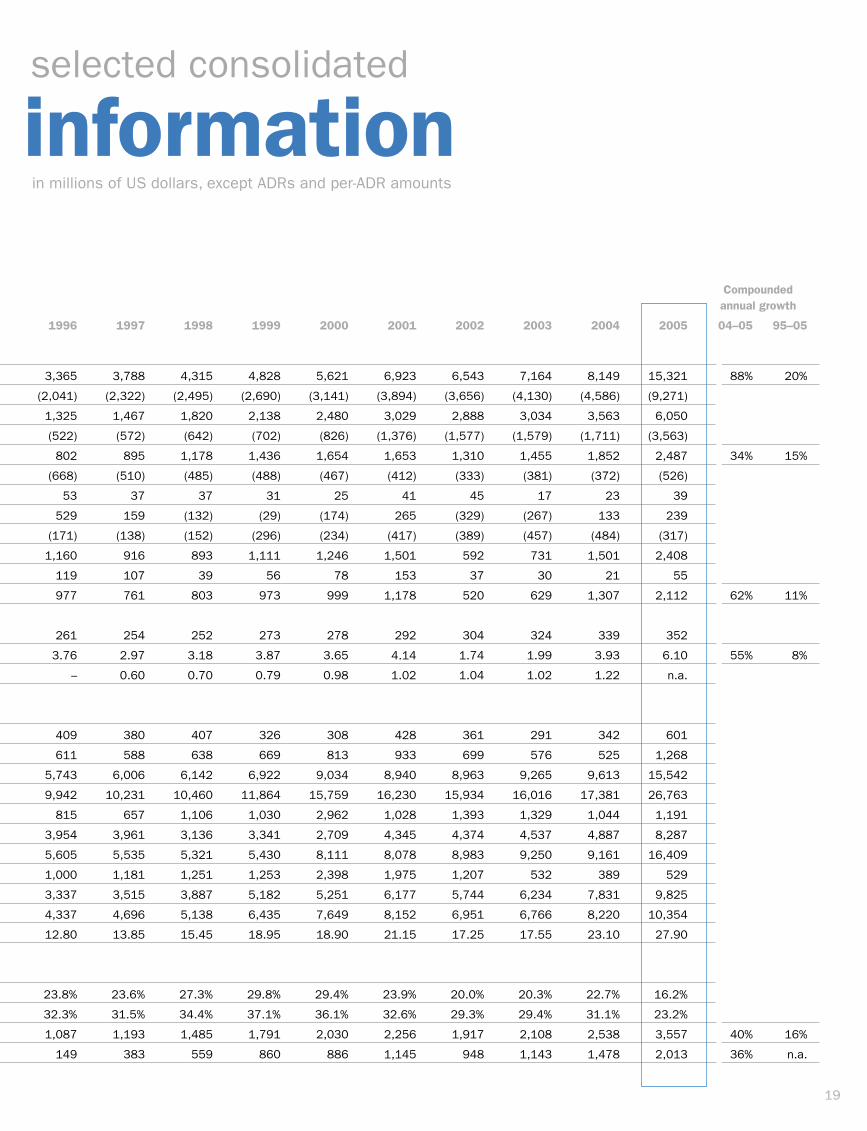
1. Cost of sales includes depreciation.2. In years 2005, 2004, 2003, 2002, and partially during 2001, the expenses related to the distribution of the company’s products were classified as selling expenses on the income statement. Partially during 2001 and fully between the years 1995 and 2000, such expens-es were recognized as part of cost of sales. This reclassification had no effect on operating income, net income, and/or earnings per ADR for the years before 2002 if the mentioned expenses were recognized consistent with the current classification. For illustrative purposes, for the years ended December 31, 1999 and 2000, the distribution expenses recognized as part of cost of sales were approximately US$225 and US$374 million, respectively, and the partial amount recognized as part of the cost of sales in 2001 was US$156 million.3. Comprehensive financing result includes financial expense, financial income, realized and unrealized gains and losses on derivative financial instruments and marketable securities, foreign exchange results, and the net monetary position result.4. In July 1995, a subsidiary of CEMEX transferred a portion of CEMEX Spain’s (formerly known as Valenciana) shares, which represented 24.77% of the common stock, in exchange for 40 billion pesetas. During the life of the transaction, such shares were treated as owned by a third party, thereby creating a minority interest in the consolidated stockholders’ equity. The original amount was refinanced in August 1997 at US$320 million and, subsequently, in February 1999 at US$500 million. Since the first refinancing, the minority interest was not recognized on the income statement because CEMEX, through its subsidiary, retained dividends and voting rights over such shares and had the option to acquire them in three tranches, the latter to mature in June 2001. In August 2000, CEMEX anticipated the exercise of its call option and terminated this transaction. During the life of the transaction, the com-pany included the cost of retaining its option as part of the financial interest.5. In November 2000, a Dutch subsidiary of CEMEX issued preferred stock for US$1.5 billion in connection with the financing required for the CEMEX, Inc. (formerly Southdown) acquisi-tion. In October 2003, CEMEX early redeemed the total outstanding amount of the preferred stock. The preferred stock’s redemption was mandatory in February and August 2004 and granted its holders 10% of the subsidiary’s voting rights, as well as the right to receive a variable guaranteed preferred dividend. After redemptions of preferred stock made during the life of this transaction, the outstanding amount of preferred stock as of December 31, 2000, 2001, and 2002, was US$1,500 million, US$900 million, and US$650 million, respectively, and was included as minority interest in each year (see note 15E to the 2005 annual report’s Financial Statements).6. In 1998 a subsidiary of CEMEX in Spain issued US$250 million of capital securities at an annual dividend rate of 9.66%. In April 2002, through a tender offer, US$184 million of capi-tal securities were redeemed. The amount paid to the holders, pursuant to the early redemp-tion, in excess of the nominal amount of the capital securities of approximately US$20 mil-lion was recorded against stockholders’ equity. The balance outstanding as of December 31, 2003 and 2002, was US$66 million. In 2004, through the exercise of a repurchase option, CEMEX liquidated the remaining capital securities. This transaction was recorded as minority interest during its validity (see note 15E to the 2005 annual report’s Financial Statements).7. The number of ADRs outstanding represents the total ADR equivalent units outstanding at the close of each year, stated in millions of ADRs, and includes the total number of ADR equivalents issued by CEMEX in underlying derivative transactions, and excludes the total number of ADR equivalents issued by CEMEX and owned by subsidiaries. Each ADR listed on the New York Stock Exchange represents 10 CPOs.8. On September 14, 1999, CEMEX concluded an exchange offer of its old series “A” and “B” shares and its old CPOs for new CPOs. As a result, most of the holders of the old series “A” and “B” shares and old CPOs received for each a new CPO, which represents the participation in two new series “A” shares and one new series “B” share of CEMEX. As a part of the exchange offer, on September 15, 1999, CEMEX made a stock split of two series “A” shares and one series “B” share for each of the old shares of any series. The proportional equity interest participation of the stockholders in CEMEX’s common stock did not change as a result of the exchange offer and the stock split mentioned above. Furthermore, on April 28, 2005, our shareholders approved a stock split, which became effective on July 1, 2005. In connection with the stock split, each of our existing series A shares was surrendered in exchange for two new series A shares, each of our existing series B shares was surrendered in exchange for two new series B shares, and each of our existing CPOs was surrendered in exchange for two new CPOs, with each new CPO representing two new series A shares and one new series B share. The number of our outstanding ADRs did not change as a result of the stock split; instead the ratio of CPOs to ADRs was modified so that each ADR now represents ten new CPOs. The proportional equity interest participation of existing sharehold-ers did not change as a result of the stock split. Earnings per ADR and the number of ADRs outstanding for the years ended December 31, 1995 through 1998, have been adjusted to make the effect of both of the stock splits retroactive and for the years ended December 31, 1999 through 2004, have been adjusted to make the effect of the July 1, 2005 stock split retroactive. In order to comply with Mexico’s accounting principles, in the Financial State-ments these figures are presented on a per-share basis (see note 21 to the 2005 annual report’s Financial Statements).9. For the period ended December 31, 1995, earnings-per-ADR amounts were determined by considering the total outstanding ADR equivalents at the year’s end. For the periods ended December 31, 1996 through 2005, the earnings-per-ADR amounts were determined by considering the average number of ADR equivalent units outstanding during each year, i.e., 259.6, 256.6, 252.4, 251.2, 275.0, 284.4, 299.2, 315.2, 332.9 and 346.0 million, respectively.10. Dividends declared at each year’s annual stockholders’ meeting for each period are re-flected as dividends for the preceding year. CEMEX did not declare or pay any dividends with respect to 1996; rather, management recommended, and shareholders approved, a share repurchase program (see paragraph below).11. As a result of CEMEX’s Share Repurchase Program in 1997, 24.1 million CPOs were acquired for an amount of approximately US$119 million. The CPOs acquired through this program accounted for approximately 2% of the CPOs outstanding on that date.12. Please refer to page 82 for the definition of terms.
financial information
CEMEX, S.A. DE C.V., AND SUBSIDIARIES Compounded annual growth
1995 1996 1997 1998 1999 2000 2001 2002 2003 2004 2005 04–05 95–05
Operating results
Net sales 2,564 3,365 3,788 4,315 4,828 5,621 6,923 6,543 7,164 8,149 15,321 88% 20%
Cost of sales(1)(2) (1,564) (2,041) (2,322) (2,495) (2,690) (3,141) (3,894) (3,656) (4,130) (4,586) (9,271)
Gross profit 1,000 1,325 1,467 1,820 2,138 2,480 3,029 2,888 3,034 3,563 6,050
Operating expenses(2) (388) (522) (572) (642) (702) (826) (1,376) (1,577) (1,579) (1,711) (3,563)
Operating income 612 802 895 1,178 1,436 1,654 1,653 1,310 1,455 1,852 2,487 34% 15%
Financial expense (652) (668) (510) (485) (488) (467) (412) (333) (381) (372) (526)
Financial income 65 53 37 37 31 25 41 45 17 23 39
Comprehensive financing result(3) 567 529 159 (132) (29) (174) 265 (329) (267) 133 239
Other income (expenses), net (162) (171) (138) (152) (296) (234) (417) (389) (457) (484) (317)
Income before taxes and others 1,017 1,160 916 893 1,111 1,246 1,501 592 731 1,501 2,408
Minority interest net income(4)(5)(6) 109 119 107 39 56 78 153 37 30 21 55
Majority interest net income 759 977 761 803 973 999 1,178 520 629 1,307 2,112 62% 11%
Millions of ADRs outstanding(7)(8)(11) 257 261 254 252 273 278 292 304 324 339 352
Earnings per ADR(8)(9) 2.95 3.76 2.97 3.18 3.87 3.65 4.14 1.74 1.99 3.93 6.10 55% 8%
Dividends per ADR(8)(10)(11) 0.33 – 0.60 0.70 0.79 0.98 1.02 1.04 1.02 1.22 n.a.
Balance-sheet information
Cash and temporary investments 355 409 380 407 326 308 428 361 291 342 601
Net working capital(12) 567 611 588 638 669 813 933 699 576 525 1,268
Property, plant, and equipment, net 4,939 5,743 6,006 6,142 6,922 9,034 8,940 8,963 9,265 9,613 15,542
Total assets 8,370 9,942 10,231 10,460 11,864 15,759 16,230 15,934 16,016 17,381 26,763
Short-term debt 870 815 657 1,106 1,030 2,962 1,028 1,393 1,329 1,044 1,191
Long-term debt 3,034 3,954 3,961 3,136 3,341 2,709 4,345 4,374 4,537 4,887 8,287
Total liabilities 4,603 5,605 5,535 5,321 5,430 8,111 8,078 8,983 9,250 9,161 16,409
Minority interest(4)(5)(6) 889 1,000 1,181 1,251 1,253 2,398 1,975 1,207 532 389 529
Majority interest 2,878 3,337 3,515 3,887 5,182 5,251 6,177 5,744 6,234 7,831 9,825
Total stockholders’ equity 3,767 4,337 4,696 5,138 6,435 7,649 8,152 6,951 6,766 8,220 10,354
Book value per ADR(8) 11.20 12.80 13.85 15.45 18.95 18.90 21.15 17.25 17.55 23.10 27.90
Other financial data
Operating margin 23.9% 23.8% 23.6% 27.3% 29.8% 29.4% 23.9% 20.0% 20.3% 22.7% 16.2%
EBITDA margin(12) 31.8% 32.3% 31.5% 34.4% 37.1% 36.1% 32.6% 29.3% 29.4% 31.1% 23.2%
EBITDA(12) 815 1,087 1,193 1,485 1,791 2,030 2,256 1,917 2,108 2,538 3,557 40% 16%
Free cash flow(12) (31) 149 383 559 860 886 1,145 948 1,143 1,478 2,013 36% n.a.
18
financial information
in millions of US dollars, except ADRs and per-ADR amounts
financial informationselected consolidated
CEMEX, S.A. DE C.V., AND SUBSIDIARIES Compounded annual growth
1995 1996 1997 1998 1999 2000 2001 2002 2003 2004 2005 04–05 95–05
Operating results
Net sales 2,564 3,365 3,788 4,315 4,828 5,621 6,923 6,543 7,164 8,149 15,321 88% 20%
Cost of sales(1)(2) (1,564) (2,041) (2,322) (2,495) (2,690) (3,141) (3,894) (3,656) (4,130) (4,586) (9,271)
Gross profit 1,000 1,325 1,467 1,820 2,138 2,480 3,029 2,888 3,034 3,563 6,050
Operating expenses(2) (388) (522) (572) (642) (702) (826) (1,376) (1,577) (1,579) (1,711) (3,563)
Operating income 612 802 895 1,178 1,436 1,654 1,653 1,310 1,455 1,852 2,487 34% 15%
Financial expense (652) (668) (510) (485) (488) (467) (412) (333) (381) (372) (526)
Financial income 65 53 37 37 31 25 41 45 17 23 39
Comprehensive financing result(3) 567 529 159 (132) (29) (174) 265 (329) (267) 133 239
Other income (expenses), net (162) (171) (138) (152) (296) (234) (417) (389) (457) (484) (317)
Income before taxes and others 1,017 1,160 916 893 1,111 1,246 1,501 592 731 1,501 2,408
Minority interest net income(4)(5)(6) 109 119 107 39 56 78 153 37 30 21 55
Majority interest net income 759 977 761 803 973 999 1,178 520 629 1,307 2,112 62% 11%
Millions of ADRs outstanding(7)(8)(11) 257 261 254 252 273 278 292 304 324 339 352
Earnings per ADR(8)(9) 2.95 3.76 2.97 3.18 3.87 3.65 4.14 1.74 1.99 3.93 6.10 55% 8%
Dividends per ADR(8)(10)(11) 0.33 – 0.60 0.70 0.79 0.98 1.02 1.04 1.02 1.22 n.a.
Balance-sheet information
Cash and temporary investments 355 409 380 407 326 308 428 361 291 342 601
Net working capital(12) 567 611 588 638 669 813 933 699 576 525 1,268
Property, plant, and equipment, net 4,939 5,743 6,006 6,142 6,922 9,034 8,940 8,963 9,265 9,613 15,542
Total assets 8,370 9,942 10,231 10,460 11,864 15,759 16,230 15,934 16,016 17,381 26,763
Short-term debt 870 815 657 1,106 1,030 2,962 1,028 1,393 1,329 1,044 1,191
Long-term debt 3,034 3,954 3,961 3,136 3,341 2,709 4,345 4,374 4,537 4,887 8,287
Total liabilities 4,603 5,605 5,535 5,321 5,430 8,111 8,078 8,983 9,250 9,161 16,409
Minority interest(4)(5)(6) 889 1,000 1,181 1,251 1,253 2,398 1,975 1,207 532 389 529
Majority interest 2,878 3,337 3,515 3,887 5,182 5,251 6,177 5,744 6,234 7,831 9,825
Total stockholders’ equity 3,767 4,337 4,696 5,138 6,435 7,649 8,152 6,951 6,766 8,220 10,354
Book value per ADR(8) 11.20 12.80 13.85 15.45 18.95 18.90 21.15 17.25 17.55 23.10 27.90
Other financial data
Operating margin 23.9% 23.8% 23.6% 27.3% 29.8% 29.4% 23.9% 20.0% 20.3% 22.7% 16.2%
EBITDA margin(12) 31.8% 32.3% 31.5% 34.4% 37.1% 36.1% 32.6% 29.3% 29.4% 31.1% 23.2%
EBITDA(12) 815 1,087 1,193 1,485 1,791 2,030 2,256 1,917 2,108 2,538 3,557 40% 16%
Free cash flow(12) (31) 149 383 559 860 886 1,145 948 1,143 1,478 2,013 36% n.a.
19
financial information

growinga
Business
CEMEX is a growing global building-solutions company
that provides products of consistently high quality and
reliable service to customers and communities across
four continents. We advance the well-being of those
we serve through our relentless focus on continuous
improvement and our efforts to promote a sustainable
future.
Our company was founded in Mexico in 1906, and we
have grown from a local player to one of the top global
companies in our industry, with more than 50,000 em-
ployees worldwide. Today we are strategically positioned
in the Americas, Europe, Africa, the Middle East, and
Asia. Our operations network produces, distributes, and
markets cement, ready-mix concrete, aggregates, and
related building materials to customers in more than
50 countries, and we maintain trade relationships with
more than 90 nations.
Business strategy
Over the past 20 years, we have built a portfolio of assets
with sustainable, profi table, long-term growth potential.
Looking forward, we will continue to
■ Focus on our core business of cement, ready-mix
concrete, and aggregates
■ Provide our customers with the best value proposition
global company
20
■ Grow profi tably through integrated positions across
our industry’s value chain
■ Allocate capital effectively
■ Integrate acquisitions quickly and achieve optimal
operating standards
Focus on our core business of cement, ready-mix
concrete, and aggregates
Our portfolio of cement, ready-mix concrete, and ag-
gregates assets is concentrated in markets that provide
sustainable top- and bottom-line growth throughout the
economic cycle. Over the past two decades, our consoli-
dated revenue and EBITDA have increased at compounded
annual growth rates of 22 percent and 21 percent, re-
spectively. We have produced an average return on capital
employed of over 11 percent over the past fi ve years.
We intend to continue geographically diversifying our
cement, ready-mix concrete, and aggregates assets
and vertically integrating our operations in new and
existing markets by acquiring or developing comple-
mentary assets along the cement value chain. By man-
aging our cement, ready-mix concrete, and aggregates
assets as one integrated business rather than as
distinct businesses, we make them more effi cient and
profi table.

Management discussion and analysis of results of operations and fi nancial condition of the company
21
Our acquisition of RMC has created an integrated build-
ing-materials company with stronger positions across
the cement value chain, greater global reach, and the fi -
nancial strength to foster disciplined, profi table growth.
We have complemented our Latin American base with
important European positions, considerably strength-
ened our company’s US operations, and opened new
high-growth markets such as Eastern Europe. We also
have signifi cantly improved our ability to deliver inte-
grated solutions of enhanced value to our customers.
Provide our customers the best value proposition
We work continually to provide superior building solu-
tions in the markets we serve. In Mexico, for example,
we are the only ready-mix provider to offer unique, custom-
made solutions for every segment of the market. So far,
we have launched 13 special concrete products, and we
have four products under development. These products
cover a wide range of applications, from concrete for
professional architectural designs to concrete for high-
performance structures.
We also see several opportunities to deepen our
customer relationships by focusing on more vertically
integrated building solutions rather than separate
products. By developing our integrated offerings, we ■ Cement ■ Ready-mix ■ Aggregates ■ Others
can provide customers with more reliable service and
more consistent product quality.
Grow profi tably through integrated positions across
the value chain
We see ample opportunity for profi table growth, across
three avenues in particular: 1) organic growth from our
existing portfolio; 2) EBITDA growth from disciplined
investments in our existing businesses, which improve our
margins and/or increase our production capacity; and
3) the acquisition of new operations in our existing or new
markets.
EBITDA distribution by product (percentage)
89 72
948
15
2 1
2004 2005
As a highly disciplined and results-oriented
organization, we are dedicated to delivering
consistently strong performance throughout the
business cycle.

Our potential for growth increases substantially when
we look down the cement value chain. Today we es-
timate that our industry’s total value chain produces
EBITDA of approximately US$72 billion. In 2005 we
generated EBITDA of nearly US$3.6 billion, or approxi-
mately 5 percent of our industry’s total. Thus, we see
substantial opportunity to grow and leverage our exist-
ing assets, expertise, and infrastructure to expand our
positions across the value chain.
For example, through our recently established joint
venture with Ready Mix USA—the largest producer
of ready-mix concrete in the southeastern United
States—we achieved greater vertical integration and
better positioned ourselves to satisfy the growing
construction needs of the country’s southeast region.
As part of the joint-venture agreement, CEMEX contrib-
uted two cement plants, 11 cement terminals, and its
aggregates, ready-mix concrete, and block assets in
the Florida Panhandle and South Georgia. Ready Mix
USA contributed all of its ready-mix and aggregates
operations. The joint venture’s complementary assets
not only create many synergies; they also strengthen
our distribution and give us access to established
customer relationships in the region.
Allocate capital effectively
We complement the organic growth of our business
with strategic acquisitions and capital investments. As
a leading industry consolidator, we take a disciplined
approach to capital allocation. We evaluate potential
acquisitions in light of three investment criteria:
1. The acquisition should provide a long-term return on our
investment that is higher than our cost of capital and
offer a 10 percent minimum return on capital employed.
2. The acquisition should allow us to maintain our finan-
cial strength and investment-grade credit quality.
22
3. Factors that we can influence, in particular the appli-
cation of our management and turnaround expertise,
should principally drive the potential for increasing
the acquisition’s value.
We will make only those acquisitions and investments
that meet all of these criteria and are consistent with our
business strategy.
In an expansion-capital program planned for 2006, we
will invest US$500 million worldwide. This program will
fund the initial phase of the Balcones plant expansion
in New Braunfels, Texas; the construction of a new kiln
at the Yaqui plant in Sonora, Mexico; and investments
in Spain, Latvia, the United Kingdom, France, and other
countries. We will fully fund this program with free
cash flow generated during the year. We expect the
investments that we make under the program to be im-
mediately accretive and to achieve a significantly higher
rate of return on capital employed than our acquisition
criteria of at least 10 percent.
To maintain the flexibility necessary to pursue future
growth opportunities, we aim to sustain our strong
free cash flow and financial structure by optimizing our
borrowing costs and debt maturities and increasing our
access to various capital sources.
In 2005 we quickly recovered our financial flexibility fol-
lowing the acquisition of RMC Group. Since completing
the acquisition on March 1, we reduced our net debt by
almost US$1.8 billion; we lowered our net-debt-to-EBITDA
ratio to 2.4 times; and we maintained our interest
coverage at 6.8 times by year-end. We also success-
fully refinanced US$7.5 billion of our debt maturities in
2005. The average maturity of our debt was 3.4 years
as of the end of the year.
As of December 31, 2005 PRODUCTION CEMENT CEMENT READY-MIX AGGREGATES LAND MARINE CAPACITY MILLION PLANTS PLANTS PLANTS QUARRIES DISTRIBUTION TERMINALS METRIC TONS/YEAR CONTROLLED MINORITY PART. CENTERS
Mexico 27.2 15 3 257 22 71 8
United States 13.3 12 4 414 57 41 8
Spain 11.0 8 0 111 21 10 18
United Kingdom 2.7 3 0 288 103 1 6
Rest of Europe1 13.0 9 1 615 155 14 21
South/Central America & Caribbean2 15.4 14 3 120 15 30 14
Africa and Middle East3 4.9 1 0 75 12 5 1
Asia4 10.7 4 4 31 5 31 13
TOTAL 98.2 66 15 1,911 390 203 891 Includes operations in Austria, Croatia, Czech Republic, Denmark, Finland, France, Germany, Hungary, Ireland, Latvia, Lithuania, Norway, Poland, and Sweden.2 Includes operations in Argentina, Colombia, Costa Rica, the Dominican Republic, Jamaica, Nicaragua, Panama, Puerto Rico, and Venezuela, as well as our trading
operations in the Caribbean region.3 Includes operations in Egypt, Israel, and the United Arab Emirates.4 Includes operations in Bangladesh, Indonesia, Malaysia, the Philippines, Taiwan, and Thailand.

Integrate acquisitions quickly and achieve optimal
operating standards
We are always looking for ways to improve our productiv-
ity and operating effi ciency. Toward this end, we have
implemented several standardized platforms to reduce
our costs, streamline our processes, and extract syner-
gies from our global operations. We have also taken
various steps over the past several years to improve
our overall product quality and the environmental im-
pact of our operations.
With each international acquisition, we have further
refi ned the technological and managerial processes
required to integrate acquisitions into our corpo-
rate structure. Consequently, we have been able to
consolidate acquisitions more quickly, smoothly, and
effectively.
Our top priorities for 2006 are to achieve the effi cient
and timely integration of RMC, capture the synergies
that we have identifi ed, and extract maximum value
from this acquisition. We are on track to realize recur-
ring synergies of US$360 million; this total includes
US$260 million in Europe and US$100 million in the
United States.
Alignment with investor interests
Employee stock-ownership plan
To better align our executives’ interests with those of
our stockholders, we began offering executives a new
stock-ownership program in 2005. The plan’s goal is
to move our company’s long-term incentives from stock
options to programs based on restricted stock, which
we believe is more highly valued by our executives and
stockholders. As of December 31, 2005, our executives
held 101,832,693 restricted CPOs, representing 2.9
percent of our total CPOs outstanding.
23
Growing spread of ROCE/WACC through disciplined capital allocation (percentage)
8
6
94 95 96 97 98 99 00 01 02 03 04 05
12
10
14
■ Return on capital employed■ Weighted-average cost of capital

Nondilutive equity offering
As part of our company’s migration from executive stock-
option plans to long-term variable compensation programs
based on restricted stock, a nondilutive equity offering
was completed in the third quarter of 2005. Through this
transaction, 31 million CEMEX ADRs were sold for a total
of US$1.5 billion. US$1.3 billion of the proceeds from
the offering were used to unwind all of the equity-forward
contracts that we had entered into with banks to hedge
the exposure on our executive stock-option plans. By
terminating all of our equity-forward contracts, we have
signifi cantly simplifi ed our capital structure. Consequently,
we have made it easier for investors to value our stock
and its potential return by enabling them to focus on the
fundamental strengths of our business model.
The offering also has enabled us to reduce our related
obligations with the fi nancial market, giving us greater
fi nancial strength and improved credit quality. Given the
nondilutive nature of the transaction, the offering cre-
ated greater liquidity for CEMEX stock through a broader
stockholder base, while the total number of shares
outstanding remained unchanged.
Corporate governance
We are committed to the highest standards of corpo-
rate governance. Our company’s board of directors is
composed of qualifi ed directors who provide appropri-
ate oversight. The requirement of independency of the
audit committee members satisfi es applicable law,
and one member of our audit committee meets the
requirements of a “fi nancial expert” as defi ned by the
Sarbanes-Oxley Act of 2002 (SOX).
We also have designed and deployed 1) a formal internal
process to support the certifi cation by our chief executive
offi cer and our executive vice president of planning and
fi nance of the information that we present in CEMEX’s
periodic reports to the US Securities and Exchange Com-
mission; 2) a system to ensure that relevant information
reaches senior management in a timely manner; 3) a
system for anonymously and confi dentially communicat-
ing to the audit committee complaints and concerns
regarding accounting and audit issues; 4) a process for
anonymously and confi dentially submitting complaints
related to misuse of assets; and 5) a task force to follow
legal requirements and best corporate-governance prac-
tices and, when appropriate, propose further improve-
ments. Moreover, we have modifi ed our code of ethics to
refl ect the requirements of SOX.
We are in compliance with the applicable sections of
SOX and expect to comply punctually with section 404.
All foreign private issuers in the United States must
comply with section 404 for their fi scal years ending on
or after July 15, 2006.
24

Net sales increased 88% to US$15.32 billion. The
increase was due mainly to the consolidation of RMC
from March through December, as well as to higher
domestic volumes.
Selling, general, and administrative (SG&A) expenses
increased 108% due mainly to our acquisition of RMC
Group. As a percentage of net sales, our SG&A expens-
es increased 2.3 percentage points versus 2004.
Operating income was up 34% to US$2.49 billion,
while EBITDA totaled US$3.56 billion, 40% more than
in 2004. Our EBITDA margin went from 31.1% in 2004
to 23.2% in 2005. This decrease reflected primarily the
change in our product mix resulting from our consolida-
tion of RMC and the growing importance of lower-mar-
gin, less-capital-intensive business segments such as
ready-mix concrete.
Financial expenses increased 41% to US$526 million
as a result of higher debt related to the acquisition of
RMC. Our interest coverage ratio was 6.8 times, the
same level as at the end of 2004.
We incurred a US$79 million foreign-exchange loss for
the year, versus a loss of US$24 million in 2004. This
loss was due primarily to the depreciation of the euro
versus the US dollar and of the euro versus the British
pound. This was more than offset by a gain on financial
instruments of US$386 million in 2005 compared with
a gain of US$120 million in 2004. This gain resulted
mainly from our cross-currency and interest-rate swaps
and gains from our equity forwards, which were terminat-
ed during the third quarter.
Majority interest net income for the year increased 62%
to US$2.11 billion as a result of our strong operating
performance, the inclusion of RMC, and gains result-
ing from our derivatives positions, such as the early
termination of our equity-forward contracts in the third
quarter of 2005.
Free cash flow after maintenance-capital expenditures
was US$2.2 billion, of which nearly US$200 million
was used for expansion-capital expenditures. Free cash
flow increased 36% to US$2.01 billion, which we used
primarily to reduce debt. We also used our free cash
flow for investments in connection with the post-merger
integration of RMC, as well as for other investments.
Net debt was US$8.67 billion at year-end 2005 com-
pared with US$5.59 billion at year-end 2004. Since
completing the acquisition of RMC on March 1, we have
reduced our net debt by nearly US$1.8 billion, applying
the majority of our free cash flow to debt reduction. At
the end of 2005, our net-debt-to-EBITDA ratio stood at
2.4 times, down from 3.2 times in March.
In 2005 we engaged in debt-refinancing transactions
totaling approximately US$7.5 billion. Also during the
year, Standard & Poor’s and Fitch Ratings maintained
their respective investment-grade ratings on our debt
of BBB- and BBB, and Moody’s upgraded its credit rat-
ing to Baa3.
resultsconsolidated
25
Earnings quality
For 2005, our free cash flow after maintenance-capi-tal expenditures was US$2.2 billion—or 62% of our consolidated EBITDA—demonstrating the strength of our portfolio and business model and our earnings quality.
95 96 97 98 99 00 01 02 03 04 05
3,55
7
2,53
8
2,10
8
1,91
72,25
6
2,03
0
1,79
1
1,48
5
1,19
3
1,08
7
815
2,01
3
1,47
8
1,14
3
9481,14
5
886
860
559
38314
9
(31)
EBITDAFree cash flow
Management discussion and analysis of results of operations and financial condition of the company

MexicoIn 2005 our Mexican operations’ net sales reached
US$3.18 billion—a 9% increase compared with the 2004
fi gure—and EBITDA rose 1% to US$1.28 billion.
Cement and ready-mix concrete volumes grew 1% and
15%, respectively, during the year. Government infrastruc-
ture spending and residential construction were the main
drivers of demand; both offset weak demand from the
self-construction sector.
In 2005 foreign direct investment and remittances from
the United States—which reached a record US$20
billion for the year—remained high and contributed to
Mexico’s strong economic activity. Mortgage-origination
levels also continued to grow; the number of mortgages
reached approximately 562,000 during the year.
Under the terms of a recent settlement agreement,
the United States will ease and ultimately eliminate
the restrictions on imports of Mexican cement over a
three-year period. Consequently, the United States will
allow 3 million metric tons of Mexican cement into the
country in 2006.
United StatesOur US operations’ net sales increased 106% to
US$4.04 billion in 2005. EBITDA reached US$1.02 bil-
lion, a 120% increase over that in 2004.
Cement, aggregates, and ready-mix concrete vol-
umes grew 6%, 112%, and 177%, respectively, during
2005. All of the country’s main construction sectors
experienced robust growth throughout the year. Public
construction spending rose 8%; residential construc-
tion spending grew 11%; and industrial-and-commercial
construction spending increased 7%.
operationsglobal review of
26
01 02 03 04 05
Solid housing growth in Mexico (mortgages/year)
Housing activity is expected to continue expanding in 2006, driven by growing mortgage-origination levels through Infonavit and other institutions.
284,
000
342,
000
440,
000
467,
000 56
2,00
0
Mexico’s main drivers of demand in 2005 were government infrastructure spending and residential construction.
All of the main construction sectors in the United States experienced robust growth throughout 2005, with spending on residential construction up over 11% during the year.
Public-sector construction—especially spending for
streets and highways—benefi ted from increased federal
funding as well as the generally improving fi scal condi-
tion of the states. Attractive fi nancing terms, better em-
ployment, tight inventories, positive demographics, and
household formation were the main drivers of growth in
the residential sector. The country’s economic expan-
sion also supported the growth trend in the industrial-
and-commercial sector.
On the operations front, we have made considerable
progress with the integration of RMC Group’s US assets.
We have identifi ed approximately US$100 million in
recurrent cost savings, most of which will come from our
centralized management of functional areas.
SpainOur net sales in Spain increased 9% to US$1.49 bil-
lion in 2005. EBITDA reached US$438 million, up 5%
from 2004.
Cement and ready-mix concrete volumes exceeded our
expectations, growing 4% and 57%, respectively, for
2005. Demand from all of the country’s main construc-
tion sectors remained strong throughout the year.
In 2005 the residential sector experienced its best
year, with housing starts exceeding the 700,000 mark.
In addition, public-works construction received a boost
from the government’s new infrastructure plan, which
is expected to run through the year 2020 and has an
estimated total budget of US$300 billion.
27
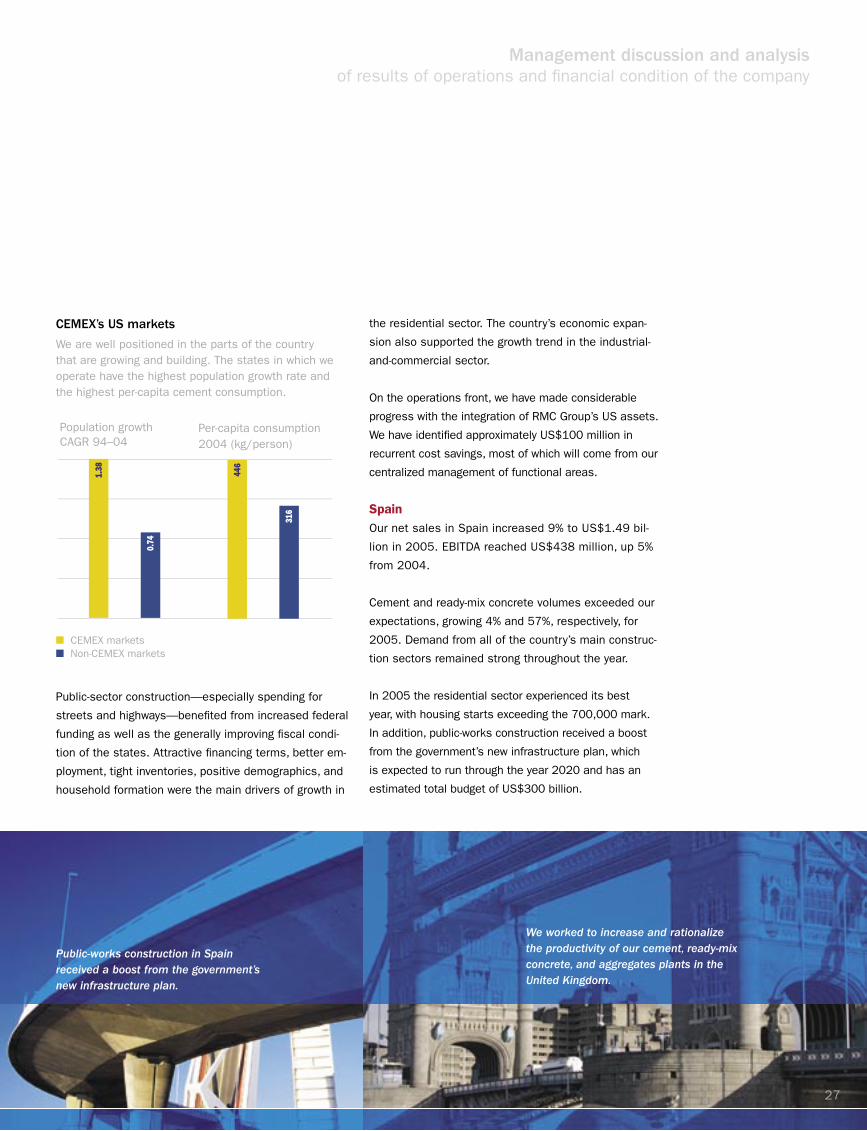
CEMEX’s US markets
We are well positioned in the parts of the country that are growing and building. The states in which we operate have the highest population growth rate and the highest per-capita cement consumption.
0.74
1.38
Population growthCAGR 94–04
316
446
Per-capita consumption2004 (kg/person)
■ CEMEX markets ■ Non-CEMEX markets
Management discussion and analysis of results of operations and fi nancial condition of the company
Public-works construction in Spain received a boost from the government’s new infrastructure plan.
We worked to increase and rationalize the productivity of our cement, ready-mix concrete, and aggregates plants in the United Kingdom.

United KingdomOur UK operations produced net sales of US$1.53 billion
and EBITDA of US$147 million in 2005. Cement and
ready-mix concrete sales volumes declined 2% and 1%,
respectively, during the year.
The UK economy grew more slowly than forecast, lead-
ing to the first annual decline in construction output
since 1994. The repair, maintenance, and improvement
sector’s activity was subdued for the year, while the pri-
vate residential and industrial construction sectors were
positive contributors to the economy.
As part of the ongoing integration of RMC, we worked to in-
crease and rationalize the productivity of our cement, ready-
mix concrete, and aggregates plants in the United Kingdom.
As a result, we expect to significantly improve our EBITDA,
capturing the bulk of our identified synergies in 2006.
Rest of EuropeThe rest of our European operations produced net sales of
US$2.67 billion and EBITDA of US$352 million in 2005.
In France, our operations’ aggregates and ready-mix
concrete volumes increased 1% and 6%, respectively,
millions of US dollars OPERATING SALES INCOME EBITDA ASSETS
Mexico 3,176 1,124 1,280 6,813 United States 4,040 741 1,015 6,804 Spain 1,486 359 438 2,627 United Kingdom 1,527 52 147 4,614Rest of Europe1 2,673 188 352 4,570 South/Central America & Caribbean2 1,316 251 382 3,048 Africa & Middle East3 535 112 148 890 Asia4 297 39 60 1,066 Other/eliminations 270 (380) (265) (3,668) TOTAL 15,321 2,487 3,557 26,763
1 Includes operations in Austria, Croatia, Czech Republic, Denmark, Finland, France, Germany, Hungary, Ireland, Latvia, Norway, Poland, Portugal, and Sweden.
2 Includes operations in Argentina, Colombia, Costa Rica, the Dominican Republic, Jamaica, Nicaragua, Panama, Puerto Rico, and Venezuela, as well as our trading operations in the Caribbean region.
3 Includes operations in Egypt, Israel, and the United Arab Emirates.4 Includes operations in Bangladesh, Malaysia, the Philippines, Taiwan, and Thailand.
28
during the year. Fueled by low interest rates and tax
incentives for home construction, the residential sector
was the main driver of demand, growing approximately
10% in 2005.
In Germany, our operations’ cement and ready-mix con-
crete volumes decreased 14% and 12%, respectively,
in 2005. Public-works and residential construction
declined, and nonresidential construction increased
slightly, mainly as a result of retail building activity. We
managed to increase our exports by approximately 26%
to partially compensate for domestic market conditions.
South/Central America and CaribbeanOur net sales in the region rose 6% to US$1.32 billion,
and EBITDA declined 23% to US$382 million in 2005.
Our regional operations’ domestic cement volumes
grew 19% for the year.
In Venezuela, our operations’ domestic cement volumes
grew 29% during the year. Demand in all of the main
construction sectors improved. Increased oil revenues
fueled the infrastructure sector. The self-construction
and government-sponsored housing sectors were also
important drivers of cement consumption.
■ Mexico■ United States■ Spain■ United Kingdom■ Rest of Europe■ Rest of the world
33
2216
29 21
27
1010
14
18
2004 2005
45
17
15
2333
27
11
4
15
9
2004 2005
Sales geographic distribution (percentage)
Our expanded scale and global reach position us to grow more profitably and generate more value for all of our stakeholders.
EBITDA geographic distribution (percentage)
Our increased geographic diversification in Europe, North America, and Asia enhances our cash-flow sta-bility and lowers our weighted-average cost of capital.
In Colombia, our operations’ cement volumes grew 33%
in 2005, driven primarily by demand from the self-con-
struction sector. Infrastructure spending was also a
signifi cant driver of cement demand.
Africa and Middle EastNet sales from our operations in Africa and the Middle
East were US$535 million, up 180% over that in 2004.
EBITDA increased 70% to US$148 million.
In Egypt, our domestic cement volumes grew 23% for
the year, as construction activity remained high. The
main drivers of cement demand were the housing and
infrastructure sectors.
AsiaIn 2005 our Asian operations’ net sales rose 52% to
US$297 million, and EBITDA increased 9% to US$60
million. In the aggregate, our regional cement volumes
grew 2%.
TradingOur global trading network is one of the largest in the
industry. Our trading operations help us to optimize our
worldwide production capacity, deliver excess cement to
where it is most needed, and explore new markets without
making immediate capital investments.
In 2005 our trading volume totaled more than 17 million
metric tons of cementitious materials, including almost
16 million metric tons of cement and clinker, and we ex-
panded our trading relationships to a record 97 countries
from 76 in 2004. In addition, we gained an important
presence in the slag trading markets, in Europe and the
Middle East in particular.
3
1
95 96 97 98 99 00 01 02 03 04 05
5
7
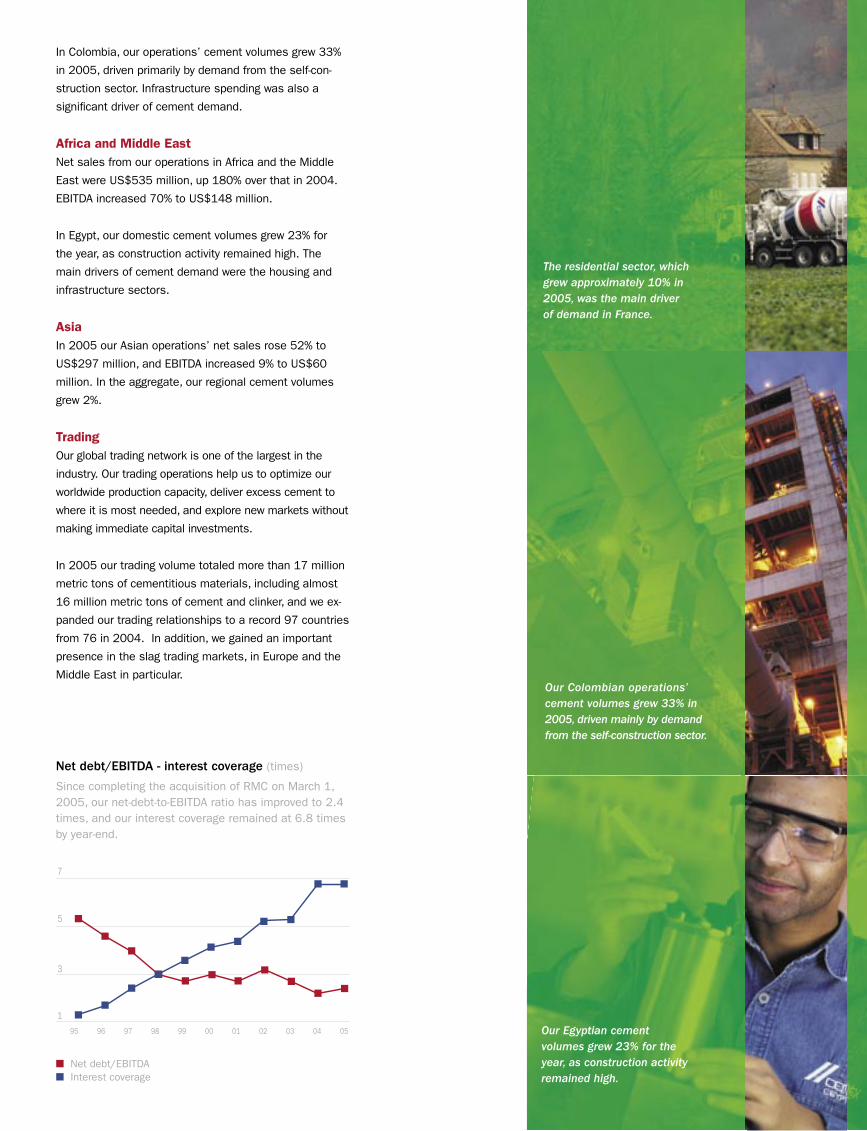
■ Net debt/EBITDA ■ Interest coverage
Net debt/EBITDA - interest coverage (times)
Since completing the acquisition of RMC on March 1, 2005, our net-debt-to-EBITDA ratio has improved to 2.4 times, and our interest coverage remained at 6.8 times by year-end.
The residential sector, which grew approximately 10% in 2005, was the main driver of demand in France.
Our Colombian operations’ cement volumes grew 33% in 2005, driven mainly by demand from the self-construction sector.
Our Egyptian cement volumes grew 23% for the year, as construction activity remained high.
30
CEMEX completes acquisition of RMC
On March 1, 2005, CEMEX announced that it had
concluded the acquisition of RMC Group p.l.c., one of
Europe’s largest producers of cement and aggregates
and the world’s largest supplier of ready-mix concrete.
The boards of directors of CEMEX and RMC, as well as
RMC stockholders, EU and US regulators, and the High
Court of Justice in England and Wales, approved the
acquisition. The enterprise value of the US$4.1 billion
cash transaction, including the assumption of debt, was
US$5.8 billion.
With the integration of RMC, CEMEX has consolidated
its position as the third largest cement company in the
world, with approximately 98 million metric tons of an-
nual production capacity, and has become the world’s
largest ready-mix concrete company and seventh largest
aggregates company, with annual production levels of
approximately 70 million cubic meters and approximate-
ly 160 million metric tons, respectively.
CEMEX and Lafarge terminate joint ventures in Spain
and Portugal
On December 22, 2005, CEMEX announced the
termination of its 50/50 ventures with Lafarge in
Readymix Asland S.A. (RMA) in Spain and Betecna
Betao Pronto S.A. in Portugal after receiving regula-
tory approval from the relevant antitrust authorities.
CEMEX and Lafarge had announced their intent to
end their participation in these ventures on Novem-
ber 3, 2005.
According to the terms of the agreement, CEMEX
received approximately €50 million in cash, 29
concrete plants, and 6 aggregates quarries from
RMA in Spain.
As a result of the termination of the joint ventures,
Lafarge held 100% of the shares of both RMA and
Betecna.
relevantacquisitions, divestitures,
events
United States and Mexico agree to resolve
antidumping order regarding Mexican cement
On January 19, 2006, officials from the Mexican and
US governments reached an agreement in principle to
end the long-standing dispute over US imports of Mexi-
can cement. Under the agreement, the United States
will ease restrictions during a three-year transition pe-
riod and completely revoke the US antidumping order in
early 2009—allowing cement from Mexico to enter the
United States without duties or other limits on volumes.
During the three-year transition period, the United
States will allow three million metric tons of Mexican
cement into the country annually—an increase from
current levels—and will permit this quantity to increase
as the market grows over the second and third years,
subject to a 4.5% annual cap. The United States will
specify quota allocations on a regional basis and will
lower the tariff to US$3 per metric ton during the transi-
tion period (from approximately US$26 per metric ton).
As a result of the settlement, the US and Mexican ce-
ment industries will share the unliquidated historical
duties associated with the antidumping order. CEMEX
will receive approximately US$100 million in cash from
this settlement and will eliminate approximately US$65
million in liabilities, both of which will positively impact
the company’s income statement.
CEMEX and Ready Mix USA complete joint venture
transaction
On July 4, 2005, CEMEX Inc., the US subsidiary of
CEMEX, and Ready Mix USA, a private ready-mix con-
crete company with operations in the southeastern
United States, announced the establishment of a joint
venture to satisfy the growing construction needs of the
country’s southeast region.
Under the arrangement, CEMEX Inc. contributed two
cement plants, one in Demopolis, Alabama, and one
in Clinchfield, Georgia; 11 cement terminals; and its
and otherrelevant

ready-mix concrete, aggregates, and concrete-block as-
sets in the Florida Panhandle and South Georgia. Ready
Mix USA contributed all of its ready-mix concrete and
aggregates operations in Alabama, Georgia, the Florida
Panhandle, and Tennessee, as well as its concrete-block
operations in Arkansas, Tennessee, Mississippi, Florida,
and Alabama. CEMEX manages the joint venture’s ce-
ment assets, and Ready Mix USA manages the ready-mix
concrete, aggregates, and concrete-block assets.
After the third anniversary of the joint venture’s forma-
tion, and for an extended period, Ready Mix USA will
have the option, but not the obligation, to require CEMEX
to purchase Ready Mix USA’s interest in the joint venture.
On September 1, 2005, CEMEX announced the signing
of an agreement to expand the scope of the joint venture
with Ready Mix USA. As a part of this expansion, CEMEX
contributed 27 additional ready-mix concrete plants and
four additional concrete block facilities, all of which are
located in the Atlanta, Georgia, metropolitan area and
operate under the Allied Ready Mix name. In return for the
contribution of these additional assets, CEMEX received
approximately US$91.6 million from the joint venture.
Ready Mix USA manages these newly contributed assets.
CEMEX completes sale of US assets
On March 31, 2005, CEMEX announced that it had
completed the sale of the Charlevoix and Dixon-Mar-
quette cement plants and certain distribution terminals
located in the Great Lakes region of the United States
to Votorantim Participacoes S.A. The value of the
transaction was approximately US$389 million. Total
production capacity of both cement plants was nearly
2 million metric tons per year, or approximately 9% of
the 2004 operating-cash-flow generation of CEMEX’s US
business before the RMC acquisition.
CEMEX divests investment in Cementos Bio Bio, S.A.
On April 26, 2005, CEMEX announced the divestiture
of its 11.92% interest in Cementos Bio Bio, S.A., a
cement company in Chile, for approximately US$65
million, or an implied enterprise value to EBITDA of nine
times. The proceeds from the sale were applied to debt
reduction, and the extraordinary gains from this transac-
tion are reflected in net income. CEMEX acquired this
holding for US$34 million in June 1999.
CEMEX completes nondilutive equity offering
On October 3, 2005, CEMEX announced that a total
of 30,993,340 ADRs were sold in a nondilutive equity
offering, which included the sale of 27,000,000 ADRs
and an additional 3,993,340 ADRs to cover overallot-
ments. The underwriters fully exercised their option to
purchase the additional ADRs to cover overallotments.
The 30,993,340 ADRs were sold in the form of both
ADRs and CPOs, comprising 22,943,340 ADRs and
80,500,000 CPOs. One ADR represents 10 CPOs. The
ADRs were offered to the public at a price of US$49.50
per ADR, and the CPOs were offered to the public at a
price of MXN53.89 per CPO.
The aggregate proceeds of the offering, including
proceeds from the exercise of the overallotment option,
were approximately US$1.5 billion, after underwriting
discounts and commissions. Approximately US$1.3
billion of these proceeds was used to unwind all of the
forward contracts entered into between CEMEX and cer-
tain banks, with the remaining approximately US$200
million paid to CEMEX.
This transaction did not increase the number of shares
outstanding and, thus, did not dilute the equity of exist-
ing stockholders.
92% of stockholders receive CPOs under CEMEX’s
stock-dividend program
On June 3, 2005, CEMEX announced the completion of
its stock-dividend program. Under the program, a total
of 66,728,250 CPOs were issued on June 3, 2005, and
distributed to 92.08% of stockholders. The remaining
31
Management discussion and analysis of results of operations and financial condition of the company

7.92% of stockholders elected to receive a cash pay-
ment of MXN2.60 per CPO (MXN13.00 per ADR) in
lieu of the stock dividend, for a total of approximately
MXN381 million (US$35 million) paid by CEMEX. In 2004
4% of stockholders elected to receive a cash payment in
lieu of the stock dividend.
Under the stock-dividend program, CEMEX stockhold-
ers received one new CPO for each 25.557 CPOs
held. CEMEX stockholders had the option to receive a
cash payment of MXN2.60 per CPO in lieu of the stock
dividend. (CPO amounts and the cash payment per CPO
do not reflect the two-for-one CPO split effective July 1,
2005.)
CEMEX stock split and ADR ratio modification
On April 28, 2005, CEMEX stockholders approved a
stock split, which became effective on July 1, 2005.
In connection with the stock split, each of CEMEX’s
series A shares was surrendered in exchange for two
new series A shares, and each of CEMEX’s series B
shares was surrendered in exchange for two new series
B shares. Each CPO, which represented two series A
shares and one series B share, was surrendered in
exchange for two new CPOs. Each new CPO represents
two new series A shares and one new series B share.
The new CPOs are identical in all material respects to
the previous CPOs.
The number of CEMEX’s ADRs—each of which repre-
sented five CPOs—did not change as a result of the
stock split; instead, the ratio of CPOs to ADRs was
modified so that each ADR now represents 10 new
CPOs following the stock split. The proportional equity
interest participation of existing stockholders did not
change as a result of the stock split.
On June 29, 2005, the new CPOs started trading on the
Mexican stock exchange, and the ADRs trading on the
NYSE reflected the CPO-to-ADR ratio modification, with
each ADR representing 10 CPOs.
Derivative instruments
In compliance with the guidelines established by our
risk management committee, we use derivative financial
instruments such as interest-rate and currency swaps,
currency and equity-forward contracts, options, and
futures to, among others, change the risk profile as-
sociated with changes in interest rates and foreign-
exchange rates of debt agreements; reduce financing
costs; and hedge forecasted transactions, net assets
in foreign subsidiaries, and CEMEX’s stock-option plans.
Mexican GAAP (Bulletin C-2) requires companies to rec-
ognize all derivative financial instruments on the balance
sheet as assets or liabilities, at their estimated fair market
value, with changes in such fair market values recorded on
the income statement. The exceptions to the general rule
until December 31, 2004, as they pertained to CEMEX,
took effect when transactions were entered into for cash-
flow hedging purposes. In such cases, changes in the fair
market value of the related derivative instruments were
recognized temporarily in equity and were reclassified into
earnings as the inverse effects of the underlying hedged
items flowed through the income statement. Beginning
in 2005, new Bulletin C-10, “Derivative Financial Instru-
ments and Hedging Activities,” establishes the framework
for hedge accounting and overrides Bulletin C-2 in this
respect; however, in respect to cash-flow hedges, the new
rules are the same as those applied by CEMEX since
2001. CEMEX has recognized increases in assets and
liabilities, which resulted in a net asset of US$433 million,
arising from the fair market value recognition of its deriva-
tives portfolio as of December 31, 2005. The notional
amounts of derivatives substantially match the amounts
of underlying assets, liabilities, or equity transactions on
which the derivatives are being entered into.
notional amounts1
Equity derivatives (not prepaid) 0
Foreign-exchange derivatives 5,427
Interest-rate derivatives 2,8841 Millions of US dollars as of December 31, 2005.
The estimated aggregate fair market value of these de-
rivative instruments was US$433 million on December
31, 2005.
32
Dividends (US dollars)
94 95 96 97 98 99 00 01 02 03 04
1.22
1.021.04
1.02
0.98
0.79
0.70
0.60
0.46
*
0.33
0.31
Currency denomination of debt (percentage)
72
21
2 5
■ US dollars
■ Euros
■ British pounds
■ Yen
* CEMEX did not declare or pay any dividends with respect to 1996; rather, management recommended, and shareholders approved, a share-repurchase program.

333333
34 | Independent auditors’ report
35 | Management responsibility for internal control
36 | Consolidated balance sheets
38 | Consolidated statements of income
39 | Consolidated statements of changes in financial position
40 | Balance sheets
42 | Statements of income
43 | Statements of changes in financial position
44 | Statements of changes in stockholders’ equity
46 | Notes to the consolidated financial statements
financialstatements
34
The Board of Directors and Stockholders CEMEX, S.A. de C.V.:
We have audited the consolidated and the parent company-only balance sheets of CEMEX, S.A. de C.V. and CEMEX, S.A. de C.V. and Subsidiaries as of December 31, 2005 and 2004, and the related consolidated and parent company-only statements of income, changes in stockholders’ equity and changes in financial position for each of the years ended December 31, 2005, 2004 and 2003. These financial statements are the responsibility of the Company’s management. Our responsibility is to express an opinion on these financial statements based in our audits.
We conducted our audits in accordance with auditing standards generally accepted in Mexico. Those standards require that we plan and perform the audits to obtain reasonable assurance about whether the financial statements are free of material misstatements and are prepared in accordance with accounting principles generally accepted in Mexico. An audit consists of examining, on a test basis, evidence supporting the amounts and disclosures in the financial statements. An audit also includes assessing the accounting principles used and significant estimates made by management, as well as evaluating the overall financial statements presentation. We believe that our audits provide a reasonable basis for our opinion.
In our opinion the consolidated and parent company-only financial statements referred to above present fairly, in all material respects, the financial position of CEMEX, S.A. de C.V. and CEMEX, S.A. de C.V. and Subsidiaries as of December 31, 2005 and 2004, and the consolidated and parent company-only results of their operations, the changes in their stockholders’ equity and the changes in their financial position for each of the years ended December 31, 2005, 2004 and 2003, in accordance with accounting principles generally accepted in Mexico.
KPMG Cárdenas Dosal, S.C.
C.P. Leandro Castillo Parada
Monterrey, N.L., Mexico
January 27, 2006.
independent auditors’ report

35
The Board of Directors and Stockholders CEMEX, S.A. de C.V.:
(Millions of constant Mexican Pesos as of December 31, 2005)
We have performed a study and evaluation of the system of internal accounting control of CEMEX, S.A. de C.V. and Subsidiaries for the year ended December 31, 2005. The management of CEMEX, S.A. de C.V. is responsible for establishing and maintaining a system of internal accounting control. Our responsibility is to express an opinion on this system of internal control based on our review.
Except as described in the following paragraph, our evaluation was conducted in accordance with generally accepted auditing standards in Mexico.
CEMEX S.A. de C.V. acquired RMC Group p.l.c. and subsidiaries during 2005. The Company is in process of modify and adequate the system of internal accounting control of the acquired entity, therefore it was not possible to perform our evaluation of the internal accounting control of this entity. Our evaluation of the system internal accounting control of CEMEX S.A. de C.V. and subsidiaries as of December 31, 2005, excluded RMC Group p.l.c.’s system of internal accounting control associated with total assets of $ 84,410 and total revenues of $ 68,500 included in the consolidated financial statements of CEMEX S.A. de C.V. and subsidiaries as of and for the year ended December 31, 2005.
Because of inherent limitations in any system of internal accounting control, errors and irregularities may occur and not be detected. Also, projections of any evaluation of the system to future periods is subject to the risk that procedures may become inadequate because of changes in conditions or that the degree of compliance with the procedures may deteriorate.
In our opinion, except for the effect of matters we may have discovered had we been able to perform the evaluation of the internal control of the acquired entity in 2005, as mentioned in the third paragraph, the system of internal accounting control of CEMEX, S.A. de C.V. and Subsidiaries for the year ended December 31, 2005, taken as a whole, satisfy management’s internal control objectives and provide reasonable assurance that material errors or irregularities will be prevented or detected in the normal course of business.
KPMG Cárdenas Dosal, S.C.
Leandro Castillo Parada
Monterrey, N.L., Mexico
January 27, 2006
The management of CEMEX, S.A. de C.V. is responsible for the preparation and integrity of the accompanying consolidated financial statements and for designing, managing and maintaining a system of internal control to provide reasonable assurance to shareholders, to the financial community and other interested parties, that transactions are executed in accordance with management authorization, accounting records are reliable as a basis for the preparation of the consolidated financial statements and to provide reasonable assurance that assets are safeguarded against loss from unauthorized use or disposition.
In fulfilling its responsibilities for the integrity of financial information, management maintains and relies on the internal control system of the Company. This system is based on an organizational structure providing division of responsibilities and the selection and training of qualified personnel. Also, it includes policies, which are communicated to all personnel through appropriate communication channels. The system of internal control is supported by an internal audit function that operates worldwide and reports its findings to management throughout the year. Management believes that, for the year ended December 31, 2005, the internal control system of the Company provides reasonable assurance that material errors or irregularities will be prevented or detected within a timely period and is cost effective.
KPMG Cárdenas Dosal, S.C., the principal independent auditors of the Company, performed a review of the internal control system and expressed their opinion thereon for the year ended December 31, 2005, that includes certain qualifications derived from the RMC Group p.l.c. acquisition that recently took place. Their review was performed in accordance with generally accepted auditing standards in Mexico, which included a review and evaluation of the internal accounting control system and performance of tests of the accounting information records, as they considered necessary in order to express their opinion. Their report is presented separately.
Lorenzo H. ZambranoChairman of the Board and Chief Executive Officer
management’s responsibility for internal control

36
consolidated balance sheets
December 31, Note 2005 2004ASSETS
CURRENT ASSETS
Cash and investments 4 $ 6,387 3,657
Trade accounts receivable less allowance for doubtful accounts 5 16,914 4,572
Other accounts receivable 6 8,236 4,857
Inventories 7 11,015 6,758
Other current assets 8 1,697 1,006
Total current assets 44,249 20,850
INVESTMENTS AND NONCURRENT RECEIVABLES 9 Investments in affiliated companies 8,923 15,973
Other noncurrent accounts receivable 7,635 3,732
Total investments and noncurrent receivables 16,558 19,705
PROPERTIES, MACHINERY AND EQUIPMENT 10 Land and buildings 88,560 52,932
Machinery and equipment 181,340 149,010
Accumulated depreciation (110,126) (102,668)
Construction in progress 5,281 3,429
Net properties, machinery and equipment 165,055 102,703
INTANGIBLE ASSETS AND DEFERRED CHARGES 11 58,366 42,426
TOTAL ASSETS $ 284,228 185,684
CEMEX, S.A. DE C.V. AND SUBSIDIARIES(Millions of constant Mexican pesos as of December 31, 2005)
See accompanying notes to consolidated financial statements.

37
As we commemorate our
100th anniversary, we are
optimistic about the prospects
that lie ahead of us. We have
the people, the culture, and
the opportunities to continue
on our path of disciplined
profitable growth
December 31, Note 2005 2004LIABILITIES AND STOCKHOLDERS’ EQUITY
CURRENT LIABILITIES Bank loans 12 $ 6,001 4,826
Notes payable 12 651 307
Current maturities of long-term debt 12 5,995 6,018
Trade accounts payable 14,466 5,720
Other accounts payable and accrued expenses 13 16,575 8,902
Total current liabilities 43,688 25,773
LONG-TERM DEBT 12 Bank loans 60,474 29,060
Notes payable 33,527 29,165
Current maturities of long-term debt (5,995) (6,018)
Total long-term debt 88,006 52,207
OTHER NONCURRENT LIABILITES Pension and other postretirement benefits 14 6,390 630
Deferred income taxes 18B 25,889 12,302
Other noncurrent liabilities 13 10,298 6,960
Total other noncurrent liabilities 42,577 19,892
TOTAL LIABILITIES 174,271 97,872
STOCKHOLDERS’ EQUITY 15 Majority interest: Common stock-historical cost basis 64 62
Common stock-accumulated inflation adjustments 3,735 3,735
Additional paid-in capital 47,133 42,580
Deficit in equity restatement (75,329) (73,900)
Cumulative initial deferred income tax effects 3S (5,850) (5,850)
Retained earnings 112,166 103,065
Net income 22,425 13,965
Total majority interest 104,344 83,657
Minority interest 5,613 4,155
Total stockholders’ equity 109,957 87,812
TOTAL LIABILITIES AND STOCKHOLDERS’ EQUITY $ 284,228 185,684

38
consolidated statements of income
CEMEX, S.A. DE C.V. AND SUBSIDIARIES(Millions of constant Mexican pesos as of December 31, except for earnings per share)
See accompanying notes to consolidated financial statements.
Years ended December 31,
Note 2005 2004 2003
Net sales $ 162,709 87,062 82,045
Cost of sales (98,460) (48,997) (47,296)
Gross profit 64,249 38,065 34,749
Operating expenses: Administrative (15,276) (8,847) (9,094)
Selling (22,564) (9,435) (8,990)
Total operating expenses (37,840) (18,282) (18,084)
Operating Income 26,409 19,783 16,665
Comprehensive financing result: Financial expense (5,588) (3,977) (4,359)
Financial income 417 250 191
Results from valuation and liquidation of financial instruments 4,101 1,280 (682)
Foreign exchange result, net (837) (252) (1,965)
Monetary position results 4,507 4,123 3,752
Net comprehensive financing result 2,600 1,424 (3,063)
Other expenses, net 3V (3,372) (5,169) (5,230)
Income before income taxes, employees’ statutory profit sharing and equity in income of affiliates 25,637 16,038 8,372
Income tax and business assets tax, net 18 (3,564) (1,960) (1,026)
Employees’ statutory profit sharing 18 9 (317) (195)
Total income tax, business assets tax and employees’ statutory profit sharing (3,555) (2,277) (1,221)
Income before equity in income of affiliates 22,082 13,761 7,151
Equity in income of affiliates 928 428 398
Consolidated net income 23,010 14,189 7,549
Minority interest net income 585 224 348
Majority interest net income $ 22,425 13,965 7,201
Basic earnings per share 3A and 21 $ 2.16 1.40 0.76
Diluted earnings per share 3A and 21 $ 2.15 1.39 0.74
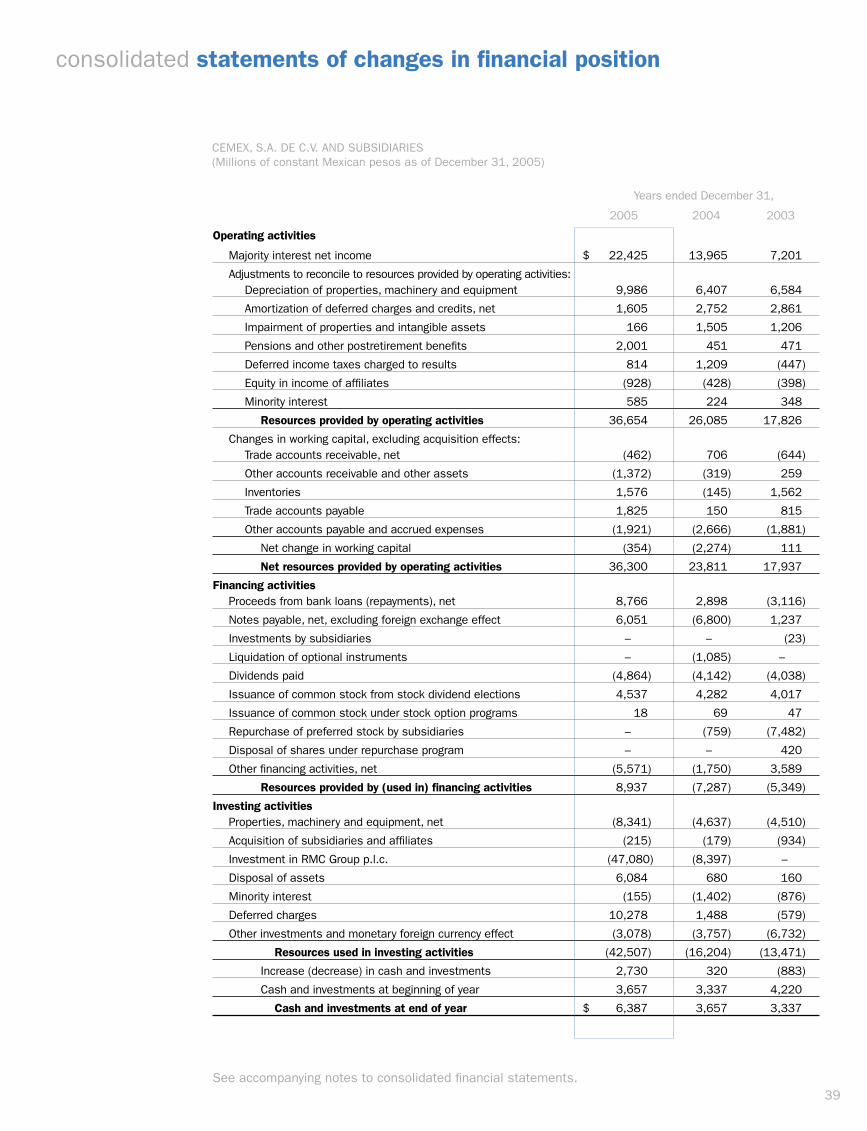
39
consolidated statements of changes in financial position
Years ended December 31,
2005 2004 2003
Operating activities
Majority interest net income $ 22,425 13,965 7,201
Adjustments to reconcile to resources provided by operating activities: Depreciation of properties, machinery and equipment 9,986 6,407 6,584
Amortization of deferred charges and credits, net 1,605 2,752 2,861
Impairment of properties and intangible assets 166 1,505 1,206
Pensions and other postretirement benefits 2,001 451 471
Deferred income taxes charged to results 814 1,209 (447)
Equity in income of affiliates (928) (428) (398)
Minority interest 585 224 348
Resources provided by operating activities 36,654 26,085 17,826
Changes in working capital, excluding acquisition effects: Trade accounts receivable, net (462) 706 (644)
Other accounts receivable and other assets (1,372) (319) 259
Inventories 1,576 (145) 1,562
Trade accounts payable 1,825 150 815
Other accounts payable and accrued expenses (1,921) (2,666) (1,881)
Net change in working capital (354) (2,274) 111
Net resources provided by operating activities 36,300 23,811 17,937
Financing activities Proceeds from bank loans (repayments), net 8,766 2,898 (3,116)
Notes payable, net, excluding foreign exchange effect 6,051 (6,800) 1,237
Investments by subsidiaries – – (23)
Liquidation of optional instruments – (1,085) –
Dividends paid (4,864) (4,142) (4,038)
Issuance of common stock from stock dividend elections 4,537 4,282 4,017
Issuance of common stock under stock option programs 18 69 47
Repurchase of preferred stock by subsidiaries – (759) (7,482)
Disposal of shares under repurchase program – – 420
Other financing activities, net (5,571) (1,750) 3,589
Resources provided by (used in) financing activities 8,937 (7,287) (5,349)
Investing activities Properties, machinery and equipment, net (8,341) (4,637) (4,510)
Acquisition of subsidiaries and affiliates (215) (179) (934)
Investment in RMC Group p.l.c. (47,080) (8,397) –
Disposal of assets 6,084 680 160
Minority interest (155) (1,402) (876)
Deferred charges 10,278 1,488 (579)
Other investments and monetary foreign currency effect (3,078) (3,757) (6,732)
Resources used in investing activities (42,507) (16,204) (13,471)
Increase (decrease) in cash and investments 2,730 320 (883)
Cash and investments at beginning of year 3,657 3,337 4,220
Cash and investments at end of year $ 6,387 3,657 3,337
CEMEX, S.A. DE C.V. AND SUBSIDIARIES(Millions of constant Mexican pesos as of December 31, 2005)
See accompanying notes to consolidated financial statements.

40
balance sheets
CEMEX, S.A. DE C.V. (Parent Company-only)(Millions of constant Mexican pesos as of December 31, 2005)
See accompanying notes to Parent Company-only financial statements (note 25).
December 31, Note 25 2005 2004ASSETS
CURRENT ASSETS
Cash and investments $ – 108
Other accounts receivable B 761 1,014
Related parties accounts receivable G 499 712
Total current assets 1,260 1,834
INVESTMENTS AND NONCURRENT RECEIVABLES
Investments in subsidiaries and affiliated companies C 132,795 100,467
Other investments and noncurrent accounts receivable 2,574 897
Long-term related parties accounts receivable G 20,913 34,037
Total investments and noncurrent accounts receivable 156,282 135,401
LAND AND BUILDINGS
Land 1,691 1,691
Buildings 434 434
Accumulated depreciation (261) (257)
Total land and buildings 1,864 1,868
INTANGIBLE ASSETS AND DEFERRED CHARGES D 3,121 4,259
TOTAL ASSETS $ 162,527 143,362

41
December 31, Note 25 2005 2004LIABILITIES AND STOCKHOLDERS’ EQUITY
CURRENT LIABILITIES
Bank loans F $ 2,039 1,588
Current maturities of long-term debt F 4,365 1,812
Other accounts payable and accrued expenses E 452 674
Related parties accounts payable G 405 6,554
Total current liabilities 7,261 10,628
LONG TERM DEBT
Bank loans F 17,967 9,529
Notes payable F 16,511 15,020
Current maturities of long-term debt F (4,365) (1,812)
Long-term related parties accounts payable G 20,313 24,933
Total long-term debt 50,426 47,670
Other noncurrent liabilities 496 1,407
TOTAL LIABILITIES 58,183 59,705
STOCKHOLDERS’ EQUITY
Common stock-historical cost basis 64 62
Common stock-accumulated inflation adjustments 3,735 3,735
Additional paid-in capital 47,133 42,580
Deficit in equity restatement (82,387) (80,958)
Cumulative initial deferred income tax effects 1,208 1,208
Retained earnings 112,166 103,065
Net income 22,425 13,965
Total stockholders’ equity 104,344 83,657
TOTAL LIABILITIES AND STOCKHOLDERS’ EQUITY $ 162,527 143,362

42
statements of income
CEMEX, S.A. DE C.V. (Parent Company-only)(Millions of constant Mexican pesos as of December 31, 2005, except for earnings per share)
See accompanying notes to Parent Company-only financial statements (note 25).
Years ended December 31,
Note 25 2005 2004 2003
Equity in income of subsidiaries and affiliates $ 23,650 12,661 2,722
Rental income 273 287 299
License fees 724 689 561
Total revenues G 24,647 13,637 3,582
Administrative expenses (58) (39) (60)
Operating income 24,589 13,598 3,522
Comprehensive financing result: Financial expense (4,622) (2,685) (3,347)
Financial income 1,592 1,540 3,333
Results from valuation and liquidation of financial instruments 932 459 16
Foreing exchange result, net (779) 847 (2,788)
Monetary position result 846 1,101 866
Net comprehensive financing result (2,031) 1,262 (1,920)
Other income (expense), net G (768) (1,208) 4,741
Income before income taxes 21,790 13,652 6,343
Income tax benefit and business assets tax, net J 635 313 858
Net income 22,425 13,965 7,201
Basic earnings per share K $ 2.16 1.40 0.76
Diluted earnings per share K $ 2.15 1.39 0.74

43
Years ended December 31,
2005 2004 2003
Operating activities
Net income $ 22,425 13,965 7,201
Ajustments to reconcile to resources provided by operating activities: Depreciation of properties 4 7 6
Amortization of deferred charges and credits, net 128 355 347
Deferred income tax charged to results 1,021 1,085 594
Equity in income of subsidiaries and affiliates (23,650) (12,661) (2,722)
Resources provided by (used in) operating activities (72) 2,751 5,426
Changes in working capital: Other accounts receivable 253 (241) 447
Short-term related parties accounts receivable and payable, net (5,936) 1,736 19,374
Other accounts payable and accrued expenses (222) (2,383) (159)
Net change in working capital (5,905) (888) 19,662
Net resources provided by (used in) operating activities (5,977) 1,863 25,088
Financing activities
Proceeds from bank loans (repayments), net 8,889 5,883 (10,198)
Notes payable, net 1,491 (7,455) (2,396)
Liquidation of optional instruments – (1,085) –
Dividends paid (4,864) (4,142) (4,038)
Issuance of common stock from stock dividend elections 4,537 4,282 4,017
Issuance of common stock under stock option programs 18 69 47
Disposal of shares under repurchase program – – 420
Other financing activities, net (911) (556) 391
Resources provided by (used in) financing activities 9,160 (3,004) (11,757)
Investing activities
Long-term related parties accounts receivable, net 8,504 2,066 (11,210)
Net change in investment in subsidiaries (10,165) (1,687) (7,505)
Dividends received – 272 5,605
Deferred charges 52 276 (52)
Other noncurrent accounts receivable (1,682) 204 (466)
Resources provided by (used in) investing activities (3,291) 1,131 (13,628)
Increase (decrease) in cash and investments (108) (10) (297)
Cash and investments at beginning of year 108 118 415
Cash and investments at end of year $ – 108 118
statements of changes in financial position
CEMEX, S.A. DE C.V. (Parent Company-only)(Millions of constant Mexican pesos as of December 31, 2005)
See accompanying notes to Parent Company-only financial statements (note 25).

44
statements of changes in stockholders’ equity
CEMEX, S.A. DE C.V. AND CEMEX, S.A. DE C.V. AND SUBSIDIARIES(Millions of constant Mexican pesos as of December 31, 2005)
See accompanying notes to financial statements.
Additional Deficit in Cumulative initial Total Total Common paid in equity deferred income Retained majority Minority stockholders’ Note stock capital restatement tax effects earnings interest interest equity
Balances at December 31, 2002 $ 3,790 34,837 (69,700) (5,850) 104,044 67,121 14,102 81,223
Dividends ($0.41 pesos per share) 15A 4 4,013 – – (4,038) (21) – (21)
Issuance of common stock 16 – 47 – – – 47 – 47
Share repurchase program 15A – 420 – – – 420 – 420
Restatement of investments and other transactions relating to minority interest – – – – – – (8,358) (8,358)
Investment by subsidiaries 9 – – (2,952) – – (2,952) – (2,952)
Comprehensive net income (loss) 15G – – (424) – 7,201 6,777 348 7,125
Balances at December 31, 2003 3,794 39,317 (73,076) (5,850) 107,207 71,392 6,092 77,484
Dividends ($0.39 pesos per share) 15A 3 4,279 – – (4,142) 140 – 140
Issuance of common stock 16 – 69 – – – 69 – 69
Liquidation of optional instruments 15F – (1,085) – – – (1,085) – (1,085)
Restatement of investments and other transactions relating to minority interest – – – – – – (2,161) (2,161)
Investment by subsdiaries 9 – – (3,372) – – (3,372) – (3,372)
Comprehensive net income (loss) 15G – – 2,548 – 13,965 16,513 224 16,737
Balances at December 31, 2004 3,797 42,580 (73,900) (5,850) 117,030 83,657 4,155 87,812
Dividends ($0.83 pesos per share) 15A 2 4,535 – – (4,864) (327) – (327)
Issuance of common stock 16 – 18 – – – 18 – 18
Restatement of investments and other transactions relating to minority interest – – – – – – 874 874
Investment by subsidiaries 9 – – (7,866) – – (7,866) – (7,866)
Comprehensive net income (loss) 15G – – 6,437 – 22,425 28,862 584 29,446
Balances at December 31, 2005 $ 3,799 47,133 (75,329) (5,850) 134,591 104,344 5,613 109,957

45
Additional Deficit in Cumulative initial Total Total Common paid in equity deferred income Retained majority Minority stockholders’ Note stock capital restatement tax effects earnings interest interest equity
Balances at December 31, 2002 $ 3,790 34,837 (69,700) (5,850) 104,044 67,121 14,102 81,223
Dividends ($0.41 pesos per share) 15A 4 4,013 – – (4,038) (21) – (21)
Issuance of common stock 16 – 47 – – – 47 – 47
Share repurchase program 15A – 420 – – – 420 – 420
Restatement of investments and other transactions relating to minority interest – – – – – – (8,358) (8,358)
Investment by subsidiaries 9 – – (2,952) – – (2,952) – (2,952)
Comprehensive net income (loss) 15G – – (424) – 7,201 6,777 348 7,125
Balances at December 31, 2003 3,794 39,317 (73,076) (5,850) 107,207 71,392 6,092 77,484
Dividends ($0.39 pesos per share) 15A 3 4,279 – – (4,142) 140 – 140
Issuance of common stock 16 – 69 – – – 69 – 69
Liquidation of optional instruments 15F – (1,085) – – – (1,085) – (1,085)
Restatement of investments and other transactions relating to minority interest – – – – – – (2,161) (2,161)
Investment by subsdiaries 9 – – (3,372) – – (3,372) – (3,372)
Comprehensive net income (loss) 15G – – 2,548 – 13,965 16,513 224 16,737
Balances at December 31, 2004 3,797 42,580 (73,900) (5,850) 117,030 83,657 4,155 87,812
Dividends ($0.83 pesos per share) 15A 2 4,535 – – (4,864) (327) – (327)
Issuance of common stock 16 – 18 – – – 18 – 18
Restatement of investments and other transactions relating to minority interest – – – – – – 874 874
Investment by subsidiaries 9 – – (7,866) – – (7,866) – (7,866)
Comprehensive net income (loss) 15G – – 6,437 – 22,425 28,862 584 29,446
Balances at December 31, 2005 $ 3,799 47,133 (75,329) (5,850) 134,591 104,344 5,613 109,957

46
notes to the consolidated financial statements
CEMEX, S.A. DE C.V. AND SUBSIDIARIESAs of December 31, 2005, 2004 and 2003(Millions of constant Mexican pesos as of December 31, 2005)
1. DESCRIPTION OF BUSINESSCEMEX, S.A. de C.V. (CEMEX or the Company) is a Mexican holding company (parent) of entities whose main activities are oriented to the construction industry, through the production and marketing of cement, ready-mix concrete and aggregates.
2. OUTSTANDING EVENTS IN 2005• On March 1, 2005, CEMEX completed the acquisition of a 100% equity interest in RMC Group p.l.c. (“RMC”). RMC
is one of the largest European cement producers and one of the largest distributors of ready-mix concrete and aggregates in the world. The purchase price of the shares, considering the 18.8% equity interest acquired in 2004 for approximately U.S.$786 million, net from the sale of certain assets, and considering acquisition expenses, amounted to approximately U.S.$4,217 million, not including approximately U.S.$2,249 million of assumed debt (note 9).
• On April 28, 2005, CEMEX stockholders approved a stock split, which became effective on July 1, 2005. In connection with the stock split, each of CEMEX’s series A shares was surrendered in exchange for two new series A shares, and each of CEMEX’s series B shares was surrendered in exchange for two new series B shares. The proportional equity interest of existing stockholders did not change as a result of the stock split (note 15).
• On October 3, 2005, CEMEX completed a secondary public offering of Ordinary Participation Certificates (“CPOs”) and American Depositary Shares (“ADSs”), which included the sale of 22,943,340 ADSs (placed in international markets) and 80,500,000 CPOs (placed in the Mexican market). The CPOs and ADSs placed in the offering were owned by financial institutions, and were the underlying securities in equity forward contracts in the Company’s own stock negotiated by CEMEX with those institutions. From the offering proceeds of approximately U.S.$1,500 million, after related expenses, approximately U.S.$1,300 million were used to settle the Company’s obligations under such forward contracts (note 17).
3. SIGNIFICANT ACCOUNTING POLICIESA) BASIS OF PRESENTATION AND DISCLOSUREThe financial statements and accompanying notes of the Parent Company (note 25), presented in addition to the consolidated financial statements, are included in order to comply with legal requirements in Mexico as an independent legal entity.
The accompanying financial statements have been prepared in accordance with Generally Accepted Accounting Principles in Mexico (“Mexican GAAP”), which recognize the effects of inflation on the financial information.
When reference is made to “pesos” or “$”, it means Mexican pesos. When reference is made to “dollars” or “U.S.$”, it means millions of dollars of the United States of America (“United States”). When reference is made to “£” or “pounds”, it means British Sterling Pounds. Except when specific references are made to “earnings per share” and “prices per share or per instrument”, the amounts in these notes are stated in millions of constant Mexican pesos as of the latest balance sheet date.
When reference is made to “CPO” or “CPOs” it means the Ordinary Participation Certificates of CEMEX. As a result of the stock split previously mentioned, each CPO was surrendered in exchange for two new CPOs. Each new CPO represents the participation in two new series “A” shares and one new series “B” share of the common stock.
References to “ADS” or “ADSs” refer to American Depositary Shares, listed on the New York Stock Exchange (“NYSE”). The number of CEMEX’s outstanding ADSs did not change as a result of the stock split; instead the ratio of CPOs to ADSs was modified so that each ADS now represents ten new CPOs. All amounts in CPOs, shares and prices per share for 2004 and 2003 included in the financial statements and their accompanying notes have been adjusted to retroactively reflect the stock split.
Certain amounts reported in the consolidated financial statements and these notes as of December 31, 2004 and 2003 have been reclassified to conform to the presentation as of December 31, 2005.
B) RESTATEMENT OF COMPARATIVE FINANCIAL STATEMENTSThe restatement factors applied to the consolidated financial statements of prior periods were calculated using the weighted average inflation and the fluctuation in the exchange rate of each country in which the Company operates relative to the peso.

47
The restatement factors for the Parent Company-only financial statements for prior periods were calculated using Mexican inflation.
Weighted Mexican average inflation factor factor2004 to 2005 0.9590 1.03002003 to 2004 1.0624 1.05392002 to 2003 1.1049 1.0387
Common stock and additional paid-in capital are restated by Mexican inflation. The weighted average inflation factor is used for all other restatement adjustments to stockholders’ equity.
C) PRINCIPLES OF CONSOLIDATIONThe consolidated financial statements include those of CEMEX and the subsidiary companies in which the Company holds more than 50% of their common stock and/or has control. All significant balances and transactions between related parties have been eliminated in consolidation.
Financial statements of joint ventures are consolidated through the proportionate consolidation method, based on International Accounting Standard 31, “Interests in Joint Ventures”. The Company applies full consolidation or the equity method, as applicable, for those joint ventures in which one of the venture partners controls the entity’s administrative, financial and operating policies.
As of December 31, 2005, the main operating subsidiaries, ordered by holding company, and the percentage of interest directly held by their immediate holding company, are as follows:
Subsidiary Country % interestCEMEX México, S. A. de C.V. 1 Mexico 100.0 CEMEX España, S.A. 2 Spain 99.7 CEMEX Venezuela, S.A.C.A. Venezuela 75.7 CEMEX, Inc. United States 100.0 CEMEX (Costa Rica), S.A. Costa Rica 99.1 Assiut Cement Company Egypt 95.8 CEMEX Colombia, S.A. Colombia 99.7 Cemento Bayano, S.A. Panama 99.3 CEMEX Dominicana, S.A. Dominican Republic 99.9 CEMEX de Puerto Rico, Inc. Puerto Rico 100.0 RMC France, S.A.S. France 100.0 CEMEX Asia Holdings Ltd. 3 Singapore 100.0 Solid Cement Corporation 4 Philippines 99.9 APO Cement Corporation 4 Philippines 99.9 CEMEX (Thailand) Co. Ltd. Thailand 100.0 CEMEX U.K. Ltd. 5 United Kingdom 100.0 CEMEX Investments Limited United Kingdom 100.0 CEMEX Deutschland, AG. Germany 100.0 CEMEX Austria p.l.c. Austria 100.0 Dalmacijacement d.d. Croatia 99.2 CEMEX Czech Republic, s.r.o. Czech Republic 100.0 CEMEX Polska sp. z.o.o. Poland 100.0 Danubiusbeton Betonkészító Kft. Hungary 100.0 Readymix Plc. 6 Ireland 61.7 CEMEX Holdings (Israel) Ltd. Israel 100.0 SIA CEMEX Latvia 100.0 RMC Topmix LLC, Gulf Quarries Company, RMC Supermix LLC y Falcon Cement LLC 7 United Arab Emirates 100.0
1. CEMEX México, S.A. de C.V. (“CEMEX Mexico”) holds 100% of the shares of Empresas Tolteca de México, S.A. de C.V. (“ETM”) and Centro Distribuidor de Cemento, S.A. de C.V. (“Cedice”). CEMEX Mexico indirectly holds CEMEX España, S.A. and subsidiaries.
2. CEMEX España, S.A. is the indirect holding company of all CEMEX’s international operations, including those acquired from RMC.3. In December 2005, the Company acquired an additional 0.9% equity interest in CEMEX Asia Holdings Ltd. (“CAH”) (note 9A). As of
December 31, 2005, this acquisition is pending for registration with the Singapore authorities.4. Represents the Company’s interest, held through CAH, in the economic benefits of these entities.5. CEMEX U.K. Ltd. is the indirect holding company of the entities that control the operations acquired in 2005 from RMC, except
those located in the United States and France.6. The Irish subsidiary is a public company, whose main minority shareholder is the Bank of Ireland Nominees Ltd., which owns
approximately 14.2% of the subsidiary’s common stock.7. CEMEX owns 49% of the common stock and obtains 100% of the economic benefits of the operating subsidiaries in that country,
through an agreement with other shareholders.

48
D) BUSINESS COMBINATIONS (notes 9 and 23)Based on Bulletin B-7, “Business Acquisitions”, which is effective for business combinations beginning on January 1, 2005, CEMEX applies the following accounting guidelines: a) adoption of the purchase method as the sole valuation method for the accounting of acquired business; b) allocation of the purchase price to all assets acquired and liabilities assumed based on their fair value as of the acquisition date; c) goodwill is not amortized and is subject to periodic impairment evaluations; d) intangible assets acquired are identified, valued and recognized; and e) the unallocated portion of the purchase price represents goodwill.
E) FOREIGN CURRENCY TRANSACTIONS AND TRANSLATION OF FOREIGN CURRENCY FINANCIAL STATEMENTSTransactions denominated in foreign currencies are recorded at the exchange rates prevailing on the dates of their execution. Monetary assets and liabilities denominated in foreign currencies are adjusted into pesos at the exchange rates prevailing at the balance sheet date and the resulting foreign exchange fluctuations are recognized in earnings, except for the exchange fluctuations arising from foreign currency indebtedness directly related to the acquisition of foreign entities and the fluctuations associated with related parties balances denominated in foreign currency that are of a long-term investment nature, which are recorded against stockholders’ equity, as part of the foreign currency translation adjustment of foreign subsidiaries.
The financial statements of foreign subsidiaries are restated in their functional currency based on the subsidiary country’s inflation rate and subsequently translated by using the foreign exchange rate at the end of the reporting period for balance sheet and income statement accounts. The peso to U.S. dollar exchange rate used by CEMEX is an average of free market rates available to settle its foreign currency transactions.
F) CASH AND INVESTMENTS (note 4)Investments in this caption are held for trading purposes. Those investments in fixed-income securities are recorded at cost plus accrued interest. Investments in marketable securities are recorded at market value. Gains or losses resulting from changes in market values, accrued interest and the effects of inflation are included in the income statements as part of the Comprehensive Financing Result.
G) INVENTORIES AND COST OF SALES (note 7)Inventories are recognized at the lower of replacement cost or market value. Replacement cost is based on the latest purchase price, the average price of the last purchases or production cost. Cost of sales reflects replacement cost of inventories at the time of sale, expressed in constant pesos as of the balance sheet date.
The Company analyzes its inventory balances to determine if, as a result of internal events, such as physical damage, or external events, such as technological changes or market conditions, certain portions of such balances have become obsolete or impaired. When an impairment situation arises, the inventory balance is adjusted to its net realizable value, whereas, if an obsolescence situation occurs, the inventory obsolescence reserve is increased. In both cases, these adjustments are recognized against the results of the period.
H) INVESTMENTS AND NONCURRENT RECEIVABLES (note 9)Investments in affiliated companies are accounted for by the equity method, when the Company holds between 10% and 50% of the issuer’s capital stock, and does not have effective control. Under the equity method, after acquisition, the investment’s original cost is adjusted for the proportional interest of the holding company in the affiliate’s equity and earnings, considering the effects of inflation.
Other long-term investments, included under this caption, are recognized at their estimated fair value, and their changes in valuation are included in the results of the period as part of the Comprehensive Financing Result.
I) PROPERTIES, MACHINERY AND EQUIPMENT (note 10)Properties, machinery and equipment (“fixed assets”) are presented at their restated value, using the inflation index of the fixed assets’ origin country and the variation in the foreign exchange rate between the country of origin currency and the Company’s functional currency. Depreciation is calculated using the straight-line method over the estimated useful lives. The maximum useful lives by category of fixed assets are as follows:
YearsAdministrative buildings 50Industrial buildings 35Machinery and equipment in plant 20Ready-mix trucks and motor vehicles 8Office equipment and other assets 10
Properties, machinery and equipment are subject to impairment evaluations (note 3K). The Comprehensive Financing Results arising from indebtedness incurred during the construction or installation period of fixed assets are capitalized as part of the carrying value of such assets.
J) INTANGIBLE ASSETS AND DEFERRED CHARGES (note 11)Intangible assets acquired, as well as costs incurred in the development stages of intangible assets, are capitalized when associated future benefits are identified and the control over such benefits is established. Expenditures not meeting these requirements are charged to earnings as incurred. Intangible assets are presented at their restated value and are classified as having a definite life, which are amortized over the benefited periods, and as having an indefinite life, which are not amortized since the period cannot be accurately established in which the benefits associated with such intangibles will terminate. Amortization of intangible assets of definite life is calculated under the straight-line method.
49
Intangible assets acquired in a business combination are accounted for at fair value at the acquisition date. When the value cannot be reasonably estimated, such value is included as part of goodwill, which is not amortized since January 1, 2005 and is subject to periodic impairment tests (note 3K). Until December 31, 2004, goodwill was amortized under the present worth or sinking fund method, which was intended to provide a better matching of goodwill amortization with the revenues generated from the acquired companies. Goodwill generated before 1992 was amortized over a maximum period of 40 years, while goodwill generated from 1992 to 2004 was amortized over a maximum period of 20 years.
Direct costs incurred in debt issuances or borrowings are capitalized and amortized as part of the effective interest rate of each transaction over its maturity. These costs include discounts, commissions and professional fees. Direct costs incurred in the development stage of computer software for internal use are capitalized and amortized through the operating results over the useful life of the software, which is approximately 4 years.
Preoperational expenses are recognized in the income statement as they are incurred. Those preoperative expenses deferred until December 31, 2003, in compliance with regulations effective as of that date, continue to be amortized over their original periods.
K) IMPAIRMENT OF LONG LIVED ASSETS (notes 10 and 11)The Company evaluates the balances of its machinery and equipment, intangible assets of definite life and other investments to establish if factors such as the occurrence of a significant adverse event, changes in the operating environment in which the Company operates, changes in projected use or in technology, as well as expectations of operating results for each cash generating unit, provide elements indicating that the book value may not be recovered, in which case an impairment loss is recorded in the income statement for the period when such determination is made, resulting from the excess of the carrying amount over the net present value of estimated cash flows related to such assets.
Likewise, CEMEX periodically evaluates the balances of goodwill and other intangible assets of indefinite life by determining the cash flows to be generated by the reporting units to which those assets relate. A reporting unit refers to a group of one or more cash generating units. Cash flows are discounted at present value, and an impairment loss is recognized if such discounted cash flows are lower than the net book value of the reporting unit.
L) DERIVATIVE FINANCIAL INSTRUMENTS (notes 12 and 17)In compliance with the guidelines established by the Risk Committee, CEMEX uses derivative financial instruments, in order to change the risk profile associated with changes in interest rates and exchange rates of foreign currency denominated debt instruments, as a vehicle to reduce financing costs (note 12); as an alternative source of financing (note 17), and as hedges of: (i) forecasted transactions, (ii) net assets in foreign subsidiaries and (iii) executive stock option programs (note 16).
Derivative financial instruments are recognized as assets or liabilities in the balance sheet at their estimated fair value and the changes in such values are recognized in the income statement for the period in which they occur, unless such instruments have been designated as accounting hedges of debt or equity instruments. Until December 31, 2004, no specific rules existed in Mexico for hedging transactions. Beginning January 1, 2005, Bulletin C-10, “Derivative Financial Instruments and Hedging Activities”, establishes accounting standards for hedging instruments.
Until December 31, 2004, as a result of the absence of specific rules for designated transactions that qualify as hedging activities, CEMEX applied the following accounting rules, which remained effective in 2005, since they comply with the rules set forth in Bulletin C-10:
a) Changes in the estimated fair value of interest rate swaps to exchange floating rates for fixed rates, designated as accounting hedges of the variability in the cash flows associated with the interest expense of a portion of the contracted debt, as well as those instruments negotiated to hedge the interest rates at which certain forecasted debt is expected to be contracted or existing debt is expected to be renegotiated, are recognized temporarily in stockholders’ equity (note 15G). These effects are reclassified to earnings, in the case of the forecasted debt, once the related debt is recognized in the balance sheet and its related financial expense is accrued.
b) Changes in the estimated fair value of foreign currency forwards, designated as hedges of a portion of the Company’s net investments in foreign subsidiaries, are recognized in stockholders’ equity, offsetting the foreign currency translation result (notes 3E and 15D). The accumulated effect in stockholders’ equity is reversed through the income statement upon disposition of the foreign investment.
c) Beginning in January 1, 2005, changes in fair value of all forward contracts in the Company’s own shares are recognized in the income statement as part of the comprehensive financial result. Until December 31, 2004, only the effect of those contracts designated as hedges for executive stock option programs (note 16) were recognized in the income statement as part of the costs related to such programs. The results derived from equity forward contracts not designated as hedges of the stock option programs during 2004 and 2003, and from equity instruments (appreciation warrants) during 2003, were recognized in stockholders’ equity upon settlement (notes 15F and 17A).
d) Changes in fair value of derivative instruments, such as foreign currency forward contracts or options, negotiated to hedge a firm commitment are recognized through stockholders’ equity, following the cash flow hedging model, and are reclassified to the income statement once the operation underlying the firm commitment takes place, as the effects from the hedged item are reflected in the income statement. With respect to hedges of the foreign exchange risk associated with a firm commitment for the acquisition of a net investment in a foreign country (note 17B), the accumulated effect in stockholders’ equity is reclassified to the income statement when the purchase occurs.

50
e) Changes in fair value of the following derivative instruments are recognized in the income statement within the valuation and liquidation of financial instruments: (i) interest rate swaps not designated as cash flow hedges; (ii) derivative instruments for the exchange of interest rates and currencies (Cross Currency Swaps or “CCS”), negotiated to change the profile of the interest rate and currency of existing debt; and (iii) other derivative instruments not identified with a particular exposure.
Until December 31, 2004, financial debt related to CCS, was presented in the balance sheet as if it had been negotiated in the exchanged currencies, through the reclassification to such debt of a portion of the assets or liabilities resulting from the estimated fair value recognition of such CCS. The non-reclassified portion, resulting mainly from the difference between the forward exchange rates and those in effect as of the balance sheet date, remained within other assets or other liabilities. Beginning on January 1, 2005, Bulletin C-10, does not allow the synthetic presentation of two financial instruments, the primary position and the derivative instrument, as if they were a single instrument; therefore, the reclassification mentioned above was discontinued; consequently, financial debt related to CCS is presented in the currencies originally negotiated.
Interest accruals generated by interest rate swaps and CCS, are recognized as financial expense, adjusting the effective interest rate of the related debt. Interest accruals from other hedging derivative instruments are recorded within the same item when the effects of the primary instrument subject to the hedging relation are recognized. Transaction costs are deferred and amortized in earnings over the life of the instrument or immediately upon settlement.
Derivative instruments are negotiated with institutions with significant financial capacity; therefore, the Company considers the risk of non-performance of the obligations agreed to by such counterparties to be minimal. The estimated fair value represents the amount at which a financial asset could be bought or sold, or a financial liability could be extinguished, between willing parties in an arm’s length transaction. Occasionally, there is a reference market that provides the estimated fair value; in the absence of a market, such value is determined by the net present value of projected cash flows or through mathematical valuation models. The estimated fair values of derivative instruments, determined by CEMEX and used for recognition and disclosure purposes in the financial statements and their notes, are supported by the confirmations of these values received from the financial counterparties.
M) ASSET RETIREMENT OBLIGATIONS (note 13)Beginning in 2003, the Company recognizes unavoidable obligations, legal or assumed, to restore the site or the environment when removing operating assets at the end of their useful lives. These obligations represent the net present value of expected cash outflows to be incurred in the restoration process, and are initially recognized against the related assets’ book value. The additional asset is depreciated during its remaining useful life. The increase in the liability, by the passage of time, is charged to results of the period. Adjustments to the obligation for changes in the estimated cash flows or the estimated disbursement period are made against fixed assets and depreciation is modified prospectively.
Asset retirement obligations in the case of CEMEX are related mainly to future costs of demolition, cleaning and reforestation, derived from commitments, both legal or assumed, so that at the end of the operation, the sites where raw material is extracted, the maritime terminals and other production sites, are left in acceptable condition. For those situations identified and quantified, effective January 1, 2003, a remediation liability was recorded for approximately $515, against fixed assets for $372, deferred income tax assets for $56 and an initial cumulative effect for $87, which was recorded in stockholders’ equity as an element of comprehensive net income. Before 2003, CEMEX had already provided accruals for certain situations.
N) CONTINGENCIES AND COMMITMENTS (note 22)Obligations or losses, related to contingencies, are recognized as liabilities in the balance sheet when present obligations exist, and when, as a result of past events, it is probable that the effects will materialize and can be reasonably quantified. Otherwise, a qualitative disclosure is included in the notes to the financial statements. The effects of long-term commitments established with third parties, such as supply contracts formalized with suppliers or clients, are recognized in the financial statements on the incurred or accrued basis, taking into consideration the substance of the agreements.
Relevant commitments are disclosed in the notes to the financial statements. The Company does not recognize contingent revenues, income or assets.
O) PENSIONS AND OTHER POSTRETIREMENT BENEFITS (note 14)The costs related to benefits to which employees are entitled by pension plans and other postretirement benefits, including medical expenses, life insurance, severance payments and seniority premiums, legally or by Company grant, are recognized in the operating results, as services are rendered, based on actuarial estimations of the benefits’ present value. The amortization of prior service cost (transition asset) and of changes in assumptions and adjustments based on experience is recognized over the employee’s estimated active service life. For certain pension plans, irrevocable trust funds have been created to cover future benefit payments.
The actuarial assumptions upon which the Company’s employee benefit liabilities are determined consider the use of real rates (nominal rates discounted by inflation). Until December 31, 2004, postemployment benefits paid upon termination of the working relationship but before retirement, such as severance benefits, were recognized as an expense in the year in which they were paid. In some circumstances, however, provisions were made for these benefits. Starting January 1, 2005, according to Bulletin D-3, “Labor Obligations”, the costs related to severance benefits are recognized over the estimated active service life of the employees.
P) DEFICIT IN EQUITY RESTATEMENT (note 15)The deficit in equity restatement includes: (i) the accumulated effect from holding non-monetary assets; (ii) the currency translation effects from foreign subsidiaries’ financial statements, net of exchange fluctuations arising from foreign currency indebtedness directly related to the acquisition of foreign subsidiaries and foreign currency related parties balances that are of a long-term investment nature (notes 3E and 15D); and (iii) valuation and liquidation effects of certain derivative financial instruments that qualify as hedge instruments, which are recorded temporarily or permanently in stockholders’ equity (note 3L).
51
Q) COMPREHENSIVE NET INCOME (note 15G)The Company presents comprehensive net income and its components as a single item in the statement of changes in stockholders’ equity. Comprehensive net income represents the change in stockholders’ equity during a period for transactions and other events not representing contributions, reductions or distributions of capital.
R) EXECUTIVE STOCK OPTION PROGRAMS (note 16)Until December 31, 2004, the Company recognized the cost associated with executive stock options programs as part of the cost of the period, using the intrinsic value method, for those options which, as of the grant date, it was not known the exercise price at which the underlying shares would be exercised, because such exercise price is increasing (variable) over the life of the options, and did not imply the issuance of new shares upon exercise. The intrinsic value method represents the existing appreciation between the market price of the share and the exercise price established in the option. The Company did not recognize cost for those programs in which the exercise price was equal to the CPO price at the option’s grant date, remained fixed for the life of the option and implied the issuance of new shares upon exercise.
Beginning in 2005, under Mexican GAAP, the Company adopted the International Financial Reporting Standard No. 2, “Shared-based Payment” (“IFRS 2”). Based on IFRS 2, options granted to executives are defined as equity instruments, in which services received from employees are settled through the delivery of shares; or as liability instruments, in which the Company incurs a liability by committing to pay, in cash or other instruments, the intrinsic value of the option as of the exercise date. The Company determined that the options in its fixed program (note 16) are defined as equity instruments, while the other programs (note 16) are liability instruments. The cost of equity instruments represents their estimated fair value at the date of grant and is recognized in earnings during the instruments’ vesting period. Liability instruments under IFRS 2 are valued at their estimated fair value at each reporting date, recognizing the changes in valuation through the income statement. The estimated fair value of options should be determined using financial option pricing models.
In addition, under IFRS 2, a cost should be recognized for those equity instruments which as of the adoption date have a remaining vesting period. Regarding the Company’s fixed program, as of the adoption date, the exercise rights were fully vested. In respect to the liability instruments, CEMEX determined the estimated fair value of the outstanding options in the different programs and recognized in the income statement an expense of approximately $992 ($860 after income tax), resulting from the difference between the estimated fair value of the instruments and the existing accrual related to such programs, which was quantified through the intrinsic value of the options. This expense was recognized as the initial cumulative effect of changes in accounting standards and is presented within the results from valuation and liquidation of financial instruments. In accordance with Bulletin A-7, “Comparability”, the Company did not restate the financial information of prior years in connection with the accounting change mentioned above.
Had the Company used the same accounting rules during the years ended December 31, 2004 and 2003, net income as well as basic net earnings per share would have been as follows:
2004 2003
Majority net income as reported $ 13,965 7,201Options’ fair value 1 (363) (454)Majority net income pro forma $ 13,602 6,747
Basic earnings per share as reported 1.40 0.76Basic earnings per share pro forma 1.36 0.71
1 In order to determine fair value in 2004 and 2003, considering the different exchanges of options which had previously occurred, CEMEX opted for simplicity to value the same portfolio of options outstanding as of the adoption date in 2005, as if it had been in effect in 2004 and 2003, using the market prices and other assumptions prevailing during those years in the option pricing models.
S) INCOME TAX, BUSINESS ASSETS TAX, EMPLOYEES’ STATUTORY PROFIT SHARING AND DEFERRED INCOME TAXES (note 18) The Income Tax (“IT”), Business Assets Tax (“BAT”) and Employees’ Statutory Profit Sharing (“ESPS”), reflected in the income statements, include amounts incurred during the period and the effects of deferred IT and ESPS. Consolidated deferred IT represents the summary of the effect determined in each subsidiary by the assets and liabilities method, by applying the enacted statutory income tax rate to the total temporary differences resulting from comparing the book and taxable values of assets and liabilities, considering when the effects became available and subject to a recoverability analysis, reflecting tax loss carryforwards as well as other recoverable taxes and tax credits. The effect of a change in the effective statutory tax rate is recognized in the income statement for the period in which the change occurs and is officially declared. The effect of deferred ESPS is recognized for those temporary differences, which are of a non-recurring nature, arising from the reconciliation of the net income for the period and the taxable income for the period for ESPS.
The cumulative initial effect, arising from the adoption of the asset and liability method, was recognized on January 1, 2000 in stockholders’ equity under the caption “Cumulative initial deferred income tax effects”. In the statement of changes in stockholders’ equity, the cumulative initial effect corresponds to the consolidated entity. The difference between the Parent Company’s and the consolidated accumulated initial deferred IT effects is included under the caption “Deficit in Equity Restatement”.

52
T) REVENUE RECOGNITIONRevenue is recognized upon shipment of cement, ready-mix concrete and aggregates to customers, and they assume the risk of loss. Income from activities other than the Company’s main line of business is recognized when the revenue has been realized, thorough goods delivered or services rendered, and there is no condition or uncertainty implying a reversal thereof.
U) MONETARY POSITION RESULTThe monetary position result, which represents the gain or loss from holding monetary assets and liabilities in inflationary environments, is calculated by applying the inflation rate of the country of each subsidiary to its net monetary position (difference between monetary assets and liabilities).
V) OTHER INCOME AND EXPENSEOther income and expense, in the statements of income, consists primarily of goodwill amortization until 2004, dumping duties, results from the sales of fixed assets, impairment losses of long-lived assets, net results from the early extinguishment of debt and other unusual or non-recurring transactions.
W) USE OF ESTIMATES The preparation of financial statements requires management to make estimates and assumptions that affect reported amounts of assets and liabilities and the disclosure of contingent assets and liabilities at the date of the financial statements, as well as the reported amounts of revenues and expenses during the period. The main captions subject to estimates and assumptions include the book value of fixed assets, allowances for doubtful accounts, inventories and assets for deferred income taxes, the fair market values of financial instruments and the assets and liabilities related to labor obligations. Actual results could differ from these estimates.
X) CONCENTRATION OF CREDIT CEMEX sells its products primarily to distributors in the construction industry, with no specific geographic concentration within the countries in which the Company operates. No single customer accounted for a significant amount of the Company’s sales in 2005, 2004 and 2003, and there were no significant accounts receivable from a single customer for the same periods. In addition, there is no significant concentration of a specific supplier relating to the purchase of raw materials.
4. CASH AND INVESTMENTSConsolidated cash and investments as of December 31, 2005 and 2004 consists of:
2005 2004
Cash and bank accounts $ 3,532 1,549Fixed-income securities 2,384 1,650Investments in marketable securities 471 458 $ 6,387 3,657
5. TRADE ACCOUNTS RECEIVABLEThe Company evaluates each of its customers’ credit and risk profiles in order to establish the required allowance for doubtful accounts. Consolidated trade accounts receivable as of December 31, 2005 and 2004, include allowances for doubtful accounts of $1,242 and $725, respectively.
As of December 31, 2005 and 2004, the Company has established sales of trade accounts receivable programs with financial institutions (“securitization programs”) in Mexico, United States and Spain, through which accounts receivable have been sold for $7,334 (U.S.$691) and $6,822 (U.S.$642), respectively. Through these programs, the Company effectively surrenders control, risks and the benefits associated with the accounts receivable sold; therefore, the amount of accounts receivable sold is recognized as a sale of financial assets and the balances are removed from the balance sheet at the moment of sale, except for the amounts that the counterparties have not paid, which are reclassified to other accounts receivable (note 6). The accounts receivable qualifying for sale do not include amounts over certain days past due or concentrations over certain limits to any one customer, according to the terms of the programs. Expenses incurred under these programs, originated by the discount granted to the acquirers of the accounts receivable, are recognized in the income statements and were approximately $210 (U.S.$20) in 2005, $121 (U.S.$11) in 2004 and $109 (U.S.$10) in 2003.
6. OTHER ACCOUNTS RECEIVABLEConsolidated other accounts receivable as of December 31, 2005 and 2004 consist of:
2005 2004
Non-trade accounts receivable $ 4,849 1,160Advances and valuation of derivative instruments (notes 12 and 17) 964 1,762Interest and notes receivable 1,389 1,148Advances for travel expenses and loans to employees 262 415Refundable taxes 772 372 $ 8,236 4,857
Non-trade accounts receivable are mainly originated by the sale of assets. Interest and notes receivable include $1,369 (U.S.$129) in 2005 and $1,114 (U.S.$105) in 2004, arising from securitization programs (note 5).

53
7. INVENTORIESConsolidated balances of inventories as of December 31, 2005 and 2004 are summarized as follows:
2005 2004
Finished goods $ 3,330 1,607Work-in-process 1,712 1,538Raw materials 2,563 639Supplies and spare parts, net of obsolescence provision 2,523 2,404Advances to suppliers 351 255Inventory in transit 536 315 $ 11,015 6,758
In December 2004, impairment losses of approximately $182 were recognized within other expenses (note 3G).
8. OTHER CURRENT ASSETSOther current assets in the consolidated balance sheets as of December 31, 2005 and 2004 consist of:
2005 2004
Advance payments $ 1,047 452Assets held for sale 650 554 $ 1,697 1,006
Assets held for sale are stated at their estimated realizable value and mainly consist of: (i) non-cement related assets acquired in business combinations and (ii) assets held for sale received from customers as payment of trade receivables.
9. INVESTMENTS AND NONCURRENT ACCOUNTS RECEIVABLEA) INVESTMENTS IN SUBSIDIARIES AND AFFILIATED COMPANIESConsolidated investments in affiliated companies as of December 31, 2005 and 2004 are summarized as follows:
2005 2004
Book value at acquisition date $ 5,034 12,635Revaluation by equity method 3,889 3,338 $ 8,923 15,973
Investments held by subsidiaries in CEMEX shares, amounting to $19,864 (314,308,790 CPOs) in 2005 and $11,999 (154,014,032 CPOs) in 2004, are offset against majority interest stockholders’ equity in the accompanying financial statements.
The Company’s principal acquisitions and divestitures during 2005, 2004 and 2003 are as follows:
I. On March 1, 2005, following board and shareholders approval and clearance from applicable regulators, CEMEX completed the acquisition of 100% of the outstanding stock of RMC Group p.l.c. (“RMC”). The purchase price of the shares, considering the 18.8% equity interest acquired in 2004 for approximately U.S.$786, net from the sale of certain assets and considering acquisition expenses, amounted to approximately U.S.$4,217 ($44,787). This amount does not include approximately U.S.$2,249 ($23,886) of assumed debt. RMC, headquartered in the United Kingdom, was one of Europe’s largest cement producers and one of the world’s largest suppliers of ready-mix and aggregates. RMC had operations in 22 countries, primarily in Europe and the United States, and employed over 26,000 people. In 2004, RMC sold 14.4 million tons of cement, 51.4 million cubic meters of ready-mix and 131.6 million tons of aggregates. The assets acquired include 13 cement plants with total installed capacity of approximately 17 million tons, located in the United Kingdom, the United States, Germany, Croatia, Poland and Latvia.
The acquisition, which began in September 2004 through a public purchase offer, was subject to the approval by RMC shareholders and applicable regulators in Europe and the United States.
On December 22, 2005 CEMEX terminated its joint ventures with the French construction materials company Lafarge S.A. (“Lafarge”), through the sale to Lafarge of its 50% equity interest in ReadyMix Asland S.A. (“RMA”) in Spain and Betecna Betao Pronto S.A. (“Betecna”) in Portugal after receiving regulatory approval from the applicable regulators. Subsequent to the sale and according to the terms of the agreement, CEMEX acquired from RMA assets in the ready-mix and aggregates sector, representing 29 concrete plants and 5 aggregate quarries. The net sale price, considering the purchase of assets from RMA, was approximately U.S.$61. The Company’s equity interest in RMA and Betecna was acquired through the purchase of RMC. The consolidated income statement for the year ended December 31, 2005, includes the operating results of RMA and Betecna from March 1 to December 22, 2005, and both companies were consolidated through the proportionate consolidation method (note 3C).
In addition, as a condition of the authorities in the United States to approve the acquisition of RMC, on August 29, 2005, ready-mix assets were sold to California Portland Cement Company in the area of Tucson, AZ, for an approximate amount of U.S.$16. These assets derived from RMC’s operations in the United States.

54
II. On July 1, 2005, CEMEX Inc., the Company’s subsidiary in the United States, and Ready Mix USA, Inc. (“Ready Mix USA”), a private ready-mix producer with operations in the Southeastern United States, established two joint ventures to satisfy construction needs in that region. Under the terms of the arrangement, CEMEX Inc. contributed a to a cement joint venture, two cement plants (Demopolis, AL and Clinchfield, GA) and eleven cement terminals in exchange for a 50.01% equity interest in this entity. To a second joint venture, CEMEX Inc. contributed ready-mix, aggregates and concrete blocks plants in Florida and Georgia, in exchange for a 49.99% equity interest in such venture. Ready Mix USA contributed all its ready-mix concrete and aggregate operations in Alabama, Georgia, the Florida Panhandle and Tennessee, as well as its concrete block operations in Arkansas, Tennessee, Mississippi, Florida and Alabama, in exchange for a 49.99% equity interest in the cement joint venture and a 50.01% equity interest in the ready-mix concrete and aggregates joint venture. In addition, on September 1, 2005, CEMEX sold to the ready-mix joint venture 27 ready-mix plants and 4 concrete block facilities located in the Atlanta, GA area, as well as working capital related to these assets, in exchange for approximately U.S$125.
After the third year of the strategic alliance and for a 25-year period, Ready Mix USA will have the right, but not the obligation, to require CEMEX to acquire the interests contributed by Ready Mix USA to the joint ventures. As of December 31, 2005, CEMEX has control and consolidates in the balance sheet the cement joint venture, while Ready Mix USA controls the joint venture that manages the ready-mix and construction materials assets; therefore, CEMEX interest in this business is accounted for by the equity method.
III. In March 2005, the Company sold the Charlevoix, Michigan, and Dixon, Illinois cement plants, both in the United States, including a cement terminal located in the Great Lakes region to Votorantim Participações S.A., for an aggregate purchase price of approximately U.S.$413. The combined capacity of the two cement plants sold was approximately two million tons per year and the operations of these plants represented approximately 9% of CEMEX’s annual operating cash flow in the United States before the RMC acquisition. The consolidated income statement for the year ended December 31, 2005 includes the results of operations relating to these plants for the three-month period ended March 31, 2005.
IV. On December 23, 2005 the Company acquired 0.9% (93,241 shares) of CAH, stock that remained owned by third parties, for approximately U.S.$8 ($84). In 2004, CEMEX acquired approximately 20.6% (2,093,667 shares) of CAH stock in exchange for a cash payment of approximately U.S.$70 and 27,850,713 CPOs, with a value of approximately U.S.$172 ($1,837), recognizing a loss of $960 in equity in 2004 as part of comprehensive income (loss), resulting from the excess of the price paid over the book value of the shares. CAH is the holding company of the subsidiaries in the Philippines, Thailand and Bangladesh, as well as the investment in Indonesia. CAH was constituted in 1999 by CEMEX and institutional investors in Asia with the objective of investing in that region. Through these operations, the Company’s interest on CAH increased to 100%.
V. On April 26, 2005, CEMEX concluded the divestiture of its 11.9% equity interest in the Chilean cement company Cementos Bio Bio, S.A., for approximately U.S.$65 ($690), recognizing a gain of $207 within the caption of other income. Until the date of the sale, this investment was accounted for by the equity method.
VI. In August and September 2003, for a combined price of approximately U.S.$100 ($1,142), CEMEX, Inc. acquired Mineral Resource Technologies, Inc. (“MRT”), distributor of minerals used in manufacturing of ready-mix concrete, and a cement plant and quarry with an annual production capacity of 560 thousand tons located in Dixon, Illinois, United States. The consolidated income statement of 2003, includes the operating results of MRT and the Dixon plant since the respective acquisition dates. As noted in III above, the Dixon plant was sold in March 2005.
As of December 31, 2005 and 2004, the consolidated investments in affiliated companies were as follows:
Activity Country % 2005 2004
RMC Group p.l.c. Concrete United Kingdom 18.8 $ – 8,810PT Semen Gresik, Tbk. Cement Indonesia 25.5 2,541 2,661Control Administrativo Mexicano, S.A. de C.V. Cement Mexico 49.0 2,491 2,147Ready Mix USA Concrete EUA 49.0 341 –Trinidad Cement Ltd Cement Trinidad 20.0 325 286Cementos Bío Bío, S.A. Cement Chile 11.9 – 453Cancem, S.A. de C.V. Cement Mexico 10.0 255 219Lehigh White Cement Company Cement EUA 24.5 148 136Societe des Ciments Antillais Cement French Antilles 26.1 177 190Caribbean Cement Company Ltd Cement Jamaica 5.0 – 112Other 2,645 959 $ 8,923 15,973
During 2003, the management of PT Semen Padang (“Padang”), subsidiary of Gresik, by different means obstructed the ownership rights of Gresik, by not acknowledging the administration of Padang elected by Gresik at the May 2003 stockholders’ meeting. In September 2003, pursuant to a court order, the management appointed by Gresik finally assumed its duties. In December 2003, Gresik designated new auditors to review the 2003 and 2002 consolidated financial statements. The in-depth troubles persist and are related to the agreements of 1998 between the Indonesian government and CEMEX, which are determinant for the Company’s decision to invest in Indonesia. According to these agreements, the government would sell to CEMEX the majority interest of Gresik and subsidiaries, which has not occurred mainly due to the opposition of the provincial administration of West Sumatra, which has argued that the original sale of Padang by the government to Gresik in 1995 is invalid, since certain necessary approvals were not obtained.

55
In December 2003, CEMEX filed before the International Center for the Settlement of Investments Disputes a request for arbitration against the Indonesian government. The arbitration tribunal held its first session in July 2004, at which the Indonesian government objected to the tribunal’s jurisdiction. As of December 31, 2005, the tribunal was still determining if it has jurisdiction to hear the dispute. The resolution of in-depth issues can take several years. CEMEX evaluates its investment in conformity with its accounting policies. As of December 31, 2005 and 2004, CEMEX used the best information available in order to value its investment in Gresik.
B) OTHER INVESTMENTS AND NONCURRENT ACCOUNTS RECEIVABLEAmounts include assets for the valuation of derivative instruments (notes 12 and 17) of $4,190 in 2005 and $1,592 in 2004. Furthermore, the amounts include investments in private funds, recorded at fair value of U.S.$19 ($203) in 2005 and U.S.$8 ($89) in 2004. In 2005 and 2004, approximately U.S.$9 ($91) and U.S.$2 ($25), were contributed to these funds, respectively.
10. PROPERTIES, PLANT AND EQUIPMENTDuring 2005 and 2004, impairment losses of approximately $166 and $1,084 were recognized within other expenses, respectively, derived from idle assets, resulting from the closing of cement assets in Mexico and the Philippines. These assets were adjusted to their estimated realizable value.
11. INTANGIBLE ASSETS AND DEFERRED CHARGESAs of December 31, 2005 and 2004, consolidated intangible assets of definite and indefinite life and deferred charges, are summarized as follows: 2005 2004Intangible assets of indefinite useful life:Goodwill $ 57,331 45,872Accumulated amortization (9,593) (9,794) 47,738 36,078Intangible assets of definite useful life:Cost of internally developed software 3,233 2,891Intangible asset for pensions (note 14) 604 874Accumulated amortization (2,579) (1,858) 1,258 1,907Deferred charges:Prepaid pension costs (note 14) – 422Deferred financing costs 528 529Deferred income taxes (note 18B) 3,667 1,835Others 7,455 3,422Accumulated amortization (2,280) (1,767) 9,370 4,441 $ 58,366 42,426
As a result of the Company’s periodic impairment evaluations (note 3K), in 2004 and 2003, the book values of the Company’s information technology business unit and the Company’s business unit in the Philippines were determined to exceed the respective amount of expected cash flows; therefore, impairment losses of goodwill were recognized within other expenses for $239 in 2004 and $898 in 2003. The losses related to the Company’s information technology business unit were $239 in 2004 and $160 in 2003 and those related to the business unit in the Philippines in 2003 were $738. In 2005 no impairment losses were determined in connection with the impairment evaluations.
The amortization expenses of intangible assets and deferred charges were $1,605 in 2005, $2,752 in 2004 and $2,861 in 2003, of which approximately 14%, 66% and 69%, respectively, were recognized in other expenses, while the difference in each year was recognized within operating expenses.
12. SHORT-TERM AND LONG-TERM BANK LOANS AND NOTES PAYABLEAs of December 31, 2005 and 2004, short-term and long-term consolidated debt and their related derivative instruments are summarized as follows:
According to the interest rate in which debt was contracted: Effective Carrying 2005 rate 1 amountShort- term Floating rate 3 4.65% $ 11,818 Fixed rate 3 11.08% 829 12,647Long-term Fixed rate 3 5.14% 42,269 Floating rate 3 4.01% 45,737 88,006 $ 100,653
Effective Carrying 2004 rate 1 amountShort-term Floating rate 3 2.35% $ 11,136 Fixed rate 3 6.98% 15 11,151Long-term Fixed rate 3 5.54% 22,247 Floating rate 3 3.67% 29,960 52,207 $ 63,358

56
According to currency contracted: Short Long Effective 2005 term term Total rate 1
Dollar $ 5,478 $ 45,921 $ 51,399 5.2%Japanese yen 337 4,224 4,561 1.1%Euros 2,052 18,772 20,824 2.9%Sterling pounds 537 1,872 2,409 5.5%Pesos 4,064 17,166 21,230 10.4%Egyptian pounds 54 – 54 9.6%Other currencies 125 51 176 10.6% $ 12,647 $ 88,006 $ 100,653
Short Long Effective 2004 term term Total 2 rate 1
Dollar $ 3,186 $ 32,177 $ 35,363 4.9%Japanese yen 3,071 5,908 8,979 1.2%Euros 4,698 4,978 9,676 3.1%Sterling pounds – 8,906 8,906 5.5%Pesos 185 214 399 6.2%Egyptian pounds 11 – 11 13.5%Other currencies – 24 24 15.6% $ 11,151 $ 52,207 $ 63,358
By category or instrument type: Short Long 2005 term term
Bank loansLines of credit in Mexico $ 2,039 –Lines of credit in foreign countries 3,962 –Syndicated loans, 2006 to 2010 – 51,728Bank Loans, 2006 to 2007 – 8,746 6,001 60,474
Notes payableEuro medium-term notes, 2006 to 2009 – 1,204Euro medium-term notes, 2006 to 2008 – 5,818Euro medium-term notes, 2006 to 2015 – 24,088Other notes 651 2,417 651 33,527Total bank loans and notes payable 6,652 94,001Current maturities 5,995 (5,995) $ 12,647 88,006
Short Long 2004 term term
Bank loansLines of credit in Mexico $ 509 –Lines of credit in foreign countries 4,317 –Syndicated loans, 2005 to 2009 – 29,060 4,826 29,060
Notes payableForeign commercial paper 242 –Euro medium-term notes, 2005 to 2009 – 1,212Medium-term notes, 2005 to 2008 – 8,075Medium-term notes, 2005 to 2015 – 18,774Other documents 65 1,104 307 29,165Total bank loans and notes payable 5,133 58,225Current maturities 6,018 (6,018) $ 11,151 52,207
1 Represents the weighted average effective rate.2 In 2004, includes the effects for currencies exchange originated by the Cross Currency Swaps (“CCS”) (note 12B).3 Includes the effects of Interest Rate Swaps (note 12A), as well as CCS (note 12B).

57
The most representative exchange rates to the financial debt as of December 31, 2005 and 2004 are as follows:
2005 2004
Mexican pesos per dollar 10.62 11.14Japanese yen per dollar 117.81 102.49Euros per dollar 0.8440 0.7383Sterling pounds per dollar 0.5812 0.5218
The most important transactions in the consolidated financial debt during 2005 are as follows:
Debt as of December 31, 2004 $ 63,358
Transactions during 2005:Credits in connection with the financing of the RMC acquisition 37,170New bank loans 30,267Debt assumed through RMC acquisition 23,886Medium-term Mexican commercial paper 3,640Medium-term foreign commercial paper 3,452Debt repayments, net (61,120) Change during the period 37,295Debt as of December 31, 2005 $ 100,653
The maturities of long-term debt as of December 31, 2005 are as follows: 2005
2007 $ 14,2462008 15,8782009 25,8942010 22,2412011 and thereafter 9,747 $ 88,006
As of December 31, 2005 and 2004, there were short-term debt transactions amounting to U.S.$505 ($5,362) and U.S.$847 ($9,051), respectively, classified as long-term debt due to the Company’s ability and the intention to refinance such indebtedness with the available amounts of committed long-term lines of credit.
As of December 31, 2005, the Company and its subsidiaries have the following lines of credit, both committed and subject to the banks’ availability, at annual interest rates ranging between 0.42% and 17.74%, depending on the negotiated currency: Line of Credit Available
European commercial paper (U.S.$600) $ 6,372 6,372Revolving credit facility (U.S.$700) 7,434 1,328Multi-currency revolving credit (U.S.$1,200) 12,744 7,222Other lines of credit in foreign subsidiaries 67,405 13,567Other lines of credit form banks 11,470 2,835 $ 105,425 31,324
Derivative Financial Instruments (note 3L)As of December 31, 2005 and 2004, in order to: (i) change the profile of the interest rate originally negotiated on a debt portion (note 12A), and (ii) reduce the financial cost of debt originally contracted in dollars or pesos (note 12B), the Company has negotiated derivative financing instruments related to existing short-term and long-term debt, which are described as follows:
A) Interest Rate Swap ContractsAs of December 31, 2005 and 2004, information with respect to interest rate swaps (“IRS”) related to short-term and long-term financial debt is summarized as follows: Notional Effective (Amounts in millions) Amount Fair Value rate 2005Swaps related to long-term debt 1 U.S.$ 387 6 4.4%Swaps related to long-term debt 2 1,113 6 4.5%Swaps related to long-term debt 3 1,000 37 4.9%Swaps related to long-term debt 4 225 3 4.9% U.S.$ 2,725 52
2004Swaps related to long-term debt 3 U.S.$ 1,950 (174) 5.8%
1 As of December 31, 2005, under these contracts, CEMEX receives a floating LIBOR* rate and pays a fixed rate of 4.0%. These contracts were designated as accounting hedges of contractual cash flows (interest payments) of the related underlying U.S. dollar floating rate debt, and mature in June 2009. Changes in the estimated fair value of these instruments are recognized in stockholders’ equity.

58
2 As of December 31, 2005, under these contracts, CEMEX receives a floating LIBOR* rate and pays a fixed rate of 4.1%. The contracts were designated as accounting hedges of contractual cash flows (interest payments) of the related underlying U.S. dollar floating rate debt, and mature in August 2009. Changes in the estimated fair value of these instruments are recognized in stockholders’ equity.
3 As of December 31, 2005 and 2004, these contracts were not designed as accounting hedges since they have optionality. Nevertheless, the contracts complement CEMEX’s financial strategy. Under these instruments, CEMEX receives a floating LIBOR* rate and pays a fixed rate of 4.6%. The maturity of these contracts is in October 2009. Changes in the estimated fair value of these instruments are recognized in the income statement of the period.
4 Likewise, as of December 31, 2005, these contracts were not designed as accounting hedges since they have optionality. Through these instruments, CEMEX receives a floating LIBOR* rate and pays a fixed rate of 3.9%. These contracts mature in April 2010. Changes in the estimated fair value are recognized in the income statement of the period.
* LIBOR represents the London Interbank Offering Rate, used in the market for debt denominated in US dollars. “Bps” means basis points. One basis
point is .01 percent.
During 2005 and 2004, due to changes in the interest rate mix of the financial debt portfolio, interest rate swap contracts were settled for a nominal amount of U.S.$775 and U.S.$100, respectively. As a result of the settlement, the Company recognized losses of approximately U.S.$4 ($38) in 2005 and U.S.$8 ($89) in 2004, representing the estimated fair value of the contracts as of the settlement date, which were recognized in the income statement of the period.
In addition, on March 1, 2005, as a result of the acquisition of RMC, CEMEX assumed interest rate swap contracts for a notional amount of approximately U.S.$585, with an estimated loss in the fair value of approximately U.S.$28. These interest rate derivative instruments were settled by CEMEX in June 2005, generating a gain in Comprehensive Financial Income for the change in the fair value between the purchase date and the settlement date for approximately U.S.$8 ($79).
In July 2004, CEMEX negotiated with a financial institution interest rate swap contracts for a notional amount of U.S.$200, receiving a fixed interest rate and paying a floating interest rate for a five-year period. These contracts resulted from the exercise, by the financial institution, of interest rate swap options (swaptions) sold by CEMEX in previous years. In 2003, considering the premiums obtained for the sale of swaptions net of changes in the fair value and settlement effects, the Company recognized a net gain of approximately U.S.$3 ($31) in earnings of the period.
In June 2003, resulting from the settlement of Forward Rate Agreements (“FRAs”) for a notional amount of U.S.$650, the Company negotiated interest rate swap contracts. FRAs were designated as accounting hedges of the interest rate of forecasted debt issuances. Upon settlement, a loss of approximately U.S.$38 ($431) was recognized in stockholders’ equity and is being amortized to the financial expense as part of the effective interest rate of the related existing debt. The amount amortized was U.S.$3 ($34) in 2005, U.S.$4 ($46) in 2004 and U.S.$8 ($89) in 2003.
B) Cross Currency Swap Contracts (“CCS”) and Other Currency Instruments (note 3L)As of December 31, 2005 and 2004, there were Cross Currency Swaps (“CCS”), through which the Company exchanges the originally contracted interest rates and currencies on notional amounts of related short-term and long-term debt. During the life of the CCS and at their maturity, the cash flows related to the exchange of interest rates and currencies under the CCS, match, in interest payment dates and conditions, those of the underlying debt.
As of December 31, 2005 and 2004, information with respect to the CCS is summarized as follows:
(Amounts in millions) Nominal Fair Effective 2005 amount value rate Short-termExchange $5,362 to dollars 1 U.S.$ 500 6 4.7%Exchange $2,800 to dollars 2 260 5 4.9% 760 11
Long-termExchange $2,488 to dollars 3 142 100 4.8%Exchange $6,888 to dollars 4 618 86 4.0%Exchange $2,940 to dollars 5 270 17 4.8%Exchange $5,281 to dollars 6 500 (2) 4.5% 1,530 201 U.S.$ 2,290 212
2004 Short-termExchange U.S.$67 to ¥1,904 million 7 U.S.$ 67 93 2.9%
Long-termExchange $3,804 to dollars 2 308 33 4.0%Exchange $3,369 to dollars 3 233 88 3.3%Exchange $4,022 to dollars 4 378 3 3.9%Exchange $800 to dollars 5 80 (6) 4.3%Exchange $602 to ¥6,008 million 8 52 (2) 1.3% 1,051 116 U.S.$ 1,118 209

59
2005 2004 CEMEX CEMEX CEMEX CEMEX Maturity receives pays receives pays1 June 2006 TIIE+25bps L+28bps – –2 June 2006 TIIE+80bps L+55bps TIIE+55bps L+125bps3 April 2007 MXN 10.8% L+96bps MXN 12.4% L+97bps4 April 2012 MXN 9.2% US 5.1% MXN 8.6% US 4.6%5 April 2009 CETES+112bps US 4.8% CETES+145bps US 4.3%6 June 2011 MXN 8.3% L+25bps – –7 – – – L+27bps ¥ 1.9%8 – – – MXN 8.8% ¥ 2.6%
* TIIE represents the Interbank Offering Rate in Mexico and CETES are public debt instruments issued by the Mexican government. As of December 31,
2005, the LIBOR rate was 4.39%, the TIIE was 8.56% and the CETES yield was 8.01%.
As of December 31, 2005 and 2004, related to the fair value of the CCS, the Company recognized net assets of U.S.$212 ($2,250) and U.S.$209 ($2,227), respectively, of which U.S.$138 ($1,466) in 2005 and U.S.$301 ($3,299) in 2004 relate to prepayments made to yen and dollar denominated obligations under the CCS. As of December 31, 2004, the amount of the prepayments was presented by decreasing the carrying amount of the related debt. The estimated fair value of the CCS, without the effects of prepayments, resulted in a net asset of U.S.$74 ($784) in 2005 and a net liability of U.S.$92 ($985) in 2004. The CCS have not been designated as accounting hedges; therefore, changes in fair value are recognized through the income statement. For the years ended December 31, 2005, 2004 and 2003, changes in the estimated fair values of the CCS, excluding the effects of prepayments, resulted in a gain of U.S.$3 ($36), a gain of U.S.$10 ($110) and a loss of U.S.$150 ($1,714), respectively, which were recognized in the income statements of the respective periods.
As of December 31, 2005, the assets and liabilities arising from the valuation of the CCS were presented separately from the related debt. As of December 31, 2004, in accordance with presentation guidelines applied by the Company as of that date (note 3L), a portion of the net liability resulting from the fair value recognition of the CCS of approximately U.S.$132 ($1,408), directly related to variations in exchange rates between the origination of the CCS and the balance sheet date, was presented as part of the related debt carrying amount, in order to reflect the expected cash flows that the Company expected to receive or pay upon settlement of these financial instruments. Through this presentation, the carrying amount of the financial indebtedness directly related to the CCS was presented as if it had been effectively negotiated in the exchange currencies instead of in the originally negotiated currencies.
The periodic cash flows underlying the CCS arising from the exchange of interest rates are determined over the notional amounts of the exchanged currency. These cash flows are recognized as part of the effective interest rate of the related financial debt within the interest expense.
The portion of the estimated fair value of the CCS, attributable to accrued interest as of the reporting date, is presented as an adjustment of the related financing interest payable.
On March 1, 2005, as a result of the acquisition of RMC, CEMEX assumed CCS for a notional amount of approximately U.S.$397, with an estimated loss in the fair value of approximately U.S.$84. These CCS were settled by CEMEX in May and June 2005, generating a gain of approximately U.S.$21 ($227) in the Comprehensive Financial Income for the change in the fair value between the acquisition date and the settlement date.
During 2003, resulting from the settlement of other currency derivative instruments for a notional amount of U.S.$105, the Company recognized a loss of approximately U.S.$4 ($41) in the income statement of the period.
The estimated fair value of derivative instruments fluctuates over time and will be determined by future interest rates and currency prices, according to the yield curves shown in the market as of the balance sheet date. These values should be viewed in relation to the fair values of the underlying transactions and as part of the Company’s overall exposure attributable to fluctuations in interest rates and foreign exchange rates. The notional amounts of derivative instruments do not necessarily represent amount exchanged by the parties, and consequently, there is no direct measure of the Company’s exposure to the use of these derivatives. The amounts exchanged in cash are determined based on the basis of the notional amounts and other terms included in the derivative financial instruments.
C) Guaranteed DebtAs of December 31, 2005 and 2004, CEMEX Mexico and ETM jointly, fully and unconditionally guaranteed indebtedness of the Company for an aggregate amount of U.S.$3,780 ($40,145) and U.S.$3,088 ($32,988), respectively. The combined summarized financial information of these guarantors as of December 31, 2005, 2004 and 2003 is as follows:
2005 2004
Assets $ 193,617 146,436Liabilities 83,953 100,921Stockholders’ equity 109,664 45,515
2005 2004 2003Net sales $ 26,914 24,970 24,868Operating income 11,032 3,188 2,831Net income 26,911 16,464 6,150
Certain debt contracts guaranteed by the Company and/or some of its subsidiaries contain restrictive covenants limiting sale of assets and requiring maintenance of a controlling interest in certain subsidiaries. As of December 31, 2005 and 2004, CEMEX was in compliance with such covenants.

60
13. OTHER SHORT-TERM AND LONG-TERM LIABILITESAs of December 31, 2005 and 2004, consolidated other accounts payable and accrued expenses are as follows:
2005 2004
Other accounts payable and accrued expenses $ 4,091 1,781Interest payable 544 552Tax payable 2,760 1,394Dividends payable 33 17Provisions 6,572 3,437Advances from customers 1,126 780Valuation of derivative instruments (notes 12 and 17) 1,449 941 $ 16,575 8,902
Short-term provisions primarily consist of: (i) remuneration and other personnel benefits accrued at the balance sheet date; (ii) insurance payments, and (iii) accruals related to the portion of legal and environmental assessments to be settled in the short-term (notes 22C and 22G). Commonly, these amounts are revolving in nature and are to be settled and replaced by similar amounts within the next 12 months.
Other long-term liabilities as of December 31, 2005 and 2004 consist of: 2005 2004
Valuation of derivative instruments (notes 12 and 17) $ 1,896 3,539Accruals for legal assessments and other responsibilities 2,063 1,315Asset retirement obligations and other environmental liabilities 4,699 830Other liabilities and deferred credits 1,640 1,276 $ 10,298 6,960
Liabilities from derivative financial instruments represent the accumulated valuation losses resulting from the estimated fair value recognition of these instruments (notes 12 and 17). Accruals for legal assessments and other responsibilities refer to the best estimation of cash flows with respect to legal claims where the Company is determined to be responsible and which are expected to be settled over a period greater than twelve months (note 22).
During 2005, the balance of this caption increased primarily as a result of the asset retirement obligations and other remediation liabilities assumed in the acquisition of RMC for approximately $4,005. Asset retirement obligations and other environmental liabilities include estimated future estimated costs for demolition, cleaning and reforestation of production sites at the end of their operation (note 3M). The expected average period to settle these obligations is greater than 15 years.
14. PENSIONS AND OTHER POSTRETIREMENT BENEFITS (note 3O)On January 10, 2006, CEMEX communicated to its Mexican employees subject to pension benefits about the beginning of a new defined contribution pension plan scheme, which, from the communication date, replaces the former defined benefit pension plan scheme. Those employees born before March 1, 1956, which represent approximately 5% of the employees eligible for these benefits, have the option to remain in the defined benefit plan, and have been requested to confirm their selection before March 31, 2006. For all other employees, the change is automatic.
As part of the plan conversion process, CEMEX will contribute to the employees’ retirement individual accounts, with a private retirement funds manager, an approximate amount of $1,060. This amount represents the actuarial value of the projected benefit obligations (“PBO”) as of the change date, which represented 32% of the total PBO from the previous pension plan. The amount assumes that approximately 85% of the employees with 50 years will elect to remain in the current plan. The cash contribution will be obtained from the existing pension funds. The administrative execution of the scheme change is expected to occur during the first quarter of 2006.
The initiation of the new defined contribution pension plan was considered to be a material event which occurred before the issuance of the financial statements; therefore, the accounting effects arising from the change were retroactively recognized in the consolidated financial statements as of December 31, 2005. As a result of the new plan, events of settlement and curtailment of obligations occurred. For these reasons, the unrecognized net actuarial results (actuarial gains and losses) were amortized proportionally to the decrease in the PBO, while the unrecognized prior service cost was amortized proportionally to the reduction of the expected years of future service of the present employees within the plan. The combined net effect of the amortization of the items mentioned above represented a loss of approximately $976, which was recognized in the 2005 income statement within other expenses.
For the years ended December 31, 2005, 2004 and 2003, the net periodic cost of pension plans and other postretirement benefits, is described as follows: PensionsNet periodic cost: 2005 2004 2003
Service cost $ 641 295 293Interest cost 1,139 348 290Actuarial return on plan assets (1,077) (381) (341)Amortization of prior service cost, changes in assumptions and experience adjustments 123 126 134Settlements and curtailments 1 976 – 3 $ 1,802 388 379
1 Effect of change of plan in Mexico.

61
Other Postretirement Benefits (“OPB”)*Net periodic cost: 2005 2004 2003Service cost $ 81 39 32Interest cost 75 33 46Actuarial return on plan assets (1) (1) (1)Amortization of prior service cost, changes in assumption and experience adjustments 44 (8) 15 $ 199 63 92
As of December 31, 2005 and 2004, the actuarial value of pension plans and other postretirement benefits (“OPB”), as well as the funded status, are presented as follows: Pensions OPB* 2005 2004 2005 2004Change in benefits obligation:PBO at beginning of year $ 6,210 6,498 586 818Service cost 641 295 81 39Interest cost 1,139 348 75 33Actuarial result 677 (299) 83 (214)Employee’ contributions 64 – – –PBO from acquisitions 20,166 (1) 656 –Initial valuation of other postretirement benefits – – 305 –Foreign exchange variations and inflation adjustments (2,371) (190) (62) 13Settlements and curtailments (1,060) (9) – (33)Benefits paid (1,093) (432) (130) (70)PBO at end of year 24,373 6,210 1,594 586
Change in plan assets:Fair value of plan assets at beginning of year 5,713 5,612 20 35Return on plan assets 3,054 456 6 1Foreign exchange variations and inflation adjustments (1,830) (182) – –Assets for acquisitions 14,450 – – –Funds contribution 852 168 48 –Employee contribution 64 – – –Settlements and curtailments (1,060) (9) – –Benefits paid (1,093) (332) (48) (16)Fair value of plan assets at end of year 20,150 5,713 26 20
Amounts recognized in the balance sheets:Funded status 4,223 497 1,568 566Net transition obligation (106) (1,346) (386) (14)Prior service cost and actuarial results 417 (438) 70 69Accrued benefit liability (prepayment) 4,534 (1,287) 1,252 621Additional minimum liability 331 865 273 9Net projected liability (prepayment) recognized $ 4,865 (422) 1,525 630
* OPB includes the cost and obligations of seniority premiums, severance payments, health care and life insurance benefits.
As of December 31, 2005 and 2004, the combined actual benefit obligation (“ABO”) of pensions and other postretirement benefits, equivalent to the PBO not considering salary increases, amounted to $23,234 and $5,862, respectively. An additional minimum liability is recognized in those individual cases when the ABO less the plan assets (net actual liability) is lower than the net projected liability. At December 31, 2005 and 2004, the Company recognized minimum liabilities against intangible assets for approximately $604 and $874, respectively.
Net transition obligations, prior service costs and net actuarial results are amortized over the estimated service life of the employees under plan benefits. As of December 31, 2005, the average estimated service life for pension plans is approximately 15.2 years, and for other postretirement benefits is approximately 13.3 years.
As of December 31, 2005 and 2004, the consolidated assets of the pension plans and other postretirement benefits are valued at their estimated fair value and are aggregated as follows: 2005 2004Fixed-income securities $ 8,653 1,861Marketable securities 9,605 3,354Private funds and other investments 1,918 518 $ 20,176 5,733
As of December 31, 2005, estimated future benefit payments for pensions and other postretirement benefits during the next ten years are as follows: 20052006 $ 1,4422007 1,4052008 1,4842009 1,4692010 1,5612011– 2015 8,204

62
CEMEX applies real rates (nominal rates discounted for inflation) in the actuarial assumptions used to determine pensions and other postretirement benefit liabilities. The most significant assumptions used in the determination of the net periodic cost are summarized as follows: 2005 2004 2003Range of discount rates used to reflect the obligations’ present value 3.5% to 5.5% 4.5% to 8.0% 3.0% to 7.0%Weighted average rate of return on plan assets 6.7% 7.8% 7.8%Weighted average rate of salary increases 3.2% 7.8% 7.8%
15. STOCKHOLDERS’ EQUITYA) COMMON STOCKThe Company’s common stock as of December 31, 2005 and 2004 is as follows: 2005 2004 (4)
Shares Series A (1) Series B (2) Series A (1) Series B (2)
Subscribed and paid shares 7,676,571,754 3,838,285,877 7,407,268,488 3,703,634,244Treasury shares (3) 213,087,000 106,543,500 498,267,340 249,133,670Unissued shares authorized for Stock Option Plans 213,530,982 106,765,491 215,921,248 107,960,624 8,103,189,736 4,051,594,868 8,121,457,076 4,060,728,538
(1) Series “A” or Mexican shares must represent at least 64% of capital stock.(2) Series “B” or free subscription shares must represent at most 36% of capital stock.(3) Includes the shares issued pursuant to the ordinary stockholders’ meeting of April 28, 2005 that were not subscribed.(4) Includes the effect of the stock split approved in 2005.
Of the total number of shares, 6,534,000,000 in 2005 and 2004 correspond to the fixed portion, and 5,620,784,604 in 2005 and 5,648,185,614 in 2004 to the variable portion.
On April 28, 2005, the annual ordinary stockholders’ meeting approved: (i) a reserve for share repurchases of up to $6,000 (nominal amount); (ii) an increase in the variable common stock through the capitalization of retained earnings of up to $4,815 (nominal amount), issuing shares as a stock dividend for up to 360 million shares (before the split) equivalent to up 120 million CPOs, at a subscription price of $66.448 pesos (nominal) per CPO, or instead, stockholders could have chosen to receive $2.60 pesos (nominal amount) in cash for each CPO. As a result, shares equivalent to 66,728,250 CPOs were subscribed and paid, representing an increase in common stock of $2, considering a nominal value of $0.0333 pesos per CPO, and in additional paid-in capital of $4,535, while an approximate cash payment through December 31, 2005 was made for $380; and (iii) the cancellation of the corresponding shares held in the Company’s treasury.
On April 28, 2005, the annual extraordinary stockholders’ meeting approved a stock split, which became effective on July 1, 2005. In connection with the stock split, each of CEMEX’s series “A” shares was surrendered in exchange for two new series “A” shares, and each of CEMEX’s series “B” shares was surrendered in exchange for two new series “B” shares. The proportional equity interest of the stockholders did not change as a result of the stock split.
On April 29, 2004, the annual stockholders’ meeting approved: (i) a reserve for share repurchases of up to $6,000 (nominal amount); (ii) an increase in the variable common stock through the capitalization of retained earnings of up to $4,169 (nominal amount), issuing shares as a stock dividend for up to 600 million shares equivalent to up 200 million CPOs, at a subscription price of $53.129 (nominal) per CPO, or instead, stockholders could have chosen to receive $2.35 (nominal amount) in cash for each CPO. As a result, shares equivalent to 75,433,165 CPOs were subscribed and paid, representing an increase in common stock of $3, considering a nominal value of $0.0333 pesos per CPO, and in additional paid-in capital of $4,279, while an approximate cash payment through December 31, 2004 was made for $161; and (iii) the cancellation of the corresponding shares held in the Company’s treasury.
B) RETAINED EARNINGSRetained earnings as of December 31, 2005 include $99,537 of earnings generated by subsidiaries and affiliated companies that are not available to be paid as dividends by CEMEX until these entities distribute such amounts to CEMEX. Additionally, retained earnings as of December 31, 2005 include a share repurchase reserve in the amount of $5,737. Net income for the year is subject to a 5% allocation toward a legal reserve until such reserve equals one fifth of the common stock. As of December 31, 2005 the legal reserve amounted to $1,526.
C) EFFECTS OF INFLATIONThe effects of inflation on majority interest stockholders’ equity as of December 31, 2005 are as follows:
Nominal Inflation adjustment Total
Common stock $ 64 3,735 3,799Additional paid-in capital 28,506 18,627 47,133Deficit in equity restatement – (75,329) (75,329)Cumulative initial deferred income tax effects (4,698) (1,152) (5,850)Retained earnings 63,396 48,770 112,166Net income $ 22,817 (392) 22,425

63
D) FOREIGN CURRENCY TRANSLATIONThe foreign currency translation results recorded in stockholders’ equity as of December 31, 2005, 2004 and 2003, are summarized as follows:
2005 2004 2003
Foreign currency translation adjustment $ (5,174) 3,117 5,267Foreign exchange gain (loss) (1) 1,414 156 (1,594) $ (3,760) 3,273 3,673
(1) Foreign exchange gain (loss) resulting from the financing identified with the acquisitions of foreign subsidiaries.
The foreign currency translation adjustment includes foreign exchange results from financing related to the acquisition of foreign subsidiaries made by the Company’s subsidiary in Spain, representing a loss of approximately $11, a gain of $3 and a gain of $61, in 2005, 2004 and 2003, respectively.
E) PREFERRED STOCKIn October 2003, CEMEX repurchased the remaining balance of preferred stock of U.S.$650 ($7,444), which was to mature in February and August 2004. The preferred stock was issued in 2000 by a Dutch subsidiary for U.S.$1,500 with an original maturity in May 2002. The preferred stock was mandatorily redeemable upon maturity and granted its holders 10% of the subsidiary’s voting rights, as well as the right to receive a guaranteed variable preferred dividend, and the option, in certain circumstances, to subscribe for additional preferred stock or common shares for up to 51% of the subsidiary’s voting rights. Until its liquidation, this transaction was included as minority interest. Preferred dividends declared for approximately U.S.$13 ($147) in 2003 were recognized as part of minority interest in the consolidated income statement in that period.
In October 2004, CEMEX liquidated the remaining capital securities for approximately U.S.$66 ($705). The capital securities were issued in 1998 by a Spanish subsidiary for U.S.$250, with an annual dividend rate of 9.66%. In April 2002, through a tender offer, U.S.$184 of capital securities were repurchased. The amount paid to holders in excess of the nominal amount of the capital securities pursuant to the early retirement of approximately U.S.$20 ($229) was recognized against stockholders’ equity. During 2004 and until its termination, as a result of the adoption of new accounting principles, this transaction was recognized as financial debt. Preferred dividends declared during 2004 of U.S.$6 ($63), were recognized in earnings as part of financial expenses. Meanwhile, preferred dividends declared in 2003 were recognized in the income statement as minority interest of approximately U.S.$6 ($75).
F) OTHER EQUITY TRANSACTIONSIn December 2004, 13,772,903 appreciation warrants (“warrants”) remaining from the public purchase offer that took place in December 2003, and which was concluded in January 2004, were settled upon maturity. Through the prior offer 90,018,042 warrants were repurchased at a purchase price of $7.8 pesos per warrant ($38.80 pesos per American Depositary Warrant or ADW). Considering the results of the purchase of warrants in January 2004, the expiration in December 2004, and the direct expenses related to these transactions, approximately $1,010 was paid. This amount was recognized against stockholders’ equity within additional paid-in capital. At the end of 2003, CEMEX announced a public offer to purchase in cash up to 90,018,042 warrants in the Mexican Stock Exchange (“MSE”), and warrants represented by ADWs, each ADW representing five warrants, traded on the New York Stock Exchange (“NYSE”). The warrants purchased pursuant to the offer represented approximately 86.73% of the then total outstanding warrants and included approximately 34.9 million warrants owned by or controlled by CEMEX and its subsidiaries.
The warrants and ADWs were originally issued in 1999 by means of a public offer on the MSE and the NYSE, in which 105 million warrants and warrants represented by ADWs were sold. Each ADW represented five warrants. The warrants permitted the holders to benefit from the future increases in the market price of the Company’s CPOs above the strike price, which as of December 31, 2003 was approximately U.S.$5.45 per CPO (U.S.$27.23 per ADS). The benefit was settled in CPOs. Until September 2003, the CPOs and ADSs required to cover exercises of warrants, were held in equity forward contracts with financial institutions. These forward contracts were settled in October 2003 as a result of a simultaneous secondary equity offering, made by the Company and the banks holding the shares.
In addition, in December 2003, through the payment of approximately U.S.$76 ($869), CEMEX exercised the option that it retained and repurchased the assets related to a financial transaction through which, in December 1995, CEMEX transferred assets to a trust, while simultaneously, investors contributed U.S.$123.5, in exchange for notes representing a beneficial interest in the trust. During the life of the transaction and until maturity in 2007, periodic repurchases of the assets underlying in the trust were stipulated. CEMEX maintained an option to reacquire the related assets at different dates. The cost of retaining this option was recognized as interest expense for approximately U.S.$15 ($166) in 2003. Until its settlement in December 2003, this transaction was included as part of the minority interest in stockholders’ equity.

64
G) COMPREHENSIVE NET INCOMEFor the years ended December 31 2005, 2004 and 2003, consolidated comprehensive net income is as follows:
2005 2004 2003
Majority interest net income $ 22,425 13,965 7,201Effects from holding non-monetary assets 5,558 (2,759) (3,498)Foreign currency translation results (5,174) 3,117 5,267Capitalized foreign exchange result (note 15D) 1,414 156 (1,594)Hedge derivative instruments (notes 12 and 17) 2,894 2,300 467Deferred IT of the year recorded in stockholders’ equity (note 18) 1,745 685 (219)Excess of price paid over book value of minority interests – (958) –Settlement of equity instruments – – (666)Cumulative initial effects of asset retirement obligations – – (87)Inflation effect on equity 1 – 7 (94)Total comprehensive income items 6,437 2,548 (424)Majority comprehensive net income 28,862 16,513 6,777Minority interest 584 224 348Comprehensive net income $ 29,446 16,737 7,125
1 Relates to the adjustment resulting from the use of the weighted average inflation index for the restatement of stockholders’ equity and the use of the index of inflation in Mexico to restate common stock and additional paid-in capital (note 3B).
16. EXECUTIVE STOCK OPTION PROGRAMSIn May 2005, as a result of change of control clauses, the existing executive stock option and share programs in RMC Group p.l.c. as of the acquisition date were liquidated through the payment of approximately £40 million (U.S.$69 or $735). This amount was included as part of the purchase price of RMC. Except for the stock option program of the Irish subsidiary mentioned in the last paragraph of the caption below, there are no other stock option programs in subsidiaries of CEMEX that were acquired in 2005.
Equity ProgramsFrom June 1995 through June 2001, CEMEX granted stock options with a fixed exercise price in pesos (“fixed program”), equivalent to the market price of the CPO at the grant date and with a tenure of 10 years. Exercise prices are adjusted for stock dividends. The employees option rights vested up to 25% annually during the first four years after having been granted.
As mentioned in note 3R, in 2005, CEMEX adopted IFRS 2 to account for its stock option programs. According to IFRS 2, the Company’s fixed program qualified as equity instruments, and no cost was recognized, considering that all options were fully vested as of the adoption date of IFRS 2. During 2005 and 2004, the new CPOs issued pursuant to exercise of these options generated an additional paid-in capital of approximately $18 and $64, respectively, and increased the number of shares outstanding.
The information related to options granted under the Company’s fixed program, for the years ended December 31, 2005 and 2004, is summarized as follows:
Options Fixed Program
Options at the beginning of 2004 4,689,335Changes in 2004:Options exercised (1,998,466)Options at the end of 2004 2,690,869Changes in 2005:Options cancelled (1,141,345)Options exercised (469,224)Options at the end of 2005 1,080,300Exercise prices:Options outstanding at the beginning of 2005 * $ 15.1Options exercised during the year * $ 15.0Options outstanding at the end of 2005 * $ 14.5
* Weighted average exercise prices per CPO. Prices include the effects of the stock split (note 15A).
Considering the anti-dilution adjustments to options, resulting from the stock split and stock dividends declared by CEMEX, as of December 31, 2005, there are 1,355,587 CPOs underlying the outstanding options under the fixed program.
In addition, as of December 31, 2005, CEMEX’s subsidiary in Ireland, Ready Mix, Ltd., acquired on March 1, 2005 as part of the RMC acquisition, has 1,640,000 options outstanding under an executive option plan in the subsidiary’s own shares. The average exercise price of these options is approximately 1.35 Euros per option. The market price of the subsidiary’s share as of December 31, 2005 was 2.35 Euros.
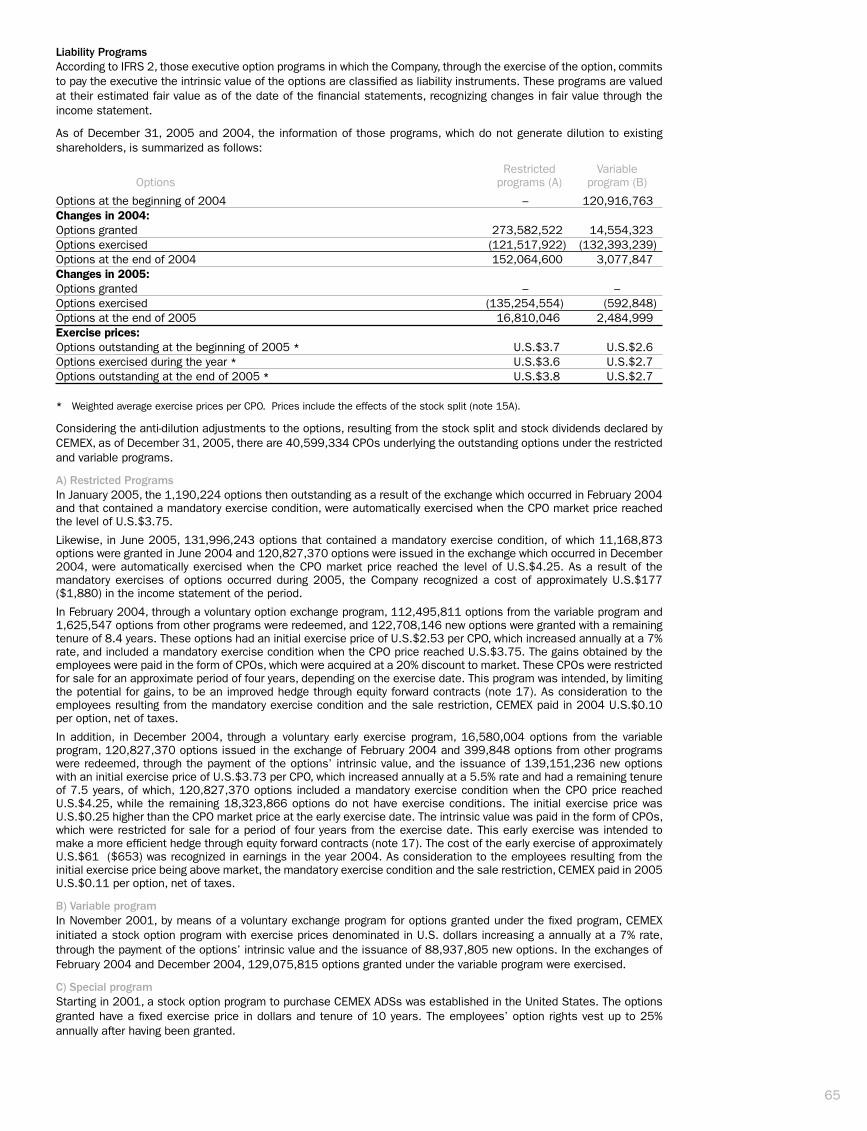
65
Liability ProgramsAccording to IFRS 2, those executive option programs in which the Company, through the exercise of the option, commits to pay the executive the intrinsic value of the options are classified as liability instruments. These programs are valued at their estimated fair value as of the date of the financial statements, recognizing changes in fair value through the income statement.
As of December 31, 2005 and 2004, the information of those programs, which do not generate dilution to existing shareholders, is summarized as follows:
Restricted Variable Options programs (A) program (B)
Options at the beginning of 2004 – 120,916,763Changes in 2004:Options granted 273,582,522 14,554,323Options exercised (121,517,922) (132,393,239)Options at the end of 2004 152,064,600 3,077,847Changes in 2005:Options granted – –Options exercised (135,254,554) (592,848)Options at the end of 2005 16,810,046 2,484,999Exercise prices:Options outstanding at the beginning of 2005 * U.S.$3.7 U.S.$2.6Options exercised during the year * U.S.$3.6 U.S.$2.7Options outstanding at the end of 2005 * U.S.$3.8 U.S.$2.7
* Weighted average exercise prices per CPO. Prices include the effects of the stock split (note 15A).
Considering the anti-dilution adjustments to the options, resulting from the stock split and stock dividends declared by CEMEX, as of December 31, 2005, there are 40,599,334 CPOs underlying the outstanding options under the restricted and variable programs.
A) Restricted ProgramsIn January 2005, the 1,190,224 options then outstanding as a result of the exchange which occurred in February 2004 and that contained a mandatory exercise condition, were automatically exercised when the CPO market price reached the level of U.S.$3.75.
Likewise, in June 2005, 131,996,243 options that contained a mandatory exercise condition, of which 11,168,873 options were granted in June 2004 and 120,827,370 options were issued in the exchange which occurred in December 2004, were automatically exercised when the CPO market price reached the level of U.S.$4.25. As a result of the mandatory exercises of options occurred during 2005, the Company recognized a cost of approximately U.S.$177 ($1,880) in the income statement of the period.
In February 2004, through a voluntary option exchange program, 112,495,811 options from the variable program and 1,625,547 options from other programs were redeemed, and 122,708,146 new options were granted with a remaining tenure of 8.4 years. These options had an initial exercise price of U.S.$2.53 per CPO, which increased annually at a 7% rate, and included a mandatory exercise condition when the CPO price reached U.S.$3.75. The gains obtained by the employees were paid in the form of CPOs, which were acquired at a 20% discount to market. These CPOs were restricted for sale for an approximate period of four years, depending on the exercise date. This program was intended, by limiting the potential for gains, to be an improved hedge through equity forward contracts (note 17). As consideration to the employees resulting from the mandatory exercise condition and the sale restriction, CEMEX paid in 2004 U.S.$0.10 per option, net of taxes.
In addition, in December 2004, through a voluntary early exercise program, 16,580,004 options from the variable program, 120,827,370 options issued in the exchange of February 2004 and 399,848 options from other programs were redeemed, through the payment of the options’ intrinsic value, and the issuance of 139,151,236 new options with an initial exercise price of U.S.$3.73 per CPO, which increased annually at a 5.5% rate and had a remaining tenure of 7.5 years, of which, 120,827,370 options included a mandatory exercise condition when the CPO price reached U.S.$4.25, while the remaining 18,323,866 options do not have exercise conditions. The initial exercise price was U.S.$0.25 higher than the CPO market price at the early exercise date. The intrinsic value was paid in the form of CPOs, which were restricted for sale for a period of four years from the exercise date. This early exercise was intended to make a more efficient hedge through equity forward contracts (note 17). The cost of the early exercise of approximately U.S.$61 ($653) was recognized in earnings in the year 2004. As consideration to the employees resulting from the initial exercise price being above market, the mandatory exercise condition and the sale restriction, CEMEX paid in 2005 U.S.$0.11 per option, net of taxes.
B) Variable programIn November 2001, by means of a voluntary exchange program for options granted under the fixed program, CEMEX initiated a stock option program with exercise prices denominated in U.S. dollars increasing a annually at a 7% rate, through the payment of the options’ intrinsic value and the issuance of 88,937,805 new options. In the exchanges of February 2004 and December 2004, 129,075,815 options granted under the variable program were exercised.
C) Special programStarting in 2001, a stock option program to purchase CEMEX ADSs was established in the United States. The options granted have a fixed exercise price in dollars and tenure of 10 years. The employees’ option rights vest up to 25% annually after having been granted.

66
The options exercises are hedged using ADSs currently owned by subsidiaries, potentially increasing stockholders’ equity and the number of shares outstanding. The amounts of these ADS programs are presented in terms of equivalent CPOs (ten CPOs represent one ADS). Special Options programOptions at the beginning of 2004 15,258,520Changes in 2004:Options granted 5,485,010Options exercised (1,489,010)Options at the end of 2004 19,254,520Changes in 2005:Options granted 1,859,000Options exercised (4,475,460)Options at the end of 2005 16,638,060Exercise prices:Options outstanding at the beginning of 2005 * U.S.$2.5Options exercised during the year * U.S.$2.4Options outstanding at the end of 2005 * U.S.$2.6
* Weighted average exercise prices per CPO.
D) Number of options by exercise price:
Fixed program Special program Restricted program Variable program
301,730 - $10.4 2,341,510 - US$2.3 16,810,046 - US$3.8 1,624,896 - US$2.7 72,893 - $12.0 3,476,190 - US$2.7 – 386,703 - US$3.0 150,944 - $15.7 4,045,250 - US$1.9 – 67,295 - US$2.4 155,099 - $14.2 4,916,110 - US$2.8 – 347,363 - US$2.2 153,189 - $17.4 1,859,000 - US$3.8 – 58,742 - US$2.6 246,445 - $18.3 – – 1,624,896 - US$2.7
As of December 31, 2005, the options from the fixed, special, restricted and variable programs have a remaining average tenure of 2.7 years, 7.5 years, 6.5 years and 6.3 years, respectively. Likewise, the employees’ option rights under such programs are vested in 100%, 49.3%, 100% and 85.3%, respectively.
In addition, as of December 31, 2005 there are 5,000 remaining options from voluntary programs sold to executives in April 2002. These options have an exercise price of U.S.$3.05 per CPO and a remaining tenure of approximately 2 years.
E) Options hedging activitiesIn December 2005, CEMEX negotiated a derivative instrument in its own shares, by means of which, through a prepayment of U.S.$145 ($1,540), CEMEX secures the appreciation over 25 million CPOs, sufficient to hedge cash flows from the exercise of options in the short and medium term. As of December 31, 2005, the fair value of this instrument was a gain of approximately U.S.$3 ($32) recognized in earnings.
Beginning in 2001 and until September 2005, CEMEX hedged most of its stock option programs through forward contracts in its own stock (note 17A), negotiated to guarantee that shares would be available at prices equivalent to those established in the options, without the necessity of issuing new CPOs into the market; therefore, these programs do not increase the number of shares outstanding and consequently do not result in dilution of the basic earnings per share. The equity forward contracts were fully settled during September 2005 through a secondary public offer (note 17A).
Commencing in 2005, as a result of the adoption of IFRS 2, CEMEX recognizes the cost of its option plans that qualify as liability instruments through the fair value of the options as of the balance sheet date (note 3R). For the year ended December 31, 2005, the income statement includes the cumulative effect from the adoption of IFRS 2, which represented an expense of approximately $992 ($860 net of IT). Beginning in 2001 and until September 2005, CEMEX recognized the cost of its stock option programs, except for its fixed program, through valuing the intrinsic value of the options as of the balance sheet date.
In addition, during 2005, the Company recognized an expense of approximately U.S.$41 ($435), resulting from changes in the fair value of the options after the adoption of IFRS 2 until year-end. Moreover, during 2005 before the adoption of IFRS 2, and for the years ended December 31, 2004 and 2003, the expense arising from the options measured by the intrinsic value was approximately U.S.$116 ($1,232), U.S.$51 ($541) and U.S.$45 ($519), respectively. Likewise, the Company recognized in the income statement the changes in the estimated fair value and the cash flows generated by the settlement of the equity forward contracts designated as hedges for these plans (note 17A), which resulted in a gain of approximately U.S.$422 ($4,482) in 2005, a gain of approximately U.S.$45 ($479) in 2004 and a loss of approximately U.S.$28 ($321) in 2003. The gains or losses resulting from the hedging instruments negotiated in the Company’s own stock are recognized in addition to the expense related to the stock option programs.
The fair value of the options was determined through binomial option pricing models. As of December 31, 2005, the most important assumptions used in valuation are the following: Assumptions 2005Expected dividend 3.8%Volatility 35%Interest rate 4.4%Weighted average remaining tenure 6.8 years
During 2005, CEMEX only granted options under its special program. The other eligible executives received a salary bonus, recognized in operating expense, which was used by the executives to purchase CPOs in the market. These CPOs are held in an employees’ trust during a restriction for sale period of approximately 4 years.

67
17. DERIVATIVE FINANCIAL INSTRUMENTSAs of December 31, 2005 and 2004, the Company’s derivative financial instruments, other than those related to financial debt (note 12), are summarized as follows: 2005 2004 Notional Fair Notional Fair Millions of dollars amount value amount valueA) Equity forward contracts – – 1,157 66B) Foreign exchange instruments 3,200 173 4,898 63C) Derivatives related to energy projects 159 (4) 168 (6)
Upon liquidation and at CEMEX’s option, the equity forward contracts allowed for physical or net cash settlement of the estimated fair value. In 2005, the fair value effects related to these instruments were recognized in the income statement, while in 2004, such effects were recognized in the income statement or as part of stockholders’ equity, according to their characteristics and use. At maturity, if these forward contracts were not settled or replaced, or if the Company defaulted on the agreements established, this might have had an adverse affect on the Company’s stock market price or its ability to operate.
A) On October 3, 2005, through a secondary equity offering agreed to by the Company, launched simultaneously on the MSE and the NYSE, financial institutions offered and sold 30,993,340 ADSs (22,943,340 ADSs and 80,500,000 CPOs) held through forward contracts, at a price of approximately U.S.$49.5 per ADS and $53.9 per CPO. Of the total sale proceeds of approximately U.S.$1,500 ($15,930), net of the offering expenses, the financial institutions kept approximately U.S.$1,300 as payment for the liquidation of the related forward contracts. The ADSs subject to the offer represented the entire amount of shares subject to the forward contracts in the Company’s stock as of the offering date. This transaction did not increase the number of shares outstanding. For the year ended December 31, 2005, considering the results of the secondary offer, as well as those of the forward contracts initiated and settled during the year to hedge the exercises of options under the stock option programs, CEMEX recognized in the income statement a gain of approximately U.S.$422 ($4,482), which was recognized in addition to the expenses generated by the stock option programs (note 16E).
As of December 31, 2004, there were forward contracts with different maturities until October 2006, for a notional amount of U.S.$1,112 covering 30,644,267 ADSs, which were designated to hedge the exercise of the options granted under the employee stock option programs. Changes in the estimated fair value of these contracts were recognized in the income statement as a complement of the cost generated by such programs. As of December 31, 2004, the estimated fair value of these contracts was a gain of approximately U.S.$45 ($479).
During 2004, contracts representing 2,509,524 CPOs that were held to meet the Company’s requirements of shares under the remaining warrants from the repurchase in 2003 were settled, resulting in a gain of approximately U.S.$3 ($28), recognized in stockholders’ equity. In addition, in October 2003, through a secondary equity offering, forward contracts for a notional amount of U.S.$461, covering 24,008,392 ADSs (120,041,960 CPOs) and 33.8 million shares of CEMEX’s subsidiary in Spain were settled, resulting a net gain of approximately U.S.$20 ($223), which was recognized in stockholders’ equity. These contracts were negotiated in 1999 to hedge future exercises under the 105 million warrants program (note 15F). These warrants were subject to a voluntary repurchase offer by CEMEX in December 2003, and the remaining warrants expired in December 2004 (note 15F). From execution of the contracts until their settlement, the Spanish subsidiary’s shares underlying the contracts were considered as owned by CEMEX.
In addition, during 2004, forward contracts covering 23,622,500 CPOs that hedged the purchase of CAH shares through exchange of the Company’s CPOs (note 9A) were settled. Through this settlement, a gain of approximately U.S.$15 ($155) was recognized in stockholders’ equity.
As of December 31, 2004, there were forward contracts with different maturities until January 2006, for a notional amount of U.S.$45 that covered 1,364,061 ADSs. Until December 31, 2004, these contracts were treated as equity instruments; therefore, changes in their fair value were recognized in stockholders’ equity when settled. During 2005, changes in the fair value of these contracts were recognized against the income statement. As of December 31, 2004, the estimated fair value was a gain of approximately U.S.$6 ($64).
B) In order to hedge financial risks associated with variations in foreign exchange rates, CEMEX has negotiated foreign exchange forward contracts for notional amounts of U.S.$3,137 and U.S.$957, at December 31, 2005 and 2004, respectively, with different maturities until 2007. These contracts have been designated as hedges of the Company’s net investment in foreign subsidiaries. The estimated fair value of these instruments is recorded in stockholders’ equity as part of the foreign currency translation effect (note 15D). In addition, as of December 31, 2004, there were foreign exchange options for a notional amount of U.S.$488, which matured in June 2005. For the sale of these options, CEMEX received premiums of approximately U.S.$63 in 2003. The changes in the estimated fair value resulted in losses of U.S.$6 ($60) in 2005, U.S.$19 ($205) in 2004 and U.S.$57 ($605) in 2003, which were recognized in earnings. In addition, as of December 31, 2005 there is a foreign exchange forward contract for a notional amount of U.S.$63, not designated as hedge, whose effects are recognized in earnings.
In September 2004, in connection with the commitment to acquire RMC (notes 2 and 9A) that was denominated in sterling pounds, CEMEX entered into a foreign exchange hedge program, oriented to hedge the variability in cash flows associated with exchange fluctuations between the U.S. dollar, the currency in which CEMEX obtained the proceeds, and sterling pounds. For this purpose, the Company negotiated foreign exchange forwards, collars and digital options, for a combined notional amount of U.S.$3,453. These contracts were designated as accounting hedges of the foreign exchange risk associated with the firm commitment agreed on November 17, 2004, the date on which RMC’s shareholders committed to sell their shares at a fixed price. Changes in the estimated fair value of these contracts from the designation date, which represented a gain of approximate U.S.$132 ($1,411), was recognized in stockholders’ equity in 2004 and was reclassified to earnings in 2005 on the purchase date. Changes in the estimated fair value of these contracts from their origination until their designation in 2004 as hedges, were a gain of approximately U.S.$102 ($1,094), which was recognized in earnings in 2004.

68
C) As of December 31, 2005 and 2004, CEMEX had an interest rate swap maturing in May 2017, with a notional amount of U.S.$150 and U.S.$159, respectively, negotiated to exchange floating for fixed interest rates in connection with agreements entered into by CEMEX for the acquisition of electric energy (note 22F). During the life of the swap and based on its notional amount, CEMEX will pay a LIBOR rate and will receive a 7.53% fixed rate until May 2017. In addition, during 2001, the Company sold a floor option with a notional amount of U.S.$159 in 2005 and U.S.$168 in 2004, related to the interest rate swap contract, pursuant to which, until 2017, CEMEX will pay the difference between the 7.53% fixed rate and the LIBOR rate. As of December 31, 2005 and 2004, the combined fair value of the swap and the floor option represented losses of approximately U.S.$4 ($44) and U.S.$6 ($67), respectively, recognized in earnings during the respective periods. The nominal amount of both contracts is not aggregated, considering that there is only one notional amount with exposure to changes in interest rates and the effects of one contract are proportionally inverse to the changes in the other one.
The estimated fair values of derivative financial instruments fluctuate over time and are based on estimated settlement costs or quoted market prices. These values should be viewed in relation to the fair values of the underlying instruments or transactions and as part of the Company’s overall exposure to fluctuations in foreign exchange rates, interest rates and prices of shares. The notional amounts of derivative instruments do not necessarily represent amounts exchanged by the parties and, therefore, are not a direct measure of the Company’s exposure through its use of derivatives. The amounts exchanged are determined on the basis of the notional amounts and other terms included in the derivative instruments.
18. INCOME TAX (IT), BUSINESS ASSETS TAX (BAT), EMPLOYEES’ STATUTORY PROFIT SHARING (ESPS) AND DEFERRED INCOME TAXESThe income tax law in Mexico provides that companies must pay either IT or BAT depending on which amount is greater with respect to their Mexican operations. Both taxes recognize the effects of inflation, although in a manner different from Mexican GAAP. ESPS is calculated on similar basis as IT without recognizing the effects of inflation.
A) IT, BAT AND ESPSCEMEX and its Mexican subsidiaries generate IT and BAT on a consolidated basis; therefore, the amounts of these items included in the financial statements, with respect to the Mexican subsidiaries, represent the consolidated result of these taxes. For ESPS purposes, the amount presented is the sum of the individual results of each company.
Beginning in 1999, the determination of the consolidated IT for the Mexican companies considers a maximum of 60% of the taxable income or loss of each of the subsidiaries. In addition, the taxable income of those subsidiaries that have tax loss carryforwards generated before 1999 will be considered by the parent company according to its equity ownership. Beginning in 2002, in the determination of consolidated IT, 60% of the taxable result of the controlling entity should be considered, unless it obtains taxable income, in which case 100% should be considered, until the restated balance of the individual tax loss carryforwards before 2001 are amortized. Beginning in 2002, a new IT law became effective in Mexico, establishing that the IT rate were scheduled to be decreased by 1% each year, beginning in 2003, until the rate reached 32% in 2005. Nevertheless, according to reforms approved to such law in November 2004, the tax rate for 2005 will be 30%, 29% for 2006 and 28% starting in 2007. In addition, beginning in 2005, the maximum of 60% for tax consolidation factor was eliminated, except in those situations when the subsidiaries would have generated tax loss carryforwards in the period from 1999 to 2004, or the parent company from the period of 2002 to 2004. In those cases, the 60% factor will prevail in the IT consolidation, until tax loss carryforwards are extinguished in each company.
The IT expense, presented in the income statements, is summarized as follows:
2005 2004 2003
Current income tax $ (2,440) (1,024) (1,645)Deferred IT (1,124) (1,006) 518Effects of inflation (note 3B) – 70 101 $ (3,564) (1,960) (1,026)
For the years ended December 31, 2005, 2004 and 2003, the total consolidated IT includes expenses of $1,413, $1,207 and $1,423, respectively, from foreign subsidiaries, and expense of $2,151 in 2005, expense of $753 in 2004 and income of $397 in 2003 from Mexican subsidiaries. In addition, the Company recognized a consolidated tax benefit, excluding deferred taxes, of $1,548, $1,302 and $1,352, in 2005, 2004 and 2003, respectively.
For its operations in Mexico, CEMEX has tax loss carryforwards, which restated for inflation, can be amortized against taxable income in the succeeding ten years. The tax loss carryforwards at December 31, 2005 are as follows:
Amount of Year of Year in which tax loss occurred carryforwards expiration
2001 $ 863 20112002 4,192 20122003 596 2013 $ 5,651
The BAT Law in Mexico establishes a 1.8% tax levy on assets, restated for inflation in the case of inventory and fixed assets, and deducting certain liabilities. BAT levied in excess of IT for the period may be recovered, restated for inflation, in any of the succeeding ten years, provided that the IT incurred exceeds BAT in such period.
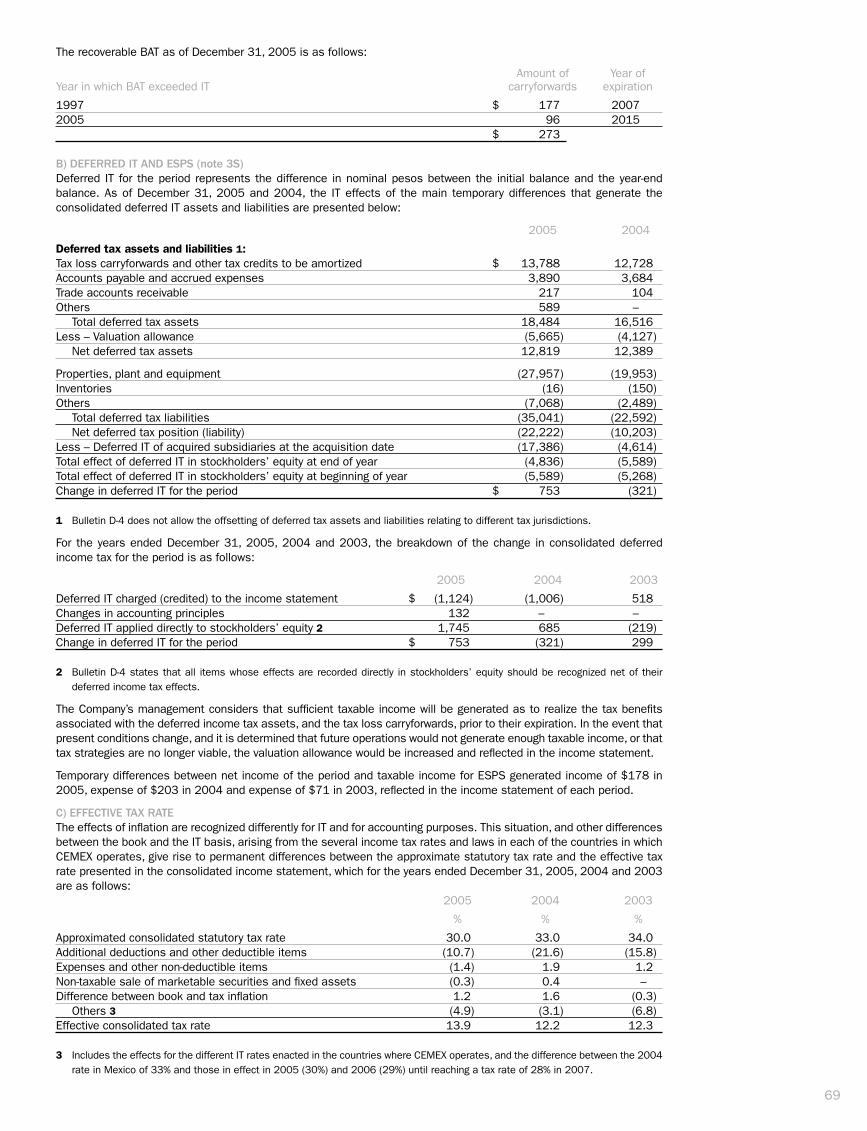
69
The recoverable BAT as of December 31, 2005 is as follows:
Amount of Year of Year in which BAT exceeded IT carryforwards expiration
1997 $ 177 20072005 96 2015 $ 273
B) DEFERRED IT AND ESPS (note 3S)Deferred IT for the period represents the difference in nominal pesos between the initial balance and the year-end balance. As of December 31, 2005 and 2004, the IT effects of the main temporary differences that generate the consolidated deferred IT assets and liabilities are presented below:
2005 2004
Deferred tax assets and liabilities 1:Tax loss carryforwards and other tax credits to be amortized $ 13,788 12,728Accounts payable and accrued expenses 3,890 3,684Trade accounts receivable 217 104Others 589 – Total deferred tax assets 18,484 16,516Less – Valuation allowance (5,665) (4,127) Net deferred tax assets 12,819 12,389
Properties, plant and equipment (27,957) (19,953)Inventories (16) (150)Others (7,068) (2,489) Total deferred tax liabilities (35,041) (22,592) Net deferred tax position (liability) (22,222) (10,203)Less – Deferred IT of acquired subsidiaries at the acquisition date (17,386) (4,614)Total effect of deferred IT in stockholders’ equity at end of year (4,836) (5,589)Total effect of deferred IT in stockholders’ equity at beginning of year (5,589) (5,268)Change in deferred IT for the period $ 753 (321)
1 Bulletin D-4 does not allow the offsetting of deferred tax assets and liabilities relating to different tax jurisdictions.
For the years ended December 31, 2005, 2004 and 2003, the breakdown of the change in consolidated deferred income tax for the period is as follows:
2005 2004 2003
Deferred IT charged (credited) to the income statement $ (1,124) (1,006) 518Changes in accounting principles 132 – –Deferred IT applied directly to stockholders’ equity 2 1,745 685 (219)Change in deferred IT for the period $ 753 (321) 299
2 Bulletin D-4 states that all items whose effects are recorded directly in stockholders’ equity should be recognized net of their deferred income tax effects.
The Company’s management considers that sufficient taxable income will be generated as to realize the tax benefits associated with the deferred income tax assets, and the tax loss carryforwards, prior to their expiration. In the event that present conditions change, and it is determined that future operations would not generate enough taxable income, or that tax strategies are no longer viable, the valuation allowance would be increased and reflected in the income statement.
Temporary differences between net income of the period and taxable income for ESPS generated income of $178 in 2005, expense of $203 in 2004 and expense of $71 in 2003, reflected in the income statement of each period.
C) EFFECTIVE TAX RATEThe effects of inflation are recognized differently for IT and for accounting purposes. This situation, and other differences between the book and the IT basis, arising from the several income tax rates and laws in each of the countries in which CEMEX operates, give rise to permanent differences between the approximate statutory tax rate and the effective tax rate presented in the consolidated income statement, which for the years ended December 31, 2005, 2004 and 2003 are as follows: 2005 2004 2003
% % %
Approximated consolidated statutory tax rate 30.0 33.0 34.0Additional deductions and other deductible items (10.7) (21.6) (15.8)Expenses and other non-deductible items (1.4) 1.9 1.2Non-taxable sale of marketable securities and fixed assets (0.3) 0.4 –Difference between book and tax inflation 1.2 1.6 (0.3) Others 3 (4.9) (3.1) (6.8)Effective consolidated tax rate 13.9 12.2 12.3
3 Includes the effects for the different IT rates enacted in the countries where CEMEX operates, and the difference between the 2004 rate in Mexico of 33% and those in effect in 2005 (30%) and 2006 (29%) until reaching a tax rate of 28% in 2007.

70
19. GEOGRAPHIC SEGMENT DATAThe Company operates principally in the construction industry segment through the production and marketing of cement, ready-mix concrete and aggregates.
The following table presents, in accordance with information analyzed for decision-making by management, selected condensed financial information, referring to the main countries or regions in which CEMEX operates, and includes new operations resulting from the acquisition of RMC for the ten-month period ended December 31, 2005.
Selected financial information by geographic segment for the years ended December 31, 2005, 2004 and 2003, is presented below:
Net Sales 1 2005 2004 2003North AmericaMexico $ 33,732 31,196 30,102United States 2 43,441 21,097 19,836EuropeSpain 3 16,098 14,741 13,910United Kingdom 16,299 – –Rest of Europe 4 28,837 – –Central and South America and the CaribbeanVenezuela 4,399 3,742 3,652Colombia 2,664 2,620 2,530Rest of Central and South America and the Caribbean 5 7,195 7,357 6,794Africa and Middle EastEgypt 2,806 2,028 1,542Rest of Africa and Middle East 6 2,981 – –AsiaPhilippines 2,039 1,617 1,536Rest of Asia 7 1,019 – –Others 8 14,145 10,587 9,602 175,655 94,985 89,504Eliminations (12,946) (7,923) (7,459)Consolidated $ 162,709 87,062 82,045
Operating Income 2005 2004 2003North AmericaMexico $ 10,734 11,707 11,593United States 2 7,145 2,776 2,344EuropeSpain 3 3,819 3,582 3,037United Kingdom 567 – –Rest of Europe 4 1,795 – –Central and South America and the CaribbeanVenezuela 1,432 1,169 1,218Colombia 362 1,194 1,052Rest of Central and South America and the Caribbean 5 685 1,685 1,202Africa and Middle EastEgypt 1,045 613 341Rest of Africa and Middle East 6 100 – –AsiaPhilippines 437 289 (145)Rest of Asia 7 (18) – –Others 8 (1,694) (3,232) (3,977)Consolidated $ 26,409 19,783 16,665
Depreciation and Amortization 9 2005 2004 2003North AmericaMexico $ 1,654 1,743 1,676United States 2 3,204 2,266 2,051EuropeSpain 3 759 1,387 1,395United Kingdom 986 – –Rest of Europe 4 1,771 – –Central and South America and the CaribbeanVenezuela 560 568 647Colombia 369 413 846Rest of Central and South America and the Caribbean 5 604 585 614Africa and Middle EastEgypt 202 190 361Rest of Africa and Middle East 6 98 – –AsiaPhilippines 227 374 453Rest of Asia 7 69 – –Others 8 1,088 1,633 1,402Consolidated $ 11,591 9,159 9,445
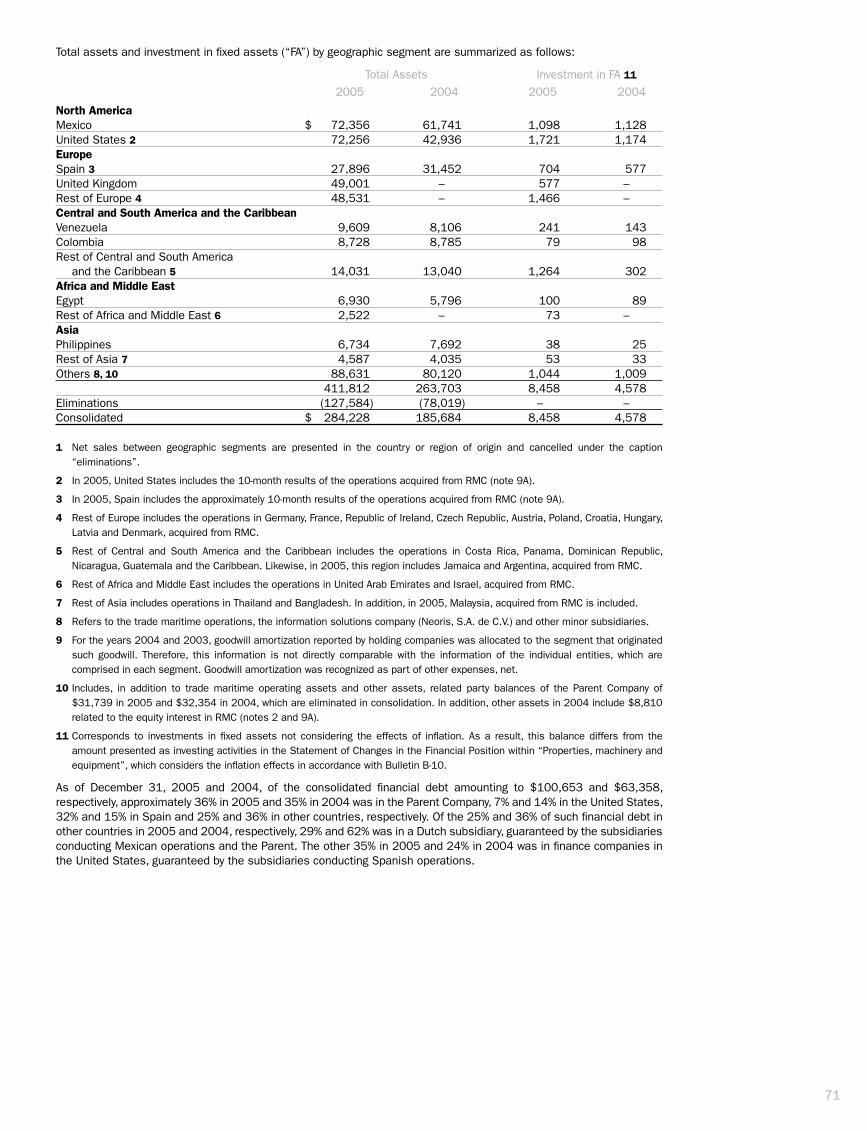
71
Total assets and investment in fixed assets (“FA”) by geographic segment are summarized as follows:
Total Assets Investment in FA 11
2005 2004 2005 2004
North AmericaMexico $ 72,356 61,741 1,098 1,128United States 2 72,256 42,936 1,721 1,174EuropeSpain 3 27,896 31,452 704 577United Kingdom 49,001 – 577 –Rest of Europe 4 48,531 – 1,466 –Central and South America and the CaribbeanVenezuela 9,609 8,106 241 143Colombia 8,728 8,785 79 98Rest of Central and South America and the Caribbean 5 14,031 13,040 1,264 302Africa and Middle EastEgypt 6,930 5,796 100 89Rest of Africa and Middle East 6 2,522 – 73 –AsiaPhilippines 6,734 7,692 38 25Rest of Asia 7 4,587 4,035 53 33Others 8, 10 88,631 80,120 1,044 1,009 411,812 263,703 8,458 4,578Eliminations (127,584) (78,019) – –Consolidated $ 284,228 185,684 8,458 4,578
1 Net sales between geographic segments are presented in the country or region of origin and cancelled under the caption “eliminations”.
2 In 2005, United States includes the 10-month results of the operations acquired from RMC (note 9A).
3 In 2005, Spain includes the approximately 10-month results of the operations acquired from RMC (note 9A).
4 Rest of Europe includes the operations in Germany, France, Republic of Ireland, Czech Republic, Austria, Poland, Croatia, Hungary, Latvia and Denmark, acquired from RMC.
5 Rest of Central and South America and the Caribbean includes the operations in Costa Rica, Panama, Dominican Republic, Nicaragua, Guatemala and the Caribbean. Likewise, in 2005, this region includes Jamaica and Argentina, acquired from RMC.
6 Rest of Africa and Middle East includes the operations in United Arab Emirates and Israel, acquired from RMC.
7 Rest of Asia includes operations in Thailand and Bangladesh. In addition, in 2005, Malaysia, acquired from RMC is included.
8 Refers to the trade maritime operations, the information solutions company (Neoris, S.A. de C.V.) and other minor subsidiaries.
9 For the years 2004 and 2003, goodwill amortization reported by holding companies was allocated to the segment that originated such goodwill. Therefore, this information is not directly comparable with the information of the individual entities, which are comprised in each segment. Goodwill amortization was recognized as part of other expenses, net.
10 Includes, in addition to trade maritime operating assets and other assets, related party balances of the Parent Company of $31,739 in 2005 and $32,354 in 2004, which are eliminated in consolidation. In addition, other assets in 2004 include $8,810 related to the equity interest in RMC (notes 2 and 9A).
11 Corresponds to investments in fixed assets not considering the effects of inflation. As a result, this balance differs from the amount presented as investing activities in the Statement of Changes in the Financial Position within “Properties, machinery and equipment”, which considers the inflation effects in accordance with Bulletin B-10.
As of December 31, 2005 and 2004, of the consolidated financial debt amounting to $100,653 and $63,358, respectively, approximately 36% in 2005 and 35% in 2004 was in the Parent Company, 7% and 14% in the United States, 32% and 15% in Spain and 25% and 36% in other countries, respectively. Of the 25% and 36% of such financial debt in other countries in 2005 and 2004, respectively, 29% and 62% was in a Dutch subsidiary, guaranteed by the subsidiaries conducting Mexican operations and the Parent. The other 35% in 2005 and 24% in 2004 was in finance companies in the United States, guaranteed by the subsidiaries conducting Spanish operations.

72
20. FOREIGN CURRENCY POSITIONAs of December 31, 2005, the main balances denominated in foreign currencies, are as follows:
U.S. dollars millions Mexico Foreign Total
Current assets 55 4,295 4,350Noncurrent assets * 2,552 16,252 18,804 Total assets 2,607 20,547 23,154Current liabilities 419 2,222 2,641Long-term liabilities 1,919 8,370 10,289 Total liabilities 2,338 10,592 12,930
* In the case of Mexico refer to non-monetary assets of foreign origin.
The peso to dollar exchange rate as of December 31, 2005, 2004 and 2003 was $10.62, $11.14 and $11.24 pesos per dollar, respectively. As of January 27, 2006, the exchange rate was $10.45 pesos per dollar.
Transactions of the Company’s Mexican operations denominated in foreign currencies during 2005, 2004 and 2003 are summarized as follows:
U.S. dollars millions 2005 2004 2003
Export sales 124 76 57Import purchases 85 88 91Financial income 16 13 8Financial expense 337 338 389
21. EARNINGS PER SHAREBasic earnings per share are calculated by dividing majority interest net income for the year by the weighted average number of common shares outstanding during the year. Diluted earnings per share reflect the effects of any transactions carried out by the Company, which have a potentially dilutive effect on the weighted average number of common shares outstanding. The amounts considered for calculations, which in 2004 and 2003 include the effect of the stock split, are summarized as follows:
Basic number Diluted number of shares of shares
December 31, 2005 10,378,589,918 10,410,888,190December 31, 2004 9,987,365,042 10,039,265,534December 31, 2003 9,456,402,458 9,674,388,376
Majority net Basic Diluted income EPS EPS
December 31, 2005 $ 22,425 2.16 2.15December 31, 2004 13,965 1.40 1.39December 31, 2003 7,201 0.76 0.74
The difference between the basic and diluted average number of shares in 2005, 2004 and 2003 is attributable to the additional shares to be issued under the Company’s fixed employee stock option programs (note 16). In addition, beginning in 2003, the Company has included the dilutive effect on the basic number of shares resulting from the equity forward contracts in the Company’s own stock, determined under the inverse treasury method.
22. CONTINGENCIES AND COMMITMENTSA) GUARANTEESAs of December 31, 2005 and 2004, CEMEX, S.A. de C.V. had signed as guarantor of loans made to certain subsidiaries for approximately U.S.$711 and U.S.$1,355, respectively. As of December 31, 2004, the Company and certain subsidiaries had guaranteed the risks associated with certain financial transactions, assuming contingent obligations under standby letters of credit, issued by financial institutions for a total of U.S.$26.
B) TAX ASSESSMENTSCEMEX and some of its subsidiaries in Mexico have been notified of several tax assessments related to different tax periods, determined by the Mexican tax authorities according to their verification attributions. These tax assessments are for an amount of approximately $742 as of December 31, 2005. The tax assessments result primarily from: (i) disallowed restatement of tax loss carryforwards in the same period in which they occurred and (ii) disallowed determination of tax loss carryforwards. The companies involved are using the available defense actions granted by law in order to cancel the tax claims. The appeals are pending resolution.
Pursuant to amendments to the Mexican Income tax Law, which became effective on January 1, 2005, Mexican companies with direct or indirect investments in entities incorporated in foreign countries whose income tax liability in those countries is less than 75% of the income tax that would be payable in Mexico, are required to pay taxes in Mexico on income derived from such foreign entities, provided that the income is not derived from entrepreneurial activities in such countries. In those applicable cases, the tax payable by Mexican companies in respect of the 2005 tax year pursuant to these amendments will be due upon filing their annual tax returns in 2006. CEMEX believes these amendments are contrary to Mexican constitutional principles; consequently, on August 8, 2005 the Company filed a motion in the Mexican federal courts challenging the constitutionality of the amendments. In this endeavor, the Company obtained a favorable ruling on December 23, 2005 in the first stage but it is possible that the authority would challenge the ruling.
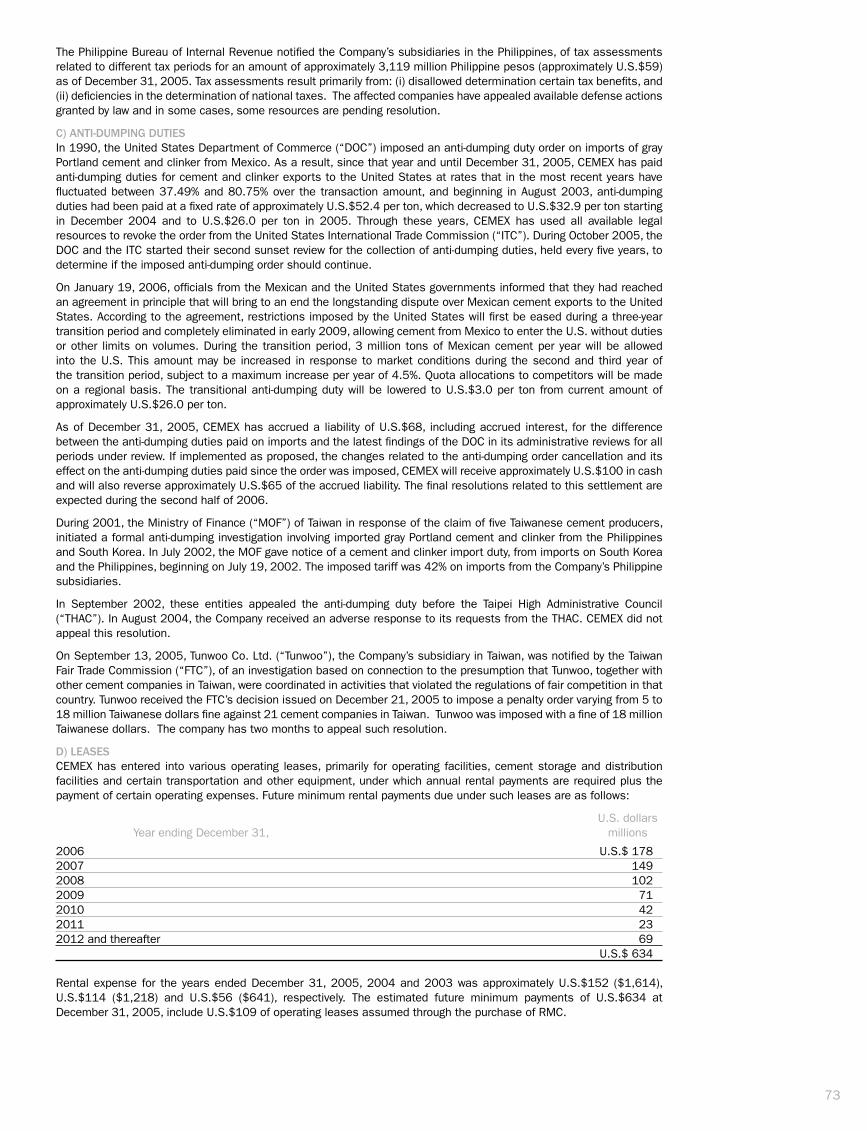
73
The Philippine Bureau of Internal Revenue notified the Company’s subsidiaries in the Philippines, of tax assessments related to different tax periods for an amount of approximately 3,119 million Philippine pesos (approximately U.S.$59) as of December 31, 2005. Tax assessments result primarily from: (i) disallowed determination certain tax benefits, and (ii) deficiencies in the determination of national taxes. The affected companies have appealed available defense actions granted by law and in some cases, some resources are pending resolution.
C) ANTI-DUMPING DUTIESIn 1990, the United States Department of Commerce (“DOC”) imposed an anti-dumping duty order on imports of gray Portland cement and clinker from Mexico. As a result, since that year and until December 31, 2005, CEMEX has paid anti-dumping duties for cement and clinker exports to the United States at rates that in the most recent years have fluctuated between 37.49% and 80.75% over the transaction amount, and beginning in August 2003, anti-dumping duties had been paid at a fixed rate of approximately U.S.$52.4 per ton, which decreased to U.S.$32.9 per ton starting in December 2004 and to U.S.$26.0 per ton in 2005. Through these years, CEMEX has used all available legal resources to revoke the order from the United States International Trade Commission (“ITC”). During October 2005, the DOC and the ITC started their second sunset review for the collection of anti-dumping duties, held every five years, to determine if the imposed anti-dumping order should continue.
On January 19, 2006, officials from the Mexican and the United States governments informed that they had reached an agreement in principle that will bring to an end the longstanding dispute over Mexican cement exports to the United States. According to the agreement, restrictions imposed by the United States will first be eased during a three-year transition period and completely eliminated in early 2009, allowing cement from Mexico to enter the U.S. without duties or other limits on volumes. During the transition period, 3 million tons of Mexican cement per year will be allowed into the U.S. This amount may be increased in response to market conditions during the second and third year of the transition period, subject to a maximum increase per year of 4.5%. Quota allocations to competitors will be made on a regional basis. The transitional anti-dumping duty will be lowered to U.S.$3.0 per ton from current amount of approximately U.S.$26.0 per ton.
As of December 31, 2005, CEMEX has accrued a liability of U.S.$68, including accrued interest, for the difference between the anti-dumping duties paid on imports and the latest findings of the DOC in its administrative reviews for all periods under review. If implemented as proposed, the changes related to the anti-dumping order cancellation and its effect on the anti-dumping duties paid since the order was imposed, CEMEX will receive approximately U.S.$100 in cash and will also reverse approximately U.S.$65 of the accrued liability. The final resolutions related to this settlement are expected during the second half of 2006.
During 2001, the Ministry of Finance (“MOF”) of Taiwan in response of the claim of five Taiwanese cement producers, initiated a formal anti-dumping investigation involving imported gray Portland cement and clinker from the Philippines and South Korea. In July 2002, the MOF gave notice of a cement and clinker import duty, from imports on South Korea and the Philippines, beginning on July 19, 2002. The imposed tariff was 42% on imports from the Company’s Philippine subsidiaries.
In September 2002, these entities appealed the anti-dumping duty before the Taipei High Administrative Council (“THAC”). In August 2004, the Company received an adverse response to its requests from the THAC. CEMEX did not appeal this resolution.
On September 13, 2005, Tunwoo Co. Ltd. (“Tunwoo”), the Company’s subsidiary in Taiwan, was notified by the Taiwan Fair Trade Commission (“FTC”), of an investigation based on connection to the presumption that Tunwoo, together with other cement companies in Taiwan, were coordinated in activities that violated the regulations of fair competition in that country. Tunwoo received the FTC’s decision issued on December 21, 2005 to impose a penalty order varying from 5 to 18 million Taiwanese dollars fine against 21 cement companies in Taiwan. Tunwoo was imposed with a fine of 18 million Taiwanese dollars. The company has two months to appeal such resolution.
D) LEASESCEMEX has entered into various operating leases, primarily for operating facilities, cement storage and distribution facilities and certain transportation and other equipment, under which annual rental payments are required plus the payment of certain operating expenses. Future minimum rental payments due under such leases are as follows:
U.S. dollars Year ending December 31, millions
2006 U.S.$ 1782007 1492008 1022009 712010 422011 232012 and thereafter 69 U.S.$ 634
Rental expense for the years ended December 31, 2005, 2004 and 2003 was approximately U.S.$152 ($1,614), U.S.$114 ($1,218) and U.S.$56 ($641), respectively. The estimated future minimum payments of U.S.$634 at December 31, 2005, include U.S.$109 of operating leases assumed through the purchase of RMC.

74
E) PLEDGED ASSETSAs of December 31, 2005 and 2004, there are liabilities amounting to U.S.$100 and U.S.$2, respectively, secured by properties, machinery and equipment.
F) COMMITMENTSAs of December 31, 2005 and 2004, the Company had commitments for the purchase of raw materials for an approximate amount of U.S.$169 and U.S.$172, respectively.
During 1999, CEMEX entered into agreements with an international partnership, which built and currently operates an electrical energy generating plant in Mexico. According to the agreements, CEMEX will purchase, starting from the beginning of operations of the plant, all the energy generated for a term of not less than 20 years. The electrical energy generating plant started operations on April 29, 2004. In addition, as part of the agreements, CEMEX has committed to supply the electrical energy plant with all fuel necessary for its operations, a commitment that has been hedged through a 20-year agreement entered into by the Company with Petróleos Mexicanos. The Company is not required to make any capital investment in the project. By means of this transaction, at December 31, 2005, the energy generated by the plant has supplied electricity to 10 cement plants of CEMEX in Mexico, covering 73% of their needs and decreasing electricity costs by 28%.
G) OTHER CONTINGENCIESOn August 5, 2005, Cartel Damages Claims, S.A. (“CDC”), filed a lawsuit in the District Court in Düsseldorf, Germany against CEMEX Deutschland AG, the subsidiary of the Company in Germany, and other German cement companies. By means of this lawsuit, CDC is seeking 102 million euros (approximately U.S.$121) in respect of damage claims by 28 entities relating to alleged price and quota fixing by German cement companies between 1993 and 2002. CDC is a Belgian company established in the aftermath of the German cement cartel investigation that took place from July 2002 to April 2003 by Germany’s Federal Cartel Office, with the purpose of purchasing potential damage claims from cement consumers and pursuing those claims against the cartel participants. At this preliminary stage in the proceedings, it is not possible to assess the likelihood of an adverse result in this lawsuit for CEMEX or the potential damages.
In August 2005, a lawsuit was filed against a subsidiary of CEMEX Colombia, claiming that it was liable along with certain employees and former employees of Asociación Colombiana de Productores de Concreto, or ASOCRETO, a union formed by all the ready-mix producers in Colombia, and the company in charge of building the mass public transportation system of Bogotá, Colombia, for the premature distress of the roads built for such transportation system using ready-mix concrete supplied by CEMEX Colombia and other ASOCRETO members. The plaintiffs allege that the ASOCRETO defendants modified the initial specifications of the transportation system to include certain construction materials supplied by CEMEX Colombia, and that as a result of these changes in the specifications, the base material supplied for the road construction failed to meet certain technical quality standards.
The plaintiffs seek the repair of the roads and estimate that the cost of such repair will be approximately U.S.$45. CEMEX Colombia is vigorously contesting this lawsuit. At this preliminary stage in the proceedings, it is not possible to assess the likelihood of an adverse result in this lawsuit, or the potential damages that could be borne by CEMEX Colombia. Typically, proceedings of this nature continue for several years before final resolution.
As of December 31, 2005, CEMEX Inc., the Company’s subsidiary in the United States, has accrued liabilities specifically relating to environmental matters in the aggregate amount of approximately U.S.$28. The environmental matters relate to: a) in the past, in accordance with industry practices, disposing of various materials, which might be currently categorized as hazardous substances or wastes, and b) the cleanup of sites used or operated by the Company, including discontinued operations, in regard to the disposal of hazardous substances or wastes, either individually or jointly with other parties. Most of the proceedings remain in the preliminary stage, and a final resolution might take several years. For purposes of recording any provision, the subsidiary considers that it is probable that a liability has been incurred and the amount of the liability is reasonably estimable, whether or not claims have been asserted, and without giving effect to any possible future recoveries. Based on the information developed to date, the subsidiary does not believe it will be required to spend significant sums on these matters in excess of the amounts previously recorded. Until all environmental studies, investigations, remediation work and negotiations with or litigation against potential sources of recovery have been completed, the ultimate cost that might be incurred to resolve these environmental issues cannot be assured.
During 2001, a subsidiary of the Company in Colombia received a civil liability suit from 42 transporters, alleging that this subsidiary is responsible for alleged damages caused by the alleged breach of provision of raw materials contracts. The plaintiffs have asked for relief in an amount in Colombian pesos equivalent, as of December 31, 2005, to approximately U.S.$57. As of December 31, 2005, the evidentiary stage has been closed, the final arguments have been presented and the final decision is pending.
In addition, during 1999, several companies filed a lawsuit against two subsidiaries of the Company in Colombia, alleging that the Ibagué plants were causing damage to their lands due to the pollution they generate. In January 2004, CEMEX Colombia, S.A. was notified that the court’s decision was that plaintiffs should be paid in the amount in Colombian pesos equivalent, as of December 31 2005, to approximately U.S.$8. The Company’s subsidiary sought leave to appeal the resolution, which was accepted, and the case was sent to the Superior Court of Ibagué. The claim is under review in the Court of Appeals. Typically, this process will continue for several years before its final resolution.

75
23. ALLOCATION OF THE PURCHASE PRICE OF RMC AND PRO FORMA FINANCIAL INFORMATIONA) ALLOCATION OF THE PURCHASE PRICEAs of December 31, 2005, the Company is in the final stage of allocating the price paid in the purchase of RMC of $44,787 (U.S.$4,217) to the fair values of the assets acquired and the liabilities assumed. The price paid for RMC’s shares was adjusted to include: (i) direct acquisition expenses, and (ii) the proceeds received from the sale of some RMC’s assets (note 9A).
CEMEX considers that the unassigned portion of the purchase price that was recognized as goodwill as of December 31, 2005, is representative of the final amount that will result when the allocation process finishes at the end of the first quarter of 2006. The Company has substantially finished with the valuation of the assets acquired and the liabilities assumed and, recognizing that some other issues may arise, the only pending issue is to conclude whether any portion of goodwill should be further allocated to other intangible assets, other than brands and trade names.
The allocation of the purchase price of RMC to the fair value of the assets acquired and liabilities assumed is presented below:
As of March 1, 2005 RMC
Current assets $ 21,915Investments and other noncurrent assets 2,536Properties, machinery and equipment 70,317Other assets A 979Intangible assets B 1,850Goodwill 12,411Total assets acquired 110,008Current liabilities C 28,556Long-term debt C 13,173Remediation liabilities 4,005Pensions and other postretirement benefits 5,561Deferred IT liability 13,186Other long-term liabilities 740Total liabilities assumed 65,221Total net assets $ 44,787
A Includes $718 of deferred tax assets.B Identified intangible assets refer mainly to trade names and brands, which have been assigned with an average useful life of
approximately 5 years.C Current liabilities include $11,983 of short-term financial debt, while long-term debt includes $11,903 of financial debt.
B) PRO FORMA FINANCIAL INFORMATIONThe following condensed pro forma income statements for the twelve-month periods ended December 31, 2005 and 2004, gives effect to the RMC acquisition as if it had occurred on January 1, 2004. The pro forma adjustments consider the fair values of the net assets acquired, under certain assumptions that CEMEX considers are reasonable.
CEMEX RMC Adjustments CEMEX Year ended December 31, 2005 1 2 3 pro forma
Sales $ 162,709 10,085 – 172,794Operating income 26,409 (293) (115) 26,001Comprehensive financing result 2,600 (107) (1,790) 703Other expenses, net (3,372) 2 (38) (3,408)Income taxes (3,555) (46) 265 (3,336)Equity in income of affiliates 928 10 – 938Consolidated net income 23,010 (434) (1,678) 20,898Minority interest 585 13 – 598Majority net income $ 22,425 (447) (1,678) 20,300Basic EPS $ 2.16 1.96Diluted EPS 2.15 1.95
CEMEX RMC Adjustments CEMEX Year ended December 31, 2004 1 2 3 pro forma
Sales $ 87,062 82,162 – 169,224Operating income 19,783 2,510 (761) 21,532Comprehensive financing result 1,424 (971) 3,851 4,304Other expenses, net (5,169) (5,237) (836) (11,242)Income taxes (2,277) (630) (377) (3,284)Equity in income of affiliates 428 504 – 932Consolidated net income 14,189 (3,824) 1,877 12,242Minority interest 224 228 – 452Majority net income $ 13,965 (4,052) 1,877 11,790Basic EPS $ 1.40 1.18Diluted EPS 1.39 1.17

76
1 Information derived from the consolidated income statements for the years 2005 and 2004, as reported. In 2005, includes RMC’s operating results for the ten-month period ended December 31, 2005.
2 In 2005, the information relates to the two-month period (unaudited) ended February 28, prepared under International Financial Reporting Standards (“IFRS”). In 2004, the information was obtained from the audited consolidated financial statements, prepared under generally accepted accounting principles in the United Kingdom (“UK GAAP”), and include reclassifications to conform RMC amounts to CEMEX’s presentation. RMC’s information was translated into pesos at the exchange rates of $21.30 and $18.27, effective as of February 28, 2005 and December 31, 2004, respectively, per £1 United Kingdom sterling pound, and was restated to constant pesos as of December 31, 2005.
3 The pro forma adjustments for the two-month period of RMC in 2005 and the twelve-month period of RMC in 2004 include adjustments related to the allocation of RMC’s purchase price. Likewise, the 2004 pro forma adjustments include adjustments resulting from the relevant differences identified between UK GAAP and Mexican GAAP. The main adjustments as of February 28, 2005 and December 31, 2004, consist of:
Items 2005 2004
Complement of depreciation expense $ (115) (761)Financial expense D (168) (1,114)Valuation of derivative instruments (1,314) 1,475Foreign exchange fluctuations D (351) 1,290Monetary position result 42 2,200Intangible assets amortization (37) (246)Goodwill amortization – (590)Deferred income tax 265 (377) $ (1,678) 1,877
D Determined on the basis of the U.S.$3,311 in 2005 and U.S.$3,326 in 2004 of average debt assumed for the purchase, using the interest rates of 2.8% in 2005 and 2.4% in 2004.
Pro forma financial information is not an indication of the consolidated results of operations that CEMEX would have reported had the RMC acquisition been completed as of January 1, 2004, nor should such information be taken as representative of the Company’s future consolidated results.
24. NEWLY ISSUED ACCOUNTING PRONOUNCEMENTSUntil May 2004, the Accounting Principles Commission (“CPC”) of the Mexican Institute of Public Accountants was the accounting standards settler in Mexico. Beginning in June 2004, this function was transferred to the Consejo Mexicano para la Investigación y Desarrollo de Normas de Información Financiera (“CINIF”). The CINIF is a private organization whose objectives are to develop Financial Reporting Standards (“FRS”) in Mexico that would be useful for financial information issuers and users, as well as to accomplish the possible convergence with IFRS, issued by the International Accounting Standards Board.
Through December 2005, the CINIF issued eight series A FRS and one series B FRS. Effective January 1, 2006, standards in Mexico include the FRS issued by the CINIF, as well as the Bulletins issued by the CPC that have not been modified, superseded or revoked by a new FRS.
The main changes, included in the FRS issued, are the following:
a) Elimination of special and extraordinary items, classifying captions in the income statements as ordinary and non-ordinary.
b) Retroactive recognition of the effects of changes in accounting principles.
c) Disclosure of the authorized date for the issuance of the financial statements, as well as the officer or entity that authorized their issuance.
25. NOTES TO THE PARENT COMPANY-ONLY FINANCIAL INFORMATION
CEMEX, S.A. de C.V. (CEMEX or the Company) is a Mexican holding company (parent) of entities whose main activities are oriented to the construction industry, through the production and marketing of cement, ready-mix concrete and aggregates.
A. SIGNIFICANT ACCOUNTING POLICIESA.1 BASIS OF PRESENTATION AND DISCLOSUREThe financial statements have been prepared in accordance with Generally Accepted Accounting Principles in Mexico (“Mexican GAAP”), which recognize the effects of inflation on the financial information.
The preparation of the Parent Company’s financial statements considered, when applicable, the same accounting policies listed in note 3 to CEMEX and subsidiaries’ consolidated financial statements.
In addition, note 25 includes references to other notes to the consolidated financial statements, in those cases when information also refers to the Parent Company.
A.2 RESTATEMENT OF COMPARATIVE FINANCIAL STATEMENTSThe restatement factors applied to the Parent Company’s financial statements of prior periods were determined using Mexican inflation. Factor using Mexican inflation
2004 to 2005 1.03002003 to 2004 1.05392002 to 2003 1.0387

77
B. OTHER ACCOUNTS RECEIVABLEAs of December 31, 2005 and 2004, other short-term accounts receivable of the Parent Company consist of:
2005 2004
Non-trade receivables $ 225 236Advances and valuation of derivative instruments (notes 12 and 17) 53 403Other refundable taxes 483 375 $ 761 1,014
C. INVESTMENTS IN SUBSIDIARIES AND AFFILIATESAs of December 31, 2005 and 2004, investments of the Parent Company in subsidiaries and affiliated companies, accounted for by the equity method, are as follows:
2005 2004
Book value at acquisition date $ 78,126 67,143Revaluation by equity method 54,669 33,324 $ 132,795 100,467
D. INTANGIBLE ASSETS AND DEFERRED CHARGESAs of December 31, 2005 and 2004, intangible assets of indefinite life and deferred charges of the Parent Company are summarized as follows:
2005 2004
Intangible assets of indefinite useful life:Goodwill $ 2,080 2,143Accumulated amortization (187) (193) 1,893 1,950
Deferred charges:Deferred financial expenses 163 203Deferred taxes 1,009 2,029Others 378 390Accumulated amortization (322) (313) 1,228 2,309 $ 3,121 4,259
E. OTHER ACCOUNTS PAYABLE AND ACCRUED EXPENSESOther accounts payable and accrued expenses of the Parent Company as of December 31, 2005 and 2004 consist of:
2005 2004
Accounts payable and accrued expenses $ 1 1Interests payable 256 212Taxes payable 190 178Dividends payable 5 5Valuation of derivative instruments (notes 12 and 17) – 278 $ 452 674
Short-term provisions primarily consist of: (i) accruals for insurance payments and (ii) accruals related to the portion of legal assessments to be settled in short-term. Commonly, these amounts are revolving in nature and are to be settled and replaced by similar amounts within the next 12 months.
F. SHORT-TERM AND LONG-TERM BANK LOANS AND NOTES PAYABLEThe maturities of long-term debt of the Parent Company as of December 31, 2005 are as follows:
Parent
2007 $ 2,9302008 8,3832009 11,7762010 5,5222011 and thereafter 1,502 $ 30,113
As of December 31, 2005 and 2004, 41% and 90%, respectively of the Parent Company’s short-term debt is denominated in dollars. Relating to long-term debt, 62% and 84% is denominated in dollars in 2005 and 2004, respectively. The remaining debt, in both years, is primarily denominated in Mexican pesos.
In the Parent Company’s balance sheet at December 31, 2005 and 2004, there were short-term debt transactions, classified as long-term debt, for U.S.$125 ($1,328) and U.S.$350 ($3,717), respectively, due to the Company’s ability and the intention to refinance such indebtedness with the available amounts of committed long-term lines of credit.
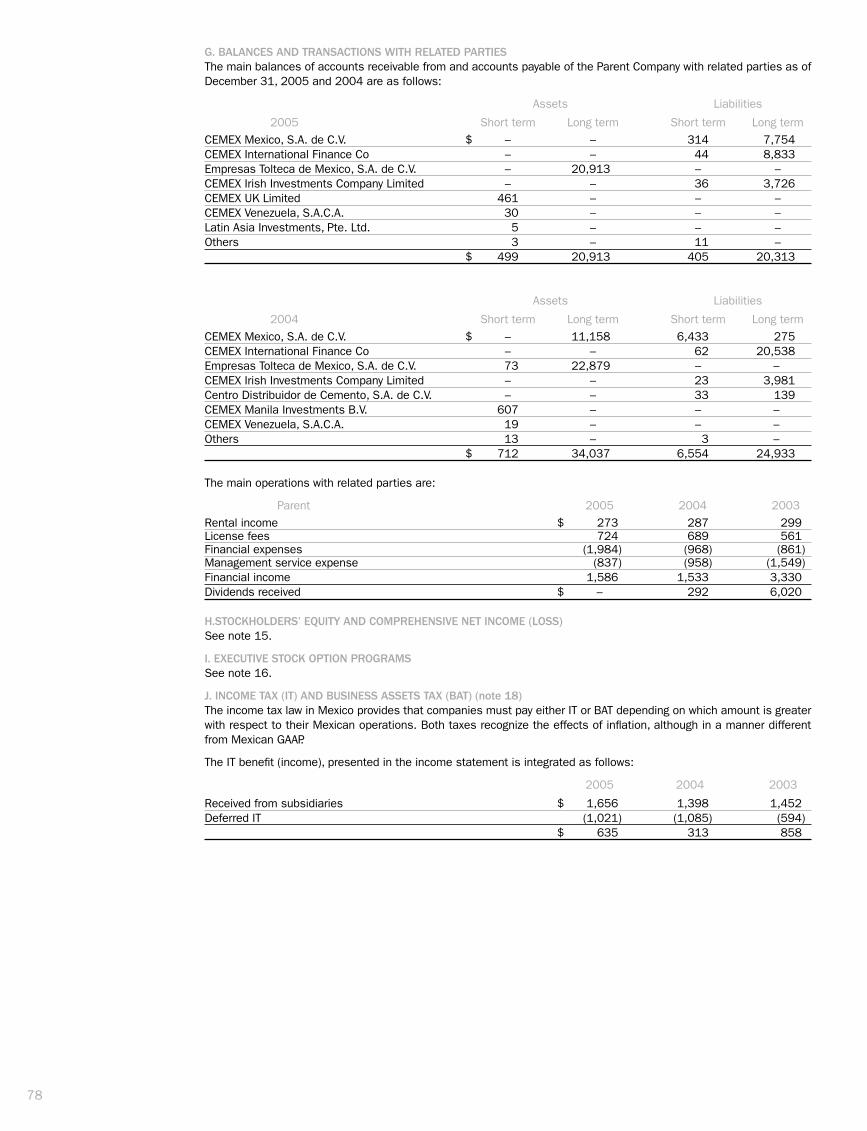
78
G. BALANCES AND TRANSACTIONS WITH RELATED PARTIESThe main balances of accounts receivable from and accounts payable of the Parent Company with related parties as of December 31, 2005 and 2004 are as follows:
Assets Liabilities
2005 Short term Long term Short term Long termCEMEX Mexico, S.A. de C.V. $ – – 314 7,754CEMEX International Finance Co – – 44 8,833Empresas Tolteca de Mexico, S.A. de C.V. – 20,913 – –CEMEX Irish Investments Company Limited – – 36 3,726CEMEX UK Limited 461 – – –CEMEX Venezuela, S.A.C.A. 30 – – –Latin Asia Investments, Pte. Ltd. 5 – – –Others 3 – 11 – $ 499 20,913 405 20,313
Assets Liabilities
2004 Short term Long term Short term Long termCEMEX Mexico, S.A. de C.V. $ – 11,158 6,433 275CEMEX International Finance Co – – 62 20,538Empresas Tolteca de Mexico, S.A. de C.V. 73 22,879 – –CEMEX Irish Investments Company Limited – – 23 3,981Centro Distribuidor de Cemento, S.A. de C.V. – – 33 139CEMEX Manila Investments B.V. 607 – – –CEMEX Venezuela, S.A.C.A. 19 – – –Others 13 – 3 – $ 712 34,037 6,554 24,933
The main operations with related parties are:
Parent 2005 2004 2003Rental income $ 273 287 299License fees 724 689 561Financial expenses (1,984) (968) (861)Management service expense (837) (958) (1,549)Financial income 1,586 1,533 3,330Dividends received $ – 292 6,020
H.STOCKHOLDERS’ EQUITY AND COMPREHENSIVE NET INCOME (LOSS)See note 15.
I. EXECUTIVE STOCK OPTION PROGRAMSSee note 16.
J. INCOME TAX (IT) AND BUSINESS ASSETS TAX (BAT) (note 18)The income tax law in Mexico provides that companies must pay either IT or BAT depending on which amount is greater with respect to their Mexican operations. Both taxes recognize the effects of inflation, although in a manner different from Mexican GAAP.
The IT benefit (income), presented in the income statement is integrated as follows:
2005 2004 2003
Received from subsidiaries $ 1,656 1,398 1,452Deferred IT (1,021) (1,085) (594) $ 635 313 858

79
CEMEX has accumulated IT loss carryforwards which, restated for inflation, can be amortized against taxable income in the succeeding ten years according to income tax law:
Year in which tax loss Amount of Year of occurred carryforwards expiration
1998 $ 3,614 20082001 1,812 20112002 5,870 20122003 4,281 20132004 42 20142005 295 2015 $ 15,914
The Company must generate taxable income to preserve the benefit of the tax loss carryforwards generated beginning in 2002.
The BAT Law establishes a 1.8% tax levy on assets, restated for inflation in the case of inventory and fixed assets, and deducting certain liabilities. CEMEX, S.A. de C.V. is a Parent Company, authorized by Mexican Tax Authorities to consolidate for tax purposes in accordance with the Income Tax Law; as a result, the Company is obliged in terms of the BAT law to calculate and file the consolidated asset value for the exercise.
K. EARNINGS PER SHARESee note 21.
L. CONTINGENCIES AND COMMITMENTSSee note 22.
80
directorsboard of
Directors
Lorenzo H. Zambrano Chairman of the Board
Lorenzo Milmo Zambrano
Armando J. García Segovia
Rodolfo García Muriel
Rogelio Zambrano Lozano
Roberto Zambrano Villarreal Independent member
Bernardo Quintana Isaac
Dionisio Garza Medina
Alfonso Romo Garza Independent member
Mauricio Zambrano Villarreal Independent member
Tomás Brittingham Longoria Independent member
José Manuel Rincón Gallardo Independent member
Alternate directors
Eduardo Brittingham Sumner Independent member
Tomás Milmo Santos
Jorge García Segovia
Luis Santos de la Garza Examiner
Fernando Ruiz Arredondo Alternate examiner
Ramiro Villarreal Morales Secretary (not a member of the board)
Audit committee members
Roberto Zambrano Villarreal President
Lorenzo Milmo Zambrano
Alfonso Romo Garza
Tomás Brittingham Longoria
José Manuel Rincón Gallardo

81
Lorenzo H. Zambrano (61)Chairman of the Board and Chief Executive Officer> Mr. Zambrano joined CEMEX in 1968. He was
named CEO in 1985 and has served as Chairman of the Board since 1995. He holds a B.S. degree in mechanical engineering from Tecnológico de Monter-rey and an M.B.A. from Stanford University. He is a member of the IBM Board of Directors, the Citigroup International Advisory Board, and the boards of directors of Alfa, Grupo Financiero Banamex, FEMSA, ICA, Televisa, and Vitro. Mr. Zambrano is also Chair-man of the Board of Tecnológico de Monterrey.
Héctor Medina (55)Executive Vice President of Planning and Finance> Mr. Medina, who joined CEMEX in 1988, has a
degree in chemical engineering from Tecnológico de Monterrey. He received an M.Sc. degree in manage-ment from the University of Bradford Management Center in the United Kingdom and an M.S. Diploma from the Escuela de Organización Industrial in Ma-drid, Spain. Mr. Medina is responsible for CEMEX’s worldwide strategic planning and finance.
Armando J. García (53)Executive Vice President of Development
> Mr. García, who originally joined CEMEX in 1975 and rejoined the company in 1985, holds a degree in mechanical engineering and business administra-tion from Tecnológico de Monterrey and an M.B.A. from the University of Texas. He is responsible for managing CEMEX’s operations technology, human resources, energy, and information technology.
Víctor M. Romo (47)Executive Vice President of Administration> Mr. Romo joined CEMEX in 1985. He earned his
bachelor’s degree in accounting and his M.S. degree in administration from Tecnológico de Monterrey. Before assuming his current position, Mr. Romo served as President of the South America and Caribbean Region. He is now responsible for the areas of comptrollership, procurement, taxation, security, risk management, and administrative services, processes, and projects.
Francisco Garza (50)President of the North America Region & Trading> Mr. Garza is a graduate of Tecnológico de Monterrey
and has an M.B.A. from Cornell University’s Johnson Graduate School of Management. Since he joined CEMEX in 1988, he has occupied several senior management positions in the company. Mr. Garza is directly responsible for CEMEX’s interests and operations in Mexico and the United States and the company’s trading unit.
Fernando A. González (51)President of the European Region> Mr. González earned his B.A. and M.B.A. from
Tecnológico de Monterrey. Since he joined CEMEX in 1989, he has held several senior management posi-tions, including Vice President of Strategic Planning, President of CEMEX Venezuela, President of CEMEX Asia, and President of the Central and South America and the Caribbean Region. Mr. González is currently responsible for the European region, including the United Kingdom, France, Germany, the rest of Europe (other than Spain, Portugal, and Italy), and Israel.
José Luis Sáenz de Miera (59)President of the Southern Europe, Africa, Middle East & Asia Region> Mr. Sáenz de Miera began in CEMEX in 1993 as Gen-
eral Manager of Administration and Finance of CEMEX Spain. One year later, he was appointed President of these operations. In 1998 he was appointed President of the Europe and Asia Region. Today he is responsible for CEMEX’s operations in Southern Europe, Africa, the Middle East, and Asia. Mr. Sáenz de Miera has a degree in economics from Universidad de Madrid, and also received a certified public accountant’s degree in Spain.
Juan Romero (48)President of the South America & Caribbean Region > Mr. Romero graduated from Universidad de Comil-
las, Spain, where he studied Law and Economic and Enterprise Sciences. He joined CEMEX in 1989 and has occupied several senior management posi-tions, including the responsibility for the company’s operations in Colombia and Mexico. Currently, he is directly responsible for CEMEX’s operations and in-terests in the South America and Caribbean region.
Rodrigo Treviño (49)Chief Financial Officer> Mr. Treviño, who joined CEMEX in 1997, received
his B.S. and M.S. degrees in industrial engineering from Stanford University. He is responsible for the company’s finance, capital markets, treasury, and investor relations.
Management team

82
Financial
EBITDA is operating income plus depreciation and amortization. Amortization of goodwill is not included in operating income but is instead recorded in other income (expense) below the operating line. EBITDA does not include certain extraordinary income and expenses that are not included in operating income under Mexican GAAP . EBITDA is not a GAAP measure.
Free cash flow equals EBITDA minus net interest expense, capital expenditures, change in working capital, taxes paid, and other cash items (net other expenses less proceeds from the disposal of obsolete and/or substantially depleted operat-ing fixed assets that are no longer in operation).
Interest coverage equals EBITDA divided by finan-cial expenses.
Net debt equals total debt minus the fair value of cross-currency swaps associated with debt minus cash and cash equivalents.
Net debt to EBITDA is calculated by dividing net debt by EBITDA. This ratio includes CEMEX’s EBIT-DA for the past 12 months plus the estimated EBITDA of RMC for the past 12 months.
Net working capital equals operating accounts receivable (including other current assets received as payment in kind) plus historical inventories minus operating payables.
Return on capital employed equals operating income minus taxes and profit sharing, divided by the sum of average net debt and consolidated stockholders’ equity.
Industry
Aggregates are sand and gravel, which are mined from quarries. They give ready-mix concrete its necessary volume and add to its overall strength. Under normal circumstances, one cubic meter of fresh concrete contains two metric tons of gravel and sand.
Clinker is an intermediate cement product made by sintering limestone, clay, and iron oxide in a kiln at around 1,450 degrees Celsius. One metric ton of clinker is used to make approximately 1.1 metric tons of gray Portland cement.
Gray Portland cement is a hydraulic binding agent with a composition by weight of at least 95% clinker and 0–5% of a minor component (usually calcium sulfate). It can set and harden underwa-ter and, when mixed with aggregates and water, produces concrete or mortar.
Installed capacity is the theoretical annual production capacity of a plant, whereas effective capacity is a plant’s actual optimal annual produc-tion capacity, which can be 10–20% less than installed capacity.
Metric ton is the equivalent of 1.102 short tons.
Pet coke is petroleum coke, a solid or fixed car-bon substance that remains after the distillation of hydrocarbons in petroleum. It may be used as fuel in the production of cement.
Ready-mix concrete is a mixture of cement, ag-gregates, and water.
White cement is a specialty cement that is used for decorative purposes and has a wide range of uses as a structural building material.
termswe use

Exchange listings Bolsa Mexicana de Valores (BMV), Mexico New York Stock Exchange (NYSE), United States Share series CPO (representing two A shares and one B share) ADR (representing ten CPOs)
BMV ticker symbol CEMEX CPO
NYSE ticker symbol CX
Media relations contact [email protected] Phone: (52-81) 8888-4334 Fax: (52-81) 8888-4417
Investor relations [email protected] From the US: 1 877 7CX NYSE From other countries: (212) 317-6000 Fax: (212) 317-6047
informationinvestor and media
Headquarters Av. Ricardo Margáin Zozaya 325 CP 66265 San Pedro Garza García, N.L. México Phone: (52-81) 8888-8888 Fax: (52-81) 8888-4417
Mexico City office Av. Presidente Masarik 101 - 18 CP 11570 México, D.F. México Phone: (52-55) 5726-9040 Fax: (52-55) 5203-2542
New York office 590 Madison Ave., 41st floor New York, NY 10022 USA Phone: (212) 317-6000 Fax: (212) 317-6047
Web addresswww.cemex.com
The information presented herein contains certain forward-looking statements and information relating to CEMEX, S.A. de C.V. and its subsidiaries (collectively, “CEMEX”) that are based on the beliefs of its management as well as assumptions made by and information currently available to CEMEX. Such statements reflect the current views of CEMEX with respect to future events and are subject to certain risks, uncertainties, and assumptions. Many factors could cause the actual results, performance, or achievements of CEMEX to be materially different from any future results, performance, or achievements that may be expressed or implied by such forward-looking statements, including, among others, changes in general economic, political, governmental, and business conditions globally and in the countries in which CEMEX does business; changes in interest rates; changes in inflation rates; changes in exchange rates; the level of construction generally; changes in cement demand and prices; changes in raw material and energy prices; changes in business strategy; and various other factors. Should one or more of these risks or uncer-tainties materialize, or should underlying assumptions prove incorrect, actual results may vary materially from those described herein as anticipated, believed, estimated, or expected. CEMEX does not intend, and does not assume any obligation, to update these forward-looking statements. In addition, certain information presented herein was extracted from information published by various official sources. This information includes statistical information relating to the cement industry, certain reported rates of inflation, exchange rates, and information relating to the countries in which CEMEX operates. CEMEX has not participated in the preparation or compilation of any of such information and accepts no responsibility therefor.de
sign
: si
gni |
pho
to: H
. H
erre
ra -
M. G
reen
- an
d ot
hers
| pr
intin
g w
etm
ore
… and

www.cemex.com
2005 ANNUAL REPORT
Construyendo el futuroMR
Building the futureTM
CE
ME
X • 2005 AN
NU
AL
RE
PO
RT


![LI*ZO-A* · f300 3 on on on 300 sw1sw2 sw3 sw4 [hz] 100 sw on on 270on on 230 on on 200( ) 160 on 130 on on on 380 on on on on 500 on on on 470 on on on 430 200hz atos 7 b1:](https://img.pdfslide.net/doc/110x75/5c5bde4b09d3f23b368c7bcd/lizo-a-f300-3-on-on-on-300-sw1sw2-sw3-sw4-hz-100-sw-on-on-270on-on-230-on.jpg)