Embed Size (px)
Citation preview
On cold spells in North America and storminessin western EuropeGabriele Messori1,2, Rodrigo Caballero1, and Marco Gaetani3
1Department of Meteorology and Bolin Centre for Climate Research, Stockholm University, Stockholm, Sweden, 2Now at MetOffice Hadley Centre, Exeter, UK, 3LATMOS/IPSL, UPMC Université Paris 06 Sorbonne Universités, UVSQ, CNRS, Paris, France
Abstract We discuss the dynamical and statistical links between cold extremes over eastern NorthAmerica and storminess over western Europe, with a focus on the midlatitude jet stream, the NorthAtlantic Oscillation (NAO) and the Pacific-North American Pattern (PNA). The analysis is performed on theEuropean Centre for Medium-Range Weather Forecasts 20th Century Reanalysis. The large-scale circulationassociated with the cold spells corresponds to advection of cold air from the Arctic region into North Americaand to a very zonal and intense North Atlantic jet, shifted persistently south of its climatological location.These features of the Atlantic jet are conducive to destructive windstorms and intense precipitation over alarge part of southern and continental Europe and the British Isles. The cold spells are preceded by a negativeNAO and followed by a positive PNA; however, we interpret the associated circulation anomalies as beingdistinct from these standard modes of climate variability.
1. Introduction
A remarkably large number of extreme weather events have affected the extratropical Northern Hemisphereduring recent winters [e.g., Coumou and Rahmstorf, 2012; Screen and Simmonds, 2014; Francis and Skific,2015]. Repeated cold and snowy spells over North America [e.g., Wang et al., 2010; Guirguis et al., 2011;Palmer, 2014; Lee et al., 2015; Trenary et al., 2015] and stormy and rainy weather over continental Europeand the British Isles [e.g., Fink et al., 2009; Matthews et al., 2014; Huntingford et al., 2014; Slingo et al., 2014;Kendon and McCarthy, 2015; van Oldenborgh et al., 2015; Christidis and Stott, 2015;Wild et al., 2015] have gar-nered widespread scientific and media coverage. Detailed case studies have been dedicated to individualevents [e.g., Fink et al., 2009; Wang et al., 2010] and seasons [e.g., Santos et al., 2013; Huntingford et al.,2014; Kendon and McCarthy, 2015], while other studies have focused more broadly on the drivers of coldspells over North America and storminess over Europe. The occurrence of these events has notably beenascribed to large-scale modes of variability [e.g., Wang et al., 2010; Guirguis et al., 2011; Huntingford et al.,2014] and changes in midlatitude planetary wave activity [e.g., Liu et al., 2012; Barnes and Screen, 2015].
Cold extremes over North America and storminess over Europe have typically been discussed separately.However, the notable recent co-occurrence of the two types of extremes in the same winter [Kendon andMcCarthy, 2015; Trenary et al., 2015] raises the question of whether there may be a systematic, physicallybased link between the two. The answer to this question can have important consequences for insuranceand reinsurance companies with worldwide exposure that are particularly vulnerable to large, correlatedlosses across their portfolios. An analogous situation arises for “clustered” windstorms, where specific dyna-mical mechanisms favor the occurrence of several extremewindstorms in quick succession [Pinto et al., 2014].
Here we explore the dynamical links between extreme events across the North Atlantic basin. We specificallyseek to identify systematic connections between cold spells over eastern North America and downstreamimpacts over western Europe, in particular intense surface wind and precipitation events. North American coldspells are defined here on time scales of days, since monthly or longer-term temperature means can be mislead-ing and conceal severe, short-lived events [e.g.,Gu et al., 2008]. We find that the large-scale flow patterns typicallyassociated with severe cold spells are likely distinct from climate modes of variability, such as the North AtlanticOscillation (NAO) and the Pacific-North American Pattern (PNA), since they are comparatively rare [Grotjahn et al.,2015]. This does not exclude climate modes from providing favorable conditions for the generation of these pat-terns and the associated extreme events [Loikith and Broccoli, 2014], and we discuss them in this context.
We begin by defining an objective index of cold spells over eastern North America (section 2). An analysis ofthe composite anomalies in various atmospheric variables confirms that our set of cold spells presents a
MESSORI ET AL. COLD SPELLS AND STORMINESS 6620
PUBLICATIONSGeophysical Research Letters
RESEARCH LETTER10.1002/2016GL069392
Key Points:• Cold spells over the eastern USAcorrespond to a very zonal andintense jet
• Cold spells over the eastern USAmatch statistically heightened surfacewind destructiveness andprecipitation over western Europe
• The cold spells are preceded by anegative NAO and followed by apositive PNA
Supporting Information:• Supporting Information S1
Correspondence to:G. Messori,[email protected]
Citation:Messori, G., R. Caballero, and M. Gaetani(2016), On cold spells in North Americaand storminess in western Europe,Geophys. Res. Lett., 43, 6620–6628,doi:10.1002/2016GL069392.
Received 16 DEC 2015Accepted 2 JUN 2016Accepted article online 4 JUN 2016Published online 24 JUN 2016
©2016. American Geophysical Union.All Rights Reserved.
qualitatively homogeneous dynamical evolution, which results in common large-scale flow anomalies overthe Atlantic and associated weather extremes over a large part of western Europe (section 3). This develop-ment is then related to climate modes of variability that have previously been associated with cold spells overNorth America (section 4). Finally, section 5 contextualizes and summarizes our findings.
2. Climatology of North American Cold Spells
We use the European Centre for Medium-RangeWeather Forecasts 20th Century Reanalysis product (ERA-20C) [Poliet al., 2016]. Dailymean fields at 1° horizontal resolution are considered. The analysis spans 111winters (December–February (DJF)), from January 1900 to December 2010. Statistical significance is assessed using both a Monte Carloapproach with 1000 random samples and a sign test showing areas where at least two thirds of the compositedevents agree on the sign of the anomalies. Furthermore, the standard deviations of the composite surface tempera-ture and wind speed anomalies discussed in sections 2–5 are shown in Figure S1 in the supporting information.
Cold spells in North America are defined over a domain in the eastern portion of the continent (30°N–45°N, 100°W–70°W; red box in Figure 1b), selected to resemble domains previously used in the literature [Walsh et al., 2001]. Thesensitivity to the exact choice of domain is discussed in Text S2 in the supporting information. Two-meter airtemperature anomalies are computed as deviations from the daily climatology and are then smoothed with a7day running mean, following Yu et al. [2015a]. The events are ranked based on the area-weighted, domain-averaged anomaly; any dayswithin 3weeks of a colder day are eliminated. So, for example, if the four coldest eventsin our time series were days 10, 71, 60, and 15, only days 10 and 71 would be retained. This separation was selectedbased on the long persistence of the circulation anomalies associatedwith the cold spells (see section 3). The top 60events are then retained for analysis. All lags are relative to the day of peak negative temperature anomalies. Most ofthe analysis presented in sections 3–5 was repeated on the 20 coldest spells identified in the ERA-Interim data [Deeet al., 2011] over the period January 1979 to December 2011, and the main conclusions we draw were found to bequalitatively robust (not shown).
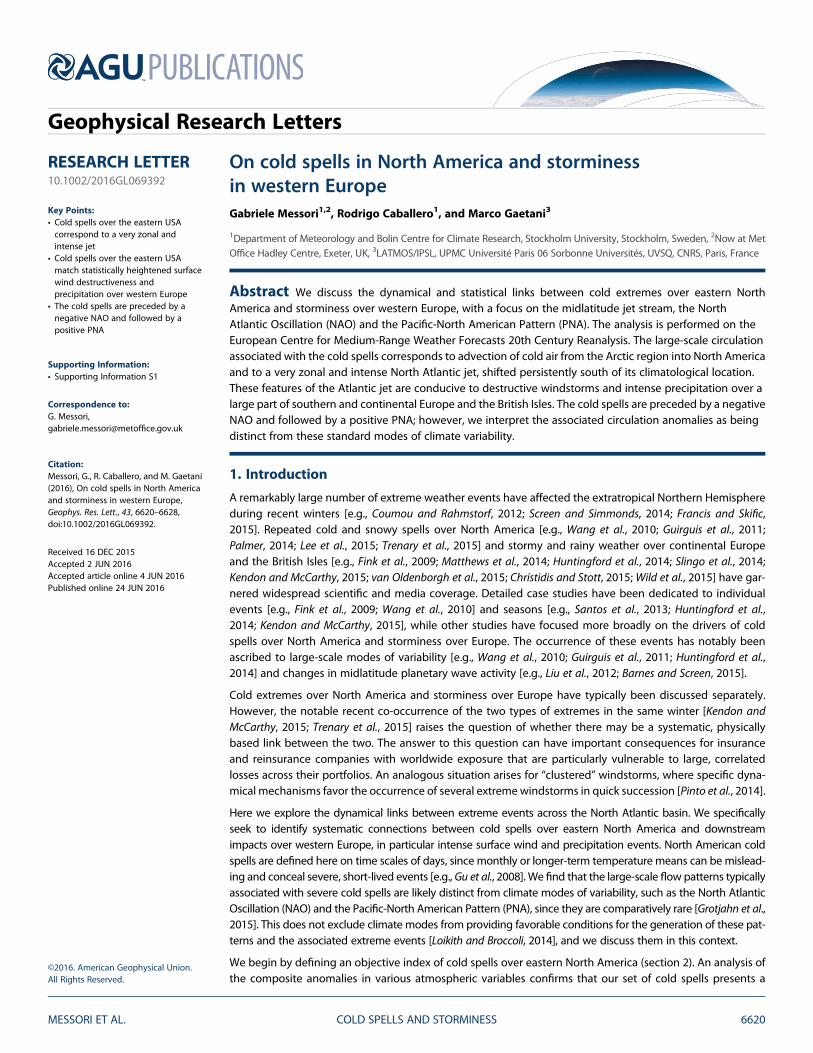
Figures 1a–1c display composite temperature anomalies for the selected cold spells at lags of !5 to +5 days.In agreement with previous analyses, the cold anomalies are first evident over central and eastern Canadaand successively extend to the lower latitudes over several days [e.g., Walsh et al., 2001; Portis et al., 2006].
Figure 1. Surface temperature anomalies (K) during North American cold spells at lags of (a) !5, (b) 0, and (c) +5 days. The 250 hPa wind anomalies (arrows) and250 hPa wind speed anomalies (m s!1, shading) during North American cold spells at lags of (d) !5, (e) 0, and (f) +5 days. The red box in Figure 1b marks thedomain over which the cold spells are selected; the black box in Figure 1e marks the domain over which the PDI and rainfall anomaly are computed. Horizontal waveactivity flux (arrows) and 250 hPa geopotential height anomalies (m, shading) during North American cold spells at lags of (g) !5, (h) 0, and (i) +5 days. The dots inFigure 1h mark the locations used to compute the PNAI. Only anomalies exceeding the 95% confidence level derived from a random Monte Carlo sampling pro-cedure are shown in Figures 1a–1f. All values are displayed in Figures 1g–1i to highlight the wave-like pattern of the geopotential height anomalies. The whitecontours in all panelsmark areas where at least two thirds of the events agree on the sign of the anomalies. The data covers ERA-20C DJFs over the period 1900–2010.
Geophysical Research Letters 10.1002/2016GL069392
MESSORI ET AL. COLD SPELLS AND STORMINESS 6621
At the same time, warm anomalies appear over the Bering Strait region and the Labrador Sea. The full tem-poral evolution of the cold spells is shown in Figure S4. We note that a weak negative temperature anomaly isalready present over central Canada 2weeks before the peak of the cold spell. The area-weighted meantemperature anomaly value over the selection domain at lag 0 is !10.7°C for the coldest spell, !6.1°C forthe warmest cold spell, and !7.7°C for the 60-event average.
3. Dynamical Evolution of North American Cold Spells and Impacts Over Europe
Cold spells in eastern North America are characterized by a circulation anomaly pattern featuring a large-scale,quasi-stationary cyclone over the Great Lakes and a dipole in the Pacific sector with anticyclonic circulationaround the Bering Strait and a cyclone to the south (Figures 1d and 1e and 1g and 1h). All anomalies are com-puted following the same methodology as for 2m temperature (see section 2). As for the temperature anoma-lies, these large-scale features start forming up to 2weeks before the peak of the cold spell, intensify as theevent progresses and then weaken after the peak (Figures 1f and S5). The maximum strength of the 250hPageopotential height anomaly pattern is seen a few days before the peak of the cold spell, with local anomaliesin excess of 180m (Figures 1g–1i). Figures 1g–1i also display thewave activity flux associatedwith these anoma-lies, computed following Takaya and Nakamura [2001]. Its relevance to the evolution of the cold spells is dis-cussed in section 5. The concurrent upper level wind anomalies are consistent with the north-westerlyadvection of cold polar air toward the eastern United States (Figures 1d and 1e), which is a robust characteristicof cold spells in the region [e.g., Konrad and Colucci, 1989; Walsh et al., 2001; Loikith and Broccoli, 2012].
Significant flow anomalies in the days preceding the North American temperature minima are also seen over theAtlantic sector, with a strong anticyclone over Greenland and a cyclonic anomaly further south (Figures 1g–1i).This pattern projects onto the negative phase of the NAO (see section 4) and yields a very southward-displaced,zonally oriented and intense Atlantic jet (Figures 1d–1f). The positive anomalies in the westerly flow extendacross the Atlantic basin into Southwestern Europe. The anomalies in the jet entry region peak around day 0, whilethose over the eastern part of the basin, retain an approximately constant magnitude at positive lags. To providean objective assessment of this behavior we apply the Jet Angle Index (JAI) of Messori and Caballero [2015]
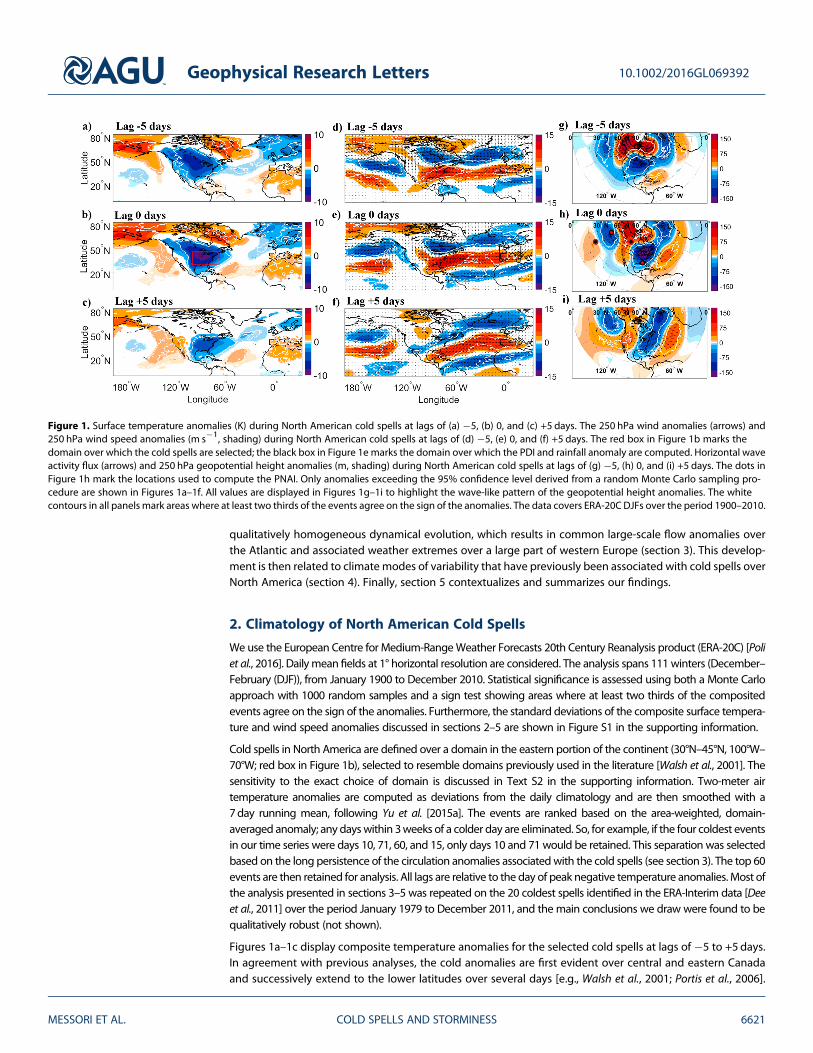
Figure 2. (a) JAI (200–400 hPa, blue) and JLI (200–400 hPa, green). (b) Composite PD values over lags !5 to +5 days, nor-malized to the interval (0, 1). (c) PDI (blue) and rainfall anomaly (green). (d) Mean composite precipitation anomalies(mmd!1) over lags!5 to +5 days; only anomalies exceeding the 95% confidence level derived from a randomMonte Carlosampling procedure are shown. (e) PNAI (blue) and NAOI (green) values at multiple time lags. All values and lags refer to theNorth American cold spells. The continuous horizontal lines in Figures 2a and 2c mark the wintertime average values. Thedashed horizontal lines mark the (a) 5th and (b) 95th percentiles, derived from a randomMonte Carlo sampling procedure.The rainfall anomalies in Figure 2c are area-weighted values cumulated over all gridboxes in the domain, summed over3 day periods and normalized to have a maximum value of +1. The abscissa in Figure 2c indicate the central days of the3 day intervals. The white contours in Figure 2d mark areas where at least two thirds of the events agree on the sign of theanomalies. The data covers the same range as Figure 1.
Geophysical Research Letters 10.1002/2016GL069392
MESSORI ET AL. COLD SPELLS AND STORMINESS 6622
and a Jet Latitude Index (JLI) similarto that first proposed by Woollingset al. [2010a]. The JAI quantifiesthe tilt of the jet, providing abearing relative to due east foreach time step; the JLI quantifiesits meridional location, providinga latitude matching the strongestzonal flow across the basin; fulldetails of both algorithms are pro-vided in Texts S4 and S5. The coldspells are associated with anoma-lously low JLI and JAI values, inboth the days preceding andimmediately following the peaknegative temperature anomalies(Figure 2a and Table 1).
Previous studies have found that anunusually strong jet can act tointensify Atlantic weather systems[Rivière and Joly, 2006; Gómaraet al., 2014a], while the enhancedzonality steers them toward Europe,favoring destructive winds over a
region encompassing France, Germany, and Benelux [Hanley and Caballero, 2012; Messori and Caballero, 2015].A similar pattern, with large anomalies in both the jet’s bearing and intensity, is also associated with surfacewind extremes over the western Mediterranean [Raveh-Rubin and Wernli, 2015]. We quantify surface winddestructiveness by adopting an empirical expression, motivated by considerations of surface powerdissipation [Klawa and Ulbrich, 2003]. The potential destructiveness (PD) at a given grid point for a specifictime-step is defined as
PD ¼ ðv v98 ! 1= Þ3; v > v980; v < v98
(1)
Here v is the peak daily 10m wind speed based on 3-hourly data at the chosen grid point and v98 is the clima-tological 98th percentile of v at the same location. By definition, the wind destructiveness is therefore nonzeroon less than 2days per winter on average. Figure 2b displays the composite PD values associated with the coldspells, summed over lags!5 to +5days and normalized to the interval (0, 1). These lags roughly match the daysover which the jet displays both the strongest intensification and significantly negative JLI and JAI anomalies(Figures 1, 2a, and S5). High PD values can be seen extending across western Europe and the Mediterraneanregion, with scattered areas of destructiveness extending into eastern Europe. To illustrate the temporal evolu-tion of the PD over western Europe and theMediterranean, we define the PD index (PDI) as the cumulative frac-tion of land gridboxes within the domain (35°N–52.5°N, 10°W–15°E; black box in Figure 1e) experiencing anonzero PD over a consecutive 3day period. This is designed to isolate spatially and temporally extensivedestructive events as opposed to intense but isolated occurrences. The domain is chosen based on Figure 2bto encompass the areas displaying large PD values. The climatological PDI wintertime domain-mean value is6.6%. Statistically significant increases in destructiveness rates are found at both positive and negative lags;the peak composite PDI value exceeds 11% (Figure 2c). We note that this value is well in excess of that asso-ciated with the positive NAO (Table 1), which is often linked to enhanced storminess over the Atlantic [e.g.,Gómara et al., 2014b]. The origin of the double peak in the PDI index is discussed in detail in Text S6. Of the60 cold spells analyzed here, 48 display at least one PDI value above the wintertime mean over the lags !5to +5days, exceeding the 5% significance level obtained from random sampling.
Alongwith increased destructiveness, there are also positive precipitation anomalies across a large part of thedomain, albeit with a low sign confidence (Figure 2d). These persist over several days and roughly match the
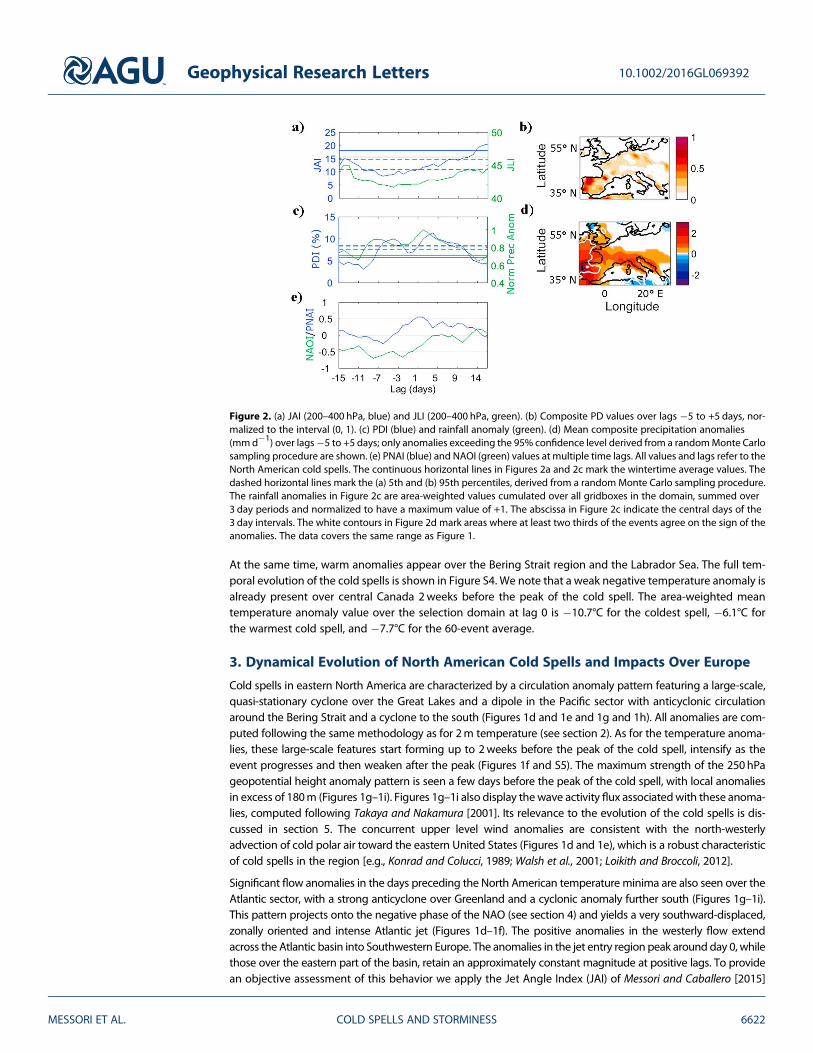
Table 1. Jet Angle and Jet Latitude Values Over the North Atlantic andPotential Destructiveness Values Over Western Europe for the WintertimeClimatology and Different Subsets of Winter Daysa,b
Events Pressure Levels Angle Latitude Peak PDI
(i) Wint. Clim. 700–925 hPa (18.6) (46.7)200–400 hPa (18.0) (46.2)
(ii) Eastern 700–925 hPa 10.8 42.1 11.3%200–400 hPa 8.9 41.6
(iii) NAO+ 700–925 hPa 20.8 49.2 9.5%200–400 hPa 21.8 48.8
(iv) NAO! 700–925 hPa 9.3 41.2 4.7%200–400 hPa 6.0 40.8
(v) PNA+ 700–925 hPa (18.8) 46.4 (5.8%)200–400 hPa (18.2) 45.6
(vi) PNA! 700–925 hPa (18.2) (46.6) (5.6%)200–400 hPa (18.1) (46.2)
aJet Angle Index and Jet Latitude Index values at upper and lower levelsfor (i) the DJF climatology, (ii) eastern cold spells lag !4 days, (iii) positiveand (iv) negative NAO phases (defined as NAOI> 1 and NAOI<!1,respectively), and (v) positive and (vi) negative PNA phases (defined asPNAI> 1 and PNAI<!1, respectively).
bThe last column displays the peak PDI value over lags !5 to +5 daysfrom the reference event. To ensure well-separated events, only caseswhere the NAOI and PNAI exceed the relevant threshold for more than1 day are retained. The reference event is then the peak NAOI or PNAIvalue. The values in brackets are not statistically different from the winter-time climatology at the 95% confidence level.
Geophysical Research Letters 10.1002/2016GL069392
MESSORI ET AL. COLD SPELLS AND STORMINESS 6623
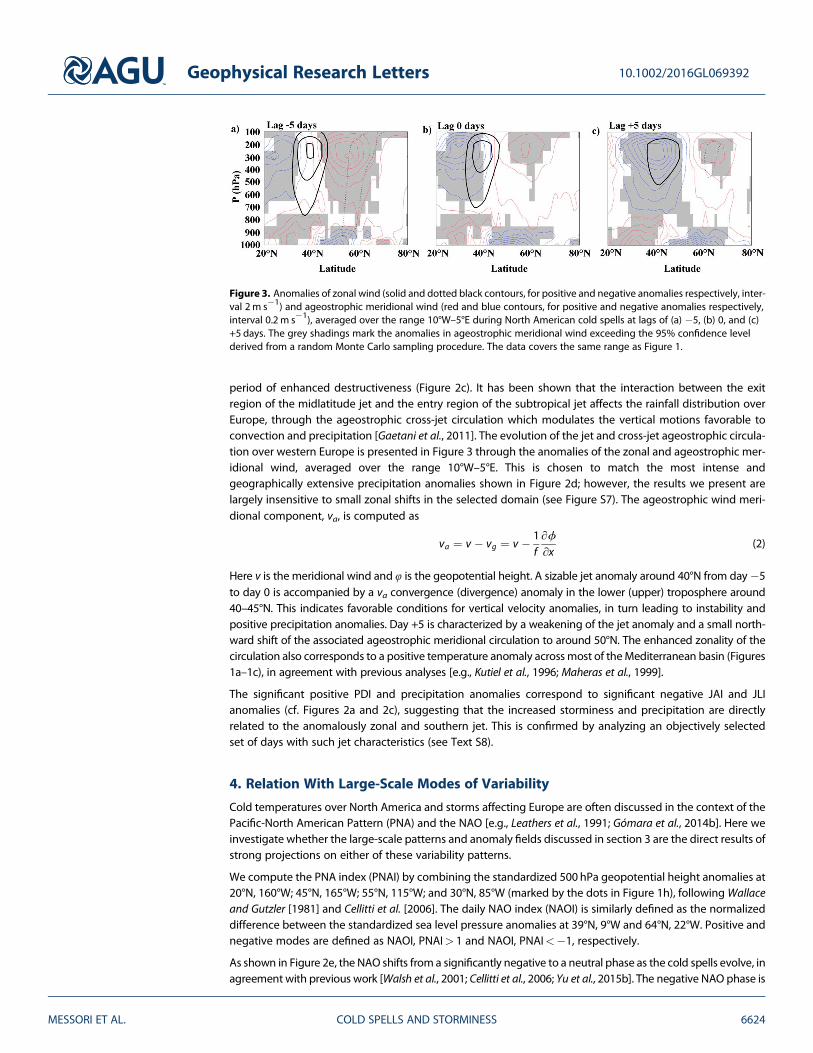
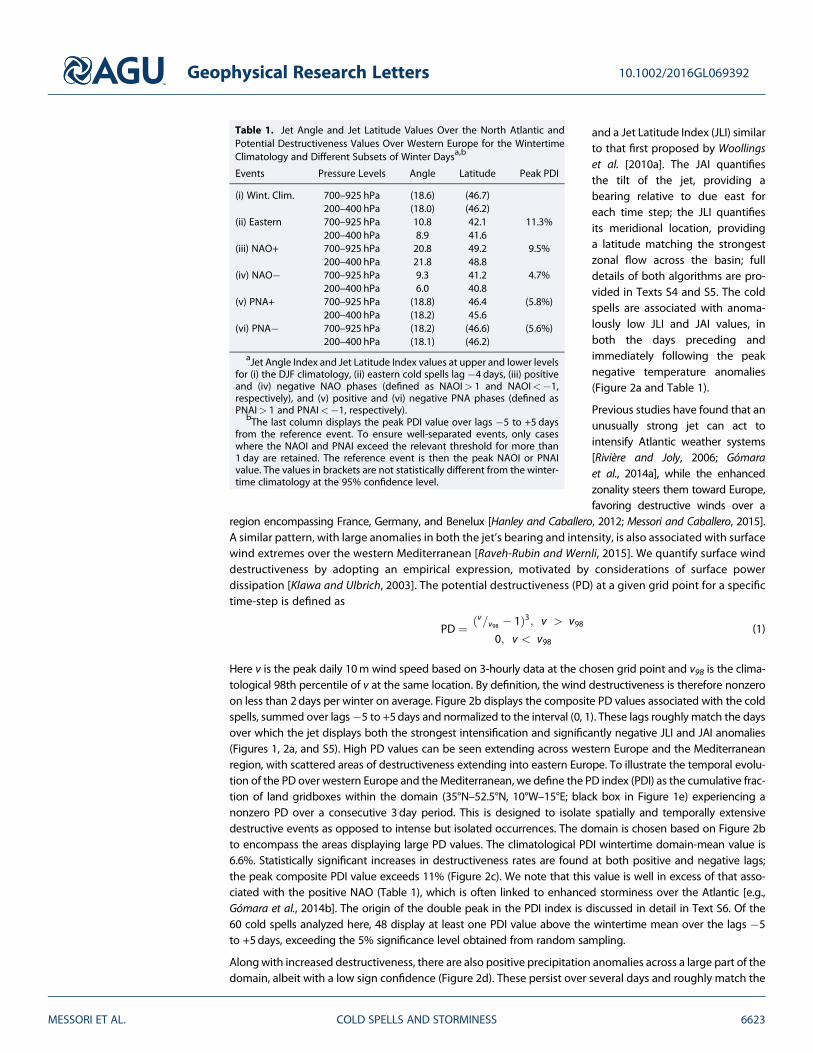
period of enhanced destructiveness (Figure 2c). It has been shown that the interaction between the exitregion of the midlatitude jet and the entry region of the subtropical jet affects the rainfall distribution overEurope, through the ageostrophic cross-jet circulation which modulates the vertical motions favorable toconvection and precipitation [Gaetani et al., 2011]. The evolution of the jet and cross-jet ageostrophic circula-tion over western Europe is presented in Figure 3 through the anomalies of the zonal and ageostrophic mer-idional wind, averaged over the range 10°W–5°E. This is chosen to match the most intense andgeographically extensive precipitation anomalies shown in Figure 2d; however, the results we present arelargely insensitive to small zonal shifts in the selected domain (see Figure S7). The ageostrophic wind meri-dional component, va, is computed as
va ¼ v ! vg ¼ v ! 1f∂ϕ∂x
(2)
Here v is the meridional wind and φ is the geopotential height. A sizable jet anomaly around 40°N from day!5to day 0 is accompanied by a va convergence (divergence) anomaly in the lower (upper) troposphere around40–45°N. This indicates favorable conditions for vertical velocity anomalies, in turn leading to instability andpositive precipitation anomalies. Day +5 is characterized by a weakening of the jet anomaly and a small north-ward shift of the associated ageostrophic meridional circulation to around 50°N. The enhanced zonality of thecirculation also corresponds to a positive temperature anomaly acrossmost of theMediterranean basin (Figures1a–1c), in agreement with previous analyses [e.g., Kutiel et al., 1996; Maheras et al., 1999].
The significant positive PDI and precipitation anomalies correspond to significant negative JAI and JLIanomalies (cf. Figures 2a and 2c), suggesting that the increased storminess and precipitation are directlyrelated to the anomalously zonal and southern jet. This is confirmed by analyzing an objectively selectedset of days with such jet characteristics (see Text S8).
4. Relation With Large-Scale Modes of Variability
Cold temperatures over North America and storms affecting Europe are often discussed in the context of thePacific-North American Pattern (PNA) and the NAO [e.g., Leathers et al., 1991; Gómara et al., 2014b]. Here weinvestigate whether the large-scale patterns and anomaly fields discussed in section 3 are the direct results ofstrong projections on either of these variability patterns.
We compute the PNA index (PNAI) by combining the standardized 500 hPa geopotential height anomalies at20°N, 160°W; 45°N, 165°W; 55°N, 115°W; and 30°N, 85°W (marked by the dots in Figure 1h), followingWallaceand Gutzler [1981] and Cellitti et al. [2006]. The daily NAO index (NAOI) is similarly defined as the normalizeddifference between the standardized sea level pressure anomalies at 39°N, 9°W and 64°N, 22°W. Positive andnegative modes are defined as NAOI, PNAI> 1 and NAOI, PNAI<!1, respectively.
As shown in Figure 2e, the NAO shifts from a significantly negative to a neutral phase as the cold spells evolve, inagreement with previous work [Walsh et al., 2001; Cellitti et al., 2006; Yu et al., 2015b]. The negative NAO phase is
Figure 3. Anomalies of zonal wind (solid and dotted black contours, for positive and negative anomalies respectively, inter-val 2m s!1) and ageostrophic meridional wind (red and blue contours, for positive and negative anomalies respectively,interval 0.2m s!1), averaged over the range 10°W–5°E during North American cold spells at lags of (a) !5, (b) 0, and (c)+5 days. The grey shadings mark the anomalies in ageostrophic meridional wind exceeding the 95% confidence levelderived from a random Monte Carlo sampling procedure. The data covers the same range as Figure 1.
Geophysical Research Letters 10.1002/2016GL069392
MESSORI ET AL. COLD SPELLS AND STORMINESS 6624
typically associatedwith below-average JAI and JLI values (Table 1), and indeed, the lowNAOI values prior to thepeak of the cold spells match the maximum zonalization and southward shift of the jet stream (cf. Figures 2aand 2e). As the NAOI shifts to neutral, the jet returns toward its climatological tilt and meridional location.
The PNAI initially oscillates around near-zero values, increasing to values of around +0.5 as the cold spellsevolve (Figure 2e). At negative lags, the large geopotential height anomalies associated with the cold spellsare misaligned with the PNA’s poles. As the whole pattern shifts eastward, the anomalies are brought in closealignment with the PNA, resulting in a stronger projection (Figures 1g–1i). At larger positive lags the circula-tion over the North American continent shifts to a more zonal configuration, the negative temperatureanomalies weaken, and the PNAI falls again to zero.
5. Discussion and Conclusions
The large-scale circulation associated with cold spells in eastern North America corresponds to advection ofcold air from the Arctic region and to a very zonal and intense North Atlantic jet, shifted south of its climato-logical location. The largest anomalies in the large-scale flow are witnessed in the days around the peak of thecold spells (Figure S5). However, the zonalization of the flow across the North Atlantic is already evident2weeks prior to the peak of the cold spells and lasts uninterrupted for around 3weeks (Figure 2a). This per-sistence is remarkable and is not an artifice of the smoothing applied to the anomalies (see Figure S9); as aterm of comparison, Franzke et al. [2011a] identified three preferred jet regimes using the JLI and found thatthe jet rarely spends more than 2weeks in the southern location.
To test the sensitivity of our results to the choice of domain used to identify the North American cold spells,we repeated the analysis using northward and southward shifted domains (Figures S2 and S3). If the domainused to identify the cold spells is shifted northward, the anomalous circulation discussed in section 3 followsthis shift and is generally weakened; on the other hand, a southward-shifted domain does not correspond toweakened anomalies (Figure S3). This is potentially linked to the influence the choice of domain has on the jetentry location. When the cold air advection associated with the cold spells extends into the subtropical cli-mate zone, it provides a highly baroclinic environment by enhancing the land-sea contrast on the easternseaboard of North America; if this region is shifted North, it is natural to expect that the preference for asouthern, intensified zonal jet and an increased storminess over western Europe will be weakened.Nonetheless, in both cases the southward displacement, zonalization, and intensification of the jet duringthe selected cold spells are conducive to the occurrence of destructive windstorms and intense precipitationover large parts of continental and southern Europe and the British Isles, as discussed in sections 3 and 4.
Based on these considerations, one might expect a bi-directional statistical link between the cold spells andthe windstorms. In section 3 it was shown that by identifying the most severe cold spells over North America,one may recover destructive surface wind episodes over Europe. Similarly, by selecting the most destructivesurface wind episodes over western Europe one indeed recovers below-average temperatures over NorthAmerica (see Text S10). However, there is no one-to-one correspondence between the two sets of events,suggesting that extreme North American cold spells are neither a necessary nor a sufficient condition forthe occurrence of heightened wind destructiveness over Europe. Rather, we interpret them as a statisticallysignificant and physically plausible precursor.
The Atlantic circulation anomalies project onto the negative NAO at negative time lags, and there is a closecorrespondence between the JAI and JLI and the NAOI throughout the evolution of the spells. Indeed,Woollings et al. [2008, 2010a, 2010b] have suggested the existence of a negative NAO regime correspondingto a southern jet location and high-latitude blocking over Greenland; moreover, Hurrell [1995] found anenhanced moisture transport toward continental Europe during negative NAO events, and Trigo et al.[2004] found positive precipitation anomalies over Iberia. However, it would be incorrect to interpret thelarge-scale anomalies described in section 3 as a subset of the conditions associated with the negative phaseof the NAO. Indeed, roughly one quarter of the cold spells displays positive NAOI values at small negativelags. Moreover,Messori and Caballero [2015] have shown that the jet’s tilt exhibits a large variability unrelatedto the NAOI, and negative NAO phases typically correspond to a weaker, less eastward extended jet [cf. Pintoand Raible, 2012], opposite to what is found for the selected cold spells. Finally, negative NAO events consid-ered as a whole correspond to a statistically significant decrease in destructiveness across the analysisdomain (Table 1).
Geophysical Research Letters 10.1002/2016GL069392
MESSORI ET AL. COLD SPELLS AND STORMINESS 6625
The PNA shows a preference for the positive phase during the cold spells, peaking at small positive lags. Thisis consistent with previous work [Cellitti et al., 2006] showing the onset and development of cold air outbreaksover North America to be associated with increasingly positive PNAI values (cf. Figure 2e with Figure 10 inCellitti et al. [2006], noting that their day 0 corresponds to the onset and not the peak of the cold spell).However, the PNA pattern has previously been associated with positive temperature anomalies over westernCanada and USA, as opposed to the continent-wide negative anomalies found here (cf. Figure 1 with Figure 2in Leathers et al. [1991]). In fact, the geopotential anomaly dipole over the North Pacific associated with thecold spells resembles more closely the West Pacific Pattern [Linkin and Nigam, 2008], which has been pre-viously linked with cold temperatures over large portions of North America [e.g., Rogers, 1981; Hsu andWallace, 1985; Linkin and Nigam, 2008; Lee et al., 2015]. Moreover, neither phase of the PNA has any significantimpact on wind destructiveness over Europe (Table 1). Additional modes of climate variability, such asEl-Niño/Southern Oscillation, have been associated with both below-average temperatures over the easternUnited States [e.g., Ropelewski and Halpert, 1986] and increased storminess over Europe [e.g., Fraedrich andMüller, 1992] and may provide scope for future investigations.
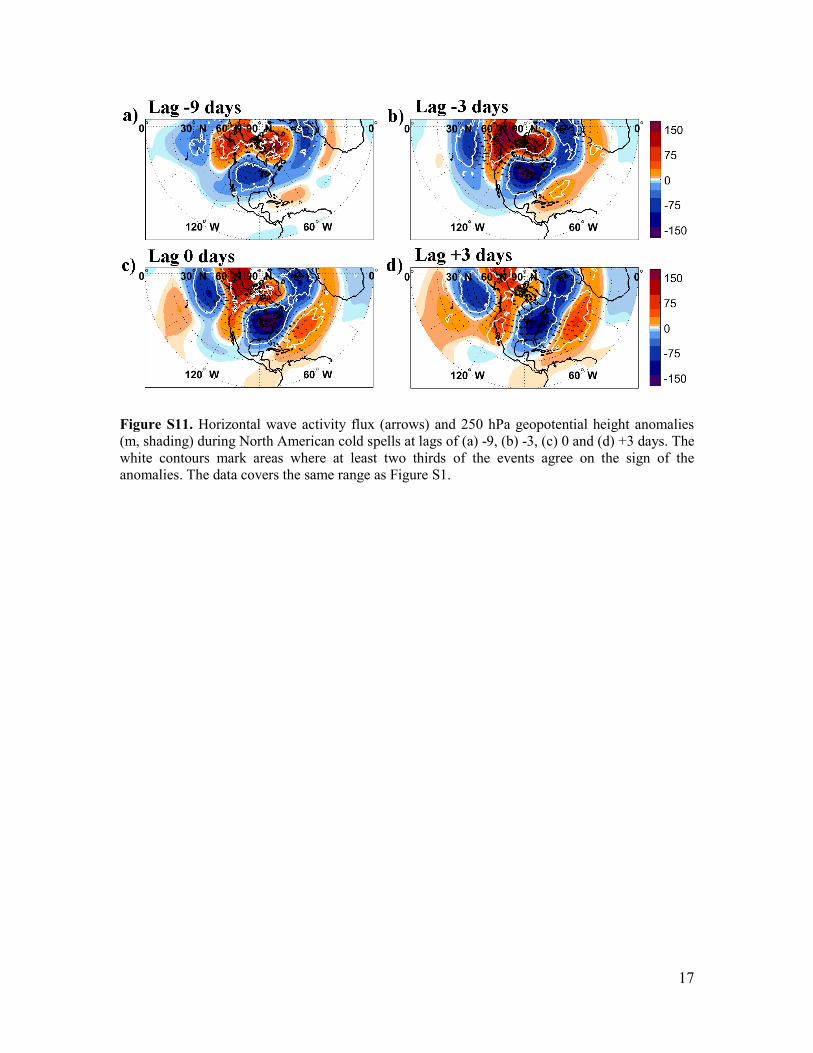
As others before us [e.g., Loikith and Broccoli, 2014; Grotjahn et al., 2015], we therefore interpret the circulationanomalies associated with extreme North American cold spells as being distinct from these canonical modes ofclimate variability. The wave activity flux displayed in Figures 1g–1i and S11 indeed suggests that the drivers ofthe anomalous cold spell circulation might be different from those associated with the climate modes. Duringthe days prior to the North American temperature minima (Figures 1g and S11a and S11b), a wave train can beseen emanating from the subtropical central Pacific, arching over North America and turning north towardGreenland, tying together the Pacific, North American, and Atlantic circulation anomalies discussed earlier intoa single hemispheric pattern [Drouard et al., 2015]. At around lag 0, however, as the cyclonic anomaly over east-ern North America reaches its maximum amplitude, the wave activity flux emanating from it turns south andenters the western subtropical Atlantic, generating an anticyclonic anomaly there and leading to the change-over from negative to neutral NAO conditions (Figure 1h). These results point to a possible major role forhemispheric-scale teleconnections in coordinating extreme events across North America and Europe, whichprovides a promising avenue for future work on prediction and prevention of climate-related impacts.
ReferencesBarnes, E. A., and J. A. Screen (2015), The impact of Arctic warming on the midlatitude jet-stream: Can it? Has it? Will it?WIREs Clim. Change, 6,
277–286.Cellitti, M. P., J. E. Walsh, R. M. Rauber, and D. H. Portis (2006), Extreme cold air outbreaks over the United States, the polar vortex, and the
large-scale circulation, J. Geophys. Res., 111, D02114, doi:10.1029/2005JD006273.Christidis, N., and P. A. Stott (2015), Extreme rainfall in the United Kingdom during winter 2013/2014: The role of atmospheric circulation and
climate change [in “Explaining Extremes of 2014 from a Climate Perspective”], Bull. Am. Meteorol. Soc., 96(12).Coumou, D., and S. Rahmstorf (2012), A decade of weather extremes, Nat. Clim. Change, 2, 491–496.Dee, D. P., et al. (2011), The ERA-Interim reanalysis: Configuration and performance of the data assimilation system, Q. J. R. Meteorol. Soc.,
137(656), 553–597.Drouard, M., G. Rivière, and P. Arbogast (2015), The link between the North Pacific climate variability and the North Atlantic Oscillation via
downstream propagation of synoptic waves, J. Clim., 28, 3957–3976.Fink, A. H., T. Brücher, V. Ermert, A. Krüger, and J. G. Pinto (2009), The European storm Kyrill in January 2007: Synoptic evolution, meteorological
impacts and some considerations with respect to climate change, Nat. Hazards Earth Syst. Sci., 9, 405–423, doi:10.5194/nhess-9-405-2009.Fraedrich, K., and K. Müller (1992), Climate anomalies in Europe associated with ENSO extremes, Int. J. Climatol., 12(1), 25–31.Francis, J., and N. Skific (2015), Evidence linking rapid Arctic warming to mid-latitude weather patterns, Phil. Trans. R. Soc. A, 373, 20140170,
doi:10.1098/rsta.2014.0170.Franzke, C., T. Woollings, and O. Martius (2011a), Persistent circulation regimes and preferred regime transitions in the North Atlantic,
J. Atmos. Sci., 68(12), 2809–2825.Gaetani, M., M. Baldi, G. A. Dalu, and G. Maracchi (2011), Jetstream and rainfall distribution in the Mediterranean region, Nat. Hazards Earth
Syst. Sci., 11, 2469–2481, doi:10.5194/nhess-11-2469-2011.Gómara, I., J. G. Pinto, T. Woollings, G. Masato, P. Zurita-Gotor, and B. Rodríguez-Fonseca (2014a), Rossby wave-breaking analysis of explosive
cyclones in the Euro-Atlantic sector, Q. J. R. Meteorol. Soc., 140(680), 738–753.Gómara, I., B. Rodríguez-Fonseca, P. Zurita-Gotor, and J. G. Pinto (2014b), On the relation between explosive cyclones affecting Europe and
the North Atlantic Oscillation, Geophys. Res. Lett., 41, 2182–2190, doi:10.1002/2014GL059647.Grotjahn, R., et al. (2015), North American extreme temperature events and related large scale meteorological patterns: A review of statistical
methods, dynamics, modeling, and trends, Clim. Dyn., 1–34.Gu, L., P. Hanson, W. Post, D. Kaiser, B. Yang, R. Nemani, S. Pallardy, and T. Meyers (2008), The 2007 eastern US spring freezes: Increased cold
damage in a warming world?, BioScience, 58, 253–262.Guirguis, K., A. Gershunov, R. Schwartz, and S. Bennett (2011), Recent warm and cold daily winter temperature extremes in the Northern
Hemisphere, Geophys. Res. Lett., 38 L17701, doi:10.1029/2011GL048762.Hanley, J., and R. Caballero (2012), The role of large-scale atmospheric flow and Rossby wave breaking in the evolution of extreme wind-
storms over Europe, Geophys. Res. Lett., 39, L21708, doi:10.1029/2012GL053408.
Geophysical Research Letters 10.1002/2016GL069392
MESSORI ET AL. COLD SPELLS AND STORMINESS 6626
AcknowledgmentsERA-Interim reanalysis data are freelyavailable from the ECMWF at http://apps.ecmwf.int/datasets/. G. Messorihas been funded by the SwedishVetenskapsrådet, as part of the MILEXproject. We are grateful to T.J. Woollingsand B.J. Hoskins for their helpful dis-cussions. We also thank the two anon-ymous reviewers whose commentshave helped to strengthen ourconclusions.
Hsu, H.-H., and J. M. Wallace (1985), Vertical structure of wintertime teleconnection patterns, J. Atmos. Sci., 42, 1693–1710.Huntingford, C., T. Marsh, A. A. Scaife, E. J. Kendon, J. Hannaford, A. L. Kay, and M. R. Allen (2014), Potential influences on the United
Kingdom’s floods of winter 2013/2014, Nat. Clim. Change, 4(9), 769–777.Hurrell, J. W. (1995), Decadal trends in the North Atlantic Oscillation: Regional temperatures and precipitation, Science, 269(5224),
676–679.Kendon, M., and M. McCarthy (2015), The UK’s wet and stormy winter of 2013/2014, Weather, 70(2), 40–47.Klawa, M., and U. Ulbrich (2003), A model for the estimation of storm losses and the identification of severe winter storms in Germany, Nat.
Hazards Earth Syst. Sci., 3, 725–732.Konrad, C. E., II, and S. J. Colucci (1989), An examination of extreme cold air outbreaks over Eastern North America, Mon. Weather Rev., 117,
2687–2700, doi:10.1175/1520-0493(1989)117<2687:AEOECA>2.0.CO;2.Kutiel, H., P. Maheras, and S. Guika (1996), Circulation and extreme rainfall conditions in the eastern Mediterranean during the last century,
Int. J. Climatol., 16, 73–92.Leathers, D. J., B. Yarnal, and M. A. Palecki (1991), The Pacific/North American teleconnection pattern and United States climate. Part I:
Regional temperature and precipitation associations, J. Clim., 4(5), 517–528.Lee, M. Y., C. C. Hong, and H. H. Hsu (2015), Compounding effects of warm sea surface temperature and reduced sea ice on the extreme
circulation over the extratropical North Pacific and North America during the 2013–2014 boreal winter, Geophys. Res. Lett., 42, 1612–1618,doi:10.1002/2014GL062956.
Linkin, M. E., and S. Nigam (2008), The North Pacific Oscillation-West Pacific Teleconnection Pattern: Mature-phase structure and winterimpacts, J. Clim., 21, 1979–1997, doi:10.1175/2007JCLI2048.1.
Liu, J., J. Curry, and H. Wang (2012), Impact of declining Arctic sea ice on winter snowfall, Proc. Natl. Acad. Sci. U.S.A., 109(11), 4074–4079,doi:10.1073/pnas.1114910109.
Loikith, P. C., and A. J. Broccoli (2012), Characteristics of observed atmospheric circulation patterns associated with temperature extremesover North America, J. Clim., 25(20), 7266–7281.
Loikith, P. C., and A. J. Broccoli (2014), The influence of recurrent modes of climate variability on the occurrence of winter and summerextreme temperatures over North America, J. Clim., 27(4), 1600–1618.
Maheras, P., E. Xoplaki, T. Davies, J. Martin-Vide, M. Bariendos, and M. J. Alcoforado (1999), Warm and cold monthly anomalies across theMediterranean basin and their relationship with circulation; 1860–1990, Int. J. Climatol., 19(15), 1697–1715.
Matthews, T., C. Murphy, R. L. Wilby, and S. Harrigan (2014), Stormiest winter on record for Ireland and UK, Nat. Clim. Change, 4(9),738–740.
Messori, G., and R. Caballero (2015), On double Rossby wave breaking in the North Atlantic, J. Geophys. Res. Atmos., 120, 11,129–11,150,doi:10.1002/2015JD023854.
Palmer, T. (2014), Record-breaking winters and global climate change, Science, 344(6186), 803–804.Pinto, J. G., and C. C. Raible (2012), Past and recent changes in the North Atlantic oscillation, Wiley Interdiscip. Rev. Clim. Change, 3(1), 79–90.Pinto, J. G., I. Gómara, G. Masato, H. F. Dacre, T. Woollings, and R. Caballero (2014), Large-scale dynamics associated with clustering of
extratropical cyclones affecting western Europe, J. Geophys. Res. Atmos., 119, 13,704–13,719, doi:10.1002/2014JD022305.Poli, P., et al. (2016), ERA-20C: An atmospheric reanalysis of the 20th century, J. Clim., doi:10.1175/JCLI-D-15-0556.1.Portis, D. H., M. P. Cellitti, W. L. Chapman, and J. E. Walsh (2006), Low-frequency variability and evolution of North American cold air out-
breaks, Mon. Weather Rev., 134(2), 579–597.Raveh-Rubin, S., and H. Wernli (2015), Large-scale wind and precipitation extremes in the Mediterranean: A climatological analysis for 1979–
2012, Q. J. R. Meteorol. Soc., 141, 2404–2417, doi:10.1002/qj.2531.Rivière, G., and A. Joly (2006), Role of the low-frequency deformation field on the explosive growth of extratropical cyclones at the jet exit.
Part II: Baroclinic critical region, J. Atmos. Sci., 63, 1982–1995.Rogers, J. C. (1981), The North Pacific Oscillation, J. Climatol., 1, 39–57.Ropelewski, C. F., and M. S. Halpert (1986), North American precipitation and temperature patterns associated with the El Niño/Southern
Oscillation (ENSO), Mon. Weather Rev., 114(12), 2352–2362.Santos, J. A., T. Woollings, and J. G. Pinto (2013), Are the winters 2010 and 2012 archetypes exhibiting extreme opposite behavior of the
North Atlantic jet stream?, Mon. Weather Rev., 141, 3626–3640.Screen, J. A., and I. Simmonds (2014), Amplifiedmid-latitude planetary waves favour particular regional weather extremes, Nat. Clim. Change,
doi:10.1038/nclimate2271.Slingo, J., et al. (2014), The recent storms and floods in the UK. Met Office, Exeter, U. K. [Available at http://www.metoffice.gov.uk/media/pdf/
1/2/Recent_Storms_Briefing_Final_SLR_20140211.pdf.]Takaya, K., and H. Nakamura (2001), A formulation of a phase-independent wave-activity flux for stationary and migratory quasigeostrophic
eddies on a zonally varying basic flow, J. Atmos. Sci., 58(6), 608–627.Trenary, L., T. DelSole, M. K. Tippett, and B. Dotty (2015), Was the cold eastern US winter of 2014 due tro Increased Variability?, [in “Explaining
Extremes of 2014 from a Climate Perspective”], Bull. Am. Meteorol. Soc., 96(12).Trigo, R. M., D. Pozo-Vázquez, T. J. Osborn, Y. Castro-Díez, S. Gámiz-Fortis, and M. J. Esteban-Parra (2004), North Atlantic oscillation influence
on precipitation, river flow and water resources in the Iberian Peninsula, Int. J. Climatol., 24, 925–944, doi:10.1002/joc.1048.van Oldenborgh, G. J., D. B. Stephenson, A. Sterl, R. Vautard, P. Yiou, S. S. Drijfhout, H. van Storch, and H. van den Dool (2015), Drivers of the
2013/2014 winter floods in the UK, Nat. Clim. Change, 5(6), 490–491.Wallace, J. M., and D. S. Gutzler (1981), Teleconnections in the geopotential height field during the Northern Hemisphere winter, Mon.
Weather Rev., 109, 784–812.Walsh, J. E., A. S. Phillips, D. H. Portis, and W. L. Chapman (2001), Extreme cold outbreaks in the United States and Europe, 1948–1999, J. Clim.,
14(12), 2642–2658.Wang, C., H. Liu, and S. K. Lee (2010), The record-breaking cold temperatures during the winter of 2009/2010 in the Northern Hemisphere,
Atmos. Sci. Lett., 11(3), 161–168.Wild, S., D. J. Befort, and G. C. Leckebush (2015), Was the extreme storm season in winter 2013/2014 over the North Atlantic and the United
Kingdom triggered by changes in the west Pacific warm pool?, [in “Explaining Extremes of 2014 from a Climate Perspective”], Bull. Am.Meteorol. Soc., 96(12).
Woollings, T. J., B. J. Hoskins, M. Blackburn, and P. Berrisford (2008), A new Rossby wave-breaking interpretation of the North AtlanticOscillation, J. Atmos. Sci., 65, 609–626.
Woollings, T. J., A. Hannachi, B. J. Hoskins, and A. Turner (2010b), A regime view of the North Atlantic Oscillation and its response toanthropogenic forcing, J. Clim., 23, 1291–1307.
Geophysical Research Letters 10.1002/2016GL069392
MESSORI ET AL. COLD SPELLS AND STORMINESS 6627
Woollings, T., A. Hannachi, and B. J. Hoskins (2010a), Variability of the North Atlantic eddy-driven jet stream, Q. J. R. Meteorol. Soc., 136,856–868, doi:10.1002/qj.625.
Yu, Y., M. Cai, R. Ren, and H. M. van den Dool (2015a), Relationship between warm air mass transport into the upper polar atmosphere andcold air outbreaks in winter, J. Atmos. Sci., 72(1), 349–368.
Yu, Y., R. Ren, and M. Cai (2015b), Comparison of the mass circulation and AO indices as indicators of cold air outbreaks in northern winter,Geophys. Res. Lett., 42, 2442–2448, doi:10.1002/2015GL063676.
Geophysical Research Letters 10.1002/2016GL069392
MESSORI ET AL. COLD SPELLS AND STORMINESS 6628
1
Geophysical Research Letters
Supporting Information for
On cold spells in North America and storminess in western Europe Gabriele Messori1,2*, Rodrigo Caballero1 and Marco Gaetani3
1Department of Meteorology and Bolin Centre for Climate Research, Stockholm University,
Stockholm, Sweden
2Now at Met Office Hadley Centre, Exeter, United Kingdom
3LATMOS/IPSL, UPMC Université Paris 06 Sorbonne Universités, UVSQ, CNRS, Paris, France
*Correspondence to: G. Messori, [email protected]
Contents of this file Texts S1 to S10 Figures S1 to S11
Introduction The present Supporting Information includes a description of the standard deviation of the surface temperature and upper-level wind anomaly composites (Text S1; Fig. S1); sensitivity tests for the selection domain of the cold spells (Text S2; Figs. S2 and S3) and descriptions of the temporal evolution of the cold spells (Text S3; Figs. S4 and S5); the Jet Angle Index (Text S4; Fig. S6) and the Jet Latitude Index (Text S5). We further present a brief discussion of the temporal evolution of the PDI index discussed in Section 3 of the main paper (Text S6); sensitivity tests for the averaging domain of the ageostrophic circulation discussed in Section 3 of the main paper (Text S7; Fig. S7); brief discussions of the PDI and precipitation anomalies associated with anomalously southern and zonal jet states (Text S8; Fig. S8); the impact of smoothing on the persistence of the jet stream anomalies (Text S9; Fig. S9) and the bi-directional link between cold spells and surface wind destructiveness (Text S10; Fig. S10). Finally, we display the temporal evolution of the geopotential height anomalies and horizontal wave activity flux associated with the cold spells (Fig. S11).
Text S1 Fig. S1 displays the standard deviations of both the temperature (Figs. S1a-S1c) and the wind speed (Figs. S1d-S1f) anomaly composites. The temperature plots display large standard deviations in the regions where the anomalies fail the sign test (cf. Figs. 1a-1c), while the standard deviation is lower at the core of the cold spell region, where all events display strong
2
negative anomalies. The wind speed anomalies display a larger variability, which again peaks in regions where the sign test fails (cf. Figs. 1d-1f). In regions where the large majority of the events agree on the sign of the anomaly, the large variability points to a small number of events which greatly exceed the composite values, and which might justify case studies in a future analysis.
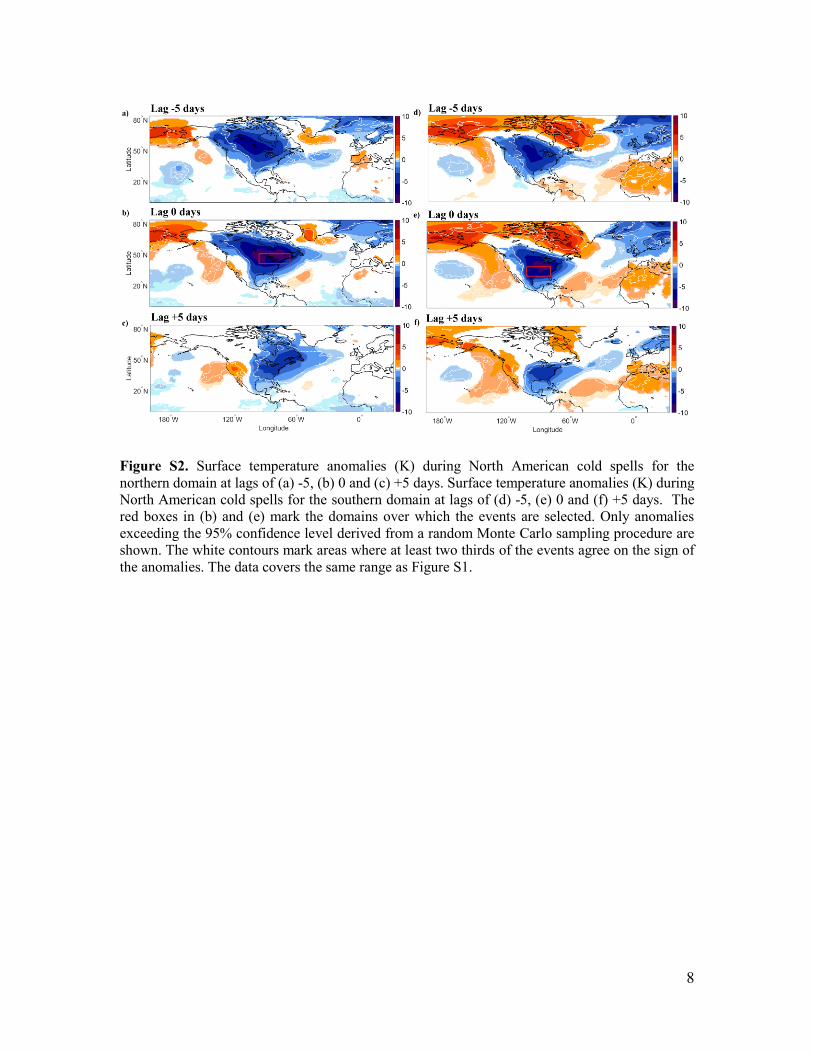
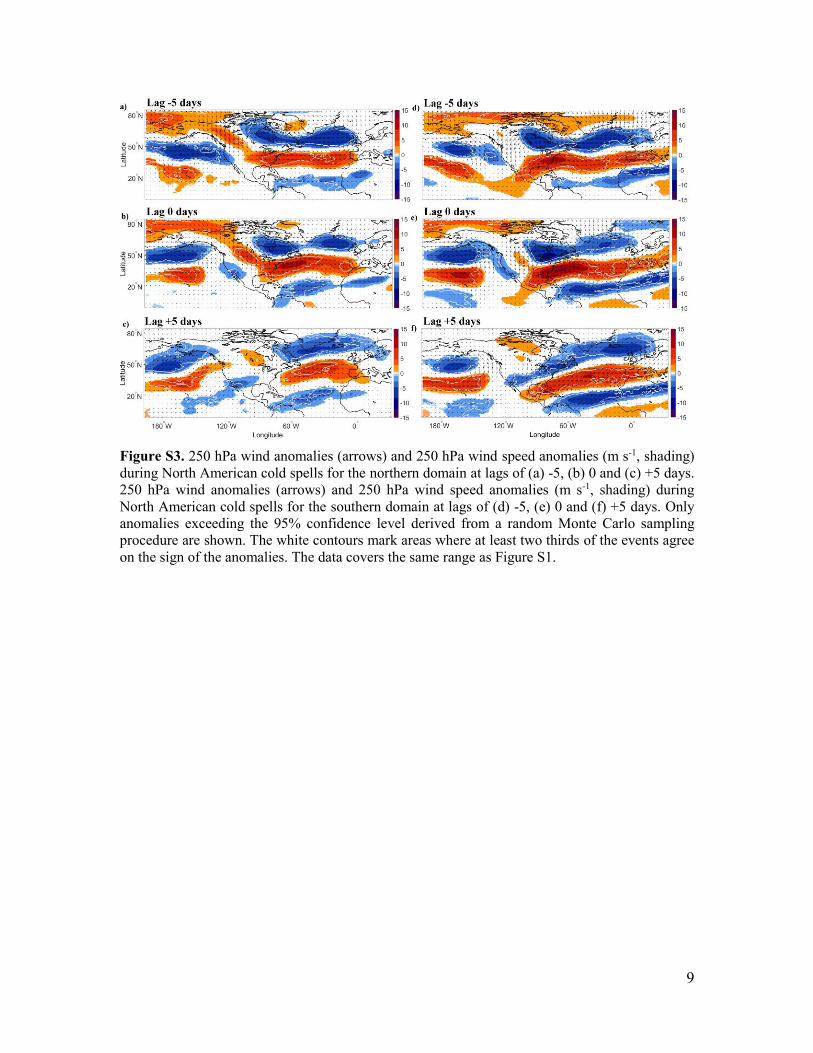
Text S2 To verify the sensitivity of our results to the selection domain for the cold spells, we have repeated the analysis on two additional domains, one shifted northward and extended to the East (40°N- 50°N, 65°W-95°W, hereafter referred to as Northern Domain, or ND) and one shifted southward (30°N-40° N, 80°W-100°W, hereafter referred to as Southern Domain, or SD). The 60 coldest spells for both domains were identified: 43 of the SD events and 15 of the ND events match the cold spells discussed in the main paper. Two cold spells are said to match if their area-weighted temperature anomalies peak within two days of one another. Fig. S2 displays the temperature anomalies associated with the two sensitivity domains (Figs. S2a-S2c ND, Figs. S2d-S2f SD) at lags of -5, 0 and +5 days. As suggested by the large overlap in the selected events, the magnitude and pattern of the SD anomalies match very closely Figs. 1a-1c in the main paper, both within North America and beyond. The ND anomalies show a large shift in the core of the cold spell, which now lies over central Canada at lag 0, but nonetheless have a strong resemblance to Fig. 1b, both in the positive anomalies over Alaska and the Eastern Pacific and the cold anomalies over Scandinavia and the Nordic Seas. Other regional anomalies, such as the warming over the Mediterranean, are almost entirely absent. Additionally, noticeable differences emerge in the persistence and geographical extent of many features. Fig. S3 displays the wind and wind speed anomalies associated with the two sensitivity domains (Figs. S3a-S3c ND, Figs. S3d-S3f SD) at lags of -5, 0 and +5 days. All three domains display similar large scale flow anomalies over the North Atlantic, with a band of intensified westerly flow extending from North America into North Africa and Western Europe (cf. Figs. 1d-1f). However, while the SD anomalies are comparable in magnitude to (and locally exceed) those shown in Figs. 1d-1f, the ND anomalies are weaker and shifted to the North. We hypothesize that this is linked to the northward shift of the anomalous cyclonic circulation associated with the inflow of cold air from the high latitudes. As the gyre moves northwards, it is reasonable to expect that its effectiveness in enhancing the land-sea thermal contrast and in generating a highly baroclinic environment in the jet entry region lessens. The link we highlight in this study between the cold spells over North America and a zonalised, intensified circulation across the North Atlantic therefore appears to get progressively stronger as the cold air advection extends further South.
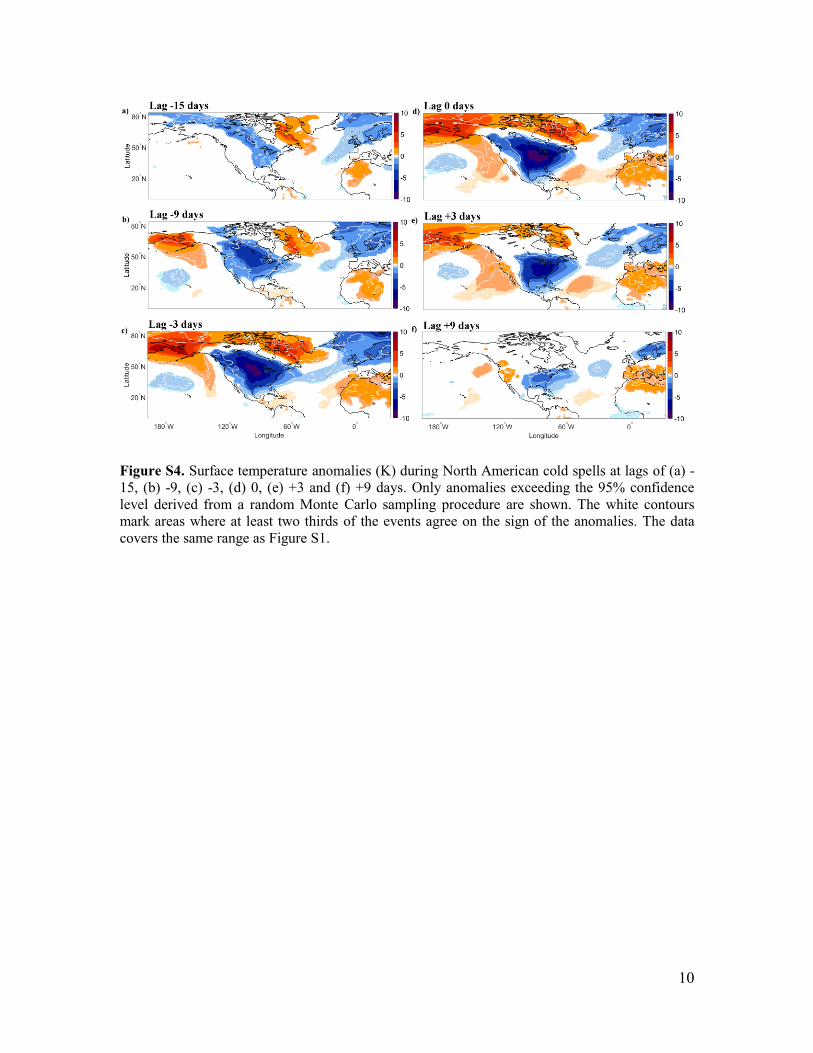
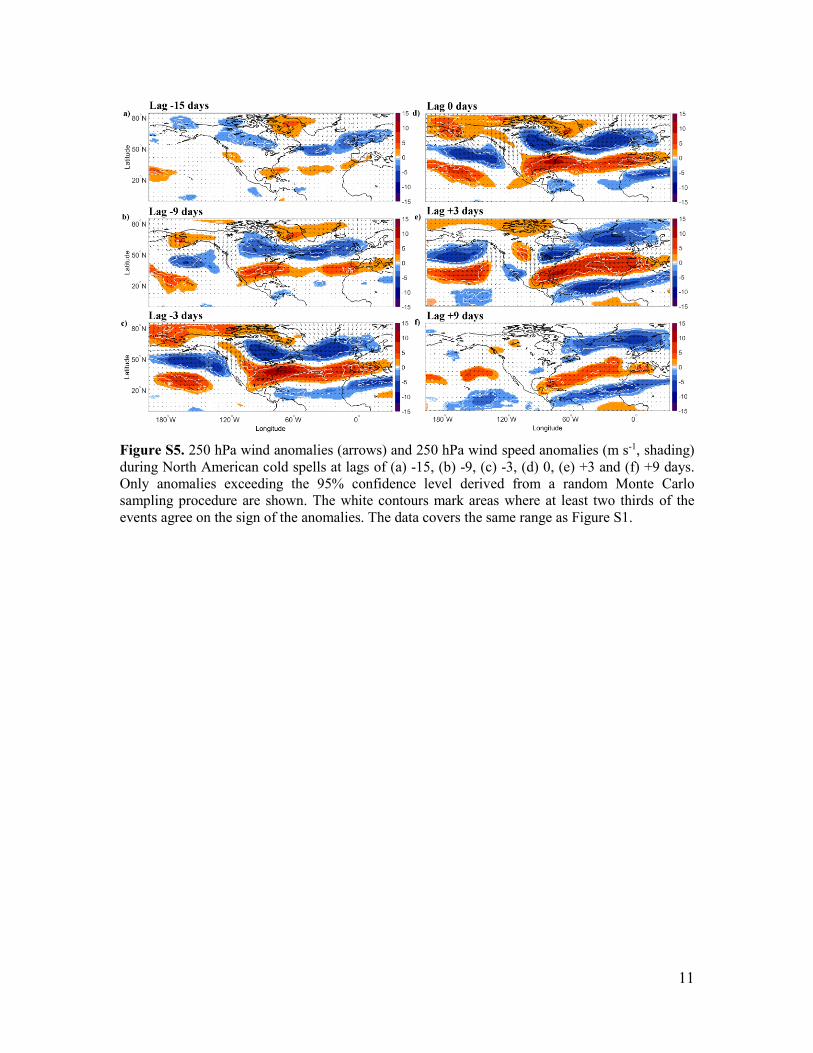
Text S3 The cold spells are preceded by a region of anomalously low temperatures over central and eastern Canada, already evident 15 days before the minimum temperature is attained (Fig. S4a). The low temperatures gradually intensify and extend across the continent, affecting almost the entire contiguous United States and Canada by day -9 (Fig. S4b). At the same time, persistent positive anomalies are found over Alaska/Eastern Russia and Greenland. The positive anomaly dipole dispels quickly after the peak of the cold spell, while negative temperature anomalies persist over the eastern seaboard up to 9 days after the peak (Fig. S4f). A strong persistence is also seen in the associated large-scale circulation anomalies. An intensified zonal jet across the Atlantic basin is already evident at lag -9 days (Fig. S5b). The intensification of the zonal flow peaks between lags -3 to +3 days (Figs. S5c-S5e), after which a more tilted jet configuration starts to return (cf. Fig. 2a).
3
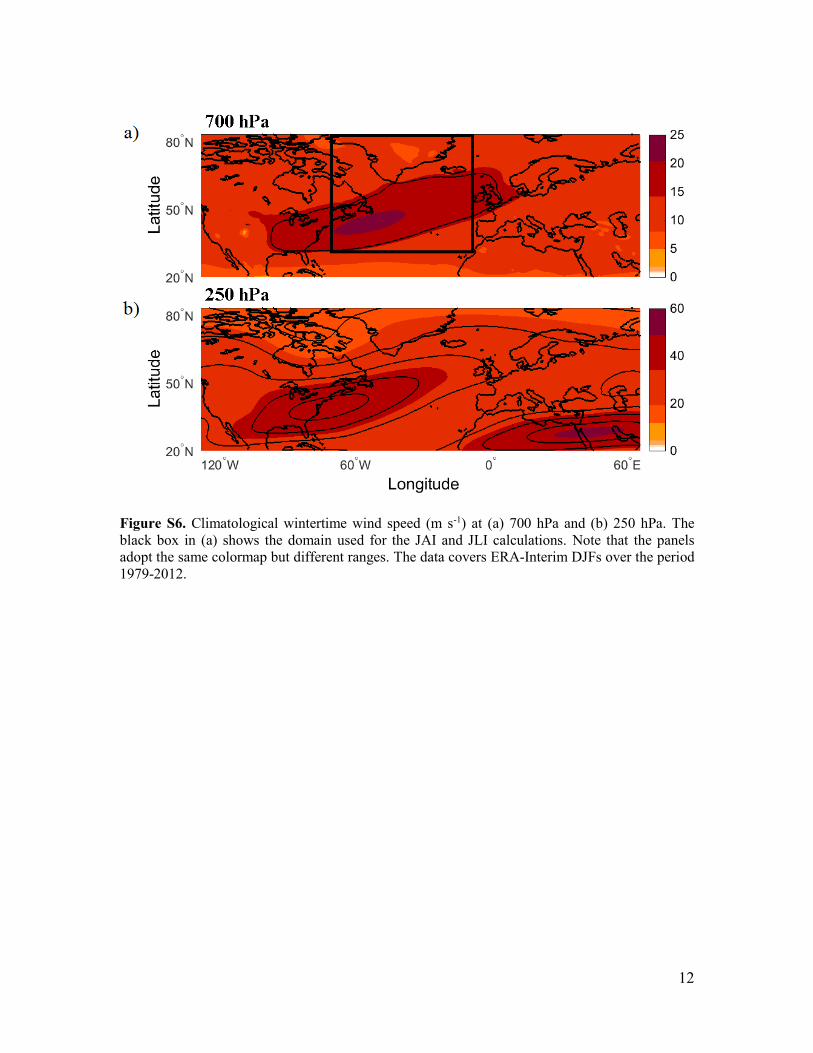
Text S4 The Jet Angle Index (JAI), first presented in Messori and Caballero [2015], is computed as the best fit rhumb line following wind speed maxima across the North Atlantic basin. Many of the steps are based on the methodology developed by Woollings et al. [2010a] to compute the jet’s latitude and the location of low-level jet events. First, an 11-day running mean filter is applied to the zonal and meridional components of wind speed. These are then averaged over 700-925 hPa or 200-400 hPa. Since, especially at low levels, the presence of orography leads to considerable noise, we follow Woollings et al. [2010a] in applying a land mask. A domain spanning 70°W-10°W and 30°N-80°N is considered. Such a reduced longitudinal extent is chosen because the index is very sensitive to the choice of eastern and western boundaries, due to the land mask. Indeed, if the domain is extended too far East, the masking implies that only winds in the Nordic Seas will be retained. This, in turn, will artificially increase the JAI values. A similar problem occurs if the domain is extended too far West and a large portion of the North American landmass is included. The meridional extent of the domain is chosen to include only the latitudes at which there is a strong westerly flow, excluding both tropical easterly flows and subtropical jet events. The climatological winds at both lower and upper levels are shown in Figs. S6a and S6b, respectively. The chosen domain (marked by the black box in Fig. S6a) encompasses the core of both the upper and lower-level jets. Only time steps with at least half of the meridians having a location with zonal wind above 8 ms−1 are considered, and maxima in wind speed along each meridian are identified. The choice of the 8 ms−1 threshold again follows Woollings et al. [2010]. If a given meridian has a secondary local wind maximum, such maximum is within 4 ms−1 of the primary one and is well-separated (more than 5° latitude apart), then the meridian is ignored. This is designed to exclude split jet events. The index is robust with respect to reasonable variations in these parameters. Finally, a best-fit rhumb line is computed. In order to prevent outliers from affecting the result, a bisquare weighting function is applied in the fitting algorithm. Rhumb lines form a constant angle with all the meridians they cross, meaning that a single bearing is obtained for the jet at each timestep. The complementary angle to the bearing of the rhumb line is the JAI.
Text S5 The Jet Latitude Index (JLI) provides the latitudinal location of the strongest zonally averaged jet. For consistency, the domain is the same as that utilized for the JAI calculation (70°W-10° W, 30°N-80°N). First, the zonal wind speed is averaged over the 700-925 hPa or 200-400 hPa pressure range, and a land mask is applied. Next, a zonal average is performed, and is filtered with an 11-day running mean filter. The jet’s latitude is defined as the latitude of maximum zonally-averaged zonal wind speed. A test of the sensitivity of a very similar JLI index to the chosen domain boundaries, and a comparison with the results obtained by Woollings et al. [2010a] using ERA-40 data, can be found in the Supporting Information for Messori and Caballero [2015].
Text S6 The PDI shown in Fig. 3c displays two significant peaks, one at day -4 and one at day +4. This double peak originates from the fact that individual cold spells tend to display a PDI peaking either before or after the peak of the cold spell. Indeed, the 60 events can be split according to whether they display the largest PDI at small negative lags (day -7 to day -3), small positive lags (day +3 to day +7) or around day 0 (day -2 to day +2). This results in 25, 20 and 15 events respectively. The mean PDI will obviously depend not only on the number of events but also on
4
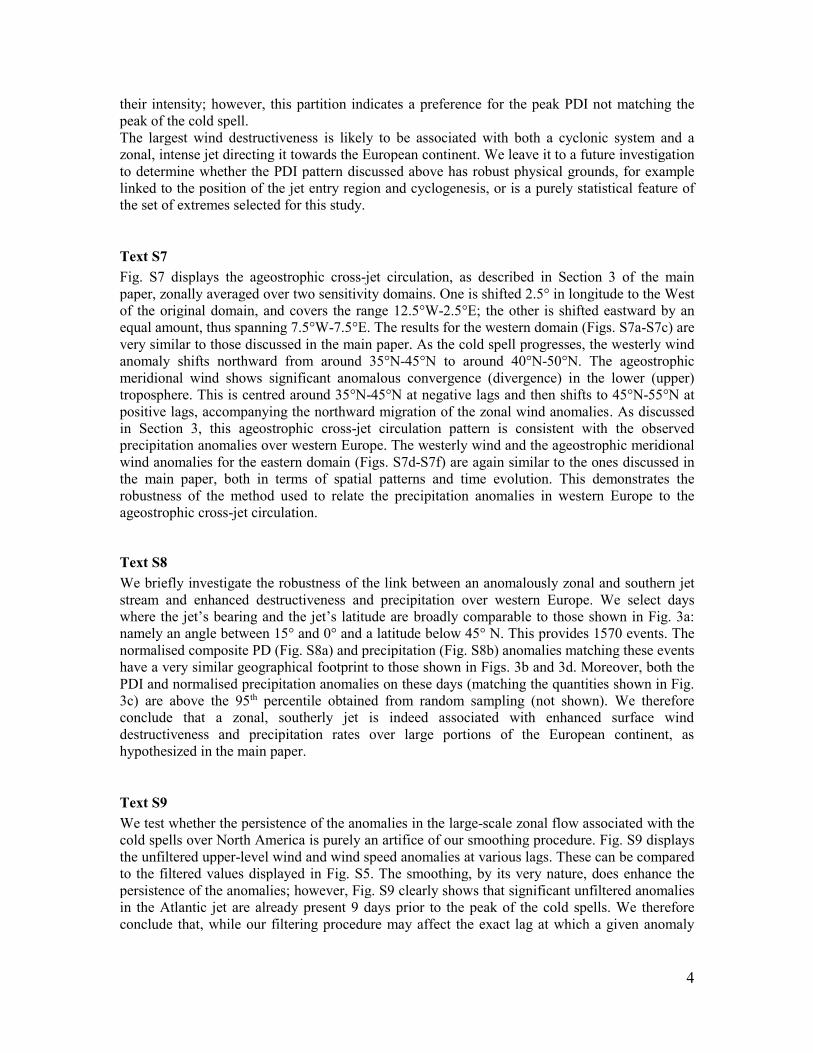
their intensity; however, this partition indicates a preference for the peak PDI not matching the peak of the cold spell. The largest wind destructiveness is likely to be associated with both a cyclonic system and a zonal, intense jet directing it towards the European continent. We leave it to a future investigation to determine whether the PDI pattern discussed above has robust physical grounds, for example linked to the position of the jet entry region and cyclogenesis, or is a purely statistical feature of the set of extremes selected for this study.
Text S7 Fig. S7 displays the ageostrophic cross-jet circulation, as described in Section 3 of the main paper, zonally averaged over two sensitivity domains. One is shifted 2.5° in longitude to the West of the original domain, and covers the range 12.5°W-2.5°E; the other is shifted eastward by an equal amount, thus spanning 7.5°W-7.5°E. The results for the western domain (Figs. S7a-S7c) are very similar to those discussed in the main paper. As the cold spell progresses, the westerly wind anomaly shifts northward from around 35°N-45°N to around 40°N-50°N. The ageostrophic meridional wind shows significant anomalous convergence (divergence) in the lower (upper) troposphere. This is centred around 35°N-45°N at negative lags and then shifts to 45°N-55°N at positive lags, accompanying the northward migration of the zonal wind anomalies. As discussed in Section 3, this ageostrophic cross-jet circulation pattern is consistent with the observed precipitation anomalies over western Europe. The westerly wind and the ageostrophic meridional wind anomalies for the eastern domain (Figs. S7d-S7f) are again similar to the ones discussed in the main paper, both in terms of spatial patterns and time evolution. This demonstrates the robustness of the method used to relate the precipitation anomalies in western Europe to the ageostrophic cross-jet circulation.
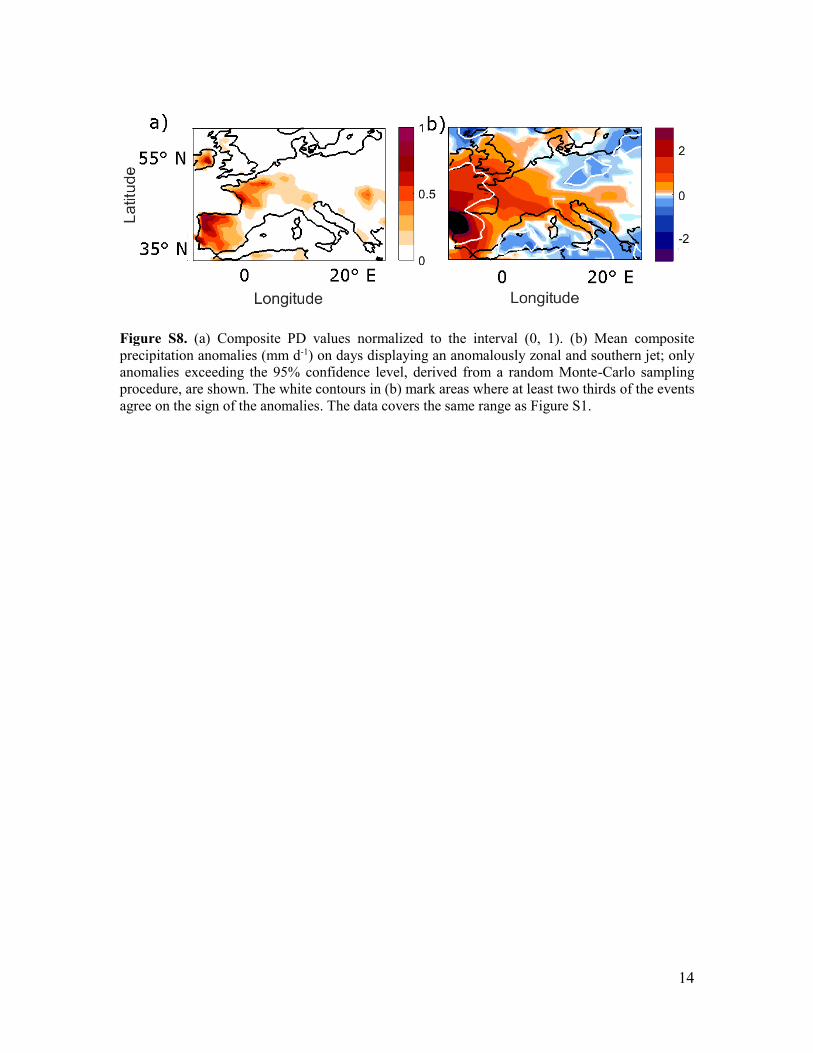
Text S8 We briefly investigate the robustness of the link between an anomalously zonal and southern jet stream and enhanced destructiveness and precipitation over western Europe. We select days where the jet’s bearing and the jet’s latitude are broadly comparable to those shown in Fig. 3a: namely an angle between 15° and 0° and a latitude below 45° N. This provides 1570 events. The normalised composite PD (Fig. S8a) and precipitation (Fig. S8b) anomalies matching these events have a very similar geographical footprint to those shown in Figs. 3b and 3d. Moreover, both the PDI and normalised precipitation anomalies on these days (matching the quantities shown in Fig. 3c) are above the 95th percentile obtained from random sampling (not shown). We therefore conclude that a zonal, southerly jet is indeed associated with enhanced surface wind destructiveness and precipitation rates over large portions of the European continent, as hypothesized in the main paper.
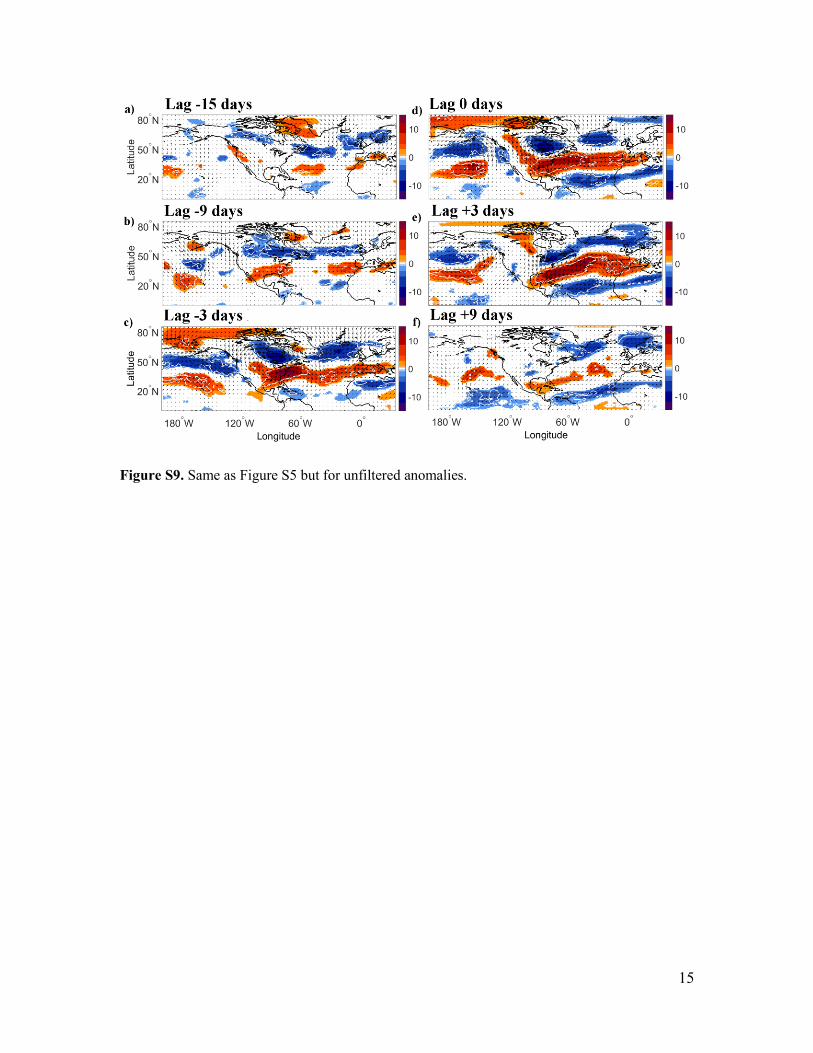
Text S9 We test whether the persistence of the anomalies in the large-scale zonal flow associated with the cold spells over North America is purely an artifice of our smoothing procedure. Fig. S9 displays the unfiltered upper-level wind and wind speed anomalies at various lags. These can be compared to the filtered values displayed in Fig. S5. The smoothing, by its very nature, does enhance the persistence of the anomalies; however, Fig. S9 clearly shows that significant unfiltered anomalies in the Atlantic jet are already present 9 days prior to the peak of the cold spells. We therefore conclude that, while our filtering procedure may affect the exact lag at which a given anomaly
5
emerges, the cold spells are indeed associated with remarkably persistent anomalies in the large-scale zonal flow.
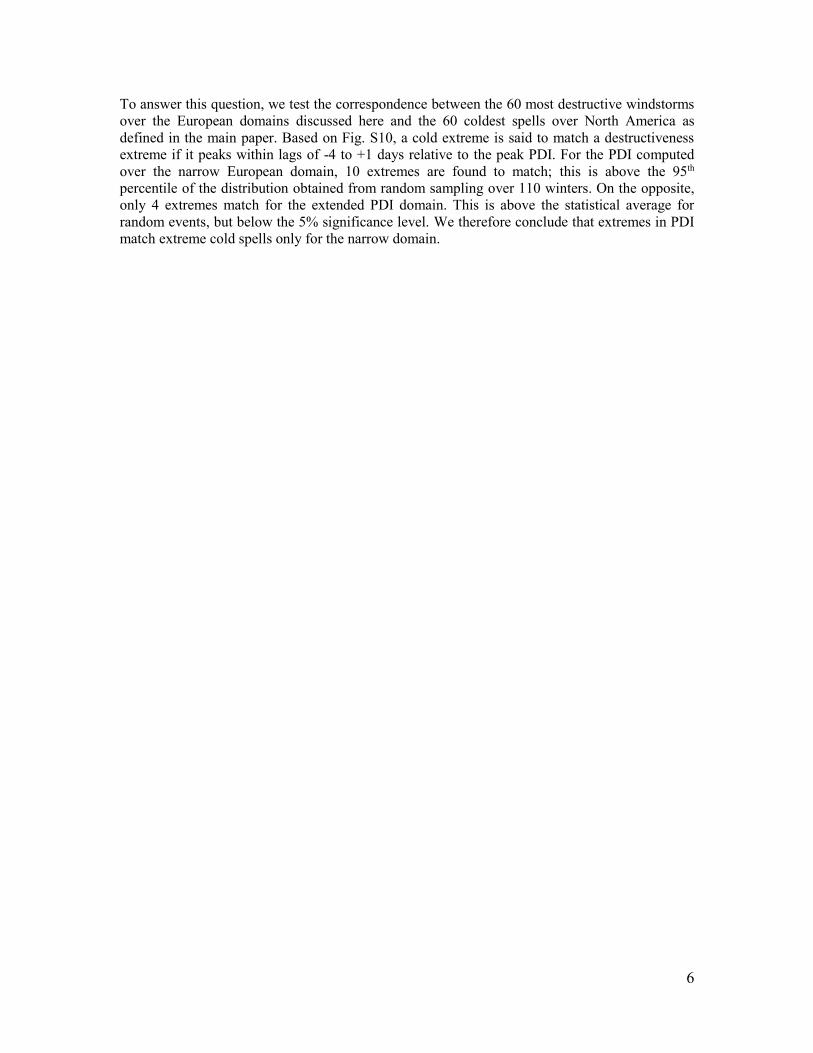
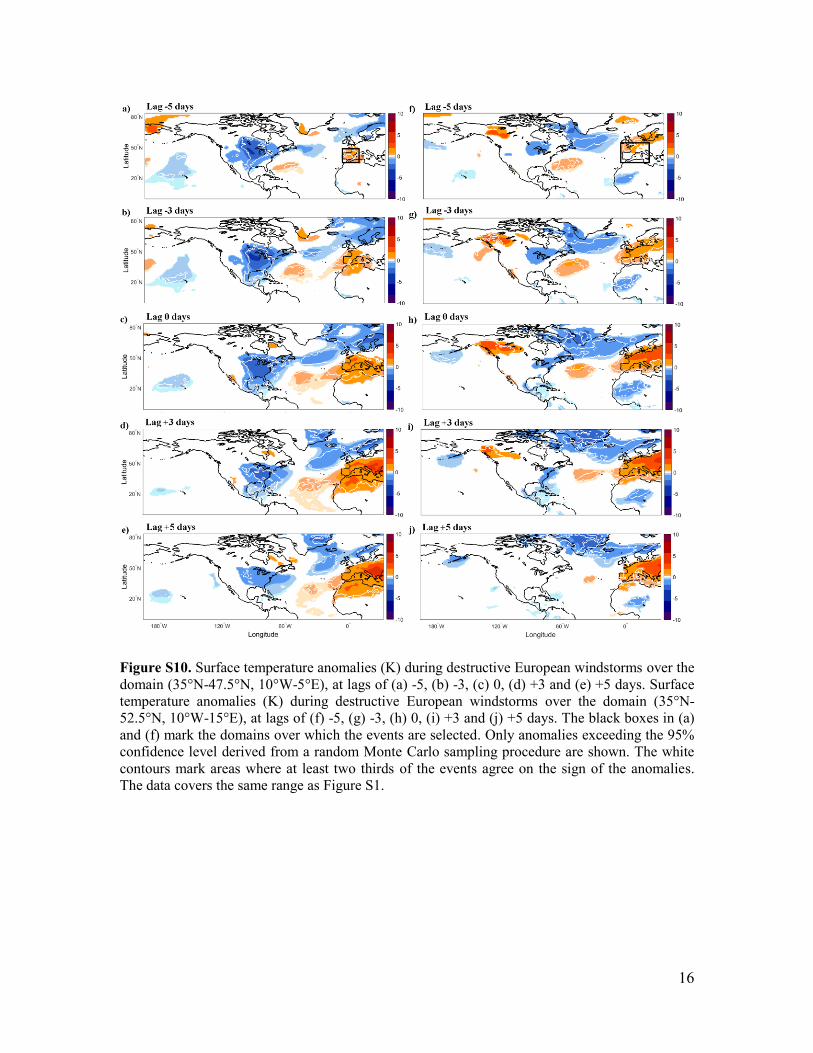
Text S10 In the main paper we show that, by selecting events based on the largest negative temperature anomalies over eastern North America, it is possible to recover episodes of destructive surface winds over western Europe. Here we analyse the inverse link: we select the most destructive windstorms over western Europe (based on PDI values) and verify whether they match below average temperatures over North America. For consistency, a minimum 21 day separation between destructive events is enforced, as was the case for the selection of the cold spells. Based on Fig. 3b, we define two domains on which to base our selection: a broad domain matching that used in the main paper, namely (35°N–52.5°N, 10°W–15°E) and a narrower domain, including only the regions with the highest PD values, namely Iberia and part of France (35°N–47.5°N, 10°W–5°E). If the relationship between cold spells and destructiveness were perfectly symmetric, based on Fig. 3b one would expect destructive events in the smaller domain to match stronger negative temperature anomalies than destructive events in the larger domain. Figs. S10a-S10e shows the composite temperature anomalies at various lags relative to the peak PDI values for the narrow domain. We note that the lags shouldn’t be compared like-for-like with the other figures, since the peak of the cold spells might not match the peak PDI values, as shown in Fig. 3c. At lag -5 days (Fig. S10a), the salient features seen in Fig. 1 are already evident: a cold anomaly over North America, a warm Mediterranean and a cold Northern Europe. As time progresses, the cold anomaly over North America intensifies and shifts towards the eastern seaboard (Figs. 10b and 10c). Finally, it starts weakening, persisting the longest in the south-eastern portion of the continent, much like what seen in Fig. S4. Naturally, there are some differences between the two patterns – most notably in the location of the warm anomalies and in the intensity of the cold spells over North America – but the similarities are certainly striking. Figs. S10f-S10j show the composite temperature anomalies at various lags relative to the peak PDI values for the wide domain. As hypothesised, the temperature anomalies over North America are generally weaker than those seen for the narrow PDI domain. A weak cold anomaly starts forming over central Canada around lag -5 days (Fig. 10f). As time progresses, the anomaly shifts eastwards, but remains limited in both geographical extent and magnitude. By lag +5 days (Fig. 10j) there are no significant temperature anomalies over the North American continent. We therefore conclude that extreme wind destructiveness in the narrow domain is systematically associated with below average temperatures over a large swathe of North America, while a significant fraction of the destructive events affecting the northern and eastern portions of the wider domain – namely the regions not included in the narrow domain – are not. The latter inference does not imply that the link between extreme cold spells and enhanced destructiveness over the wider domain lacks a physical basis; rather, it indicates that there may be a range of other large-scale patterns associated with extreme destructive events over the region. A separate, but closely related, question concerns how extreme the co-occurring events are. In the main paper we show the existence of a link between extreme cold spells over North America and enhanced wind destructiveness over Europe. Here we have briefly highlighted a similar link between extreme destructiveness episodes over Europe and below average temperatures over North America. However, this bi-directionality does not imply that the extremes in one quantity will match the extremes in the other. For example, the extreme cold spells might be associated with heightened wind destructiveness but might, a priori, be completely unrelated to the most extreme destructiveness episodes. Indeed, the very nature of extremes implies that they are often associated with different drivers from statistically above-average but still relatively commonplace events.
6
To answer this question, we test the correspondence between the 60 most destructive windstorms over the European domains discussed here and the 60 coldest spells over North America as defined in the main paper. Based on Fig. S10, a cold extreme is said to match a destructiveness extreme if it peaks within lags of -4 to +1 days relative to the peak PDI. For the PDI computed over the narrow European domain, 10 extremes are found to match; this is above the 95th percentile of the distribution obtained from random sampling over 110 winters. On the opposite, only 4 extremes match for the extended PDI domain. This is above the statistical average for random events, but below the 5% significance level. We therefore conclude that extremes in PDI match extreme cold spells only for the narrow domain.
7
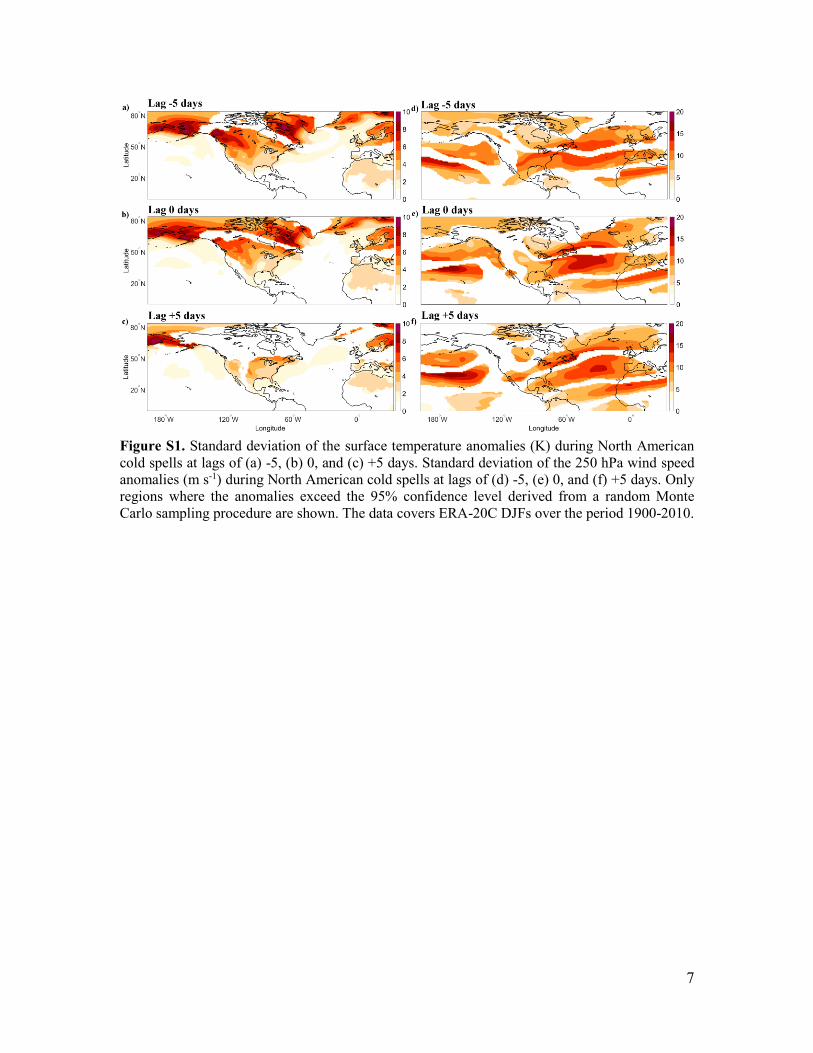
Figure S1. Standard deviation of the surface temperature anomalies (K) during North American cold spells at lags of (a) -5, (b) 0, and (c) +5 days. Standard deviation of the 250 hPa wind speed anomalies (m s-1) during North American cold spells at lags of (d) -5, (e) 0, and (f) +5 days. Only regions where the anomalies exceed the 95% confidence level derived from a random Monte Carlo sampling procedure are shown. The data covers ERA-20C DJFs over the period 1900-2010.
8
Figure S2. Surface temperature anomalies (K) during North American cold spells for the northern domain at lags of (a) -5, (b) 0 and (c) +5 days. Surface temperature anomalies (K) during North American cold spells for the southern domain at lags of (d) -5, (e) 0 and (f) +5 days. The red boxes in (b) and (e) mark the domains over which the events are selected. Only anomalies exceeding the 95% confidence level derived from a random Monte Carlo sampling procedure are shown. The white contours mark areas where at least two thirds of the events agree on the sign of the anomalies. The data covers the same range as Figure S1.
9
Figure S3. 250 hPa wind anomalies (arrows) and 250 hPa wind speed anomalies (m s-1, shading) during North American cold spells for the northern domain at lags of (a) -5, (b) 0 and (c) +5 days. 250 hPa wind anomalies (arrows) and 250 hPa wind speed anomalies (m s-1, shading) during North American cold spells for the southern domain at lags of (d) -5, (e) 0 and (f) +5 days. Only anomalies exceeding the 95% confidence level derived from a random Monte Carlo sampling procedure are shown. The white contours mark areas where at least two thirds of the events agree on the sign of the anomalies. The data covers the same range as Figure S1.
10
Figure S4. Surface temperature anomalies (K) during North American cold spells at lags of (a) -15, (b) -9, (c) -3, (d) 0, (e) +3 and (f) +9 days. Only anomalies exceeding the 95% confidence level derived from a random Monte Carlo sampling procedure are shown. The white contours mark areas where at least two thirds of the events agree on the sign of the anomalies. The data covers the same range as Figure S1.
11
Figure S5. 250 hPa wind anomalies (arrows) and 250 hPa wind speed anomalies (m s-1, shading) during North American cold spells at lags of (a) -15, (b) -9, (c) -3, (d) 0, (e) +3 and (f) +9 days. Only anomalies exceeding the 95% confidence level derived from a random Monte Carlo sampling procedure are shown. The white contours mark areas where at least two thirds of the events agree on the sign of the anomalies. The data covers the same range as Figure S1.
12
Figure S6. Climatological wintertime wind speed (m s-1) at (a) 700 hPa and (b) 250 hPa. The black box in (a) shows the domain used for the JAI and JLI calculations. Note that the panels adopt the same colormap but different ranges. The data covers ERA-Interim DJFs over the period 1979-2012.
13
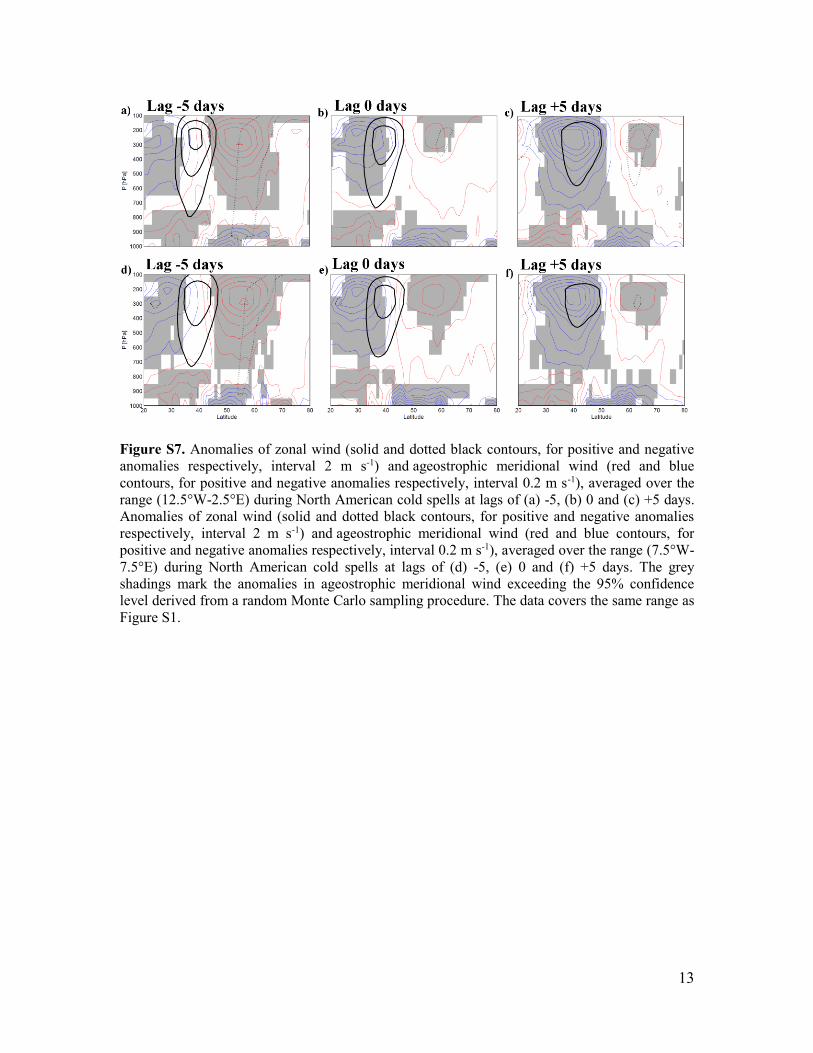
Figure S7. Anomalies of zonal wind (solid and dotted black contours, for positive and negative anomalies respectively, interval 2 m s-1) and ageostrophic meridional wind (red and blue contours, for positive and negative anomalies respectively, interval 0.2 m s-1), averaged over the range (12.5°W-2.5°E) during North American cold spells at lags of (a) -5, (b) 0 and (c) +5 days. Anomalies of zonal wind (solid and dotted black contours, for positive and negative anomalies respectively, interval 2 m s-1) and ageostrophic meridional wind (red and blue contours, for positive and negative anomalies respectively, interval 0.2 m s-1), averaged over the range (7.5°W-7.5°E) during North American cold spells at lags of (d) -5, (e) 0 and (f) +5 days. The grey shadings mark the anomalies in ageostrophic meridional wind exceeding the 95% confidence level derived from a random Monte Carlo sampling procedure. The data covers the same range as Figure S1.
14
Figure S8. (a) Composite PD values normalized to the interval (0, 1). (b) Mean composite precipitation anomalies (mm d-1) on days displaying an anomalously zonal and southern jet; only anomalies exceeding the 95% confidence level, derived from a random Monte-Carlo sampling procedure, are shown. The white contours in (b) mark areas where at least two thirds of the events agree on the sign of the anomalies. The data covers the same range as Figure S1.
15
Figure S9. Same as Figure S5 but for unfiltered anomalies.
16
Figure S10. Surface temperature anomalies (K) during destructive European windstorms over the domain (35°N-47.5°N, 10°W-5°E), at lags of (a) -5, (b) -3, (c) 0, (d) +3 and (e) +5 days. Surface temperature anomalies (K) during destructive European windstorms over the domain (35°N-52.5°N, 10°W-15°E), at lags of (f) -5, (g) -3, (h) 0, (i) +3 and (j) +5 days. The black boxes in (a) and (f) mark the domains over which the events are selected. Only anomalies exceeding the 95% confidence level derived from a random Monte Carlo sampling procedure are shown. The white contours mark areas where at least two thirds of the events agree on the sign of the anomalies. The data covers the same range as Figure S1.
17
Figure S11. Horizontal wave activity flux (arrows) and 250 hPa geopotential height anomalies (m, shading) during North American cold spells at lags of (a) -9, (b) -3, (c) 0 and (d) +3 days. The white contours mark areas where at least two thirds of the events agree on the sign of the anomalies. The data covers the same range as Figure S1.