Embed Size (px)
Citation preview
On complexity and variability of individuals’discretionary activities
Dimas B. E. Dharmowijoyo1 • Yusak O. Susilo2 •
Anders Karlstrom2
Published online: 30 August 2016� The Author(s) 2016. This article is published with open access at Springerlink.com
Abstract Using a hierarchical structured equation model and a multi-dimensional 3-week
household time-use and activity diary conducted in Bandung Metropolitan Area, Indonesia,
this study investigated the interaction among individuals’ non-instrumental variables, time
space (such as their day-to-day time duration of activity participation, socio-demographics
and built environment), and health factors on individuals’ day-to-day discretionary
activities. The results show that individuals’ subjective characteristics and day-to-day
time–space components significantly influence decision making processes to participate in
certain activities, particularly grocery shopping. Integration between subjective factors and
day-to-day time duration of activity participation also reveals how an individual cate-
gorises a particular behaviour as routine, planned or impulsive. For example, grocery
shopping is a planned behaviour with real consequences (e.g. starving). Appearing as a
strong commitment and intention enables individuals to allocate time to engage in this
activity. Thus, given the individual’s time–space constraints, there may be a regular trade-
off between frequency and duration. On the other hand, out-of-home social-recreational
activity is a less urgent/impulsive activity and depends far more on an individual’s day-to-
day time–space constraints than his/her subjective characteristics. If the situation on the
given day is not feasible for him/her to undertake the out-of-home social recreational
activity, he/she is more likely to re-schedule the activity. The study results also show that
& Dimas B. E. [email protected]
& Yusak O. [email protected]
& Anders [email protected]
1 Department of Civil Engineering, Institute of Technology and Science Bandung, Jalan GaneshaBoulevard Lot-A1, CBD Kota Deltamas Tol Jakarta-Cikampek Km 37, Cikarang Pusat, Bekasi,Indonesia
2 Department of Transport Science, KTH Royal Institute of Technology, Teknikringen 10,100 44 Stockholm, Sweden
123
Transportation (2018) 45:177–204https://doi.org/10.1007/s11116-016-9731-5
land use configuration and perceived accessibilities influence individuals’ discretionary
activity participation.
Keywords Day-to-day time–space constraints � Non-instrumental factors � Discretionary
activities duration � Bandung Metropolitan Area � Indonesia
Introduction
In engaging with their daily activity-travel, travellers’ needs and constraints are influenced
by their personal and household socio-demographic characteristics and their socio-envi-
ronmental conditions. Based on individual personal and social characteristics, Hagerstrand
(1970) argued that an individual is subject to three types of constraints: capability con-
straints, coupling constraints, and authority constraints. These constraints interact with
each other and define one’s daily time–space prism. The conditions and variability of other
resources, such as availability and service level of the infrastructure and public transport
network, the selection of possible activity locations within reachable distances, access to
various travel modes, and amount of money to spend, would provide individuals with
opportunities to engage in more/less activities with more/less dispersed location and time.
Given that individuals’ needs, desires, and constraints differ from day to day, their time–
space prisms and paths also differ from day to day (Schlich and Axhausen 2003; Miller
2005; Chikaraishi et al. 2011; Raux et al. 2012; Moiseeva et al. 2014; Susilo and Axhausen
2014). This complex mechanism means that each individual is unique and failing to
accommodate these interactions biases analyses and predictions.
The constraints are not solely physical and instrumental factors, such as travel mode
availability, time and cost. Non-instrumental variables such as motivation, volition and
habits also come into play. Currently there is a lack of knowledge of how these non-
instrumental variables are interacting and influencing the constraints that shape the indi-
viduals’ travel behaviour (Lewin 1936; Weick 1976; McDonald 1994; Golledge and
Stimson 1997; Dijst et al. 2008; Van Acker et al. 2011). Recent studies have hinted that
different social and geographical conditions may present different sets of pressures and
opportunities to the individual that correlate and differently interact with different indi-
viduals’ subjective characteristics (McDonald 1994; Garling and Axhausen 2003; Dijst
et al. 2008; Dharmowijoyo et al. 2015b). Previous studies revealed that individuals’ social
and geographical conditions, including their activity locations and spatial movement pat-
terns, are also influenced by non-instrumental factors, such as behavioural desire, volition,
and past behaviour (Dijst et al. 2008; Dharmowijoyo et al. 2015b). Thus, individuals’
temporal-social situations and trip engagements are correlated with that individual’s non-
instrumental factors. Given that each day is distinct, the influence of individual motivation,
volitional state, and past behaviour on the variability of activity-travel behaviour may be
different for different days.
Furthermore, any health or emotional problems may also influence individuals’ activity-
travel behaviour. How individuals’ health condition influences their activity and travel
participation may be more straightforward compared with the other way around (Dhar-
mowijoyo et al. 2015b, 2016a). This highlights the importance of understanding the
complex interdependencies between ones’ health condition and ones’ time-use and activity
participation.
178 Transportation (2018) 45:177–204
123
The interactions between needs and constraints highlight that some activities (such as
work/school and drop-off/pick-up child/children) are temporally and spatially fixed, while
other activities, such as maintenance and leisure, are flexible/discretionary. The former are
defined as mandatory and difficult to be re-scheduled, thus, dictating the individuals’
ability to perform the latter. In this open information era, individuals’ desire to connect
with other people may increase travel distance and space exploration by utilising the recent
advancements in vehicle technologies and infrastructure expansion, but may reduce them
in terms of spending more time on certain activity types with other people (Axhausen
2006; Carrasco and Miller 2006, 2009). It is notable that discretionary activity trips
(consisting of grocery shopping and social-recreation trips) tend to dominate individuals’
trip making purposes (around 54–70 %, around half for social-recreation trips) rather than
work/school trips (around 18–36 %) in developed countries (Stauffacher et al. 2005).
Grocery shopping and out-of-home social-recreation activities are the most important out-
of-home discretionary activities which tend to have different purposes in satisfying indi-
viduals’ needs (Akar et al. 2011), and temporal and spatial fixity degree (Schwanen et al.
2008). Grocery shopping aims to satisfy individuals’ biological needs and tend to have
lower spatial and temporal fixity degree than out-of-home social-recreation in developed
country case, whilst social-recreation trips fulfil cultural and physiological needs and tend
to have more fixed spatial and temporal fixity degree. Understanding how different
mechanisms underlie those different activities will help us to provide more opportunities
for undertaking those activities and/or to manage trips related with those activities.
Moreover, relating those activities with health parameters shows that undertaking social-
recreational activities tends to positively correlate with better social health conditions
(Suzukamo et al. 2011; Dharmowijoyo et al. 2015b; Susilo and Liu 2016). Meanwhile,
simultaneously undertaking grocery shopping as a primary activity and socialising as a
secondary purpose, encourages individuals to do more physical activities, subsequently
improving their physical health condition (Dharmowijoyo et al. 2015b).
While studies have investigated the complexity of discretionary activity participation
(e.g. Yamamoto and Kitamura 1999; Joh et al. 2002; Pendyala and Yamamoto 2002;
Meloni et al. 2004; Lee and Hickman 2007; Cirillo and Axhausen 2010), including how it
was arranged between different household members and varied across different days (e.g.
Kang et al. 2009; Kang and Scott 2010; Dharmowijoyo et al. 2016a), the interaction
between individuals’ day-to-day time–space components, his/her subjective characteristics
and health factors in discretionary activity participation are largely unknown. In this study,
it is hypothesised that integration among time–space, psychological and health components
can categorise the level of priority of certain activities. Cullen and Godson (1975), Cullen
(1978), and Golledge and Stimson (1997) have argued that classification of certain
activities as a planned or an impulsive behaviour can be caused by integration between
time–space and psychological factors. Moreover, time–space components such as daily
time allocation to activity participation, socio-demographic and built environment vari-
ables are assumed to affect individuals’ non-instrumental factors. Lastly, it is also
hypothesised that incorporating health factors in the model will show how individuals’
health constraints influence individuals’ activity-travel behaviours. The interaction
between health and time–space components may help us in coordinating health and time-
use policies,
All of the discussions above try to analyse individuals’ behaviours in relation with their
personal factors and associations with other individuals, materials and authorities’ rules/
norms in multi-hierarchies and multi-dimensional perspectives within time–space limita-
tions. The investigation tries to capture the complexity of interactions at the smallest level
Transportation (2018) 45:177–204 179
123
(Golledge and Stimson 1997; Marion 1999; Urry 2005; Ramalingam et al. 2008). Indi-
viduals’ behaviours can be seen as individuals’ efforts to satisfy their needs and desires in
considering the interactions of multi-dimensional systems embedded within themselves
under given time and space limitations. Integrating multi-dimensional perspectives can
provide insight into the reasons why an individual performs certain activities/trips which
may not be obviously captured by a one discipline approach (Dijst et al. 2009).
Using a 3-week household time-use and activity diary, this paper examined the rela-
tionship between individuals’ non-instrumental variables (such as motivation, volition, and
past behaviour), time–space and health factors on individuals’ day-to-day grocery shop-
ping and social-recreation activities. Time space components in this study were represented
by day-to-day time duration of activity participation, socio-demographic and built envi-
ronment variables. Those time–space components were available variables in this paper
which explain time–space constraints. A hierarchical Structural Equation Model (SEM)
was applied to take day-to-day variability effects into account, which examine the rela-
tionships between individuals’ discretionary activity time and non-instrumental factors,
such as behavioural desire, volition, and past behaviour.
In the next section, the datasets and variable specifications will be described. ‘‘Day-to-
day variability in individuals’ grocery shopping and out-of-home leisure activities’’ section
presents the descriptive analyses of individuals’ day-to-day variability in discretionary
activity participation during the observed period. ‘‘Proposed model structure’’ and ‘‘Esti-
mation results’’ sections describe the proposed model structure and model estimation
results, respectively. Conclusions are presented in ‘‘Conclusions and discussion’’ section.
The 2013 Bandung Metropolitan Area dataset
The Bandung Metropolitan Area
The Bandung Metropolitan Area (BMA) is the capital of the Province of West Java and is
approximately 200 km or 2–3 h’ drive south of Jakarta. The BMA is located in a river
basin, surrounded by volcanoes, in the central mountainous plateau region of West Java
Province and is 700 m above sea level. Bandung was founded as a city in the seventeenth
century and designed for 300,000 residents. Currently, it has around 2.5 million people just
in the inner areas. With its conurbations, it encompasses around 7.89 million people,
3382.89 km2, and is the second largest metropolitan area in Indonesia after the Jakarta
Metropolitan Area (JMA).
Compared to cities in developed countries, the BMA has a very relaxed or unplanned
mixed and monocentric land use, congested road networks, and poor public transport
networks and services (Susilo et al. 2010). Road congestion and low performance of public
transport encourage the BMA’s travellers to use motorcycles to reduce their travel costs
and time (Susilo et al. 2015). At the same time, they usually have more choices within a
closer range in which to conduct their activities along their travel routes, due to the highly
mixed land use configurations. These conditions influence the size, spread, orientation, and
variability of daily activity spaces (Dharmowijoyo et al. 2014). Unlike Jakarta, the BMA
does not have a formal transit system. An infrequent one-line railway operation serves
Cimahi in the West of Bandung City and Cileunyi in the East, which contributes only a
marginal riding share. The majority of public transport operations are supported by
indigenous public transport systems (called angkot and ojeg) that run like paratransit
180 Transportation (2018) 45:177–204
123
systems (Susilo 2011). They do not have particular stops, meaning they can stop every-
where. Most of these paratransit systems operate near the city centre; ojeg serves suburban
or settlement areas where angkots do not operate (Joewono and Kubota 2007a, b; Tarigan
et al. 2014).
The 2013 BMA dataset
The BMA dataset includes multi-dimensional information such as household, physical
activity and lifestyle, individual’s subjective characteristics, time-use and activity diary,
and subjective well-being data. The dataset raises possibilities to analyse individuals’
behaviour in multi-dimensional perspectives. Moreover, the interrelation among multi-
dimensional perspectives and among time–space constraints reveals some endogeneity
problems that exist due to the complexity of individuals’ decision making processes.
The survey involved 732 individuals and 191 households from all over BMA for 21
consecutive days. The questionnaires were applied in Bahasa Indonesia as the native
language of people in Indonesia. Due to poor registration of residents in Indonesia and
other developing countries, the recruitment process started with direct interaction between
surveyors and potential respondents, mediated by community leaders in selected neigh-
bourhoods. Therefore, in the recruitment process, the survey did not have any response rate
information. After the interaction, the respondents were asked to sign a commitment letter
agreeing not to withdraw from the survey until it was completed. After signing the
agreement, the surveyors began to distribute the questionnaires to the respondents. This
process minimised the attrition of respondents in completing the survey. In this survey,
none of respondents quit in the middle of survey time.
The household data section contained household composition, individuals’ perception
about how far his/her accommodation was from the city centre, public and transportation
facilities, and built environment variables. The subjective perception of accessibility was
used in this dataset, rather than objective measurements, because the traffic conditions in
BMA, like in other developing cities, are rather unpredictable and are frequently highly
congested. Thus, a subjective perceived accessibility was considered as a better mea-
surement to capture the accessibility to various activity locations available from individ-
uals’ residential locations. The profile of the samples used in this study is illustrated in
Table 1.
The time-use and activity diary survey captured twenty-three in-home and out-of-home
activity classifications, travel duration and mode characteristics, and multitasking activities
for adults, young adults and children above 7 years of age. In this study, time-use activity
participation was classified into groups of mandatory and discretionary activities. The
mandatory activities are classified as activities that are difficult to be re-scheduled (Cullen
and Godson 1975) with relative higher temporal and spatial fixity (such as working, school
and pick up/drop activities, Schwanen et al. 2008), thus, dictating the individual’s ability to
perform the discretionary activities. Moreover, discretionary activities are defined as
activities that are easy to be re-scheduled within time and space limitations (Cullen and
Godson 1975) with relative higher temporal and spatial flexibility such as grocery shop-
ping and leisure activities (Schwanen et al. 2008).
Mandatory activities contained in-home and out-of-home mandatory activities. Out-of-
home mandatory activities were defined as activities to meet other individuals or materials
at a location outside the home base such as working at workplace locations, studying at
school, having business meetings and dropping off/picking up children to/from school
Transportation (2018) 45:177–204 181
123
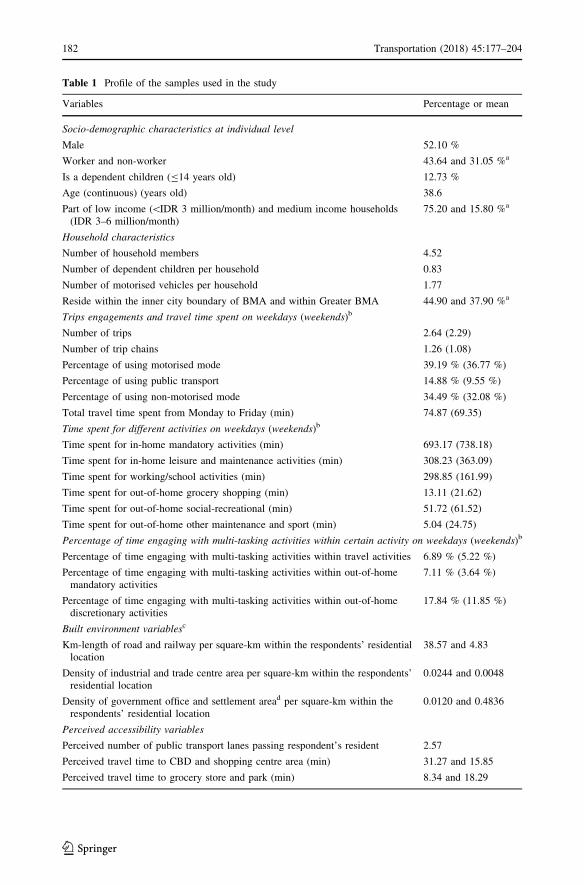
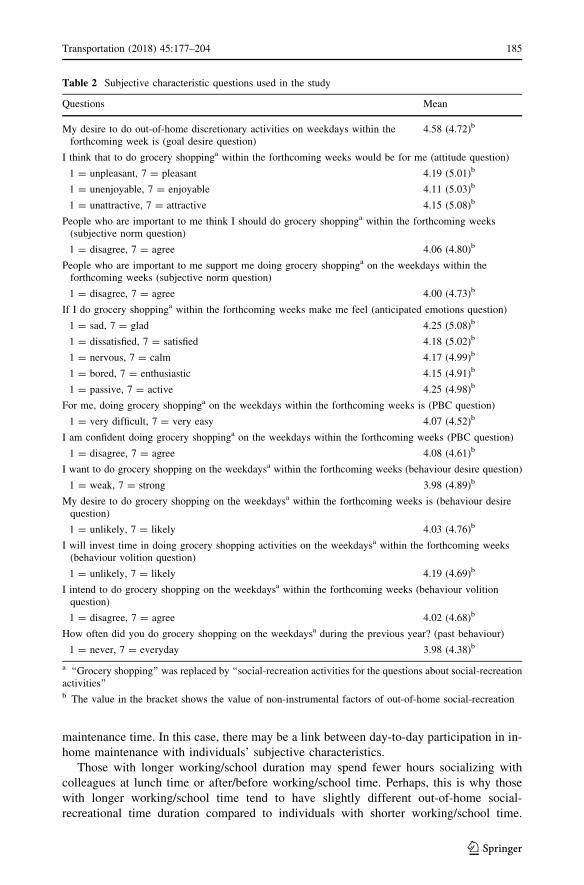
Table 1 Profile of the samples used in the study
Variables Percentage or mean
Socio-demographic characteristics at individual level
Male 52.10 %
Worker and non-worker 43.64 and 31.05 %a
Is a dependent children (B14 years old) 12.73 %
Age (continuous) (years old) 38.6
Part of low income (\IDR 3 million/month) and medium income households(IDR 3–6 million/month)
75.20 and 15.80 %a
Household characteristics
Number of household members 4.52
Number of dependent children per household 0.83
Number of motorised vehicles per household 1.77
Reside within the inner city boundary of BMA and within Greater BMA 44.90 and 37.90 %a
Trips engagements and travel time spent on weekdays (weekends)b
Number of trips 2.64 (2.29)
Number of trip chains 1.26 (1.08)
Percentage of using motorised mode 39.19 % (36.77 %)
Percentage of using public transport 14.88 % (9.55 %)
Percentage of using non-motorised mode 34.49 % (32.08 %)
Total travel time spent from Monday to Friday (min) 74.87 (69.35)
Time spent for different activities on weekdays (weekends)b
Time spent for in-home mandatory activities (min) 693.17 (738.18)
Time spent for in-home leisure and maintenance activities (min) 308.23 (363.09)
Time spent for working/school activities (min) 298.85 (161.99)
Time spent for out-of-home grocery shopping (min) 13.11 (21.62)
Time spent for out-of-home social-recreational (min) 51.72 (61.52)
Time spent for out-of-home other maintenance and sport (min) 5.04 (24.75)
Percentage of time engaging with multi-tasking activities within certain activity on weekdays (weekends)b
Percentage of time engaging with multi-tasking activities within travel activities 6.89 % (5.22 %)
Percentage of time engaging with multi-tasking activities within out-of-homemandatory activities
7.11 % (3.64 %)
Percentage of time engaging with multi-tasking activities within out-of-homediscretionary activities
17.84 % (11.85 %)
Built environment variablesc
Km-length of road and railway per square-km within the respondents’ residentiallocation
38.57 and 4.83
Density of industrial and trade centre area per square-km within the respondents’residential location
0.0244 and 0.0048
Density of government office and settlement aread per square-km within therespondents’ residential location
0.0120 and 0.4836
Perceived accessibility variables
Perceived number of public transport lanes passing respondent’s resident 2.57
Perceived travel time to CBD and shopping centre area (min) 31.27 and 15.85
Perceived travel time to grocery store and park (min) 8.34 and 18.29
182 Transportation (2018) 45:177–204
123
locations. Activities that are undertaken at the home base for fulfilling the individual’s
basic needs such as sleeping, eating and personal care were defined as in-home mandatory.
Discretionary activities were separated into maintenance and leisure. Discretionary
activities for satisfying household and personal physiological and biological needs (Akar
et al. 2011) were defined as maintenance activities. These include in-home maintenance
activities, such as housekeeping and nursing activities, as well as out-of-home maintenance
activities such as grocery shopping, health treatment activities and other service activities
(such as going to the bank, post office) (Kang and Scott 2010). For this study, out-of-home
maintenance activities were separated into grocery shopping and other out-of-home
maintenance. Moreover, leisure activities were discretionary activities undertaken within
an individual’s available time either in-home or out-of-home for satisfying cultural and
physiological needs (Akar et al. 2011). These activities included entertainment (such as
watching TV, listening to music/radio, reading magazines/newspapers and accessing the
Internet), social and family activities (such as meeting with family members and friends,
visiting relatives/friends and undertaking sport, leisure, and voluntary activities and going
on holiday). Out-of-home meetings with other household members/relatives/friends and
participating in out-of-home leisure, volunteer and going on holiday activities were defined
as out-of-home social-recreation activities in this study. On the other hand, out-of-home
sport was the only out-of-home leisure activity excluded from out-of-home social-recre-
ational activities.
Multi-tasking activities were defined as concurrent activities which contained primary
and secondary activities (Kenyon 2010; Circella et al. 2012) for satisfying different needs
and desires at the same time. In this case, multi-tasking activities were defined as com-
bining mandatory activities (such as work/school, eating, sleeping), maintenance activities
(such as nursing, grocery shopping), and active leisure activities such as doing sport or
reading a book with passive leisure activities, such as entertainment and socialising
(Circella et al. 2012). Socialising in this case was defined as meeting with other people
such as with other household members, or non-household members.
The questionnaire contained a section with health-related quality of life (QoL) questions
and its potential influencing factors. Health-related QoL was developed based on SF-36
(Short-Form 36), one of the most widely used generic measures for health-related surveys.
This set of questions has been adopted by more than 11 countries (Zhang 2013). It contains
eight subscales that consider physical, social and mental health, which are measured in
categories such as physical functioning (PF), limitations on role functioning according to
Table 1 continued
Variables Percentage or mean
Perceived travel time to the nearest place to stop public transport (min) 14.50
Trip chain is defined as home to home tripa The remaining is students (25.31 %), part of high income households (8.90 %) and reside within CBD ofBMA (17.20 %)b The values in brackets show the percentage/mean values on weekends, otherwise is on weekdaysc The density is calculated based on built area in only horizontal plane in km2 divided by total area in km2.The measurement is excluded the area on vertical planed Following the definition of density of certain built area, living in a denser settlement area does not alwaysmean to live in a populated area. More populous area can mean an area which contains low densitysettlement area in horizontal plane (but denser in vertical plane)
Transportation (2018) 45:177–204 183
123
physical health (RP), bodily pain (BP), general health (GH), mental health (MH), limita-
tions on role functioning due to emotional problems (RE), social functioning (SF) and
vitality (VT). As suggested by Suzukamo et al. (2011), PF, RP and BP will be defined as
physical health, RP, SF and RE as social health, and BP, GH, VT, SF, MH as mental
health.
Subjective characteristics take in individual’s planned behaviour, and habit. The Ex-
tended-Method of Goal Directed Behaviour (EMGB) theory was used in this study which
also accounted how deliberation information precedes the actions or not. Actions preceded
by deliberation processes (planned or reasoned behaviours) refer to the goal of the indi-
vidual taking part in certain behaviours that appear after intention or planning (Garling
et al. 2001; Garling and Axhausen 2003). In the Extended Model of Goal directed
Behaviour (EMGB) theory, intention is formed by individuals’ motivation which plays as
the most proximal antecedents to influence individuals’ intention. When the individual
performs certain behaviours, he/she is being motivated to achieve that particular behaviour.
Achieving a goal(s) is a necessary motivational function of decision-making (Thomson
et al. 2009). Therefore, behaviour desire is applied to represent motivation which directly
influences intention. The behaviour desire also includes attitude, subjective norms, per-
ceived behaviour control (PBC) and anticipated emotions as antecedents assumed to
indirectly influence intention. Perugini and Conner (2000), Perugini and Bagozzi (2001)
and Dharmowijoyo et al. (2015b) can be read to explain the theory in more detail. Only 584
respondents out of 732 were taken in this survey all of which were included in the analysis.
There was no cleaning/filtering step in the analysis. The subjective questions used in this
study are shown in Table 2.
Day-to-day variability in individuals’ grocery shopping and out-of-homeleisure activities
Figure 1a–d show the average day-to-day time spent in grocery shopping and out-of-home
social-recreational activities, broken down by respondents’ psychological factors, time
allocations for out-of-home and in-home activities, and density of settlement area/km2
within home zones variables. It can be seen that individuals’ time allocation to both
activity types varies daily and tends to reach the longest duration on Sunday. Presumably,
this is because Sunday is the only full holiday in Indonesia (Dharmowijoyo et al. 2016a).
On Sunday, individuals tend to have different activity-travel patterns from weekdays and
longer duration for discretionary activities (Dharmowijoyo et al. 2016b).
People with strong motivation, commitment, intention, and a high frequency in the past
to do grocery shopping and out-of-home social-recreation, tend to have shorter grocery
shopping and social-recreation time duration, respectively. Moreover, individuals with
longer in-home maintenance and shorter working/school time duration, and lower number
of trips, tend to have longer grocery shopping duration. As seen in Fig. 1c, individuals with
a strong motivation, commitment and intention, and higher frequency in the past to
undertake out-of-home social-recreation tend to increase their participation in activities
gradually from Monday to reach the highest level on Sunday. The pattern also looks
similar for out-of-home social-recreational behaviour of individuals with longer in-home
184 Transportation (2018) 45:177–204
123
maintenance time. In this case, there may be a link between day-to-day participation in in-
home maintenance with individuals’ subjective characteristics.
Those with longer working/school duration may spend fewer hours socializing with
colleagues at lunch time or after/before working/school time. Perhaps, this is why those
with longer working/school time tend to have slightly different out-of-home social-
recreational time duration compared to individuals with shorter working/school time.
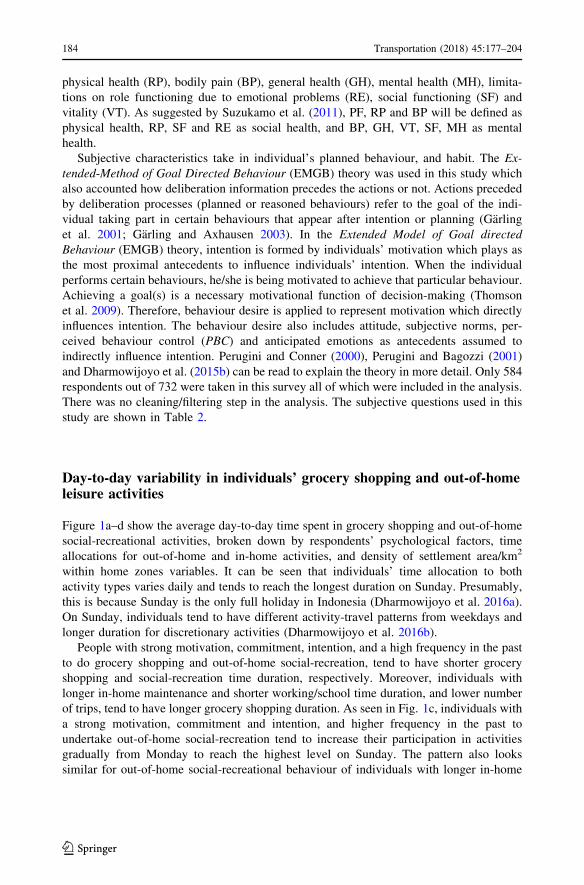
Table 2 Subjective characteristic questions used in the study
Questions Mean
My desire to do out-of-home discretionary activities on weekdays within theforthcoming week is (goal desire question)
4.58 (4.72)b
I think that to do grocery shoppinga within the forthcoming weeks would be for me (attitude question)
1 = unpleasant, 7 = pleasant 4.19 (5.01)b
1 = unenjoyable, 7 = enjoyable 4.11 (5.03)b
1 = unattractive, 7 = attractive 4.15 (5.08)b
People who are important to me think I should do grocery shoppinga within the forthcoming weeks(subjective norm question)
1 = disagree, 7 = agree 4.06 (4.80)b
People who are important to me support me doing grocery shoppinga on the weekdays within theforthcoming weeks (subjective norm question)
1 = disagree, 7 = agree 4.00 (4.73)b
If I do grocery shoppinga within the forthcoming weeks make me feel (anticipated emotions question)
1 = sad, 7 = glad 4.25 (5.08)b
1 = dissatisfied, 7 = satisfied 4.18 (5.02)b
1 = nervous, 7 = calm 4.17 (4.99)b
1 = bored, 7 = enthusiastic 4.15 (4.91)b
1 = passive, 7 = active 4.25 (4.98)b
For me, doing grocery shoppinga on the weekdays within the forthcoming weeks is (PBC question)
1 = very difficult, 7 = very easy 4.07 (4.52)b
I am confident doing grocery shoppinga on the weekdays within the forthcoming weeks (PBC question)
1 = disagree, 7 = agree 4.08 (4.61)b
I want to do grocery shopping on the weekdaysa within the forthcoming weeks (behaviour desire question)
1 = weak, 7 = strong 3.98 (4.89)b
My desire to do grocery shopping on the weekdaysa within the forthcoming weeks is (behaviour desirequestion)
1 = unlikely, 7 = likely 4.03 (4.76)b
I will invest time in doing grocery shopping activities on the weekdaysa within the forthcoming weeks(behaviour volition question)
1 = unlikely, 7 = likely 4.19 (4.69)b
I intend to do grocery shopping on the weekdaysa within the forthcoming weeks (behaviour volitionquestion)
1 = disagree, 7 = agree 4.02 (4.68)b
How often did you do grocery shopping on the weekdaysa during the previous year? (past behaviour)
1 = never, 7 = everyday 3.98 (4.38)b
a ‘‘Grocery shopping’’ was replaced by ‘‘social-recreation activities for the questions about social-recreationactivities’’b The value in the bracket shows the value of non-instrumental factors of out-of-home social-recreation
Transportation (2018) 45:177–204 185
123
Furthermore, those with fewer trips and longer in-home maintenance time have the shortest
duration for out-of-home social-recreation, but gradually increase this when approaching
the weekends. There may be efforts to improve individuals’ overall well-being (Baron
2005) or rating of good experience within their certain life episode (Rasouli and Tim-
mermans 2014) by negotiating their time-use or day-to-day time allocation, meaning less
stress and more freedom/relaxing/exciting activities (Anable and Gatersleben 2005).
8
13
18
23
28
33
1M 2T 3W 4TH 5F 6S 7SU 8M 9T 10W 11TH 12F 13S 14SU 15M 16T 17W 18TH 19F 20S 21SU
Tim
e-us
e fo
r gr
ocer
y s
hopp
ing
(min
utes
)
Day***
Weak Behaviour Desire (≤0*) Strong Behaviour Desire(>0*)
Weak Behaviour Voli�on (≤0*) Strong Behaviour Voli�on (>0*)
Low Frequency in the past (≤4**) High frequency in the past (>4**)
5
10
15
20
25
30
35
1M 2T 3W 4TH 5F 6S 7SU 8M 9T 10W 11TH 12F 13S 14SU 15M 16T 17W 18TH 19F 20S 21SU
Tim
e-us
e fo
r gr
ocer
y s
hopp
ing
(min
utes
)
Day***Low number of trips (<2) High number of trips (≥2)
Shorter �me-use for working/school (<240 min) Longer �me-use for working/school (≥240 min)
Shorter �me-use for in-home maintenance (<300 min) Longer �me-use for in-home maintenance (≥300 min)
Low se�lement density (<50%) High se�lement density (≥50%)
(a)
(b)
186 Transportation (2018) 45:177–204
123
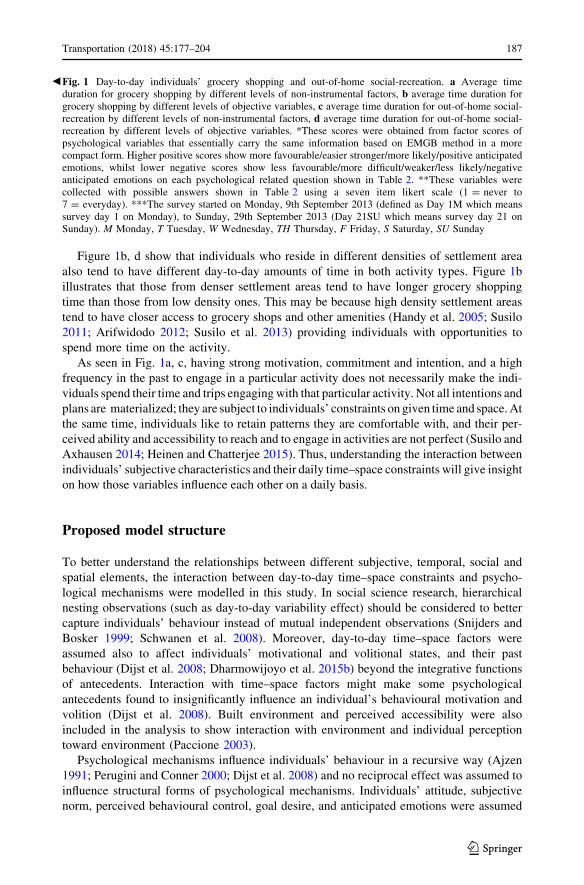
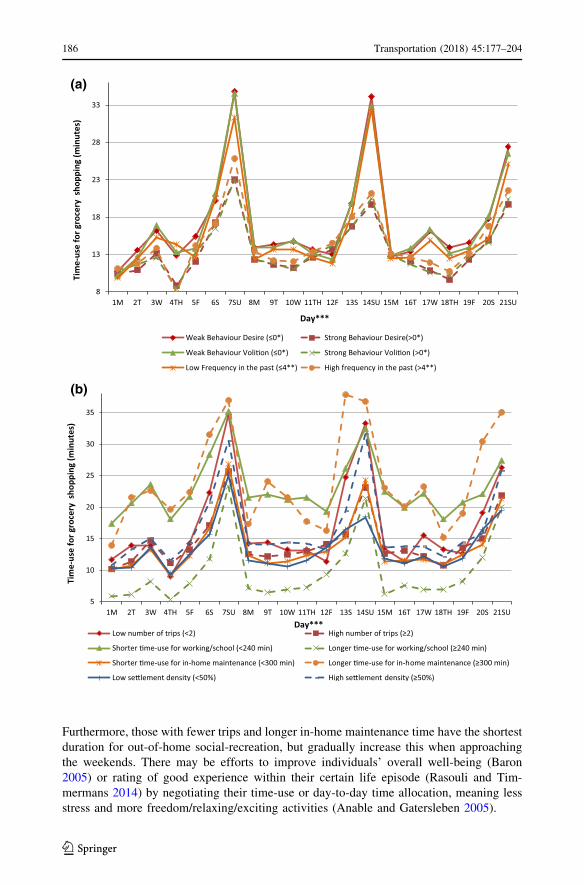
Figure 1b, d show that individuals who reside in different densities of settlement area
also tend to have different day-to-day amounts of time in both activity types. Figure 1b
illustrates that those from denser settlement areas tend to have longer grocery shopping
time than those from low density ones. This may be because high density settlement areas
tend to have closer access to grocery shops and other amenities (Handy et al. 2005; Susilo
2011; Arifwidodo 2012; Susilo et al. 2013) providing individuals with opportunities to
spend more time on the activity.
As seen in Fig. 1a, c, having strong motivation, commitment and intention, and a high
frequency in the past to engage in a particular activity does not necessarily make the indi-
viduals spend their time and trips engaging with that particular activity. Not all intentions and
plans are materialized; they are subject to individuals’ constraints on given time and space. At
the same time, individuals like to retain patterns they are comfortable with, and their per-
ceived ability and accessibility to reach and to engage in activities are not perfect (Susilo and
Axhausen 2014; Heinen and Chatterjee 2015). Thus, understanding the interaction between
individuals’ subjective characteristics and their daily time–space constraints will give insight
on how those variables influence each other on a daily basis.
Proposed model structure
To better understand the relationships between different subjective, temporal, social and
spatial elements, the interaction between day-to-day time–space constraints and psycho-
logical mechanisms were modelled in this study. In social science research, hierarchical
nesting observations (such as day-to-day variability effect) should be considered to better
capture individuals’ behaviour instead of mutual independent observations (Snijders and
Bosker 1999; Schwanen et al. 2008). Moreover, day-to-day time–space factors were
assumed also to affect individuals’ motivational and volitional states, and their past
behaviour (Dijst et al. 2008; Dharmowijoyo et al. 2015b) beyond the integrative functions
of antecedents. Interaction with time–space factors might make some psychological
antecedents found to insignificantly influence an individual’s behavioural motivation and
volition (Dijst et al. 2008). Built environment and perceived accessibility were also
included in the analysis to show interaction with environment and individual perception
toward environment (Paccione 2003).
Psychological mechanisms influence individuals’ behaviour in a recursive way (Ajzen
1991; Perugini and Conner 2000; Dijst et al. 2008) and no reciprocal effect was assumed to
influence structural forms of psychological mechanisms. Individuals’ attitude, subjective
norm, perceived behavioural control, goal desire, and anticipated emotions were assumed
bFig. 1 Day-to-day individuals’ grocery shopping and out-of-home social-recreation. a Average timeduration for grocery shopping by different levels of non-instrumental factors, b average time duration forgrocery shopping by different levels of objective variables, c average time duration for out-of-home social-recreation by different levels of non-instrumental factors, d average time duration for out-of-home social-recreation by different levels of objective variables. *These scores were obtained from factor scores ofpsychological variables that essentially carry the same information based on EMGB method in a morecompact form. Higher positive scores show more favourable/easier stronger/more likely/positive anticipatedemotions, whilst lower negative scores show less favourable/more difficult/weaker/less likely/negativeanticipated emotions on each psychological related question shown in Table 2. **These variables werecollected with possible answers shown in Table 2 using a seven item likert scale (1 = never to7 = everyday). ***The survey started on Monday, 9th September 2013 (defined as Day 1M which meanssurvey day 1 on Monday), to Sunday, 29th September 2013 (Day 21SU which means survey day 21 onSunday). M Monday, T Tuesday, W Wednesday, TH Thursday, F Friday, S Saturday, SU Sunday
Transportation (2018) 45:177–204 187
123

to influence their behavioural motivation as in influencing their commitment and intention
(behavioural volition).
Due to the psychological factors’ interaction, it is possible to explore the complex
interaction between day-to-day time–space factors and the psychological mechanisms
38
43
48
53
58
63
68
73
78
1M 2T 3W 4TH 5F 6S 7SU 8M 9T 10W 11TH 12F 13S 14SU 15M 16T 17W 18TH 19F 20S 21SU
Tim
e-us
e fo
r so
cial
-rec
rea�
onal
(min
utes
)
Day***
Weak Behaviour Desire (≤0*) Strong Behaviour Desire (>0*)
Weak Behaviour Voli�on (≤0*) Strong Behaviour Voli�on (>0*)
Low Frequency in the past (≤4**) High frequency in the past (>4**)
10
20
30
40
50
60
70
80
1M 2T 3W 4TH 5F 6S 7SU 8M 9T 10W 11TH 12F 13S 14SU 15M 16T 17W 18TH 19F 20S 21SU
Tim
e-us
e fo
r so
cial
-rec
rea�
onal
(min
utes
)
Low number of trips (<2) High number of trips (≥2)
Shorter �me-use for working/school (<240 min) Longer �me-use for working/school (≥240 min)
Shorter �me-use for in-home maintenance (<300 min) Longer �me-use for in-home maintenance (≥300 min)
Low se�lement density (<50%) High se�lement density (≥50%)
Day***
(c)
(d)
Fig. 1 continued
188 Transportation (2018) 45:177–204
123
using a hierarchical SEM (Dharmowijoyo et al. 2015a). A hierarchical SEM captured the
complexity of psychological mechanisms in a recursive structure while accounting for the
day-to-day variability effect of individuals’ time–space constraints. The method was not
expected to deal with any reciprocal effect in examining psychological factors’ interaction.
Each psychological factor was formed from observable indicators in the measurement
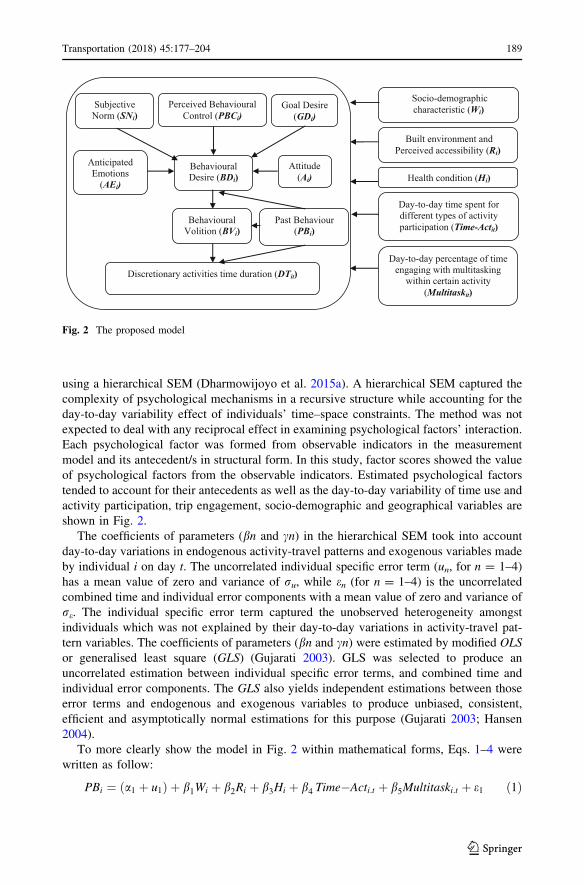
model and its antecedent/s in structural form. In this study, factor scores showed the value
of psychological factors from the observable indicators. Estimated psychological factors
tended to account for their antecedents as well as the day-to-day variability of time use and
activity participation, trip engagement, socio-demographic and geographical variables are
shown in Fig. 2.
The coefficients of parameters (bn and cn) in the hierarchical SEM took into account
day-to-day variations in endogenous activity-travel patterns and exogenous variables made
by individual i on day t. The uncorrelated individual specific error term (un, for n = 1–4)
has a mean value of zero and variance of ru, while en (for n = 1–4) is the uncorrelated
combined time and individual error components with a mean value of zero and variance of
re. The individual specific error term captured the unobserved heterogeneity amongst
individuals which was not explained by their day-to-day variations in activity-travel pat-
tern variables. The coefficients of parameters (bn and cn) were estimated by modified OLS
or generalised least square (GLS) (Gujarati 2003). GLS was selected to produce an
uncorrelated estimation between individual specific error terms, and combined time and
individual error components. The GLS also yields independent estimations between those
error terms and endogenous and exogenous variables to produce unbiased, consistent,
efficient and asymptotically normal estimations for this purpose (Gujarati 2003; Hansen
2004).
To more clearly show the model in Fig. 2 within mathematical forms, Eqs. 1–4 were
written as follow:
PBi ¼ a1 þ u1ð Þ þ b1Wi þ b2Ri þ b3Hi þ b4 Time�Acti:t þ b5Multitaski:t þ e1 ð1Þ
Socio-demographic characteristic (Wi)
Behavioural Desire (BDi)
Discretionary activities time duration (DTit)
Built environment and Perceived accessibility (Ri)
Day-to-day time spent for different types of activityparticipation (Time-Actit)
Attitude (Ai)
Perceived Behavioural Control (PBCi)
Goal Desire (GDi)
Anticipated Emotions
(AEi)
Behavioural Volition (BVi)
Subjective Norm (SNi)
Day-to-day percentage of time engaging with multitasking
within certain activity (Multitaskit)
Health condition (Hi)
Past Behaviour (PBi)
Fig. 2 The proposed model
Transportation (2018) 45:177–204 189
123
BDi: ¼ a2 þ u2ð Þ þ b6Ai þ b7SNi þ b8PBCi þ b9AEi þ b10GDi þ b11Wi þ b12Ri
þ b13Hi þ b14Time�Acti:t þ b15Multitaski:t þ c1cPBi;t þ e2
ð2Þ
BVi ¼ a3 þ u3ð Þ þ b16Wi þ b17Ri þ b18Hi þ b19 Time�Acti:t þ b20Multitaski:t
þ c2dBDi;t þ c3
dPBi;t þ e3
ð3Þ
DTi;t ¼ a4 þ u4ð Þ þ b21Wi þ b22Ri þ b23Time�Acti;t þ b24Multitaski;t þ c4dBVi;t
þ c5dPBi;t þ e4:
ð4Þ
The coefficient parameters were estimated by maximum likelihood estimator as shown
in Eq. 5 (Breusch 1987; Greene 1993) with LIMDEP version 8.0. From Eq. 5, N was
defined as a matrix of cross-sectional units (e.g. individuals or firms) with N = 1, …, N,
whilst T was defined as a matrix of time periods with T = 1, …, T. Moreover,
d = y - Xb, where Qw = I - Pw with Pw = T-1 (IN � IT0IT0). Qb is Q0 - Qw with
Q0 = I - NT-1 lNT l0NT and h = r2/(r2 ? T ra2). Now, with Eq. 5, maximising over b
given h yields:
L� b; hð Þ ¼ �NT
2log d0 Qw þ hQbð Þdf g þ N
2log h ð5Þ
Iterative GLS was used by successive Eqs. 6 and 7, starting from some initial values for bin d = y - Xb in 7 or for h in 6.
bMLE ¼ X0 Qw þ hQbð ÞX½ ��1X0 Qw þ hQbð Þy½ � ð6Þ
and maximising over h, given b yields:
h ¼ d0Qwd
T � 1ð Þd0Qbdð7Þ
The advantage of this model compared to certain path analysis method (e.g. FIML) is
that it can deal with categorical variables. Individuals’ socio-demographic variables may
be better explained by categorical instead of continuous variables due to the non-linear
behaviours of the variables. The heterogeneity of non-instrumental factors may be
explained by individuals’ socio-demographic variables (Ajzen 1991; Anable 2005; Dijst
et al. 2008; Dharmowijoyo et al. 2015b). Moreover, the model needs less computational
time compared to multilevel path analysis models. However, it is inefficient when esti-
mating the relationships between latent variables and hierarchical nesting observations.
Estimation results
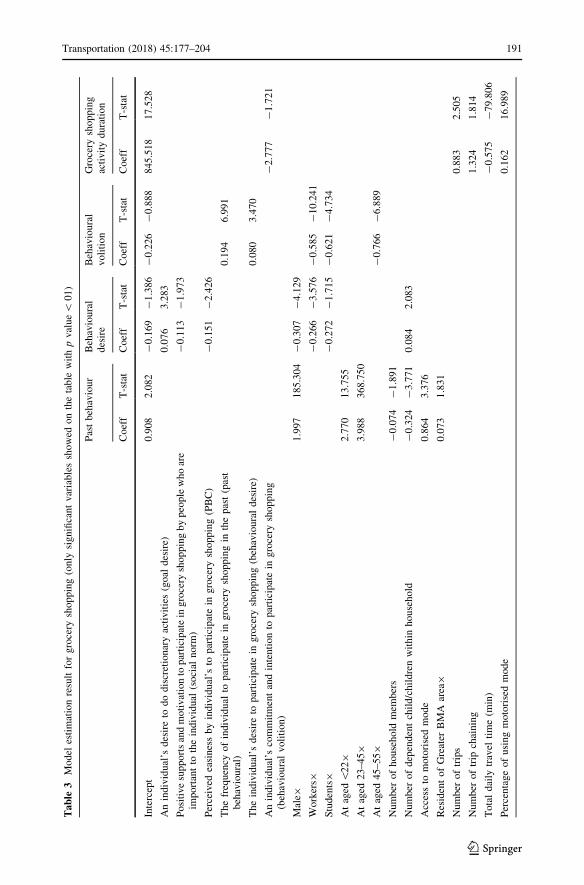
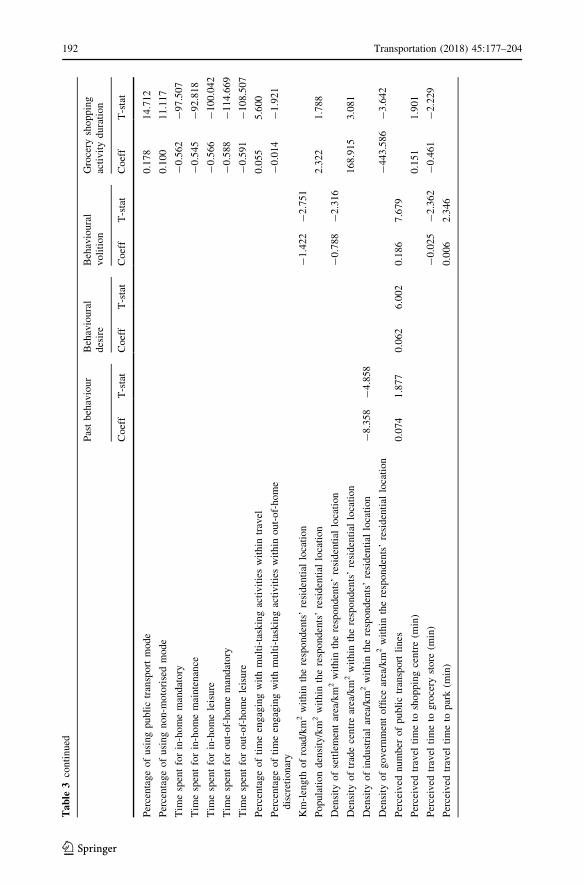
Tables 3 and 4 show that participation in day-to-day discretionary activity behaviours are
integrated between individuals’ day-to-day social situation, geographical condition of the
home zone, and subjective characteristics. Geographical condition was also found to sig-
nificantly influence individuals’ volitional and past behaviour to undertake both activities.
Accounting for the day-to-day variability effect makes some psychological antecedents,
such as attitude and anticipated emotions, not influence behavioural desire significantly.
The salient results are shown below.
190 Transportation (2018) 45:177–204
123
Table
3M
odel
esti
mat
ion
resu
ltfo
rgro
cery
shoppin
g(o
nly
signifi
cant
var
iable
ssh
ow
edon
the
table
wit
hp
val
ue\
01
)
Pas
tb
ehav
iou
rB
ehav
ioura
ld
esir
eB
ehav
ioura
lv
oli
tio
nG
roce
rysh
op
pin
gac
tivit
ydura
tion
Co
eff
T-s
tat
Coef
fT
-sta
tC
oef
fT
-sta
tC
oef
fT
-sta
t
Inte
rcep
t0
.908
2.0
82
-0
.169
-1
.38
6-
0.2
26
-0
.888
84
5.5
18
17
.52
8
An
indiv
idual
’sdes
ire
todo
dis
cret
ionar
yac
tivit
ies
(goal
des
ire)
0.0
76
3.2
83
Po
siti
ve
sup
po
rts
and
mo
tiv
atio
nto
par
tici
pat
ein
gro
cery
sho
pp
ing
by
peo
ple
wh
oar
eim
po
rtan
tto
the
ind
ivid
ual
(so
cial
no
rm)
-0
.113
-1
.97
3
Per
ceiv
edea
sin
ess
by
indiv
idu
al’s
top
arti
cip
ate
ing
roce
rysh
opp
ing
(PB
C)
-0
.151
-2
.42
6
Th
efr
equen
cyo
fin
div
idu
alto
par
tici
pat
ein
gro
cery
sho
pp
ing
inth
ep
ast
(pas
tb
ehav
iou
ral)
0.1
94
6.9
91
Th
ein
div
idu
al’s
des
ire
top
arti
cip
ate
ing
roce
rysh
opp
ing
(beh
avio
ura
ld
esir
e)0
.080
3.4
70
An
indiv
idu
al’s
com
mit
men
tan
din
ten
tio
nto
par
tici
pat
ein
gro
cery
sho
pp
ing
(beh
avio
ura
lv
oli
tion
)-
2.7
77
-1
.72
1
Mal
e91
.997
18
5.3
04
-0
.307
-4
.12
9
Wo
rker
s9-
0.2
66
-3
.57
6-
0.5
85
-1
0.2
41
Stu
den
ts9
-0
.272
-1
.71
5-
0.6
21
-4
.734
At
aged
\2
29
2.7
70
13
.75
5
At
aged
23
–459
3.9
88
36
8.7
50
At
aged
45
–559
-0
.766
-6
.889
Nu
mb
ero
fh
ou
seh
old
mem
ber
s-
0.0
74
-1
.891
Nu
mb
ero
fd
epen
den
tch
ild
/ch
ild
ren
wit
hin
ho
use
ho
ld-
0.3
24
-3
.771
0.0
84
2.0
83
Acc
ess
tom
oto
rise
dm
ode
0.8
64
3.3
76
Res
iden
to
fG
reat
erB
MA
area9
0.0
73
1.8
31
Nu
mb
ero
ftr
ips
0.8
83
2.5
05
Nu
mb
ero
ftr
ipch
ainin
g1
.32
41
.814
To
tal
dai
lytr
avel
tim
e(m
in)
-0
.575
-7
9.8
06
Per
cen
tag
eo
fu
sin
gm
oto
rise
dm
od
e0
.16
21
6.9
89
Transportation (2018) 45:177–204 191
123
Table
3co
nti
nued
Pas
tb
ehav
iou
rB
ehav
ioura
ld
esir
eB
ehav
ioura
lv
oli
tio
nG
roce
rysh
op
pin
gac
tivit
ydura
tion
Co
eff
T-s
tat
Coef
fT
-sta
tC
oef
fT
-sta
tC
oef
fT
-sta
t
Per
cen
tag
eo
fu
sin
gp
ub
lic
tran
spo
rtm
od
e0
.17
81
4.7
12
Per
cen
tag
eo
fu
sin
gn
on
-mo
tori
sed
mod
e0
.10
01
1.1
17
Tim
esp
ent
for
in-h
om
em
and
ato
ry-
0.5
62
-9
7.5
07
Tim
esp
ent
for
in-h
om
em
ain
ten
ance
-0
.545
-9
2.8
18
Tim
esp
ent
for
in-h
om
ele
isu
re-
0.5
66
-1
00
.04
2
Tim
esp
ent
for
ou
t-o
f-h
om
em
and
atory
-0
.588
-1
14
.66
9
Tim
esp
ent
for
ou
t-o
f-h
om
ele
isu
re-
0.5
91
-1
08
.50
7
Per
centa
ge
of
tim
een
gag
ing
wit
hm
ult
i-ta
skin
gac
tivit
ies
wit
hin
trav
el0.0
55
5.6
00
Per
centa
ge
of
tim
een
gag
ing
wit
hm
ult
i-ta
skin
gac
tivit
ies
wit
hin
out-
of-
hom
ed
iscr
etio
nar
y-
0.0
14
-1
.92
1
Km
-len
gth
of
road
/km
2w
ith
inth
ere
spo
nd
ents
’re
sid
enti
allo
cati
on
-1
.422
-2
.751
Po
pu
lati
on
den
sity
/km
2w
ith
inth
ere
spo
nden
ts’
resi
den
tial
loca
tion
2.3
22
1.7
88
Den
sity
of
sett
lem
ent
area
/km
2w
ith
inth
ere
spo
nden
ts’
resi
den
tial
loca
tion
-0
.788
-2
.316
Den
sity
of
trad
ece
ntr
ear
ea/k
m2
wit
hin
the
resp
on
den
ts’
resi
den
tial
loca
tio
n1
68
.91
53
.081
Den
sity
of
indust
rial
area
/km
2w
ith
inth
ere
spo
nden
ts’
resi
den
tial
loca
tion
-8
.358
-4
.858
Den
sity
of
gover
nm
ent
offi
cear
ea/k
m2
wit
hin
the
resp
on
den
ts’
resi
den
tial
loca
tio
n-
44
3.5
86
-3
.64
2
Per
ceiv
edn
um
ber
of
pu
bli
ctr
ansp
ort
lin
es0
.074
1.8
77
0.0
62
6.0
02
0.1
86
7.6
79
Per
ceiv
edtr
avel
tim
eto
sho
pp
ing
cen
tre
(min
)0
.15
11
.901
Per
ceiv
edtr
avel
tim
eto
gro
cery
sto
re(m
in)
-0
.025
-2
.362
-0
.461
-2
.22
9
Per
ceiv
edtr
avel
tim
eto
par
k(m
in)
0.0
06
2.3
46
192 Transportation (2018) 45:177–204
123
Table
3co
nti
nued
Pas
tb
ehav
iou
rB
ehav
ioura
ld
esir
eB
ehav
ioura
lv
oli
tio
nG
roce
rysh
op
pin
gac
tivit
ydura
tion
Co
eff
T-s
tat
Coef
fT
-sta
tC
oef
fT
-sta
tC
oef
fT
-sta
t
Ind
ivid
ual
’ssu
bje
ctiv
efr
equen
cyo
fh
avin
gnomentalproblems
indai
lyac
tivit
ies
du
rin
gla
st4
wee
ks
1.4
91
70
.66
5
Ind
ivid
ual
’ssu
bje
ctiv
efr
equen
cyo
fh
avin
gnosocialproblems
indai
lyac
tivit
ies
du
rin
gla
st4
wee
ks
0.5
83
37
.01
60
.133
4.1
06
Mea
no
fth
ed
epen
den
tv
aria
ble
s4
.598
-0
.564
0.3
05
15
.46
1
SD
1.8
47
0.9
99
1.0
14
33
.99
6
e it
0.4
229
E-
70
.32
99
E-
50
.4399
E-
72
86
.75
9
ui
5.6
08
3.9
84
1.3
64
24
9.8
42
Nu
mb
ero
fo
bse
rvat
ion
s(N
)1
1,3
75
11
,69
71
0,6
82
10
,42
3
R-s
qu
are
0.1
96
0.2
05
0.2
19
0.5
61
Lo
gli
kel
ihoo
d-
21
,87
7.0
2-
15
,24
3.4
1-
13
,98
3.7
6-
47
,24
8.8
7
Transportation (2018) 45:177–204 193
123
Table
4M
odel
esti
mat
ion
resu
ltfo
rout-
of-
hom
eso
cial
-rec
reat
ional
(only
signifi
cant
var
iable
ssh
ow
edon
the
table
wit
hp
val
ue\
0.1
)
Pas
tb
ehav
iou
rB
ehav
ioura
ld
esir
eB
ehav
ioura
lv
oli
tio
nO
ut-
of-
ho
me
soci
al-
recr
eati
on
alac
tiv
ity
du
rati
on
Co
eff
T-s
tat
Coef
fT
-sta
tC
oef
fT
-sta
tC
oef
fT
-sta
t
Inte
rcep
t1
5.1
62
82
.72
42
.864
34
.25
1-
2.2
71
-7
.021
12
25
.12
10
.89
4
An
indiv
idual
’sdes
ire
todo
dis
cret
ionar
yac
tivit
ies
-0
.636
-4
5.1
11
Per
ceiv
edea
sines
sb
yin
div
idual
’sto
par
tici
pat
ein
out-
of-
hom
eso
cial
-rec
reat
ion
acti
vit
ies
(PB
C)
1.7
68
10
6.4
53
The
freq
uen
cyof
indiv
idual
topar
tici
pat
ein
out-
of-
hom
eso
cial
recr
eati
on
inth
epas
t(p
ast
beh
avio
ura
l)0
.216
14
.60
3
Mal
e90
.369
66
.01
90
.849
28
.26
91
1.3
51
5.8
15
At
aged
\2
29
-0
.753
-4
.806
8.5
11
3.5
43
At
aged
45
–559
-1
.413
-1
1.2
82
Nu
mb
ero
fh
ou
seh
old
mem
ber
s-
1.8
01
0.2
24
7.0
30
Nu
mb
ero
fd
epen
den
tch
ild
/ch
ild
ren
wit
hin
ho
use
ho
ld-
2.1
22
-2
.28
2
Nu
mb
ero
ftr
ips
0.0
01
-2
.653
-5
.43
8
Nu
mb
ero
ftr
ipch
ainin
g0
.001
3.2
59
-2
.201
-2
.15
6
To
tal
dai
lytr
avel
tim
e(m
in)
-0
.896
-1
13
.26
6
Per
cen
tag
eo
fu
sin
gm
oto
rise
dm
od
e-
0.3
04
-2
2.8
81
Per
cen
tag
eo
fu
sin
gp
ub
lic
tran
spo
rtm
od
e-
0.4
06
-2
4.5
26
Per
cen
tag
eo
fu
sin
gn
on
-mo
tori
sed
mod
e-
0.2
28
-1
8.0
57
Tim
esp
ent
for
in-h
om
em
and
ato
ry-
0.9
46
-2
12
.63
2
Tim
esp
ent
for
in-h
om
em
ain
ten
ance
-0
.946
-1
91
.06
4
Tim
esp
ent
for
in-h
om
ele
isu
re-
0.9
41
-2
25
.59
1
Tim
esp
ent
for
ou
t-o
f-h
om
em
and
atory
0.0
01
13
.71
8-
0.8
82
-2
45
.31
7
194 Transportation (2018) 45:177–204
123
Table
4co
nti
nued
Pas
tb
ehav
iou
rB
ehav
ioura
ld
esir
eB
ehav
ioura
lv
oli
tio
nO
ut-
of-
ho
me
soci
al-
recr
eati
on
alac
tiv
ity
du
rati
on
Co
eff
T-s
tat
Coef
fT
-sta
tC
oef
fT
-sta
tC
oef
fT
-sta
t
Tim
esp
ent
for
ou
t-o
f-h
om
em
ain
ten
ance
-0
.855
-7
6.5
93
Tim
esp
ent
for
ou
t-o
f-h
om
esp
ort
0.0
01
6.6
47
-0
.862
-9
3.6
64
Per
centa
ge
of
tim
een
gag
ing
wit
hm
ult
i-ta
skin
gac
tivit
ies
wit
hin
in-h
om
em
and
atory
-0
.00
1
Per
centa
ge
of
tim
een
gag
ing
wit
hm
ult
i-ta
skin
gac
tivit
ies
wit
hin
in-h
om
ed
iscr
etio
nar
y0
.12
74
.155
Per
centa
ge
of
tim
een
gag
ing
wit
hm
ult
i-ta
skin
gac
tivit
ies
wit
hin
out-
of-
hom
ed
iscr
etio
nar
y0
.001
-0
.081
-7
.61
2
Km
-len
gth
of
road
/km
2w
ith
inth
ere
spo
nd
ents
’re
sid
enti
allo
cati
on
-1
0.3
23
-1
6.6
13
0.2
02
3.7
08
Km
-len
gth
of
rail
way
/km
2w
ith
inth
ere
spo
nden
ts’
resi
den
tial
loca
tio
n0
.433
2.6
88
Po
pu
lati
on
den
sity
/km
2w
ith
inth
ere
spo
nden
ts’
resi
den
tial
loca
tion
-0
.04
2-
6.2
26
1.1
44
1.6
17
Den
sity
of
sett
lem
ent
area
/km
2w
ith
inth
ere
spo
nden
ts’
resi
den
tial
loca
tion
-1
.531
-4
.317
Den
sity
of
trad
ece
ntr
ear
ea/k
m2
wit
hin
the
resp
on
den
ts’
resi
den
tial
loca
tio
n-
21
3.2
43
-3
.45
5
Den
sity
of
indust
rial
area
/km
2w
ith
inth
ere
spo
nden
ts’
resi
den
tial
loca
tion
-4
.267
-4
.814
Den
sity
of
gover
nm
ent
offi
cear
ea/k
m2
wit
hin
the
resp
on
den
ts’
resi
den
tial
loca
tion
-5
4.7
28
-9
.163
82
6.0
43
2.1
07
Per
ceiv
edn
um
ber
of
pu
bli
ctr
ansp
ort
lin
es0
.220
8.3
90
Per
ceiv
edtr
avel
tim
eto
sho
pp
ing
cen
tre
(min
)-
0.2
58
-5
3.5
77
Per
ceiv
edtr
avel
tim
eto
gro
cery
sto
re(m
in)
-0
.021
-1
.895
Per
ceiv
edtr
avel
tim
eto
par
k(m
in)
0.2
28
Ind
ivid
ual
’ssu
bje
ctiv
efr
equen
cyo
fh
avin
gnophysicalproblems
ind
aily
acti
vit
ies
du
ring
last
4w
eek
s1
.184
53
.98
0
Transportation (2018) 45:177–204 195
123
Table
4co
nti
nued
Pas
tb
ehav
iou
rB
ehav
ioura
ld
esir
eB
ehav
ioura
lv
oli
tio
nO
ut-
of-
ho
me
soci
al-
recr
eati
on
alac
tiv
ity
du
rati
on
Co
eff
T-s
tat
Coef
fT
-sta
tC
oef
fT
-sta
tC
oef
fT
-sta
t
Ind
ivid
ual
’ssu
bje
ctiv
efr
equ
ency
of
hav
ingnomentalproblems
indai
lyac
tivit
ies
du
rin
gla
st4
wee
ks
2.2
42
2.0
41
Mea
no
fth
ed
epen
den
tv
aria
ble
s4
.378
-0
.306
0.9
63
54
.85
1
SD
1.4
79
1.0
21
1.0
16
88
.03
1
e it
0.0
03
0.0
02
0.0
01
61
5.8
13
ui
18
.10
11
.592
2.6
46
24
0.2
28
Nu
mb
ero
fo
bse
rvat
ion
s(N
)1
0,7
31
10
,71
01
0,8
46
10
,51
4
R-s
qu
are
0.0
82
0.5
97
0.2
27
0.8
92
Lo
gli
kel
ihoo
d-
18
,96
6.1
5-
10
,55
0.9
8-
13
,69
5.8
1-
50
,27
8.8
3
196 Transportation (2018) 45:177–204
123

Time use for grocery shopping activities
The results illustrate that individuals’ motivation, commitment, intention, and frequency in
the past to engage in grocery shopping tend to be time invariant. Individuals’ psychological
factors are not influenced by the difference of day-to-day individuals’ day-to-day social
situations indicated by day-to-day time duration of activity participation. However, living
within different geographical locations tends to explain individuals’ volitional stage.
Those with better social and mental health tend to have stronger motivation to grocery
shop, whilst having better social health tends to positively correlate with stronger com-
mitment and intention to do the activity. Moreover, socio-demographic variables tend to
also affect non-instrumental variables. For example, non-workers have stronger motiva-
tion, and commitment and intention to undertake grocery shopping, while females have
stronger motivation, but lower frequency of the activity in the past. Students tend to have
the lowest motivation, commitment and intention to grocery shop compared with workers
and non-workers. In addition, having more household members and dependent children
tends to reduce past frequency of grocery shopping, indicating intra-household activity
sharing arrangements (Susilo and Axhausen 2014). At the same time, having access to
motorised transport and residing within the Greater BMA Area positively correlates with a
higher frequency of grocery shopping in the past.
As expected, behavioural volition is influenced by considerable situational variables
than behavioural desire. Behavioural volition is a closer stage to actual behaviour than
planning or motivation, thus, it is logically acceptable that situational variables in larger
number are found to significantly affect behavioural volition. Having a shorter perceived
travel time and more perceived public transport lines gives an individual higher com-
mitment and intention to do the activity, whilst residing within a denser settlement area and
longer roads/km2 tends to show an opposite result. Having closer access to grocery
shopping locations may make individuals who reside within denser settlement areas
(Arifwidodo 2012; Tarigan et al. 2016) have less commitment and intention to do grocery
shopping compared with those who have farther access to grocery shopping in less dense
areas. Moreover, those who reside near the city centre with longer road/km2 tend to be
dominated by high income households who may have a home assistant to do grocery
shopping on their behalf (Dharmowijoyo et al. 2015a, 2016a). On the other hand, residing
close to a dense trade area makes individuals perceive having a shorter travel time to reach
the grocery shops. At the same time, those residing in denser government office areas tend
to perceive longer travel times to grocery shop locations.
Regarding close interaction between day-to-day variability effect and geographical
constraints, it can be seen from Table 3 that a higher commitment and intention to
engage in grocery shopping correlates negatively with grocery shopping duration. As
highlighted by previous studies (e.g. Susilo et al. 2013), there is a trade-off between
shopping frequency and duration, and with the quantity and type of grocery shopping.
For top-up, routine grocery shopping, individuals do not need to spend long on the
activity. Participating in work/school and out-of-home leisure activities has a higher
impact in reducing the duration of grocery shopping compared to participation in in-
home activities. This may be due to individuals’ out-of-home time budget affecting the
trade-off between different activities’ duration and participation (Susilo and Avineri
2014; Ahmed and Stopher 2014).
Transportation (2018) 45:177–204 197
123
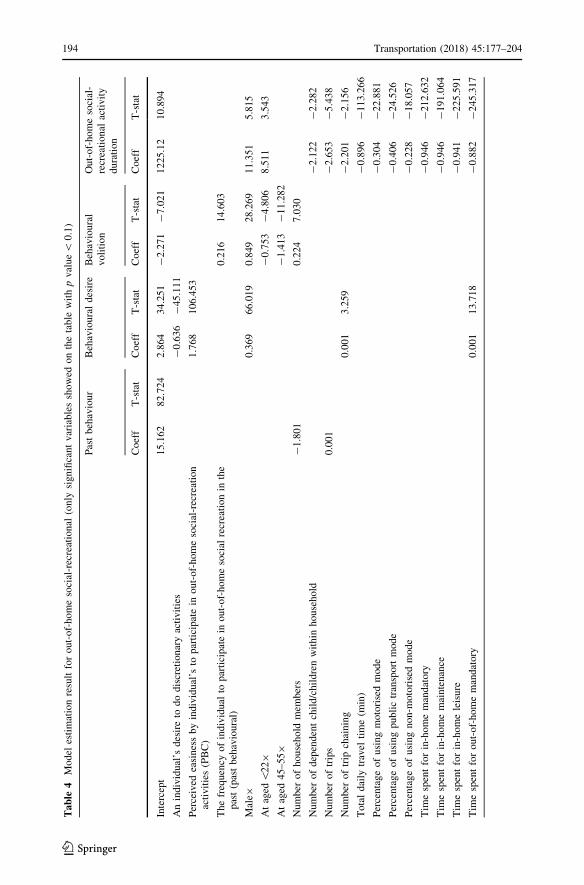
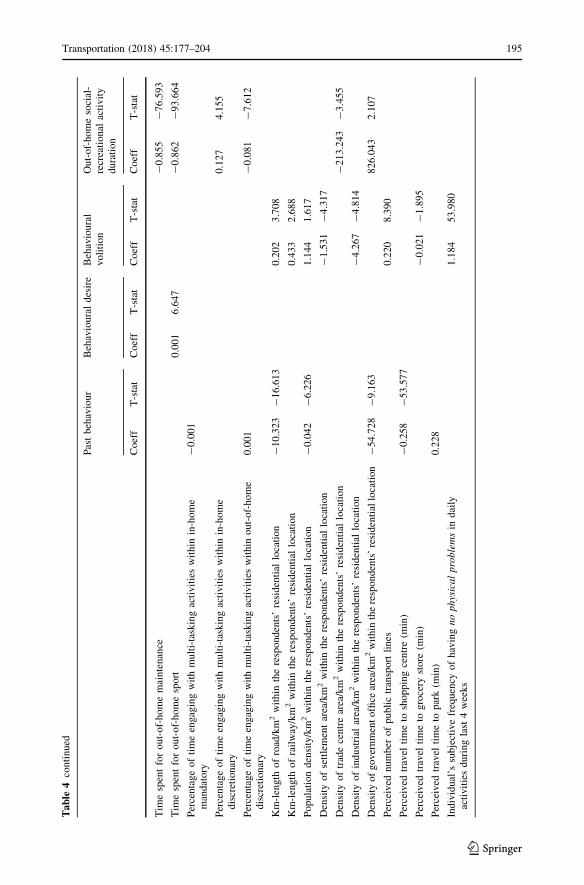
Time use for out-of-home social and recreational activities
Goal desire and perceived behavioural control, respectively, were found to negatively and
positively correlate with individuals’ motivation to undertake out-of-home social and
recreational activities. As shown in the estimation results in Table 4, different to grocery
shopping participation models, individuals tend to have different motivation to undertake
out-of-home social-recreation on different days due to differing day-to-day social situa-
tions and trip engagement. Those with longer work/school and out-of-home sport time, and
higher trip chains, tend to have a stronger motivation to do the activity.
However, the difference in social situation on different days does not influence indi-
viduals’ behaviour volition. As shown in Table 4, commitment and intention to do out-of-
home social-recreation is relatively time invariant on the given days. Commitment and
intention tends to be influenced by the geographic location of individuals’ home, past
behaviour, and general differences in social context between males and females, and senior
citizens and their younger counterparts.
Individuals who reside within a more populated area (population density higher than
10,000 people/km2), denser settlement and trade areas (above 55 and 2 % of the areas are
settlement and trade areas, respectively) tend to perceive a shorter travel time to the city
centre (around 22 min), while others perceive it to be 39 min. However, controlling for the
similarities/differences of population and settlement densities, and perceived average travel
time to the city centre, those living in more populated areas tend to have different com-
mitments and intentions to undertake out-of-home social-recreation to those living in
denser settlement areas. A more populous area would also contain kampongs which may be
resided in by more people within the same built area on a horizontal plane than real-estate
or non-kampongs areas (McCarthy 2003). More populous areas may have a denser set-
tlement area not only in the horizontal plane but also in the vertical plane (McCarthy
2003). Denser populated and mixed land use areas may contribute to the more populated
areas compared to denser settlement areas in the studied location, which tend to have more
formal and informal social contact via membership of religious organisations, civic
engagement, and neighbourhood interaction (Putnam 2001). Moreover, individuals who
reside in less populated areas with denser industry, tends to have a weaker commitment
and intention to undertake the activity than those from an area with a higher length of road/
km2.
Different to the grocery shopping model, out-of-home social recreation activity duration
was affected only by individuals’ time–space components. No psychological factors were
significant. A higher time allocation to in-home and out-of-home activities has a higher
impact on reducing individuals’ allocation to out-of-home social recreational activities
than to grocery shopping activities. Individuals in a developing country may define the
activity as more temporally flexible than grocery shopping (Dharmowijoyo et al. 2016a) in
contrast to the results in a developed country (Schwanen et al. 2008). Not materialising an
activity when having a strong commitment and intention to participate in the activity may
show how individuals deprioritise the activity due to having tighter time–space constraints
on a given day. Individuals who reside within dense government office areas tend to spend
longer in out-of-home social and recreational activities than those who live in denser trade
centre areas.
198 Transportation (2018) 45:177–204
123
Conclusions and discussion
Using a hierarchical SEM and a multi-dimensional 3-week household time-use and activity
diary, this study investigated the interaction of day-to-day variability of individuals’
activity time duration and trip engagements, built environment, socio-demographics with
non-instrumental factors on their grocery shopping and out-of-home social-recreational
activity participation. The estimation results showed that individual behaviour is a complex
interaction between daily time–space and subjective factors.
The results illustrate that individuals’ commitment and intention to do discretionary
activities and motivation to undertake grocery shopping tends to be time invariant. It is not
influenced by the difference of daily social situations represented by daily time allocation
to activity engagement. Different groups of individuals with different social roles in
general (Bird and Fremont 1991) tend to have a different commitment and intention to
undertake those activities. In BMA area or in developing country cases in general, it is
common that female and non-workers tend to have stronger motivation and volition to do
grocery shopping than males and workers. Females are likely to be non-workers in
developing country cases (Dharmowijoyo et al. 2014, 2015a, b). They have responsible to
do grocery shopping when males who are likely to be workers, have responsible to work.
Males and the ones from bigger households are also common to have stronger volition to
undertake social-recreation activities than female and the ones from smaller households,
respectively. Males tend to be workers who tend to have longer time allocation to work,
whilst the ones with bigger households tend to have more time to do maintenance activities
than smaller ones (Dharmowijoyo et al. 2015b, 2016a). However, individuals’ motivation
to engage in out-of-home social-recreational activities tends to vary on different days due
to having different social situations on different days. As expected, the different geo-
graphical situations tend to determine the strength/weakness of an individual’s commit-
ment and intention to perform both discretionary activities.
Integration between subjective factors and day-to-day time duration of activity partic-
ipation also reveals how individuals categorise a particular behaviour as a planned or
impulsive behaviour. An activity is considered as a planned behaviour/prioritised beha-
viour when having a strong commitment and intention to participate in certain activity
makes an individual tries to spare time to undertake the activity (Cullen and Godson 1975;
Cullen 1978; Golledge and Stimson 1997). Otherwise, when an individual deliberately
denies his/her strong commitment and intention to participate in the certain activity, thus
make him/her does not spare time and/or chooses to re-schedule the given activity, it may
be considered impulsive/lowly prioritised (Cullen and Godson 1975; Cullen 1978; Gol-
ledge and Stimson 1997). Understanding and accommodating activity prioritisation
mechanisms and the influence of individual’s non-instrumental variables towards them are
important for travel demand analysis and policy design.
Based on above definitions, different types of discretionary activity were found to have
different interaction patterns between individuals’ daily time–space constraints and their
psychological factors. Grocery shopping is a conscious activity with real consequences
(e.g. starving) rather than a habit. While participation in this activity is also subject to
individual time–space constraints, there is an indication of a trade-off between frequency
and duration regarding activities performed daily as also shown in the descriptive analysis
section. On the other hand, out-of-home social-recreational activity is a less urgent activity
that depends far more on an individual’s day-to-day time–space constraints than his/her
subjective characteristics. These results show how different constraints in developing
Transportation (2018) 45:177–204 199
123
constraints makes individuals tend to have a different prioritisation degree on many dis-
cretionary activities from developed country cases. Individuals may have a strong com-
mitment and intention to participate in out-of-home social-recreational activities (Anable
and Gatersleben 2005) every day to improve their well-being (Baron 2005) or rating of
good experiences within their certain life episodes (Rasouli and Timmermans 2014).
However, if the situation on a given day was not feasible for them to undertake out-of-
home social-recreation activity, they were more likely to reschedule the activity.
Recording multi-tasking tends to reveal how undertaking socialising activities as sec-
ondary activity within out-of-home discretionary activities (as primary) makes individuals
reduce their grocery shopping and/or out-of-home social-recreation time. It uncovers
individuals’ efforts to manage their participation in socialising activities within tighter time
schedules in conjunction with other activities as primary (Kenyon and Lyons 2007; Sul-
livan and Gershuny 2012) in order to improve their well-being (Baron 2005) and/or rating
of good experiences in a certain life episode (Rasouli and Timmermans 2014).
For policy implementation, ignoring either subjective factors or time–space components
may underestimate whether certain policy implementation may be needed/may not be
needed to provide more opportunities to undertake a particular behaviour. For example in
grocery shopping case, because participation in grocery shopping is subject to individuals’
commitment and intention to undertake such activity, and does not need a long time
allocation (only 13 min in average for the ones with higher behaviour volition and 17 min
in average for the counterpart) due to having accessible grocery shops in all areas of study
(grocery shops can be reached within 8 min of travel time in average in all areas),
implementation any time-use policies would not relatively influence increasing time
allocation to such activity. Maintaining the density of grocery shops is still applicable
policy in all type of areas in order to provide more accessible grocery shops particularly
within congested city such as BMA or other developing country cities. However,
unmanaged denser grocery shops can also raise traffic conflicts within a congested area as
BMA or other developing country cities and shut down some grocery shops. On contrary,
different from grocery shopping activities, time-use policies such as reducing time allo-
cation to in-home activities and working are still relevant policies to provide more
opportunities to allocate time for out-of-home social-recreation in developing country case.
Suggesting a more balanced life policy with balanced time to undertake household
activities, sleep, work/study, in-home and out-of-home activities (particularly out-of-home
leisure or social/recreation) is also indicated in this study which tend to correspond with
having better social and mental health in developed (Hunt et al. 2015) and developing
country cases (Dharmowijoyo et al. 2015b, 2016b). Furthermore, this study also reveals
that travel time reduction policies particularly for public transport will provide travellers
who reside in sub urban and greater area with higher opportunities to undertake out-of-
home social-recreation activities. Locating sub urban and greater area with more reachable
social-recreation activity destinations such as placing more parks or play grounds closer
with individuals’ residential locations may be able to provide more opportunities to
undertake out-of-home social-recreation activities.
Excluding one multi-dimensional factor would miss individuals’ complex decision
making process in undertaking a particular behaviour as noted in the hypotheses above.
Integrating time–space and subjective components would provide insight how individuals
put priority level on a particular behaviour, thus will help us to suggest better strategies or
policy implementations. This study also suggests solutions how we set our built envi-
ronment which meet with individuals’ efforts to satisfy their needs and desires. Moreover,
the travel and activity commitments of individuals are also subject of intra-household’s
200 Transportation (2018) 45:177–204
123
commitments and arrangements. The trade-off and altruism interactions between house-
hold members have not been taken into account in this study and are subject to future
study. Furthermore, relating how undertaking the discretionary activities behaviour with
health and/or well-being improvement efforts would also be the next possible step of the
studies.
Acknowledgments This paper is part of a doctoral research funded by the Ministry of Education ofIndonesia and the KTH Royal Institute of Technology.
Open Access This article is distributed under the terms of the Creative Commons Attribution 4.0 Inter-national License (http://creativecommons.org/licenses/by/4.0/), which permits unrestricted use, distribution,and reproduction in any medium, provided you give appropriate credit to the original author(s) and thesource, provide a link to the Creative Commons license, and indicate if changes were made.
References
Ahmed, A., Stopher, P.: Seventy minutes plus or minus 10—a review of travel time budget studies. Transp.Rev. 34(5), 607–625 (2014)
Ajzen, I.: The theory of planned behaviour. Organ. Behav. Hum. Decis. Process. 50, 179–211 (1991)Akar, G., Clifton, K.J., Doherty, S.T.: Discretionary activity location choice: in-home or out-of-home.
Transportation 38, 101–122 (2011)Anable, J.: ‘Complacent car addicts’ or ‘aspiring environmentalists identifying travel behaviour segments
using attitude theory. Transp. Policy 12, 65–78 (2005)Anable, J., Gatersleben, B.: All work and no play? the role of instrumental and affective factors in work and
leisure journeys by different travel modes. Transp. Res. Part A 39, 163–181 (2005)Arifwidodo, S.D.: Exploring the effect of compact development policy to urban quality of life in Bandung.
City Cult. Soc. 3, 303–311 (2012)Axhausen, K.W.: Activity spaces, biographies, social networks and their welfare gains and externalities:
some hypotheses and empirical results. Mobilities 2(1), 15–36 (2006)Baron, N.: Adjusting the volume: in-place and mobile dimensions of discourse control through technology.
In: Proceedings of Mobile Communication and the Network Society. Rutgers University, USA (2005)Bird, C.E., Fremont, A.M.: Gender, time use and health. J. Health Soc. Behav. 32(2), 114–129 (1991)Breusch, T.S.: Maximum likelihood estimation of random effects model. J. Econom. 36, 383–389 (1987)Carrasco, J.A., Miller, E.J.: Exploring the propensity to perform social activities: social networks approach.
Transportation 33, 463–480 (2006)Carrasco, J.A., Miller, E.J.: The social dimension in action: a multilevel, personal networks model of social
activity frequency. Transp. Res. Part A 43(1), 90–104 (2009)Chikaraishi, M., Fujiwara, A., Zhang, J., Axhausen, K., Zumkeller, D.: Changes in variations of travel time
expenditure. Transp. Res. Rec. 2230, 121–131 (2011)Circella, G., Mokhtarian, P.L., Poff, L.K.: A conceptual typology of multitasking behaviour and
polichronicity preferences. Int. J. Time Use Res. 9(1), 59–107 (2012)Cirillo, C., Axhausen, K.W.: Dynamic model of activity type choice and scheduling. Transportation 37(1),
15–38 (2010). (2012)Cullen, I.G.: The treatment of time in the explanation of spatial behaviour. In: Carlstein, T., Parkes, D.N.,
Thrift, N.J. (eds.) Time space and spacing time II: human activity and time geography, pp. 27–38.Edward Arnold, London (1978)
Cullen, I.G., Godson, V.: Urban networks: the structure of activity patterns. Prog. Plan. 4, 1–96 (1975)Dharmowijoyo, D.B.E., Susilo, Y.O., Karlstom, A.: Day-to-day inter- and intra-personal variability of
individual’s activity space in a developing country. Environ. Plann. B 41, 1063–1076 (2014)Dharmowijoyo, D.B.E., Susilo, Y.O., Karlstrom, A.: The day-to-day variability in travellers’ activity-travel
patterns in the Jakarta Metropolitan Area. Transportation (2015a). doi:10.1007/s11116-015-9591-4Dharmowijoyo, D.B.E., Susilo, Y.O., Karlstom, A.: Collecting a multidimensional three-weeks household
time-use and activity diary in the Bandung Metropolitan Area. Transp. Res. Part A 80, 231–246(2015b)
Transportation (2018) 45:177–204 201
123
Dharmowijoyo, D.B.E., Susilo, Y.O., Karlstom, A.: Relationships among activity duration, travel time spentand activity space indices in the Jakarta Metropolitan Area, Indonesia. J. Transp. Geogr. 54, 148–160(2016a)
Dharmowijoyo, D.B.E., Susilo, Y.O., Karlstom, A.: Analysing the complexity of day-to-day an individual’sactivity-travel pattern using multi-dimensional sequence alignment method: a case study in BandungMetropolitan Area. Indonesia. In: Accepted for Presentation at the 95th Annual Meeting of theTransport Research Board (2016b)
Dijst, M., Farag, S., Schwanen, T.: A comparative study of attitude theory and other theoretical models forunderstanding travel behaviour. Environ. Plan. A 40, 831–847 (2008)
Dijst, M., Rietveld, P., Steg, L.: Individual needs, opportunities and travel behaviour: a multidisciplinaryperspective based on psychology, economics and geography. In: Wee, B., Annema, J.A., Banister, D.(eds.) The Transport System and Transport Policy, pp. 19–50. Edward Elgar Publishing, Massachusetts(2009)
Garling, T., Axhausen, K.W.: Introduction: habitual travel choice. Transportation 30, 1–11 (2003)Garling, T., Fujii, S., Boe, O.: Empirical test of a model of determinants of script-based driving choice.
Transp. Res. Part F 4, 89–102 (2001)Golledge, R.G., Stimson, R.J.: Spatial Behaviour. The Guilford Press, New York (1997)Greene, W.: Econometric Analysis. Prentice Hall, New Jersey (1993)Gujarati, D.: Basic Econometric. McGrawHill, Boston (2003)Hagerstrand, T.: What about people in regional sciences? Reg. Sci. Assoc. 247(21), 7–21 (1970)Handy, S., Cao, X., Mokhtarian, P.: Correlation or causality between the built environment and travel
behavior? evidence from Northern California. Transp. Res. Part D 10, 427–444 (2005)Hansen, C.B.: Inference in linier panel data models with serial correlation and an essay on the impact of
401(k) participation on the wealth distribution. Ph.D. Dissertation. Massachusetts Institute of Tech-nology (2004)
Heinen, E., Chatterjee, K.: The same mode again? exploration of mode choice variability in Great Britainusing the National Travel Survey. Transp. Res. Part A 78, 266–282 (2015)
Hunt, E., McKay, E.A., Dahly, D.L., Fitzgerald, A.P., Perry, I.J.: A person-centred analysis of the time use,daily activities, and health related quality of life of Irish school-going late adolescent. Qual. Life Res.24, 1303–1315 (2015)
Joewono, T.B., Kubota, H.: User perception of private paratransit operation in Indonesia. J. Public Transp.10(4), 99–118 (2007a)
Joewono, T.B., Kubota, H.: User satisfaction with paratransit in competition with motorization in Indonesia:anticipation of future implications. Transportation 34(3), 337–354 (2007b)
Joh, C.H., Arentze, T., Hofman, F., Timmermans, H.J.P.: Activity pattern similarity: a multidimensionalalignment method. Transp. Res. Part B 36, 385–403 (2002)
Kang, H., Scott, D.M.: Exploring day-to-day variability in time use for household members. Transp. Res.Part A 44, 609–619 (2010)
Kang, H., Scott, D.M., Doherty, S.T.: An investigation of planning priority of joint activities in thehousehold activity scheduling process. Transp. Res. Rec. 2134, 82–88 (2009)
Kenyon, S.: What do we mean by multitasking? exploring the need for methodological clarification in time-use research. Int. J. Time Use Res. 7(1), 609–619 (2010)
Kenyon, S., Lyons, G.: Introducing multitasking to the study of travel and ICT. Transp. Res. Part A 41,161–175 (2007)
Lee, Y., Hickman, M., Washington, S.: Household type and structure, time use pattern, and trip chainingbehaviour. Transp. Res. Part A 41, 1004–1020 (2007)
Lewin, K.: Principles of topological psychology. McGraw-Hill, New York (1936)Marion, R.: The Edge of Organization: Chaos and Complexity Theories of Formal Social Systems. Sage,
Thousand Oaks (1999)McCarthy, P.: Understanding slumps: case studies for the global report on human settlements. World Bank
(2003)McDonald, W.J.: Time use in shopping: the role of personal characteristics. J. Retail. 70(4), 345–365 (1994)Meloni, I., Guala, L., Loddo, A.: Time allocation to discretionary in-home, out-of-home and to trips.
Transportation 31, 69–96 (2004)Miller, H.J.: A measurement theory for time geography. Geograph. Anal. 37, 17–45 (2005)Moiseeva, A., Timmermans, H.J.P., Choi, J., Joh, C.H.: Sequence alignment analysis of activity-travel
pattern’s variability using eight weeks’ diary data. Transp. Res. Rec. 2412, 49–56 (2014)Paccione, M.: Urban environment quality and human wellbeing—a social geographical perspective. Landsc.
Urban Plan. 65, 19–30 (2003)
202 Transportation (2018) 45:177–204
123
Pendyala, R.M., Yamamoto, T., Kitamura, R.: On the formulation of time–space prisms to model constraintson personal activity-travel engagement. Transportation 29, 73–94 (2002)
Perugini, M., Bagozzi, R.P.: The role of desires and anticipated emotions in goal-directed behaviours:broadening and deepening the theory of planned behaviour. Br. J. Soc. Psychol. 40, 79–98 (2001)
Perugini, M., Conner, M.: Predicting and understanding behavioural volitions: the interplay between goaland behaviours. Eur. J. Soc. Psychol. 30, 705–731 (2000)
Putnam, R.D.: Bowling Alone: The Collapse and Revival of American Community. Simon and Schuster,New York (2001)
Ramalingam, B., Jones, H., Reba, T., Young, J.: Exploring the science of complexity: ideas and implicationsfor development and humanitarian efforts. Working Paper 285, Results of ODI Research (2008)
Rasouli, S., Timmermans, H.: Judgements of travel experiences, activity envelopes, trip features and multi-tasking: a panel effects regression model specification. Transp. Res. Part A 63, 65–75 (2014)
Raux, C., Ma, T.Y., Cornelis, E.: Variability and anchoring points in weekly activity-travel patterns. In:Transportation Research Board 91st Annual Meeting, Washington (2012)
Schlich, R., Axhausen, K.W.: Habitual travel behaviour: evidence from a six-week diary. Transportation30(1), 13–36 (2003)
Schwanen, T., Kwan, M.P., Ren, F.: How fixed is fixed? gendered rigidity of space–time constraints andgeographies of everyday activities. Geoforum 39, 2109–2121 (2008)
Snijders, T.A.B., Bosker, A.J.: Multilevel Analysis: An Introduction to Basic and Advanced MultilevelModelling. Sage, London (1999)
Stauffacher, M., Schlich, R., Axhausen, K.W., Scholz, R.W.: The diversity of travel behaviour: motives andsocial interactions in leisure time activities. Arbeitsberichte Verkehr-und Raumplanung. 30x. IVT.ETH Zurich, Zurich (2005). http://www.ivt.ethz.ch/vpl/publications/reports/ab328.pdf
Sullivan, O., Gershuny, J.: Domestic outsourcing and multitasking: how much do they really contribute?Sociology Working Papers, Department of Sociology, University of Oxford (2012)
Susilo, Y.O.: Paratransit. In: Button, K., Nijkamp, P., Vega, H. (eds.) A Dictionary of Transport Analysis.Edward Elgar Publishing, Cheltenham (2011)
Susilo, Y.O., Avineri, A.: The impacts of household structure to the day-to-day variability of individual andhousehold stochastic travel time budget. J. Adv. Transp. 48, 454–470 (2014)
Susilo, Y.O., Axhausen, K.W.: Stability in individual daily activity-travel-location patterns: a study usingthe Herfindahl–Hirschman Index. Transportation 41, 995–1011 (2014)
Susilo, Y.O., Liu, C.: Examining the relationships between individual’s travel, in-home and out-of-homeactivities and their physical, mental and social health indicators: case study in the BandungMetropolitan Area, Indonesia. In: Paper Submitted to the World Conference on Transport Research,Shanghai (2016)
Susilo, Y.O., Joewono, T.B., Santosa, W.: An exploration of public transport users’ attitudes and preferencestowards various policies in Indonesia. J. East. Asia Soc. Transp. Stud. 8, 1202–1216 (2010)
Susilo, Y.O., Hanks, N., Ullah, M.: An exploration of shoppers travel mode choice in visiting conveniencestores in the UK. J. Transp. Plan. Technol. 36(8), 669–684 (2013)
Susilo, Y.O., Joewono, T.B., Vandebona, U.: Investigating the reasons underlie repetitive traffic violationsbehaviours among motorcyclists. J. Accid. Anal. Prev 75, 272–284 (2015)
Suzukamo, Y., Fukuhara, S., Green, J., Kosinski, M., Gandek, B., Ware, J.E.: Validation testing of three-component model of short form-36 scores. J. Clin. Epidemiol. 64, 301–308 (2011)
Tarigan, A.K., Susilo, Y.O., Joewono, T.B.: Segmentation of paratransit users based on service quality andtravel behaviour in Bandung, Indonesia. J. Transp. Plan. Technol. 37(2), 200–218 (2014)
Tarigan, A.K., Sagala, S., Samsura, D.A.A., Fisabilillah, D.F., Simarmata, H.A., Nababan, M.: BandungCity, Indonesia. Cities 50, 100–110 (2016)
Thomson, J.A., Shaw, D., Shiu, E.: An empirical examination of goal desire and emotion in the context ofsmoking cessation. ANZMAC, 1–8 (2009)
Urry, J.: The complexities of global. Theory Cult. Soc. 22(5), 235–254 (2005)Van Acker, V., Wee, B., Witlox, F.: When transport geography meets social psychology: toward a con-
ceptual model of travel behaviour. Transp. Rev. 37(2), 219–240 (2011)Weick, K.: Education organizations as loosely coupled systems. Adm. Sci. Q. 21, 1–9 (1976)Yamamoto, T., Kitamura, R.: An analysis of time allocation to in-home and out-of-home discretionary
activities across working days and non-working days. Transportation 26, 211–230 (1999)Zhang, J: Urban forms and health promotion: an evaluation based on health-related QOL indicators. In: 13th
World Conference on Transport Research (WCTR) (2013)
Transportation (2018) 45:177–204 203
123
Dimas B. E. Dharmowijoyo is a lecturer in Civil Engineering of Institute of Technology and Science,Bandung, Indonesia. He is investigating the complexity of individuals’ everyday mobility. He is trying tofigure out how multi-dimensional factors interconnected and interrelated with each other in shaping thecomplexity of individuals’ decision making process and activity-travel patterns, thus influence transport andurban planning, and policy.
Yusak O. Susilo is an Associate Professor in Transport Analysis and Policy at the KTH Royal Institute ofTechnology. Sweden. His main research interest lies in the intersection between transport and urbanplanning, transport policy, decision making processes and behavioural interactions modelling.
Anders Karlstrom is a Professor in Transport and Economics at the KTH Royal Institute of Technology.Sweden. His research interests include transport analysis and planning, behavioural economics, discretechoice and econometrics.
204 Transportation (2018) 45:177–204
123