Embed Size (px)
Citation preview

On improving the Performance of Multimodal biometric
authentication through Ant colony optimization
L.LATHA1
and S.THANGASAMY2
1Dept of CSE, Kumaraguru College of Technology, Coimbatore, Tamilnadu, INDIA
2R & D, Kumaraguru College of Technology, Coimbatore, Tamilnadu, INDIA
Abstract: - Multimodal biometric authentication systems are now widely used for providing the utmost security
owing to its better recognition performance compared to unimodal systems. Multimodal biometric systems are
developed by combining the information of individual biometrics. In this paper, a multimodal biometric system
is proposed by combining the scores of iris and palm print traits of a person. This information fusion takes
place at the matching score level, due to the ease in accessing and combining the scores generated by the two
different matchers. Since the matching scores output by the two modalities are heterogeneous, score
normalization is needed to transform these scores into a common domain, prior to combining them. The
normalized values are then applied to various score fusion methods. The resulting scores are compared to a
threshold value for taking a decision of accepting or rejecting the person. The recognition accuracy of fusion
methods strongly depend upon the correctness of this threshold value. Hence we propose Ant colony
optimization (ACO) technique for selecting the optimal threshold value for each of the fusion method
employed. This approach further enhances the accuracy of the system compared to the fusion methods with no
optimal threshold. The experimental results obtained using CASIA iris and palm print databases show that the
application of ACO results in higher recognition rates and lower error rates. To the best of our knowledge, it is
the first work that applies ACO to enhance the accuracy of biometric authentication process.
Key-Words: - ACO, Biometrics, Multimodal, Normalization, Product, Score fusion, Sum
1 Introduction Biometrics refers to the measurement and analysis
of physical and behavioural traits of humans with a
goal of verifying or determining the identity of
humans. It provides a more authentic alternative to
establish identity as compared to passwords, ID
cards, etc. which can be stolen or passed on to
others fairly easily. A biometric characteristic
should have the following characteristics to be truly
useful in real scenarios: universality, uniqueness,
permanence, collectability, acceptability and
difficult to circumvent [1]. It may not be possible
for a single biometric to have all the above
mentioned desirable properties. This has led to the
research in multi-biometric systems that rely on
fusing information from multiple biometric
evidences. Fusion of multiple biometric
characteristics has been shown to increase accuracy
while decreasing the vulnerability to spoofing. In
addition, use of multiple biometrics provides a
better coverage of population to deal with situations
like indistinguishable unimodal biometric
characteristics.
In a multimodal recognition system, information
can be integrated at various levels: feature
extraction level, matching score level and decision
level [2]. Fusion at the feature extraction level
combines different biometric features in the
recognition process. Score fusion matches the
individual scores of different recognition systems to
obtain a multimodal score. Decision level systems
perform logical operations upon the unimodal
system decisions to reach a final resolution. A
matching score level fusion system consist of two
steps: normalization and fusion [3]. The
normalization process converts the scores of
different traits to a comparable range of values.
Without this step, a biometric with a higher range
could eliminate the contribution of another with a
lower one.
Ant colony optimization (ACO) searches for an
optimal path in a graph, based on the behavior
of ants seeking a path between their colony and a
source of food [4]. In the natural world, ants
(initially) wander randomly, and upon finding food
return to their colony while laying down pheromone
trails. If other ants find such a path, they are likely
WSEAS TRANSACTIONS on INFORMATION SCIENCE and APPLICATIONS L. Latha, S. Thangasamy
ISSN: 1790-0832 453 Issue 12, Volume 8, December 2011

not to keep travelling at random, but to instead
follow the trail, returning and reinforcing it if they
eventually find food. However, the pheromone trail
starts to evaporate, thus reducing its attractive
strength. The more time it takes for an ant to travel
down the path and back again, the more time the
pheromones have to evaporate.
A short path, by comparison, gets marched over
more frequently, and thus the pheromone density
becomes higher on shorter paths than longer ones
[5]. Pheromone evaporation also has the advantage
of avoiding the convergence to a locally optimal
solution. If there were no evaporation at all, the
paths chosen by the first ants would tend to be
excessively attractive to the following ones. Thus,
when one ant finds a good (i.e., short) path from the
colony to a food source, other ants are more likely
to follow that path, and positive feedback eventually
leads all the ants following a single path. The idea
of the ant colony algorithm is to mimic this behavior
with simulated ants walking around the graph
representing the problem to solve. Thus an ACO is
employed to dynamically select the appropriate
decision threshold to minimize the error rate and
increase the performance compared to fusion
results. Here in ACO, ants move continuously to
choose the best threshold through the shortest path.
2 Existing work Many researchers have demonstrated that fusion is
effective in the sense that the fused scores provide
much better discrimination between the inter and
intra classes than the individual scores. Several
recent papers have compared various techniques on
empirical data. Some of the important works are
enumerated below:
In [6] several classifier combination rules were
evaluated on frontal face, face profile, and voice
biometrics (using a database of 37 subjects). They
found that the “sum of a posteriori probabilities”
rule outperformed the product, min, max, median,
and majority of a posteriori probability rules (at
EER) due to its resilience to errors in the estimation
of the densities. In [7] they evaluated five binary
classifiers on combinations of three face and voice
modalities (database of 295 subjects). They found
that a support vector machine and Bayesian
classifier achieved almost the same performances;
and both outperformed Fisher’s linear discriminant,
a C4.5 decision tree and a multilayer perceptron. [8]
found that a support vector machine outperformed
(at EER) the sum of normalized scores when fusing
face, fingerprint and signature biometrics (database
of 100 subjects and 50 chimeras). In [9] the sum of
scores, max-score, and min-score fusion methods
were applied to normalized scores of face,
fingerprint and hand geometry biometrics (database
of 100 users, based on a fixed TAR). The
normalized scores were obtained by using one of the
following techniques: simple distance-to-similarity
transformation with no change in scale (STrans),
min–max, z-score, median-MAD, double sigmoid,
tanh, and Parzen. They found that the min–max, z-
score, and tanh normalization schemes followed by
a simple sum of scores outperformed other methods;
tanh is better than min-max and z-score when
densities are unknown; and optimizing the
weighting of each biometric on a user-by-user basis
outperforms generic weightings of biometrics.
Authors in [10] compared combinations of z-
score, min-max, tanh and adaptive (two-quadrics,
logistic and quadric-line-quadric) normalization
methods and simple sum, min score, max score,
matcher weighting, and user weighting fusion
methods. They found that fusing COTS fingerprint
and face biometrics does outperform unimodal
COTS systems, but the high performance of
unimodal COTS systems limits the magnitude of the
performance gain; for open-population applications
(e.g., airports) with unknown posterior densities,
min-max normalization and simple-sum fusion are
effective; for closed-population applications (e.g. an
office), where repeated user samples and their
statistics can be accumulated, QLQ adaptive
normalization and user weighting fusion methods
are effective. [11] compared various parametric
techniques on the BSSR1 dataset. That study
showed that the Best Linear technique performed
consistently well, in sharp contrast to many
alternative parametric techniques, including simple
sum of z-scores, Fisher’s linear discriminant
analysis, and an implementation of sum of
probabilities based on a normal (Gaussian)
assumption. [4] published the first ant colony
algorithm to solve the well-known traveling
salesman problem. [12] recently presented an ant-
based algorithm for obtaining a degree-constrained
minimum spanning tree. Their algorithm consists of
two stages, exploration and construction. In the
exploration stage, each node is assigned an ant, and
all ants move around to discover low-cost edges.
Low-cost edges thus receive intensive visits and
high pheromone levels. In the construction stage, a
number of high-pheromone edges are picked out
and sorted in ascending order of edge cost. A
degree-constrained minimum spanning tree is then
constructed from the selected edges using a version
of the Kruskal’s algorithm.
WSEAS TRANSACTIONS on INFORMATION SCIENCE and APPLICATIONS L. Latha, S. Thangasamy
ISSN: 1790-0832 454 Issue 12, Volume 8, December 2011
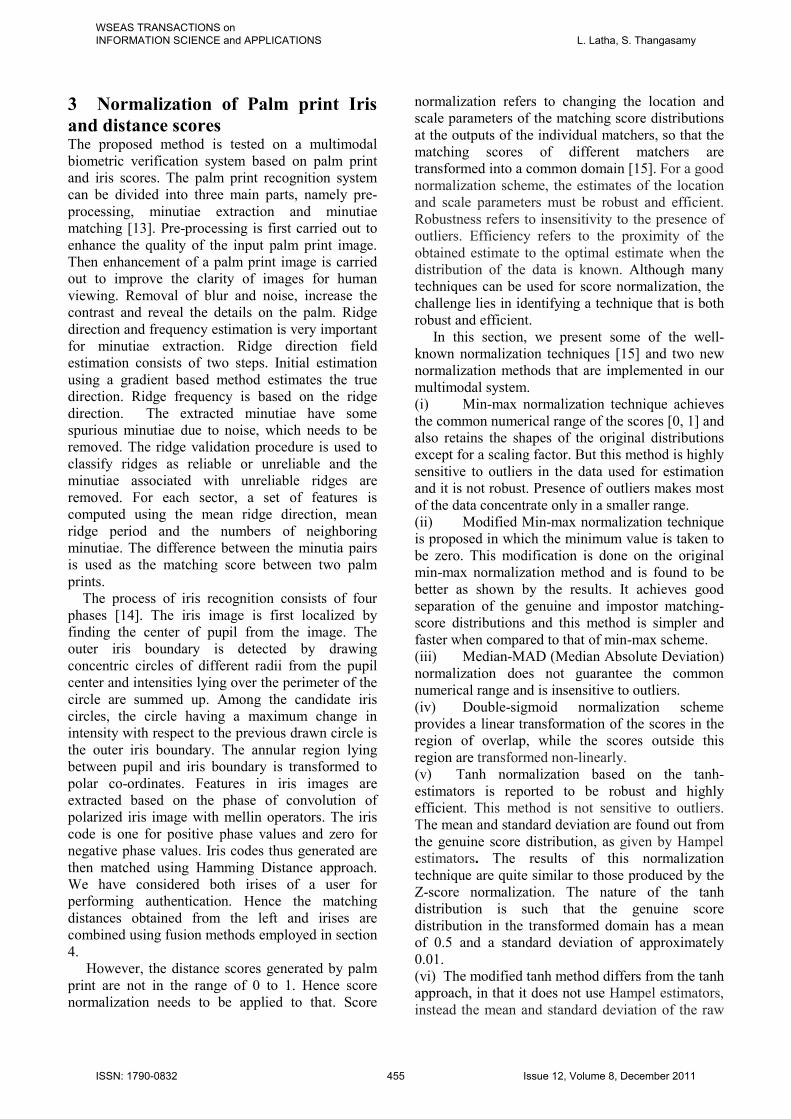
3 Normalization of Palm print Iris
and distance scores The proposed method is tested on a multimodal
biometric verification system based on palm print
and iris scores. The palm print recognition system
can be divided into three main parts, namely pre-
processing, minutiae extraction and minutiae
matching [13]. Pre-processing is first carried out to
enhance the quality of the input palm print image.
Then enhancement of a palm print image is carried
out to improve the clarity of images for human
viewing. Removal of blur and noise, increase the
contrast and reveal the details on the palm. Ridge
direction and frequency estimation is very important
for minutiae extraction. Ridge direction field
estimation consists of two steps. Initial estimation
using a gradient based method estimates the true
direction. Ridge frequency is based on the ridge
direction. The extracted minutiae have some
spurious minutiae due to noise, which needs to be
removed. The ridge validation procedure is used to
classify ridges as reliable or unreliable and the
minutiae associated with unreliable ridges are
removed. For each sector, a set of features is
computed using the mean ridge direction, mean
ridge period and the numbers of neighboring
minutiae. The difference between the minutia pairs
is used as the matching score between two palm
prints.
The process of iris recognition consists of four
phases [14]. The iris image is first localized by
finding the center of pupil from the image. The
outer iris boundary is detected by drawing
concentric circles of different radii from the pupil
center and intensities lying over the perimeter of the
circle are summed up. Among the candidate iris
circles, the circle having a maximum change in
intensity with respect to the previous drawn circle is
the outer iris boundary. The annular region lying
between pupil and iris boundary is transformed to
polar co-ordinates. Features in iris images are
extracted based on the phase of convolution of
polarized iris image with mellin operators. The iris
code is one for positive phase values and zero for
negative phase values. Iris codes thus generated are
then matched using Hamming Distance approach.
We have considered both irises of a user for
performing authentication. Hence the matching
distances obtained from the left and irises are
combined using fusion methods employed in section
4.
However, the distance scores generated by palm
print are not in the range of 0 to 1. Hence score
normalization needs to be applied to that. Score
normalization refers to changing the location and
scale parameters of the matching score distributions
at the outputs of the individual matchers, so that the
matching scores of different matchers are
transformed into a common domain [15]. For a good
normalization scheme, the estimates of the location
and scale parameters must be robust and efficient.
Robustness refers to insensitivity to the presence of
outliers. Efficiency refers to the proximity of the
obtained estimate to the optimal estimate when the
distribution of the data is known. Although many
techniques can be used for score normalization, the
challenge lies in identifying a technique that is both
robust and efficient.
In this section, we present some of the well-
known normalization techniques [15] and two new
normalization methods that are implemented in our
multimodal system.
(i) Min-max normalization technique achieves
the common numerical range of the scores [0, 1] and
also retains the shapes of the original distributions
except for a scaling factor. But this method is highly
sensitive to outliers in the data used for estimation
and it is not robust. Presence of outliers makes most
of the data concentrate only in a smaller range.
(ii) Modified Min-max normalization technique
is proposed in which the minimum value is taken to
be zero. This modification is done on the original
min-max normalization method and is found to be
better as shown by the results. It achieves good
separation of the genuine and impostor matching-
score distributions and this method is simpler and
faster when compared to that of min-max scheme.
(iii) Median-MAD (Median Absolute Deviation)
normalization does not guarantee the common
numerical range and is insensitive to outliers.
(iv) Double-sigmoid normalization scheme
provides a linear transformation of the scores in the
region of overlap, while the scores outside this
region are transformed non-linearly.
(v) Tanh normalization based on the tanh-
estimators is reported to be robust and highly
efficient. This method is not sensitive to outliers.
The mean and standard deviation are found out from
the genuine score distribution, as given by Hampel
estimators. The results of this normalization
technique are quite similar to those produced by the
Z-score normalization. The nature of the tanh
distribution is such that the genuine score
distribution in the transformed domain has a mean
of 0.5 and a standard deviation of approximately
0.01.
(vi) The modified tanh method differs from the tanh
approach, in that it does not use Hampel estimators,
instead the mean and standard deviation of the raw
WSEAS TRANSACTIONS on INFORMATION SCIENCE and APPLICATIONS L. Latha, S. Thangasamy
ISSN: 1790-0832 455 Issue 12, Volume 8, December 2011

scores is considered. Hence the complexity involved
in the usage of Hampel estimators is eliminated.
Thus it is faster and simpler method.
The normalized matching scores from both palm
print and iris modules are then combined into a
unique score using different fusion methods as
given in the section 4. Based on this matching score,
a suitable threshold is selected and decision about
whether to accept or reject a user is made.
4 Score level fusion methods adopted
in our system Score level fusion is commonly preferred in
multimodal biometric systems because matching
scores contain sufficient information to make
genuine and impostor case distinguishable and they
are relatively easy to obtain. Therefore, combining
information obtained from individual modalities
using score level fusion seems both feasible and
practical [15]. In general, score level fusion
techniques can be divided into three categories as
follows [16], [17]: transformation-based score level
fusion (e.g. sum-rule based fusion), classifier-based
score level fusion (e.g. SVM based fusion) and
density-based score level fusion (e.g. likelihood
ratio test with Gaussian Mixture Model). The
following fusion methods [15] are evaluated using
the iris and palm print traits.
4.1 Mean fusion The matching scores of the traits palm print and iris
are combined by taking their mean value. Thus the
final score SFinal is given by,
SFinal=(a*SIRIS-R+b*SPALM+c*SIRIS-L)/3 (1)
where SIRIS-R = matching score of right iris, SPALM =
matching score of palm print, SIRIS-L = matching
score of left iris and a, b, c are the weights assigned
to the various traits. Currently, equal weightage is
assigned to each trait so that the value of (a+b+c) is
one. The final matching score (SFinal) is compared
against a certain threshold value to recognize the
person as genuine or imposter.
4.2 Min fusion This fusion method chooses the minimum of the
different unimodal scores as the multimodal score
value. Thus the final score is given by,
SFinal = min (SIRIS-R , SPALM , SIRIS-L) (2)
4.3 Max fusion This fusion method chooses the maximum of the
different unimodal scores as the multimodal score
value. Thus the final score is given by,
SFinal = max (SIRIS-R , SPALM , SIRIS-L) (3)
4.4 Sum fusion This rule assumes that the posteriori probabilities
computed by the individual classifiers do not
deviate much from the prior probabilities. It is
applicable when there is a high level of noise
leading to ambiguity in the classification problem.
The sum of the matching scores of the traits, MSFinal
is given by,
SFinal = SIRIS-R + SPALM + SIRIS-L (4)
4.5 Product fusion In general, different biometric traits of an individual
are mutually independent. This allows us to make
use of the product rule in a multimodal biometric
system based on the independence assumption. The
product of the matching scores of the traits is given
by
SFinal = SIRIS-R * SPALM * SIRIS-L (5)
4.6 Tanh fusion The traits are combined by taking the tan hyperbolic
sum of the matching scores. Thus the final score
MSFinal is given by,
SFinal= tanh (SIRIS-R)+tanh(SPALM)+tanh(SIRIS-L) (6)
4.7 Median fusion This fusion method chooses the median value of the
different unimodal scores as the multimodal score
value. Thus the final score is given by,
SFinal = median (SIRIS-R , SPALM , SIRIS-L) (7)
5 Ant Colony Optimization The main aim of an optimization technique is to
obtain an optimal result, either to maximize or to
minimize a function by systematically choosing
values within an allowed given set. Ant colony
optimization mimics the behaviour of ants that
deposit pheromones along the paths in which they
move when foraging [18]. The pheromone level
deposited on a particular path rises with the number
of ants passing through that path. Ants adopt
pheromones to communicate and cooperate with
each another to identify shorter paths to the food
WSEAS TRANSACTIONS on INFORMATION SCIENCE and APPLICATIONS L. Latha, S. Thangasamy
ISSN: 1790-0832 456 Issue 12, Volume 8, December 2011

source. Ants select the next node to visit using a
combination of heuristic and pheromone
information.
Based on the fused score of iris and palm print,
an optimal threshold value is found out dynamically
using ACO. This decision threshold is then used for
obtaining the recognition rate and error rate. It is
found that ACO minimizes the error rate and
increase the performance compared to the ordinary
fusion methods.
Let q0 is an predetermined parameter in [0, 1]
and if a random number q ≤ q0, then an ant at node
vr selects its next node vs. The pheromone level on
edge (r,s) is given by,
τrs(ηrs)β = max{ τrj(ηrj)
β} (8)
where ηrj is a heuristic function defined as the
reciprocal of the cost cij associated with the edge (i,
j); Ji denotes the set of nodes that remain to be
visited by the ant at node mi; β denotes the relative
importance between the pheromone level and the
edge cost, and q0 represents the relative significance
of exploitation and exploration. A greater value of
q0 means that the system performed more
exploitation and less exploration. If q > q0, then vs is
randomly selected from Jr according to the
probability distribution given by
prk = Σ τrk(ηrk)β / τrj(ηrj)
β, if vk Є jr (9)
= 0, otherwise
After an ant has completed its tour, the
pheromones on the edges of that tour are updated by
the local updating rule to prevent succeeding ants
from searching in the neighborhood of the currently
best tour. The rule for this operation is defined as
τrj ← (1-ρ) τrj + ∆ρτ (10)
where 0 < ρ < 1 is a parameter representing the local
pheromone evaporation rate, and ∆τ represents the
variation in pheromone, which is set to be the initial
pheromone level τ0. Once all ants have completed
their tours, the pheromones on all edges of the graph
are updated by the global updating rule to accelerate
searching the best solution. The global updating rule
enhances the edges involved in the globally best
tour, and is defined as
τrj ← (1- α) τrj + ατgb (11)
where 0 < α < 1 denotes the global pheromone
evaporation rate. This ACO mechanism is now
applied to fusion algorithms in order to find the
optimal threshold value. It is the value at which the
genuine acceptance rate (GAR) is the maximum and
false rejection rate (FRR) is the minimum. Hence
the proposed method gives the best solution for our
multimodal biometric system.
6 Databases used in the
experimentation Database containing palm print and iris samples is
required to evaluate the performance of our
multimodal system. Hence CASIA iris and palm
print image databases are used. A “chimerical”
multimodal database is created using pairs of
artificially matched palm and iris samples. CASIA
IrisV3 [19] database includes three subsets which
are labelled as CASIA-IrisV3-Interval, Lamp and
Twins. CASIA-IrisV3 contains a total of 22,035 iris
images from more than 700 subjects. All iris images
are 8 bit gray-level JPEG files, collected under near
infrared illumination with a resolution of 320 x 280.
Almost all subjects are Chinese except a few in
CASIA-Iris V3-Interval. Iris images were captured
with self-developed iris camera and most of the
images were captured in two sessions, with at least
one month interval. It contains 2639 iris images
from 249 subjects. From this, a database consisting
of 100 subjects was constructed with each 5 samples
per user. Thus, 500 (100×5) genuine score vectors
and 49,500 (100×5×99) impostor score vectors were
obtained from this database.
CASIA Palm print Image Database [20] contains
5,502 palm print images captured from 312 subjects.
For each subject, palm print images from both left
and right palms are collected. All palm print images
are 8 bit gray-level JPEG files and the samples were
collected in one session only. From this, a database
consisting of 100 subjects was constructed with
each 5 samples per user. The biometric data
captured from every user is compared with that of
all the users in the database leading to one genuine
score vector and 99 impostor score vectors for each
distinct input. Thus, 500 (100×5) genuine score
vectors and 49,500 (100×5×99) impostor score
vectors were obtained from this database. Assuming
the independence of the three modalities, we create
100 “virtual” users by combining the subjects from
the two databases. Merging the scores from the
above two databases resulted in 1000 genuine score
vectors and 99,000 impostor score vectors. A score
vector is a 3-tuple, corresponding to the matching
scores obtained from the left iris, right iris and palm
print matchers respectively.
7 Experimental results and Discussion Performance of the proposed multimodal biometric
system has been studied under different
normalization and fusion techniques. Any system
can make two types of errors. The first type of error
is false acceptance where an impostor is accepted
WSEAS TRANSACTIONS on INFORMATION SCIENCE and APPLICATIONS L. Latha, S. Thangasamy
ISSN: 1790-0832 457 Issue 12, Volume 8, December 2011

wrongly. The second error is false rejection where a
genuine client is wrongly rejected. The trade-off
between these error rates namely, FAR and FRR can
be graphically represented by a Receiver Operating
Characteristics (ROC) plot [21]. To quantify the
performance into a single number, Equal Error Rate
(EER) is often used which represents the error rate
when FAR is equal to FRR. The distance score ‘d’
between the stored template and test image is
computed for each of the trait and is compared with
an acceptance threshold ‘t’ and if d is greater than or
equal to t, then the compared samples belong to a
different person. Pairs of biometric samples
generating scores lower than t belongs to the same
person. Thus the distribution of scores generated
from pairs of samples from different persons is
called an impostor distribution, and the score
distribution generated from pairs of samples of the
same person is called a genuine distribution. Figure
1 shows three ROC graphs obtained from the above
multimodal biometric verification system using
different normalization techniques and fusion
methods. Table 1 shows the recognition rates and
error rates obtained from all the normalization and
fusion techniques employed in this work. The table
also shows the optimal threshold values obtained for
different fusion methods by using ACO. These
threshold values enhance the accuracy of the system
very well as shown in the last column of the table.
0 0.02 0.04 0.06 0.08 0.1 0.12 0.14 0.160.84
0.86
0.88
0.9
0.92
0.94
0.96
0.98
1
FAR
GAR
iris left
iris right
palm original
org tanh
minmax
zscore
logistic
mod tanh
median mad
mod minmax
0 0.05 0.1 0.150
0.05
0.1
0.15
FAR
FRR
iris left
iris right
palm original
org tanh
median mad
minmax
mod minmax
zscore
logistic
mod tanh
Fig. 1(a) Max fusion
0 0.02 0.04 0.06 0.08 0.1 0.12
0.88
0.9
0.92
0.94
0.96
0.98
1
FAR %
GAR %
left iris
right iris
palm
tanh
median & MAD
minmax
modified minmax
zscore
logistic
modified tanh
0 0.02 0.04 0.06 0.08 0.1 0.120
0.02
0.04
0.06
0.08
0.1
0.12
FAR
FRR
iris left
iris right
palm
tanh
median & MAD
minmax
modified minmax
zscore
logistic
modified tanh
Fig. 1(b) Mean fusion
WSEAS TRANSACTIONS on INFORMATION SCIENCE and APPLICATIONS L. Latha, S. Thangasamy
ISSN: 1790-0832 458 Issue 12, Volume 8, December 2011

0 0.05 0.1 0.15 0.2 0.250.75
0.8
0.85
0.9
0.95
1
FAR
GAR
iris left
iris right
palm original
tanh
median mad
minmax
mod minmax
logistic
mod tanh
0 0.05 0.1 0.15 0.2 0.250
0.05
0.1
0.15
0.2
0.25
FAR
FRR
iris left
iris right
palm original
tanh
median MAD
MINMAX
modified MINMAX
LOGISTIC
modified tanh
Fig. 1(c) Median & MAD fusion
0 0.05 0.1 0.15 0.2 0.250.75
0.8
0.85
0.9
0.95
1
FAR
GAR
iris left
iris right
palm
tanh
median & MAD
minmax
modified minmax
zscore
logistic
modified tanh
0 0.02 0.04 0.06 0.08 0.1 0.120
0.02
0.04
0.06
0.08
0.1
0.12
FAR
FRR
iris left
iris right
palm
tanh
median & MAD
minmax
modified minmax
z score
logistic
modified tanh
Fig. 1(d) Min fusion
0 0.05 0.1 0.15 0.2 0.250.75
0.8
0.85
0.9
0.95
1
FAR
GAR
iris left
iris right
palm original
tanh
median MAD
minmax
mod minmax
logistic
mod tanh
0 0.05 0.1 0.15 0.2 0.250
0.05
0.1
0.15
0.2
0.25
FAR
FRR
iris left
iris right
palm original
tanh
medain MAD
minmax
mod minmax
logistic
mod tanh
Fig. 1(e) Modified max fusion
WSEAS TRANSACTIONS on INFORMATION SCIENCE and APPLICATIONS L. Latha, S. Thangasamy
ISSN: 1790-0832 459 Issue 12, Volume 8, December 2011

0 0.05 0.1 0.15
0.85
0.9
0.95
1
FAR
GAR
iris left
iris right
palm original
org tanh
median mad
minmax
mod minmax
z score
logistic
mod tanh
0 0.05 0.1 0.15
0
0.05
0.1
0.15
FAR
FRR
iris left
iris right
palm original
tanh
median mad
minmax
mod minmax
zscore
logistic
mod tanh
Fig. 1(f) Product fusion
0 0.05 0.1 0.15
0.85
0.9
0.95
1
FAR
GAR
iris left
iris right
palm original
tanh
median mad
minmax
mod minmax
zscore
logistic
mod tanh
0 0.05 0.1 0.15
0
0.05
0.1
0.15
FAR
FRR
iris left
iris right
palm original
tanh
median mad
minmax
mod minmax
zscore
logistic
mod tanh
Fig. 1(g) Sum fusion
0 0.02 0.04 0.06 0.08 0.1 0.12
0.88
0.9
0.92
0.94
0.96
0.98
1
FAR
GAR
iris left
iris right
palm
tanh
median & MAD
minmax
modified min-max
z-score
logistic
modified tanh
0 0.05 0.1 0.150
0.05
0.1
0.15
FAR
FRR
iris left
iris right
palm original
org tanh
median mad
minmax
mod minmax
zscore
logistic
mod tanh
Fig. 1(h) Tanh fusion
WSEAS TRANSACTIONS on INFORMATION SCIENCE and APPLICATIONS L. Latha, S. Thangasamy
ISSN: 1790-0832 460 Issue 12, Volume 8, December 2011

Table 1 Comparison of the performance
obtained before and after applying ACO to the system
Fusion rule
applied
Normalization
scheme employed
GAR and
EER obtained
Optimal threshold
obtained by ACO
GAR and EER
obtained by ACO
Product Logistic
Median & MAD
Tanh
Minmax
Modified minmax
Modified tanh
99.3% & 0.7%
97.4% & 2.5%
98.2% & 2.3%
99.5% & 0.8%
99.5% & 0.5%
98.2% & 2%
0.0071
0.0101
0.0125
0.0203
0.0308
0.0238
99.32% & 0.64%
97.76% & 2.1%
98.25% & 1.77%
99.4% & 0.58%
99% & 0.3%
97% & 2.9%
Max Logistic
Median & MAD
Tanh
Minmax
Modified minmax
Modified tanh
97.4% & 2%
95.9% & 4%
100% & 0
96% & 3.8%
96.5% & 3.8%
100% & 0
0.7978
0.4910
0.5742
0.8704
0.8819
1.1690
97.45% & 2.14%
96% & 8.1%
100% & 0
96.27% & 3.3%
95.57% & 3.31%
100% & 0
Median Logistic
Median & MAD
Tanh
Minmax
Modified minmax
Modified tanh
96% & 4%
97.7% & 2%
93.5% & 6.2%
94% & 6%
93.5% & 6.1%
93.5% & 6.2%
0.1672
0.1527
0.1665
0.1776
0.1771
0.1683
96% & 3.8%
97.76% & 1.6%
93.58% & 6.16%
94.73% & 6%
93.58% & 6.1%
93.529% & 6.15%
Tanh Logistic
Median & MAD
Tanh
Minmax
Modified minmax
98.3% & 1.2%
100% & 1.8%
98% & 1.8%
95.8% & 3.9%
100% & 0
0.6449
0.2199
0.5509
0.3359
0.6753
99.39% & 0.51%
98% & 1.6%
98.19% & 1.74%
95.81% & 3.76%
100% & 0
WSEAS TRANSACTIONS on INFORMATION SCIENCE and APPLICATIONS L. Latha, S. Thangasamy
ISSN: 1790-0832 461 Issue 12, Volume 8, December 2011

Modified tanh
100% & 0
0.8612 100% & 0
Min Logistic
Median & MAD
Tanh
Minmax
Modified minmax
Modified tanh
98% & 1.8%
97.8% & 2%
96.5% & 3.8%
95.9% & 3.8%
96.5% & 3.8%
96.5% & 3.7%
0.0959
0.1254
0.1210
0.1280
0.0176
0.0310
98.5% & 1.3%
97.82% & 2.1%
96.6% & 3.5%
96.06% & 3.68%
96.56% & 3.6%
96.55% & 3.66%
Sum
Mean
Logistic
Median & MAD
Tanh
Minmax
Modified minmax
Modified tanh
Logistic
Median & MAD
Tanh
Minmax
Modified minmax
Modified tanh
98% & 2%
96% & 4%
98% & 1.3%
97.2% & 0.8%
97.1% & 1.6%
100% & 0
98.1% & 1.4%
95.5% & 3.5%
98.1% & 1.5%
96.6% & 3.2%
98.9% & 0.8%
100% & 0
0.6837
0.2639
0.5509
0.3670
0.1690
0.2471
0.187
0.9418
0.5215
0.3610
0.8846
0.7910
98.32% & 1.19%
98% & 1.5%
98.5% 7& 1.44%
97.4% & 2.72%
99% & 1.57%
100% & 0
99.7% & 02%
96.1% & 2.95%
99.6% & 03%
96.5% & 3.2%
99.6% & 0.3%
100% & 0
As it can be seen from the results, the threshold
optimization carried out by using ACO gives a very
good improvement in the performance of the
system. Max, sum and mean fusion methods give
the best results in terms of the low EER and high
recognition rate compared to other fusion methods.
The normalization method that gives the maximum
recognition accuracy and minimum error are
highlighted in the table shown above.
8 Conclusion This paper examines the effect of different score
normalization techniques and fusion methods on the
performance of a multimodal biometric system. We
have demonstrated that the normalization and fusion
methods optimized by employing ACO technique
improve the biometric recognition performance. The
multimodal biometric system was constructed using
the iris and palm print traits. Selection of thresholds
play a crucial role in any biometric authentication
system as it directly affects the system performance.
Hence an optimization approach based on Ant
WSEAS TRANSACTIONS on INFORMATION SCIENCE and APPLICATIONS L. Latha, S. Thangasamy
ISSN: 1790-0832 462 Issue 12, Volume 8, December 2011
colony system is proposed for proper selection of
the threshold values for each of the fusion method
adopted in this work. The experimental results
obtained using CASIA iris and palm print databases
show that the application of ACO for threshold
optimization improves the accuracy of the system
enormously. In particular max, sum and mean
fusion methods give the best results in terms of the
low EER and high recognition rate compared to
other fusion methods.
References:
[1] Jain.A.K, A.Ross, and S.Prabhakar, An
introduction to biometric recognition, IEEE
Trans. Circuits Systems Video Technol., vol.14,
no.1, 2004, pp.4–20 (special issue on image-
and video-based biometrics).
[2] Hong.L, Jain.A.K, and S.Pankanti, Can
multibiometrics improve performance?,
Proceedings of IEEE Workshop on Automatic
Identification Advanced Technologies, NJ,
USA, 1999, pp. 59–64.
[3] Jain.A.K, A.Ross, Information fusion in
biometrics, Pattern Recogn. Lett, vol.24,
no.13, 2004, pp.2115–2125 (special issue on
multimodal biometrics).
[4] Colorni,A., Dorigo,M., and Maniezzo,V,
Distributed optimization by ant colonies. In
Toward a practice of autonomous systems,
Proceedings of the first European conference
on artificial life (pp. 134–142). Cambridge,
MA: MIT Press, 1992.
[5] Dorigo, M., Maniezzo, V., & Colorni, A, The
ant system: Optimization by a colony of
cooperating agents, IEEE Transactions on
System, Man, and Cybernetics, Part B, vol.26,
1996, pp.1–13.
[6] Kittler.J, M.Hatef, R.Duin, and J.Matas. On
Combining Classifiers, IEEE Trans on Pattern
Analysis and Machine Intelligence, Vol. 20,
No. 3, 1998.
[7] Ben-Yacoub, Abdeljaoued and Mayoraz, Fusion
of Face and Speech Data for Person Identity
Verification, 1999.
[8] Fierrez-Aguilar.J, Ortega-Garcia.J, Garcia-
Romero.D and J. Gonzalez-Rodriguez, A
comparative evaluation of fusion strategies for
multimodal biometric verification, Proc. 4th
IAPR Intl. Conf. on Audio- and Video-based
Biometric Person Authentication, AVBPA,
Springer LNCS-2688, 2003, pp. 830-837.
[9] Nandakumar, Jain, Ross, Score Normalization
in Multimodal Biometric Systems, Pattern
Recognition, vol.38, 2005, pp.2270-2285.
[10] Mink.A, R.Snelick, U.Uludag, M.Indovina, and
A. Jain, Large Scale Evaluation of Multimodal
Biometric Authentication Using State-of-the-
Art Systems, IEEE Transactions on Pattern
Analysis and Machine Intelligence, 2005, Vol.
27, No.3, pp. 450-455.
[11] Masi.D, H. Korves, L.adel and B.Ulery, Multi-
Biometric Fusion: From Research to
Operations, Sigma, 2005.
[12] Bui, T. N., & Zrncic, C. M., An ant-based
algorithm for finding degree constrained
minimum spanning tree, Proceedings of the 8th
annual conference on Genetic and
Evolutionary Computation, Seattle, 2006,
Washington (pp. 11–18). NewYork: ACM
Press.
[13] Jain.A.K, and Jianjiang Feng, Latent Palmprint
Matching, IEEE Transactions on Pattern
Analysis and Machine Intelligence, vol.31, no.
6, 2009.
[14] Park.H.A. and K. R. Park, Iris recognition
based on score level fusion by using SVM,
Pattern Recognition Letters, vol. 28, no. 15,
2007, pp. 2019–2028.
[15] Dass, K. Nandakumar, A.K. Jain, A principled
approach to score level fusion in multimodal
biometric systems, in: Proceedings of AVBPA,
Rye Brook, 2005, pp.1049–1058.
[16] Dass,.S.C, K. Nandakumar, Y. Chen, A.K. Jain,
Likelihood ratio-based biometric score fusion,
IEEE Transactions on Pattern Analysis and
Machine Intelligence, vol.30, no.2, 2008,
pp.342–347.
[17] Bergamini.C, et al., Combining different
biometric traits with one-class classification,
Signal Processing, vol.89, no.11, 2009,
pp.2117–2127.
[18] Chang-Chun Lin a, Lu-Chuan Tseng, Website
reorganization using an ant colony system,
Expert Systems with Applications, vol.37, 2010,
pp.7598–7605.
[1] [19] CASIA Iris Image Database, (2007).
http://www.sinobiometrics.com.
[20] Palm print database, (2007).
http://www.sinobiometrics.com.
[21] Prabhakar.S, S. Pankanti, A. K. Jain, Biometric
Recognition: Security and Privacy Concerns,
IEEE Security & Privacy, 2003, pp. 33-42
WSEAS TRANSACTIONS on INFORMATION SCIENCE and APPLICATIONS L. Latha, S. Thangasamy
ISSN: 1790-0832 463 Issue 12, Volume 8, December 2011