Embed Size (px)
Citation preview
rsos.royalsocietypublishing.org
ResearchCite this article: Li Y, Yang Y. 2018Non-coaxiality of sand under bi-directionalshear loading. R. Soc. open sci. 5: 172076.http://dx.doi.org/10.1098/rsos.172076
Received: 4 December 2017Accepted: 13 April 2018
Subject Category:Engineering
Subject Areas:civil engineering/engineering geology
Keywords:non-coaxiality, simple shear test, sand
Author for correspondence:Yao Lie-mail: [email protected]
Non-coaxiality of sandunder bi-directionalshear loadingYao Li1 and Yunming Yang21School of Highway, Chang’an University, Xi’an, People’s Republic of China2International Doctoral Innovation Centre, Department of Civil Engineering,The University of Nottingham, Ningbo, People’s Republic of China
YL, 0000-0002-2503-6953
This study aims to investigate the effect of consolidation shearstress magnitude on the shear behaviour and non-coaxialityof soils. In previous drained bi-directional simple shear teston Leighton Buzzard sand, it is showed that the level of non-coaxiality, which is indicated by the angle difference betweenthe principal axes of stresses and the corresponding principalaxes of strain rate tensors, is increased by increasing angledifference between the direction of consolidation shear stressand secondary shearing. This paper further investigated therelation and includes results with higher consolidation shearstresses. Results agree with the previous relation, and furthershowed that increasing consolidation shear stresses decreasedthe level of non-coaxiality in tests with angle differencebetween 0° and 90°, and increased the level of non-coaxialityin tests with angle difference between 90° and 180°.
1. IntroductionIn experiment and numerical modelling, it is showed that theprincipal axes of stresses and the corresponding principal axes ofstrain rate tensors often do not coincide [1–4]. In most of numericalmodelling soil models, these axes are considered as generallycoincident, which neglects the non-coaxiality and may lead tounsafe simulation results [5–10].
Due to the limitation of testing apparatus, the non-coaxialityis not well understood, especially when shear stresses exist. Intests conducted by Li et al. [11] using the first commerciallyavailable variable direction dynamic cyclic simple shear system(VDDCSS), a procedure is introduced in determining the rotationangle of principal axes of stresses and plastic strain rate usingdata obtained from a typical bi-directional simple shear test.The level of non-coaxiality can be determined by the angledifference between the two determined angles. In the procedure,
2018 The Authors. Published by the Royal Society under the terms of the Creative CommonsAttribution License http://creativecommons.org/licenses/by/4.0/, which permits unrestricteduse, provided the original author and source are credited.
on July 12, 2018http://rsos.royalsocietypublishing.org/Downloaded from
2
rsos.royalsocietypublishing.orgR.Soc.opensci.5:172076
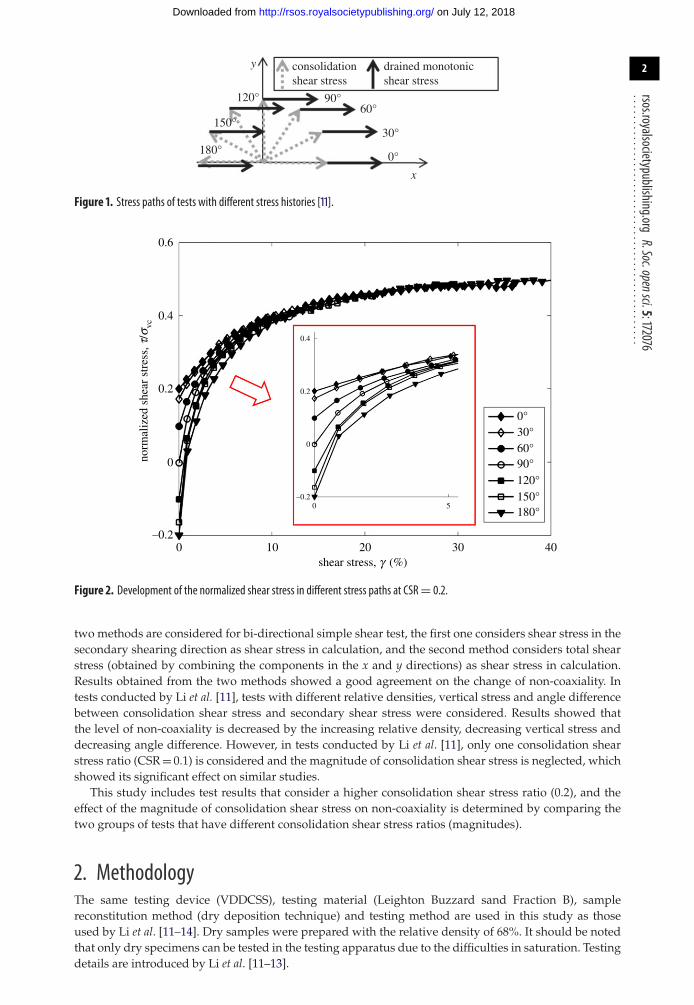
................................................consolidationshear stress
90°60°
30°
0°
120°
y
x
150°
180°
drained monotonicshear stress
Figure 1. Stress paths of tests with different stress histories [11].
0.6
0.4
0.2
norm
aliz
ed s
hear
str
ess,
t/s
vc
0
–0.20 10 20
shear stress, g (%)30
0.4
0.2
0
–0.20 5
40
0°30°60°90°120°150°180°
Figure 2. Development of the normalized shear stress in different stress paths at CSR= 0.2.
two methods are considered for bi-directional simple shear test, the first one considers shear stress in thesecondary shearing direction as shear stress in calculation, and the second method considers total shearstress (obtained by combining the components in the x and y directions) as shear stress in calculation.Results obtained from the two methods showed a good agreement on the change of non-coaxiality. Intests conducted by Li et al. [11], tests with different relative densities, vertical stress and angle differencebetween consolidation shear stress and secondary shear stress were considered. Results showed thatthe level of non-coaxiality is decreased by the increasing relative density, decreasing vertical stress anddecreasing angle difference. However, in tests conducted by Li et al. [11], only one consolidation shearstress ratio (CSR = 0.1) is considered and the magnitude of consolidation shear stress is neglected, whichshowed its significant effect on similar studies.
This study includes test results that consider a higher consolidation shear stress ratio (0.2), and theeffect of the magnitude of consolidation shear stress on non-coaxiality is determined by comparing thetwo groups of tests that have different consolidation shear stress ratios (magnitudes).
2. MethodologyThe same testing device (VDDCSS), testing material (Leighton Buzzard sand Fraction B), samplereconstitution method (dry deposition technique) and testing method are used in this study as thoseused by Li et al. [11–14]. Dry samples were prepared with the relative density of 68%. It should be notedthat only dry specimens can be tested in the testing apparatus due to the difficulties in saturation. Testingdetails are introduced by Li et al. [11–13].
on July 12, 2018http://rsos.royalsocietypublishing.org/Downloaded from
3
rsos.royalsocietypublishing.orgR.Soc.opensci.5:172076
................................................0.6
0.4
0.2
norm
aliz
ed to
tal s
hear
str
ess,
tT/s
vc
0
–0.20 10 20
total shear stress, gT (%)30
0.4
0.2
0
–0.20 5
40
0°30°60°90°120°150°180°
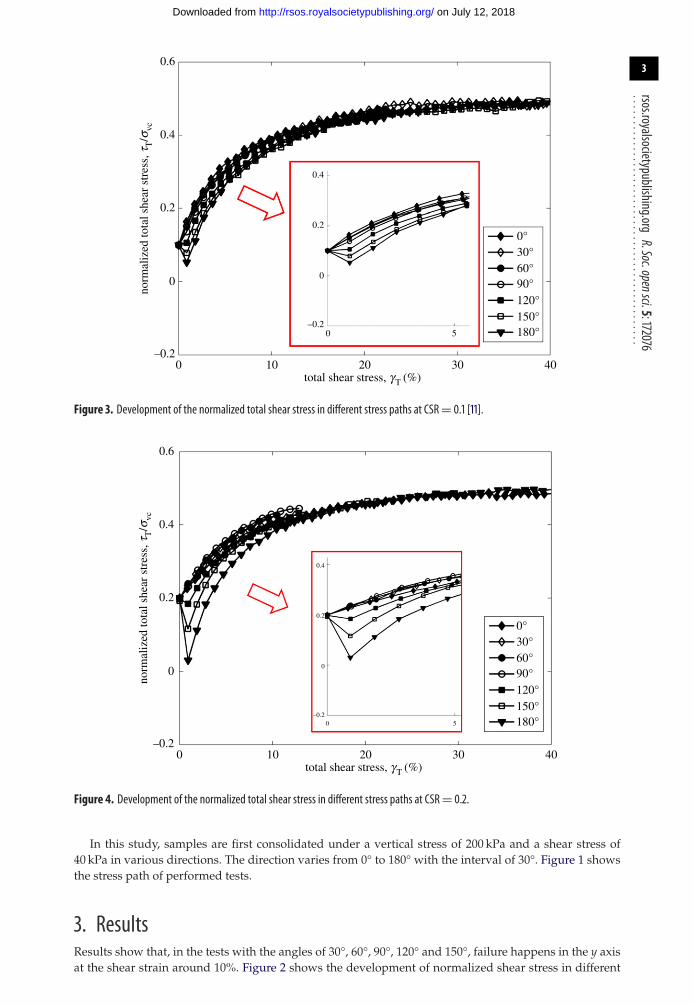
Figure 3. Development of the normalized total shear stress in different stress paths at CSR= 0.1 [11].
0.6
0.4
0.2
norm
aliz
ed to
tal s
hear
str
ess,
tT/s
vc
0
–0.20 10 20
total shear stress, gT (%)30
0.4
0.2
0
–0.20 5
40
0°30°60°90°120°150°180°
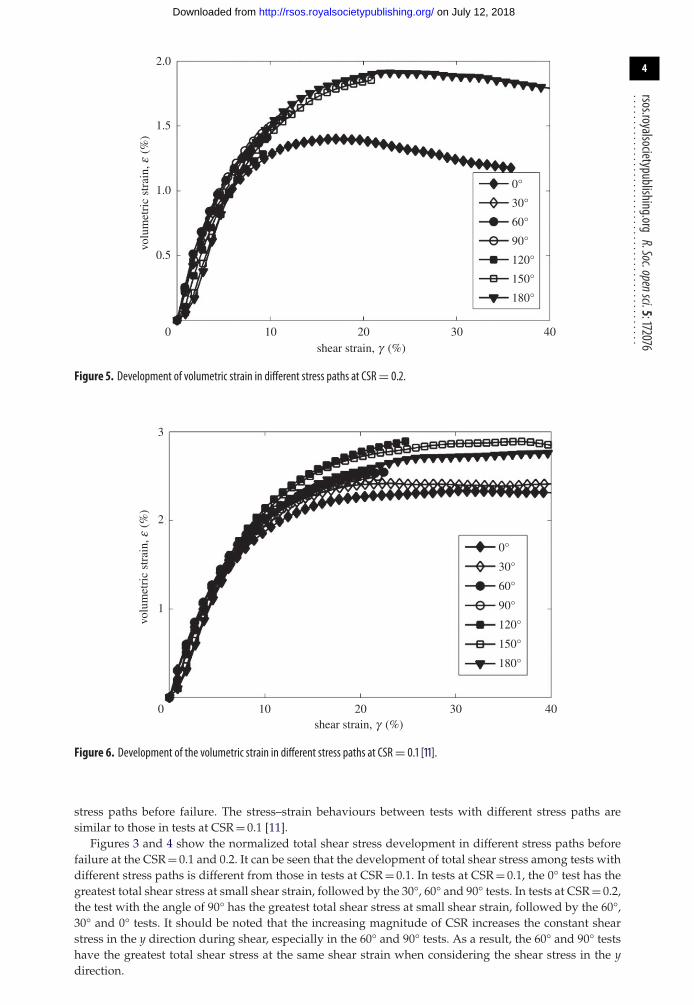
Figure 4. Development of the normalized total shear stress in different stress paths at CSR= 0.2.
In this study, samples are first consolidated under a vertical stress of 200 kPa and a shear stress of40 kPa in various directions. The direction varies from 0° to 180° with the interval of 30°. Figure 1 showsthe stress path of performed tests.
3. ResultsResults show that, in the tests with the angles of 30°, 60°, 90°, 120° and 150°, failure happens in the y axisat the shear strain around 10%. Figure 2 shows the development of normalized shear stress in different
on July 12, 2018http://rsos.royalsocietypublishing.org/Downloaded from
4
rsos.royalsocietypublishing.orgR.Soc.opensci.5:172076
................................................2.0
1.5
1.0
volu
met
ric
stra
in, e
(%)
shear strain, g (%)
0.5
0 10 20 30 40
0°
30°
60°
90°
120°
150°
180°
Figure 5. Development of volumetric strain in different stress paths at CSR= 0.2.
3
2
1
0
volu
met
ric
stra
in, e
(%)
shear strain, g (%)10 20 30 40
0°
30°
60°
90°
120°
150°
180°
Figure 6. Development of the volumetric strain in different stress paths at CSR= 0.1 [11].
stress paths before failure. The stress–strain behaviours between tests with different stress paths aresimilar to those in tests at CSR = 0.1 [11].
Figures 3 and 4 show the normalized total shear stress development in different stress paths beforefailure at the CSR = 0.1 and 0.2. It can be seen that the development of total shear stress among tests withdifferent stress paths is different from those in tests at CSR = 0.1. In tests at CSR = 0.1, the 0° test has thegreatest total shear stress at small shear strain, followed by the 30°, 60° and 90° tests. In tests at CSR = 0.2,the test with the angle of 90° has the greatest total shear stress at small shear strain, followed by the 60°,30° and 0° tests. It should be noted that the increasing magnitude of CSR increases the constant shearstress in the y direction during shear, especially in the 60° and 90° tests. As a result, the 60° and 90° testshave the greatest total shear stress at the same shear strain when considering the shear stress in the ydirection.
on July 12, 2018http://rsos.royalsocietypublishing.org/Downloaded from
5
rsos.royalsocietypublishing.orgR.Soc.opensci.5:172076
................................................shear strain, g (%)1
7
1
norm
aliz
ed s
hear
mod
ulus
, G/s
vc
10 40
0°
30°
60°
90°
120°
150°
180°
Figure 7. Normalized shear modulus versus shear strain in tests with different stress paths under the CSR= 0.2.
50
40
30
20
10
0
angl
e, q
–10
–20
–300 10 20
30
20
10
0
–10
30 40
strain incrementstress 0°stress 30°stress 60°
stress 90°stress 120°stress 150°stress 180°
shear strain, g (%)
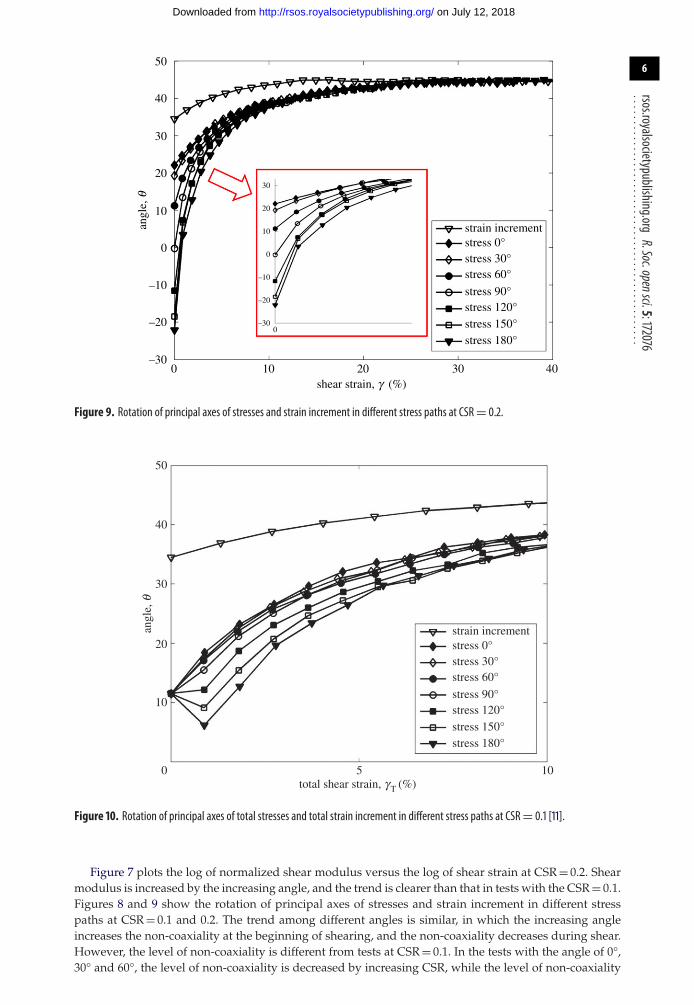
Figure 8. Rotation of principal axes of stresses and strain increment in different stress paths at CSR= 0.1 [11].
Figure 5 shows the development of volumetric strain in different stress paths at CSR = 0.2. It should benoted that most tests failed at the early stage of shearing, and shows little difference in the developmentof volumetric strain at the beginning of shear. The tests with the angles of 0° and 180° develop greatershear strains, and corresponding volumetric strains are well recorded. It shows that the test with theangle of 0° reached the peak volumetric strain first. Similar behaviour is observed in the test with theangle of 180°, and it reaches the peak volumetric strain at a higher shear strain. The peak volumetricstrain of the test with the angle of 180° is greater than that in the test with the angle of 0°, which showsa similar trend to that in the tests at CSR = 0.1. In addition, tests at CSR = 0.2 show a greater dilativebehaviour than the tests at CSR = 0.1, as shown in figures 5 and 6.
on July 12, 2018http://rsos.royalsocietypublishing.org/Downloaded from
6
rsos.royalsocietypublishing.orgR.Soc.opensci.5:172076
................................................50
40
30
20
10
0
angl
e, q
–10
–20
–300 10 20
30
20
10
0
–10
–20
–300
30 40
strain incrementstress 0°stress 30°stress 60°
stress 90°stress 120°stress 150°stress 180°
shear strain, g (%)
Figure 9. Rotation of principal axes of stresses and strain increment in different stress paths at CSR= 0.2.
50
40
30
20
10
0
angl
e, q
5 10
strain incrementstress 0°stress 30°stress 60°
stress 90°stress 120°stress 150°stress 180°
total shear strain, g T (%)
Figure 10. Rotation of principal axes of total stresses and total strain increment in different stress paths at CSR= 0.1 [11].
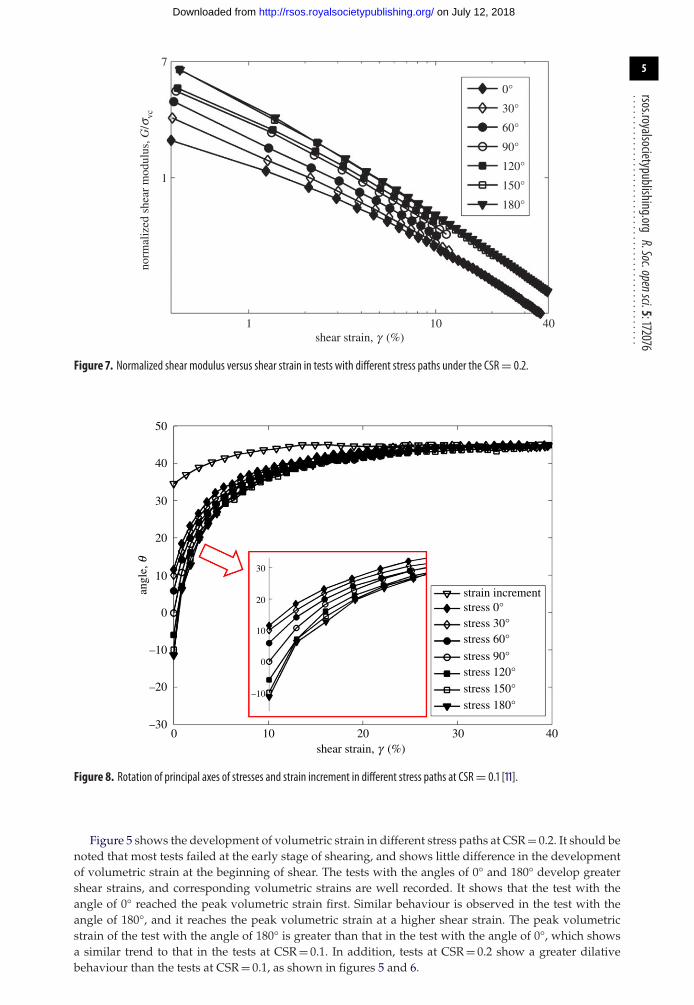
Figure 7 plots the log of normalized shear modulus versus the log of shear strain at CSR = 0.2. Shearmodulus is increased by the increasing angle, and the trend is clearer than that in tests with the CSR = 0.1.Figures 8 and 9 show the rotation of principal axes of stresses and strain increment in different stresspaths at CSR = 0.1 and 0.2. The trend among different angles is similar, in which the increasing angleincreases the non-coaxiality at the beginning of shearing, and the non-coaxiality decreases during shear.However, the level of non-coaxiality is different from tests at CSR = 0.1. In the tests with the angle of 0°,30° and 60°, the level of non-coaxiality is decreased by increasing CSR, while the level of non-coaxiality
on July 12, 2018http://rsos.royalsocietypublishing.org/Downloaded from
7
rsos.royalsocietypublishing.orgR.Soc.opensci.5:172076
................................................50
40
30
20
10
0
angl
e, q
5 10
strain incrementstress 0°
stress 30°stress 60°
stress 90°stress 120°stress 150°
stress 180°
total shear strain, g T (%)
Figure 11. Rotation of principal axes of total stresses and total strain increment in different stress paths at CSR= 0.2.
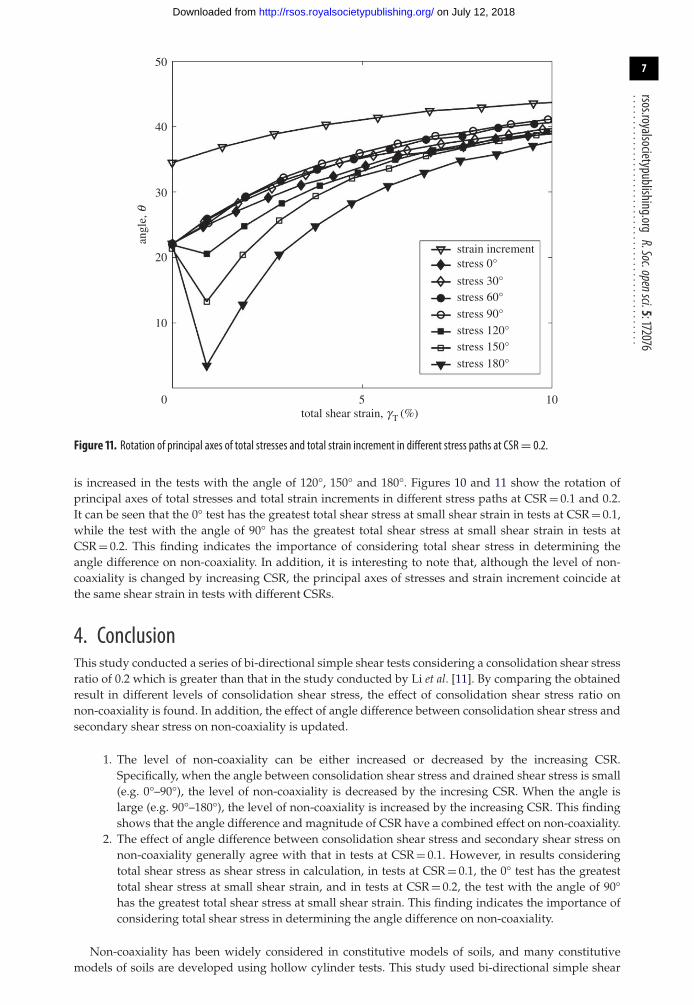
is increased in the tests with the angle of 120°, 150° and 180°. Figures 10 and 11 show the rotation ofprincipal axes of total stresses and total strain increments in different stress paths at CSR = 0.1 and 0.2.It can be seen that the 0° test has the greatest total shear stress at small shear strain in tests at CSR = 0.1,while the test with the angle of 90° has the greatest total shear stress at small shear strain in tests atCSR = 0.2. This finding indicates the importance of considering total shear stress in determining theangle difference on non-coaxiality. In addition, it is interesting to note that, although the level of non-coaxiality is changed by increasing CSR, the principal axes of stresses and strain increment coincide atthe same shear strain in tests with different CSRs.
4. ConclusionThis study conducted a series of bi-directional simple shear tests considering a consolidation shear stressratio of 0.2 which is greater than that in the study conducted by Li et al. [11]. By comparing the obtainedresult in different levels of consolidation shear stress, the effect of consolidation shear stress ratio onnon-coaxiality is found. In addition, the effect of angle difference between consolidation shear stress andsecondary shear stress on non-coaxiality is updated.
1. The level of non-coaxiality can be either increased or decreased by the increasing CSR.Specifically, when the angle between consolidation shear stress and drained shear stress is small(e.g. 0°–90°), the level of non-coaxiality is decreased by the incresing CSR. When the angle islarge (e.g. 90°–180°), the level of non-coaxiality is increased by the increasing CSR. This findingshows that the angle difference and magnitude of CSR have a combined effect on non-coaxiality.
2. The effect of angle difference between consolidation shear stress and secondary shear stress onnon-coaxiality generally agree with that in tests at CSR = 0.1. However, in results consideringtotal shear stress as shear stress in calculation, in tests at CSR = 0.1, the 0° test has the greatesttotal shear stress at small shear strain, and in tests at CSR = 0.2, the test with the angle of 90°has the greatest total shear stress at small shear strain. This finding indicates the importance ofconsidering total shear stress in determining the angle difference on non-coaxiality.
Non-coaxiality has been widely considered in constitutive models of soils, and many constitutivemodels of soils are developed using hollow cylinder tests. This study used bi-directional simple shear
on July 12, 2018http://rsos.royalsocietypublishing.org/Downloaded from
8
rsos.royalsocietypublishing.orgR.Soc.opensci.5:172076
................................................tests which can better replicate in situ conditions, and expermental data and result could improve soilconstitutive models which help simulate real shear behaviour of soils under complex stress environment.
Data accessibility. Data are deposited at Dryad (http://dx.doi.org/10.5061/dryad.pp2t3) [15].Authors’ contributions. Y.L. conducted the experiments, analysed the results and drafted the manuscript. Y.Y. conceivedthe experiments. All the authors reviewed and approved the final manuscript.Competing interests. The authors declare no conflicts of interest.Funding. This research is supported by National Natural Science Foundation of China (NSFC contract no. 51708040,11172312 and A020311), Fundamental Research Funds for the Central Universities of Ministry of Education of China(grant no. 300102218106) and the International Doctoral Innovation Centre (IDIC) scholarship scheme. The work isalso partially supported by the Engineering and Physical Sciences Research Council (EPSRC) grant no. EP/L015463/1.Acknowledgements. We greatly acknowledge the support from Ningbo Education Bureau, Ningbo Science andTechnology Bureau, China’s MoST and the University of Nottingham.
References1. Roscoe KH, Bassett RH, Cole ERL. 1967 Principal axes
observed during simple shear of a sand. ln Proc.Geotechnical Conf. on Shear Strength Properties ofNatural Soils and Rocks, Oslo, Norway, September,pp. 231–237. Oslo, Norway: Norwegian GeotechnicalSociety.
2. Drescher A, de Josselin de Jong G. 1972 Photoelasticverification of a mechanical model for the flowof a granular material. J. Mech. Phys. Solids 20,337–340.
3. Budhu M. 1979 Simple shear deformation of sands.PhD thesis, Cambridge University, Cambridge, UK.
4. Yu H-S. 2006 Plasticity and geotechnics. New York,NY: Springer.
5. Yu H-S, Yuan X. 2006 On a class of non-coaxialplasticity models for granular soils. Proc. R.Soc. A 462, 725–748. (doi:10.1098/rspa.2005.1590)
6. Yang Y, Yu H-S. 2006 Application of a non-coaxialsoil model in shallow foundations. Geomech.Geoeng. 1, 139–150. (doi:10.1080/17486020600777101)
7. Lai JX, Zhou H, Wang K, Qiu JL, Wang LX, Wang JB,Feng ZH. 2018 Shield-driven inducedground surface and Ming Dynasty city wallsettlement of Xi’an metro, Tunn. Undergr. SpaceTechnol. 79.
8. Lai JX, Wang XL, Qiu JL, Chen JX, Hu ZN, Wang H.2018 Extreme deformation characteristics andcountermeasures for a tunnel in difficult groundsin southern Shaanxi, China. Environ. EarthSci. 77.
9. Luo YB, Chen JX, Chen Y, Diao PS, Qiao X. 2018Longitudinal deformation profile of a tunnel inweak rock mass by using the back analysis method.Tunn. Undergr. Space Technol. 71, 478–493.(doi:10.1016/j.tust.2017.10.003)
10. Luo YB, Chen JX, Gao ST, Deng XH, Diao PS. 2017Stability analysis of super-large-section tunnel inloess ground considering water infiltration causedby irrigation. Environ. Earth Sci. 76, 763.(doi:10.1007/s12665-017-7106-7)
11. Li Y, Yang Y, Yu H, Roberts G. 2018 Principal stressrotation under bidirectional simple shear loadings.KSCE J. Civil Eng. 22, 1–10. (doi:10.1007/s12205-017-0822-4)
12. Li Y, Yang Y, Yu H, Roberts G. 2017 Monotonic directsimple shear tests on sand under multidirectionalloading. Int. J. Geomech. 17, 1–10. (doi:10.1061/(ASCE)GM.1943-5622.0000673)
13. Li Y, Yang Y, Yu H, Roberts G. 2018 Effect of samplereconstitution methods on the behaviors ofgranular materials under shearing. ASTM J. Test.Eval. 46, 20170126. (doi:10.1520/JTE20170126)
14. Li Y, Yang Y, Yu H, Roberts G. 2017 Correlationsbetween the stress paths of a monotonic test and acyclic test under the same initial conditions. SoilDyn. Earthq. Eng. 101, 153–156. (doi:10.1016/j.soildyn.2017.07.023)
15. Li Y, Yang Y. 2018 Data from: Non-coaxiality of sandunder bi-directional shear loading. Dryad DigitalRepository. (doi:10.5061/dryad.pp2t3)
on July 12, 2018http://rsos.royalsocietypublishing.org/Downloaded from