Embed Size (px)
Citation preview
On-line Booking and Revenue
Management: Evidence from a
Low-Cost Airline
Claudio Piga
Loughborough University and Rimini Centre for
Economic Analysis
Seminar at Fondazione Eni Enrico Mattei
Introduction• In three influential papers, Dana analysed how
revenue management can be effectively used when capacity is costly and firms set prices BEFORE demand is known.
• In all these papers, price dispersion arises as a consequence of the assumptions of the model, and it does not imply a carrier’s intention to price discriminate.
• A crucial assumption is that the airlines have to commit to a pricing schedule and will not update it; i.e., the solutions are not sub-game perfect.
Price Dispersion & Demand
uncertainty – Dana (1999, Rand)
• Costly capacity and prices set before the actual
realisation of demand is known;
• in practice, the firm has to decide the level of prices and
the associated number of seats it will sell for each
possible realization of demand.
• For the case of two-states demand (low and high), the
firm will set two prices and the corresponding number of
tickets available at each price.
• The analysis consider the case in which the firm
operates in different market structures.
Dana (1999, Rand)
• Dana shows that regardless of the market structure, the firm should determine different ``batches'' of seats, and that fares should increase as fewer batches remain unsold.
• That is, the profile of fare should be an increasing function of the number of sold seats.
• The domain over which this function is distributed should increase with the degree of competition on a route or market
• There is no room for intertemporal price discrimination in Dana’s work.
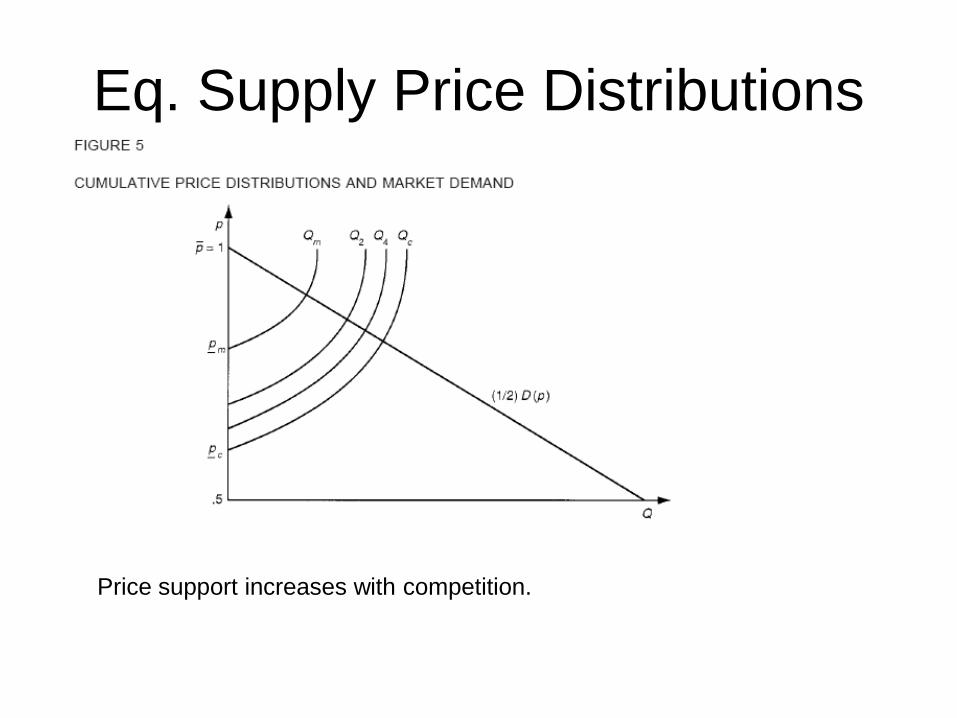
Eq. Supply Price Distributions
Price support increases with competition.
Further from Dana (1999)
• Another important feature of the model is the commitment of the firm to the schedule of prices it set before demand is known.
• Such a price rigidity may arise because the firm must incur a very high cost in tracking the evolution of demand for all the flights it operates and adjust fares to reflect demand conditions.
• This appears to run contrary to the current standard practice in the industry.
Literature
• There are no studies that try to link the paid fare for a seat on a flight with the number of available seats on that flight.
• Escobari and Li Gan (2006, NBER) and Puller, Sengupta and Wiggins (2009, NBER) try to obtain this information by merging two different dataset; their analysis is complicated by the complexity of Full Service Carriers’ Yield Management, that considers a number of ticket classes that are open all at the same time.
• This work benefits from dealing with the simpler system of a Low Cost Carrier, and allows a more direct test of the implications of Dana’s model.

Literature
• Implicitly, this paper studies the effect of (stochastic) peak load pricing on Fare Dispersion;
• Previous literature has mainly looked into the relationship between Price Discrimination and Price Dispersion (Gerardi and Shapiro, JPE 2009; Borenstein and Rose, 1994; Gaggero and Piga, 2010)

A quote from EU CC investigation of the FR and AL takeover
• The first software type which both companies use is a system that tracks the booking status of each flight, provides forecasts for the further development and makes proposals for the pricing pattern.
• This software allows the responsible “yield manager” or “analyst” to verify the booking status for any given Ryanair or Aer Lingus flight.
• With the help of the program, the analyst can compare the actual booking status (or “load factor”) of a flight with the booking forecast which is provided by the system.
• This booking forecast is based on previous experience with the same route at the relevant dates or on similar routes. The forecasts are adjusted according to forecasted growth and other relevant changes of the factors affecting supply and demand on the route.
Study objectives
• Derive a pricing curve for Ryanair, a
European Low Cost Carrier;
• Test the hypothesis of the relationship
between price dispersion and market
structure.
• Assess whether and how the adjustment
to a “pricing” template are made, i.e.,
assess whether the commitment story by
Dana has important implications

11
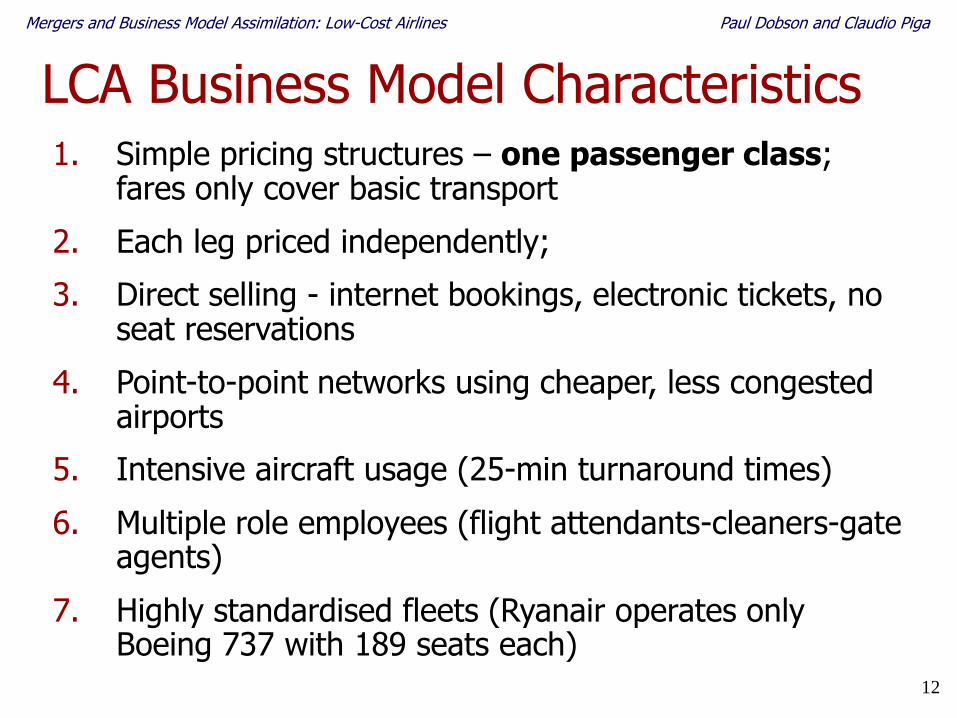
LCA Business Model Characteristics
Mergers and Business Model Assimilation: Low-Cost Airlines Paul Dobson and Claudio Piga
12
LCA Business Model Characteristics1. Simple pricing structures – one passenger class;
fares only cover basic transport
2. Each leg priced independently;
3. Direct selling - internet bookings, electronic tickets, no seat reservations
4. Point-to-point networks using cheaper, less congested airports
5. Intensive aircraft usage (25-min turnaround times)
6. Multiple role employees (flight attendants-cleaners-gate agents)
7. Highly standardised fleets (Ryanair operates only Boeing 737 with 189 seats each)
Mergers and Business Model Assimilation: Low-Cost Airlines Paul Dobson and Claudio Piga
13
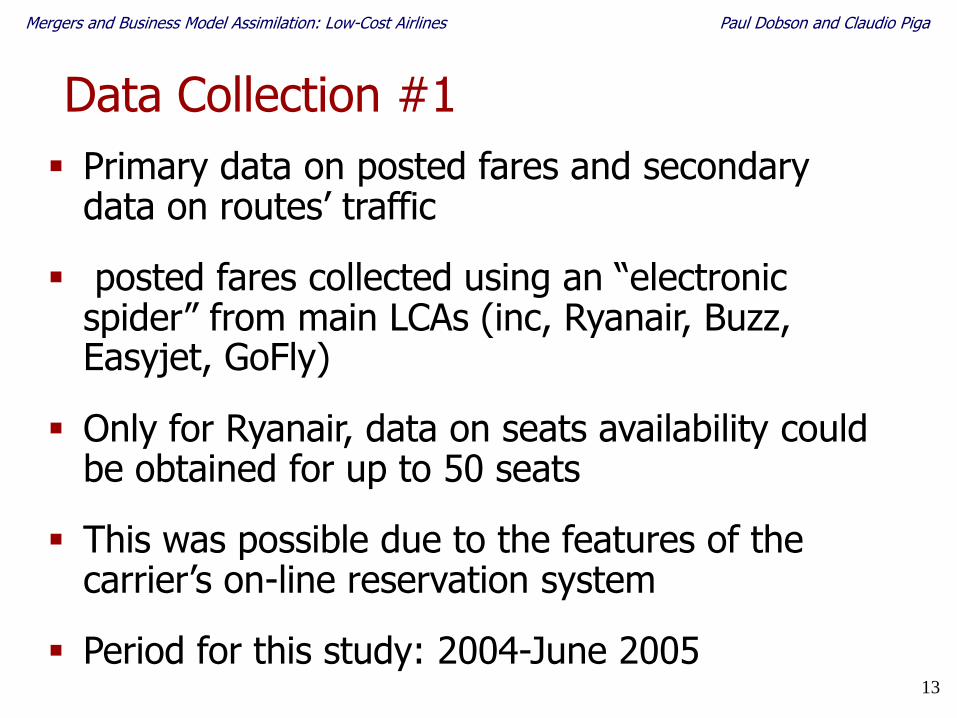
Primary data on posted fares and secondary data on routes’ traffic
posted fares collected using an “electronic spider” from main LCAs (inc, Ryanair, Buzz, Easyjet, GoFly)
Only for Ryanair, data on seats availability could be obtained for up to 50 seats
This was possible due to the features of the carrier’s on-line reservation system
Period for this study: 2004-June 2005
Mergers and Business Model Assimilation: Low-Cost Airlines Paul Dobson and Claudio Piga
Data Collection #1
14
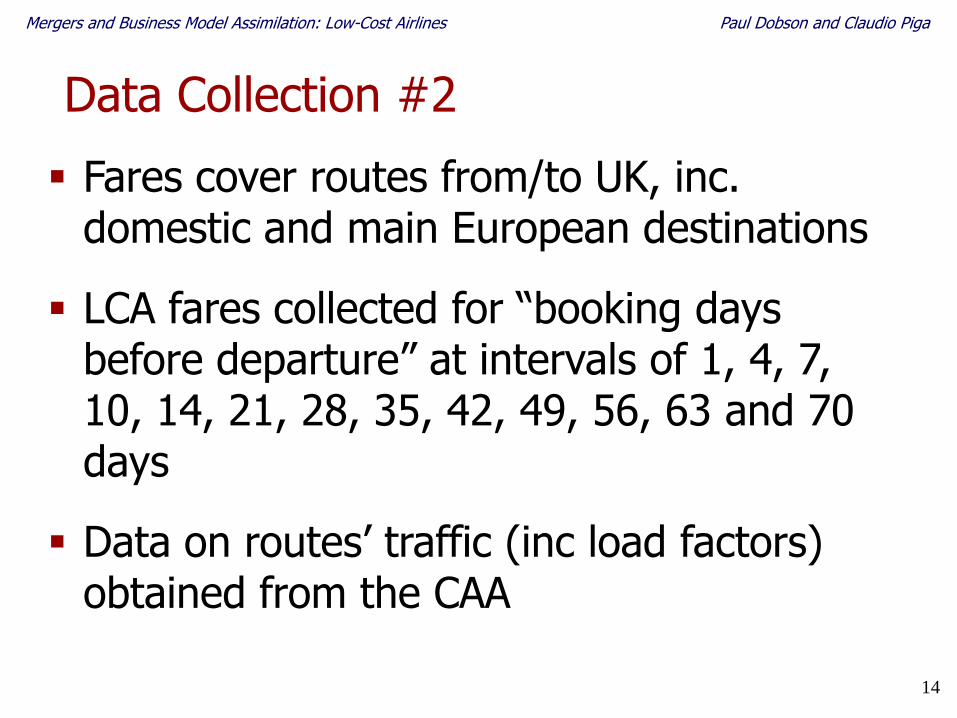
Fares cover routes from/to UK, inc. domestic and main European destinations
LCA fares collected for “booking days before departure” at intervals of 1, 4, 7, 10, 14, 21, 28, 35, 42, 49, 56, 63 and 70 days
Data on routes’ traffic (inc load factors) obtained from the CAA
Mergers and Business Model Assimilation: Low-Cost Airlines Paul Dobson and Claudio Piga
Data Collection #2
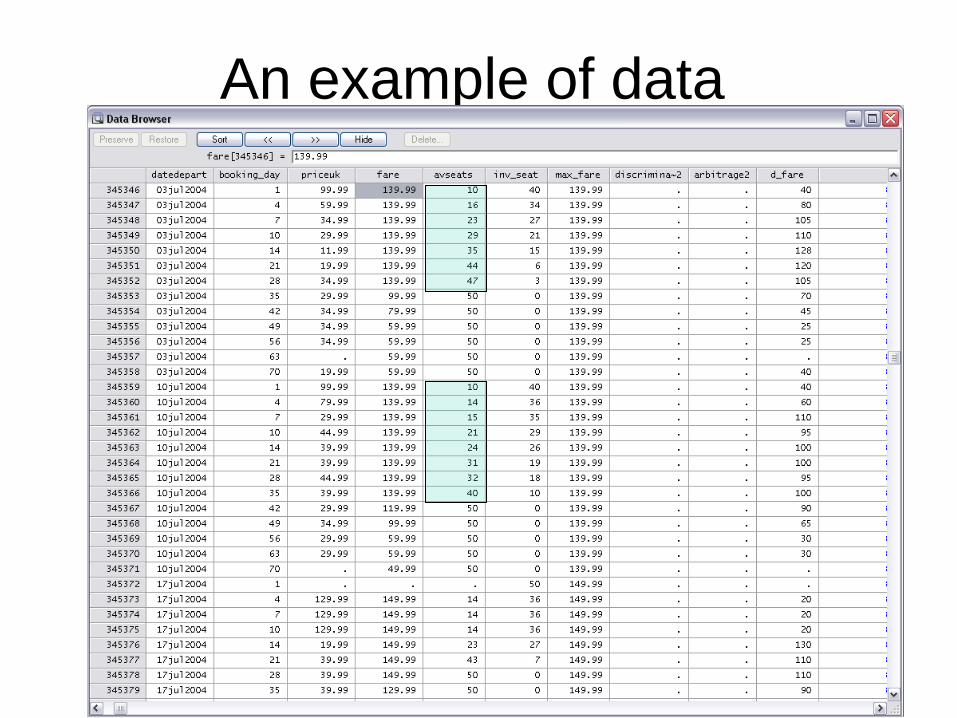
An example of data

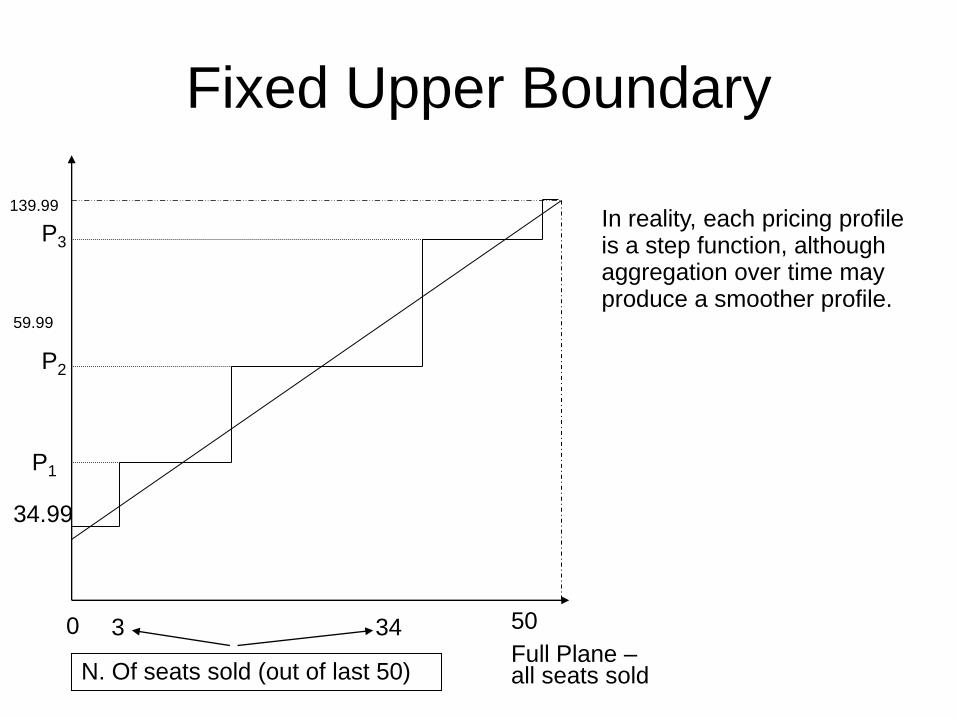
Fixed Upper Boundary
139.99
0 50
Full Plane –all seats sold
3
34.99
59.99
query= 47
Airplane full Query= 16
34
Price 1 seat
Price 1 seat
N. Of seats sold (out of last 50)
The revenue management software defines a maximum threshold which corresponds to the price of the last seat.
This can be obtained by any query that closes the flight.
The threshold is independent of the current occupancy rate.
Fixed Upper Boundary
139.99
0 50
Full Plane –all seats sold
3
34.99
59.99
34
N. Of seats sold (out of last 50)
In reality, each pricing profile is a step function, although aggregation over time may produce a smoother profile.
P1
P2
P3
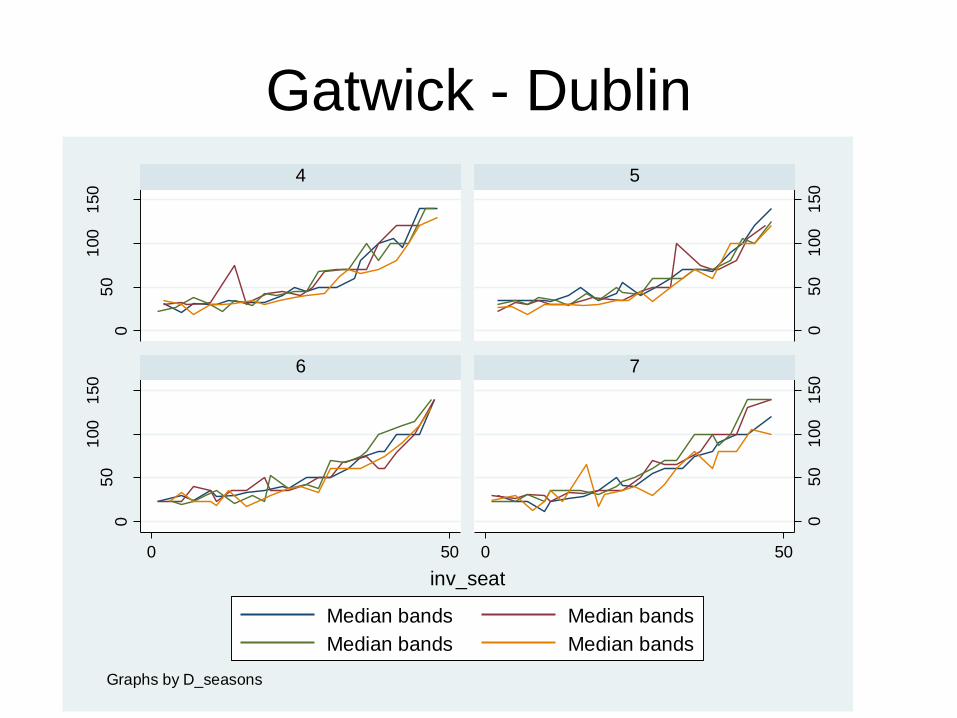
Gatwick - Dublin
05
01
00
150
05
01
00
150
05
01
00
150
05
01
00
150
0 50 0 50
4 5
6 7
Median bands Median bands
Median bands Median bands
Me
dia
n b
an
ds
inv_seat
Graphs by D_seasons
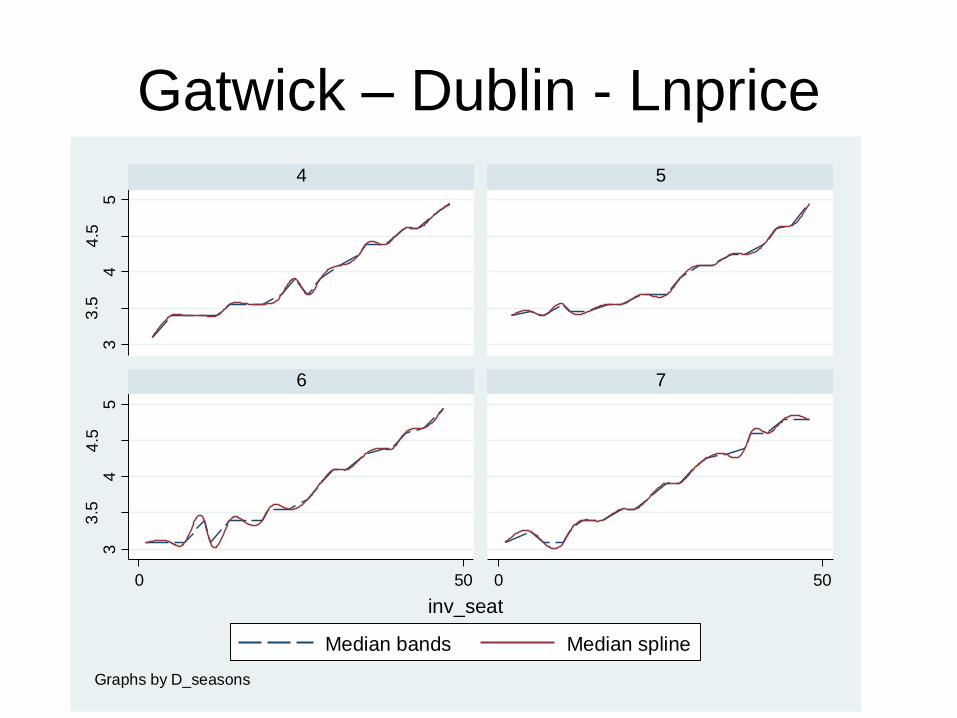
Gatwick – Dublin - Lnprice3
3.5
44
.55
33
.54
4.5
5
0 50 0 50
4 5
6 7
Median bands Median spline
inv_seat
Graphs by D_seasons
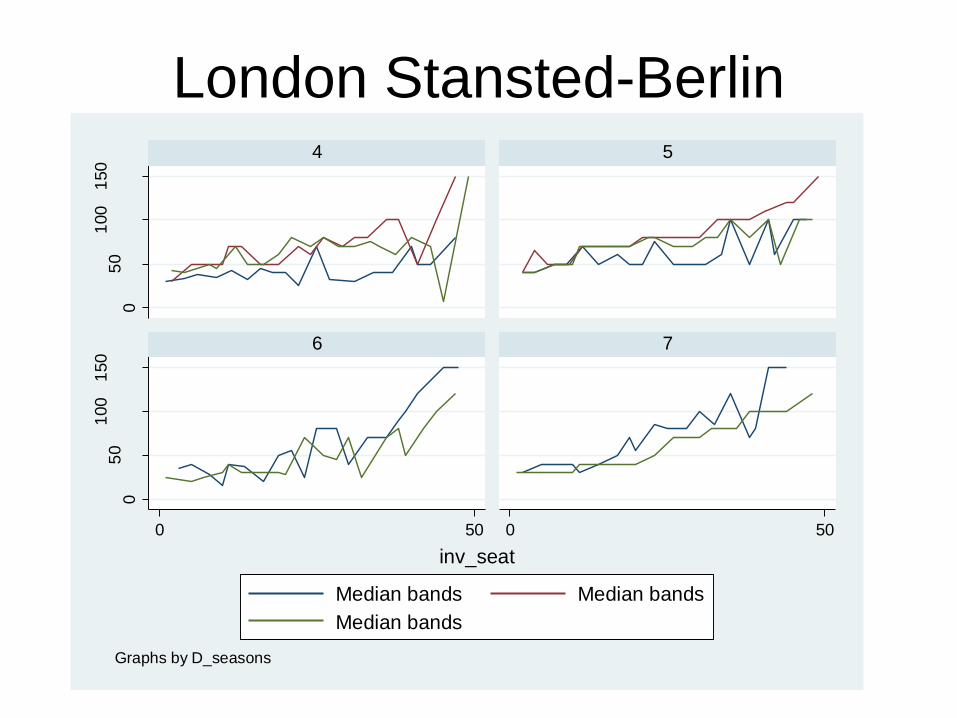
London Stansted-Berlin0
50
100
150
05
01
00
150
0 50 0 50
4 5
6 7
Median bands Median bands
Median bands
Me
dia
n b
an
ds
inv_seat
Graphs by D_seasons
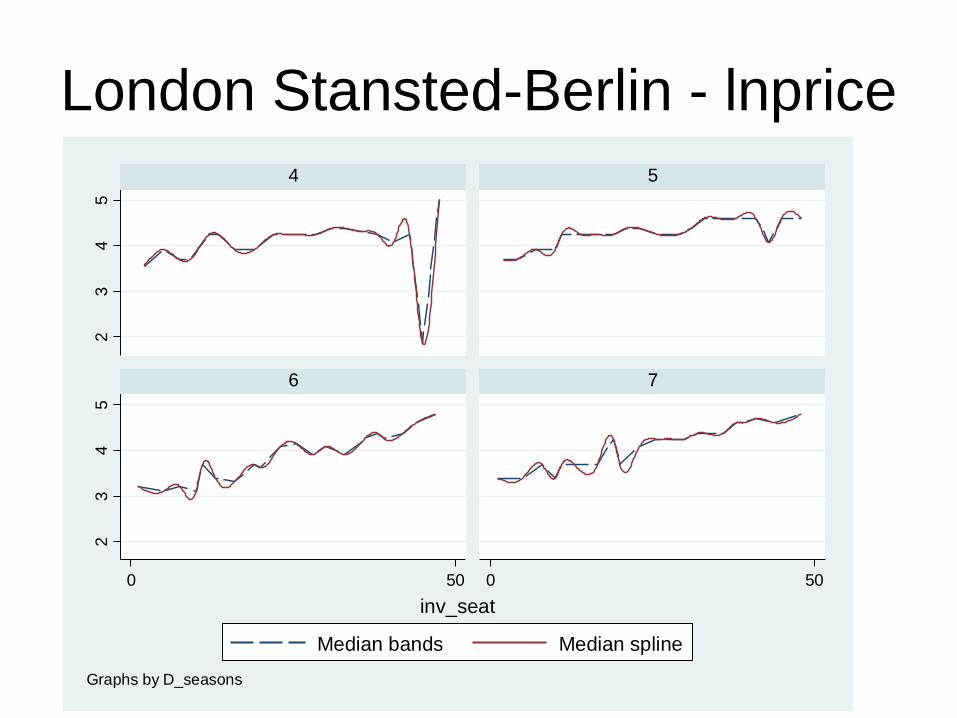
London Stansted-Berlin - lnprice2
34
52
34
5
0 50 0 50
4 5
6 7
Median bands Median spline
inv_seat
Graphs by D_seasons
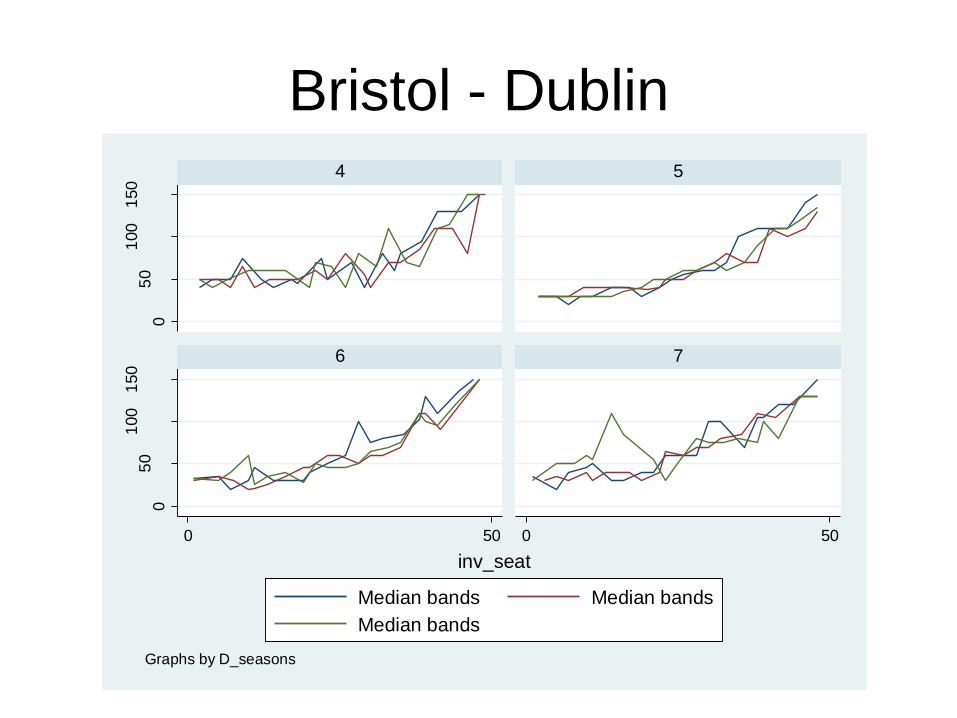
Bristol - Dublin0
50
100
150
05
01
00
150
0 50 0 50
4 5
6 7
Median bands Median bands
Median bands
Me
dia
n b
an
ds
inv_seat
Graphs by D_seasons
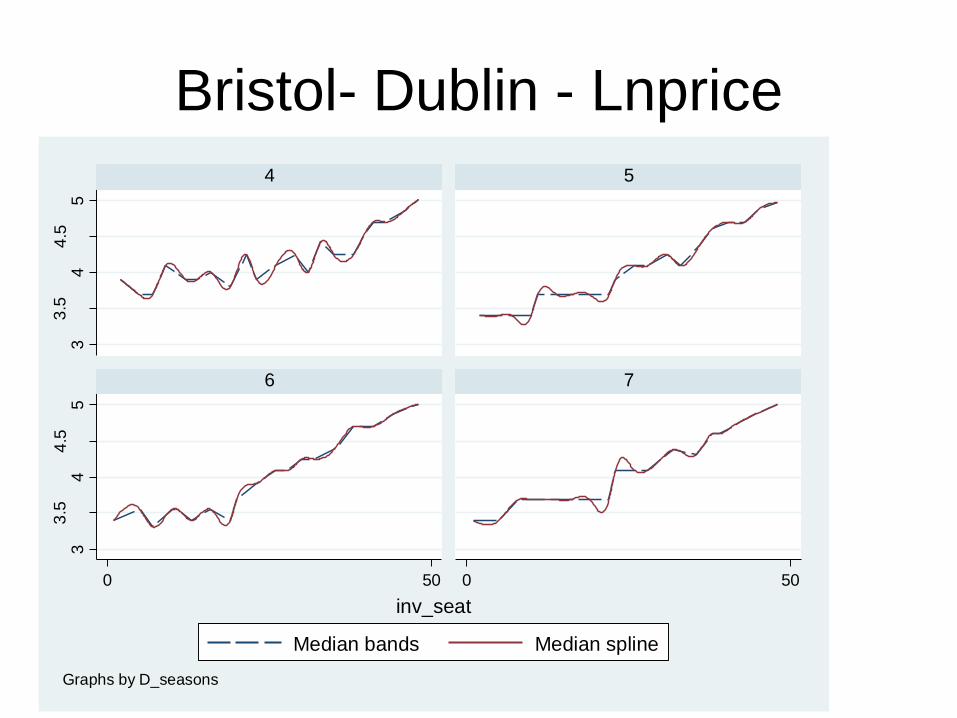
Bristol- Dublin - Lnprice3
3.5
44
.55
33
.54
4.5
5
0 50 0 50
4 5
6 7
Median bands Median spline
inv_seat
Graphs by D_seasons
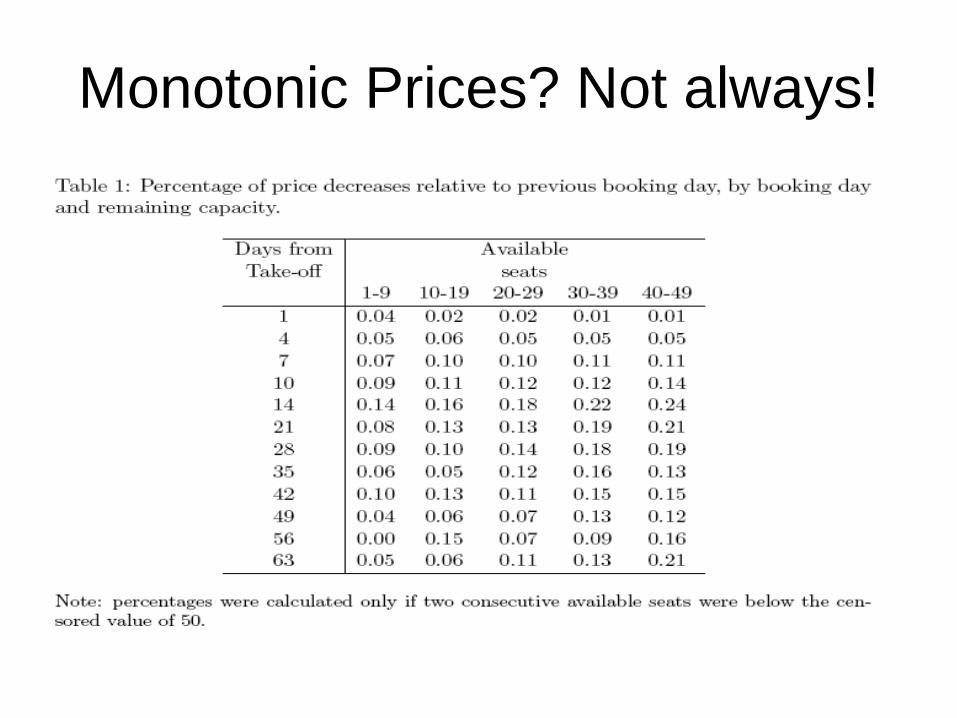
Monotonic Prices? Not always!
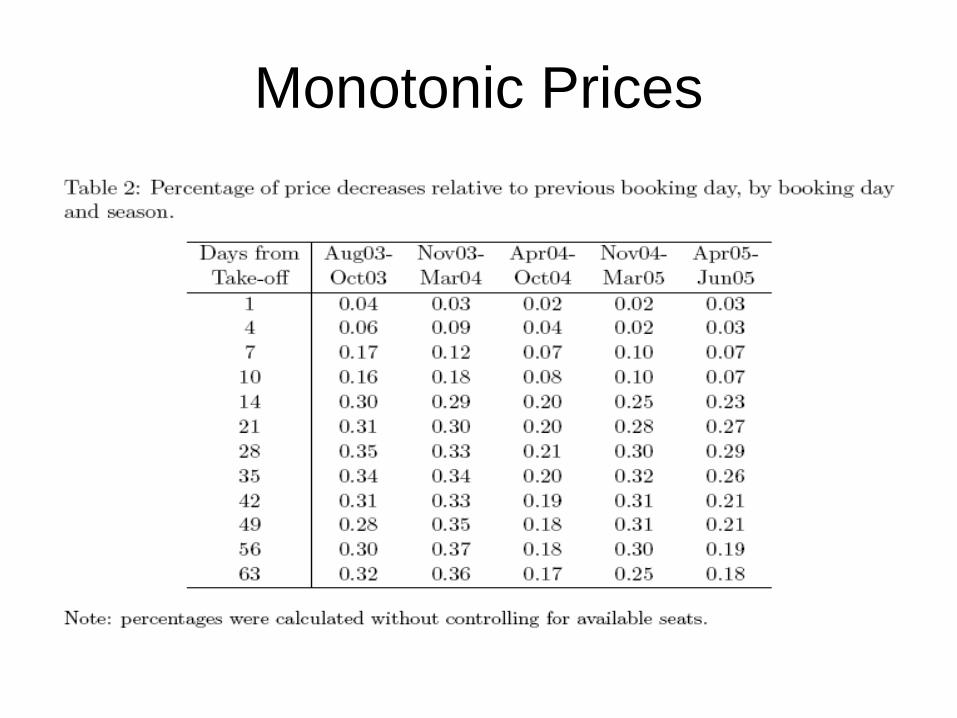
Monotonic Prices
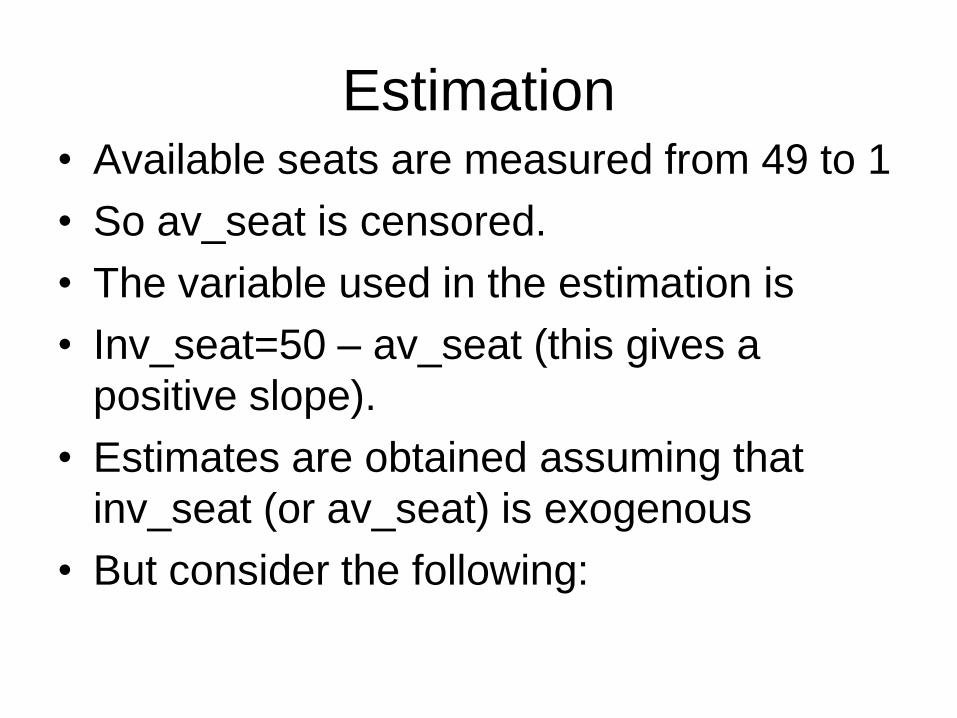
Estimation• Available seats are measured from 49 to 1
• So av_seat is censored.
• The variable used in the estimation is
• Inv_seat=50 – av_seat (this gives a
positive slope).
• Estimates are obtained assuming that
inv_seat (or av_seat) is exogenous
• But consider the following:
Panel Fixed Effect
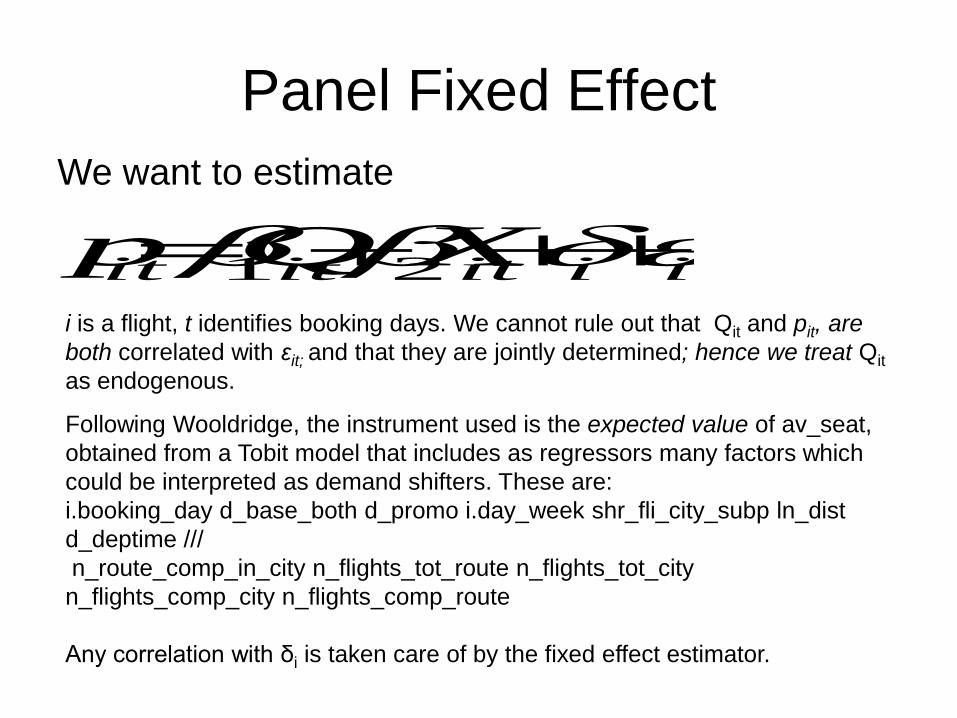
We want to estimate
itiititit XQp 21
i is a flight, t identifies booking days. We cannot rule out that Qit and pit, are
both correlated with εit; and that they are jointly determined; hence we treat Qit
as endogenous.
Following Wooldridge, the instrument used is the expected value of av_seat,
obtained from a Tobit model that includes as regressors many factors which
could be interpreted as demand shifters. These are:
i.booking_day d_base_both d_promo i.day_week shr_fli_city_subp ln_dist
d_deptime ///
n_route_comp_in_city n_flights_tot_route n_flights_tot_city
n_flights_comp_city n_flights_comp_route
Any correlation with δi is taken care of by the fixed effect estimator.
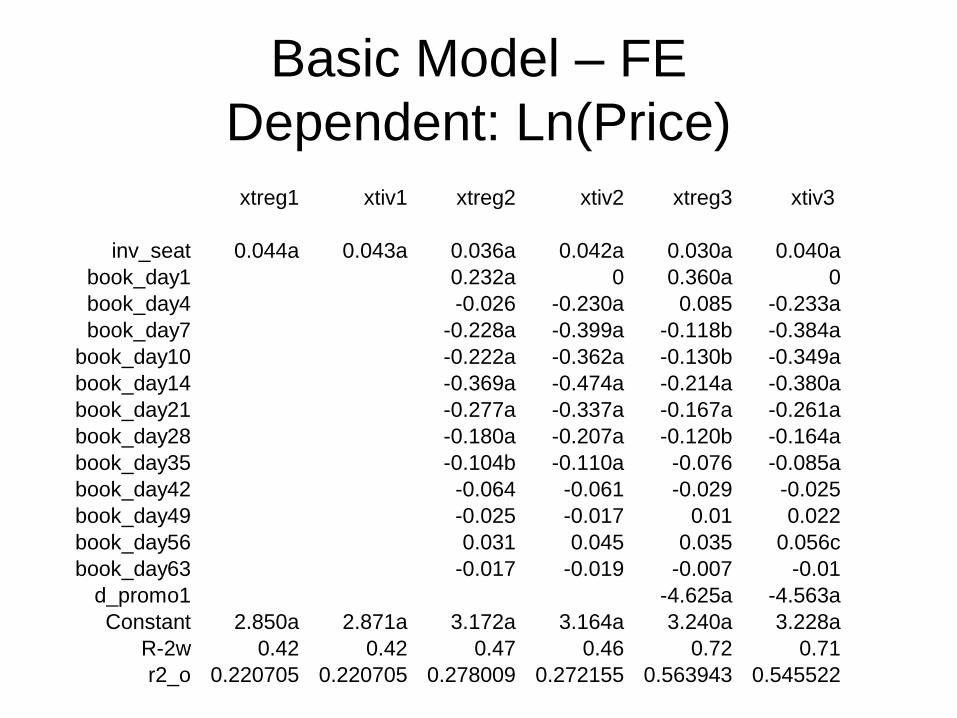
xtreg1 xtiv1 xtreg2 xtiv2 xtreg3 xtiv3
inv_seat 0.044a 0.043a 0.036a 0.042a 0.030a 0.040a
book_day1 0.232a 0 0.360a 0
book_day4 -0.026 -0.230a 0.085 -0.233a
book_day7 -0.228a -0.399a -0.118b -0.384a
book_day10 -0.222a -0.362a -0.130b -0.349a
book_day14 -0.369a -0.474a -0.214a -0.380a
book_day21 -0.277a -0.337a -0.167a -0.261a
book_day28 -0.180a -0.207a -0.120b -0.164a
book_day35 -0.104b -0.110a -0.076 -0.085a
book_day42 -0.064 -0.061 -0.029 -0.025
book_day49 -0.025 -0.017 0.01 0.022
book_day56 0.031 0.045 0.035 0.056c
book_day63 -0.017 -0.019 -0.007 -0.01
d_promo1 -4.625a -4.563a
Constant 2.850a 2.871a 3.172a 3.164a 3.240a 3.228a
R-2w 0.42 0.42 0.47 0.46 0.72 0.71
r2_o 0.220705 0.220705 0.278009 0.272155 0.563943 0.545522
Basic Model – FE
Dependent: Ln(Price)
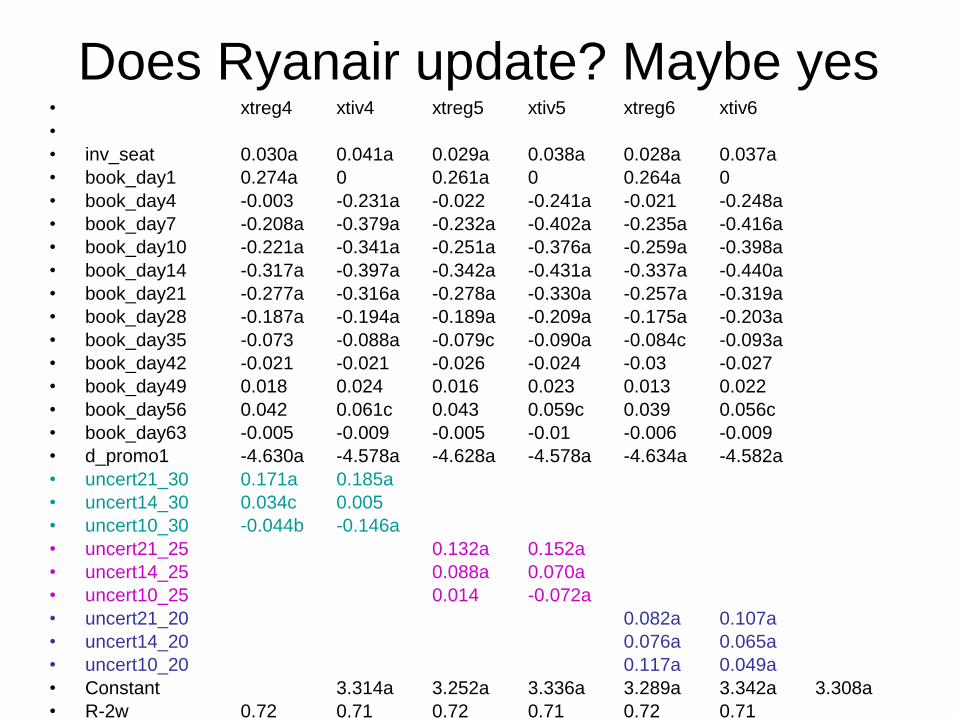
Does Ryanair update? Maybe yes• xtreg4 xtiv4 xtreg5 xtiv5 xtreg6 xtiv6
•
• inv_seat 0.030a 0.041a 0.029a 0.038a 0.028a 0.037a
• book_day1 0.274a 0 0.261a 0 0.264a 0
• book_day4 -0.003 -0.231a -0.022 -0.241a -0.021 -0.248a
• book_day7 -0.208a -0.379a -0.232a -0.402a -0.235a -0.416a
• book_day10 -0.221a -0.341a -0.251a -0.376a -0.259a -0.398a
• book_day14 -0.317a -0.397a -0.342a -0.431a -0.337a -0.440a
• book_day21 -0.277a -0.316a -0.278a -0.330a -0.257a -0.319a
• book_day28 -0.187a -0.194a -0.189a -0.209a -0.175a -0.203a
• book_day35 -0.073 -0.088a -0.079c -0.090a -0.084c -0.093a
• book_day42 -0.021 -0.021 -0.026 -0.024 -0.03 -0.027
• book_day49 0.018 0.024 0.016 0.023 0.013 0.022
• book_day56 0.042 0.061c 0.043 0.059c 0.039 0.056c
• book_day63 -0.005 -0.009 -0.005 -0.01 -0.006 -0.009
• d_promo1 -4.630a -4.578a -4.628a -4.578a -4.634a -4.582a
• uncert21_30 0.171a 0.185a
• uncert14_30 0.034c 0.005
• uncert10_30 -0.044b -0.146a
• uncert21_25 0.132a 0.152a
• uncert14_25 0.088a 0.070a
• uncert10_25 0.014 -0.072a
• uncert21_20 0.082a 0.107a
• uncert14_20 0.076a 0.065a
• uncert10_20 0.117a 0.049a
• Constant 3.314a 3.252a 3.336a 3.289a 3.342a 3.308a
• R-2w 0.72 0.71 0.72 0.71 0.72 0.71
r2_o 0.58 0.55 0.58 0.56 0.58 0.56
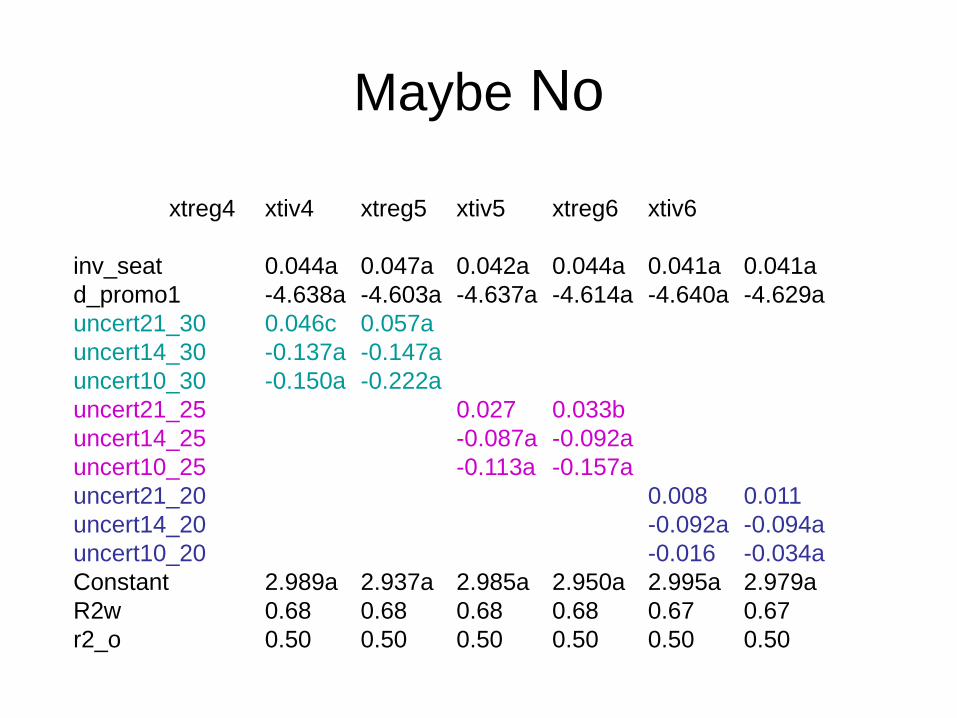
Maybe No
xtreg4 xtiv4 xtreg5 xtiv5 xtreg6 xtiv6
inv_seat 0.044a 0.047a 0.042a 0.044a 0.041a 0.041a
d_promo1 -4.638a -4.603a -4.637a -4.614a -4.640a -4.629a
uncert21_30 0.046c 0.057a
uncert14_30 -0.137a -0.147a
uncert10_30 -0.150a -0.222a
uncert21_25 0.027 0.033b
uncert14_25 -0.087a -0.092a
uncert10_25 -0.113a -0.157a
uncert21_20 0.008 0.011
uncert14_20 -0.092a -0.094a
uncert10_20 -0.016 -0.034a
Constant 2.989a 2.937a 2.985a 2.950a 2.995a 2.979a
R2w 0.68 0.68 0.68 0.68 0.67 0.67
r2_o 0.50 0.50 0.50 0.50 0.50 0.50
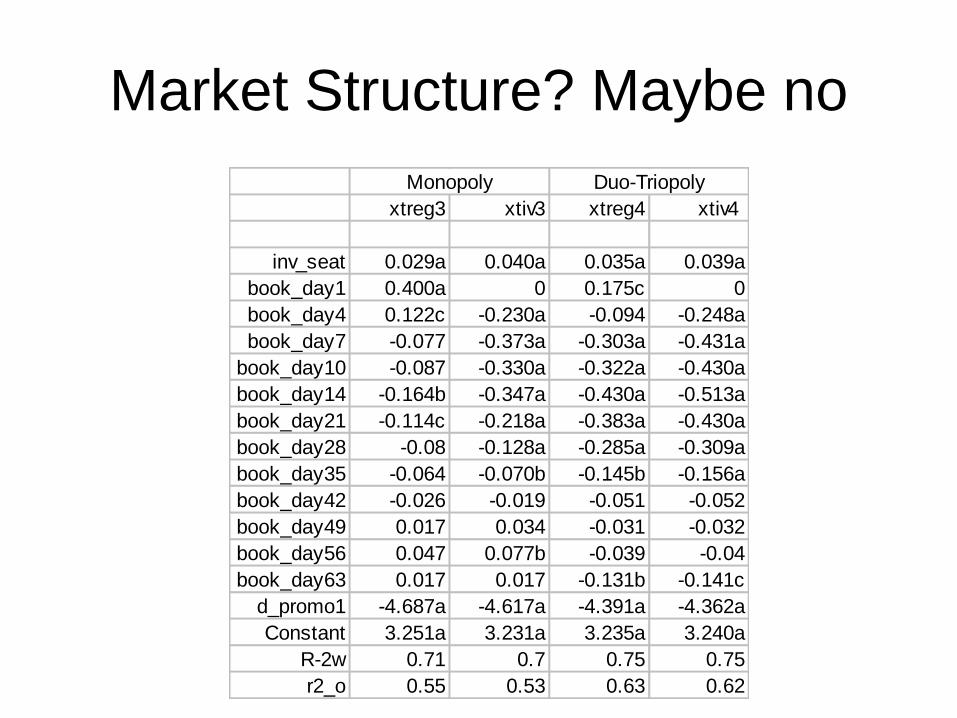
Market Structure? Maybe no
xtreg3 xtiv3 xtreg4 xtiv4
inv_seat 0.029a 0.040a 0.035a 0.039a
book_day1 0.400a 0 0.175c 0
book_day4 0.122c -0.230a -0.094 -0.248a
book_day7 -0.077 -0.373a -0.303a -0.431a
book_day10 -0.087 -0.330a -0.322a -0.430a
book_day14 -0.164b -0.347a -0.430a -0.513a
book_day21 -0.114c -0.218a -0.383a -0.430a
book_day28 -0.08 -0.128a -0.285a -0.309a
book_day35 -0.064 -0.070b -0.145b -0.156a
book_day42 -0.026 -0.019 -0.051 -0.052
book_day49 0.017 0.034 -0.031 -0.032
book_day56 0.047 0.077b -0.039 -0.04
book_day63 0.017 0.017 -0.131b -0.141c
d_promo1 -4.687a -4.617a -4.391a -4.362a
Constant 3.251a 3.231a 3.235a 3.240a
R-2w 0.71 0.7 0.75 0.75
r2_o 0.55 0.53 0.63 0.62
Monopoly Duo-Triopoly
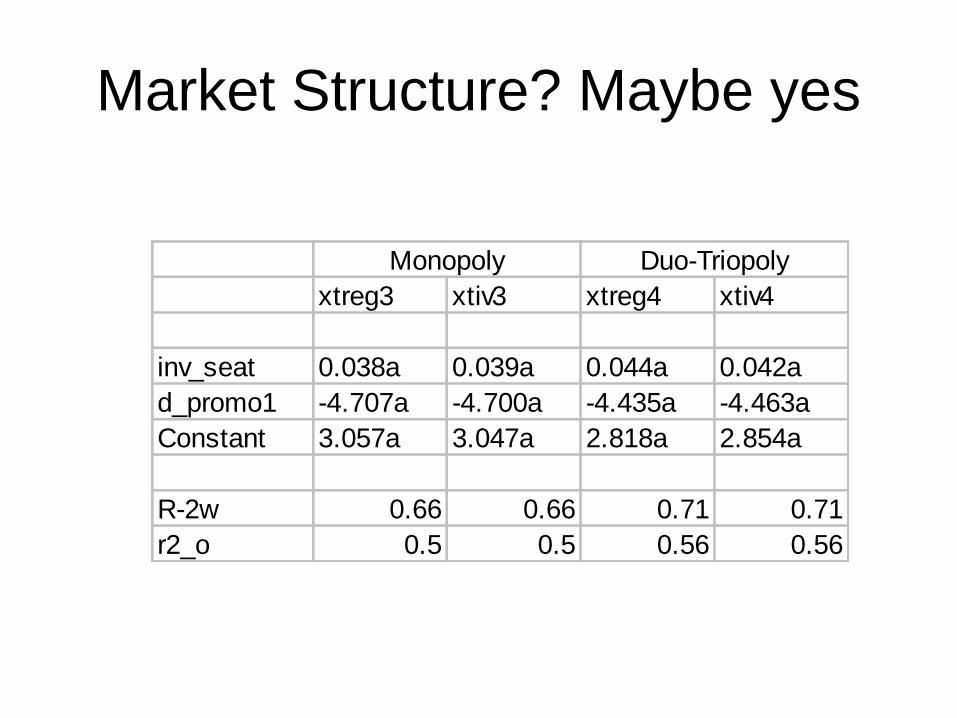
Market Structure? Maybe yes
xtreg3 xtiv3 xtreg4 xtiv4
inv_seat 0.038a 0.039a 0.044a 0.042a
d_promo1 -4.707a -4.700a -4.435a -4.463a
Constant 3.057a 3.047a 2.818a 2.854a
R-2w 0.66 0.66 0.71 0.71
r2_o 0.5 0.5 0.56 0.56
Monopoly Duo-Triopoly
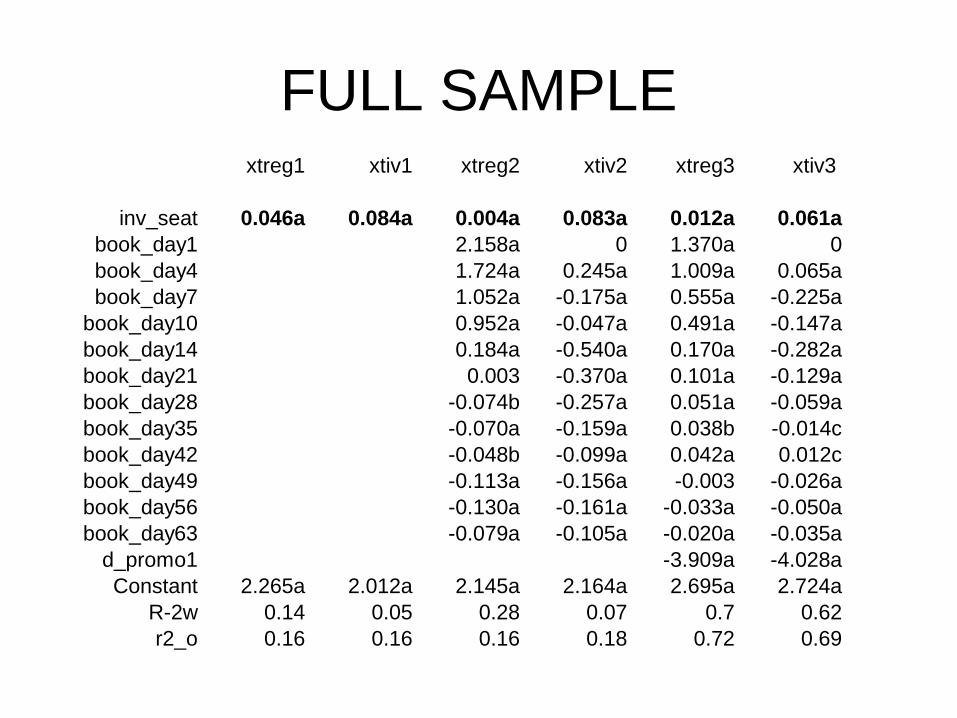
FULL SAMPLExtreg1 xtiv1 xtreg2 xtiv2 xtreg3 xtiv3
inv_seat 0.046a 0.084a 0.004a 0.083a 0.012a 0.061a
book_day1 2.158a 0 1.370a 0
book_day4 1.724a 0.245a 1.009a 0.065a
book_day7 1.052a -0.175a 0.555a -0.225a
book_day10 0.952a -0.047a 0.491a -0.147a
book_day14 0.184a -0.540a 0.170a -0.282a
book_day21 0.003 -0.370a 0.101a -0.129a
book_day28 -0.074b -0.257a 0.051a -0.059a
book_day35 -0.070a -0.159a 0.038b -0.014c
book_day42 -0.048b -0.099a 0.042a 0.012c
book_day49 -0.113a -0.156a -0.003 -0.026a
book_day56 -0.130a -0.161a -0.033a -0.050a
book_day63 -0.079a -0.105a -0.020a -0.035a
d_promo1 -3.909a -4.028a
Constant 2.265a 2.012a 2.145a 2.164a 2.695a 2.724a
R-2w 0.14 0.05 0.28 0.07 0.7 0.62
r2_o 0.16 0.16 0.16 0.18 0.72 0.69
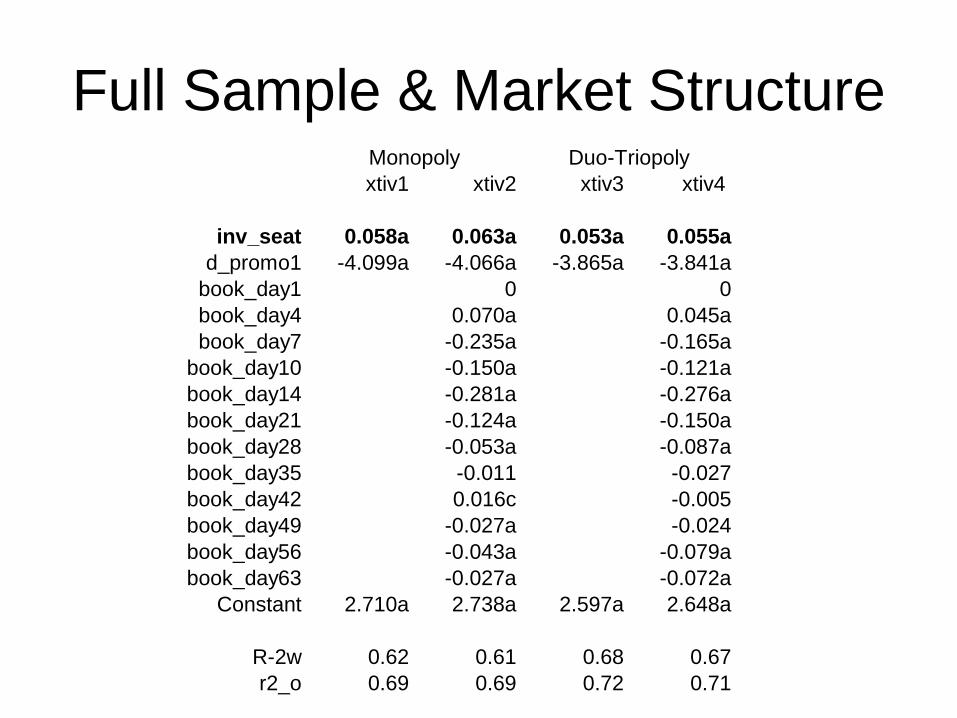
Full Sample & Market Structure
xtiv1 xtiv2 xtiv3 xtiv4
inv_seat 0.058a 0.063a 0.053a 0.055a
d_promo1 -4.099a -4.066a -3.865a -3.841a
book_day1 0 0
book_day4 0.070a 0.045a
book_day7 -0.235a -0.165a
book_day10 -0.150a -0.121a
book_day14 -0.281a -0.276a
book_day21 -0.124a -0.150a
book_day28 -0.053a -0.087a
book_day35 -0.011 -0.027
book_day42 0.016c -0.005
book_day49 -0.027a -0.024
book_day56 -0.043a -0.079a
book_day63 -0.027a -0.072a
Constant 2.710a 2.738a 2.597a 2.648a
R-2w 0.62 0.61 0.68 0.67
r2_o 0.69 0.69 0.72 0.71
Monopoly Duo-Triopoly
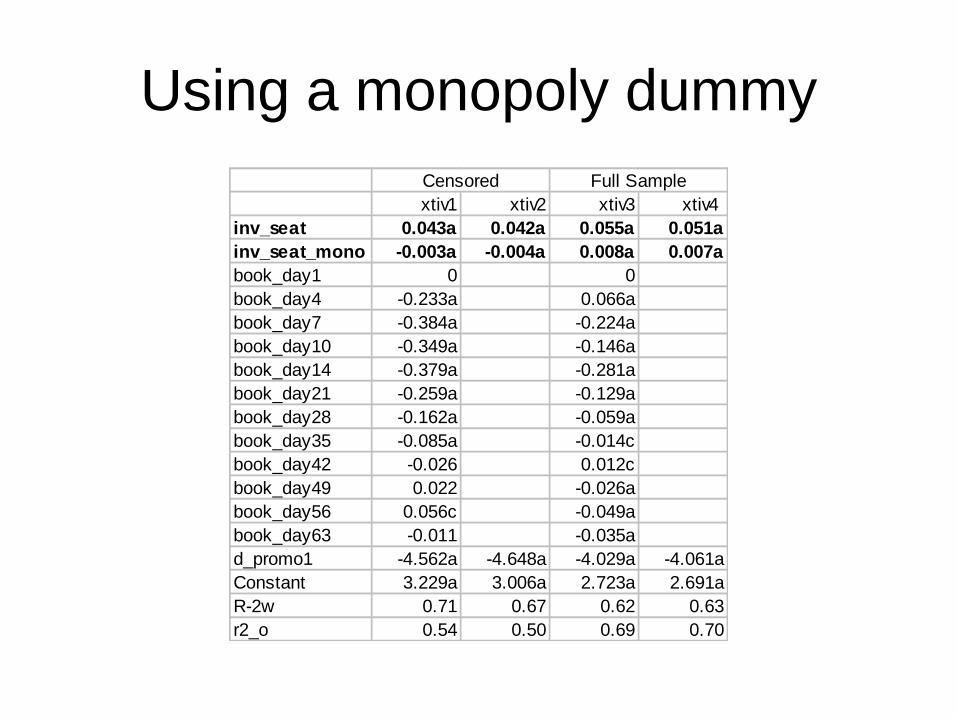
Using a monopoly dummy
xtiv1 xtiv2 xtiv3 xtiv4
inv_seat 0.043a 0.042a 0.055a 0.051a
inv_seat_mono -0.003a -0.004a 0.008a 0.007a
book_day1 0 0
book_day4 -0.233a 0.066a
book_day7 -0.384a -0.224a
book_day10 -0.349a -0.146a
book_day14 -0.379a -0.281a
book_day21 -0.259a -0.129a
book_day28 -0.162a -0.059a
book_day35 -0.085a -0.014c
book_day42 -0.026 0.012c
book_day49 0.022 -0.026a
book_day56 0.056c -0.049a
book_day63 -0.011 -0.035a
d_promo1 -4.562a -4.648a -4.029a -4.061a
Constant 3.229a 3.006a 2.723a 2.691a
R-2w 0.71 0.67 0.62 0.63
r2_o 0.54 0.50 0.69 0.70
Censored Full Sample