Embed Size (px)
Citation preview
ARTICLE IN PRESS
0890-6955/$ - se
doi:10.1016/j.ijm
�CorrespondE-mail addr
International Journal of Machine Tools & Manufacture 47 (2007) 1847–1853
www.elsevier.com/locate/ijmactool
On-line tool wear monitoring using geometric descriptorsfrom digital images
M. Castejona, E. Alegrea, J. Barreiroa,�, L.K. Hernandezb
aEscuela de Ingenierıas Industrial e Informatica, Universidad de Leon, Campus de Vegazana, 24071 Leon, SpainbDepartment de Ingenierıa Mecanica, Industrial y Mecatronica, Universidad de Pamplona, Km 1 vıa Bucaramanga Pamplona, Colombia
Received 28 September 2006; received in revised form 30 March 2007; accepted 4 April 2007
Available online 12 April 2007
Abstract
A new method based on a computer vision and statistical learning system is proposed to estimate the wear level in cutting inserts in
order to identify the time for its replacement. A CNC parallel lathe and a computer vision system have been used to obtain 1383 flank
images. A binary image for each of the former wear flank images have been obtained by applying several pre-processing and segmenting
operations. Every wear flank region has been described by means of nine geometrical descriptors. LDA (linear discriminant analysis)
shows that three out of the nine descriptors provide the 98.63% of the necessary information to carry out the classification, which are
eccentricity, extent and solidity. The result obtained using a finite mixture model approach shows the presence of three clusters using
these descriptors, which correspond with low, medium and high wear level. A monitoring approach is performed using the tool wear
evolution for each insert along machining and the discriminant analysis. This evolution represents the probability of belonging to each
one of the wear classes (low, medium and high). The estimate of the wear level allows to replace the tool when the wear level is located at
the end of the M class (medium), preventing that the tool enters into the H class (high).
r 2007 Elsevier Ltd. All rights reserved.
Keywords: Tool wear; Monitoring; Computer vision; Image classification
1. Introduction
Development of on-line measurement systems to reportthe wear level of tool inserts in unmanned metal cuttingprocesses is an issue of paramount importance for thecontrol of automated production environments. Produc-tion costs cut down associated to lower human resourcesrequirements—the supervision of a machinist is no longerrequired—and the benefits of operating at higher cuttingspeeds come, unfortunately, at the price of shorter toollives. Last decade has witnessed a growing awareness of theincreased production benefits related to extending the useof the tool insert beyond the standard limits. In spite of themany efforts focused on this issue, the quest for asatisfactory on-line monitoring solution has not yetreached an end because of the great difficulties involvedin tool wear measurement.
e front matter r 2007 Elsevier Ltd. All rights reserved.
achtools.2007.04.001
ing author. Tel.: +34987 191792; fax: +34 987 291930.
ess: [email protected] (J. Barreiro).
Turning, milling and drilling [1] are processes involved inthe manufacture of the large majority of goods, whichmakes the cost of the tool inserts become an importantamount of the production costs, especially in the unmannedproduction context. As reported by Teti [2] and Weck-enmann et al. [3], the costs of cutting tools and their replace-ment account for 3–12% percent of the total productioncosts. Production costs are closely linked with the cost of thecutting tools and their usage since they accrue throughoutthe use of the equipment. Although small at first glance, it isevident that where cutting tools are concerned, a consider-able amount of money can be either spent or saved [4]. Inaddition, about 20% of non-productive time is due to toolfailure [5] in modern machines. On-line monitoring of wearlevel might improve the decision making process involved intool insert replacement, by means of taking advantage of afacts based approach instead of relying on the subjectivecriteria of the machinist. It has been reported [6] that byusing wear sensors a tool cost saving of up to 40% may bereached, a clear business opportunity.
ARTICLE IN PRESSM. Castejon et al. / International Journal of Machine Tools & Manufacture 47 (2007) 1847–18531848
It is very important, therefore, to develop precisemethods to predict the tool wear level, its evolution andremaining useful life. The machine control system shouldbe able to provide optimized strategies for tool replacementand the adjustment of tool correctors.
Tool wear measurement studies carried out so farprovide interesting information about the tool conditionduring the machining operation; however, the results arerestricted to the measurement of very particular dimen-sional characteristics [1,3,7–11]. It would be interesting tocomplete this information with more features to betterdetermine the actual condition of the tool. Other research-ers have combined signals coming from different types ofsensors, which is known as sensor fusion [12–15]. However,the bulk of the literature in this context proposes the use ofindirect measures obtained from acoustic and vibrationsensors, cutting forces, power or current consumption andothers. However, some direct wear measurement should beconsidered to improve the performance.
Tool wear and its measurement are described in severalstandards (ISO 3685, ISO 8688, ISO 883, ISO 3364, ISO6987 and ISO 9361). These standards provide wearthreshold values at several points of the worn region asreference values for considering the tool insert replacement.However, technological advances in machines, tools andpart materials have rendered these standards obsolete. Thethreshold values included in these standards are tooconservative for current technology and, thus, theirindustrial application is not adequated. Many studiesdemonstrate that machining in good conditions is stillpossible over these threshold values. Besides, practical rulesfor tool replacement often used at industrial environmentsare not good enough, since they are based on fixed valuesfor cutting time, number of machined parts or othercriteria based on statistical tool life prediction. Tool lifewill be optimized if the tool is used during more timeproducing in tolerance dimensions and surface qualityparts. The industrial practical rules do not allow to achievea good degree of optimization. On-line tool conditionmonitoring (TCM) is a very interesting alternative tostatistical tool life prediction for the reduction of manu-facturing costs.
For these reasons, during last years several researchershave been working in the characterization of the qualitativeand quantitative morphology of tool wear, as well as intool monitoring systems. State of the art in sensor systemsand their industrial application has been investigated byseveral researchers [5,16–22]. These works classify thetechniques of measurement in two main groups: direct andindirect methods. Direct methods measure the weardirectly over the tool, while indirect methods use inter-mediate process variables that are correlated with the toolwear, such as cutting forces, acoustic and vibration signalsand others.
In general, indirect methods make easier the tool wearmeasurement, since they do not require the machiningprocess to stop. For this reason, they have been the most
popular methods for years. However, precision is not asgood as that achieved with direct methods, since themeasurement is affected by noise signals [5,9,21,23]; hencethe insistence on implementing direct methods for wearmeasurement without machining interruption and toolextraction from the machine or tool-holder.Ref. [24] includes a review of monitoring systems. This
reference indicates that direct optic systems are the mostreliable, in spite of their high cost. Nevertheless, contin-uous progress has taken place in sensors technology and, inparticular, vision sensors have been specially improved inperformance but also in cost reduction. For this reason,different researchers have used them for on-line tool wearmeasurement. In addition, advances in image processingand artificial intelligence technology provide more reliableimage analyses and tool replacement strategies. The highnumber of applications cited in the state of the artdemonstrates that computer vision systems are already amature technology. However, the characterization ofdifferent wear morphologies has not been efficientlyachieved yet. One of the reasons is the fact that previouswork in literature focuses either in optimization of theimage acquisition system, including lightening, or in imageprocessing optimization. However, there is an importantchance for improvement if classification techniques areapplied as a method to monitoring the tool life time. Thestate of the art reveals that these techniques are not appliedin this way in spite of they are well known. This is one ofthe goals of this research.State of the art in TCM using computer vision systems
indicates two main work lines: (i) systems that use direc-tional light for flank wear measurement [1,5,8–10,25–27]and (ii) systems that use structured light and 3D recon-struction for crater wear measurement [3,23,27–29]. Mostof the industrial applications indicate that the predominantcriteria that determines tool replacement is the wear inflank, in contrast with the wear in crater that is restricted toparticular part material–tool material matching.In consequence, our research is focused on flank wear
characterization of turning tool inserts by means ofcomputer vision techniques together with classificationtechniques based on geometric descriptors. The objective isto identify the morphology and wear level to adopt thecorrective actions in each state.
2. Materials and methods
2.1. Machining and vision systems
A CNC parallel lathe with a maximum turning speedof 2300 rpm has been used for the tests. AISI SAE 1045(20 HB, normalized) and 4140 (34 HB, tempered) steel barsof 250mm of length and 90mm of diameter weremachined. The tool inserts were covered tungsten carbide,rhombic, and high tough. Different values were used forthe cutting parameters: cutting speeds (Vc) between 140and 200m/min, feed rate (f) of 0.2mm/rev and depth of
ARTICLE IN PRESSM. Castejon et al. / International Journal of Machine Tools & Manufacture 47 (2007) 1847–1853 1849
cutting (ap) at 2mm remain constant. Tools were disas-sembled and located in a tool-fixture after machining afull pass along the part; tool-fixture allows keepingconstant the flank location in the image. Additionally,the roughness and hardness of the machined surface weremeasured [30].
2.2. Image acquisition
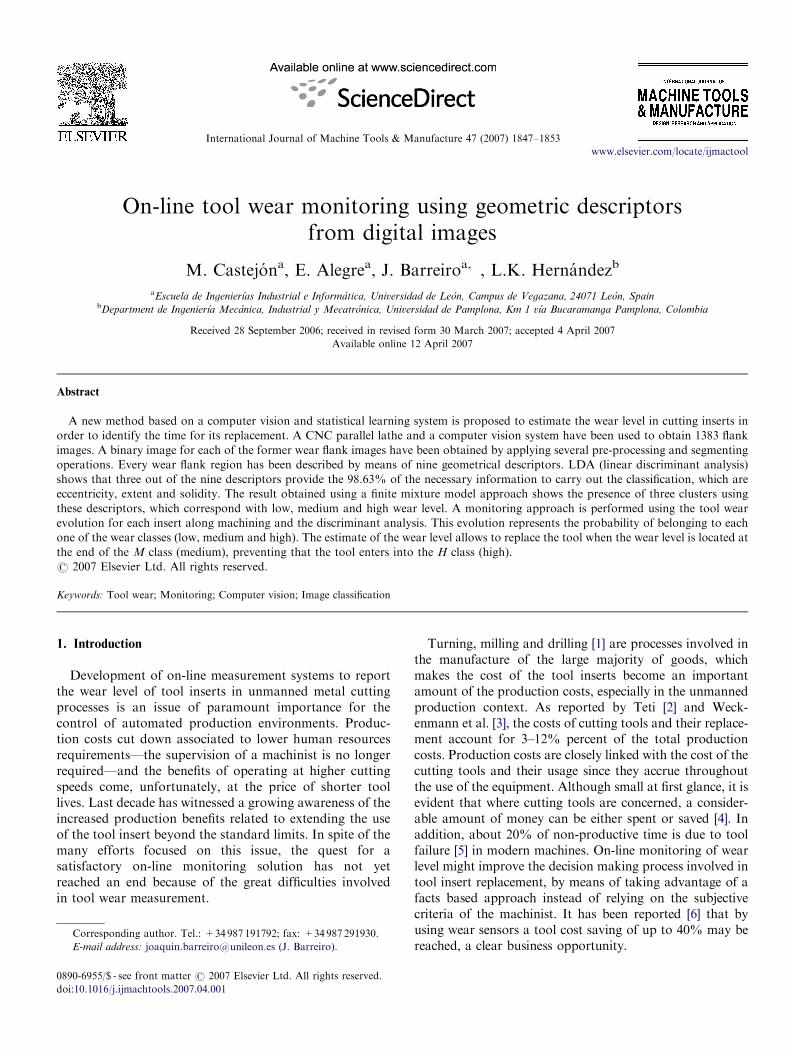
Images have been acquired [30] using a Pullnix PE2015B/W camera with 1/300 CCD. Digitalization was carried outwith a Matrox Meteor II card. The optical system iscomposed by a 70XL industrial zoom of OPTEM, with anextension tube of 1X and 0.5X/0.75X/1.5X/2.0X OPTEMlens. The lighting system is composed by a DCRsIIIregulated light source of FOSTEC that provides an intensecold lighting. A SCDI system of diffuse lighting of NERSCDI-25-F0 is used to avoid shines. The system providesdiffuse lighting in the same direction as the camera axis.Positioning of lighting is carried out by means of a singlebundle of Fostec. Fig. 1 shows the machine with the visionsystem.
Image acquisition is achieved using a developed applica-tion that uses the Matlab image acquisition toolbox. The
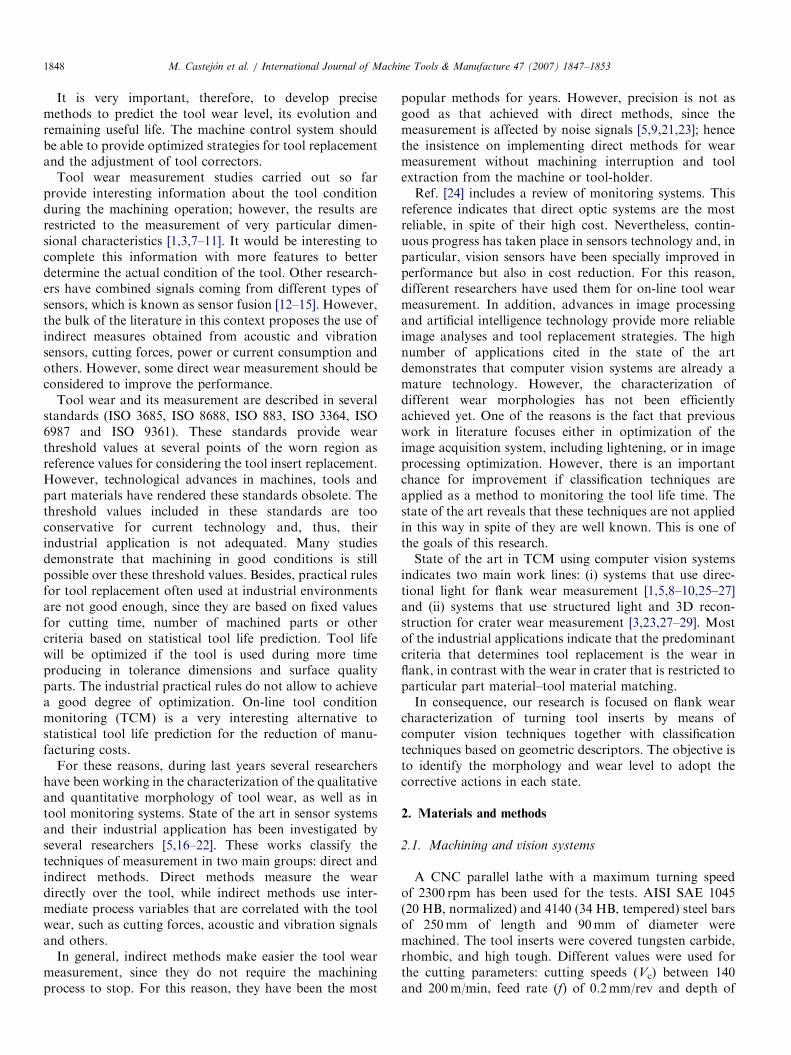
Fig. 2. (a) First images in a series showing three wear level
Fig. 1. Equipment used for the tests: vision system and lathe.
application has three main modules: setup of the camera,setup of the sequence and acquisition of the image. Thesemodules provide information of the capturing device andlet the user choose the resolution, define the informationstorage path and save the images acquired.
2.3. Image processing
Using the former vision system, 1383 flank images wereacquired. Initially, a low-pass filter was applied to eachimage for background blurring and to make the segmenta-tion easier. Later on, the region of interest was cropped andthe contrast was enhanced by means of a histogramstretching.After that, the images were manually segmented. The
original images, in gray scale, and the binary segmentedimages were stored in tiff format with compression withoutloss (Fig. 2). Image processing and extraction of geome-trical descriptors were performed using Matlab and theimage processing toolbox.
2.4. Image descriptors
The description of the wear regions has been carried outusing nine basic descriptors commonly used with binaryimages. These descriptors have been chosen becausechanges in the region of interest affect mainly to the areaand the relationship between the minor and major axes.The following geometrical descriptors were obtained foreach one of the 1383 binary images:
(a)
s; (b
Area: number of pixels in the wear region.
(b) Length of major axis: length of the major axis of theellipse that has the same normalized second centralmoments as the region.
(c)
Length of minor axis: length of the minor axis of theellipse that has the same normalized second centralmoments as the region.(d)
Eccentricity: eccentricity of the ellipse that has the samesecond moments as the region. The eccentricity (1) isthe distance ratio between the ellipse foci, c, and itsmajor axis length, a. Value is in the range 0–1 (0 and 1are degenerated cases; an ellipse with eccentricity 0 is a) segmented images with the worn region in white.
ARTICLE IN PRESSM. Castejon et al. / International Journal of Machine Tools & Manufacture 47 (2007) 1847–18531850
circle, while an ellipse with eccentricity 1 is a linesegment):
e ¼c
a. (1)
(e)
Orientation: angle in degrees between the x-axis and themajor axis of the ellipse that has the same secondmoments as the region.(f)
Convex area: number of pixels in the convex image.Convex image is the convex hull with all pixels withinthe hull filled in. The convex hull or convex envelopefor a set of points S in a real vector space V is theminimal convex set containing S. The convex hull of aset of points S in n dimensions is the intersection of allconvex sets containing S. For N points P1, y, PN, theconvex hull C is given by the expression (2):c ¼XN
j¼1
ljpj : lj � 08j andXN
j¼1
lj ¼ 1
( ). (2)
(g)
Equivalent diameter: diameter of a circle with the samearea as the region. It is computed as indicated in (3).ED ¼
ffiffiffiffiffiffiffiffiffiffiffiffiffiffiffiffi4 �Area
p
r. (3)
(h)
Solidity: proportion of pixels in the convex hull that arealso in the region. It is computed as indicated in (4).S ¼Area
Convex Area. (4)
(i)
Extent: proportion of pixels in the bounding box thatare also in the region. It is computed as indicated in (5).The Bounding Box is the smallest rectangle containingthe region.E ¼Area
Bounding Box Area. (5)
A feature vector is generated. It is composed by the nineprevious values and it describes the wear region.
3. tests and results
3.1. Determination of the existing wear classes
The collected features allowed us to perform a clusteranalysis in order to reveal the underlying structuressupporting the data set. A finite mixture model approachwas adopted, in consideration of the complex nature of thedata. The finite mixture model clustering is a model basedclustering technique that attempts to fit the parameters thatbetter characterize the distributions of the differentsubpopulations generating the sample. The search for thebest parameters, those with maximum probability, is
usually performed by means of the expectation–maximiza-tion (EM) algorithm [37,38].For the data analysis, we found extremely useful the
implementation of the Mclust algorithm [31–35] runningunder R, a free software environment for statistical compu-ting and graphics [36]. The obtained results suggested thepresence of three clusters that could be referred, eventually,to three distinct wear levels: low, medium and high.The Mclust algorithm provides the mixture of multivariate
normal models that best fit the supporting data. Themodelling of the clusters by means of multivariate normaldistributions provides a clustering technique that is robust toaffine equivariant transformations to the data set, which ismandatory in cases such as this one where the variables mighthave been measured in different units. Along the way, Mclusttakes advantage of the EM algorithm [37,38] in order to findthe maximum likelihood set of parameters. The resultscomprehend not only the optimal values of the parametersbut also some hints about the number of clusters by means ofthe Bayesian information criterion [39].Whereas traditional model based clustering techniques
perform a hard partitioning of the data set, the finitemixture model approach allows each observation—eachfeature vector describing the worn region—to belongsimultaneously to every cluster. The degree in which anobservation belongs to a certain class depends on itsproximity to the center of the class, a distance that is mea-sured according to the defining parameters of each cluster.Of special interest is the LDA [40,41] projection of the
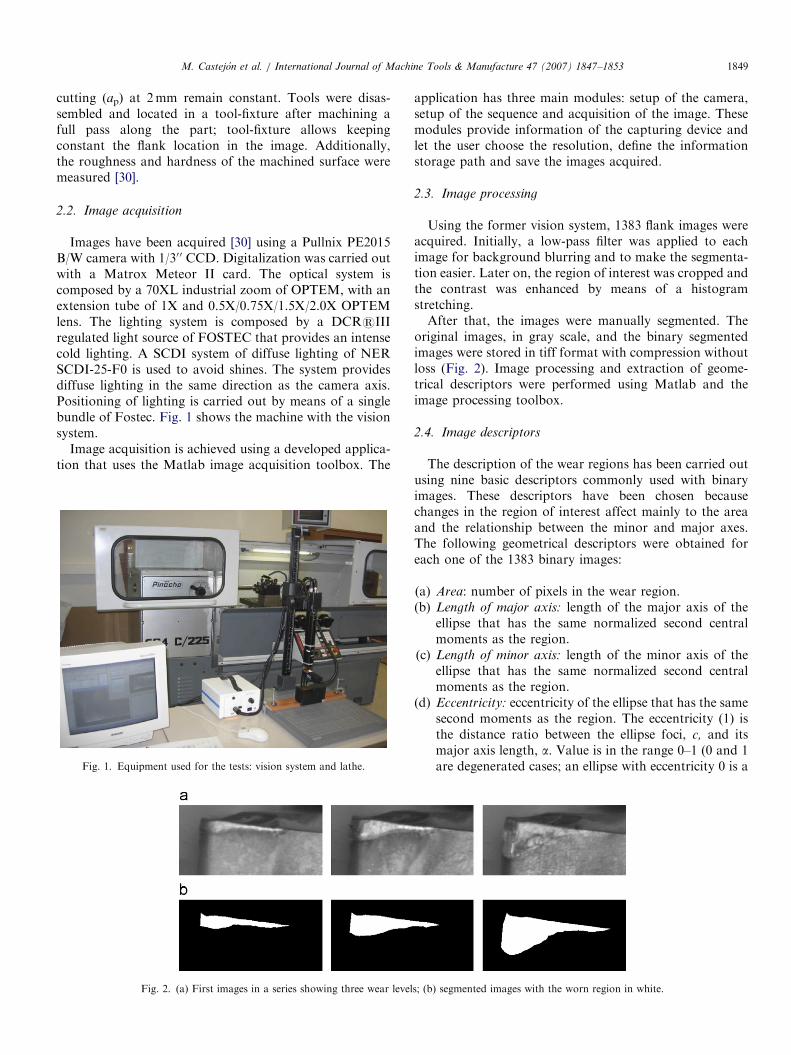
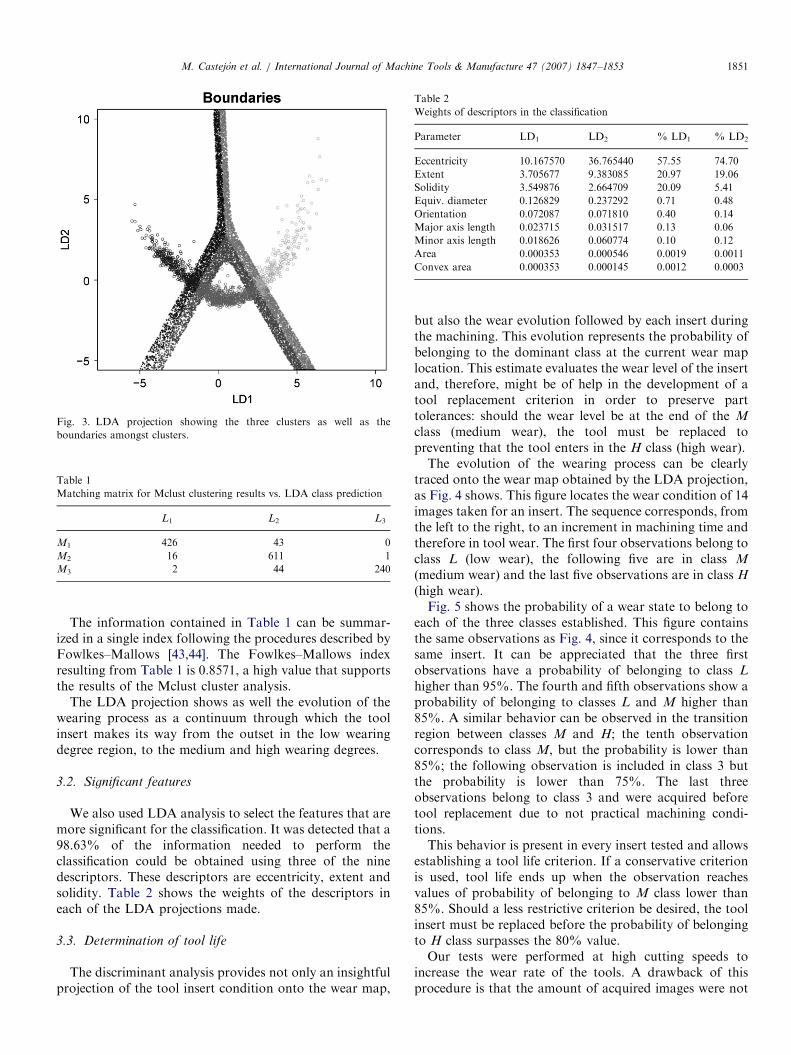
data set obtained by considering the class identifiersresulting from the Mclust algorithm, which is showed inFig. 3. The axes of the LDA projection, LDi, are orientedtowards those directions where the compactness of theclusters is higher and the separation amongst the clusters islarger. The projection of the data set onto these axesprovides the picture that best distinguishes the differentclusters. Fig. 3 also shows the boundaries amongst wearclusters. These boundaries divide the map in three regionslow worn region (left side), medium worn region (center)and high worn region (right side).The LDA approach allows to test the quality of the
results provided by the clustering algorithm; based onconsidering that a clustering has been correctly determinedif their parameters can be used back again to build apredictive model whose results mimic the original behavior.The 1386 wear observations acquired were classified
according to LDA as follows: 33.91% were assigned toclass L (low wear); 45.40% to class M (medium wear);20.67% to class H (high wear).The comparison amongst the results obtained by the
Mclust algorithm and those obtained by the predictionperformed using the discriminant analysis can be expressedas a matching matrix [42], as shown in Table 1. The cij
element of the matrix represents the number of elementsthat simultaneously belong to the Mi and Lj classes, whereMi is the ith class identified by the Mclust algorithm and Lj
is the jth class predicted by the LDA.
ARTICLE IN PRESS
Fig. 3. LDA projection showing the three clusters as well as the
boundaries amongst clusters.
Table 1
Matching matrix for Mclust clustering results vs. LDA class prediction
L1 L2 L3
M1 426 43 0
M2 16 611 1
M3 2 44 240
Table 2
Weights of descriptors in the classification
Parameter LD1 LD2 % LD1 % LD2
Eccentricity 10.167570 36.765440 57.55 74.70
Extent 3.705677 9.383085 20.97 19.06
Solidity 3.549876 2.664709 20.09 5.41
Equiv. diameter 0.126829 0.237292 0.71 0.48
Orientation 0.072087 0.071810 0.40 0.14
Major axis length 0.023715 0.031517 0.13 0.06
Minor axis length 0.018626 0.060774 0.10 0.12
Area 0.000353 0.000546 0.0019 0.0011
Convex area 0.000353 0.000145 0.0012 0.0003
M. Castejon et al. / International Journal of Machine Tools & Manufacture 47 (2007) 1847–1853 1851
The information contained in Table 1 can be summar-ized in a single index following the procedures described byFowlkes–Mallows [43,44]. The Fowlkes–Mallows indexresulting from Table 1 is 0.8571, a high value that supportsthe results of the Mclust cluster analysis.
The LDA projection shows as well the evolution of thewearing process as a continuum through which the toolinsert makes its way from the outset in the low wearingdegree region, to the medium and high wearing degrees.
3.2. Significant features
We also used LDA analysis to select the features that aremore significant for the classification. It was detected that a98.63% of the information needed to perform theclassification could be obtained using three of the ninedescriptors. These descriptors are eccentricity, extent andsolidity. Table 2 shows the weights of the descriptors ineach of the LDA projections made.
3.3. Determination of tool life
The discriminant analysis provides not only an insightfulprojection of the tool insert condition onto the wear map,
but also the wear evolution followed by each insert duringthe machining. This evolution represents the probability ofbelonging to the dominant class at the current wear maplocation. This estimate evaluates the wear level of the insertand, therefore, might be of help in the development of atool replacement criterion in order to preserve parttolerances: should the wear level be at the end of the M
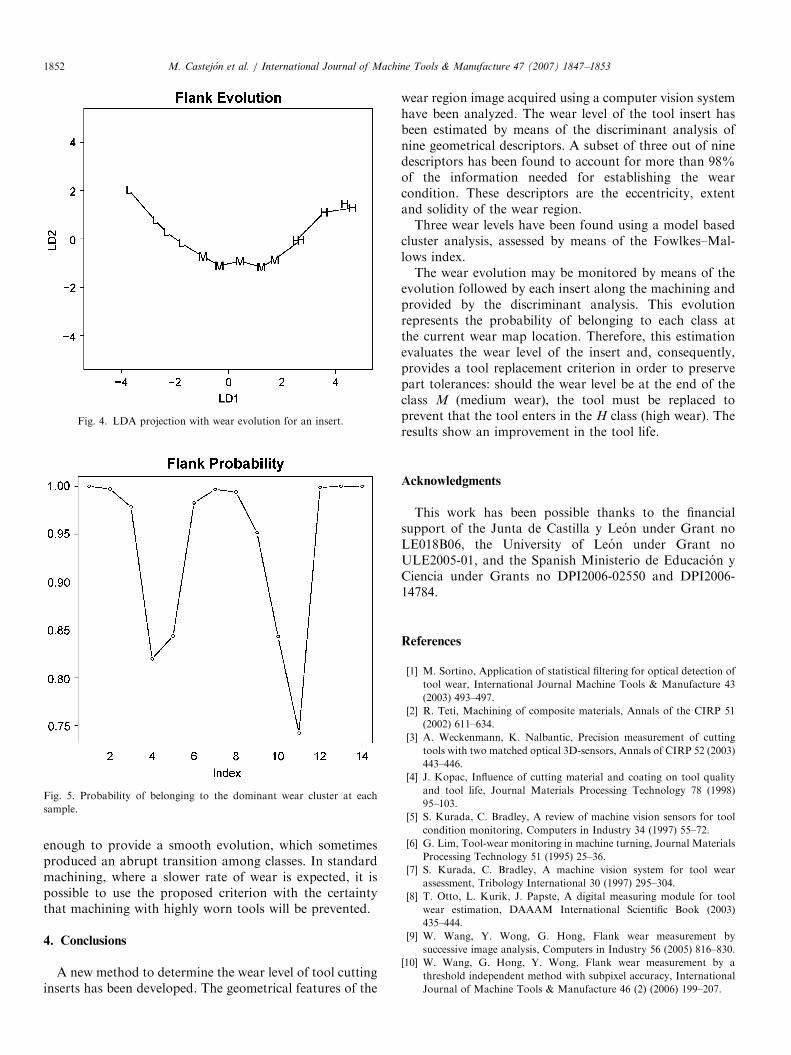
class (medium wear), the tool must be replaced topreventing that the tool enters in the H class (high wear).The evolution of the wearing process can be clearly
traced onto the wear map obtained by the LDA projection,as Fig. 4 shows. This figure locates the wear condition of 14images taken for an insert. The sequence corresponds, fromthe left to the right, to an increment in machining time andtherefore in tool wear. The first four observations belong toclass L (low wear), the following five are in class M
(medium wear) and the last five observations are in class H
(high wear).Fig. 5 shows the probability of a wear state to belong to
each of the three classes established. This figure containsthe same observations as Fig. 4, since it corresponds to thesame insert. It can be appreciated that the three firstobservations have a probability of belonging to class L
higher than 95%. The fourth and fifth observations show aprobability of belonging to classes L and M higher than85%. A similar behavior can be observed in the transitionregion between classes M and H; the tenth observationcorresponds to class M, but the probability is lower than85%; the following observation is included in class 3 butthe probability is lower than 75%. The last threeobservations belong to class 3 and were acquired beforetool replacement due to not practical machining condi-tions.This behavior is present in every insert tested and allows
establishing a tool life criterion. If a conservative criterionis used, tool life ends up when the observation reachesvalues of probability of belonging to M class lower than85%. Should a less restrictive criterion be desired, the toolinsert must be replaced before the probability of belongingto H class surpasses the 80% value.Our tests were performed at high cutting speeds to
increase the wear rate of the tools. A drawback of thisprocedure is that the amount of acquired images were not
ARTICLE IN PRESS
Fig. 4. LDA projection with wear evolution for an insert.
Fig. 5. Probability of belonging to the dominant wear cluster at each
sample.
M. Castejon et al. / International Journal of Machine Tools & Manufacture 47 (2007) 1847–18531852
enough to provide a smooth evolution, which sometimesproduced an abrupt transition among classes. In standardmachining, where a slower rate of wear is expected, it ispossible to use the proposed criterion with the certaintythat machining with highly worn tools will be prevented.
4. Conclusions
A new method to determine the wear level of tool cuttinginserts has been developed. The geometrical features of the
wear region image acquired using a computer vision systemhave been analyzed. The wear level of the tool insert hasbeen estimated by means of the discriminant analysis ofnine geometrical descriptors. A subset of three out of ninedescriptors has been found to account for more than 98%of the information needed for establishing the wearcondition. These descriptors are the eccentricity, extentand solidity of the wear region.Three wear levels have been found using a model based
cluster analysis, assessed by means of the Fowlkes–Mal-lows index.The wear evolution may be monitored by means of the
evolution followed by each insert along the machining andprovided by the discriminant analysis. This evolutionrepresents the probability of belonging to each class atthe current wear map location. Therefore, this estimationevaluates the wear level of the insert and, consequently,provides a tool replacement criterion in order to preservepart tolerances: should the wear level be at the end of theclass M (medium wear), the tool must be replaced toprevent that the tool enters in the H class (high wear). Theresults show an improvement in the tool life.
Acknowledgments
This work has been possible thanks to the financialsupport of the Junta de Castilla y Leon under Grant noLE018B06, the University of Leon under Grant noULE2005-01, and the Spanish Ministerio de Educacion yCiencia under Grants no DPI2006-02550 and DPI2006-14784.
References
[1] M. Sortino, Application of statistical filtering for optical detection of
tool wear, International Journal Machine Tools & Manufacture 43
(2003) 493–497.
[2] R. Teti, Machining of composite materials, Annals of the CIRP 51
(2002) 611–634.
[3] A. Weckenmann, K. Nalbantic, Precision measurement of cutting
tools with two matched optical 3D-sensors, Annals of CIRP 52 (2003)
443–446.
[4] J. Kopac, Influence of cutting material and coating on tool quality
and tool life, Journal Materials Processing Technology 78 (1998)
95–103.
[5] S. Kurada, C. Bradley, A review of machine vision sensors for tool
condition monitoring, Computers in Industry 34 (1997) 55–72.
[6] G. Lim, Tool-wear monitoring in machine turning, Journal Materials
Processing Technology 51 (1995) 25–36.
[7] S. Kurada, C. Bradley, A machine vision system for tool wear
assessment, Tribology International 30 (1997) 295–304.
[8] T. Otto, L. Kurik, J. Papste, A digital measuring module for tool
wear estimation, DAAAM International Scientific Book (2003)
435–444.
[9] W. Wang, Y. Wong, G. Hong, Flank wear measurement by
successive image analysis, Computers in Industry 56 (2005) 816–830.
[10] W. Wang, G. Hong, Y. Wong, Flank wear measurement by a
threshold independent method with subpixel accuracy, International
Journal of Machine Tools & Manufacture 46 (2) (2006) 199–207.
ARTICLE IN PRESSM. Castejon et al. / International Journal of Machine Tools & Manufacture 47 (2007) 1847–1853 1853
[11] Y. Kwon, M. Jeong, O. Omitaomu, Adaptative support vector
regression analysis of closed-loop inspection accuracy, International
Journal of Machine Tools & Manufacture 46 (6) (2006) 603–610.
[12] F. Kim, I. Choi, Development of a tool failure detection system using
multi-sensors, International Journal of Machine Tools & Manufac-
turing 36 (1996) 861–870.
[13] R. Silva, R. Reuben, K. Baker, Tool wear monitoring of turning
operations by neural network and expert system classification of a
feature set generated from multiple sensors, Mechanical Systems and
Signal Processing 12 (1998) 319–332.
[14] D. Choi, W. Kwon, C. Chu, Real-time monitoring of tool fracture in
turning using sensor fusion, International Journal of Advanced
Manufacturing Technology 15 (1999) 305–310.
[15] N. Ghosh, Y. Ravi, A. Patra, S. Mukhopadhyay, S. Paul, A.
Mohanty, A. Chattopadhyay, Estimation of tool wear during CNC
milling using neural network-based sensor fusion, Mechanical
Systems and Signal Processing 21 (1) (2007) 466–479.
[16] M. Shiraishi, Scope of in-process measurement, monitoring and
control techniques in machining processes—Part 1: In-process
techniques for tools, Precision Engineering 10 (1988) 179–189.
[17] M. Khan, M. Abou-Zeid, On-line sensing of tool wear for adaptative
control of turning operation, SME Technical Paper, Dearbon,
Michigan, 1991.
[18] G. Byrne, D. Dornfeld, I. Inasaki, G. Ketteler, R. Teti, Tool
condition monitoring (TCM)—the status of research and industrial
applications, Annals of the CIRP 44 (1995) 541–567.
[19] P. Prickett, C. Johns, An overiew of approaches to end milling tool
monitoring, International Journal of Machine Tools & Manufacture
39 (1999) 105–122.
[20] D. Dimla, Sensor signals for tool-wear monitoring in metal cutting
operations—a review of methods, Internstional Journal of Machine
Tools & Manufacture 40 (2000) 1073–1098.
[21] B. Sick, On-line and indirect tool wear monitoring in turning
with artificial neural networks: a review of more than a decade of
research, Mechanical Systems and Signal Processing 16 (2002)
487–546.
[22] E. Jantunen, A summary of methods applied to tool condition
monitoring in drilling, International Journal of Machine Tools &
Manufacture 42 (2002) 997–1010.
[23] J. Jurkovic, M. Korosec, J. Kopac, New approach in tool wear
measuring technique using CCD vision system, International Journal
of Machine Tools & Manufacture 45 (9) (2005) 1023–1030.
[24] F. Al-Sulaiman, M. Baseer, A. Sheikh, Use of electrical power for
online monitoring of tool condition, Journal of Materials Processing
Technology 166 (2005) 364–371.
[25] T. Pfeifer, L. Wiegers, Reliable tool wear monitoring by optimized
image and illumination control in machine vision, Measurement 28
(2000) 209–218.
[26] M. Lanzetta, A new flexible high-resolution vision sensor for tool
condition monitoring, Journal of Materials Processing Technology
119 (2001) 73–82.
[27] W. Wang, Y. Wong, G. Hong, 3D measurement of crater wear by
phase shifting method, Wear 261 (2) (2006) 164–171.
[28] F. Giusti, M. Santochi, G. Tantussi, On-line sensing of flank and
crater wear of cutting tools, Annals of the CIRP 36 (1987) 41–44.
[29] K. Prasad, B. Ramamoorthy, Tool wear evaluation by stereo vision
and prediction by artificial neural network, Journal of Materials
Processing Technology 112 (2001) 43–52.
[30] L.K. Hernandez, H. Caceres, J. Barreiro, E. Alegre, M. Castejon,
R.A. Fernandez, Monitorizacion del desgaste de plaquitas de corte
usando vision artificial, in: Proceedings del VII Congreso Iberoamer-
icano de Ingenierıa Mecanica, Mexico D.F., 12–14 October, 2005.
[31] J.D. Banfield, A.E. Raftery, Model-based Gaussian and non-
Gaussian clustering, Biometrics 49 (1993) 803–821.
[32] C. Fraley, A.E. Raftery, Mclust: software for model-based cluster
analysis, Journal of Classification 16 (1999) 206–297.
[33] C. Fraley, A.E. Raftery, Model-based clustering, discriminant
analysis, and density estimation, Journal of the American Statistical
Association 97 (2002) 611–631.
[34] C. Fraley, A.E. Raftery, Mclust: software for model-based clustering,
discriminant analysis, and density estimation, Technical Report No.
415, Department of Statistics, University of Washington, 2002.
[35] C. Fraley, A.E. Raftery, Enhanced Software for model-based
clustering, discriminant analysis, and density estimation: Mclust,
Journal of Classification 20 (2003) 263–286.
[36] A Language and Environment for Statistical Computing (ISBN 3-
900051-07-0), Development Core Team, Foundation for Statistical
Computing, Vienna, Austria, http://www.R-project.org, 2003
[37] A.P. Dempster, N.M. Laird, D.B. Rubin, Maximum likelihood from
incomplete data via the EM algorithm, J. Royal Statistical Society 39
(1977) 1–38.
[38] G. McLachlan, T. Krishnan, EM algorithm and extensions, Wiley,
New York, USA, 1997.
[39] G. Schwarz, Estimating the dimension of a model, Annals of
Statistics 6 (1978) 461–464.
[40] R.A. Fisher, The use of multiple measurements in taxonomic
problems, Annals of Eugenics 7 (1936) 179–188.
[41] R.O. Duda, P.E. Hart, D.H. Stork, Pattern Classification (ISBN
0471056693), Wiley Interscience, New York, 2000.
[42] R. Kohavi, F. Provost, Glossary of terms, Journal of Machine
Learning 30 (2–3) (1998) 271–274.
[43] E.B. Fowlkes, C.L. Mallows, A method for comparing two
hierarchical clusterings, Journal of the American Statistical Associa-
tion 78 (1983) 553–569.
[44] M. Meila, Comparing clusterings, Technical report 418, University of
Washington, 2002.


![3DMatch: Learning Local Geometric Descriptors From RGB ......our descriptor focuses on learning geometric features for real-world RGB-D scanning data at ... RGB-D Scenes v.2 [20],](https://img.pdfslide.net/doc/110x75/602dfbb76ba142767b405a1c/3dmatch-learning-local-geometric-descriptors-from-rgb-our-descriptor-focuses.jpg)