Embed Size (px)
Citation preview
On-Line Ultrasonic Monitoring of the Injection Molding Process
H. WANG, B. CAO,* C. K. JEN, K. T. NGUYEN, and M. VIENS
Industrial Materials Institute National Research Council
Boucheruille, Quebec, Canada J4B 6Y4
and
*Department of Electrical Engineering McGill University
Montreal, Qukbec, Canada H 3 A 2A7
On-line ultrasonic monitoring of injection molding of a simple polymer box is studied using pulse-echo techniques. The flow front of molten polymers inside the mold has been probed by a multiple-channel probing system with a time resolution of 2 ms. This information can be used to control the plunger movements. The gap development, because of the shrinkage of the part in the mold, is also monitored. This information, which is important for the understanding of the part's cooling process, has been found to be superior than that measured by a conventional pressure probe. The relation between the gap formation time and the packing pressure has been investigated at various part locations characterized by different thicknesses. The velocity and the amplitude variations of ultrasonic waves, in a reflection a s well as in a transmission configuration, have also been measured in the part's material during its solidification. The behavior of these ultrasonic param- eters contributes to the interpretation of the solidification process.
INTRODUCTION
ncreasing requirements for high quality products I and efficient production have caused material pro- cesses to undergo a fast evolution in the past decade (1-3). Since material processes are usually dynamic and difficult to attain a steady state, complex control strategies have to be applied. Often, to perform such a control task, instruments are required to provide pre- cise feedback on process parameters and material properties during production, and thus the develop- ment of cost-effective sensors as well as on-line mea- surement technologies is important ( l , 3). Although computer process modeling, analysis, and optimiza- tion of the operating conditions have been investigated intensively (4-61, the simulation models often involve many simplified assumptions for the real but compli- cated situations in order to facilitate the solution of the p-oblem and to reduce the computation time. Ex- perimental verifications of the computer simulation results are thus crucial in validating the assumptions. This creates further demands for the development of
*To whom correspondence should be addressed.
measurement methods and advanced instrumenta- tion.
Injection molding has been widely used a s a mass production method. Various sensors such as tradi- tional thermocouples and pressure sensors have been employed in monitoring and controlling the process (7-9). These traditional sensors have several limita- tions, such as slow response, unsteadiness, and non- repeatability. Often, they thus do not fulfill the re- quirements of fast processing control. Because of these shortcomings, advanced measurement sensors and methods are continually needed.
The ability of the ultrasound to interrogate nonin- vasively, nondestructively, and rapidly the surface and internal regions of material objects is clearly de- sirable for a modern injection molding process con- trol. Such a control should not disturb normal pro- cessing conditions or consistent product properties in a batch or continuous process, and, a t the same time, it should acquire the desired information fast enough to provide efficient feedback to the process control ( 10). Although ultrasonic techniques have been used for the improvement of material processes for a long time, recent advances in transducer materials, micro- processors, digital signal processing, and measure-
POLYMER ENGINEERING AND SCIENCE, FEBRUARY 1997, Yo/. 37, No. 2 363
H. Wang et al.
ment techniques allow the data to be obtained and analyzed rapidly, reliably, and economically (1 0). This progress makes ultrasound an attractive tool for on- line production monitoring. For example, the ultra- sonic pulse-echo method was utilized to characterize polymers in both the solid and molten states (1 1-13), to measure the polymer melt temperature during in- jection molding ( 14) and to study the mold cavity con- ditions in a simple plate mold (15, 16). The interface in multi-layer polymer flows has also been monitored (17). Other applications of ultrasonic sensors include closed-loop control of injection molding hold time (15, 18) and measurements of material properties during injection molding (19).
The injection molding process can be considered as consisting of three stages: 1) the filling stage, during which the material is heated, melted, and then in- jected into the cavity of a mold, which has a unique shape for a designed production part; 2) the packing/ holding stage, where additional material is forced into the cavity under high pressure until the gate is frozen to compensate for the shrinkage resulting from con- tinuous cooling: and 3 ) the solidification stage, during which the part is cooled further until it is sufficiently solidified. The part is then ejected and the cycle re- starts. During the filling stage, the flow advances with certain paths inside the mold at a high speed under a high pressure. When the cavity is filled, the filling pressure should be immediately switched to a rela- tively lower packing pressure. With the monitoring of the advancement of the flow front a smooth transition from the filling stage could be achieved and thus high impact on the mold can be avoided, part flashing re- duced, and the mold life improved.
During the packing stage, more molten polymer is forced into the cavity and the high pressure keeps the polymer in contact with the mold walls. When the gate is frozen, no more material can be added into the cavity, and the solidifying material begins to shrink from the wall, forming a n air gap between the wall and the part (20, 2 1). Because of the formation of the gap, there might be a significant thermal contact resis- tance between the part and the cavity wall, which reduces the heat transfer efficiency, resulting in longer production cycles. Effects of the gap formation on injection molding of plastics have been mentioned by many researchers (21, 22), but few efforts have been devoted to its monitoring. Detection of the gap formation may provide more information about the heat transfer inside the parts and improve the physi- cal understanding of the thermal contact resistance of the gap. Furthermore, after the gap is developed, and especially after the gate is frozen, the holding pressure will not further affect the part (4). A dynamic control of the holding time may be achieved by monitoring the gap development a t the gate location, resulting in en- ergy savings.
During solidification, it is desirable to use the prop- erties of the solidifying material as input parameters to the process control system in order to achieve the required final quality of the parts. For instance, differ-
ent ultrasonic wave velocities and attenuation inside the material may relate to a range of the material properties such as density, temperature, residual stress, and elastic constants, directly or indirectly (10). The gap development itself is also part of the information about the solidification process.
Overall, a lot of essential information can be moni- tored during the process, such as (a) the flow front advancement during the filling stage, (b) the gap de- velopment caused by the shrinkage of the part during the cooling, and (c) the material solidification, which significantly affects the quality of the part. Performing all this monitoring can lead to a n improved on-line quality control system and enhance the basic under- standing of the process. Indeed, the ultrasonic moni- toring of the injection molding process has been re- cently reported (15, 16, 18, 19, 23). In those studies, ultrasonic pulse-echo methods were used to monitor several aspects of the processing concerning mold fill- ing, flash, and shrinkage in the mold. The ultrasonic velocity of the part during solidification was found to be sensitive to the temperature and pressure. The objective of this study is to refine the above monitoring tasks by using improved ultrasonic measurement sys- tems and techniques such as echo selection, two- channel acquisition system, and advanced digital sig- nal processing, and by performing additional monitoring tasks such as for flow front advancement and gap development.
ULTRASONIC TECHNIQUES AND EXPERIMENTAL ARRANGEMENTS
Reflection and Transmission
When ultrasonic waves impinge at the boundary between two different media, some of the energy is transmitted through the boundary and the rest is re- flected back. The reflection and transmission coeffi- cients, R and T, are respectively defined as:
T = l - R ( 2 )
where Zi is the acoustic impedance of medium i, which is defined a s the product of the density pi and wave velocity V, of the materials:
Z i = piVi ( i = 1.2) ( 3 )
Pulse-echo ultrasonic measurements can be oper- ated in reflection and transmission modes. In the re- flection mode, the signal is transmitted and received by the same ultrasonic transducer (UT), while in the transmission mode, the signal is transmitted by one UT and received by another. The transmission method has limited practical use because it necessitates the installation of two UTs on the two sides of the injection mold. The reflection mode is preferred because only one mold side access is required.
364 POLYMER ENGINEERING AND SCIENCE, FEBRUARY 1997, Vol. 37, No. 2
On-line Ultrasonic Monitoring of the Injection Molding Process
Flow Front Monitoring
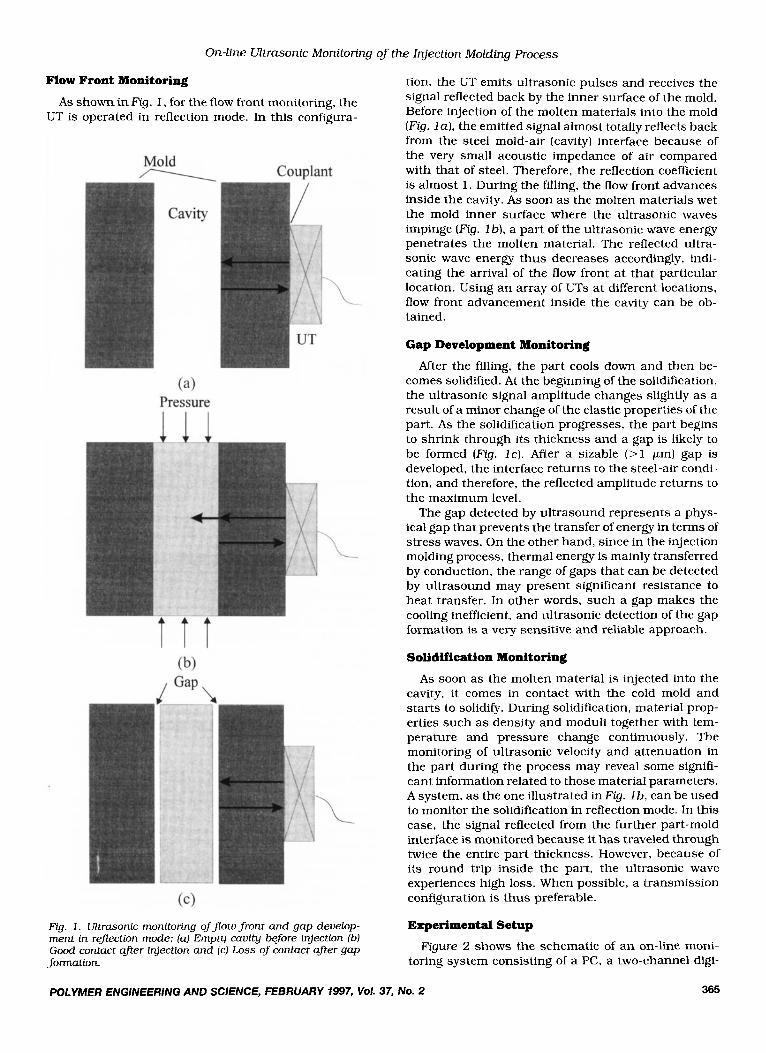
As shown in R g , 1 , for the flow front monitoring, the UT is operated in reflection mode. In this configura-
(4 Pressure
Fcg. 1. Ultrasonic monitoring offlow front and gap deuelop- ment in reflection mode: [a) Empty cauity before injection (b) Good contact after injection and (c) Loss of contact after gap formation.
tion, the UT emits ultrasonic pulses and receives the signal reflected back by the inner surface of the mold. Before injection of the molten materials into the mold (Fig. la ) , the emitted signal almost totally reflects back from the steel mold-air (cavity) interface because of the very small acoustic impedance of air compared with that of steel. Therefore, the reflection coefficient is almost 1 . During the filling, the flow front advances inside the cavity. As soon as the molten materials wet the mold inner surface where the ultrasonic waves impinge (Fig. 1 b), a part of the ultrasonic wave energy penetrates the molten material. The reflected ultra- sonic wave energy thus decreases accordingly, indi- cating the arrival of the flow front at that particular location. Using an array of UTs at different locations, flow front advancement inside the cavity can be ob- tained.
Gap Development Monitoring
After the filling, the part cools down and then be- comes solidified. At the beginning of the solidification, the ultrasonic signal amplitude changes slightly as a result of a minor change of the elastic properties of the part. As the solidification progresses, the part begins to shrink through its thickness and a gap is likely to be formed (Fig. l c ) . After a sizable ( > 1 pm) gap is developed, the interface returns to the steel-air condi- tion, and therefore, the reflected amplitude returns to the maximum level.
The gap detected by ultrasound represents a phys- ical gap that prevents the transfer of energy in terms of stress waves. On the other hand, since in the injection molding process, thermal energy is mainly transferred by conduction, the range of gaps that can be detected by ultrasound may present significant resistance to heat transfer. In other words, such a gap makes the cooling inefficient, and ultrasonic detection of the gap formation is a very sensitive and reliable approach.
Solidification Monitoring
As soon as the molten material is injected into the cavity, it comes in contact with the cold mold and starts to solidify. During solidification, material prop- erties such as density and moduli together with tem- perature and pressure change continuously. The monitoring of ultrasonic velocity and attenuation in the part during the process may reveal some signifi- cant information related to those material parameters. A system, as the one illustrated in Fig. 1 b, can be used to monitor the solidification in reflection mode. In this case, the signal reflected from the further part-mold interface is monitored because it has traveled through twice the entire part thickness. However, because of its round trip inside the part, the ultrasonic wave experiences high loss. When possible, a transmission configuration is thus preferable.
Experimental Setup
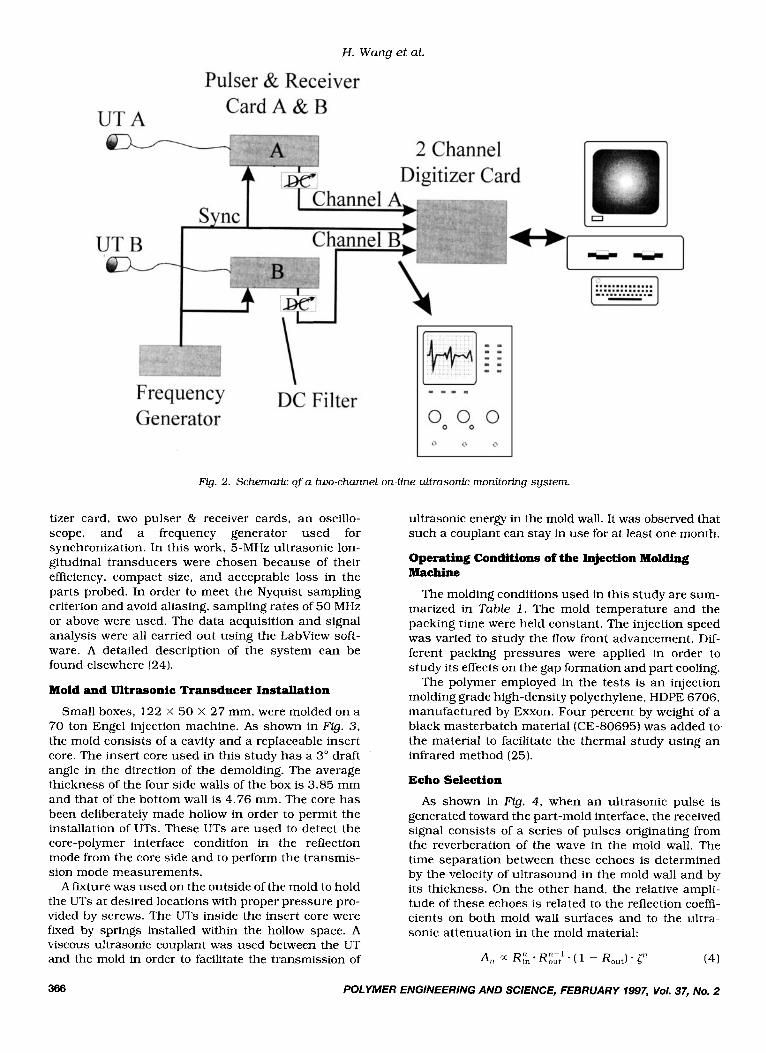
Figure 2 shows the schematic of an on-line moni- toring system consisting of a PC, a two-channel digi-
POLYMER ENGlNEERfNG AND SCIENCE, FEBRUARY 1997, Vol. 37, No. 2 365
H. Wang et al.
Fig. 2. Schematic of a two-channel on-line ultrasonic monitoring system.
tizer card, two pulser & receiver cards, a n oscillo- scope, and a frequency generator used for synchronization. In this work, 5-MHz ultrasonic lon- gitudinal transducers were chosen because of their efficiency, compact size, and acceptable loss in the parts probed. In order to meet the Nyquist sampling criterion and avoid aliasing, sampling rates of 50 MHz or above were used. The data acquisition and signal analysis were all carried out using the LabView soft- ware. A detailed description of the system can be found elsewhere (24).
Mold and Ultrasonic Transducer Installation
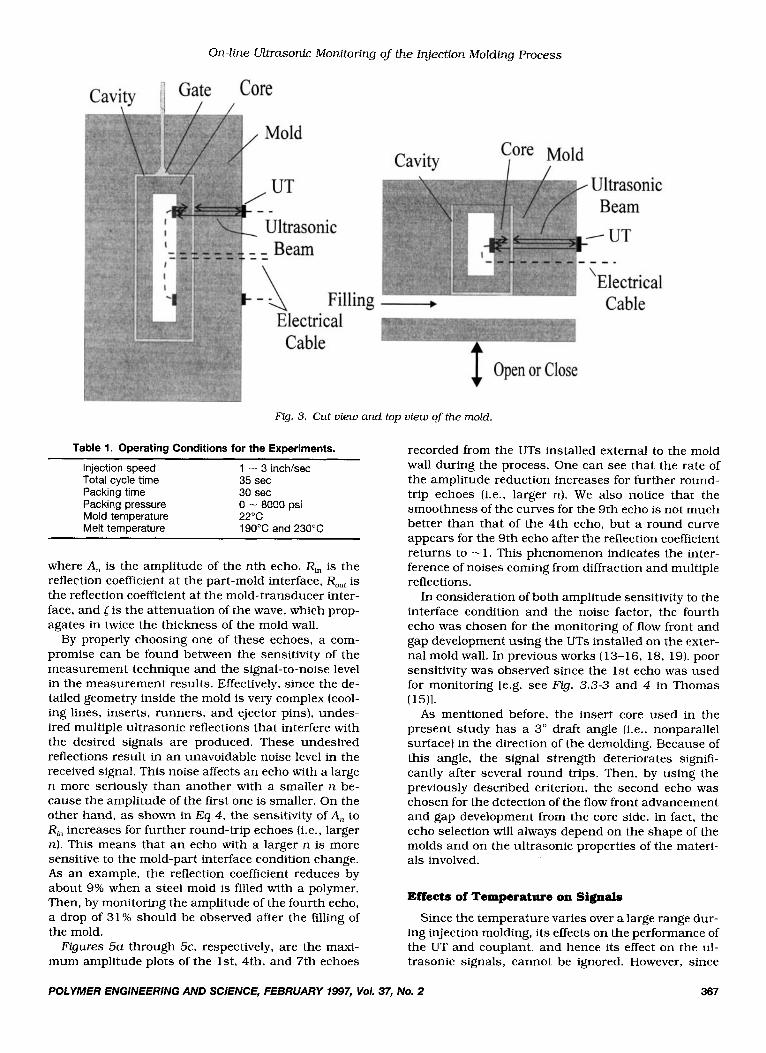
Small boxes, 122 X 50 X 27 mm, were molded on a 70 ton Engel injection machine. As shown in Fig. 3 , the mold consists of a cavity and a replaceable insert core. The insert core used in this study has a 3" draft angle in the direction of the demolding. The average thickness of the four side walls of the box is 3.85 mm and that of the bottom wall is 4.76 mm. The core has been deliberately made hollow in order to permit the installation of UTs. These UTs are used to detect the core-polymer interface condition in the reflection mode from the core side and to perform the transmis- sion mode measurements.
A fixture was used on the outside of the mold to hold the UTs at desired locations with proper pressure pro- vided by screws. The UTs inside the insert core were fixed by springs installed within the hollow space. A viscous ultrasonic couplant was used between the UT and the mold in order to facilitate the transmission of
ultrasonic energy in the mold wall. It was observed that such a couplant can stay in use for at least one month.
Operating Conditions of the Injection Molding Machine
The molding conditions used in this study are sum- marized in Table 1 . The mold temperature and the packing time were held constant. The injection speed was varied to study the flow front advancement. Dif- ferent packing pressures were applied in order to study its effects on the gap formation and part cooling.
The polymer employed in the tests is an injection molding grade high-density polyethylene, HDPE 6706, manufactured by Exxon. Four percent by weight of a black masterbatch material (CE-80695) was added to the material to facilitate the thermal study using an infrared method (25).
Echo Selection
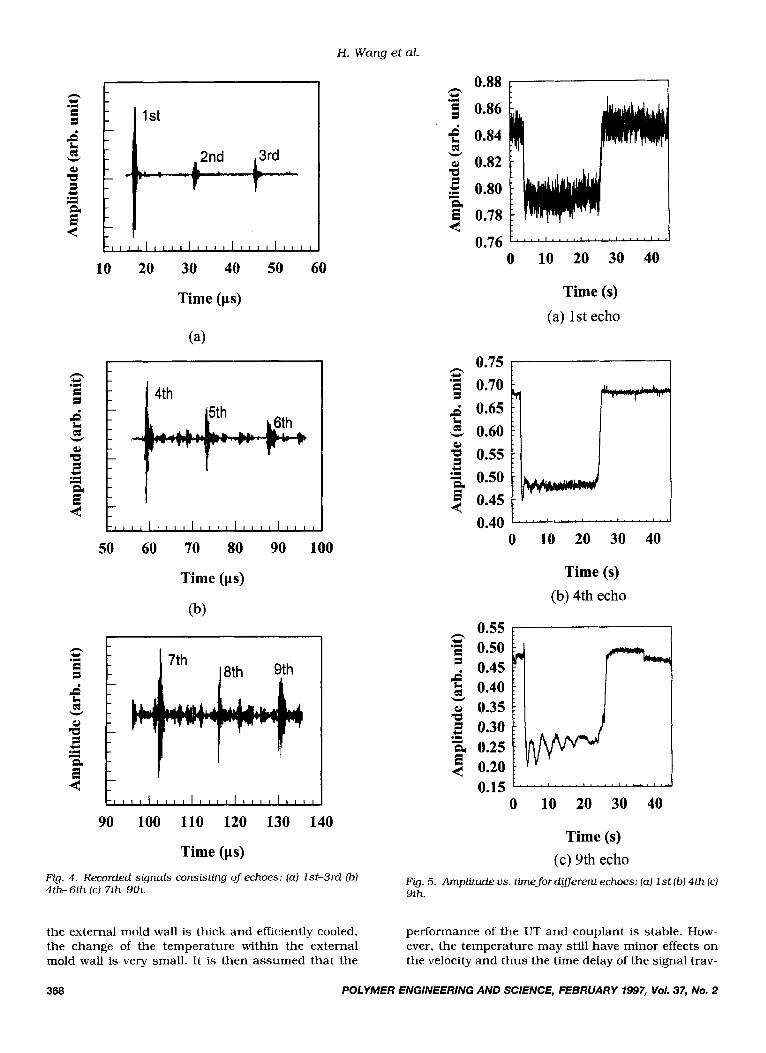
A s shown in Fig. 4, when an ultrasonic pulse is generated toward the part-mold interface, the received signal consists of a series of pulses originating from the reverberation of the wave in the mold wall. The time separation between these echoes is determined by the velocity of ultrasound in the mold wall and by its thickness. On the other hand, the relative ampli- tude of these echoes is related to the reflection coeffi- cients on both mold wall surfaces and to the ultra- sonic attenuation in the mold material:
(4)
366 POLYMER ENGINEERING AND SCIENCE, FEBRUARY 1997, Vol. 37, No. 2
On-line Ultrasonic Monitoring of the Injection Molding Process
Table 1. Operating Conditions for the Experiments.
Injection speed Total cycle time 35 sec Packing time 30 sec Packing pressure Mold temperature 22°C Melt temperature 190°C and 230°C
1 - 3 inch/sec
0 - 8000 psi
where A, is the amplitude of the nth echo, R,, is the reflection coefficient a t the part-mold interface, Rout is the reflection coefficient a t the mold-transducer inter- face, and [ is the attenuation of the wave, which prop- agates in twice the thickness of the mold wall.
By properly choosing one of these echoes, a com- promise can be found between the sensitivity of the measurement technique and the signal-to-noise level in the measurement results. Effectively, since the de- tailed geometry inside the mold is very complex (cool- ing lines, inserts, runners, and ejector pins), undes- ired multiple ultrasonic reflections that interfere with the desired signals are produced. These undesired reflections result in an unavoidable noise level in the received signal. This noise affects an echo with a large n more seriously than another with a smaller n be- cause the amplitude of the first one is smaller. On the other hand, as shown in Eq 4, the sensitivity of A, to R, increases for further round-trip echoes (i.e., larger n). This means that a n echo with a larger n is more sensitive to the mold-part interface condition change. As an example, the reflection coefficient reduces b y about 9% when a steel mold is filled with a polymer. Then, by monitoring the amplitude of the fourth echo, a drop of 3 1 % should be observed after the filling of the mold.
Figures 5a through 5c, respectively, are the maxi- mum amplitude plots of the lst, 4th. and 7th echoes
Fig. 3. Cut view and top view of the mold.
POLYMER ENGINEERING AND SCIENCE, FEBRUARY 7997, Vol. 37, No. 2 367
recorded from the UTs installed external to the mold wall during the process. One can see that the rate of the amplitude reduction increases for further round- trip echoes (i.e., larger n). We also notice that the smoothness of the curves for the 9th echo is not much better than that of the 4th echo, but a round curve appears for the 9th echo after the reflection coefficient returns to - 1. This phenomenon indicates the inter- ference of noises coming from diffraction and multiple reflections.
In consideration of both amplitude sensitivity to the interface condition and the noise factor, the fourth echo was chosen for the monitoring of flow front and gap development using the UTs installed on the exter- nal mold wall. In previous works (13-16, 18, 19). poor sensitivity was observed since the 1st echo was used for monitoring 1e.g. see Fg. 3.3-3 and 4 in Thomas (1511.
As mentioned before, the insert core used in the present study has a 3" draft angle (i.e., nonparallel surface) in the direction of the demolding. Because of this angle, the signal strength deteriorates signifi- cantly after several round trips. Then, by using the previously described criterion, the second echo was chosen for the detection of the flow front advancement and gap development from the core side. In fact, the echo selection will always depend on the shape of the molds and on the ultrasonic properties of the materi- als involved.
Effects of Temperature on Signals
Since the temperature varies over a large range dur- ing injection molding, its effects on the performance of the UT and couplant, and hence its effect on the ul- trasonic signals, cannot be ignored. However, since
n
E c, .I
a
e a"
2
d W
a c, .I d
c
n
E I
+., .3
e a" 2 2 c
rd W
1
n c, .3 E 1
e a"
2
d W
1 +-, .3 d
4
10 20 30 40 50 60
Time (p)
t 4th
5th
* 50 60 70 80 90 100
Time (ps)
1 90 100 110 120 130 140
Time (ps) Fig. 4 . Recorded signals consisting of echoes: (a) 1st-3rd (b) 4th-6th (C) 7th-9th.
H. Wang et al.
0.88 1 0 .i 5 0.86
0.84 d
8 0.78
3 0.80
4
w
a" 1
0.76
0.75 n .* c 0.70 1 6 0.65 .5 0.60 a" 0.55 2 1 0.50
0.45 c a
0 10 20 30 40
Time (s) (a) 1st echo
0.40 0 10 20 30 40
Time (s) (b) 4th echo
0.55 -a 0.50
0.45 0.40
4 0.35 0.30
a 0.25 El
n c,
W
1
4 0.20
Time (s) (c) 9th echo
Fig. 5. Amplitude us. time fordflerent echoes: (a) 1 st (b) 4th (c) 9th.
the external mold wall is thick and efficiently cooled, the change of the temperature within the external mold wall is very small. It is then assumed that the
performance of the U T and couplant is stable. How- ever, the temperature may still have minor effects on the velocity and thus the time delay of the signal trav-
368 POLYMER ENGINEERING AND SCIENCE, FEBRUARY 1997, Vol. 37, No. 2
On-line Ultrasonic Monitoring of the Injection Molding Process
eling inside the mold wall. This time delay variation of the signal could provide information on the slight tem- perature changes that occur during the process.
EXPERIMENTAL RESULTS AND DISCUSSION
Flow Front Monitoring
As mentioned earlier, the sudden decrease of the reflection coefficient indicates the arrival of the flow front. In this study, a two-channel system shown in Fig. 2 was used to detect the difference in the arrival times at two locations for each molding cycle. From different combinations of the monitoring locations, the advancement of the molten polymer flow front path could be sampled. Different injection speeds were applied in order to examine the variation of the flow front advancement inside the cavity. This two- channel system is much more effective in monitoring the flow front advancement than the single channel system used by Thomas (15).
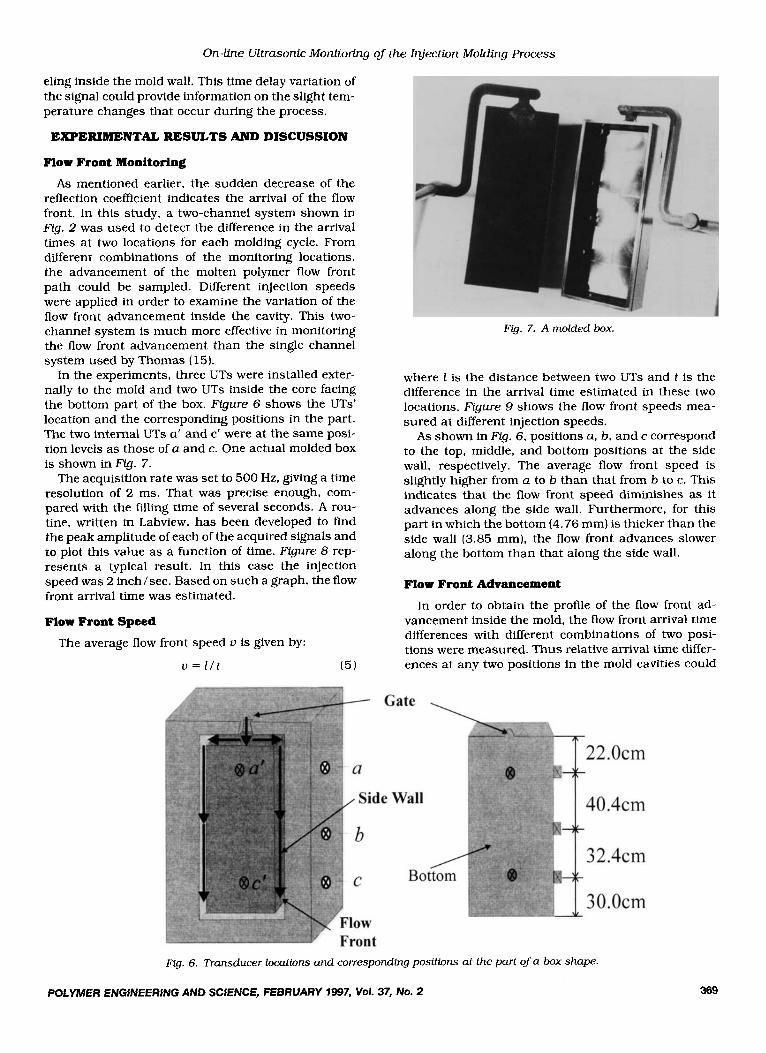
In the experiments, three UTs were installed exter- nally to the mold and two UTs inside the core facing the bottom part of the box. Figure 6 shows the UTs' location and the corresponding positions in the part. The two internal UTs a' and c' were at the same posi- tion levels a s those of a and c. One actual molded box is shown in Fig. 7.
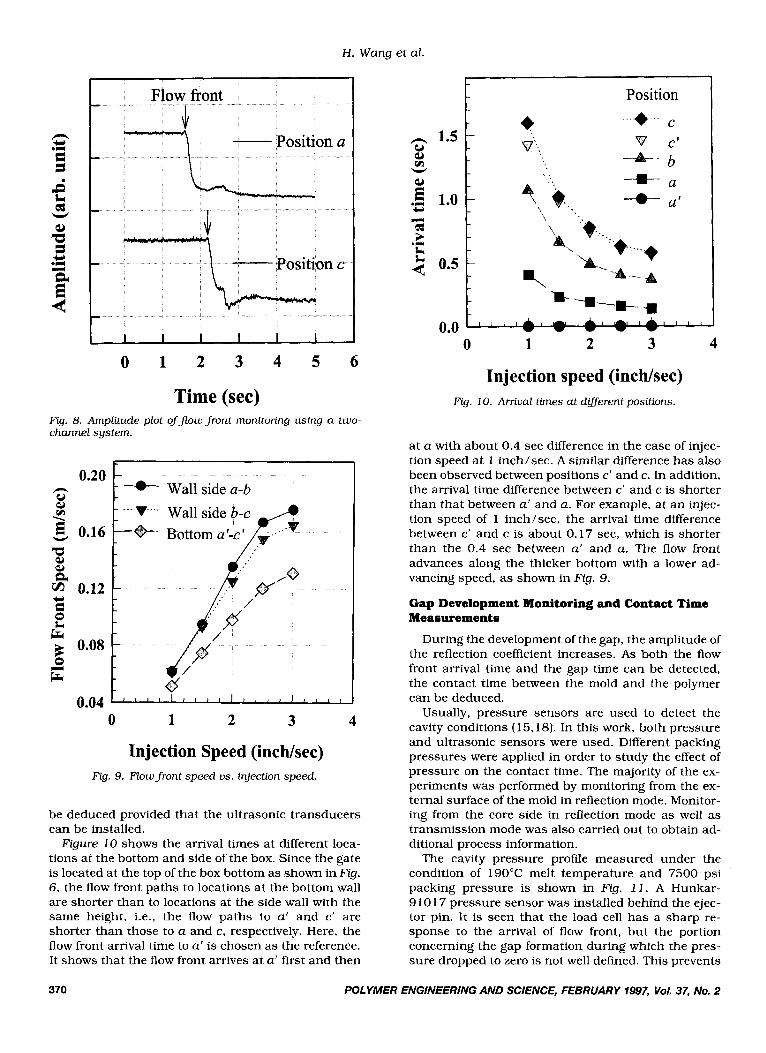
The acquisition rate was set to 500 Hz, giving a time resolution of 2 ms. That was precise enough, com- pared with the filling time of several seconds. A rou- tine, written in Labview, has been developed to find the peak amplitude of each of the acquired signals and to plot this value as a function of time. Figure 8 rep- resents a typical result. In this case the injection speed was 2 inch/sec. Based on such a graph, the flow front arrival time was estimated.
Flow Front Speed
The average flow front speed u is given by:
u = l / t (5)
Fig. 7. A molded box.
where t is the distance between two UTs and 1 is the difference in the arrival time estimated in these two locations. Figure 9 shows the flow front speeds mea- sured at different injection speeds.
As shown in Fig. 6, positions a, b, and c correspond to the top, middle, and bottom positions at the side wall, respectively. The average flow front speed is slightly higher from a to b than that from b to c. This indicates that the flow front speed diminishes as it advances along the side wall. Furthermore, for this part in which the bottom (4.76 mm) is thicker than the side wall (3.85 mm), the flow front advances slower along the bottom than that along the side wall.
Flow Front Advancement
In order to obtain the profile of the flow front ad- vancement inside the mold, the flow front arrival time differences with different combinations of two posi- tions were measured. Thus relative arrival time differ- ences at any two positions in the mold cavities could
Flg. 6. Transducer locations and corresponding positions at the part of a box shape.
POLYMER ENGfNEERING AND SCIENCE, FEBRUARY 1997, Vof. 37, No. 2 369
H. W a n g et al.
L
lc--m-*
Position a -x
0.20 n 0
:- Position c
L
-
- - Wall side a-b
0 1 2 3 4 5 6
Time (sec) Q. 8. Amplitude plot of frow front monitoring using a two- channel system.
-V- Wall side b- W -+- Bottoms'-c'
b’ Injection Speed (inchkec)
Fg. 9. Flow front speed us. injection speed.
be deduced provided that the ultrasonic transducers can be installed.
Figure 10 shows the arrival times at different loca- tions at the bottom and side of the box. Since the gate is located at the top of the box bottom as shown in Fig. 6, the flow front paths to locations at the bottom wall are shorter than to locations at the side wall with the same height, i.e., the flow paths to a‘ and c’ are shorter than those to a and c, respectively. Here, the flow front arrival time to a’ is chosen a s the reference. It shows that the flow front arrives a t a’ first and then
Position 1 C
...+ ..
v c’ -%-- b + a + a’
Injection speed (inchhec) Fig. 10. Arrival times at diJferent positions.
at a with about 0.4 sec difference in the case of injec- tion speed at 1 inch/sec. A similar difference has also been observed between positions c’ and c. In addition, the arrival time difference between c‘ and c is shorter than that between a’ and a. For example, a t an injec- tion speed of 1 inch / sec, the arrival time difference between c’ and c is about 0.17 sec, which is shorter than the 0.4 sec between a’ and a. The flow front advances along the thicker bottom with a lower ad- vancing speed, as shown in Fig. 9.
Gap Development Monitoring and Contact Time Measurements
During the development of the gap, the amplitude of the reflection coefficient increases. As both the flow front arrival time and the gap time can be detected, the contact time between the mold and the polymer can be deduced.
Usually, pressure sensors are used to detect the cavity conditions (15,18). In this work, both pressure and ultrasonic sensors were used. Different packing pressures were applied in order to study the effect of pressure on the contact time. The majority of the ex- periments was performed by monitoring from the ex- ternal surface of the mold in reflection mode. Monitor- ing from the core side in reflection mode a s well as transmission mode was also carried out to obtain ad- ditional process information.
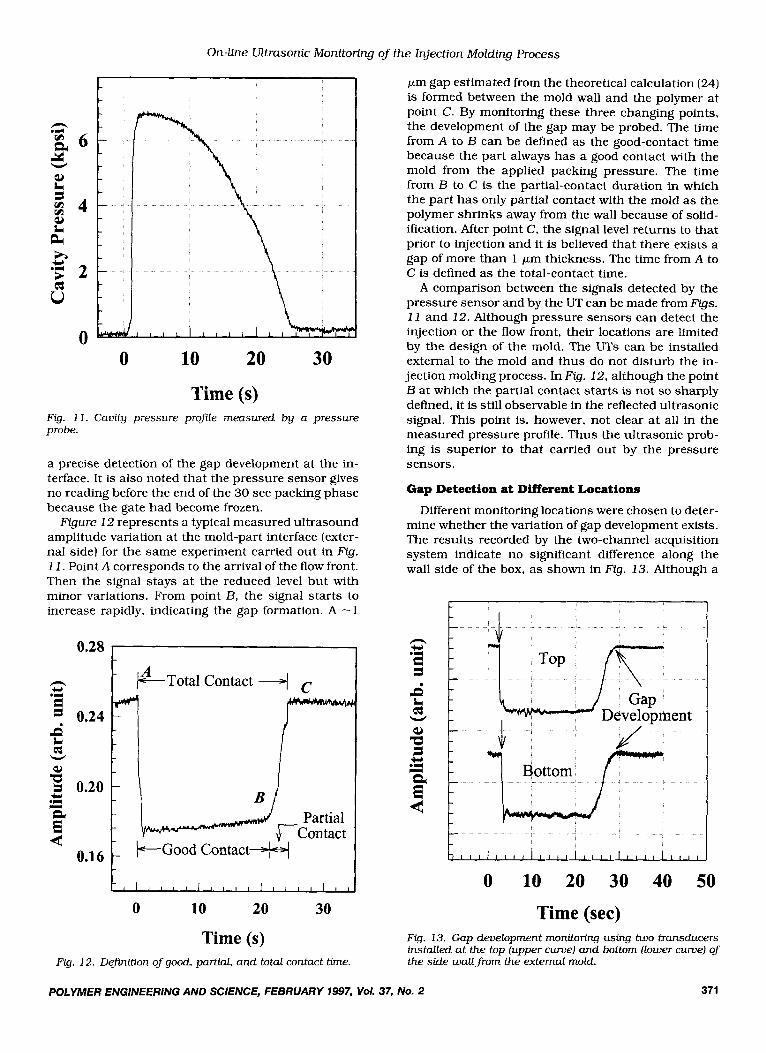
The cavity pressure profile measured under the condition of 190°C melt temperature and 7500 psi packing pressure is shown in Fig. 11. A Hunkar- 910 17 pressure sensor was installed behind the ejec- tor pin. It is seen that the load cell has a sharp re- sponse to the arrival of flow front, but the portion concerning the gap formation during which the pres- sure dropped to zero is not well defined. This prevents
370 POLYMER ENGINEERING AND SCIENCE, FEBRUARY 1997, Vol. 37, No. 2
On-line Ultrasonic Monitoring of the Injection Molding Process
0 10 20 30
Time (s) Fig. 1 I . Cavity pressure profrle measured by a pressure probe.
a precise detection of the gap development at the in- terface. It is also noted that the pressure sensor gives no reading before the end of the 30 sec packing phase because the gate had become frozen.
Figure 12 represents a typical measured ultrasound amplitude variation at the mold-part interface (exter- nal side) for the same experiment carried out in Fig. 1 1 . Point A corresponds to the arrival of the flow front. Then the signal stays at the reduced level but with minor variations. From point B, the signal starts to increase rapidly, indicating the gap formation. A -1
0.28 I I L
@-Total 'I Contact -
a" .3 I
Partial J,Contac t
0.16 +Good Contact-
0 10 20 30
Time (s) Fig. 12. Definition of good, partial, and total contact time.
pm gap estimated from the theoretical calculation (24) is formed between the mold wall and the polymer at point C. By monitoring these three changing points, the development of the gap may be probed. The time from A to B can be defined as the good-contact time because the part always has a good contact with the mold from the applied packing pressure. The time from B to C is the partial-contact duration in which the part has only partial contact with the mold as the polymer shrinks away from the wall because of solid- ification. After point C, the signal level returns to that prior to injection and it is believed that there exists a gap of more than 1 pm thickness. The time from A to C is defined as the total-contact time.
A comparison between the signals detected by the pressure sensor and by the U T can be made from Figs. 1 1 and 12. Although pressure sensors can detect the injection or the flow front, their locations are limited by the design of the mold. The UTs can be installed external to the mold and thus do not disturb the in- jection molding process. In Fig. 12, although the point B at which the partial contact starts is not so sharply defined, it is still observable in the reflected ultrasonic signal. This point is, however, not clear at all in the measured pressure profile. Thus the ultrasonic prob- ing is superior to that carried out by the pressure sensors.
Gap Detection at Different Locations
Different monitoring locations were chosen to deter- mine whether the variation of gap development exists. The results recorded by the two-channel acquisition system indicate no significant difference along the wall side of the box, as shown in Fig. 13. Although a
0 10 20 30 40 50
Time (sec) FYg. 13. Gap development monitoring using two transducers installed at the top (upper curve) and bottom (lower curve) of the side wall from the external mold.
POLYMER ENGINEERING AND SCIENCE, FEBRUARY 1997, Vol. 37, No. 2 371
H. W a n g et al.
slight difference in the flow front arrival time (the flow front arrival time is small compared with the whole contact time) can be observed, a gap was developed nearly a t the same time. For this case, the point C defined in Fig. 13 is not so distinct and will be studied in the future.
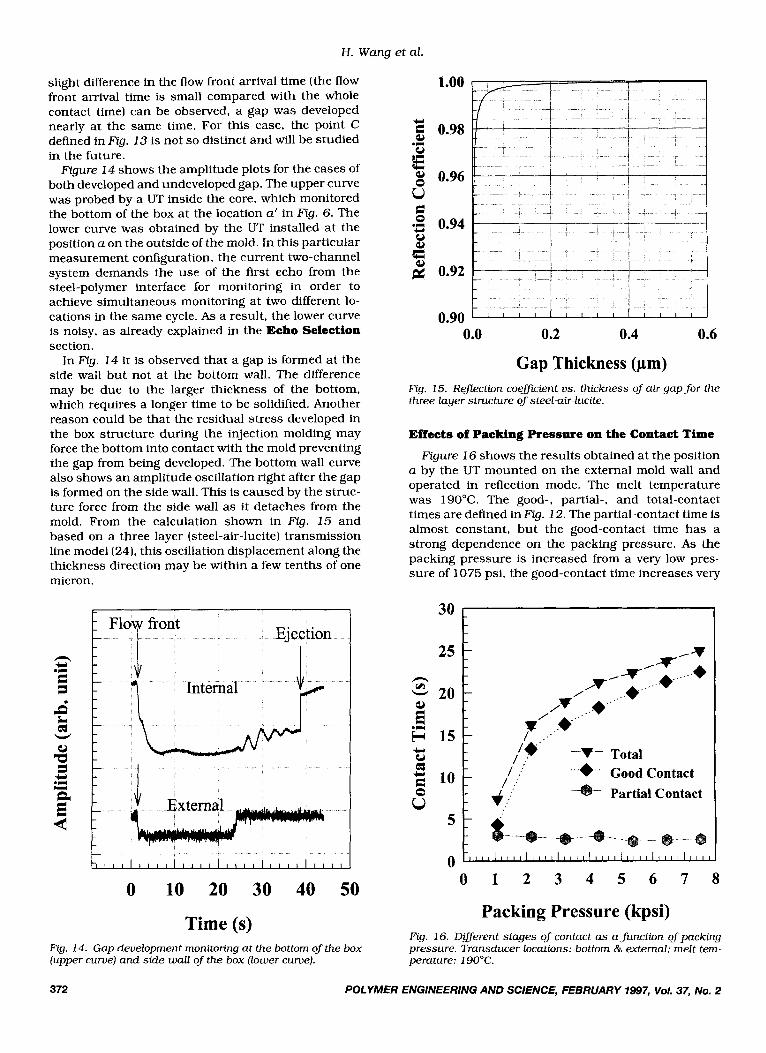
Figure 14 shows the amplitude plots for the cases of both developed and undeveloped gap, The upper curve was probed by a UT inside the core, which monitored the bottom of the box at the location a' in Fig. 6. The lower curve was obtained by the UT installed at the position a on the outside of the mold. In this particular measurement configuration, the current two-channel system demands the use of the first echo from the steel-polymer interface for monitoring in order to achieve simultaneous monitoring at two different lo- cations in the same cycle. As a result, the lower curve is noisy, as already explained in the Echo Selection section.
In Fig. 14 it is observed that a gap is formed at the side wall but not a t the bottom wall. The difference may be due to the larger thickness of the bottom, which requires a longer time to be solidified. Another reason could be that the residual stress developed in the box structure during the injection molding may force the bottom into contact with the mold preventing the gap from being developed. The bottom wall curve also shows an amplitude oscillation right after the gap is formed on the side wall. This is caused by the struc- ture force from the side wall as it detaches from the mold. From the calculation shown in Flg. 15 and based on a three layer (steel-air-lucite) transmission line model (24). this oscillation displacement along the thickness direction may be within a few tenths of one micron.
Ejection [ ~107 front
J/ External t d 0 10 20 30 40 50
Time (s) Fig. 14. Gap development monitoring at the bottom of the box (upper curve) and side wall of the box (lower curve).
1.00
Y 0.98
.m 8 0.96
u c Y 0.94 u
& 0.92
0.90 0.0 0.2 0.4 0.6
Gap Thickness (pm) Fcg. 15. Reflection coefllient us. thickness of air gap for the three layer structure of steelair-lucite.
Effects of Packing Pressure on the Contact Time
Figure 16 shows the results obtained at the position a by the UT mounted on the external mold wall and operated in reflection mode. The melt temperature was 190°C. The good-, partial-, and total-contact times are defined in Fig. 12. The partial-contact time is almost constant, but the good-contact time has a strong dependence on the packing pressure. As the packing pressure is increased from a very low pres- sure of 1075 psi, the good-contact time increases very
30 c
E" il 15 c, u 2ol
f : ...+.- Good Contact
Partial Contact u - - -
0 h I I I I I I I I I I I I I I I I I I ' I I I I I I I I I I I I I I I I I I I
0 1 2 3 4 5 6 7 8
Packing Pressure (kpsi) Fig. 16. DGerent stages of contact as a function of packing pressure. Transducer locations: bottom & external: melt tem- perature: 190°C.
372 POLYMER ENGINEERING AND SCIENCE, FEBRUARY 1997, Vol. 37, No. 2
On-line Ultrasonic Monitoring of the Injection Molding Process
sharply at the beginning and then with a slower rate at about 3000 psi. The results indicate that increasing the pressure improves the duration of good-contact, while the partial-contact time remains approximately unchanged. Experimental results obtained at differ- ent positions and at different melt temperature, using transmission or reflection mode, showed a similar de- pendence of the part contact time on the packing pres- sure.
Solidification Monitoring Even though the gap development caused by the
shrinkage of the part provides some knowledge of the solidification process, the information is not complete. Ultrasonic velocity and attenuation inside the part are also strongly related to the physical properties of the molded part. Thus the ultrasonic wave velocity and attenuation measurements can be related to more so- lidification parameters. Since the complicated compo- nents of the mold such as cooling line, ejector pin, and non-parallel mold surface may generate noises that interfere with the desired signals, the injection mold- ing process is not ideal for accurate attenuation mea- surements, which require at least two echoes with high signal to noise ratio (SNR > 30 dB). However, velocity measurements can still be carried out with a considerable accuracy using two echoes with low SNR (e.g. 10 dB). Amplitude variation may also be moni- tored. For solidification monitoring, ultrasonic mea- surements using both transmission and reflection modes were performed.
Transmission Mode
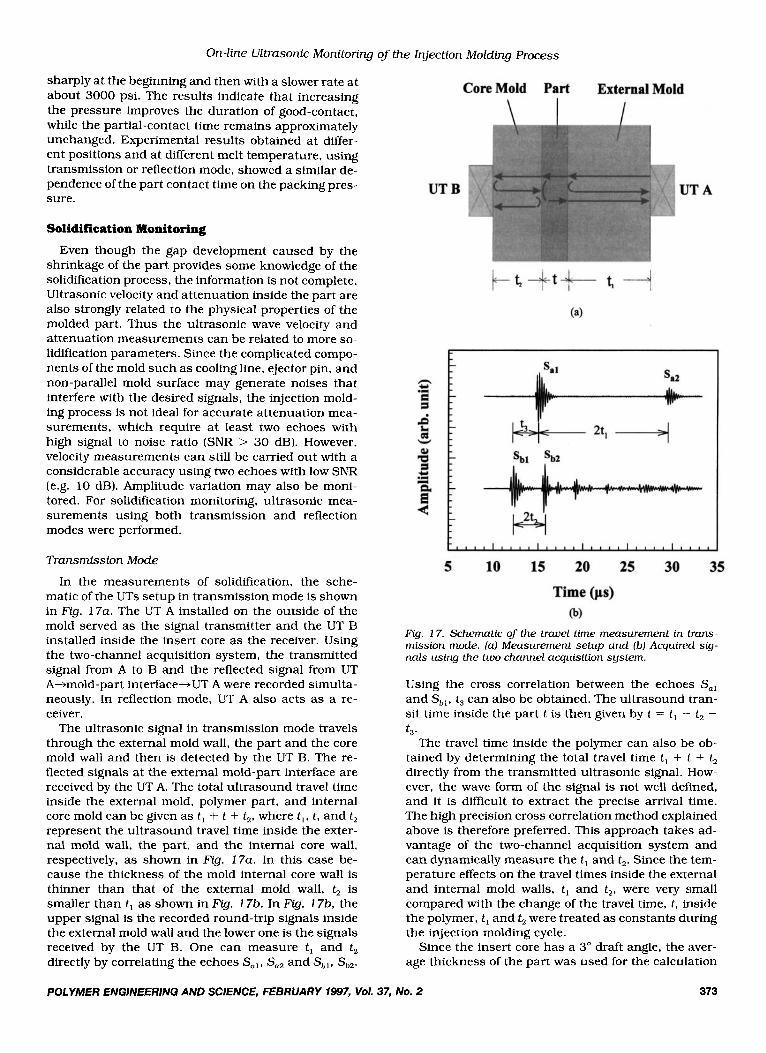
In the measurements of solidification, the sche- matic of the UTs setup in transmission mode is shown in Fig. 17a. The UT A installed on the outside of the mold served as the signal transmitter and the UT B installed inside the insert core as the receiver. Using the two-channel acquisition system, the transmitted signal from A to B and the reflected signal from UT A-tmold-part interface-+UT A were recorded simulta- neously. In reflection mode, UT A also acts as a re- ceiver.
The ultrasonic signal in transmission mode travels through the external mold wall, the part and the core mold wall and then is detected by the UT B. The re- flected signals at the external mold-part interface are received by the UT A. The total ultrasound travel time inside the external mold, polymer part, and internal core mold can be given as t , + t + t,, where t,, t, and t, represent the ultrasound travel time inside the exter- nal mold wall, the part, and the internal core wall, respectively, as shown in Fig. 17a. In this case be- cause the thickness of the mold internal core wall is thinner than that of the external mold wall, t, is smaller than t , as shown in Fig. 17b. In Fig. 17b, the upper signal is the recorded round-trip signals inside the external mold wall and the lower one is the signals received by the UT B. One can measure t , and t, directly by correlating the echoes S,, , S,, and S,,, sb,.
Core Mold Part External Mold
c c 1 .-
e 0 W
c
5 10 15 20 25 30 35
Time (ps) (b)
Fig. 17. Schematic of the travel time measurement in trans- mission mode. (a) Measurement setup and [b) Acquired sig- nals using the twochannel acquisition system.
Using the cross correlation between the echoes S,, and S, , , t3 can also be obtained. The ultrasound tran- sit time inside the part t is then given by t = t, -- t , - t3
The travel time inside the polymer can also be ob- tained by determining the total travel time t , + t + t, directly from the transmitted ultrasonic signal. How- ever, the wave form of the signal is not well defined, and it is difficult to extract the precise arrival time. The high precision cross correlation method explained above is therefore preferred. This approach takes ad- vantage of the two-channel acquisition system and can dynamically measure the t , and t,. Since the tem- perature effects on the travel times inside the external and internal mold walls, t , and t,, were very small compared with the change of the travel time, t, inside the polymer, t , and t, were treated as constants during the injection molding cycle.
Since the insert core has a 3" draft angle, the aver- age thickness of the part was used for the calculation
POLYMER ENGlNEERlNG AND SCIENCE, FEBRUARY 1997, Vol. 37, No. 2 373
H. Wang et al.
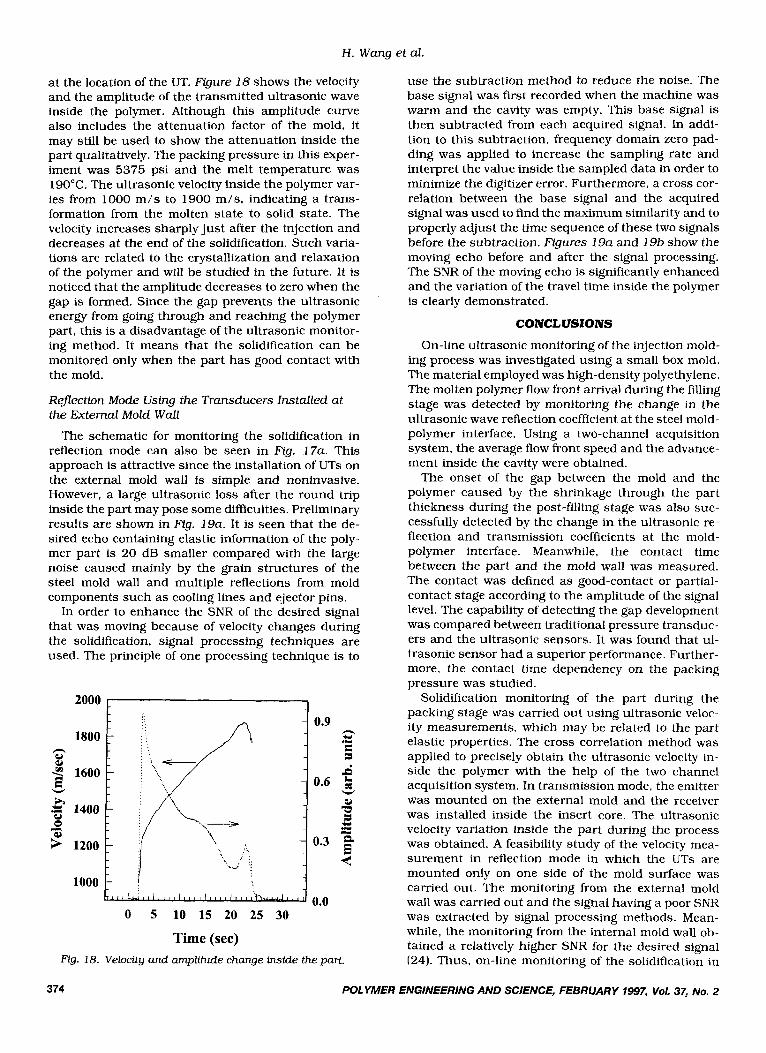
at the location of the UT. Figure 18 shows the velocity and the amplitude of the transmitted ultrasonic wave inside the polymer. Although this amplitude curve also includes the attenuation factor of the mold, it may still be used to show the attenuation inside the part qualitatively. The packing pressure in this exper- iment was 5375 psi and the melt temperature was 190°C. The ultrasonic velocity inside the polymer var- ies from 1000 m / s to 1900 m/s , indicating a trans- formation from the molten state to solid state. The velocity increases sharply just after the injection and decreases a t the end of the solidification. Such varia- tions are related to the crystallization and relaxation of the polymer and will be studied in the future. It is noticed that the amplitude decreases to zero when the gap is formed. Since the gap prevents the ultrasonic energy from going through and reaching the polymer part, this is a disadvantage of the ultrasonic monitor- ing method. It means that the solidification can be monitored only when the part has good contact with the mold.
Reflection Mode Using the Transducers Installed at the External Mold Wall
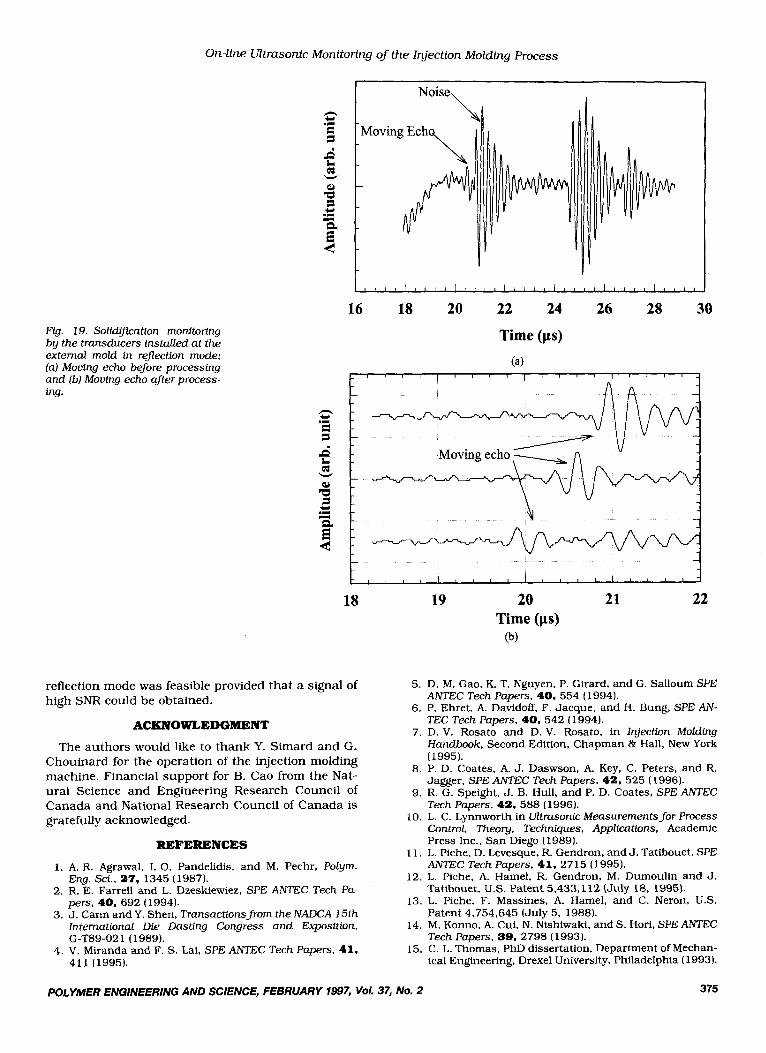
The schematic for monitoring the solidification in reflection mode can also be seen in Fig. 17a. This approach is attractive since the installation of UTs on the external mold wall is simple and noninvasive. However, a large ultrasonic loss after the round trip inside the part may pose some difficulties. Preliminary results are shown in Fig. 19a. I t is seen that the de- sired echo containing elastic information of the poly- mer part is 20 dB smaller compared with the large noise caused mainly by the grain structures of the steel mold wall and multiple reflections from mold components such as cooling lines and ejector pins.
In order to enhance the SNR of the desired signal that was moving because of velocity changes during the solidification, signal processing techniques are used. The principle of one processing technique is to
2000
n 0.9 1800
n 0 3 1600 W
I I
0 5 10 15 20 25 30
Time (sec)
I I I I I I I I I I I I I I I I I I I ,'r3..A.-iI < , 1000
Fig. 18. Velocity and amplitude change inside the part.
use the subtraction method to reduce the noise. The base signal was first recorded when the machine was warm and the cavity was empty. This base signal is then subtracted from each acquired signal. In addi- tion to this subtraction, frequency domain zero pad- ding was applied to increase the sampling rate and interpret the value inside the sampled data in order to minimize the digitizer error. Furthermore, a cross cor- relation between the base signal and the acquired signal was used to find the maximum similarity and to properly adjust the time sequence of these two signals before the subtraction. Figures 19a and 19b show the moving echo before and after the signal processing. The SNR of the moving echo is significantly enhanced and the variation of the travel time inside the polymer is clearly demonstrated.
CONCLUSlONS
On-line ultrasonic monitoring of the injection mold- ing process was investigated using a small box mold. The material employed was high-density polyethylene. The molten polymer flow front arrival during the filling stage was detected by monitoring the change in the ultrasonic wave reflection coefficient a t the steel mold- polymer interface. Using a two-channel acquisition system, the average flow front speed and the advance- ment inside the cavity were obtained.
The onset of the gap between the mold and the polymer caused by the shrinkage through the part thickness during the post-filling stage was also suc- cessfully detected by the change in the ultrasonic re- flection and transmission coefficients a t the mold- polymer interface. Meanwhile, the contact time between the part and the mold wall was measured. The contact was defined as good-contact or partial- contact stage according to the amplitude of the signal level. The capability of detecting the gap development was compared between traditional pressure transduc- ers and the ultrasonic sensors. It was found that ul- trasonic sensor had a superior performance. Further- more, the contact time dependency on the packing pressure was studied.
Solidification monitoring of the part during the packing stage was carried out using ultrasonic veloc- ity measurements, which may be related to the part elastic properties. The cross correlation method was applied to precisely obtain the ultrasonic velocity in- side the polymer with the help of the two channel acquisition system. In transmission mode, the emitter was mounted on the external mold and the receiver was installed inside the insert core. The ultrasonic velocity variation inside the part during the process was obtained. A feasibility study of the velocity mea- surement in reflection mode in which the UTs are mounted only on one side of the mold surface was carried out. The monitoring from the external mold wall was carried out and the signal having a poor SNR was extracted by signal processing methods. Mean- while, the monitoring from the internal mold wall ob- tained a relatively higher SNR for the desired signal (24). Thus, on-line monitoring of the solidification in
374 POLYMER ENGINEERING AND SCIENCE, FEBRUARY 1997, Vol. 37, No. 2
On-line Ultrasonic Monitoring of the Injection Molding Process
Fig. 19. Solidifiiation monitoring by the transducers installed a t the external mold in reflection mode: (a) Moving echo before processing and (b) Moving echo after process- ing.
n *
+-
16 18 20 22 24 26 28 30
Time (ps)
(4 C " " l " " l " " I " " ~
r F .. . . /'
.I I
c I- I
~ ~ ' ~ " " " " ' " " ' ' ' ~
18 19 20 21 22 Time (ps)
(b)
reflection mode was feasible provided that a signal of high SNR could be obtained.
ACKNOWLEDGMENT The authors would like to thank Y. Simard and G.
Chouinard for the operation of the injection molding machine. Financial support for B. Cao from the Nat- ural Science and Engineering Research Council of Canada and National Research Council of Canada is gratefully acknowledged.
REFERENCES
1. A. R. Agrawal, I. 0. Pandelidis, and M. Pechr, Polym. Eng. Sci., 27. 1345 (1987).
2. R. E. Farrell and L. Dzeskiewiez, SPE ANTEC Tech Pa- pers, 40, 692 (1994).
3. J. Cann and Y. Shen, Transactions from the NADCA 15th International Die Dasting Congress a n d Exposition,
4. V. Miranda and F. S. Lai, SPE ANTEC Tech Papers, 41, G-T89-02 1 (1989).
411 (1995).
5. D. M. Gao, K. T. Nguyen. P. Girard, and G. Salloum SPE ANTEC Tech Papers, 40. 554 (1994).
6. P. Ehret, A. Davidoff, F. Jacque, and H. Bung, SPE AN- TEC Tech Papers, 40, 542 (1994).
7. D. V. Rosato and D. V. Rosato, in Injection Molding Handbook, Second Edition, Chapman & Hall, New York (1995).
8 . P. D. Coates. A. J. Daswson, A. Key, C. Peters, and R. Jagger. SPE AlVTEC Tech Papers, 42,525 (1996).
9. R. G. Speight, J . B. Hull, and P. D. Coates, SPE ANTEC Tech Papers, 41, 588 (1996).
10. L. C. Lynnworth in UZtrasonic Measurements for Process Control, Theory, Techniques, Applications, Academic Press Inc., San Diego (1989).
1 1. L. Piche, D. Levesque, R. Gendron, and J. Tatibouet, SPE ANTEC Tech Papers, 41, 2715 (1995).
12. L. Piche, A. Hamel, R. Gendron, M. Dumoulin and J. Tatibouet, US. Patent 5,433,112 (July 18, 1995).
13. L. Piche, F. Massines, A. Hamel, and C. Neron, U S . Patent 4,754,645 (July 5, 1988).
14. M. Konno, A. Cui, N. Nishiwaki, and S. Hori, SPE ANTEC Tech Papers, 39, 2798 (1993).
15. C. L. Thomas, PhD dissertation, Department of Mechan- ical Engineering, Drexel University, Philadelphia (1993).
POLYMER ENGINEERING AND SCIENCE, FEBRUARY 1997, Vol. 37, No. 2 375
H . Wang et al.
16.
17.
18.
19.
20.
376
C. Thomas, J. L. Rose. and 2. K. Li, Review of Progress in Quantitative Nondestructive Evaluation, 12. 2333 (1 993). J. J. Magda, M. L. Parrott, C. L. Thomas, and D. R. Law- son, SPE ANTEC Tech Papers, 42, 1182 (1996). C. L. Thomas, A. A. Tseng, J. L. Rose, and A. J. Bur, SPE AiWEC Tech Papers, 39, 143 (1993). C. L. Thomas, A. 0. Adebo, and A. J. Bur, SPE ANTEC Tech Papers, 40, 2236 (1994). B. 0. Rhee, C. A. Hieber, and K. K. Wang, SPE ANTEC Tech Papers, 40.496 (1994).
21. C. J. Yu, J. E. Sunderland, and C. Poli, Polyrn. Eng. Sci.,
22, M. Rezayat and B. Jantzen, Polym. Eng. Sci., 38, 247
23. C. L. Thomas, M. Jiang, C. C. Chen, and A. J. Bur, SPE
24. B. Cao, Master’s thesis, Department of Electrical Engi-
25. H. Wang, M. Prystay, J.-F. HCtu, B. Cao, and C. K. Jen,
Received June 24, 1996
30, 1599 (1990).
(1995).
ANTEC Tech Papers, 41, 2707 (1995).
neering, McGill University, Montreal (1996).
SPE ANTEC Tech Papers, 42, 1049 (1996).
POLYMER ENGINEERING AND SCIENCE, FEBRUARY 1997, Vol. 37, No. 2