Embed Size (px)
Citation preview
QUARTERLY JOURNAL OF THE
ROYAL METEOROLOGICAL SOCIETY VOL. 72 OCTOBER, 1946 “0. 3’4
551.543.3 : 55’.509.33 ON PERIODS AND SYMMETRY POINTS IN PRESSURE AS
AIDS TO FORECASTING B y SIR GILBERT WALKER, Kt., C.S.I.. Sc.D., F.R.S.
(Yanuscript received December 4, 1945-read November 20, 1946) SUMMARY
(a) The movements of the atmosphere are on such a scale as to produce much coherence between the pressures on successive days. Persistence is especially marked in high values of pressure, which usually last for a week or thereabout, and will appear on a graph as surges.
(b ) Two surges m days apart will make a considerable contri- bution to the computed amplitude of a wave whose period is m days ; and a third surge or hollow at an appropriate time may further increase it. Thus mere coherence produces a n appreciable amount of periodicity.
( c ) The existence of coherence in pressure series makes the ordinary Schuster criterion for “reality” inapplicable. A test suit- able for harmonic analysis follows from a previous paper by the author, but one adapted for correlograms is much needed.
(d ) The amount of periodicity to be expected in a coherent random series may be examined theoretically or experimentally. I t does not differ appreciably from that found in actual pressure series. Hence if a wave system appears there is no special ground for expecting the continuation which is necessary as the basis of a weather forecast. During a stretch of 144 days there was no evidence that a periodicity of, cay, p days observed over a stretch of 3p days had any appreciable tendency to persist over another 3 p days.
( e ) Surges and hollows also tend to make points of positive or negative symmetry, and experiments with coherent random series produce a s much symmetry a s we find in actual pressure series. Thus the symmetry that is observed, like the periodicity, is due to ordinary atmospheric conditions ; and even when the symmetry is strongly marked continuity cannot be relied upon to justify pre- diction.
I . Among the duties with which a meteorologist is confronted, that of weather prediction i s of vital importance. In connexion with this a belief in the reality of periods of various lengths in air pressure and in the occurrence of points of symmetry has developed in severaI countries, with confidence in the reliability of forecasts based upon them. I t is, therefore, imperative that the validity of these methods should be subjected to a critical examination.
265
266 SIR GILBERT WALKER
I-’ERIODICITIES
2. Modes of analysis of the periodicity of a series fall into two main classes :-(a) trigonometrical, such as Fourier analysis or the more complete Schuster prriodogram, and ( b ) depending on correla- tion coefficients between terms I , 2, 3 . . . apart, the graph being called a “correlogram” (Kendall, 1944, p. 105).
3. The use of Fourier analysis has two serious drawbacks. Firstly there is a strong temptation to take as the length of time analysed 60 or 72 days in order to have a large number df integral submultiple periods; and when one of these, say of 2 0 days, has a considerable amplitude it is accepted as real without examination of the amplitudes of 19 and 21 days. Thus Weickmann’s chief waves are of 24 and 36 days (1931, p 244).
The second drawback is that frequently an oscillation appears for a time, dies out and later appears again with a different phase; so the contributions to the analysis of the whole series may largely cancel and the summed amplitude may be small although there may have been waves of large amplitude for much of the time. Thus the Fourier amplitude, if taken as an index of wave activity, may not give a correct impression.
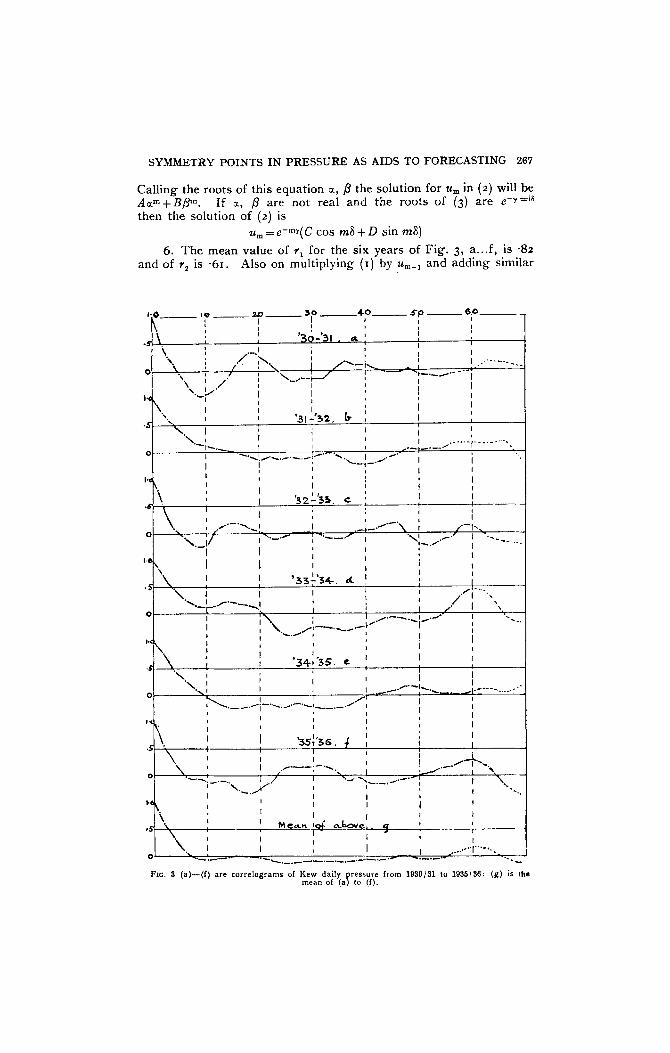
4. From these defects the correlogram is in great measure free. In contrast with the limitation of periods to ,submultiples of 60 and 72 days it brought out clearly the rg-day waves which prevailed from November 1930 to January 1931 (see Fig. 3a). Also Pollak (1940, p. 4zg), using a development of the, correlation method, announced 40 wave-lengths of between 4 and 32 days, which were well scattered.*
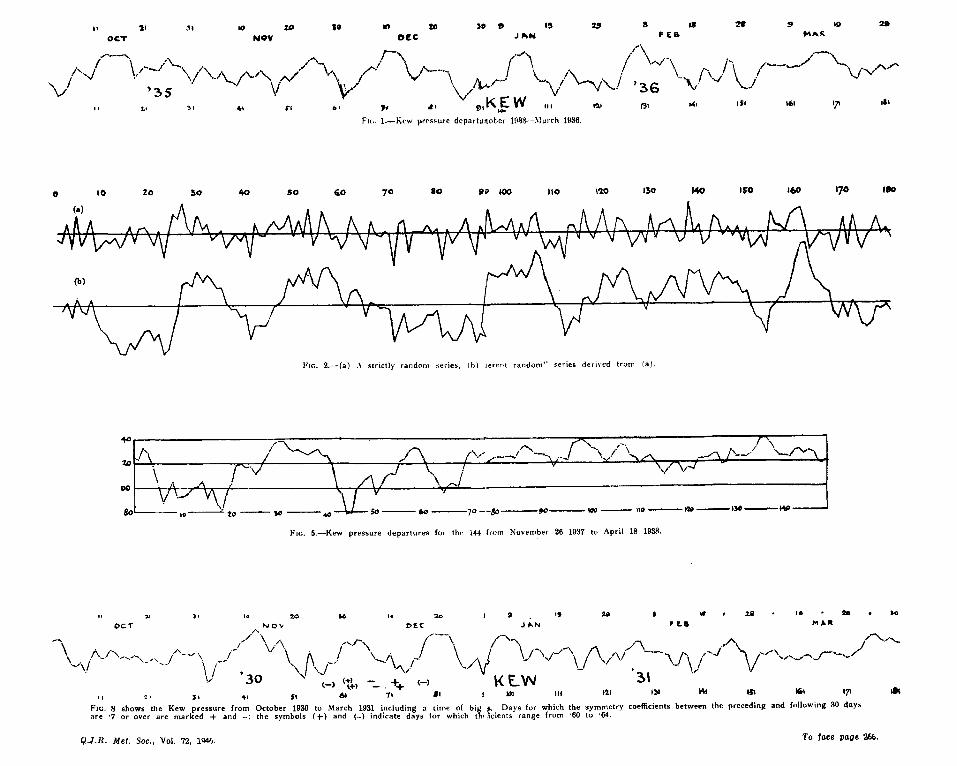
Correlograms a t once bring to light an important feature, that in daily pressures the value of T , , the correlation coefficient between values on successive days considerable, usually between 7 and -9. This expresses the fundamental feature of the smoothness of the pressure graphs: and of it Figs. I , 5 , 8 of the daily Kew pressures, for about seventeen months in all, will give an idea. In a curve such as Fig. 2 8 , got by plotting random numbers, a large positive value is as likely as not to be followed by a negative value, so that the appearance is essentially different.
The correlograms of Kew pressure for the six half-years October to March from 1930-1 to 1935-6 are given in Fig. 3, a...f, and the mean of these is Fig. 38.
5 . It was suggested by Yule (1927) that in many cases a series might be regarded a s defining a system with a certain number of natural periods of its own to which were applied a series of external disturbances v,, v2. . . . Corresponding to a single damped period there would be an equation of the form
Now u,=xnl will provide a solution of
if
14, g l 1 l m - l + gZUm-2 + Vm * . . . . (1)
u m == g i U m - l + SzUm-2 . . (2)
*They were:-4.0, 4.1, 4-4. 5-0, 5.8, 5.8, 6 4 , 6.8, 7.1. 7-6, 8.1, 8.1, 9.0. 9.2 9.4, 9-5 , 10.0. 10.0, 10.2, 11.0, 12.3, 12.4, 13.4. 13.6, 13.6, 15-0, 16.0, 16.2 16-8, 19.3, 20.1, 22.2, 23.9, 24.0, 24.0, 26 3, 28.8, 31.3, 31.9.
SYMMETRY POINTS I N PRESSURE AS AIDS TO FORECASTING 267
Calling the roots of this equation a , p the solution for u, in (2) will be Aam+Bpm. If a , ,# are not real and the roots of (3) are e - y r i s
then the solution of (2) is urn= e - m y ( C cos m8 + D ,sin ma)
6 . The mean value of rl for the six years of Fig. 3, a...f, is 3 2 and adding similar and of rz is .61. Also on multiplying ( I ) by
FIG. 3 (a)-(1) are correlograms of Kew daily ressure from lQS0jSl to 1036/36: (g) is the mean of cay to , f ) .
268 SIR GILBERT WALKER
equations for successive values of m, when the number of terms is large (Walker 1931, 519)
r 1 = g1+ g2r1 Similarly on multiplying by
r2 = s l y 1 + s z From the values . 8 z , .61 we find s I = . 9 8 , g z = - . ~ g , so that
and as the roots of xz--g8x.+.rg=o are -71 and ’27 we have
This indicates a fairly persistent component in ( . 7 1 ) m and one that rapidly diminishes in (.27)m, with no oscillatory term. The former is the more important and its existence can be inferred with much greater confidence ; for if instead of .82 and .61 for rl and r2 we had .8 and ‘64, values well within the limits of error, it would follow that g , = .8 and g2=o, with urn= G(.B)m. As it will greatly reduce the amount of computing and will not introduce appreciable error if we treat g, as zero, we shall as a first approximation, adopt this value.
urn = .g8u,-, - . Igurn-z
X , = E(*71)m + F( .27)”’
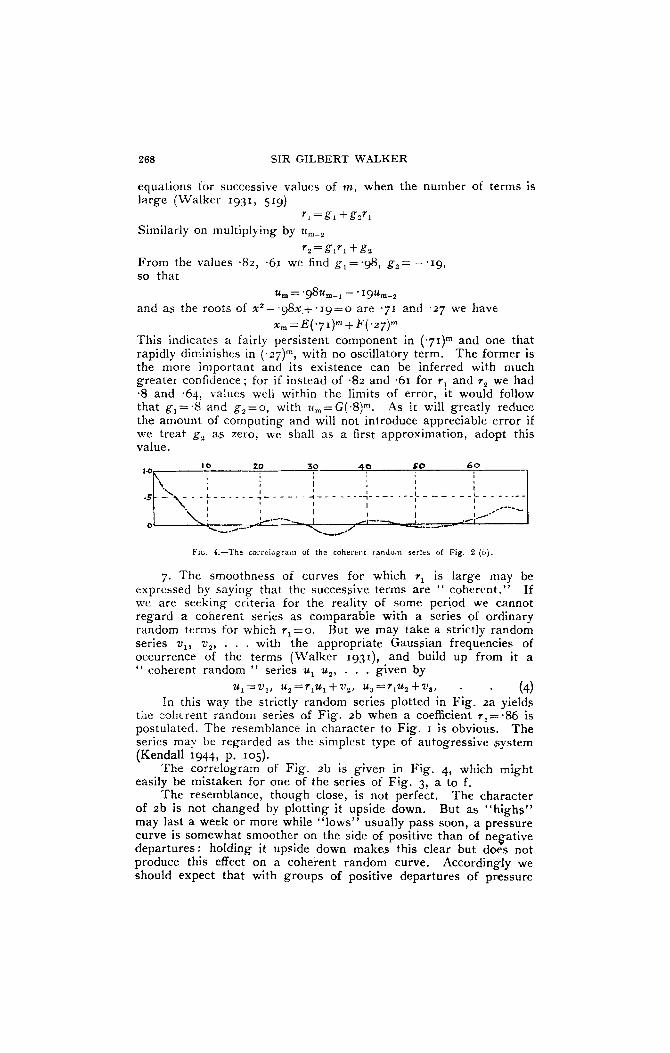
FIG. 4.-The corrclograii of the coherent random series of Fig. 2 (b).
7. The smoothness of curves for which rl is large may be exprcssed by saying that the successive terms are “ cohercnt.” If we are seeking criteria for the reality of some period we cannot regard a coherent series as comparable with a series of ordinary random terms for which r l=o . But we may take a strictly random series vl, v2, . . . with the appropriate Gaussian frequencies of occurrence of the terms (Walker 1g31), and build up from it a “ coherent random ” series u1 uz, . . . given by
u l = v l , u2=~,u ,+vuz , u 3 = r l u Z + v 3 , . . (4) I n this way the strictly random series plotted in Fig. 2a yields
the coherent random series of Fig. zb when a coefficient r ,=*86 is postulated. The resemblance in character to Fig. I is obvious. The series may be regarded as the simplest type of autogressive ,system (Kendall 1944, p. 105).
The correlograrn of Fig. zb is given in Fig. 4, which might easily be mistaken for one of the series of Fig. 3, a to f.
The resemblance, though close, is not perfect. The character of zb is not changed by plotting it upside down. But as “highs” may last a week or more while “lows” usually pass soon, a pressure curve is somewhat smoother on the side of positive than of negative departures: holding it upside down makes this clear but does not produce this effect on a coherent random curve. Accordingly we should expect that with groups of positive departures of pressure
SYMMETRY POINTS IN PRESSURE AS AIDS TO FORECASTING 269
the greater smoothness would yield greater values of r , than with groups of negative departures.
This feature should be most marked in ,seasons in which the surges of pressure are most developed, and I therefore worked out the values of rl for the hundred days from October I , 1930 to January 8, 1931 (see Fig. 8). For pairs of consecutive days in which the prior day had a positive departure the value of rl was .67 and €or those with a negative departure it was ”74.
Some other factor,s affecting r l will be discussed in the Appendices.
8. When two surges occur m days apart there will be appreci- able contributions to the amplitude of a wave of m days period. And if a third surge should appear its time of arrival may sometimes increase the amplitude and sometimes diminish it. Thus analysis may be expected occasionally to indicate harmonic waves which for two or three periods have amplitudes comparable with those of surges.
9. For the reality of a period shown in a correlogram no satis- factory criterion is known to me. For a period derived by harmonic analysis both Schuster’s criterion and the extengion of it to an amplitude selected for its magnitude are based on comparison with strictly random numbers, and are therefore not valid for coherent series. , For these a method has been developed (Walker 1931, 520-3) and it may be convenient to apply it briefly to the system of $ 5 , equation ( I ) .
W e have found r l=g l+gzr l rz=glr1 +gz
U ’ ~ = ( Y ~ ( I -Rz) where R Z = g l r l +g,r, and from (1931, 523) if uz, u’* are the variances of u, ‘u
Thus I -dZ/cP=glrl,+g,rz Hence, eliminating rl, r ,
u’z/r2=, I (1 -gJ2-gl2 1 (1 +gz) / ( ’ -g*) Also (1931, 522) for the q’th harmonic, if a=zn,/n, the Fourier terms for u, v are given by
n - (a,,+ ib,) = zukei(k-’)qa 2 k=1
n
and n > (a’,.+ ib’,) = (uk - g l U r - - g2uk-,) ei(!+-’)+
1 tl
2 - - - (a, + ib,) (.I. - gleiqa - g,eiqn)
with
- n ( d Q - i b ’ , ) = - n (u,-ibq) (~ . -g , e - ’q~ - gze-2’s.) 2 2
So, multiplying, for the amplitudes c, c’ we have
W e ge t rid o f the effects of the units of measurement by using the “amplitude-ratio,” f z c / a s / z , which is unity for a pure sine curve.
c‘Z=cZ { I +g,Z+g,2-2g1 ( I - g z ) cos qx-2g2 cos zqz }
270 SIR GILBERT WALKER
9 ' 7 G 5 4
c ;
lo.+
.3
6' 4 /\ ,P;/ c --.-
f' ._.--_-_"I
. ,_ ~ - -- ~ -. -. ._ - _ .--.-._
= - I , ,A, \ : . ' :": j j / 4 f . L*---.... . z , I' '
f ' : 1, .--:,;y- .
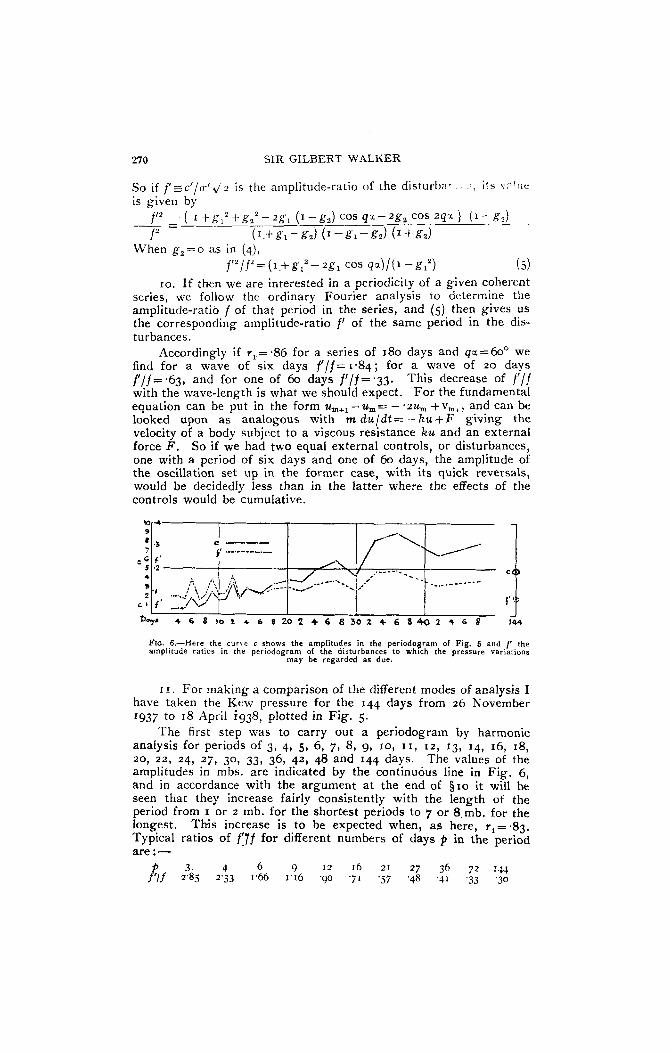
I I . For making a comparison of the different modes of analysis I have taken the Kew pressure for the 144 days from 26 November 1937 to 18 April i938, plotted in Fig. 5.
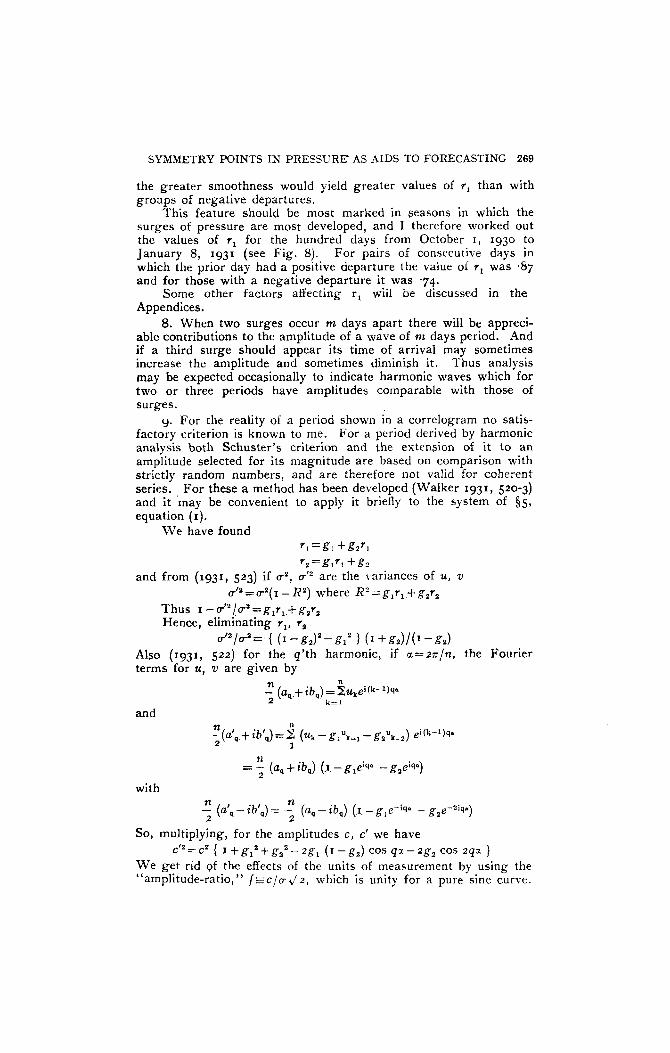
The first step was to carry out a periodogram by harmonic analysis for periods of 3, 4, 5 , 6, 7, 8, g, 10, 11, 12, 13, 14, 16, 18, 2 0 , 2 2 , 24, 27, 30, 33, 36, 42, 48 and 144 days. The values of the amplitudes in mbs. are indicated by the continuous line in Fig. 6, and in accordance with the argument a t the end of $10 it will he seen that they increase fairly consistently with the length of the period from I or 2 mb. for the shortest periods to 7 or 8.mb. for the longest. This increase is to be expected when, as here, r,=.83, Typical ratios of f'7f for different numbers of days p in the period are :-
3 ) 4 6 9 12 16 21 27 36 72 r j j hf 2.85 2'33 1.66 1'16 '90 .71 '57 '48 '41 '33 '30
SYMMETRY POINTS IN PRESSURE AS AIDS TO FORECASTING 271
The values of f’ are shown by the dotted line in Fig. 6 ; for p=144, f’ is less than for p = 3 o r 4. The number of terms included ranges from 126 when p=42 to 150 when p=15 .
In order to decide whether the amount of periodicity in the disturbances is greater than random numbers would produce we may now apply Schuster’s criterion to the value of f’. These are multi- plied by 1000.
1 A H L E I
p 3 4 j o 7 8 9 IO I I 1 2 I j I 4
fi 16 I 8 20 2 2 24 27 30 33 30 42 48 144 f’ 91 116 120 1 0 j 134 1j2 106 189 193 126 IjZ 78
f’ 78 81 68 156 63 85 154 87 97 168 80 116
As Schuster proved, the chance that from a series of n random terms a value of f’ will exceed k ( z / n ) ? is e-k2; and on making -e-k2 equal to 4, 4, 9 we learn that 75 per cent of 24 values of f’ derived from random numbers should exceed .06; 50 per cent should exceed .IO; and 25 per cent -14. The values of f’ corresponding to these in Table I are .08, ’11 and * I S , so that the amplitudes of the periods are approximately what random figures may be expected to yield. Also there is no single amplitude big enough to claim reality : for the biggest is ’193, for which k = 2 . @ and the chance that a random coefficient will exceed this is e-kz, or 1/14*7, or once in 15 cases; it actually occurs once in 24 cases.
Thus in both respects the amplitudes of periodicities found are no larger than random numbers will produce.
12. Since a wave of p days may last for a time and reappear with a nearly reversed phase, and the contributions to the whole 144 days may largely cancel, it seems desirable to experiment by limiting the number of days included in our analysis to 3p and to effect as many analyses as 144 days would provide, with extensions to 150 when necessary.
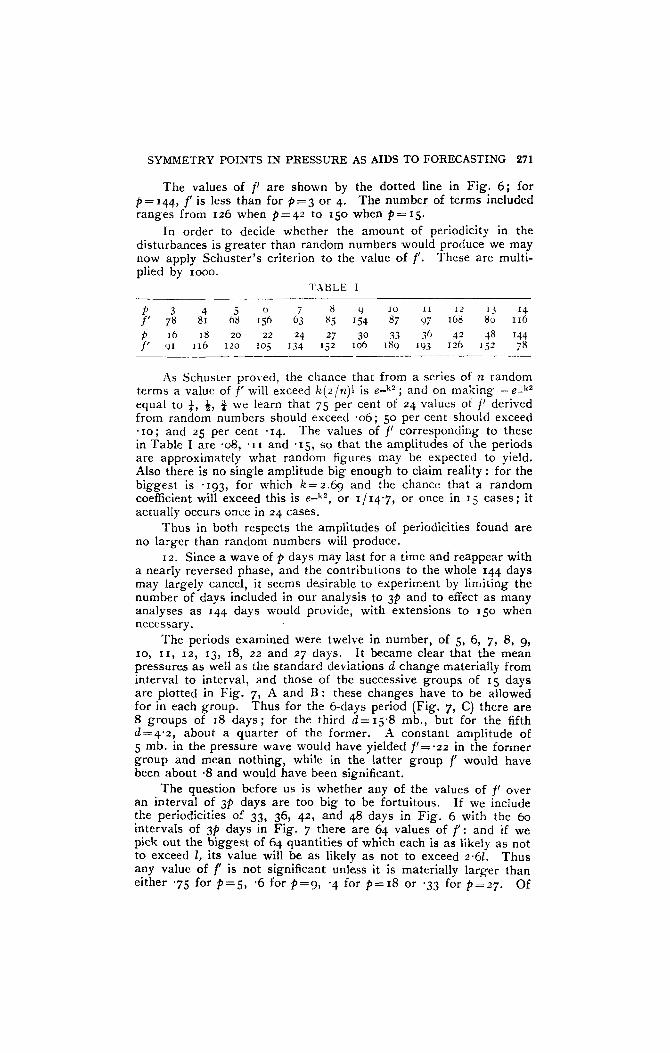
The periods examined were twelve in number, of 5 , 6, 7, 8, 9, 10, 11, 12, 13, 18, 22 and 27 days. I t became clear that the mean pressures as well as the standard deviations d change materially from interval to interval, and those of the successive groups of 15 days are plotted in Fig. 7, A and B: these changes have to be allowed for in each group. Thus for the 6-days period (Fig. 7, C ) there are 8 groups of 18 days ; for the third d = 15.8 mb., but for the fifth d=4.2, about a quarter of the former. A constant amplitude of 5 mb. in the pressure wave would have yielded f ’ = . 2 2 in the former group and mean nothing, while in the latter group f’ would have been about .8 and would have been significant.
The question before u s is whether any of the values of f’ over an interval of 3p days are too big to be fortuitous. If we include the periodicities of 33, 36, 42, and 48 days in Fig. 6 with the 60 intervals of 3p days in Fig. 7 there are 64 values of f‘: and if we pick out the biggest of 64 quantities of which each is as likely as not to exceed 1, its value will be as likely a s not to exceed 2.62. Thus any value of f is not significant unless it is materially larger than either ‘75 for p = 5 , a 6 for p = g , ’4 for p = 1 8 or ‘33 for p=27. Of
272 SIR GILBERT WALKER
these limits perhaps ‘75 and a 6 should be somewhat reduced owing to overestimation of the ratio f’/f when p is smal!: existing iiicor-y is imperfect in such cases.
During the first 72 days, when the amplitudes of c are relatively large, none of the value,s of f’ is materially in excess of the limits laid dawn. I t is in the second 72 days that fr reaches ‘9 approxi- mately and might be significant in the periods of 5 and 6 days. For the longer periods f’ is such a s chance may be expected to produce.
SYMMETRY POINTS IN PRESSURE AS AIDS TO FORECASTING 273
An application of harmonic analysis without recognition of coherence leads, I understand, to acceptance as real of the periods of 6, 84 to 94, 1 7 or 18, and about 26 and 33 days, that of 17 or 18 being ,specially well-marked. All these periods-+xcept perhaps that of 6 days-have no significance when account is taken of coherence.
13. When estimating the usefulness of a periodicity for forecast- ing there is another important consideration. If the period is of p days it might be well developed over the 3 p days over which its amplitude was estimated; but over the next 3 p days the coefficients a , b of its cosine and sine terms might vanish or undergo a change of sign. In the latter case predictions based on it would be reversed in character.
The coefficients a, b are shown in Fig. 7 C and the graphs show 21 cases in which over 3 p days the amplitude of a or 0 was 4 mb. or over. During the following 3p days there are 5 cases (with periods 5, j, 8, 8 and 27 days) in which the amplitude was less than z mb., so that the wave had practically died out. Of those which had amplitudes of 2 to 3.9 mb. there were 5 in which the sign had persisted and 4 in which it reversed (of 5, 6, g and 27 days): and of the 7 in which the succeeding amplitude was maintained a t 4 mb. or over, 3 had the same sign and 4 the opposite (5, 6, 6 and 10). Hence as far a s these 144 days are concerned to rely on per- sistence in period and phase from one interval of 3 p days to the next appears to give no better indication than tossing a penny. I t is true that for a period as long a5 10 days, estimated over 30 days, it is a rather severe requirement tha t the wave shall persist over another 30 days: but persistence over 10 days may fairly be demanded, and that would produce an appreciable effect on the a, b 01 the 30 days: the existence of such an effect is highly uncertain.
POINTS OF SYMMETRY
14. The consiclerations of the previous sections have much in common with those appropriate for points of symmetry. One or more of these are likely to arise from geometrical considerations when two or three surges or hollows happen to arrive in a n appro- priate succession. Incidentally it may be remarked that plotted curves often give the impreasion of closer relationships than are justified by the correlation coefficients.
The first question to settle then is the extent to which symmetry points occur in coherent random series; and the amount of persis- tence a t first assumed was .68 which is less than the average quantity. (The formula used was u , = ~ ~ u ~ - ~ . + v ~ , and the change from ‘7 to *68 is due to the error of grouping.)
If the symmetry point occurs on the mth day the natural measure of the symmetry is the value of the correlation coefficient between the series urn+, . . . urn-=, this may be denoted by h, and called the symmetry coefficient, S.C. The coefficient k employed by Stumpff (1938, p. 8) differs from this in that the series correlated are not the actual pressures but approxi- mations to them by Fourier series using the six longest waves. His “,symmetry index” S has the value ( ~ - k ) / z so that for perfect positive symmetry k = I and S = 0 , while for complete reversal
u , , ~ , . . . u,,, and the series
274 SIR GILBERT WALKER
k = - I and S = I . As we shall see later the use of Fourier approxi- mations instead of the actual values produces big distortions. For s in h, I have adopted 30 as the standard number.
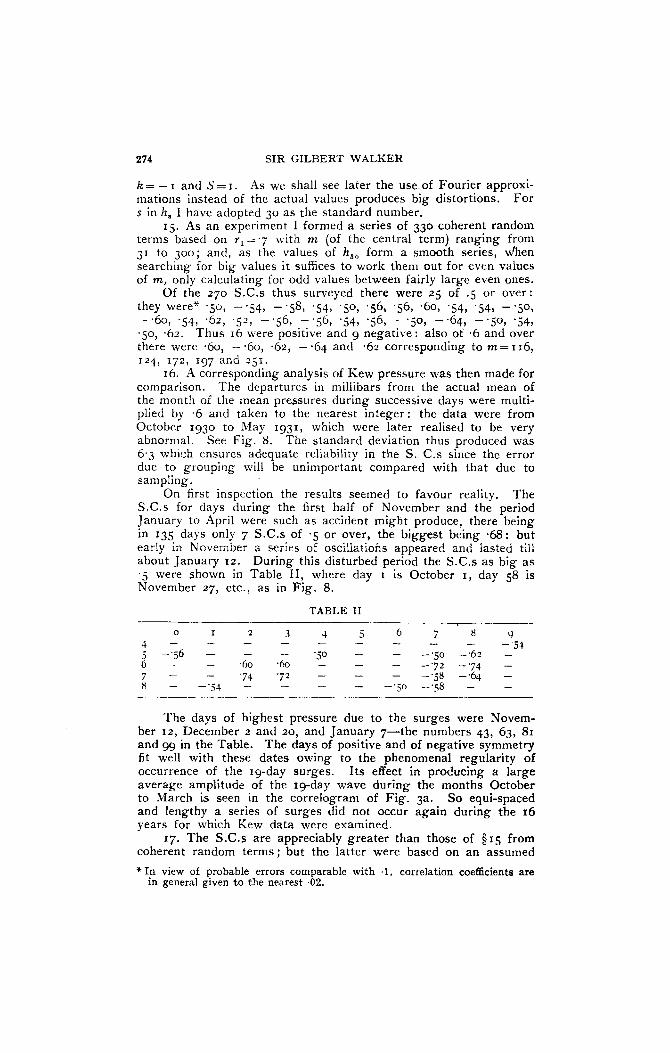
15. As an experiment I formed a series of 330 coherent random terms based on r 1 = ' 7 n i th m (of the central term) ranging from 31 to 300; and, as the values of h,, form a smooth series, when searching for big values it sufices to work them out for even values of m, only calculating for odd values between fairly large even ones.
Of the 270 S.C.s thus surveyed there were 25 of .5 or over: they were" '50, -'54, -.58, '54, 'jo, '56, '56, .60, '54, '54, -'SO,
-50, -62. Thus 16 were positive and g negative: also of ,6 and over there were .60, - .60, .62, - '64 and . 6 2 corresponding to m= I 16, 124, 172, I97 and 2 j I .
16. A corresponding analysis of Kew pressure was then made for comparison. The departures in millibars from the actual mean of the month of the mean pressures during successive days were multi- plied by .6 and taken to the nearest integer: the data were from October 1930 to May 1931, which were later realised to be very abnormal. See Fig. 8. The standard deviation thus produced was 6.3 which ensures adequate reliability in the S. C.s since the error due to grouping will be unimportant compared with that due to sampling.
The S.C.s for days during the first half of November and the period January to April were such a s accident might produce, there being in 135 days only 7 S.C.s of ' 5 or over, the biggest being -68: but early in November a series of oscillatiohs appeared and lasted till about January 12 . During this disturbed period the S.C.s as big as ' 5 were shown in Table 11, where day I is October I , day 58 is November 27, etc., as in F ig , 8.
-54, '62, '52, -.56, .7.56, '54, '56, :*SO, -%, - * S O , '54,
On first inspection the results seemed to favour reality.
TABLE 11
0 I 2 8 9 5 6 7 3 4
6 - - 60 .60 - - - - - ' j 2 -'j4 -
8 - -331 -
- 51 - - - - - - - - 4 - 5 -.j6 - - - j0 - - -'jo -.62 -
- '74 '72 - - - --58 -.64 - - -'jO -.58 - - - - .- 7 -
The days of highest pressure due to the surges were Novem- ber 1 2 , December z and 20, and January 7-the numbers 43, 63, 81 and gg in the Table. The days of positive and of negative symmetry fit well with these dates owing to the phenomenal regularity of occurrence of the Ig-day surges. I t s effect in producing a large average amplitude of the Ig-day wave during the months October to March is seen in the correlogram of Fig. 3a. So equi-spaced and lengthy a series of surges did not occur again during the 16 years for which Kew data were examined.
17. The S.C.s are appreciably greater than those of $15 from coherent random terms; but the latter were based on an assumed
* I n view of probable errors comparable with .1, correlation coefficients are in general given to the nearest .02.
SYMMETRY POINTS IN PRESSITRE AS AIDS TO FORECASTING 275
r ,= .7 between pressures on successive days while the monthly values during Xovembcr and December were .76 and .86.
Accordingly for purposes of comparison I formed two more series of coherent random numbers, for which 7 , was .76 and 4 6 respectively. I used the central series of I j o coherent random num- bers taken from the 300 previously used, choosing this series because it seemed the most disturbed portion. Thus there were in each case go series of 60 consecutive terms for which h,, was calculated, the central terms of the series being the 31st, 32nd . . . 120th. From the first set of numbers , for which rl=’76, the go series contained 7 for which h,, was between .60 and .68, with 2 between ‘70 and .78. Thase for which r=.86 gave j between .6o and .68, 4 between ‘70 and .78, and 4 between .80 and .84.
18. As the condition for the “ reality ” of a symmetry the limit of k laid down by Mildner (1g31), using the ackual pressure figures is ‘ 5 ; and Stumpff (1938, p. 19) using six harmonic terms demands ‘6, but rightly admits that this is not more severe than Mildner’s ’ 5 .
The biggest values of h,, of the exceptional winter 1930-31, though far in excess of the limits for reality demanded by Stumpff and Mildner, are, as we have just seen, no larger than is produced by coherent random numbers to which the actual amount of coher- ence has becn given.
19. We shall now need a measurc of the succcss of a prediction, say for b days, based on symmetry for a days after and before the mth day. W e have called h, the coefficient between the series
and
and we shall now call I , the coefficient between
and
Urn+i, Urntz, . . . Um+a
Urn-1, urn-z, . . . Urn-a
umta+i , Um+e.+2r . . * um+a+b
Um-a-1, urn-a-2, . . . urn-a-b
The published data usually cover about 30 days before and after the symmetry point; so I have taken 2 0 and 10 as the standard values of a, b-i.e. 20 days during which the law of symmetry is obeyed are used as justifying a forecast of obedience for 10 more days.
20. The following statement covers for places outside Great Britain all the examples of symmetry points with a claim to success of which details are now available to me.
(a) An interesting case is that of Stumpff’s graph from Jutland on p. 12 of his 1938 paper . He says that for the 30 days S=*99, so that his k = - ‘98. A qlance a t his graph shows that i f the actual figures were taken our h,, would be materially less. Actually we find that the coefficient is - .56, and that it arises almost entirely in the 10 days before and after the symmetry point, for which hl ,= - .88. For h,, we find -’64, and if on this a prediction for 10 days had been made according to the standard procedure suggested we shouid have had Z l , = -‘24, a failure. If after the phenomenal symmetry of the 10 days before and after, a prediction for 10 days had been made, it would have been unfortunate since for this period 1,” was +-56, of the wrong sign.
276 SIR GILBERT WALKER
( b ) W e also have from the same source a symmetry point in Denmark, of 10 January 1936, for which he says tha t k=*84. W e find h,,='64, h2,=.42 and I,,=.74. With so small a value of h,, no forecast could have been made.
In Stumpff's 1942 paper (p. 108) there are two cases given a5 11 specially fine symmetry points."
( c ) In the first, in southern Greenland, over the central 40 days h,,=-86, and for the 10 days on each side of this 1,,=*82. Over the central 60 days h,,=.88 and outside this 2,,=.54--0f doubtful utility. All symmetry then disappears and after 40 days from the symmetry point l,, = .06.
(d) The second example, like (a) , was of double symmetry- over Iceland-and was remarkable. Over the 40 central days it,,, = - -68 and outside this E , , = - -98. This extraordinary reversed reflexion was maintained until 35 days from the symmetry point, so that 1 , 5 = - '98. But the relationship then suddenly reversed and for the next 10 days Z,,=+.98, equally perfect but in the opposite direction. Here h3,= - .84.
A number of symmetry points a t Donncrsberg have been given by Pollak (1940). In Figs. I to 3 he shows six of which apparently the bcst are:-
Here h,, = - ' 50 is not really big enough whereon to base a prediction. Actually l , , = +.24 and a forecast would have been wrong:
(f) For 22 December 1933 h,, was -74; but a prediction would have worked out only fairly well as I,, = '50 : h,, = .66.
I owe to Prof. Brunt two graphs from which I have made measurements :-
( g ) .At 60' N 30°W there was a well marked symmetry point on I January 1933. Data for the days m= I , +30 reckoned from I January 1933 are missing ; apart from these omissions
( e ) A point of double symmetry on 8 December 1933.
k - - . 2 0 . 30-
h,, = .36, I , , = '60, h,, = *48.
Here h,, would not have been big enough to justify a forecast. (On the graph is a note that S=.IO, i . e . k = - 8 0 . )
(h ) For Seydisfjord on 4 June, 1941 there was a conspicuous symmetry point, with good reflexion during the central 40 days, for which hz0 = + '74. O n this a forecast might have seemed justifiable ; but i t would have been unfortunate for I,,= - 7 4 . For the whole period of 60 days h3,=.30. (On the graph is a note that S=.o6, i .e . k = 48.)
2 1 . For the British Isles I have plotted the daily values a t Kew and Aberdeen from 1922 to 1937 and, although marked differences occasionally appear, the curves have much in common save that the amplitudes are bigger at the more northern station. The similarity may extend to considerably greater distances-at times to central Germany. The most promising time for large values of 1 was clearly in the winter of 1930-31 already described in $16 above.
SYMMETRY POINTS IN PRESSURE AS AIDS TO FORECASTING 277
From Table I the syiiilnc:rc points on days 58, 65, 72 and 78 appear the most interesting
(i) For November 28, 1930 (day 58) h,,= -.62. Here h 20 - - - .60, l , , = - .78.
(j) For December 7 (day 68) h,,= - '74. Here h,,= - '70,
(k) For December 1 1 (day 7 2 ) h,,=.74. Here h,,=.80, 1,,=.64. ( 1 ) For December 17 (day 78) h,,= -.64. Here h,,= - .78,
Weickmann (1931, p. 246) gives the graphs of November 1930 to January 1931 for Croydon (near Kew) and for Leipzig (closely resembling it) with 1 1 Decembvr 1930 as the only day of symmetry in each place.
22. We must now consider how big h,, must be to justify a pre- diction; and as a preliminary question, what magnitude of Z,, is necessary. I think there is fairly general agreement that if a day's or a season's rainfall is being forecast we must have a coefficient of a t least '7 between the antecedent conditions and the rainfall. How big then mu,st h,, be in order that the corresponding l , , shall be a t least .7?
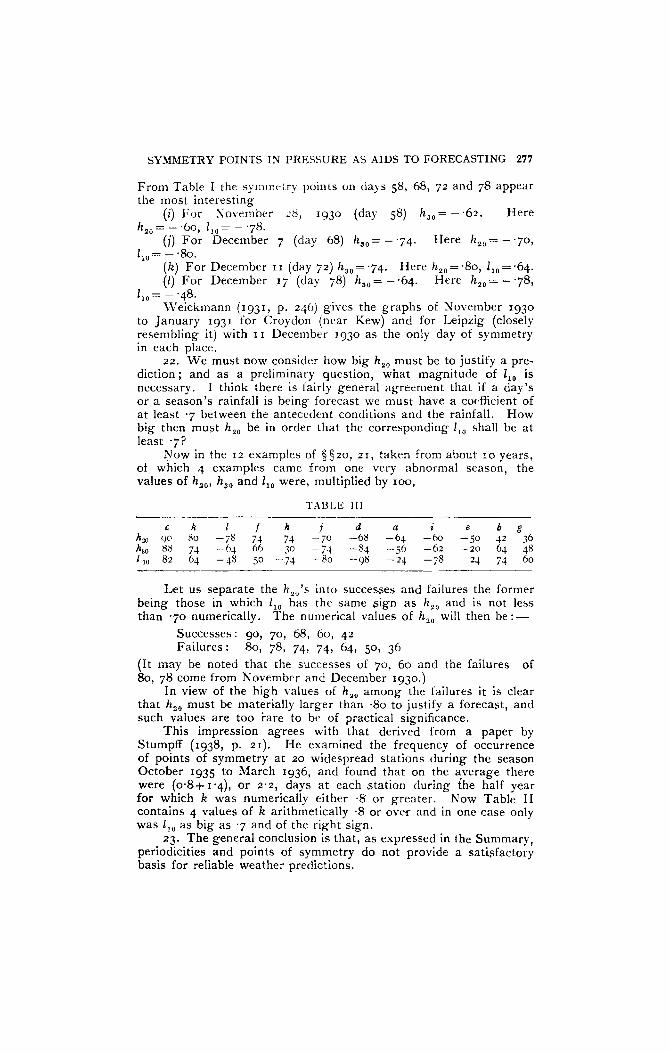
Now in the 12 examples of $ $20, 21, taken from about 10 years, of which 4 examples came from one very abnormal season, the values of h,,, h,, and I,, were, multiplied by 100,
l , , = - .80.
l , , = - ?8.
TARLE I l l
c k l f h t d a i e b g h, oc 80 -78 74 74 -70 -68 -64 -60 - jo 42 36 hso XH 74 -64 66 30 -74 -84 -jh -62 -20 64 48 1," 82 64 -48 j o -74 - 80 -98 -24 -78 24 74 60
Let us separate the haO's into successes and failures the former being those in which 1,, has the same sign a s h,, and is not less than "70 numerically.
Successes: go, 70, 68, 60, 42 Failures: 80, 78, 74, 74, 64, 50, 36
(It may be noted that the successes of 70, 60 and the failures of 80, 78 come from November and December 1930.)
In view of the high values of h,, among the failures it is clear that h,, must be materially larger than .So to justify a forecast, and such values are too iare to be of practical significance.
This impression agrees with that derived from a paper by Stumpff (1938, p. 21) . He examined the frequency of occurrence of points of symmetry a t 20 widespread stations during the season October 1935 to March 1936, and found that on the average there were (0.8+1*4), or 2.2, days a t each ,station during the half year for which k was numerically either .8 or greater. Now Table I1 contains 4 values of k arithmetically .8 or over and in one case only was l , , as big a5 '7 and of the right sign.
23. The general conclusion is that, as expressed in the Summary, periodicities and points of symmetry do not provide a satisfactory basis for reliable weather predictions.
The numerical values of h,, will then be:-
278 SIR GILBERT WALKER
APPmDicEs I . The nature of the coherence between daily pressures
It is clear from the equation u,=rlu,-l,+v, that if v, rises to an isolated peak u , will in general be markedly high, u , , ~ will be raised to a rather smaller extent and ,SO on for the successive terms ; but and the previous terms will not be affected. Examples of this will be seen in Fig. 2b a t 106, 120, 138 and 161. In an actual pressure curve this feature does not occur and a peak is fairly symmetrical before and after. I t may be asked why the coherent; has not been based on such an equation as
which yields a t once rl = (ab + bc +cd + d e ) / ( a 2 + b2 + c 2 + da + e2)
The reply is that such a process would add greatly to the arithmetic and would affect the periodicities. For example if a = b = c = d = e , it will produce rl equal to .80. But if there were a 5-day period in the z’s, its contribution to * ~ f ~ - ~ +urn.+ + zrn-2 + zm-l + v, would be zero and the u series formed from the z’s would have no such period.
Inasfar as (6) expresses the pressure on any day as dependent on external conditions on that day and on previous days it is probably closer to the truth than urn + g z u , - z + v m . But in reality the quantities z),-~, V,,,-~ . . . v, are presumably far from independent, and neither equation expresses the meteorological conditions. The equation ~ , = g ~ u , - ~ + v ~ may be looked on merely as a convenient device for getting coherent random numbers.
11. The dependence of rl on weather It might be expected that for any month rl would be roughly
proportional to the amount of disturbance and so to the standard deviation u. But there are other factors a t work. Thus in the winter half of 1930-31 the values of r , and u for the successive months were :-
(6) U,=avm-, + bVrn-3 + Cvm-,.+ dvm-l+ earn . .
Oct. N O ~ . Dee. Jan. Feb. Mar. rl ‘62 .76 4 6 -78 -60 -86 0- 4’5 9.0 9.1 6.5 6.5 5 7
During the first four months, with rapid and large changes of pressure, r , varied in the same direction as u ; but in March, when the day to day changes were smaller (see Fig. 8), rl was much larger than u wouid suggest. AIso from April t o September rl was 430 in 1931 and -73 in 1932 although in summer the disturbances are smaller and more short-lived than in winter.
REFERENCES Kendall, M. G. 1944 Biometrika, 33, pp. 105-132. Mildner, P. 1931 Beitr. Phys. frei Atmos., 17.
Stumpff, K .
Walker, Sir G. T. Weickmann, L. 1931 Gerland’s Beitr., 34, pp. 244-257. ,
Yule, G. U. 1927 Philos. Trans. A . , 226, pp. 267-298.
Pollak, 1,. W. 1940 Q. J., 66, pp. 419-437. 1938 Ver. d. Ft. Inst. d. Univ., Berlin, 3, pp. 1-40. 1942 Bull. Arner. Met. SOC., 23, pp. 105-110. 1931 Proc. Roy. SOC. A . , 131, pp. 518-532.
SYMMETRY POINTS I N PRESSURE AS AIDS T O FORECASTING 279
DISCL’SSION
Dr. C. E. P. M ~ o O t i s : I am very glad Sir Gilbert Walker has taken up the question of the reality of pressure waves from the standpoint of mathematical analysis. I have long felt that the claims of the Weick- mann school of long-range forecasting by pressure waves and symmetry points are greatly exaggerated, but I personally do not think they are quite so baseless as one would infer from Sir Gilbert’s paper. Some time ago Miss Carruthers and I carried out an experimental investigation into the reality of pressure waves. \lie formed 3-day means of pressure for 20 years for each of seven stations, ranging from Spitsbergen and the A4zores to Vienna, and analysed the mass of nearly 17,000 figures for waves of lengths from 9 to 7j days. The method used was neither harmonic analysis nor auto-correlation, but the simple and rapid “ difIerence-periodograni ” which I devised in 1924 and ivhich was the only way in which the work could have been carried out in a reasonable time. We used a sufficient variety of intervals to obtain a good check of all the waves accepted as real, and I am confident that the results are free from bias. I began the investigation with the opinion that there are no true pressure waves, and that the result would be a heterogeneous mass of fugitive spurious waves of all lengths, with no one length tend- ing to be more frequent than another. What we actually found was something quite different, which convinced me that owing to its structure the atmosphere has a definite tendency to vibrate in certain wave-lengths, as claimed initially by Margules and elaborated by Defant, Lettau and Haurwitz. Pressure waves of all lengths did occur, b u t their frequency had a series of well marked maxima at lengths of 12-13, 18-19, 24, 36, 48 and 72 days. There can be no doubt about the general fact, for the peaks completely dominated the periodogram, though different waves were prominent in different years. But these waves Lvere found to be fugitive, their average duration being only about five or six wave-lengths, while their amplitudes were small on the whole and often changcd suddenly. The shapes of the “waves ” ivere often greatly distorted from sine- curves, and altogether it seems doubtful i f pressure waves would ever be of use for forecasting.
The possible theoretical waves computed by Defant, Lettau and Haurwitz are rather numerous, depending on the assumptions as to the structure of the atmosphere, but the most probable above 10 days seem to be 12, 18-19, 24, 33-38, 48 and 56-58 days. All these except the last are well developed in the periodogram of actual pressure ivnves. If the latter are in fact the natural vibrations of the atmosphere, some :igenry must exist to bring them into operation. .4 harp string emits a definite note, but not until it is plucked. Xlis.; Carruthers and I investicated several possible agents, but Lvithout much success until \ve cnnie to consider variations of radiation from the sun. \Ye annlysed the daily valucs of the solar constant published. by the Smithsoninn Institution for 1023 to 1930 (Anflals 01 the Astro f~hys icn l Observa tory , vol. 6 ) , in cx:ictly the same way as we analysed the prrisure waves. The valurs of the solar constant for individual days are nrlmittedly doubtful, but the errors .ire hardly likely to be systematic, and should not invalidate the rrsults of the periodogram. This gave a sprirs of peaks at I.;, z,; , 3;. 5 1 , 6; and 74 days. These nearly all correspond, peak for peak, ivith those of the periodogram of pressure n.aves, but they are-about threc or four per
280 DISCUSSION
cent longer. It seems possible therefore that the pressure waves were set i n operation by waves of solar radiation, and took up the nearest natural periods of free vibration of the earth’s atmosphere. But since the latter were not quite identical with the solar waves, after about five wave-lengths the two got out of step and the pressure wave broke down. This part of the investigation was briefly described by Miss Carruthers a t a meeting of the Geophysical Section of the Royal .4stronomical Society in 1944.
There are two striking exceptions which, in the old trite phrase, “ prove the rule.” The highest peak in the frequency of solar waves occurs a t 67 days, but there is no corresponding peak in the frequency of pressure waves. But it happens that according to Haurwitz and Lettau there is no natural period of free vibration of the atmosphere near 67 days, and the solar wave meets with no response in the atmosphere. On the other hand, one of the theoretical periods of atmospheric oscilla- tion found by both Haurwitz and Lettau has a length of about 57 days, but there is no corresponding peak in the periodogram either of solar radiation or of pressure waves. In this case we may suppose that the response is waiting in the atmosphere but is never evoked.
Whether or not there is anything in this rather speculative solar hypothesis, there is a t least some reason to believe that pressure waves of certain lengths, which are mostly harmonics of 72 or 144 days, do have a real tendency to occur. But the fact that they are so short-lived and unstable makes them very difficult to examine and isolate. The shorter waves cannot be isolated by harmonic analysis, and even auto- correlation can only evoke them in ghostly form. I t also makes them of little or no use for weather forecasting. In Germany the belief in waves and symmetry points has almost attained the proportions of another Teutonic myth, and I think we owe a debt of gratitude to Sir Gilbert Walker for helping to explode it.
Miss CARRUTHERS: I would have liked to ask Sir Gilbert Walker whether he has found the correlogram useful for determining periodicities in pressure series. I think that even with a continuous oscillation periods would be difficult to isolate. For example, the existence of a ro-day period occurring simultaneously with a zo-day period might be completely masked o w h g to the fact that the zoday period would give rise to a minimum value of vt a t k = r o which would to some extent cancel out the maximum expected from the 1s-day period. When applied to oscillations that are only spasmodic (it is well known that continuous oscillations do not occur in pressure) a further disadvantage appears. The correlogram shows only the mean effect of existing periods, so that an oscillation of fairly large amplitude lasting only a short while might be thrown up in the correlogram as something too small for consideration when significance tests are applied. This defect was mentioned by Sir Gilbert Walker himself with reference to the Schuster periodogram.
Asst. Prof. P. A. SHEPPARD: To me, the most significant aspect of Sir Gilbert’s paper is the statement that the incidence of periodicities and symmetry points in a coherent random series is much the same as in actual pressure series. This being so it is, surely, clear that no purely statistical treatment of pressure series can ever be applied to forecasting pressures wit,h more than a random expectation of success. The only hopeful line of approach to the problem of long-period forecasting is
[References, p. 283.1
SYMMETRY POINTS IN PRESSURE AS AIDS TO FORECASTING 281
therefore the physical, for meteorologists are not yet ready to accept the conclusion that there is no rhyme or reason to the pressure surges and hollows which do in fact occur. (Added later) : The correspondence noted by Sir Gilbert between actual pressure series and coherent random series relates presumably only to pressures in mid-temperate latitudes, with Kew as an example. There would presumably be much to be said for a statistical treatment of pressures (or other suitable variables) at certain stations outside these latitudes, e.g. , a t “ centres of action,” in relation to simultaneous or later pressures within mid-temperate latitudes. Sir Gilbert has, indeed, already given a lead in this direction in his earlier work on world weather. The approach, though empirical, is in essence physical.
Fl/Lt. D. J. SCHOVE: In the elaboration and application of the principles of symmetry-points, the Poles at Lwow went further than the Germans a t Leipzig. In the interesting communications of their Geophysical Institute (some of these were favourably reviewed by Sir Gilbert in the Q.J. 61, pp. 449-450, 1935) they extended the technique to annual and even secular pressure curves. If their analysis of trends is legitimate it should be possible to predict climatic variations. As an example, when we plot p y e a r moving means of Scottish and Azores pressures since 1871 we have what appears to be the first half of a sine wave (amplitude just over I mb. and length about 75 years); the Scottish curve falls and the Azores curve rises, and together they account for the rise in “ circulation.” If we had any reason to believe that these cwnes would continue to be of “ sine ” rather than, say, “ hysteresis ” form, we could predict the return of old-fashioned winters by the 1950’s.
Whilst I suspect that the apparent symmetry-points’ in trend curves arise from the slight correlation between successive departures from the mean, i t would be interesting to hear of post-war work from Poland and the views of Sir Gilbert on the methods of analysis involved.
Mr. ROBERT ASHTON (communicated): I t is of interest to hear that work is being done on the possibility of long-range forecasting. I have no doubt in my own mind that it is possible to predict particular elements of weather for some considerable time ahead by the use of some form of harmonic analysis.
T h e lecture in no way alters my opinion but it does emphasize the inadequacy of the existing observations for forecasting purposes. I suggest that any surface element is very largely affected by what may be called a ‘‘ shallow air constituent ” which can completely mask any harmonic behaviour and in consequence any periodicity is difficult to determine.
In order to obtain some degree of success it is essential that observa- tions are made a t regular times a t various levels and I feel that the present situation of a few upper air observations per day spread over a very large area is completely inadequate; I can see no possibility of much progress in any form of forecasting until upper air observations are as frequent as those made a t the surface.
Mr. L. H. G. DINES: Sir Gilbert Walker’s paper greatly appeals to me. The search for empirical periodicities and kindred methods of analysis of physical data is a very old pastime and crops up again and again. It is worth remembering that about 45 years ago my father,
282 DISCUSSION
the late W. H. Dines, read a paper before the Royal Meteorological Society in which he discussed this same problem and came to just the same sort of conclusion as Sir Gilbert Walker has done.
Professor D. BRUNT, in reply : I was much interested in Dr. Brooks’s description of the work he had done in investigating periodicities of relatively few days in regard to pressure. I view with suspicion, however, his suggestion that these oscillations are set in motion by variations of solar radiation having the same period. The published figures for solar radiation are made up of two components: firstly, the observed radiation a t the earth’s surface, and secondly, a meteorological correction for the loss of radiation on the way through the atmosphere. The published figures are therefore in part meteorological and are not completely straight-forward estimations from observed quantities. Before I would accept Dr. Brooks’s suggestions I should want to satisfy myself that the periodicities were not in the corrections rather than in the actual solar observations. I t should be noted that none of these periodicities referred to show up in the correlogram which the author has shown in Fig. 3, although we should expect that some of them should be clearly defined if such periods were present and were of any importance in regard to the changes of pressure taking place during the winter. I conclude that from the point of view of weather forecasting these s*called pressure waves have no value. I am uncertain whether one ought even to use the word “ waves” to describe the variations which occur.
With regard to the question raised by Mr. Schove, I have never investigated the Polish work on symmetry of five and ten year means.
Finally, I should like to make a few remarks on matters that have not been raised directly in Sir Gilbert Walker’s paper. Firstly, in the event of an apparent symmetry beginning to show itself, it is clear that the forecaster wishing to use a symmetry point is faced with the delicate problem a t what stage he will accept the existence of symmetry as established, and then proceed to use it in order to forecast pressure. If he does this too soon he may find that the expected symmetry does not materialise, whereas if he leaves it too late he is liable to find that the symmetry has entirely disappeared before he has made use of it. The only way that has been suggested for forecasting the appearance of symmetry points before they come is by making a Fourier analysis of the observed pressures over some period such as 72 days and combining the periods thus obtained in order to make a forecast in the future to the extent of determining when, if a t all, the important terms wilt come into exactly the same phase. The date of this occurrence would be the central point of the symmetry. This reduces forecasting by symmetry points to a lazy form of forecasting by Fourier analysis, and anyone who has tried to use Fourier analysis over a short period for forecasting future weather will realise that this is not a practicable method.
Sir GILBERT WALKER (who n.as unable to be present a t the meeting) has since added: I would like to thank Professor Brunt very heartily for reading my paper and for his effective handling of the discussion. I think it likely that after long ages of belief in the control of our affairs by the heavenly bodies men are born with instinctive faith in the exist- ence of periods in weather. I lost mine when the imperative need ot reliability in seasonal forecasts drove me to replace instinct by valid
SYMMETRY POINTS I N PRESSURE AS AIDS TO FORECASTING 283
quantitative criteria applied to the results given by standard methods. In reply to the questions put to me :-
To Miss N. C A R R U T H E R S : In a correlogram waves of appreciable magnitude in general stand out clearly with maxima and minima a t appropriate distances ; their amplitudes are proportional to the squares of those in the original series. If further information is needed the correlogram itself may be analysed, either harmonically or by subjecting it to a further correlogram analysis; the latter occurs in the Fuhrich method after removing the biggest oscillation : but i t is not clear that the outcome is worth the labour (see L. W. Pollak and F. Kaiser " Ueber die numerische Methode von J . Fuhrich ", Statisticky Obzor 16, 1-54,
I regard the correlogram as the standard method for detecting oscilla- tions which may die out and appear again in a different phase. In my view i t is a wasteful expenditure of time to discuss periods unless quantitative tests of reality are applied, and it is a disadvantage of the correlogram that the amplitude to be expected from random disturbances is as yet given not by theory but by experiment.
To Asst. Prof. P. A. SHEPPARD : If " long-period " forecasting covers one or two weeks I agree that the only hope appears to lie in a physical rather than in a numerical approach. But for a forecast in general terms of conditions two or three months ahead over a wide region the methods of World Weather with resulting correlation coefficients of .6 or over seem to hold out some promise. My recollection is that in India there were daily pressure changes in 24 hours over the whole area, sometimes as big as a tenth of an inch, which scarcely affected the position of areas of relatively high and low pressure and seemed to have a negligible influence on rainfal!. The extent and the relations of these widespread pressure changes seem worthy of investigatiw At present it is doubtful whether daily pressures in the tropics are r1m-e helpful for forecasting a week ahead than are those of temperate latitudes.
To Fl./Lt. D. J. SCHOVE: With reference to the work of Arctowski and his Polish collaborators it would be unsatisfactory to express any opinion except after a description and a discussion of their methods. For that the present occasion appears inappropriate.
REFERENCES
Prag, '935).
Brooks, C. E. P. 1924 Proc. Roy. SOC., A., 105, pp. 346-359. Carruthers, N. 1945 Nature, 155, pp. 225-226.