Embed Size (px)
Citation preview
On QoE Impact of DoH and DoT in Africa: Why aUser’s DNS choice matters
Enock Samuel Mbewe and Josiah Chavula
University of Cape Town, Cape Town, WC 7701, RSA{embewe,jchavula}@cs.uct.ac.za
Abstract. Internet security and Quality of Experience (QoE) are two antagonistic con-cepts that the research community has been attempting to reconcile. Internet securityhas of late received attention due to users’ online privacy and security concerns. Oneexample is the introduction of encrypted Domain Name System (DNS) protocols. Theseprotocols, combined with suboptimal routing paths and offshore hosting, have the po-tential to negatively impact the quality of web browsing experience for users in Africa.This is particularly the case in edge access networks that are far away from essential in-frastructures such as DNS and content servers. In this paper, we analyse the QoE impactof using open public DoH and DoT resolvers when resolving websites that are hosted inAfrica versus those hosted offshore. The study further compares the performance of DoTand DoH under different network conditions (mobile, community network, Eduroam andCampus wired network). Our results show that high latency and circuitous DNS resolu-tion paths amplify the performance impact of secure DNS protocols on DNS resolutiontime and page load time. The study further shows that users’ DNS resolver preferenceshugely determine the level of QoE. This study proposes wider adoption of TransportLayer Security version 1.3 (TLSv1.3) to leverage its latency-reduction features such asfalse start and Zero or One Round Trip Time (0/1-RTT). The study further proposesthe localisation of content and secure DNS infrastructure. This, coupled with peeringand cache sharing recommended by other works, will further minimise the impact ofsecure DNS protocols on Quality of Experience.
Keywords: Networks· Network performance · Internet security · DNS privacy, QoE
1 Introduction
Domain Name System (DNS)[1] is one of the fundamental components of the Internet whichmaps the human-readable names to their respective IP addresses of Internet resources. Formost of the Internet’s history, these services have been delivered in plaintext providing a fertileground for attackers to exploit this vulnerability and compromise Internet users’ security andprivacy online. Some governments, Internet Service Providers and other players exploited thisvulnerability by using DNS for pervasive monitoring, Internet censorship, content control andother attacks as reported in RFC 7258 [2]. As a result, various efforts have been developed toencrypt the DNS queries. These efforts have resulted in the development of different protocolssuch as DNS over TLS (DoT) [3], DNS over DTLS, DNS over QUIC, DNS over HTTPS(DoH)[4] and DNSCrypt [5]. Although these protocols are relatively new, there has beenincreased adoption of some by service providers, OS vendors and software vendors. Lu etal. [6] collectively call these DNS encryption protocols DNS over Encryption (DoE) the termwe use in this paper. Amongst these protocols, DoT and DoH are two standardised which aregaining grounds in the industry and research communities. Our study, therefore, focuses onthese two protocols as measured from Internet user’s networks and devices.
2 E.S. Mbewe & J. Chavula
Much as these are desirable developments that provide essential security goals, Internetusers should be willing to bear the extra QoE costs that come with security [7, 8, 9]. Generally,DNS-over-Encryption can incur performance overhead for DNS clients due to an extra delayTLS session setup and encryption [6]. Measuring the real impact of DoE would help the usersmake a rational decision and correctly estimate their QoE expectations. The Internet researchcommunity has tried to measure the impact of DoE on DNS resolution and page load time.However, none of the measurement studies has focused on edge access networks commonlyfound in developing regions such as Africa. Therefore, the findings from these studies cannotbe generalised.
This paper presents the results of Internet security measurements study taken from dif-ferent edge networks in Africa. We specifically aimed to find out the extent to which DoEcoupled with latency and offshore content hosting would impact overall Quality of Experience.To ably achieve this aim, we carried out measurements from end-user networks in seven (7)African countries: Madagascar, Malawi, Nigeria, Kenya, Uganda, South Africa and Zambia.We measured the impact of DoE provided by the open DNS recursive resolvers on DNS res-olution time (DRT) and page load time (PLT). To correctly estimate the impact of DoE, wemeasure the cost of resolving with regular plaintext DNS (hereafter referred to as Do53) fromboth the user network, which we call local Do53 and remote Do53 measured from each of theopen public DNS recursors. The following is a summary of our major findings:
i. We find that unencrypted DNS transport is by far faster than the encrypted DNS transportin high-delay, lossy edge networks.
ii. We find that network conditions, user’s DNS resolver choice, webserver and DNS resolvergeolocation hugely determine the QoE (DNS response times, page load times and successand failure rates of Secure DNS resolution).
iii. Comparably, we find that providers having their caches in Africa have a higher probabil-ity of successfully resolving names than distant recursors. Therefore, we motivate for theimplementation of local DoE infrastructure by the Internet Service Providers (ISPs) to fur-ther reduce the DNS response time and page load time hence improving QoE for Internetusers
2 Background
Unreliable, slow, insecure, expensive or non-existent Internet access remains a big problem forbillions of people in the developing world where the physical infrastructure is still underde-veloped. Bandwidth is generally an expensive resource for developing regions with low userdensities [10]. Despite the recent development of the internet infrastructure in these regions,Quality of Experience for users is often impacted by high latencies resulting from circuitousname resolution as observed by Formoso et al. [11]. Recent studies [12, 13] report that Africancontent is normally hosted in North America despite the availability of some Content DeliveryNetworks in the region. This may be attributed to the cost of hosting and unreliability ofpower in most of the underdeveloped countries. Apart from bandwidth, latency is caused by anumber of factors including lossy links and lack of peering between the networks, preventingthe sharing of CDN servers, as well as poorly configured DNS resolvers [14]. Besides theseworks, this study has especially been inspired by the study conducted by Calandro et al. [13].The authors surveyed the type of content commonly produced and consumed in Africa. Theyfurther conducted active latency and traceroute measurements to locate webservers hostingthe African content. They found that most of the content is hosted outside the countries own-ing such content and most often, offshore. In this study, we measure how these observationscombined secure DNS resolution would impact DNS response time and page load time.

On QoE Impact of DoH and DoT in Africa: Why a User’s DNS choice matters 3
Given the recency of DoT and DoH, the research community is yet to establish the realperformance cost of these protocols. At the writing of this paper, we know of very few mea-surement studies on the performance cost of DoT and DoH. An early preliminary study byMozilla 1 found that DoH lookups are only marginally slower (6 ms) than conventional, unen-crypted DNS over port 53 (Do53). Bottger et al. [15] studied the DoH ecosystem to understandthe cost of the additional DNS security. Their findings indicate that the impact is marginaland does not heavily impact the page load times. In their works, Hounsel, et al. ([16] and[17]), compared the cost of DoT and DoH measured from campus network and Amazon ec2instances. Their results show that although the resolution times of Do53 is better than thatof DoT and DoH, both protocols can perform better than Do53 in terms of page load times.Lu et al. [6] conducted end-to-end DNS-over-Encryption measurements and found that thatgenerally the service quality of DNS-over-Encryption is satisfying, in terms of accessibility andlatency and that the added latency is worth it. DoH, in particular, is attracting the atten-tion of the research community due to its current centralised implementation. Some fear toentrust valuable browsing information to a few providers. As such, some works are focusingon de-centralising DoH so that no single provider has all the browsing information. Hoang etal. [18] propose K-resolver to slice user information to different decentralised DoH resolvers.This, however, suffers from increased latency when the servers are geographically separated.A similar study is conducted by Hounsel et al.[19] which proposes a distributed DoH serverarchitecture called M-DNS.
In this paper, we measure and compare DNS response and page load times to websiteshosted within Africa versus websites hosted in America and Europe respectively. We conductmeasurements from edge network (3G/4G mobile networks, community wireless network andhome broadband) vantage points in Africa. We perform these measurements against open pub-lic DNS recursive resolvers such as Google, Cloudflare, Quad9, CleanBrowsing and AdGuard.We also measure latency to each of the recursors and websites to provide a context for ourfindings.
3 Methodology
In this section, we describe the metrics used and how we measure these metrics using ourexperiment setup.
3.1 Metrics
This study aimed to understand how Do53, DoT and DoH impact browsing Quality of Ex-perience (QoE). The study considered network-level and browser-level metrics. These metricsare latency, DNS response time (in this paper referred to as DRT), DNS success and failurerates and page load time (PLT).
Latency Several studies have pointed out that African networks suffer higher latencies. Re-cent studies [11, 13, 14] have attributed these latencies to suboptimal routing, lack of peeringand cache sharing. Other studies have attributed these latencies to offshore hosting and mis-configuration of DNS. However, none of these works has looked at the impact of latency onsecurity protocols in the region. Latency determines the kind of applications that can run onaffected networks. For example, VoIP and video conferencing may allow latency of not more
1 See https://blog.nightly.mozilla.org/2018/08/28/firefox-nightly-secure-dns-experimental-results
4 E.S. Mbewe & J. Chavula
than 400ms and online gaming, not more than 200ms. Therefore, it is important to understandthe extent to which the secure DNS protocols add on to the already high latency in order toinform Internet users of what applications may run on a given network condition. Also, it isimportant to show which public DNS providers respond with reasonable latency as this wouldaid users in the choice of DNS recursive resolvers. We also perform latency measurements toresolvers and websites in order to explain the source of delays in our results. We conduct pingmeasurements to each of the recursors and domains using different DNS configurations. Wethen calculate the median RTT for each latency measurement.
DNS Resolution Time DNS query response time is one of the major factors that affect thespeed of page rendering in the browser. A web page normally contains several objects fetchedfrom different servers. In this study, we measured DNS resolution time firstly for the mainpage, and thereafter, for each domain, we collected all the unique domains for components(i.e. images, JavaScript, CSS etc) and measured their respective DNS Response time. We usegetdns and libcurl C libraries to issue Do53, DoT, and DoH queries. Getdns provides an APIthat allows developers to perform DNS Do53 and DoT requests using different programminglanguages. Libcurl supports POST requests to be sent via HTTPS. This capability enables usto measure DoH DNS response time. We could have gotten the DNS response times from thecollected HARs, however, we noted that some of the timings were not correct and decided touse the getdns. It is important to note that the DNS responses were not cached by the browserused in the measurements to make sure that the subsequent transaction is not affected by thecache.
DNS-related failure rates Failures within DNS can have a dramatic impact on the widerInternet, most notably preventing access to any services dependent on domain names (e.g. web,mobile apps) [20]. Recent studies on Do53, DoT and DoH have found that encrypted queriestend to fail more than the regular DNS. Hounsel et al [16] found that in lossier conditions, suchas 3G, DoH experiences higher failure rates compared to Do53. This work seeks to establishDNS failure rates from real 3G and 4G conditions. We argue that understanding the prevalenceof errors resulting from a particular DNS protocol is essential in informing the users’ choice ofDNS protocols given their network conditions.
Page Load Time Page load time is an important metric of browser-based QoE. It representsthe amount of time a user has to wait before the page is loaded in a browser. In this study,Firefox was used in headless mode to visit a set of HTTPS-enabled websites. For each website,we collect HAR files in JSON format containing timing information, including blocking infor-mation, proxy negotiation, DNS lookup, TCP handshake, SSL, Requests, Waiting and Contentdownload. From the HAR files, we record the onLoad timing - the time taken to completelyload the page together with its components.
3.2 Experiment setup
We begin by describing how we collected the dataset that we analyse in this study. The studyuses Alexa top 50 global websites for African countries 2 and top 50 Alexa local websites 3
for each African country (hosted locally or operated by local entities). The local websites were
2 https://www.alexa.com/topsites/countries3 https://www.alexa.com/topsites/category/Top/Regional/Africa
On QoE Impact of DoH and DoT in Africa: Why a User’s DNS choice matters 5
particularly included to represent the websites serving African content and observe how DoTand DoH impact the browsing QoE on the local websites. These websites are normally notheavily cached in different public DNS recursive resolvers. We managed to get 2294 uniquewebsites altogether. We then used pshtt modules of domain-scanner 4 application to find thewebsites that were online and responsive on port 443. This process gave us 1583 websites.
We then used MaxMind to geolocate 1206 websites. Of the 1206 websites, we found that55.7% of the websites are hosted in North America, 27.6% in Europe, 14.4% in Africa, 1.7% inAsia, 0, 5% in Oceania and 0.1% in South America. We then selected the first three continentswhich served the most websites in our dataset. We randomly selected an equal number (173)of websites from America and Europe datasets. The 173 value came from the lowest number ofwebsites in the selected continents, which is Africa in our case. This gave us 519 websites whichwe use in this study. We did this to have a common denominator for on which to base ourresults and discussion. For each of these continents, we looked at the common TLS protocolsnegotiated. We found that America had the highest number of websites that negotiated TLS1.3(84%) and the remaining 16% negotiated TLS1.2. Africa had 84% TLS1.2, 15% TLS1.3 and1% TLS1.0 while Europe had 87% TLS1.2, 12% TLS1.3 and 1% TLS1.0.
To replicate web browser actions when a user visits a website, we follow a methodologyused in a study by Hounsel et al. [16]. We use automated Firefox 67.0.1 to randomly visitthe websites in our list in headless mode. This is a clean instance without any ad or pop-up blockers. We, however, install a plugin to export HTTP Archive objects (HARs) fromeach visited website. We store these HARs in a PostgreSQL database as JSON objects. Thestudy also aimed at measuring how the selection of DNS recursive resolver and DNS transportaffect browser performance which, in turn, affects user’s QoE. As such, we use 5 DNS recursiveresolvers each offering Do53, DoH and DoT. Additionally, we used default Do53 at each vantagepoint. It is important to note that the default resolvers only support Do53 and this serves asa baseline for the performance over Do53. Table 1 lists resolvers used in this study. Of the fiveresolvers, three (Google, Cloudflare and Quad9) negotiated TLS1.3 while CleanBrowsing andAdGuard negotiate TLS1.2
Firefox web browser natively supports Do53 and DoH. On the other hand, DoT has tobe configured on the user’s machine outside of the browser. As such, we use Stubby for DoTresolution, a stub resolver based on the getdns library. Stubby listens on a loopback address andresponds to Do53 queries. All DNS queries received by Stubby are then sent out to a configuredrecursor over DoT. We modify /etc/resolv.conf on our measurement systems to point to theloopback address served by Stubby. This forces all DNS queries initiated by Firefox to be sentover DoT.
Between the measurements, we were not able to control the caches of the recursive resolvers.We, therefore, randomised the order of arguments that were presented to the browser in theform of a tuple comprising websites, DNS recursive resolvers and DNS protocols. This wasdone to avoid biasing results due to network quiet and busy times, as well as the potentialeffect of a query warming the recursor’s cache for subsequent queries from the other protocolstested.
This measurements study was done from February 2020 to 21 May 2020. The measurementswere done from 14 vantage points located in 7 countries; Malawi, Madagascar, South Africa,Kenya, Zambia, Nigeria and Uganda. This study aimed at measuring the impact of DoT andDoH on user’s Quality of Experience hence the measurements were conducted at networkedges. As such we used our contacts from 5 of these seven countries. These countries are (withtheir respective networks we measured from enclosed in brackets after the country name):
4 https://github.com/18F/domain-scan
6 E.S. Mbewe & J. Chavula
Configuration Do53/DoT address DoH URI Marker
Local Default Do53 None LocalCloudflare 1.1.1.1 https://cloudflare-dns.com/dns-query CFGoogle 8.8.8.8 https://dns.google/dns-query GGQuad9 9.9.9.9 https://dns.quad9.net/dns-query Q9CleanBrowsing 185.228.168.168 https://doh.cleanbrowsing.org/doh/security-filter CBAdGuard 176.103.130.131 https://dns.adguard.com/dns-query AG
Table 1: Compared DNS Resolvers
Madagascar (Widecom), Zambia (MTN, Liquid telecoms), Uganda (Airtel, Orange), Kenya(Airtel) and Nigeria (MTN). The researchers had access to two countries; Malawi (TNM,Airtel, wired Campus network) and South Africa (Vodacom, Eduroam, Campus wired network,Community network). The participants were compensated with extra Internet data bundles.
At each vantage point, we conducted two sessions of measurements; one under 4G and an-other under 3G. Measurements were also conducted on a wireless community network and twoUniversity campus networks (Wired and Eduroam) in South Africa. The community networksare becoming more prevalent in the region as a low-cost Internet access network managedand operated by communities to meet their communication needs [21]. The campus networksrepresent the well connected, higher resourced networks which we use to benchmark our results.
We ran the measurements on computers running Ubuntu 18.04 desktop version. We pack-aged the Firefox browser in a docker container for portability. The tools ran on i5 computeswith 8GB of RAM except for one PC which had 16GB RAM.
4 Results
In this section, we present findings from the measurements conducted. We start with anoverview of the data collected from all vantage points, and thereafter, we highlight vantagepoints and protocols that show peculiar results. We focus the discussion on comparing theperformance of different DNS configuration from 4G networks. The evaluation is also basedon the continent in which the websites are hosted. We then benchmark these findings againstmeasurements from university campus networks, representing the high-end networks. It is im-portant to note that in the dataset we have timings longer than four seconds. However, usingboxplots we can identify the distribution of the data and comfortably cut off outliers. As canbe seen from the results in this section we place a cut-off point at 2000 ms for latency andDNS response time. We further use the median difference for page load time.
4.1 Transport delay
Following our findings in terms of DNS response time and page load time, we deep-dived intoother determinants of Internet performance, such as latency and DNS resolution paths. To dothis, we conducted ICMP ping measurements and traceroute measurements.
Latency measurements: Each time we performed a page load test, we performed ICMP fiveping tests to each resolver. We observe that Quad9, Local, Cloudflare, Google, Cleanbrowsing,and Adguard have median round trip times (RTTs) of 229.4 ms, 328.8 ms, 333.8 ms, 381ms, 443.4 ms and 1296 ms respectively. On the median case, we see that Quad9 has lower
On QoE Impact of DoH and DoT in Africa: Why a User’s DNS choice matters 7
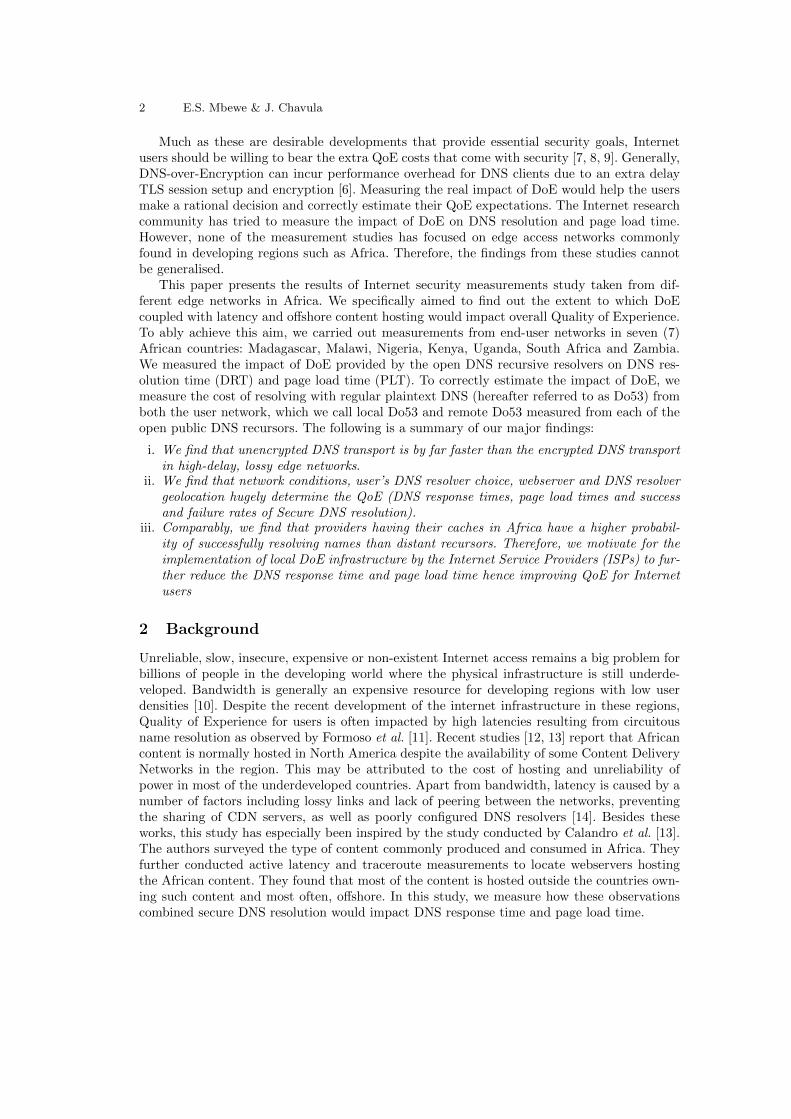
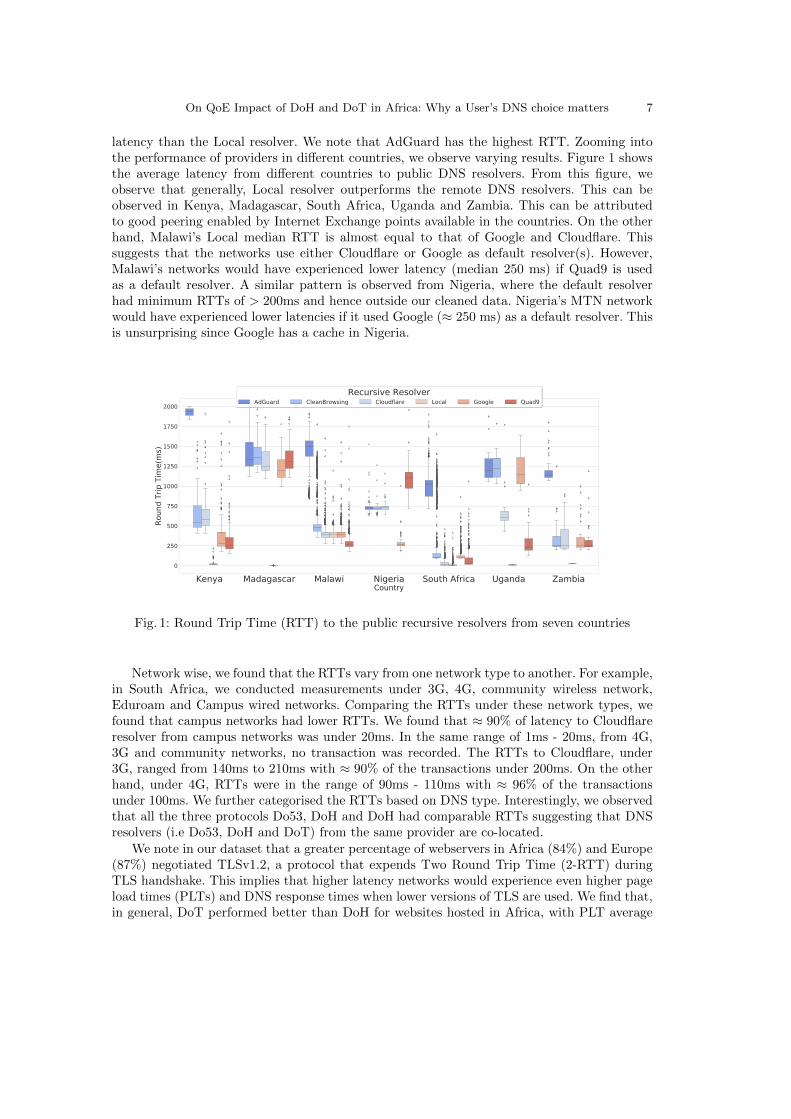
latency than the Local resolver. We note that AdGuard has the highest RTT. Zooming intothe performance of providers in different countries, we observe varying results. Figure 1 showsthe average latency from different countries to public DNS resolvers. From this figure, weobserve that generally, Local resolver outperforms the remote DNS resolvers. This can beobserved in Kenya, Madagascar, South Africa, Uganda and Zambia. This can be attributedto good peering enabled by Internet Exchange points available in the countries. On the otherhand, Malawi’s Local median RTT is almost equal to that of Google and Cloudflare. Thissuggests that the networks use either Cloudflare or Google as default resolver(s). However,Malawi’s networks would have experienced lower latency (median 250 ms) if Quad9 is usedas a default resolver. A similar pattern is observed from Nigeria, where the default resolverhad minimum RTTs of > 200ms and hence outside our cleaned data. Nigeria’s MTN networkwould have experienced lower latencies if it used Google (≈ 250 ms) as a default resolver. Thisis unsurprising since Google has a cache in Nigeria.
Kenya Madagascar Malawi Nigeria South Africa Uganda ZambiaCountry
0
250
500
750
1000
1250
1500
1750
2000
Roun
d Tr
ip T
ime(
ms)
Recursive ResolverAdGuard CleanBrowsing Cloudflare Local Google Quad9
Fig. 1: Round Trip Time (RTT) to the public recursive resolvers from seven countries
Network wise, we found that the RTTs vary from one network type to another. For example,in South Africa, we conducted measurements under 3G, 4G, community wireless network,Eduroam and Campus wired networks. Comparing the RTTs under these network types, wefound that campus networks had lower RTTs. We found that ≈ 90% of latency to Cloudflareresolver from campus networks was under 20ms. In the same range of 1ms - 20ms, from 4G,3G and community networks, no transaction was recorded. The RTTs to Cloudflare, under3G, ranged from 140ms to 210ms with ≈ 90% of the transactions under 200ms. On the otherhand, under 4G, RTTs were in the range of 90ms - 110ms with ≈ 96% of the transactionsunder 100ms. We further categorised the RTTs based on DNS type. Interestingly, we observedthat all the three protocols Do53, DoH and DoH had comparable RTTs suggesting that DNSresolvers (i.e Do53, DoH and DoT) from the same provider are co-located.
We note in our dataset that a greater percentage of webservers in Africa (84%) and Europe(87%) negotiated TLSv1.2, a protocol that expends Two Round Trip Time (2-RTT) duringTLS handshake. This implies that higher latency networks would experience even higher pageload times (PLTs) and DNS response times when lower versions of TLS are used. We find that,in general, DoT performed better than DoH for websites hosted in Africa, with PLT average
8 E.S. Mbewe & J. Chavula
difference of 650 ms, even though 84% of such websites used TLSv1.2. We expect that QoEfor websites hosted Africa and Europe would improve if webservers in these regions negotiatedTLSv1.3, which uses 0/1-RTT when performing TLS handshake.
Traceroute measurements: To understand the reason behind higher latencies to resolversform some countries, we conducted traceroute measurements to geolocate the DNS recursors.We performed traceroute to each of the resolvers in our measurement tool. The findings showthat the paths to some resolvers are longer than others. For example, looking at the previoushost before the final destination, we notice that for DNS providers have their presence inSouth Africa. However, the paths taken from various countries to South Africa differ, evenbetween two ISPs from the same country. For example, from a vantage point in Malawi, Airtelnetwork had lower RTTs than Telkom Networks Malawi (TNM). To understand the reasonbehind these varying RTTs in these networks, we conducted traceroute measurements fromour vantage points to the DNS resolvers. We notice that all the paths to the resolvers passthrough South Africa; however, the traceroute measurements revealed that these networks usedifferent network paths to the same destination. For example, Cloudflare resolver (1.1.1.1) isone hop (ASN) away from Airtel subscribers compared to three hops (ASNs) under TNM.
4.2 Pageload success and failure rates
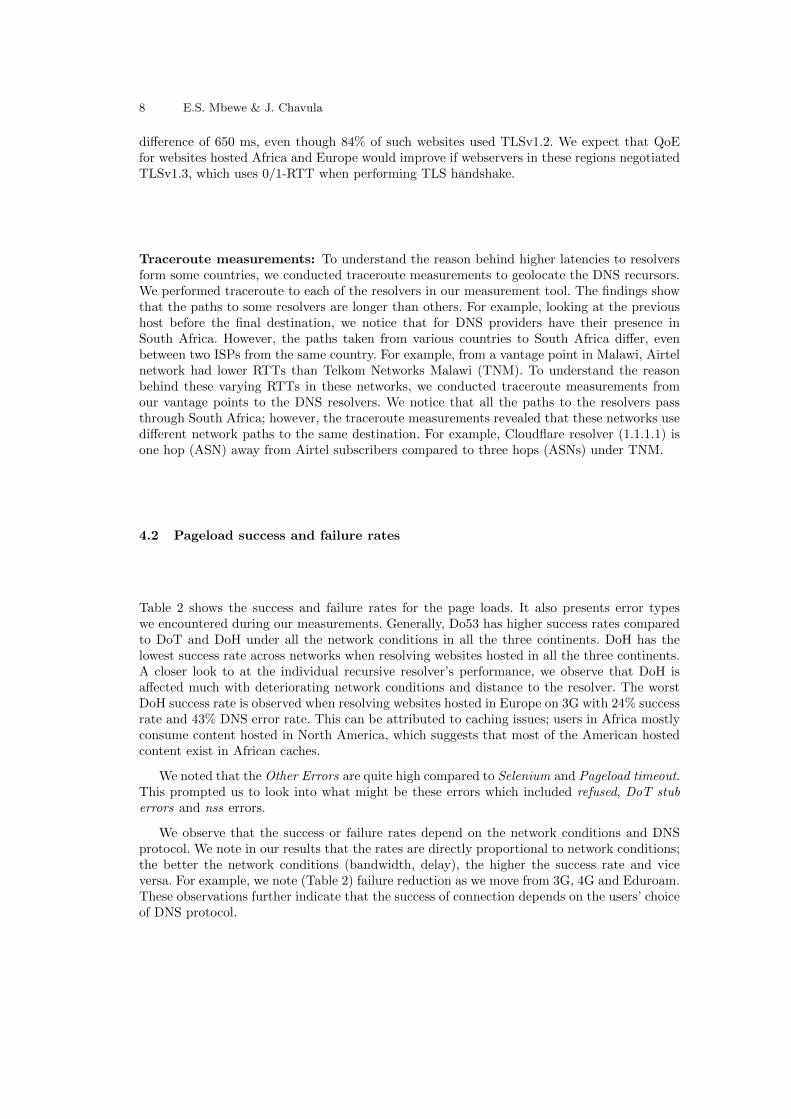
Table 2 shows the success and failure rates for the page loads. It also presents error typeswe encountered during our measurements. Generally, Do53 has higher success rates comparedto DoT and DoH under all the network conditions in all the three continents. DoH has thelowest success rate across networks when resolving websites hosted in all the three continents.A closer look to at the individual recursive resolver’s performance, we observe that DoH isaffected much with deteriorating network conditions and distance to the resolver. The worstDoH success rate is observed when resolving websites hosted in Europe on 3G with 24% successrate and 43% DNS error rate. This can be attributed to caching issues; users in Africa mostlyconsume content hosted in North America, which suggests that most of the American hostedcontent exist in African caches.
We noted that the Other Errors are quite high compared to Selenium and Pageload timeout.This prompted us to look into what might be these errors which included refused, DoT stuberrors and nss errors.
We observe that the success or failure rates depend on the network conditions and DNSprotocol. We note in our results that the rates are directly proportional to network conditions;the better the network conditions (bandwidth, delay), the higher the success rate and viceversa. For example, we note (Table 2) failure reduction as we move from 3G, 4G and Eduroam.These observations further indicate that the success of connection depends on the users’ choiceof DNS protocol.
On QoE Impact of DoH and DoT in Africa: Why a User’s DNS choice matters 9
Continent Network ProtocolSuccessful
(%)DNSError (%)
PageloadError (%)
SeleniumError (%)
OtherErrors (%)
Africa
3Gdns 61.33 11 0 10.33 17.33doh 47.88 35.45 0 4.55 12.12dot 58.63 12.2 0 11.61 17.56
4Gdns 79.37 2.73 1.02 1.26 15.63doh 61.14 23.63 0.7 1.17 13.37dot 79.52 2.64 1.14 1.39 15.31
Eduroamdns 85.98 2.49 1.85 2.12 7.56doh 65.06 24.9 1.08 2.16 6.8dot 77.3 11.93 1.41 2.32 7.04
Europe
3Gdns 54.7 4.27 0 14.53 26.5doh 24.62 43.85 0 18.46 13.08dot 55.3 5.3 0 15.15 24.24
4Gdns 77.78 2.61 1.63 0.79 17.18doh 62.14 19.5 1.43 0.76 16.18dot 76.72 2.86 1.76 1.3 17.35
Eduroamdns 86.29 2.8 0.8 1 9.11doh 72.16 20.54 0.63 1.17 5.5dot 80.02 12.06 0.72 0.81 6.39
North America
3Gdns 64.22 7.33 0.43 17.67 10.34doh 49.22 31.01 0 12.4 7.36dot 60.38 8.46 1.15 17.69 12.31
4Gdns 84.09 0.91 0.37 1.42 13.21doh 67.78 17.57 0.29 1.28 13.09dot 82.43 0.86 0.58 1.32 14.81
Eduroamdns 88.67 2.42 0.11 0.99 7.81doh 73.66 20.5 0.1 0.89 4.85dot 82.28 10.89 0 0.89 5.94
Table 2: Success and Error rate for Do53, DoT and DoH to websites hosted in Africa, Europeand North America respectively under 3G, 4G and Eduroam networks.
4.3 DNS resolution delay
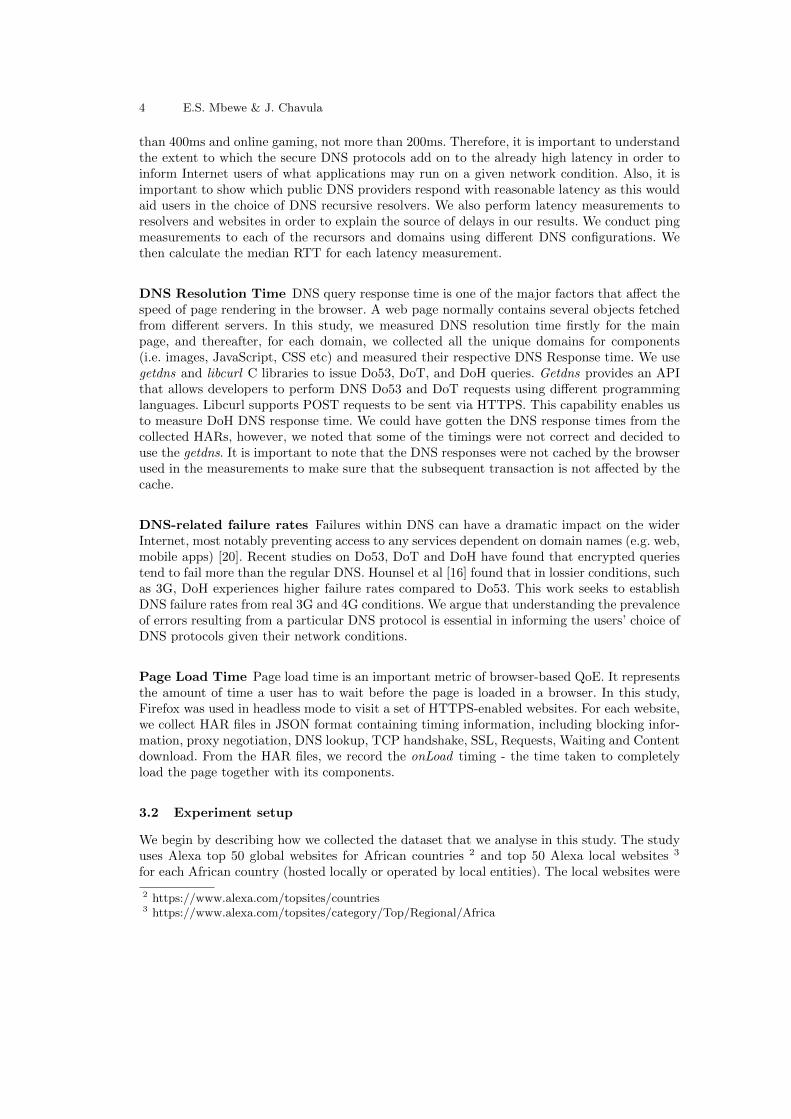
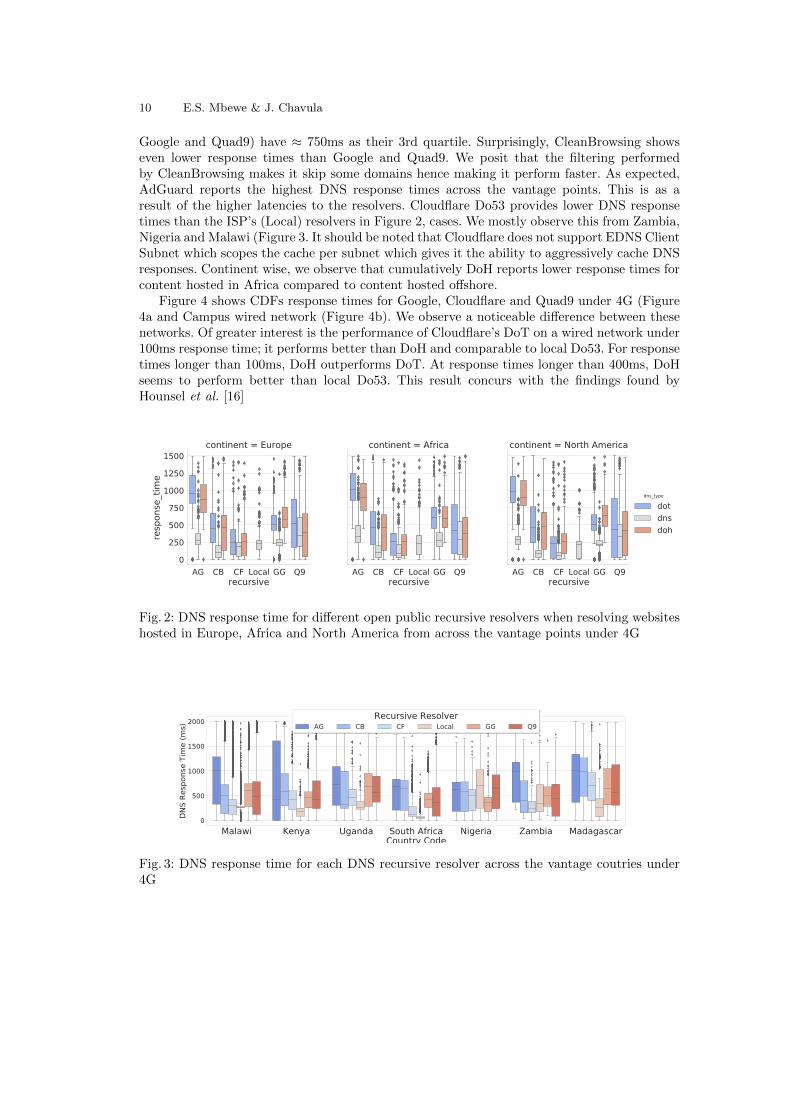
Overall, as expected, we find that Do53 has a lower DNS resolution time (DRT) compared toDoT and DoH across all the resolvers. It should be noted that we have two kinds of Do53;local and remote (provided by the open public resolvers). Figure 2 shows a category plot forDNS response times for different recursive resolvers grouped by continent and DNS protocol.This implies that users have to bear some substantial cost to benefit from DNS security. Thedifference between DoE and Do53 on the same DNS provider is substantially wide. We notefrom the latency results that DoE and Do53 from the same DNS provider were colocated exceptAdGuard which showed a median RTT difference of ≈ 200ms. This RTT difference translatesto a median response time difference of ≈ 750ms between AdGuard’s DoE and Do53 as shownin Figure 2. We observe a marginal difference between DoE from the same DNS provider withDoH having lower response times than DoT except for Google which displays the oppositewhen resolving domains hosted in Europe and North America. However, Google’s DoE seemsto perform uniformly when resolving sites hosted in Africa. We further observe that Quad9’sDoT has way higher than its DoH despite having comparable median.
Much larger differences can be seen when we compare DNS providers against each other.From Figure 2, we note that four of the five public resolvers (CleanBrowsing, Cloudflare,
10 E.S. Mbewe & J. Chavula
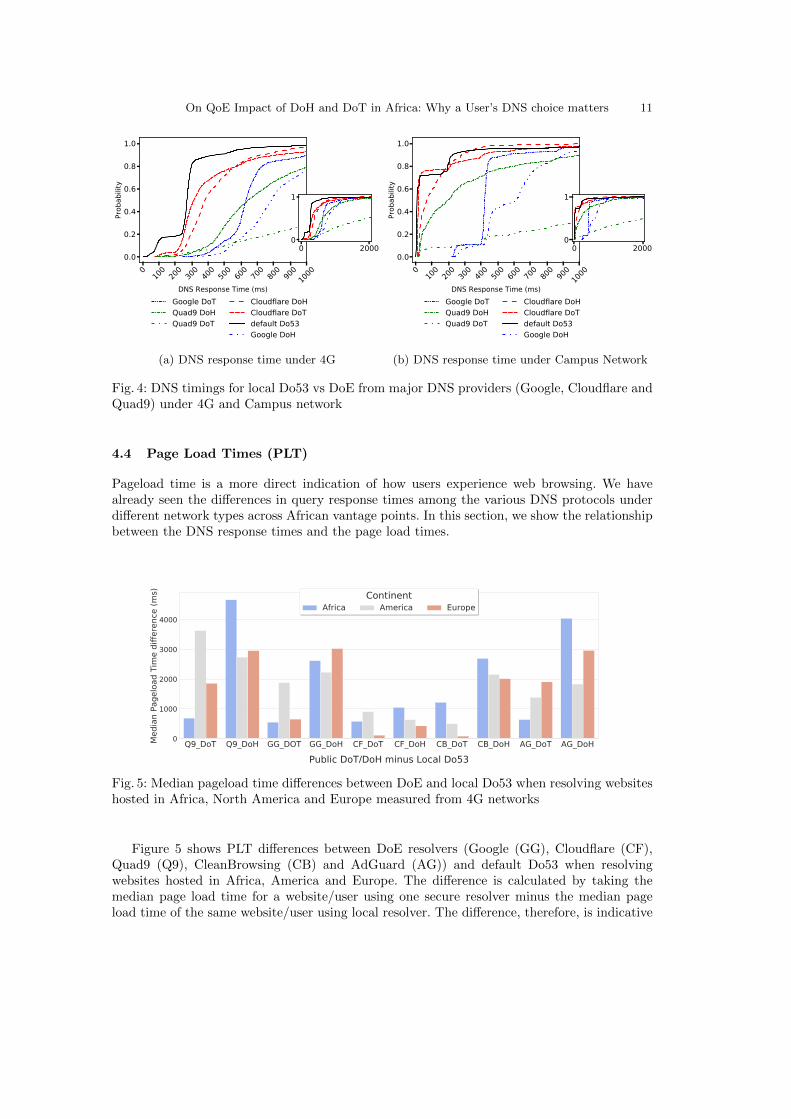
Google and Quad9) have ≈ 750ms as their 3rd quartile. Surprisingly, CleanBrowsing showseven lower response times than Google and Quad9. We posit that the filtering performedby CleanBrowsing makes it skip some domains hence making it perform faster. As expected,AdGuard reports the highest DNS response times across the vantage points. This is as aresult of the higher latencies to the resolvers. Cloudflare Do53 provides lower DNS responsetimes than the ISP’s (Local) resolvers in Figure 2, cases. We mostly observe this from Zambia,Nigeria and Malawi (Figure 3. It should be noted that Cloudflare does not support EDNS ClientSubnet which scopes the cache per subnet which gives it the ability to aggressively cache DNSresponses. Continent wise, we observe that cumulatively DoH reports lower response times forcontent hosted in Africa compared to content hosted offshore.
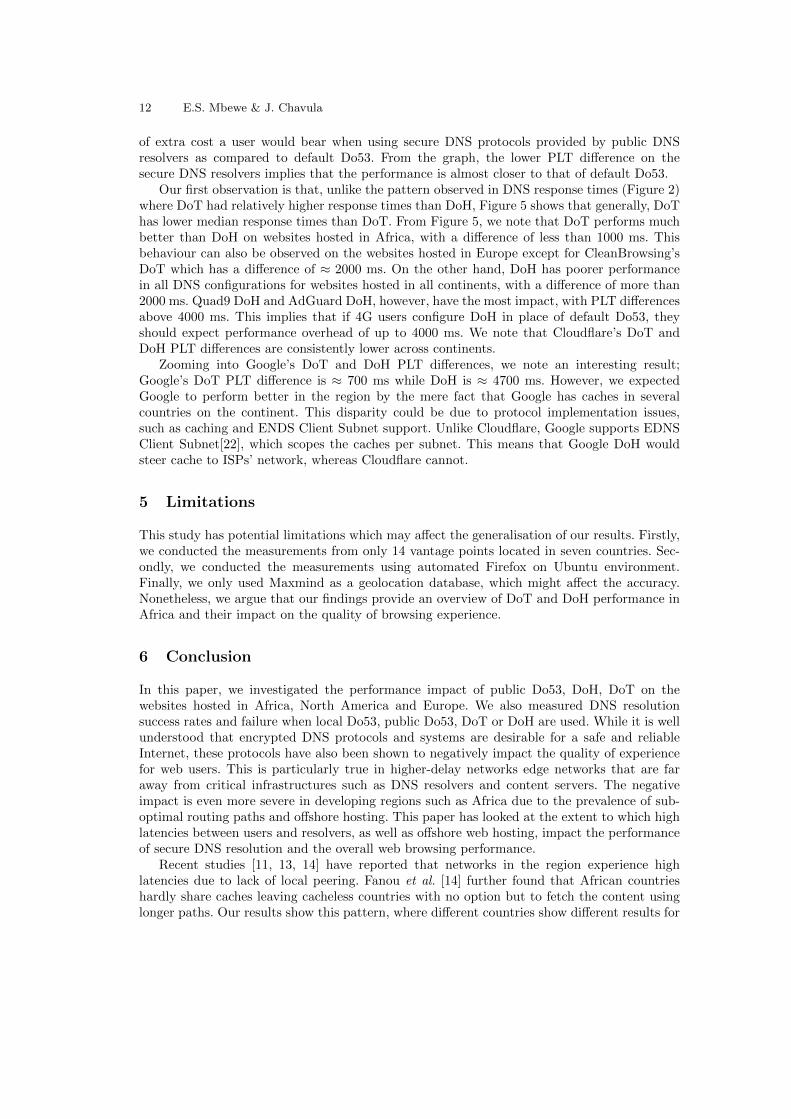
Figure 4 shows CDFs response times for Google, Cloudflare and Quad9 under 4G (Figure4a and Campus wired network (Figure 4b). We observe a noticeable difference between thesenetworks. Of greater interest is the performance of Cloudflare’s DoT on a wired network under100ms response time; it performs better than DoH and comparable to local Do53. For responsetimes longer than 100ms, DoH outperforms DoT. At response times longer than 400ms, DoHseems to perform better than local Do53. This result concurs with the findings found byHounsel et al. [16]
AG CB CF Local GG Q9recursive
0
250
500
750
1000
1250
1500
resp
onse
_tim
e
continent = Europe
AG CB CF Local GG Q9recursive
continent = Africa
AG CB CF Local GG Q9recursive
continent = North America
dns_type
dotdnsdoh
Fig. 2: DNS response time for different open public recursive resolvers when resolving websiteshosted in Europe, Africa and North America from across the vantage points under 4G
Malawi Kenya Uganda South Africa Nigeria Zambia MadagascarCountry Code
0
500
1000
1500
2000
DNS
Resp
onse
Tim
e (m
s)
Recursive ResolverAG CB CF Local GG Q9
Fig. 3: DNS response time for each DNS recursive resolver across the vantage coutries under4G
On QoE Impact of DoH and DoT in Africa: Why a User’s DNS choice matters 11
010
020
030
040
050
060
070
080
090
010
00
DNS Response Time (ms)
0.0
0.2
0.4
0.6
0.8
1.0
Prob
abilit
y
Cloudflare DoHCloudflare DoTdefault Do53Google DoH
Google DoTQuad9 DoHQuad9 DoT
0 20000
1
(a) DNS response time under 4G
010
020
030
040
050
060
070
080
090
010
00
DNS Response Time (ms)
0.0
0.2
0.4
0.6
0.8
1.0
Prob
abilit
y
Cloudflare DoHCloudflare DoTdefault Do53Google DoH
Google DoTQuad9 DoHQuad9 DoT
0 20000
1
(b) DNS response time under Campus Network
Fig. 4: DNS timings for local Do53 vs DoE from major DNS providers (Google, Cloudflare andQuad9) under 4G and Campus network
4.4 Page Load Times (PLT)
Pageload time is a more direct indication of how users experience web browsing. We havealready seen the differences in query response times among the various DNS protocols underdifferent network types across African vantage points. In this section, we show the relationshipbetween the DNS response times and the page load times.
Q9_DoT Q9_DoH GG_DOT GG_DoH CF_DoT CF_DoH CB_DoT CB_DoH AG_DoT AG_DoHPublic DoT/DoH minus Local Do53
0
1000
2000
3000
4000
Med
ian
Page
load
Tim
e di
ffere
nce
(ms) Continent
Africa America Europe
Fig. 5: Median pageload time differences between DoE and local Do53 when resolving websiteshosted in Africa, North America and Europe measured from 4G networks
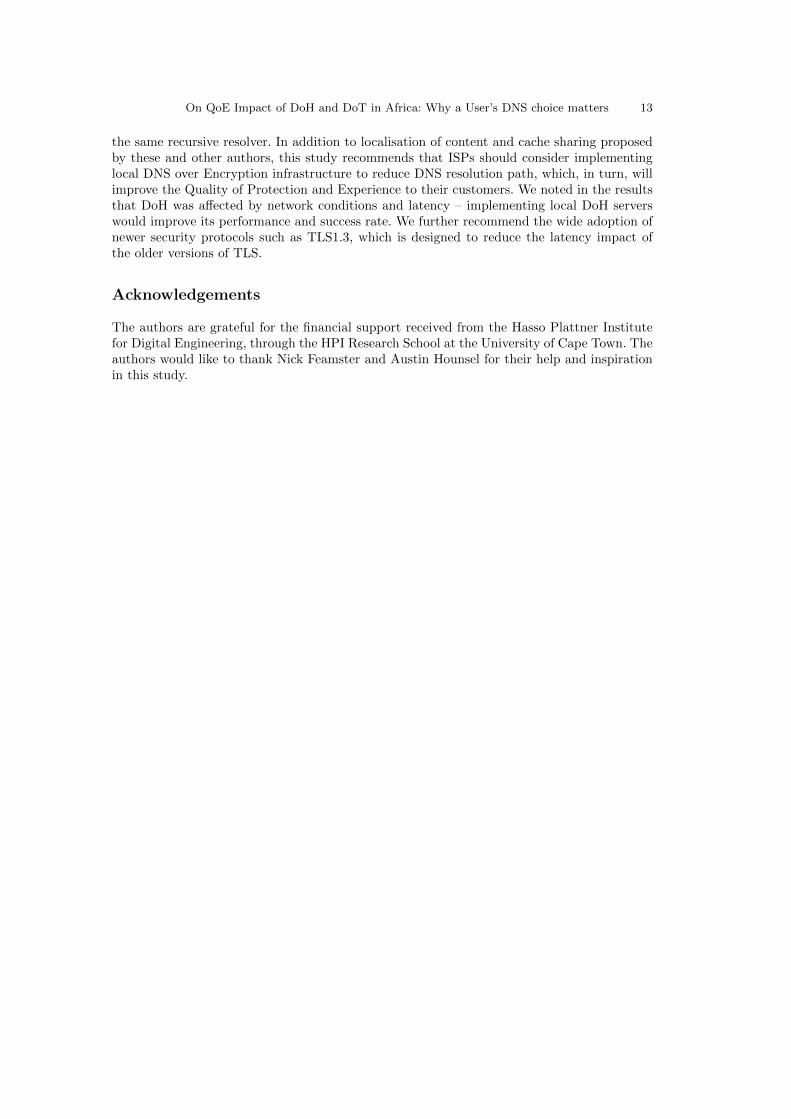
Figure 5 shows PLT differences between DoE resolvers (Google (GG), Cloudflare (CF),Quad9 (Q9), CleanBrowsing (CB) and AdGuard (AG)) and default Do53 when resolvingwebsites hosted in Africa, America and Europe. The difference is calculated by taking themedian page load time for a website/user using one secure resolver minus the median pageload time of the same website/user using local resolver. The difference, therefore, is indicative
12 E.S. Mbewe & J. Chavula
of extra cost a user would bear when using secure DNS protocols provided by public DNSresolvers as compared to default Do53. From the graph, the lower PLT difference on thesecure DNS resolvers implies that the performance is almost closer to that of default Do53.
Our first observation is that, unlike the pattern observed in DNS response times (Figure 2)where DoT had relatively higher response times than DoH, Figure 5 shows that generally, DoThas lower median response times than DoT. From Figure 5, we note that DoT performs muchbetter than DoH on websites hosted in Africa, with a difference of less than 1000 ms. Thisbehaviour can also be observed on the websites hosted in Europe except for CleanBrowsing’sDoT which has a difference of ≈ 2000 ms. On the other hand, DoH has poorer performancein all DNS configurations for websites hosted in all continents, with a difference of more than2000 ms. Quad9 DoH and AdGuard DoH, however, have the most impact, with PLT differencesabove 4000 ms. This implies that if 4G users configure DoH in place of default Do53, theyshould expect performance overhead of up to 4000 ms. We note that Cloudflare’s DoT andDoH PLT differences are consistently lower across continents.
Zooming into Google’s DoT and DoH PLT differences, we note an interesting result;Google’s DoT PLT difference is ≈ 700 ms while DoH is ≈ 4700 ms. However, we expectedGoogle to perform better in the region by the mere fact that Google has caches in severalcountries on the continent. This disparity could be due to protocol implementation issues,such as caching and ENDS Client Subnet support. Unlike Cloudflare, Google supports EDNSClient Subnet[22], which scopes the caches per subnet. This means that Google DoH wouldsteer cache to ISPs’ network, whereas Cloudflare cannot.
5 Limitations
This study has potential limitations which may affect the generalisation of our results. Firstly,we conducted the measurements from only 14 vantage points located in seven countries. Sec-ondly, we conducted the measurements using automated Firefox on Ubuntu environment.Finally, we only used Maxmind as a geolocation database, which might affect the accuracy.Nonetheless, we argue that our findings provide an overview of DoT and DoH performance inAfrica and their impact on the quality of browsing experience.
6 Conclusion
In this paper, we investigated the performance impact of public Do53, DoH, DoT on thewebsites hosted in Africa, North America and Europe. We also measured DNS resolutionsuccess rates and failure when local Do53, public Do53, DoT or DoH are used. While it is wellunderstood that encrypted DNS protocols and systems are desirable for a safe and reliableInternet, these protocols have also been shown to negatively impact the quality of experiencefor web users. This is particularly true in higher-delay networks edge networks that are faraway from critical infrastructures such as DNS resolvers and content servers. The negativeimpact is even more severe in developing regions such as Africa due to the prevalence of sub-optimal routing paths and offshore hosting. This paper has looked at the extent to which highlatencies between users and resolvers, as well as offshore web hosting, impact the performanceof secure DNS resolution and the overall web browsing performance.
Recent studies [11, 13, 14] have reported that networks in the region experience highlatencies due to lack of local peering. Fanou et al. [14] further found that African countrieshardly share caches leaving cacheless countries with no option but to fetch the content usinglonger paths. Our results show this pattern, where different countries show different results for
On QoE Impact of DoH and DoT in Africa: Why a User’s DNS choice matters 13
the same recursive resolver. In addition to localisation of content and cache sharing proposedby these and other authors, this study recommends that ISPs should consider implementinglocal DNS over Encryption infrastructure to reduce DNS resolution path, which, in turn, willimprove the Quality of Protection and Experience to their customers. We noted in the resultsthat DoH was affected by network conditions and latency – implementing local DoH serverswould improve its performance and success rate. We further recommend the wide adoption ofnewer security protocols such as TLS1.3, which is designed to reduce the latency impact ofthe older versions of TLS.
Acknowledgements
The authors are grateful for the financial support received from the Hasso Plattner Institutefor Digital Engineering, through the HPI Research School at the University of Cape Town. Theauthors would like to thank Nick Feamster and Austin Hounsel for their help and inspirationin this study.
Bibliography
[1] P. Mockapetris, “Domain names - concepts and facilities,” RFC 1034, IETF, November1987.
[2] S. Farrell and H. Tschofenig, “Pervasive Monitoring is an attack,” RFC 7258, IETF, May2014.
[3] Z. Hu, L. Zhu, J. Heidemann, A. Mankin, D. Wessels, and P. Hoffman, “Specification forDNS over Transport Layer Security (dotls),” RFC 7858, IETF, May 2016.
[4] P. H. . P. McManus, “DNS queries over HTTPS (doh),” RFC 8484, IETF, October 2018.[5] dnscrypt.info, “DNSCrypt version 2 protocol specification.”[6] C. Lu, B. Liu, Z. Li, S. Hao, H.-X. Duan, M. Zhang, C. Leng, Y. Liu, Z. Zhang, and
J. Wu, “An end-to-end, large-scale measurement of dns-over-encryption: How far have wecome?,” Proceedings of the Internet Measurement Conference, 2019.
[7] P. Radmand and A. Talevski, “Impact of Encryption on QoS in VoIP,” in 2010 IEEESecond International Conference on Social Computing, pp. 721–726, Aug 2010.
[8] H. A. Mohammed and A. H. Ali, “Effect of some Security Mechanisms on the QoS VoIPapplication using OPNET,” International Journal of Current Engineering and Technol-ogy, vol. 3, pp. 1626–1630, 12 2013.
[9] E. Spyropoulou, T. Levin, and C. Irvine, “Calculating costs for quality of Security service,”in Proceedings 16th Annual Computer Security Applications Conference (ACSAC’00),pp. 334–343, Dec 2000.
[10] J. Chen, S. Amershi, A. Dhananjay, and L. Subramanian, “Comparing Web interactionmodels in developing regions,” in Proceedings of the First ACM Symposium on Computingfor Development, ACM DEV ’10, (New York, NY, USA), pp. 6:1–6:9, ACM, 2010.
[11] A. Formoso, J. Chavula, A. Phokeer, A. Sathiaseelan, and G. Tyson, “Deep diving intoafrica’s inter-country latencies,” in IEEE INFOCOM 2018 - IEEE Conference on Com-puter Communications, pp. 2231–2239, April 2018.
[12] R. Fanou, G. Tyson, P. Francois, and A. Sathiaseelan, “Pushing the frontier: Exploring theAfrican Web ecosystem,” in Proceedings of the 25th International Conference on WorldWide Web, WWW ’16, (Republic and Canton of Geneva, Switzerland), pp. 435–445,International World Wide Web Conferences Steering Committee, 2016.
[13] E. Calandro, J. Chavula, and A. Phokeer, “Internet Development in Africa: A ContentUse, Hosting and Distribution Perspective,” in e-Infrastructure and e-Services for Devel-oping Countries (G. Mendy, S. Ouya, I. Dioum, and O. Thiare, eds.), (Cham), pp. 131–141,Springer International Publishing, 2019.
[14] R. Fanou, G. Tyson, E. L. Fernandes, P. Francois, F. Valera, and A. Sathiaseelan, “Explor-ing and analysing the African Web ecosystem,” ACM Trans. Web, vol. 12, pp. 22:1–22:26,Sept. 2018.
[15] T. Bottger, F. Cuadrado, G. Antichi, E. L. a. Fernandes, G. Tyson, I. Castro, and S. Uhlig,“An empirical study of the cost of dns-over-https,” in Proceedings of the Internet Measure-ment Conference, IMC ’19, (New York, NY, USA), p. 15–21, Association for ComputingMachinery, 2019.
[16] A. Hounsel, K. Borgolte, P. Schmitt, J. Holland, and N. Feamster, “Analyzing the costs(and benefits) of dns, dot, and doh for the modern web,” Proceedings of the AppliedNetworking Research Workshop, 2019.
[17] A. Hounsel, K. Borgolte, P. Schmitt, J. Holland, and N. Feamster, “Comparing the effectsof dns, dot, and doh on web performance,” in Proceedings of The Web Conference 2020,
On QoE Impact of DoH and DoT in Africa: Why a User’s DNS choice matters 15
WWW ’20, (New York, NY, USA), p. 562–572, Association for Computing Machinery,2020.
[18] N. P. Hoang, I. Lin, S. Ghavamnia, and M. Polychronakis, “K-resolver: Towards decen-tralizing encrypted dns resolution,” ArXiv, vol. abs/2001.08901, 2020.
[19] A. Hounsel, K. Borgolte, P. Schmitt, and N. Feamster, “D-DNS: Towards re-decentralizingthe dns,” 02 2020.
[20] D. Yang, Z. Li, and G. Tyson, “A Deep Dive into DNS Query Failures,” in 2020 USENIXAnnual Technical Conference (USENIX ATC 20), pp. 507–514, USENIX Association,July 2020.
[21] C. Rey-Moreno, “Supporting the creation and scalability of affordable access solutions,”annual report, Internet Society, May 2017.
[22] C. Contavalli, W. van der Gaast, Google, D. Lawrence, Akamai Technologies, and W. Ku-mari, “Client Subnet in DNS Queries,” RFC 7871, IETF, May 2016.


![DNS over anything but UDP: Implications - ripe77.ripe.net · DoH: DNS over HTTPS UDP or Json blob in HTTP on port 443 DoH[1] pending RFC publication Envisioned as Application to Resolver](https://img.pdfslide.net/doc/110x75/5e6c913930709756f07b8823/dns-over-anything-but-udp-implications-doh-dns-over-https-udp-or-json-blob-in.jpg)