Embed Size (px)
Citation preview

On Remote Weather Associated with the Subtropical Highs of
Pacific Sea Level Pressure
Richard GrotjahnAtmospheric Science Program,
Dept. of LAWR, Univ. of California
Davis, CA 95616, USA
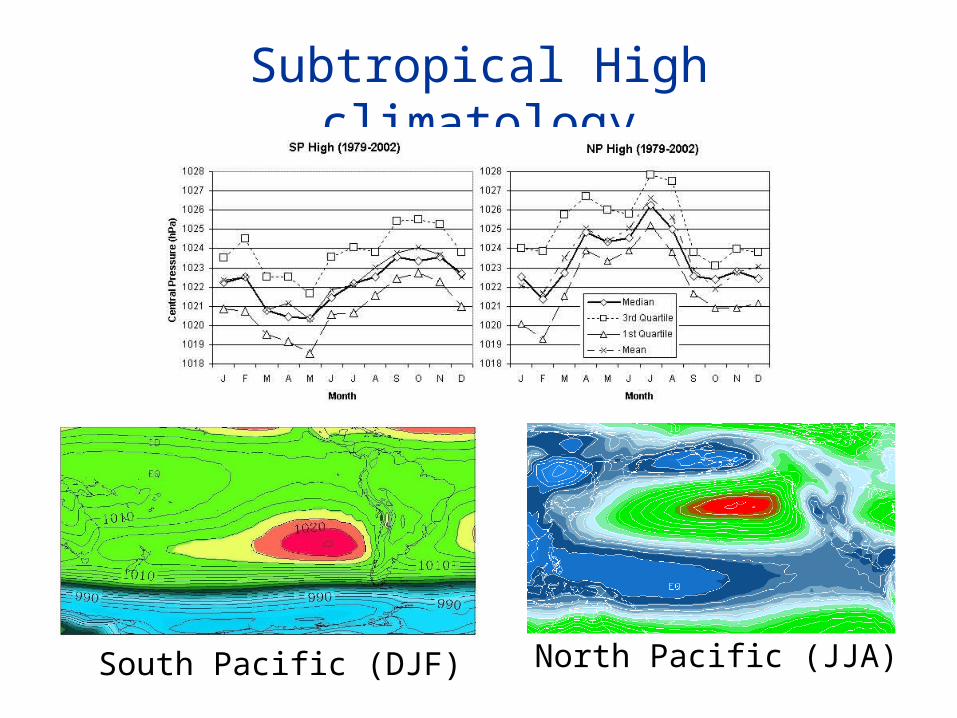
Subtropical High climatology
North Pacific (JJA)South Pacific (DJF)
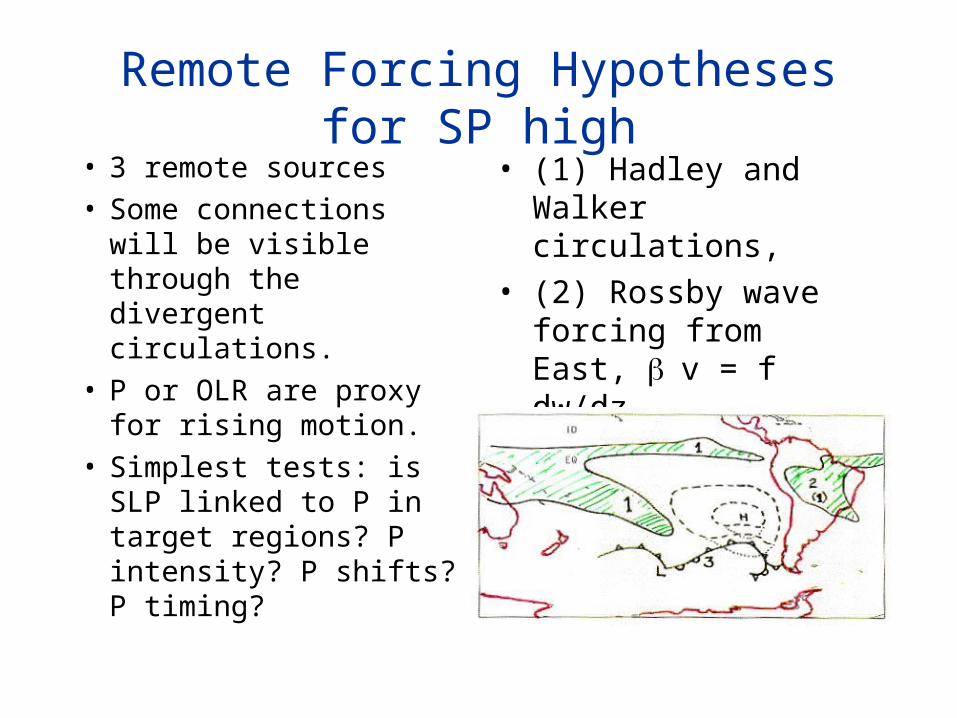
Remote Forcing Hypotheses for SP high
• 3 remote sources • Some connections will
be visible through the divergent circulations.
• P or OLR are proxy for rising motion.
• Simplest tests: is SLP linked to P in target regions? P intensity? P shifts? P timing?
• (1) Hadley and Walker circulations,
• (2) Rossby wave forcing from East, v = f dw/dz
• (3) traveling frontal cyclones and anticyclones

Precipitation ClimatologyJJADJF
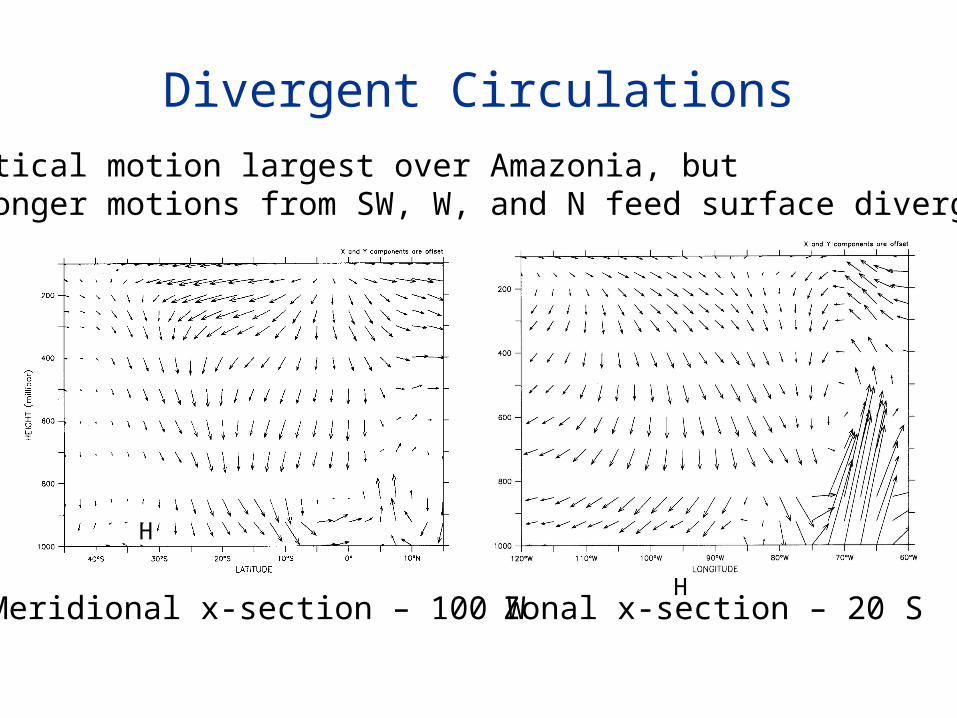
Meridional x-section – 100 W Zonal x-section – 20 S
Divergent CirculationsVertical motion largest over Amazonia, butStronger motions from SW, W, and N feed surface divergence
H
H

Physical Interpretation of Gill’s Model
QDy
v
x
u
y
Pyuyu
x
Pyvyv
2
12
1
x
Qf
xPy
2
22
Form vorticity eqn
Invisicid form:
z
wffQfD
xv

Rossby Wave Mechanism deduced from Gill’s Tropical Circulation Model

Analysis Procedures (Monthly Data) Preliminary study to identify coincident behavior. Monthly NCEP/NCAR Reanalysis data (1979-97). Seasonal groupings, local “summer” emphasized. Total and monthly anomaly (MA) fields. (MA
defined as deviations from the average constructed from all occurrences of that month).
Monthly data cannot distinguish cause from effect. Tools (significance test) shown here:
composites (bootstrap resampling)1-point rank correlations (t- and D-statistics).

T1 – target group chose based on a criterion. Each member 2-D field of F1.
T2 – similar to T1. Target group for field F2 using same times as for T1.
R1n – “nth” random group drawn from
field F1. Times randomly chosen from the entire record with replacement but no duplication. Sample size matches target sample. Many random groups. (e.g. 1000).
R2n - similar to R1n except randomly
choices from F2. Times used differ from those for R1n
For each grid point: compare the mean of the target group vs the means of the random samples at that grid point.
Bootstrap Resampling (part 1)
t = 1
t = 2
t = 3
t = 4
t = NT
t = 5
T2
T1
R2n
t = 6
R1n
F2(nx,ny,nt)(P, OLR, DWS, VP, SLP,…)
F1(nt)(SLP, MJO, SOI,…)

010
2030
4050
6070
8090
100
286
287
288
288
289
290
291
291
292
293
294
294
295
Mean temperature at 850 hPa
Fre
qu
ency
Bootstrap Resampling (part 2)Significance: Determine separately for each location point Distribution from random composites at each pt. Level determined by number at a tail times 2 Distribution can be ‘normal-like’, bimodal, etc Significant if target composite lies at either tail (2-tailed test)
Example: At point (i,j) of an observed distribution. The star indicates a significant target composite T2
Figure II.2: example of null distribution.This null distribution was generated while assessing the significance of the 850 hPa mean temperature. This histogram refers to the grid point closest to Sacramento, and gathers 1000 random samples. The target value has been added and is shown by a star. 99% of the values stand between the two dashed lines. (i.e. 5 random to right tail, 5 to the left)

Composites: ONDJF Monthly Anomaly Data:• E and NE: lower SLP
(purple) more P (N of South America) for strong high and vice versa.
• N and NW: More P and Northward shift of ICZ
• W: More P (green) & westward shift of SPCZ
• NW & N MJO? ENSO?• S and SW: Dipole (P)
storm track shift to S for strong SP high. Tracks may be broader for weak SP high.
6 strongest – 6 weakest Green: significant above (1%) Purple: significant below (1%)

Composites: JJA Monthly Anomaly Data:
6 strongest – 6 weakestGreen: significant above (1%) Purple: significant below (1%)
SLP:Highest when high is NWSP high coordinatedWeak & strong composites not “opposite”
Precip:Shift of ICZ southwardShift of midlat NW-wardStronger over Indonesia

1-Point Rank Correlations
Day 1
Day 2
Day 3
Day NT F2(i,j,NT)
F2(i,j,3)
F2(i,j,2)
F2(i,j,1)
F1(1)
F1(2)
F1(3)
F1(NT)
F2(nx,ny,nt)(P, OLR, DWS, VP, SLP,…)
F1(nt)=F1(M,N,nt)(SLP, MJO, SOI, …)
R(i,j)
(M,N)
y
x
R(i,j)
y
x
),(21
1
)),(2),,(2)(1)(1(1
),(jiFF
NT
k
jiFkjiFFkFNT
jiR
NHST (Null Hypothesis Significance Test): “Given that F2 at (i,j) is not correlated with F1 at (M,N), what is the probability that the indicated correlation could occur by chance?” ≤ 1% chance is shaded

1-pt correlations of Monthly Anomaly Data:• Intersection of 2 signif.
tests used shaded & tend to match 0.3 correlation.
• correlation points respond to events on the same side.
• NE to E Pacific ICZ (shift) and more Amazonian P
• NW side to ICZ & SPCZ shift
• E, NE, N, and NW of the SP high center correlate with less P in the Kiribati area like composites results
• W, SW & S: Total and MA data both show: dipolar correlation pattern implies poleward shift of storm track P for higher SLP
• P shown, OLR similar
• Blue: significant above (1%)
• Orange: significant below (1%)

1-pt correlations of MA Data: NP High Signif. R at remote spots on the same
side of the high as the correl. point. P near Central America not
compelling. For key points on the East side of the high, less P for stronger SLP.
Results consistent w/ composites*
• P shown, OLR similar
• Blue: significantly (2.5%) more P for higher SLP at *
• Brown: significantly (2.5%) less P for higher SLP at *
• H is total data mean location

Work with Daily Mean Data: SP high only
• Data Source:
• NOAA/CDC (Boulder CO, USA)
• NCEP/NCAR reanalysis data
• SLP, U, V
• Ud, Vd, Velocity Potential (VP) from NCL commands.
• Data record:
• 90-day DJF periods shown (122 day NDJF similar)
• Drawn from 01/1990 through 08/2002
• Goal:
• Prior work showed remote links now wish to establish cause and effect by using lags and leads.

Lags and Leads (expressed as F1 Relative to F2)
Example: 1 day lag
t = 1
t = 2
t = 3
t = 4 F2(i,j,4)
F2(i,j,3)
F2(i,j,2)
F2(i,j,1)
F1(1)
F1(2)
F1(3)
F1(4)
F2(nx,ny,nt)(P, OLR, DWS, VP, SLP,
…)
F1(nt)(SLP, MJO, SOI, …)
R(i,j)
(M,N)
y
x
R(i,j)
),(21
1
1
)),(2),,(2)(1)1(1(1
1
),(jiFF
NT
k
jiFkjiFFkFNT
jiR
(1 day lead is similar; but F1 leads F2)

SLP lagged autocorrelationslag (L) and lead (R) SLP @ pt-8
correlations (CW: 8, 4, 0, -4, -12d)

SLP lagged autocorrelationslag (L) and lead (R) SLP @ pt-11 correlations (CW: 4, 2, 0, -2, -4d)

SLP 1-pt Autocorrelation animation

Velocity Potential (“VP”) at 200 hPa lag (L) and lead (R) SLP @ pt-8
correlations (CW: 8, 6, 4, 2, 0, -2, -4,-6 d)
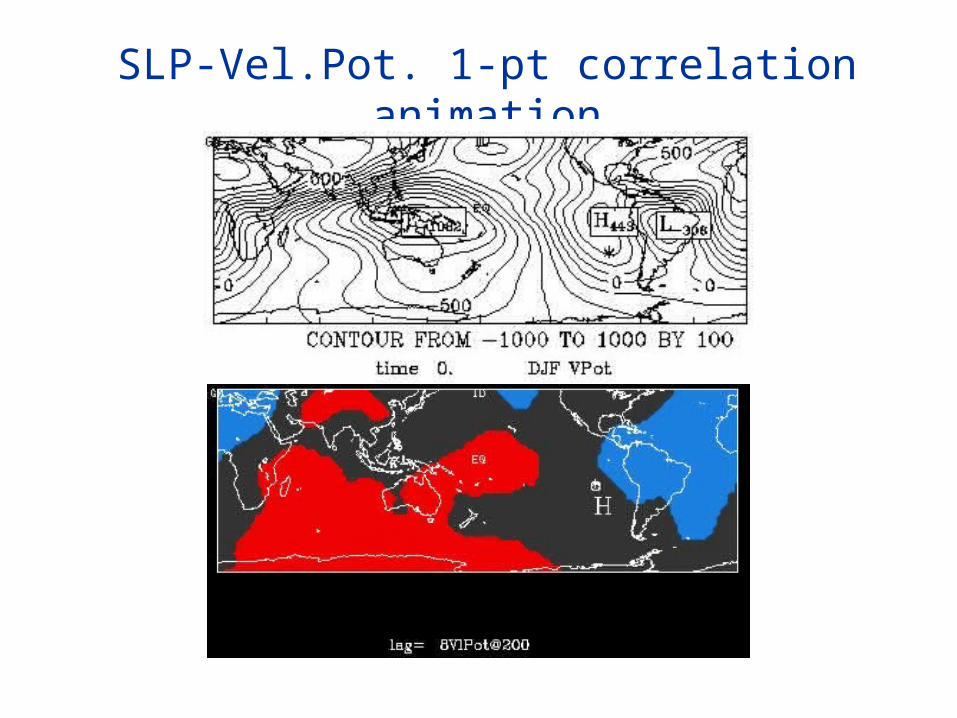
SLP-Vel.Pot. 1-pt correlation animation
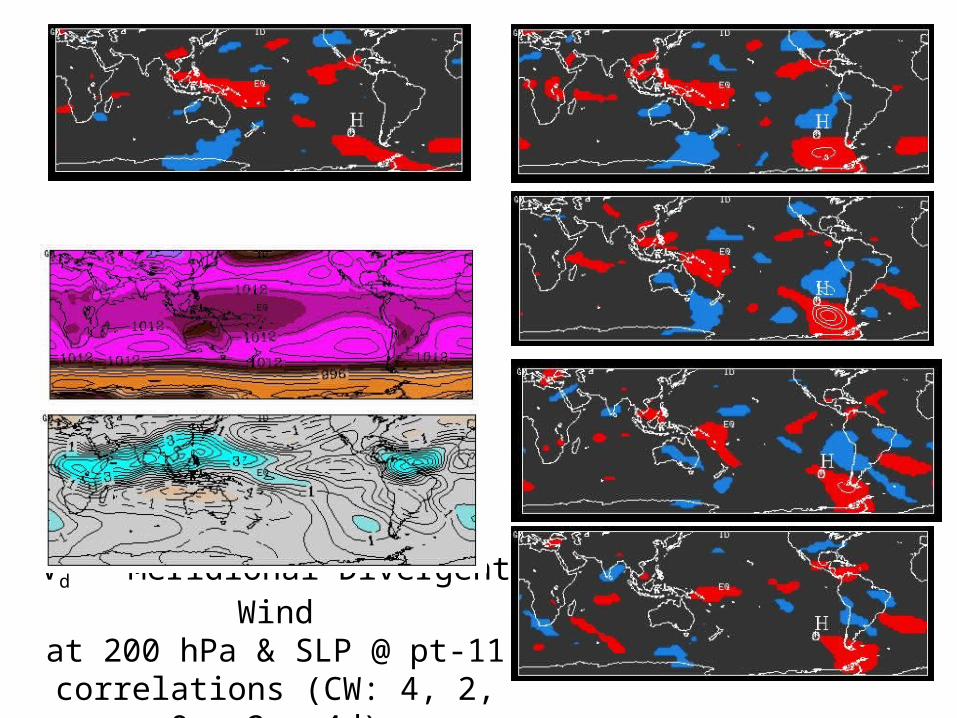
Vd – Meridional Divergent Windat 200 hPa & SLP @ pt-11
correlations (CW: 4, 2, 0, -2, -4d)

Cross-correlation points for SLP & VP
)2,2(2)1,1(1
1
1
))2,2(2),2,2(2)(1,1(1),1,1(1(1
1)(
nmFnmF
kNs
iNyear
i
nmFinmFnmFkinmFkNs
NyearkAc

VP cross-correlations for SLP on NE side

DWS cross-correlations for SLP max
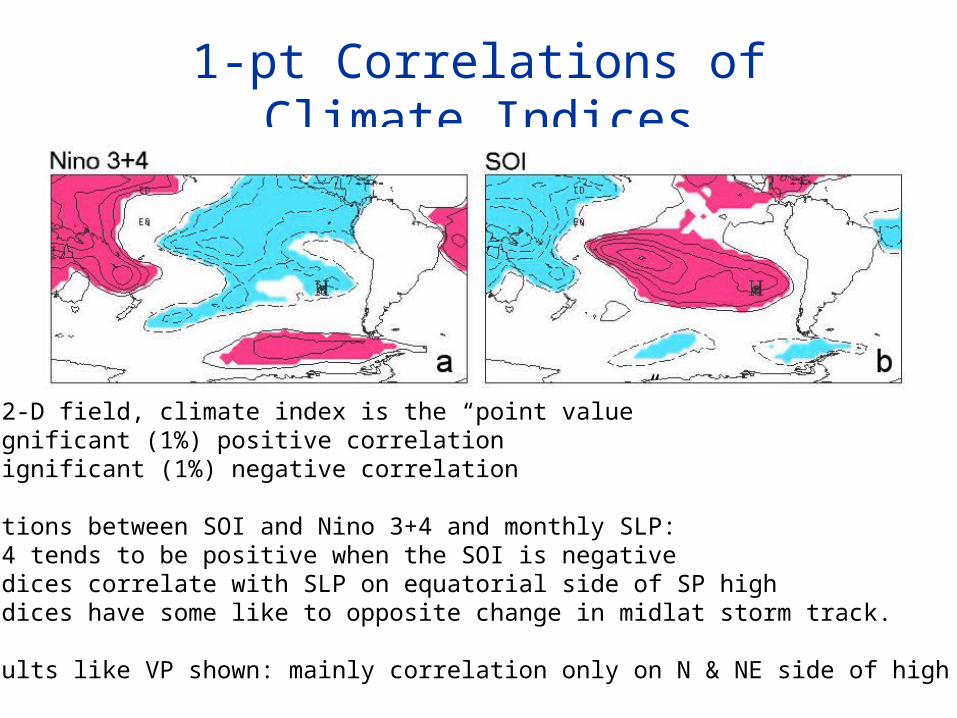
1-pt Correlations of Climate Indices
SLP is 2-D field, climate index is the “point value”Red: significant (1%) positive correlationBlue: significant (1%) negative correlation
Correlations between SOI and Nino 3+4 and monthly SLP:Nino 3+4 tends to be positive when the SOI is negativeBoth indices correlate with SLP on equatorial side of SP highBoth indices have some like to opposite change in midlat storm track.
MJO results like VP shown: mainly correlation only on N & NE side of high

Conclusions• Equatorial and NE side of SP high highly correlated with pressure in
equatorial & E Pacific. Stronger SLP on N side of SP high is followed by lower SLP over SE Asia.
• Equatorial side of NP high correlated with ICZ. Relation to precip over Central America inconsistent with Rossby wave model.
• Stronger SP highs are those SW of the mean position & reinforced by divergent winds from midlatitude cyclones.
• Stronger NP highs are those NW of mean position & reinforced by midlat cyclones and Indonesian precip.
• Expansion of Amazonian velocity potential (VP) min. leads to stronger SP high when reinforced by weaker E. Indonesian VP min. Both lead to westward move of VP max over Pacific.
• This last item leads a westward migration of higher than normal SLP on equatorial side of SP high.
• For many points cross spectrum (not shown) has strong frequency ~40d. Presumably consistent MJO correlations found (not shown).