Embed Size (px)
Citation preview

On the Design of Online Predictors for AutonomicPower-Performance Adaptation of Multithreaded Programs
Matthew Curtis-Maury, James DzierwaChristos D. Antonopoulos and Dimitrios S. Nikolopoulos
Department of Computer ScienceCollege of William and Mary
P.O. Box 8795 – Williamsburg, VA 23187–8795, U.S.A.e-mail:{mfcurt,jadzie,cda,dsn}@cs.wm.edu
May 15, 2006
Abstract
This paper investigates the design space for techniques that enable runtime, autonomic pro-gram adaptation for high-performance and low-power execution via event-driven performanceprediction. The emerging multithreaded and multicore processor architectures enable applica-tions to trade performance for reduced power consumption via regulating concurrency. At thesame time however, power and performance adaptation opportunities for multithreaded pro-grams in high-end computing environments are constrained by the fact that users are unwillingto compromise performance for saving power. Runtime systems that enable autonomous pro-gram adaptation are an appealing solution in the specific context, due to the challenges that arisein statically identifying the optimal energy-efficient operating points in each program, and theconcerns of delegating the complexity of this task to end-users or application developers. Sys-tem software needs to identify and exploit the power saving opportunities that arise due to theinability of code to effectively utilize all the available resources in the system, or the inabilityof the system to overcome scalability bottlenecks in parallel code.
The techniques investigated in this paper fall into a broader class of methods that collectinformation about the performance of programs on-the-fly, as a program executes, and adaptthe programin situ, after briefly analyzing the collected information. On-line performancepredictors are well suited for rapid adaptation with limited input. They also overcome the lim-itations of techniques based on direct search of operating points. We explore the design of fastonline performance predictors that use feedback from hardware event counters to project per-formance of parallel execution at each layer of parallel execution in the system instantaneously,using linear regression models. We perform a quantitative analysis of the design space of thesepredictors, focusing on the selection of hardware events touse as input for the prediction, thechoice of regression techniques for phase-by-phase performance prediction across potential ex-ecution configurations, and the process of predicting performance across multiple dimensionsof parallelism in the system. We demonstrate the applicability and effectiveness of our runtimeperformance predictors in the problem of power-aware, high-performance execution of multi-threaded applications on a real multi-SMT system built fromIntel’s Hyperthreaded processors.
1

1 Introduction
Multithreading and multiprocessing, two technologies which until recently werea premium of en-
terprise servers and high-end computing environments, have now been integrated in a single chip,
making parallel processing more affordable and universally accessiblethan ever. The high com-
pute density of chip multiprocessing and multithreading processors allows applications to extract
more performance out of a fixed transistor budget. Chip-level multiprocessing overcomes many of
the limitations of instruction-level parallel architectures, while, at the same time, improving power-
efficiency.
Concurrency control is a natural means of trading higher performancefor lower power consump-
tion. Systems with chip-level and/or board-level multiprocessing enable system software to regulate
power consumption and performance simultaneously, using concurrencyas a knob. Concurrency
can be lowered to reduce power consumption at a performance cost, or increased to improve per-
formance at the cost of higher energy consumption rate. In certain occasions however, concurrency
can be throttled to achieve both performance improvement and energy savings. Such occasions
arise due to inherent program properties, such as limited algorithmic concurrency, fine granularity
of computations which makes the exploitation of parallelism in hardware difficult,memory and/or
communication intensity, and frequent synchronization and serialization. They also arise due to
architectural properties that limit scalability of multithreaded code, such as capacity limitations in
resources shared between threads along the execution pipelines and memory hierarchies.
Clearly, system software needs to increase its awareness of both concurrency and energy, in
order to exploit the architectural characteristics of chip multiprocessors and multithreaded proces-
sors. Although sacrificing performance for saving power is a highly desirable and affordable feature
for desktop and mobile computing environments, users of high-end computingsystems have very
little to no tolerance for sacrificing performance for the sake of saving power. The unique mani-
festation of the power-performance trade-off in high-performance computing environments creates
challenges for system software. Power-/performance-aware systemsoftware for high-end systems
should exploit only the specific power-saving opportunities that arise either due to application char-
acteristics or due to architectural limitations, in specific execution intervals where throttling con-
currency either does not harm or improves performance. The optimal operating point in terms of
2

power/performance efficiency may vary widely from program to program or even between phases
of the same program. Given the limitations of static performance and power analysis [13], and the
inherent drawbacks of delegating the difficult task of power-performance adaptation to application
developers or end-users, runtime systems with autonomic control capabilitiesare ideal candidates
for identifying sweetspots of the energy/performance trade-offs and exploiting the resulting oppor-
tunities.
This paper explores the design of autonomic, self-optimizing runtime system software for high-
performance and power-aware multithreaded execution on parallel platforms built from multithreaded
and multicore processors. We introduce runtime systems that regulate concurrency and thread gran-
ularity in situ, to enable power-aware execution of parallel programs under stringent performance
constraints. The proposed runtime systems trace parallelized program phases, dynamically analyze
the characteristics of each phase using either timing or lower-level information from hardware event
counters, and derive good operating points for each phase of the program. Collection and analysis
of hardware event rates for performance prediction, as well as adaptation, are conducted while the
program executes, therefore they need to be designed for minimal intrusion.
Although the literature on autonomic power-performance adaptation of multithreaded codes in
high-performance computing environments is sparse, there are at least two broad classes of adapta-
tion strategies that have been considered so far. The first includes adaptation algorithms based on a
direct search of operating points, which proceeds concurrently with program execution. In their sim-
plest form, these methods time periodic parallel phases under different configurations (e.g. number
of threads/cores/processors used) and select the configuration which yields the best performance.
Naturally, adaptation algorithms based on searching do not scale well with thenumber of possible
system configurations that can execute the program. If additional configuration parameters such as
frequency and voltage are incorporated in the search criteria, searchcost increases dramatically.
An alternative to direct search methods are prediction-based methods [4]. In this class of tech-
niques, the runtime system instruments program phases and collects information during a small
number of trial executions of each phase. This information is, in turn, usedto derive a performance
prediction for each phase, when executed with different degrees of parallelism and different map-
pings of the parallelism to the layers of the architecture. Performance predictions can be coupled
with power predictions, which are obtained either from event counters, or via calibrating measured
3

power samples collected during training executions. Prediction-based methods are appealing for
online program adaptation, since they require significantly fewer trial executions of program phases
to reach a decision for the estimated optimal operating point. They are more practical than direct
search methods, especially in the context of short-lived parallel codes and codes with few recur-
rences of parallel phases. On the other side of the coin, since fast prediction-based methods use
real feedback from only a very small number of trial configurations of each phase, they face more
difficulties in identifying optimal operating points than direct search methods and their overall ef-
fectiveness is critically dependent on the accuracy of the employed prediction methodology.
We investigate the design of performance predictors for autonomic power/performance adapta-
tion on multithreaded codes, and more specifically, power adaptation which incurs no performance
penalty, or improves performance. We consider performance predictors that use input from hard-
ware performance monitoring counters to derive instantaneous estimates ofperformance for any
degree of concurrency and any mapping of the threads to the layers of the parallel system. We study
the effectiveness of our predictors in projecting performance using a variety of benchmarks with
different concurrency, granularity, and scalability properties. We focus on the problem of selecting
the most appropriate hardware events for prediction, using both empiricaland statistical methods,
and on refining predictions by using phase classification according to absolute performance charac-
teristics, and additional information about the system organization. Along withthe investigation of
predictor design, we present results demonstrating that online prediction-driven adaptation methods
achieve both higher performance and better energy-efficiency than other adaptation methods based
on direct search, as well as compared to non-adaptive, static executionschemes.
The rest of this paper is organized as follows. Section 2 discusses the design of performance
predictors for granularity control and power-performance adaptationin more detail. In Section 3,
we outline the design of an autonomic runtime system for transparent power-performance adapta-
tion, and discuss policies and mechanisms for making multithreaded codes more energy-efficient
from within the runtime system. Section 4 evaluates event-driven predictors interms of accuracy
and effectiveness in achieving their objective of sustained high performance with lower energy con-
sumption. Section 5 discusses related work in the field. Section 6 concludes the paper.
4

2 Designing Effective Predictors for Power-Performance Adaptation
The core of our adaptive runtime system is a online performance predictor. The predictor uses input
collected from hardware performance counters at runtime, during executions with test configura-
tions, to predict the performance of any given code region when executed with different numbers of
threads and under different mappings of these threads to the layers of the architecture. Performance
counters provide both qualitative and quantitative insight on the interaction of the code with the
hardware. They reveal bottlenecks – both within and across processors – and scalability limitations,
and quantify their effect on performance and on the utilization of the system.Such information
can, thus, be exploited to make an educated projection of performance under different execution
scenarios, based on the observed performance during test executions with specific configurations.
For example, a large number of cache misses in a shared L1/L2 cache may indicate that there is
either contention between threads executing on the same processor or thatthe working set of the
application is too large to fit in the cache.
In this section we outline the architecture and design of the performance predictor that drives
the decisions of our adaptive runtime system, focusing on interesting details and design decisions.
The predictor estimates performance for a given, parallelized code region in the form of cu-
mulative instructions per cycle (IPC) across all threads used to execute the region. No matter how
loops are executed in parallel, the total computational load – thus the total number of instructions as
well – corresponding to the body of each loop remains constant, if “overhead” code – such as work
distribution code, or instructions issued during busy-waiting at synchronization points – is not taken
into account. As a result, the cumulative IPC for “useful” instructions is inversely proportional to
the execution time of a given parallel region, excluding the overheads.
IPC is a generic metric, characterizing the interaction of code with the underlying hardware. As
a result, code regions with similar characteristics are expected to attain similar IPCs on a given ar-
chitecture, even if their computational loads or total execution times vary greatly. As a consequence,
predicting performance as an expected IPC rather than directly as expected execution time allows
the predictor to correctly classify loops during the training phase and generalize this knowledge to
other loops at runtime, regardless of the individual execution times of different loops. This makes
IPC the most appropriate choice for performance prediction.
5

Dual-Processor SMP, Layer I
SMT, Layer III
L1
T1 T2
SMT, Layer III
L1
T1 T2
L2
Dual-Core CMP, Layer II
SMT, Layer III
L1
T1 T2
SMT, Layer III
L1
T1 T2
L2
Dual-Core CMP, Layer II
DRAM
Figure 1: A three-layer shared-memory multiprocessor.
In the context of this work we consider prediction schemes for layered shared-memory parallel
architectures. We define alayer of parallelismas a set of homogeneous processing elements (pro-
cessors, cores within processors, threads within cores etc.) that share a given layer of the shared
memory hierarchy, which is also shared by nested processing elements in thelower layers of the
hierarchy, but not by processing elements in higher layers of the hierarchy. Figure 1 illustrates a
three-layer shared-memory system with two processors, two cores per processor and two threads
per core, running in an SMT configuration. Processors, cores within each processor and threads
within each core form the different layers of parallelism.
On layered shared-memory architectures, the degree of resource sharing and the actual resources
that are shared between threads vary from layer to layer. For example,physical processors in an
SMP share only the off-chip interconnect and DRAM. Cores within a processor typically share
an on-chip interconnect and the outermost levels of the cache. Threadson a single core share
most resources of the execution core, including pipelines, branch predictors, TLB and L1 cache.
Application performance and scalability are largely determined by the nature of resources that are
shared between software threads at each layer, and the intensity of contention for these resources.
Due to the varying nature, degree and impact of sharing at different layers of the machine, the
potential for unified performance prediction across all layers of parallelism is limited. Furthermore,
different metrics, evaluating the interaction of software with different hardware resources, are likely
6

to be the best indicators of performance at each layer. As the set of critical resources changes, the set
of hardware events used to provide feedback to the predictor needs to vary accordingly. To address
this problem, we introduce a recursive, multi-step, multi-layer prediction scheme which estimates
performance along one layer of parallelism at a time, using a linear model which is driven by input
from the most appropriate hardware monitoring events for the specific layer. The appropriate events
for each layer are derived from a regression analysis described further in Section 4.2.1. The predictor
uses input from as many test executions, as the number of layers of parallelism in the system. At
each step, it estimates IPCs for all possible configurations (active/inactive) of processing elements
at the specific layer of the architecture. Following, it selects the number of threads that yields the
highest cumulative IPC and uses that configuration as the basis when repeating the procedure for
the immediately higher layer of parallelism. The set of hardware events and linear coefficients used
by the linear prediction model at a given step depends on the layer of parallelism considered by the
predictor at that step and on the base-configuration selected for the layers of the system considered
in previous steps of the prediction process.
In subsection 2.1 we describe the linear model used for IPC prediction andits rationale. In
subsection 2.2 we outline the offline steps needed for “training” the model and for identifying the
most representative sets of hardware events in each case.
2.1 The Linear IPC Prediction Model
The IPC predictor is applied to estimate the expected IPC for a target code region (IPCest(con f iguration))
under all possible configurations (numbers of activated execution contexts) for a specific layer of the
parallel architecture. The predictor uses input from a test execution, inthe form of IPC (IPCobs(test))
and of a set of hardware performance metrics (m1(test), ...,mn(test)). In should be noted that the hard-
ware metrics are first normalized by the number of elapsed clock cycles. This puts the metrics in
the form ofevent rates, rather than absolute event counts which would be affected by the execution
time of a phase. The test configuration for a specific layer is synthesized by combining the already
identified optimal configuration decisions for lower layers of the hierarchywith the activation of all
execution elements at higher layers of the hierarchy.
The estimated IPC is calculated by scaling the observed IPC using a transferfunction (H(con f iguration))
and by consecutively correcting by a constant residual (e(con f iguration)).
7

IPCest(con f iguration) = IPCobs(test) ·H(con f iguration)(m1(test), ...,mn(test))+e(con f iguration) (1)
The transfer function (H(con f iguration)) represents the expected performance effect due to the way
the target code region interacts with hardware. That effect is assumed tobe a linear combination
of the effects of individual bottlenecks, the severity of which is quantifiedby the values of metrics
m1(test), ...,mn(test). As a result,H(con f iguration) is formulated as a linear combination of these metrics
(equation 2).
H(con f iguration)(m1(test), ...,mn(test)) =n
∑i=1
(ai(con f iguration) ·mi(test) +bi(con f iguration))+c(con f iguration)
(2)
Target configurations for evaluation at each layer are also formulated recursively; we combine
the optimal configuration already identified for lower layers with the activationof 1 to all (pi)
processing elements at the current layer (i). The processing elements at higher, not yet visited
layers are all considered activated.
It should be noted that both the functionH(con f iguration) – i.e. the coefficientsai(con f iguration),
bi(con f iguration) and c(con f iguration) – and the constant residuale(con f iguration) are different for each
target configuration. They depend on the number and the layout of processing elements used to run
the given parallel execution phase in the system. Moreover, the hardware events used as input also
change, depending on the targeted layer of the architecture and on the configuration decisions taken
for the lower layers.
Combining equations 1 and 2 the estimated IPC for a target configuration can be calculated as:
IPCest(con f iguration) =n
∑i=1
(ai(con f iguration) ·mi(test) ·IPCobs(test))+d(con f iguration) ·IPCobs(test)+e(con f iguration)
(3)
whered(con f iguration) = c(con f iguration) +∑ni=1bi(con f iguration). The accurate estimation of the expected
IPC is thus dependent on the proper approximation of the coefficientsai(con f iguration) , d(con f iguration),
8

the residuale(con f iguration), and – last but not least – the selection of appropriate hardware events.
This is the goal of the offline training phase described in the following subsection.
2.2 Offline Model Training: Selection of Hardware Events and Estimation of Coef-
ficients via Linear Regression
The offline training process uses input from static executions of a representative set of parallel
regions. Each parallel region is executed with all possible configurationsof processing elements at
different layers of the system. For each static configuration we collect allpossible hardware events
that can be counted on a per-thread basis.
2.2.1 Pruning of the Space of Event Combinations
During the training phase of our model we need to evaluate the effectiveness of all possible event
combinations in order to identify the most appropriate events for the IPC estimation at each layer
of the parallel architecture and for each configuration decision reached for lower layers. Most
modern processors allow monitoring of a large number of events. For example, Intel Hyperthreaded
Pentium 4 processors offer 40 events (many with the potential of further differentiation via use
of bitmaps), up to 18 of which can be monitored simultaneously by both threads executing on
each physical processor. One additional counter (time stamp counter) is available for accurately
monitoring clock cycles. IBM Power 5 offers 500 distinct events. 6 per thread can be monitored
simultaneously. Although the events required for calculating IPC (retired instructions, cycles) need
to always participate in the event set, the space of potential event combinations is still huge and can
not realistically be fully evaluated, even offline.
It should be noted that a valid choice for an event counter is to leave it unused. In models taking
into account too many hardware metrics, estimates of coefficients may be unstable in the presence
of multi-collinearity. Moreover, metrics that are actually uncorrelated with the IPC can increase the
variance of the predictions [23].
Fortunately, the combination space can be dramatically reduced, if only “valid” combinations
of events are taken into account. Most modern processors allow each event to be monitored on
specific registers of the performance monitoring subsystem. Events using the same registers cannot
9

be monitored simultaneously, thus they cannot be combined in the same event set.
Moreover, after collecting samples of hardware metrics from all configurations of each parallel
region in the training set, events that have consistently low (negligible) valuesacross all samples
can be eliminated. Such events cannot have a significant performance scaling contribution in the
context of a linear prediction model.
2.2.2 Identification of Effective Hardware Event Combinations and Estimation of Coeffi-
cients
The goal of the training phase is to identify the most appropriate hardware events for each transfer
function H() and to closely approximate the corresponding coefficients. In the training phase we
use a limited set of parallel regions (training set). Regions in the training set need to have as diverse
characteristics as possible and to be representative of the general class of applications – such as
scientific computing applications, multimedia applications, server applications etc.– to which the
predictor is expected to be applied (target set). Each parallel region is statically executed with all
possible configurations of processing elements available on the system. Furthermore, for each such
static configuration we collect all the target hardware metrics from the performance monitoring
counters of the processor.
Transfer functions are then generated using multivariate linear regression. For each layer of
the target architecture we need to generate transfer functions for the transition from all possible
base configurations (i.e. all possible combinations of execution elements at lower layers of the
architecture) to all possible target configurations at the specific layer (i.e. all possible scenarios
for the activation/deactivation of processing elements at the specific layer). Moreover, for each set
of test to target configuration transitions originating from the same test configuration, we generate
different transfer functions using as input all combinations of hardware metrics that survived the
pruning described in section 2.2.1.
While estimating the transfer function for the transition from a specific base (test) configura-
tion to a specific target configuration, the observed IPCs during the static execution of the train-
ing set regions under the target configuration serve as thedependent variable. The products of
mi(test) · IPC(test) for each event used in prediction andIPC(test) alone are, in turn, used as theinde-
pendent variables. The regression analysis produces estimates for theai(con f iguration), d(con f iguration)
10

ande(con f iguration) coefficients of each transfer function.
The next step, after the generation of the transfer functions that correspond to all possible event
set combinations for each base to target configuration transition, is the identification of the preferred
event set combination for the specific transition. At this phase, we evaluatethe effectiveness of
the transfer function corresponding to each event set in accurately predicting the IPC of the target
configuration, based on data attained during the test execution of the baseconfiguration. For the
purposes of this evaluation we use an additional set of parallel regions (control set). The control
set is also executed under all possible configurations and the observedIPCs are compared with the
IPCs predicted using the transfer functions. The event set that corresponds to the most accurate
prediction for each base to target configuration transition is selected as thepreferred one for the
specific transition. Alternatively, the control set may be the same as the training set. In this case,
a good metric of the accuracy of each transfer function is the coefficientof determination (R2)
calculated during the linear regression analysis. A higherR2 indicates higher quality of predictions
with the specific event set.
The intuition behind this model for performance prediction is that hardware events which char-
acterize the interaction between software and hardware can provide insight into the expected per-
formance of a code region. Thus, we use the observed IPC of each code region from the test
configuration as a starting point and adjust it based on the observed values of hardware metrics in
order to estimate the IPC under another configuration. In essence, the regression analysis identifies
the effects of each hardware metric on performance.
At the end of the training phase for layeri of the hierarchy, the number of hardware event sets
at layeri (#Ei) is equal to the number of possible base (test) configurations at that layer. #Ei can be
calculated by the following equation:
#Ei =i−1
∏k=1
ck (4)
#E1 = 1 (5)
whereci is the number of possible configurations for the execution elements of layeri. Intuitively,
∏i−1k=1ck is the number of possible base (test) configurations at layeri in the system.1 Similarly, the
1This is the number of all possible configuration decisions for layers 1, . . . , i−1.
11

number of transfer functions at layeri (#Hi) can be defined as:
#Hi = (#Ei) · (ci −1) (6)
where(ci −1) is the number of transitions to all possible target configurations from any given base
configuration.
The effectiveness of the training and the accuracy of the prediction process can be improved
by further classifying parallel regions according to their characteristics. We have experimented
by dividing parallel regions into buckets, according to the cumulative IPC they attain under the
first-layer test configuration. IPC thresholds can signify a separation between sets of regions with
different scalability slopes. That additional degree of classification allows for the generation of
different transfer functions for different loop classes and allows themodel to consider algorithmic
scalability factors as well.
3 Power-Performance Adaptation using Online Predictions
3.1 Runtime System Architecture
The iterative structure of the majority of parallel applications, particularly in the scientific and engi-
neering domains, lends itself naturally to optimization techniques that exploit the repeated execution
of program phases. One popular method of utilizing periodic phases for dynamic program adap-
tation is to run the application under each potential configuration – i.e. each valid combination of
numbers of processing elements activated at each layer of the system – for one iteration, and simply
select the option with the best performance for use during the remaining iterations [6, 14, 17, 32].
A significant advantage of this approach is that once a decision is made, it can be trusted with a
relatively high degree of confidence to be effective for the specific combination of application and
hardware.
Unfortunately, for systems with a large number of processors, or cores/threads per processor,
the search phase can require a significant number of iterations to reach adecision, potentially result-
ing in a significant portion of the application running under suboptimal configurations. Moreover,
certain applications may have too few iterations to make a direct search feasible. Though heuris-
12

tic searches which avoid testing all configurations, such as greedy hill climbing [18], or simulated
annealing [16], can regain some ground by reducing search overhead and the penalty of executing
with suboptimal configurations, it is clear that new techniques are requiredwhich can significantly
reduce the search phase overhead of adaptive approaches.
To address this issue, we introduce an alternative to the direct search approach whereby config-
uration performance ispredicted, in order to reduce the required number of search phase iterations.
In our prediction scheme, each phase of parallel execution in the program needs to be executed
once for each layer of parallelism available in the system. Data collected during the execution of a
phase with a given configuration is used to make a prediction of the performance on other, untested
configurations at the same layer of parallelism. For example, on an SMT-based multiprocessor, this
approach works by first running one iteration of a phase with all threadson all SMT processors
active, to predict the optimal configuration in the innermost layer of parallelism, i.e. the number of
threads to use on each SMT processor for the specific phase. Once theruntime system identifies the
potentially optimal number of threads to use per SMT processor, a second execution of the same
phase is used to predict the optimal configuration for the outermost layer ofparallelism, i.e. the
optimal number of processors to use for the phase. Performance is predicted in the form of IPC by
using the IPC prediction technique described in Section 2. This strategy reduces the configuration
search phase to only as many iterations as the number of layers in the architecture, independently
of the total number of execution elements in the system. In so doing, the overhead of searching
can be significantly limited compared with exhaustive or heuristic search methods. The common
characteristic of our approach with previous ones however, is that it is based on the iterative nature
of the target applications. Each parallel phase needs to be executed morethan once for the runtime
system to achieve effective adaptation via prediction.
3.2 Performance-Centric Runtime Adaptation based on IPC-predictions
Following the offline training phase, the predictor has at its disposal a set of transfer functions for
the estimation of the IPC at each layer of the parallel architecture. Assuming asystem withnl
layers, the runtime IPC-driven adaptation process proceeds as follows:
The initial execution of each parallel region is ignored, in order to avoid any distortion of the
monitored hardware metrics values due to initialization and cache warmup effects.
13

The first set of transfer functions and the corresponding hardwaremetrics are used to predict the
IPC under all possible configurations of the processing elements at the innermost layer (layer 1) of
the architecture. The transfer function uses input from a test executionwith a base configuration.
That configuration, for layer 1, is equivalent to activating all processing elements, at all layers of the
system. Assuming a vector in which positioni corresponds to the number of processing elements
activated at layer i, the test configuration for layer 1 will be in the formcnlcnl−1...c2c1. The adaptive
algorithm then uses the data from the test execution as input to the appropriate transfer functions
to estimate the IPC when 1 ...c1−1 elements2 are activated at level 1. Following, it selects the
configuration that yields the highest estimated IPC as the preferred configuration for layer 1. Let’s
assume that this is the configuration that activatesp1 processing elements at layer 1.
The runtime proceeds layer by layer, identifying the optimal configuration ateach layer. Let’s
assume that the target layer isk. Another test execution of the parallel region is performed, this
time under the configurationcnlcnl−1...ckpk−1...p2p1. During the test execution, the runtime system
monitors the hardware events that have – during the training phase – been identified as optimal for
layer k if pk−1pk−2...p2p1 was the optimal configuration for layers 1, . . . ,k−1. The system then
uses the hardware metrics as inputs to the set of transfer functions that can be used for layerk
starting from a base configurationcnlcnl−1...ckpk−1...p2p1. The IPC prediction model estimates the
IPCs if 1,2, . . . ,ck processing elements are activated at layerk and selects for the specific layer the
configuration that results in the highest estimated IPC (pk).
Upon reaching layernl, the runtime system has come up with an estimated optimal configuration
for processing elements at all layers of the system (pnl pnl−1...p2p1). Figure 2 outlines the whole
process.
Note that the runtime system changes the set of monitored hardware metrics which are used
for prediction, as it proceeds through the process, taking into accountthe layer of parallelism for
which prediction is made, and the decisions made in earlier steps of the process. The number of trial
executions for each phase is limited to the number of layers of parallelism available in the system,
which is typically very small (2 or 3 on current systems). Similarly, the number of sets of hardware
events activated is also at most equal to the number of layers in the system. The total number of
2The IPC whenc1 elements are activated at layer 1 does not need to be estimated. It is the IPC observed during thetest execution.
14

execute phase, ignore performance counter samples of first execution;∀ layer l ,nl ≥ l ≥ 1 of parallelism from the innermost to the outermost{
config =cnlcnl−1...cl pl−1...p2p1;ES= EScon f ig;execute phase with configurationcon f igand record IPC
and set of performance countersES;predict number of processing elementspl to use at layerl for maximizing IPC;
}
Figure 2: Outline of steps of IPC prediction for each parallel execution phase.con f ig is the con-figuration of processing elements during the test execution for a specific layer. At layers lower thanthe current the identified as optimal number of processing elements is activated. All processingelements of higher layers are activated.EScon f ig denotes the preferred event set for the specificlayer (identified during the offline training phase), given the configurationdecisions already takenfor lower layers.
IPCs estimated by the predictor before reaching a decision for layeri (#Testsi) can be calculated
recursively using the following formula:
#Testsi = #Testsi−1 +ci −1 (7)
#Tests1 = c1−1 (8)
The number of IPC estimations required to reach a configuration decision for all layers of the system
is, thus, linear to the total number of processing elements in the system.
Another important observation is that the runtime system may change configurations (number
of processing elements at one or more layers) between adjacent phases, both during the prediction
process and during the decision actuation process. This dynamic reconfiguration of parallel phases
may yield better energy-efficiency by deactivating processors, but mayalso incur a non-negligible
performance penalty due to migration of working sets of threads between caches. We discuss this
issue in more depth during our experimental evaluation.
3.3 Design & Implementation Issues
3.3.1 Program Instrumentation
Our adaptation runtime system is based on the instrumentation of codes parallelized using
OpenMP [22]. In OpenMP codes, parallel regions are marked with directives to inform the com-
piler that a given section of code can be executed by multiple threads. We exploit this information
15

to perform adaptation at the granularity of these parallel regions, which we use as approximations
of program phases. Though performing adaptation on a loop-by-loop level would permit a more
accurate isolation and characterization of application phases, OpenMP disallows adjustment of the
number of threads within a parallel region.
Hooks to our power-performance adaptation runtime system are invoked upon entering or leav-
ing a parallel region, immediately after the work distribution code upon entry and before the syn-
chronization barrier before exit. The barrier is implicitly introduced by the OpenMP runtime. The
specific choice of instrumentation points limits performance data collection to the body of loops. If,
for example the barrier was to be included in the monitored section of code, theresulting hardware
event rates would be skewed by a potentially significant increase in elapsed clock cycles due to
threads waiting at the barrier and by the high-IPC stream of instructions issued while spin-waiting
– which is unrelated to the algorithm-specific computation.
call start region(1)!$omp parallel default(shared) private(i,j,k)call start loop()!$omp dodo k = 1, d(3)
do j = 1, d(2)do i = 1, d(1)
u1(i,j,k) = u0(i,j,k)*ex(t*indexmap(i,j,k))end do
end doend do!$omp end donowaitcall stop loop()!$omp barrier!$omp mastercall accumulate()!$omp end master!$omp end parallelcall stop region(1)
Figure 3: Example parallel region from the FT application of the NAS parallelbenchmarks suite.The additions/modifications to the code required to activate and use our adaptation runtime systemare shown in boldface.
Figure 3 depicts an example of a parallel region that has been modified to useour runtime sys-
tem for adaptation. Source code modifications are shown in boldface. Callsto start loop() and
stop loop() allow for the starting and stopping of the collection of execution time and performance
counters during the initialization phase. The functionaccumulate()simply tallies the data collected
for each thread once they have all synchronized. This function must becalled atomically by only
16

one thread. Finally,start region() andstop region() delimit the boundaries of parallel regions so
that bookkeeping information can be maintained during the adaptation phase and the identified as
optimal configurations can be enforced during later iterations. For parallel regions with multiple par-
allel loops within them, multiplestart loop()-stop loop()-accumulate()sequences can be chained
together within a single region. The formulaic structure of these calls makes instrumentation a sim-
ple process for users with no previous knowledge of the source code,as well as for automation via
a compiler.
3.3.2 Collecting Thread-Local Event Counts
To retrieve the values of the target hardware metrics from performance counters we use PACMAN
(PerformAnce Counters MANager), a custom-made library that provideslow-overhead access to
performance monitoring hardware. PACMAN uses lower-level substrates, such as Perfctr [24] on
Pentium processors, in order to gain privileged access to the configuration registers and counters of
hardware performance monitors.
Collection of hardware performance data is often a non-trivial exercise. This is especially true on
Intel Hyperthreaded processors, where several issues need to beaddressed. First, since monitoring
hardware is shared between the execution contexts on each processor, two co-executing threads
can never use the same counters or configuration registers. A simple strategy that Perfctr follows
in order to prevent this from happening is forcing all threads that use performance monitoring to
execute on the first execution context of each processor.
In order to monitor multithreaded programs using all available hardware contexts of each pro-
cessor, we have removed this limitation from Perfctr. PACMAN automatically andtransparently
controls the binding of threads to processors and selects non-conflictingconfigurations for threads
co-executing on the same processor. Furthermore, we have opted to usea thread binding scheme
which minimizes the cache distortion that occurs when the active configurationis changed. Specif-
ically, threads are assigned to fill each layer of parallelism before moving on to the next. For
example, one thread is first assigned to each processor. Once all processors have a thread, then
a second thread is bound to each processor on a different core than the first, and this continues
until each core of each processor has a thread to execute. Finally, on athree-layer system, each
unoccupied context is assigned a thread until all contexts are used. Thisbinding ensures that for
17

configuration changes that maintain a given number of active cores or processors, the maximum
number of threads will continue to execute on the same processor/core, thereby minimizing cache
distortion. When configuration changes that modify the number of processors occur, this binding is
recalculated.
Enabling thread-local event collection in Perfctr also allows the runtime system to collect event
counts at arbitrarily fine granularities. Thread-local counter collection thus surpasses the limitations
of global, system-wide counter collection, which requires root privilegesand allows the sampling of
counters with a maximum frequency equal to that of the OS timer (approximately 10 Hz for Linux).
3.3.3 Achieving Power Savings
The majority of the power saving opportunities exploited by our runtime system come through
control of the granularity of the program with the purpose of leaving one or more processors idle.
Modern processors employ clock-gating to limit power dissipation of functional units when they
are not being used. Beyond clock gating, additional savings can be achieved through transferring a
processor to a lower power state. Intel Pentium 4 processors, for example, accomplish this through
the use of the privilegedhlt instruction, which can lower power consumption from approximately
9W in the idle state to only 2W in the halted state. Though, due to privileges limitations,we can
not directly transition the processor to halted state from our adaptation library, when processors are
left idle the operating system typically moves them into the halted state within a very short time
interval. We have experimentally confirmed that processors are actually transitioned down to the
halted state for 85% of the time during which they are left idle, during adaptiveprogram executions
controlled by our runtime system.
3.3.4 Power Measurement and Estimation Methodologies
To incorporate energy awareness in a power-performance adaptationscheme, the runtime system
can use either estimations or direct measurements of system power consumption, at different op-
erating points. Direct measurements using, for example, multimeters connectedto the power sup-
ply lines and a digital connection to the system for data acquisition, are somewhat inflexible to
use, especially if the runtime system needs to track fine-grain phases for energy and performance
optimization. For example, most digital multimeters support sampling rates lower than100 Hz.
18

Such measurement methodologies are better suited for coarse-grained analysis of system power
consumption. Facing the limitations of real-time physical power measurement, several researchers
advocate the use of power estimation models, which use real-time feedback in the form of data at-
tained from performance monitoring counters [13, 29]. Such models provide accurate estimates of
power consumption on microprocessors, however they often require thesimultaneous monitoring
of more performance events than those supported by the hardware. As aresult, multiple executions
of the target code need to be performed, rotating the monitored events. Executing these rotations
at runtime is often unrealistic, especially if the power measurements need to be used as input for
power-performance adaptation. As a simpler alternative, a runtime system may apply a simple cal-
ibration methodology in which static power estimates for different configurations are used. The
static power estimates are collected through either actual or modeled power measurements obtained
during training runs.
We use separate methodologies for estimating and measuring power consumption in our run-
time system. For power measurements, we are using a model originally proposed by Isci and
Martonosi [13]. The model partitions a processor in components and associates an activity fac-
tor with each component. Each component is also associated with a maximum power consumption,
derived by multiplying the maximum power consumption of the entire processor with the percentage
of die area occupied by the specific component. Maximum power consumptionfor each component
is scaled down by the activity factor, which corresponds roughly to the percentage of execution
time during which the component is activated. Activity factors are calculated using hardware per-
formance monitoring counters. The actual power consumed by each component is calculated as
the sum of the maximum power scaled by the activity factor and a non-gated clock power of the
component. The non-gated clock power does not grow linearly with the activity factor. Total power
consumption on the processor is calculated by adding the power consumed ineach component to
a constant idle power consumed when the processor is inactive. Note thatour power measurement
and estimation methodologies calculate or predict power consumption by processors only. This is
still a significant fraction of total system power consumption, especially in CPU-intensive scientific
and engineering codes. In future work we intend to incorporate system-wide power measurements
in our models.
Using the aforementioned model for estimating power consumption across different program
19
configurations at runtime is unfortunately impractical. The model requires four rotations of sets of
hardware event counters to obtain a power estimate. Obtaining event counts from these rotations
would require four executions of each phase in the program, in addition to the executions used for
prediction. To solve this problem we reverted to a simpler runtime power estimationmethodology,
in which the power consumed with each configuration of active processors/threads per processor
is estimated as a fraction of the power consumed by all processors with one thread per processor
active. The scale factors for power consumption with different program configurations are derived
by calibrating power estimates obtained from Isci and Martonosi’s model, when applied to the
training set of benchmarks. Specifically, the average power consumptionof each configuration
during the static executions is normalized by the power consumption of the configuration with one
thread active on all processors and this normalized value is used as the power scaling coefficient for
each configuration.
3.3.5 Alternative Adaptation Criteria
The default behavior of our runtime adaptation process is to select the configuration with the highest
IPC for each region. This clearly has the potential to improve performanceas each region executes
with its optimal3 configuration. However, energy consumption can also be improved through this
technique because the application may be executed with fewer than the maximum number of pro-
cessors for portions of its execution and for a shorter total execution time.
While for many systems and applications, focusing primarily on performance isa logical de-
cision, in other cases an alternative, purely energy-centric metric may be amore appropriate tar-
get for optimization. By using the empirically determined scale factors as an estimation of the
power consumption for each configuration, our runtime system can derive predictions of purely
power-based-metrics and apply energy-centric optimality criteria during theadaptation phase. For
example, the relative energy consumption under different configurations can be approximated by
combining power scaling factors with CPI (1/IPC), using equation 9:
3Optimal in this context is the configuration that yields the highest IPC for a given program phase, while the programruns with that configuration statically throughout its lifetime. This definition of optimality is limited, since it does nottake into account the fact that the aforementioned static optimal point for aphase may shift due to interference anddependence with adjacent phases in the code, which are possibly executed under different configurations. In fact we haveexperimentally verified that such interference may account for up to 19% performance penalties. We intend to explorea more stringent definition of cross-phase, global optimality and adapt the runtime system to search for globally optimalpoints in future work.
20
Benchmark Number of Iterations Recurring Phases %time inrecurring phases
Target SetBT 200 5 99.58CG 15 5 92.45FT 6 5 90.54IS 10 1 84.34LU 250 3 99.95
LU-HP 250 11 99.83MG 4 6 90.01SP 400 9 99.71
Training SetUA 200 49 99.84
MM5 180 70 95.45
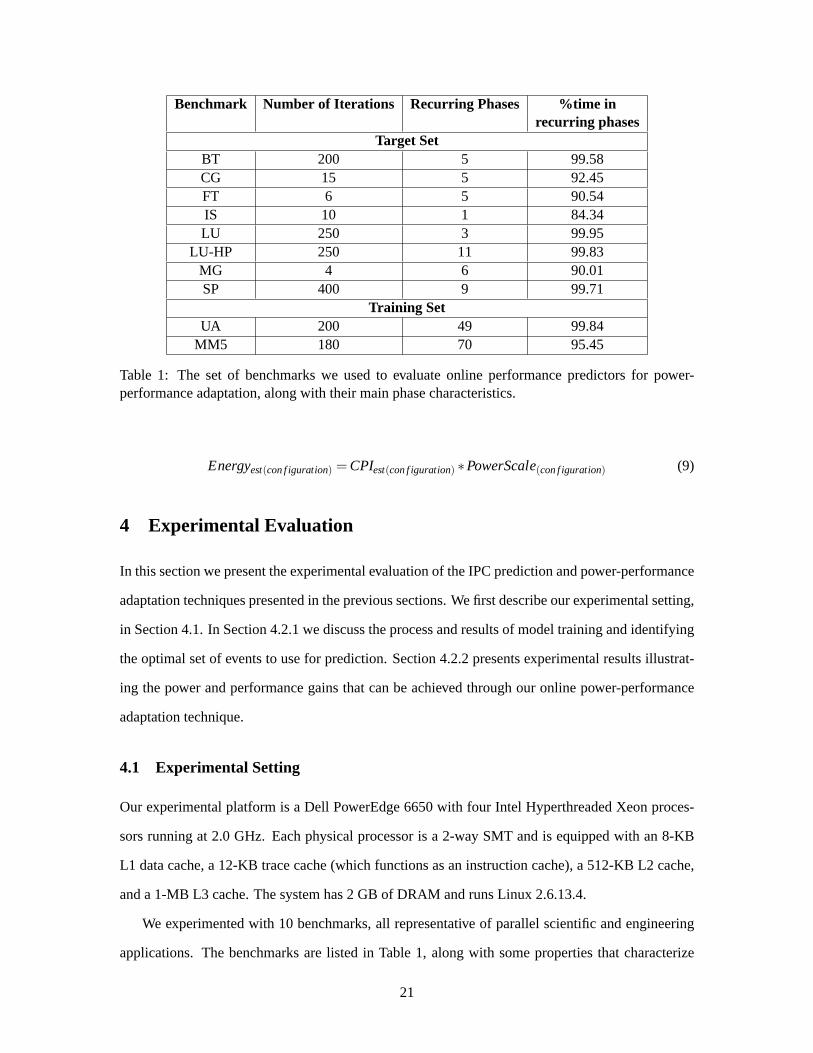
Table 1: The set of benchmarks we used to evaluate online performance predictors for power-performance adaptation, along with their main phase characteristics.
Energyest(con f iguration) = CPIest(con f iguration) ∗PowerScale(con f iguration) (9)
4 Experimental Evaluation
In this section we present the experimental evaluation of the IPC prediction and power-performance
adaptation techniques presented in the previous sections. We first describe our experimental setting,
in Section 4.1. In Section 4.2.1 we discuss the process and results of model training and identifying
the optimal set of events to use for prediction. Section 4.2.2 presents experimental results illustrat-
ing the power and performance gains that can be achieved through our online power-performance
adaptation technique.
4.1 Experimental Setting
Our experimental platform is a Dell PowerEdge 6650 with four Intel Hyperthreaded Xeon proces-
sors running at 2.0 GHz. Each physical processor is a 2-way SMT andis equipped with an 8-KB
L1 data cache, a 12-KB trace cache (which functions as an instruction cache), a 512-KB L2 cache,
and a 1-MB L3 cache. The system has 2 GB of DRAM and runs Linux 2.6.13.4.
We experimented with 10 benchmarks, all representative of parallel scientific and engineering
applications. The benchmarks are listed in Table 1, along with some propertiesthat characterize
21

their structure and phase behavior. These properties include the numberof iterations that the main
body of the computation is executed for in each benchmark, the number of discrete parallel execu-
tion phases in each benchmark, and the number of recurring parallel execution phases. The latter
are the ones that offer opportunities for achieving better energy-efficiency through runtime concur-
rency control and adaptation. Listed in the table is also the percentage of execution time that each
benchmark spends in recurring parallel execution phases. This percentage illustrates the fraction of
execution that can be optimized for better energy-efficiency, in accordance with of Amdahl’s law.
The benchmarks include an interesting spectrum of targets for the runtime system, including
benchmarks with very few iterations (MG, FT, CG and IS), in which direct search strategies of
thread granularities and mappings may consume a large fraction of executiontime or even be infea-
sible, and benchmarks with many iterations (BT, LU, LU-HP, SP), in which direct search methods
have ample opportunities to reach a seemingly optimal operating point and presumably outperform
prediction-based approaches, since the latter are always prone to inaccuracies in predicting the best
configuration for each phase.
Two out of the 10 benchmarks (UA and MM5) are used to train our predictors. The choice of
these benchmarks as a training set stems from the fact that they have a large number of parallel
execution phases in which thread granularity, performance and scalability(in terms of absolute IPC
and IPC gain from increasing numbers of threads) vary enough to cover a wide variety of cases
encountered in real applications. More specifically, single-thread IPC ranges from 0.121 to 1.388 in
UA and from 0.047 to 0.823 in MM5. The maximum multithreaded IPC ranges from0.223 to 3.922
in UA and from 0.051 to 3.270 in MM5. The range of maximum to minimum IPC ratios varies from
1.109 to 5.253 in UA and from 1.099 to 6.983 in MM5. Ranges around 1 indicateno scalability due
to multiprocessing or simultaneous multithreading, where ranges over 4 indicatescalability due to
both multiprocessing across processors and simultaneous multithreading withinprocessors.
We evaluate runtime predictors using two metrics. The first metric is direct and measures the
absolute IPC prediction accuracy, calculated by comparing estimated IPC to observed IPC in static
executions of the benchmarks in the target set, using all possible combinationsof processors and
threads per processor. The second and more important metric for runtime predictors indicates
whether the predictor can locate optimal operating points in a program. This metric is more im-
portant because even if absolute IPC prediction accuracy is not good,if the relative ranking of
22
configurations derived from IPC predictions matches the ranking of configurations derived from the
actual measured IPCs, the predictor will still be effective.
The metric that we use to evaluate the effectiveness of each predictor in locating optimal op-
erating points is the percentage of execution time during which the runtime system,driven by the
predictor, configures the program to run with astatically optimalconfiguration. We define thestat-
ically optimalconfiguration for each phase as the configuration with which the phase achieves the
highest IPC, assuming that the entire code is executed under the same configuration. An additional
criterion we use to evaluate predictor effectiveness in the same context is the performance penalty
of misprediction. This is the actual performance loss incurred in a phase, whenever the predictor
reaches a different decision than the statically optimal configuration. The performance penalty is
calculated by comparing the IPC of the phase with the predicted configurationagainst the IPC of
the same phase measured offline with the statically optimal configuration.
Note that the statically optimal configuration of each phase may or may not be theglobally
optimal configuration, when the phase is executed in an adaptive programwith dynamically vary-
ing concurrency. IPC in each phase depends non-trivially on the configuration of other adjacent
phases in the code and theoretically, positive or negative interference between dynamically config-
ured phases may result in a globally optimal IPC which is higher or lower than the statically optimal
IPC for a phase. The globally optimal IPC and the corresponding configuration would be the most
appropriate metrics to compare against our predictions. However, calculating the globally optimal
IPC through a brute-force approach is not trivial. It requires executing a number of experiments
which is exponential to the number of phases. We plan to explore this issue further in future work.
We weigh performance penalty with the contribution of each region to the total execution time
of each benchmark to derive a single penalty metric. It is important to point out that even if the pre-
dictor misses the optimal operating point, it may still execute a phase with an efficient configuration.
The predictor may choose an operating point which is “close” to the optimal, both configuration-
and performance-wise.
23

4.2 Experimental Results
4.2.1 Selecting Events for Prediction & Model Training
In order to locate the optimal set of hardware events to use for performance prediction, we first
executed all benchmarks in the training set with all possible static configurations and as many times
as the rotations of hardware counters needed to collect samples of all hardware events available
by the Intel Pentium 4 hardware performance monitoring unit. The performance monitoring unit
of the Pentium 4 allows for the collection of up to 18 events simultaneously in 18 registers. On
Hyperthreaded processors however, the performance monitoring registers are shared between two
threads, therefore the number of events recordable per-thread is limited to9.
The Pentium 4 allows flags to be passed to each of the 40 events that utilize onlyone perfor-
mance register. These flags further specify the events to be recorded.For example, a flag is used
to differentiate between recording all L2 cache accesses and only recording L2 misses. For the
events that allow such a parameter, we selected the single parameter which yields the event intu-
itively expected to have a significant impact on performance. We executedeach benchmark in both
the training and the target set, with each of the 8 possible static configurations(using one to four
processors, with one or two Hyperthreads per processor), 8 times to collect all 40 events. The rea-
son why more than the expected minimum (5) number of iterations are required tocollect the 40
events with 9 registers per thread, is conflicts between events that can be measured only in specific
combinations of registers.
Following the collection of event counts of all hardware events for each region of each bench-
mark in the training set, we analyzed the data to determine which event rates were typically close
to 0, and as a result would not be useful in predicting performance. We identified 13 such events
and removed them from further consideration. The total number of valid combinations of the 27
events that survived pruning is 99,372. This combination space is considerably smaller than all
combinations of 27 events in groups of 9 or fewer.
We next performed the linear regression and generated the transfer functions for all possible
transitions from base (test) to target configurations, following the process discussed in Section 2.
For each of the possible transitions we evaluated the effectiveness of each of the 99,372 sets of
events.
24

As a final step, we evaluated the top 1000 performing (in terms of predicted IPC error) sets of
events for each predictor, with IPC bucket divisions from 0.0 to 4.0 at intervals of 0.1, to find the
best performing division of loops in 2 IPC buckets.
Predictor (4,2)->(4,1) (4,2)->(*,2) (4,1)->(*,1)Event0 Instructions Retired Instructions Retired Instructions RetiredEvent1 Retired Branches1 Bus Accesses Bus AccessesEvent2 Retired Branches2 L2 Cache Misses L2 Cache MissesEvent3 Trace Cache Misses Trace Cache MissesTrace Cache MissesEvent4 WC Buffer Evictions UOP Queue Writes Retired BranchesEvent5 Packed SP UOPs Packed SP UOPs Packed SP UOPsEvent6 Stall Cycles Split Loads/Stores Split LoadsEvent7 Pipeline Flushes Pipeline Flushes
Table 2: The Intel Pentium 4 hardware events resulting in the highest prediction accuracy for eachpredictor on our experimental platform.
In the following discussion, configuration(nproc,nthr/proc) denotes a configuration withnproc
processors andnthr/proc threads per processor. As outlined in Section 2, in the first step of the pre-
diction process our runtime system uses input from a test execution of each phase with configuration
(4,2) to predict whether to use one or two Hyperthreads per processor(i.e. select between config-
uration (4,2) and configuration (4,1)). The predictor for the IPC of configuration (4,1), starting
from a test execution with configuration (4,2), achieves an average prediction accuracy of 89.19%.
Through the additional use of two IPC buckets, the accuracy improves to 89.49%, with a bucket
threshold atIPC = 1.5. The set of events used in this predictor are listed in the second column of
Table 2.
In the second step of the prediction process, our runtime system uses input from a test execution
with the configuration decided upon in the first step, to predict how many processors to activate
in the system. In the event that the first step predicts that 2 Hyperthreads per processor should be
activated, configuration (4,2) is used to predict the IPC of configuration(*,2), where * is between
1 and 4 in our experimental platform. The prediction accuracy without buckets using data from
test executions under configuration (4,2) to predict configurations (*,2) is 86.20%. The accuracy
improves to 87.57% with a bucket threshold atIPC = 1.2. Similarly, when predicting configuration
(*,1) with input from a test execution under configuration (4,1), the prediction accuracy is 87.87%
and 89.23%, without and with buckets respectively. The sets of hardware counters that provided
25

the highest prediction accuracy in these two cases are outlined in the third and fourth columns of
Table 2. It is interesting to note that only two events differ between the eventsets used for the
(4,2)->(*,2) and the (4,1)->(*,1) predictors.
Our runtime prediction model requires one test iteration of each phase per architectural layer of
the machine. An alternative incurring less overhead would be to simply use one test configuration of
each phase to make predictions along all layers of the machine. To evaluate the possibility of such
a prediction scheme, we have considered the prediction accuracy of using the (4,2) configuration to
predict the IPCs of all other configurations. In the best case, using anIPC bucket division at 1.3,
the prediction accuracy of this simplified predictor is 84.91%. While the attained accuracy is still
fairly high, we do not believe the reduction in initialization iterations by a mere two inthe case of
a multicore-multithreaded SMP, and one in the case of a multithreaded SMP system,justifies even
this loss of accuracy compared to using layer-specific predictors.
% Parallel exec time Weighted performance lossw/ opt pred in mispred regions
BT 60.96 4.38CG 99.05 0.58FT 100 0IS 100 0LU 74.75 3.52
LU-HP 32.84 0.47MG 55.63 0.18SP 29.81 5.17
AVG 69.13 1.79
Table 3: Configuration prediction accuracy of our model. The second column in the table givesthe amount of parallel execution time during which the application is adaptively executed with thestatically optimal configuration, which is discovered from static executions withno configurationchanges across phases. The third column shows the weighted performance loss incurred when thepredictor mispredicts the optimal configuration.
Table 3 shows the time each benchmark spends executing under the statically optimal configura-
tion of each phase – which is discovered via static offline executions – whenrun dynamically, using
prediction-based power-performance adaptation. These results showthat six of the eight applica-
tions spend the majority of their execution time in the optimal configuration and for three of them
theoptimal configuration prediction accuracyis at or quite close to 100% (CG, FT, IS). Overall, the
weighted mean accuracy is 69.13%. One important issue to address is the impact on performance
26

BT
0
50
100
150
200
250
300
350
(1,1
)
(1,2
)
(2,1
)
(2,2
)
(3,1
)
(3,2
)
(4,1
)
(4,2
)
Exh
Heu
r
Pr
Pr
E
Static Configuration (CPUs, Threads/CPU)
Exe
cuti
on
Tim
e (s
ec)
Adaptation Strategy
CG
0
2
4
6
8
10
12
14
16
18
(1,1
)
(1,2
)
(2,1
)
(2,2
)
(3,1
)
(3,2
)
(4,1
)
(4,2
)
Exh
Heu
r
Pr
Pr
E
Static Configuration (CPUs, Threads/CPU)
Exe
cuti
on
Tim
e (s
ec)
Adaptation Strategy
FT
0
5
10
15
20
25
(1,1
)
(1,2
)
(2,1
)
(2,2
)
(3,1
)
(3,2
)
(4,1
)
(4,2
)
Exh
Heu
r
Pr
Pr
E
Static Configuration (CPUs, Threads/CPU)
Exe
cuti
on
Tim
e (s
ec)
Adaptation Strategy
IS
0
1
2
3
4
5
6
7
(1,1
)
(1,2
)
(2,1
)
(2,2
)
(3,1
)
(3,2
)
(4,1
)
(4,2
)
Exh
Heu
r
Pr
Pr
EStatic Configuration (CPUs, Threads/CPU)
Exe
cuti
on
Tim
e (s
ec)
Adaptation Strategy
LU
0
50
100
150
200
250
300
350
400
450
(1,1
)
(1,2
)
(2,1
)
(2,2
)
(3,1
)
(3,2
)
(4,1
)
(4,2
)
Exh
Heu
r
Pr
Pr
E
Static Configuration (CPUs, Threads/CPU)
Exe
cuti
on
Tim
e (s
ec)
Adaptation Strategy
LU-HP
050
100
150200250300
350400450
(1,1
)
(1,2
)
(2,1
)
(2,2
)
(3,1
)
(3,2
)
(4,1
)
(4,2
)
Exh
Heu
r
Pr
Pr
E
Static Configuration (CPUs, Threads/CPU)
Exe
cuti
on
Tim
e (s
ec)
Adaptation Strategy
MG
0
5
10
15
20
25
(1,1
)
(1,2
)
(2,1
)
(2,2
)
(3,1
)
(3,2
)
(4,1
)
(4,2
)
Exh
Heu
r
Pr
Pr
E
Static Configuration (CPUs, Threads/CPU)
Exe
cuti
on
Tim
e (s
ec)
Adaptation Strategy
SP
0
50
100
150
200
250
300
350
(1,1
)
(1,2
)
(2,1
)
(2,2
)
(3,1
)
(3,2
)
(4,1
)
(4,2
)
Exh
Heu
r
Pr
Pr
E
Static Configuration (CPUs, Threads/CPU)
Exe
cuti
on
Tim
e (s
ec)
Adaptation Strategy
Figure 4: Execution time of the benchmarks under the 8 different static configurations (left side ofeach graph) and the 4 dynamic adaptation strategies (right side of each graph). The best performingstatic configuration for each application is marked with striped bars.
when a suboptimal configuration is predicted. Table 3 also shows the weighted performance loss
observed for each benchmark during mispredicted phases. This value iscalculated as∑NBi=1wi ×Di ,
whereNB is the number of mispredicted regions in benchmarkB, wi is the weight of each mispre-
dicted region expressed as the percentage of the total parallel executiontime of B that the specific
region accounts for, andDi is the absolute performance penalty suffered by the mispredicted region
i. The average penalty is only 1.79%. Even when our adaptive strategy fails to identify the optimal
configuration, it manages to identify similar configurations. Thus, the mispredictions have a rela-
tively small effect on performance. This characteristic can also be attributed to the high absolute
accuracy of the IPC predictor.
4.2.2 Evaluation of Online Power-Performance Adaptation using IPC Prediction
The experimental results that illustrate the power-performance opportunities and capabilities of our
runtime system are summarized in Figure 4 and Figure 5. Figure 4 illustrates execution times of all
static configurations of the targeted benchmarks on our experimental platforms, as well as with four
adaptive execution strategies which will be discussed in the following paragraphs. Static executions
maintain a steady configuration across phases and throughout the execution of the benchmarks.
27

Figure 5 illustrates energy consumption (E) and two other popular power-efficiency metrics, namely
energy∗delay(ED), andenergy∗delay2 (ED2). The charts depict these energy-related metrics for
all four adaptive execution strategies considered, normalized to the values of the respective metrics
of the static execution with configuration (4,2). The latter would be the naturalchoice of a user
executing on our experimental platform. Figure 5 also depicts the energy-related metrics for the
optimal static configuration with respect toE, ED andED2, i.e. the respective metrics for the static
configuration which yields the lowest energy,energy∗ delayandenergy∗ delay2 respectively, in
each benchmark.
Figure 4 shows that the optimal static configuration varies from benchmark to benchmark. For
four applications, the lowest execution time is achieved with configuration (4,2), however three
applications execute optimally statically, with configuration (4,1). One benchmark (IS) executes
optimally statically with configuration (3,1).
Variability in optimal configuration occurs extensively at the phase level within applications as
well. Therefore, it is possible to adjust the execution configuration at runtime to systematically use
the optimal configuration for each phase, and in so doing to attain performance improvements. In
the cases where the optimal configuration for a phase occurs on fewer than the total processors,
power consumption savings – beyond the reduction in execution time – can be observed. The
goal of our adaptation approach is to exploit this potential within parallel applications at runtime,
without a priori knowledge of program execution characteristics, in order to achieve bothpower
and performance benefits.
The most straightforward adaptive strategy is to exhaustively search theconfiguration space and
simply select the configuration with the best performance. We have implementedand evaluated such
an approach and the execution time and energy-related results are shownin Figure 4 and 5 under
labelEXH. Clearly, exhaustive search suffers from excessive overhead during its initialization phase
as it results, on average, in a 4.6% slowdown compared to statically executingwith configuration
(4,2). Furthermore, it is 19.2% slower on average than the optimal static configurations of the
benchmarks. Despite the increased execution time, the approach is able to locate opportunities to
deactivate processors and results in a 7.3% average reduction in energy consumption across the
benchmarks (Figure 5). However, as a result of the substantial increase in execution time and the
modest decrease in energy consumption, theED2 of EXH goes up by 9.6% compared to the static
28

BT
0
0.5
1
1.5
2
2.5
Energy ED ED2Evaluation Metric
Rat
io
CG
0
0.5
1
1.5
2
2.5
Energy ED ED2Evaluation Metric
Rat
io
FT
0
0.2
0.4
0.6
0.8
1
1.2
Energy ED ED2Evaluation Metric
Rat
io
IS
0
0.1
0.2
0.3
0.4
0.5
0.6
0.7
0.8
0.9
1
Energy ED ED2Evaluation Metric
Rat
io
LU
0
0.5
1
1.5
2
2.5
3
Energy ED ED2Evaluation Metric
Rat
io
Exh
HPPATCH
Pr
Pr E
St Opt
3.79 13.14LU-HP
0
0.5
1
1.5
2
2.5
3
3.5
4
Energy ED ED2Evaluation Metric
Rat
io
6.18
MG
0
0.2
0.4
0.6
0.8
1
1.2
1.4
1.6
1.8
2
Energy ED ED2Evaluation Metric
Rat
io
SP
0
0.5
1
1.5
2
2.5
3
3.5
4
4.5
Energy ED ED2Evaluation Metric
Rat
io
AVERAGE
0
0.2
0.4
0.6
0.8
1
1.2
1.4
1.6
1.8
2
Energy ED ED2Evaluation Metric
Rat
io
3.73
Figure 5: Performance of the dynamic adaptation strategies in terms of energy (first group of bars),energy*delay (second group of bars) and energy*delay2 (third group of bars). Each group of barshas been normalized with respect to the performance of the (4processors/2 threads per processor)static configuration for the respective metric. The rightmost bar in each group corresponds to theoptimal static execution for the respective metric.
execution with configuration (4,2). The exhaustive search strategy performs poorly in CG, from
both a performance and a power-performance perspective.
In order to reduce the search overhead of the exhaustive search approach, we have – in previous
work – introduced a hill-climbing, search-based heuristic technique calledHPPATCH[5]. Rather
than testing every possible configuration in the search space,HPPATCH works at one layer of
parallelism at a time. First, it attempts to find the optimal number of processors to use by testing all
processors with all cores and threads active. It continues to try fewerprocessors until an increase in
execution time is observed by deactivating an additional processor. The lowest number of processors
that results in a decrease in execution time is used throughout the execution of each phase. This
search process is then repeated on the given number of processors todetermine the number of cores
per processor and then the number of threads per core.HPPATCHhas the potential to significantly
reduce the number of required search iterations, and therefore search overhead, compared to the
exhaustive search approach. However, like most hill-climbing heuristics,HPPATCHcan get trapped
29

Config (1,1) (1,2) (2,1) (2,2) (3,1) (3,2) (4,1) (4,2)Power 0.31 0.33 0.53 0.57 0.77 0.80 1.0 1.03
Table 4: Power scaling coefficients used to approximate the expected cumulativepower consumption of all processors of our experimental platform, under different(nproc,nthr/proc) configurations. Power is normalized with respect to the consumption inthe (4processors/ 1 thread per processor) configuration.
in a local minimum in execution time and may fail to find the truly optimal configuration for a given
phase.
UsingHPPATCHon our system results in an average reduction in execution time of 5.0% com-
pared to statically using eight threads. When combined with the 8.4% reduction inenergy con-
sumption, this approach reducesED2 by 11.6% andED by a similar margin. Even compared to
the fastest static execution, HPPATCH is only 8.7% slower. Despite the reduction in the number of
search iterations, the initialization phase is associated with a non-negligible overhead, especially for
applications with too few outermost loop iterations to amortize the startup cost.
Through the use of IPC prediction (labeledPr in the charts), the length of the search phase is
reduced to only three iterations in the case of a 3-layer system and two in a 2-layer system, while
still selecting optimal or nearly optimal configurations for each phase. When compared to the (4,2)
configuration, prediction-based adaptivity results in an average 10.2% reduction in execution time.
In fact, this strategy comes within an average of 1.2% of the optimal static execution, without requir-
ing prior knowledge of the characteristics of applications. This approachalso results in 13.6% and
5.8% performance improvements over exhaustive search andHPPATCH, respectively. As shown
in Figure 5, prediction-based adaptation performs well by energy-centric standards as well. Specif-
ically, there is an 11.7% average reduction in energy consumption. Because of the reduction in
execution time along with the exploitation of opportunities to deactivate processors, a significant
22.6% reduction inED2 occurs using this method. Moreover, theED2 of adaptive executions with
our runtime system are within 12.4% of theED2-optimal static execution.
We also implemented an extension to the IPC prediction-based adaptation, where the IPC pre-
diction is used to estimate the energy consumption of various configurations at runtime. The adap-
tation is then performed directly targeting energy minimization. Table 4 outlines the power scaling
factors for each configuration, which are used in equation 9 to predict energy consumption. The
results attained using an energy-centric adaptive strategy (labeledPrE in the charts) show a clear
30

advantage for pure IPC-based adaptation, especially for high-performance computing applications.
While this approach is able to reduce the average energy consumption by 4.1% compared to static
executions with configuration (4,2), the energy consumption of the energy-conscious adaptation
mechanism is higher than that of the performance-oriented adaptation mechanism. Furthermore,
the 66.7% increase in execution time experienced through the use of this mechanism outweighs
the benefits of potential energy savings for performance-sensitive users. The energy-centric adapta-
tion strategy tries to reduce power consumption by aggressively deactivating processors. However,
extensive processor deactivation usually come at the expense of performance. Moreover, the in-
crease in execution time limits the benefits of execution at a reduced power configuration if energy
consumption is used as a metric. Clearly, the unacceptable performance lossassociated with this
approach makes it inappropriate for use in high-performance computing domains.
5 Related Work
Most of the earlier research efforts which successfully used feedback from hardware counters to
optimize programs, applied profile-guided offline, rather than online optimization. Recent exam-
ples of such efforts include hardware-assisted page placement for NUMA multiprocessors [20], the
continuous program optimization prototype of IBM, which has been deployed to optimize the man-
agement of variable page-size systems [3], and some application-specificcase studies [2]. On the
contrary, using hardware event counters to achieve live, online optimization of a system component
as the system operates is not as well explored in the literature. In particular,few studies have de-
ployed online optimization driven from hardware event counters on realhardware. Some notable
contributions in this area are the hardware performance monitor-driven job schedulers for SMT pro-
cessors proposed by Moseley et. al [21] and Settle et. al [25], and theADORE system from the
University of Minnesota [19]. ADORE optimizes register allocation, data cache prefetching and
data layout on-the-fly on Itanium processors using input from Perfmon[8], a hardware performance
monitor for the specific architecture. Our work falls into the category of online dynamic optimiza-
tion with feedback from hardware counters, however it targets energyconsumption, in addition to
performance.
Offline performance prediction for parallel programs is a mature area of research, and its cov-
31

erage is beyond the scope of this paper. The prediction techniques discussed in this paper bare
similarities with offline performance prediction techniques that utilize partial execution [30], as
well as with statistical simulation of superscalar processors using IPC prediction with input from
very short code samples [7]. To our knowledge, no prior work has considered online predictors of
parallel execution performance on shared-memory architectures, usingruntime input on IPC and
hardware event rates. This work overall provides ample opportunities for further research in the
area of online performance prediction and optimization.
The high-performance computing community has only recently emphasized the issue of con-
straining power consumption without compromising performance. Efforts in this front include the
building of power-scalable and power-efficient clusters such as Green Destiny [10, 28] and Blue
Gene/L [9], which are both built from low-power processors, as well as the implementation of
runtime systems for dynamic voltage and frequency scaling of processorsin message-passing ap-
plications [11, 15]. The latter research efforts in the area of runtime systems relate to the work
presented in this paper, in that both attempt to achieve maximal power savings without compro-
mising the performance of parallel programs, and both attempt to exploit inherent properties of the
program (such as phases with limited scalability and processor idling at communication points) to
achieve power savings. Our work differs in that it is applied in the contextof shared-memory rather
than distributed memory multiprocessors, and it optimizes code phases with granularities which are
significantly finer than the granularities at which voltage and frequency scaling can reliably operate.
Furthermore, our work is immediately deployable in all kinds of emerging multithreaded processors,
including SMT processors, multicore processors, multi-SMT processorsand multiprocessors built
from multithreaded processor components, whereas techniques based on DVFS still face some hard
technological constraints for being deployed on a thread-by-thread basis in multicore chips [17].
Thread-level concurrency control for more efficient execution of multithreaded codes has been
proposed and implemented in several research prototypes and vendor implementations of runtime
systems for parallel programming on shared memory multiprocessors. More specifically, thread-
level control enables more efficient adaptive execution of multithreaded programs in multiprogram-
ming environments [1, 26, 31], as well as more efficient executions of standalone programs with
varying concurrency and scalability characteristics across differentphases of their code [12, 32].
Typically, the programmer, the runtime system or the compiler can set the desired level of concur-
32

rency for each parallelized region of the program independently. Although mechanisms for concur-
rency control have been at the disposal of programmers for severalyears, most real implementations
lack the necessary support for autonomic, concurrency management-related decision control from
within the runtime system. In some implementations the compiler uses a simple threshold-based
strategy and either serializes parallel code, or executes it with a fixed number of threads requested
by the programmer [12, 27]. Our contribution in this context is a fully autonomicdecision control
scheme for concurrency management, utilizing hardware event countersfor performance prediction.
More recently, researchers in the computer architecture community considered search algo-
rithms for autonomic adaptation of concurrency and frequency/voltage ofprocessing cores in chip
multiprocessors [18]. This research has similar motivating factors with our work, i.e. reducing
power consumption while sustaining a certain quality of service in terms of performance. There are
four major differences between our research and the work in [18]. First, we do not consider fre-
quency and voltage scaling, partially due to the premature stages of development of this technique
on multithreaded architectures. Second, we deploy our framework on a real system instead of a sim-
ulated system. More importantly, our work takes into consideration all the overhead required for
collecting, analyzing and predicting performance and power characteristics of the program through
hardware counters, as well as the overhead (both explicit due to scheduling and implicit due to
cache distortion) of the dynamic reconfiguration of the number and placement of threads at runtime.
The third difference is that instead of search algorithms that time different configurations to reach
an optimal decision, our work uses direct prediction with more detailed input –including time and
extensive information from hardware performance counters– from a much more limited number of
polled configurations. Our results show that even if the search algorithms use heuristics such as hill
climbing and simulated annealing, their overhead may be an obstacle towards effective adaptation
of short-lived codes. The fourth major difference between our research and work in [18] is that
we do not set a specific performance target and tune our adaptation process based on the target.
On the contrary, our runtime system searches autonomously for the best possible performance un-
der the least possible energy consumption, for a given program with recurring parallel execution
phases. Furthermore, in contrast with [18] our approach does not require artificial lengthening of
the program to actuate adaptation.
33

6 Conclusions
The performance and power characteristics of layered shared-memorymultiprocessors built from
multicore and multithreaded components provide strong motivation for injecting autonomic power-
aware and performance-aware execution capabilities in parallel programs. A major challenge in
the implementation of such capabilities is that adaptation, along with the collection andanalysis of
the necessary information for selecting target code configurations, needs to happen as the program
executes.
This paper argues that effective runtime adaptation capabilities on layeredmultiprocessors are
enabled by the use of hardware event counters and linear performance models derived from these
counters. The runtime system can collect sets of event rates with relativelylow overhead at runtime,
and use these event rates to characterize performance and scalability ofa given code fragment.
Hardware counters unravel complex interactions between hardware and concurrent software, while
enabling performance characterization and optimization at fine time granularities and in response to
inherent workload characteristics, such as concurrency and resource usage patterns.
We have presented an autonomic runtime adaptation system based on performance and scala-
bility predictions collected at runtime from hardware event counters. The objective of our system
is the seamless integration of simultaneous performance and power optimization inmultithreaded
codes, via the use of autonomic control of granularity and thread placement in parallel regions. We
have outlined statistical methods for selecting and combining event sets that accurately characterize
performance and scalability and we have provided concrete prediction models and adaptation mech-
anisms for layered architectures built from multithreaded processors. Wehave also demonstrated a
prototype of our system on a two-layer multiprocessor with SMT processors and have shown ex-
perimentally that our runtime system achieves its purpose (simultaneous powerand performance
improvements), compared to the commonly used execution strategies that strivefor maximizing
concurrency. Furthermore, our runtime system overcomes the limitations of search algorithms in
locating good operating points in programs with infrequently recurring phases.
Although our runtime system provides strong proof of the concept of hardware profile-driven
autonomic adaptation, our work creates ample room and opportunities for further research in the
area. The energy-efficiency of our prediction-based adaptation model fares well against static opti-
34

mal executions – i.e. executions that use a persistent static configuration in all phases of the program,
that is known to be the most energy-efficient among all similar static configurations a priori – but it
does not necessarily fare equally well against dynamically optimal executions – i.e. an oracle-driven
execution that finds the globally optimal combination of configurations of phases that yields the best
performance or energy-efficiency. We believe that achieving the latter goal requires significant ef-
fort and innovation in both the statistical prediction models and in the algorithms used to reach
optimal cross-phase configuration predictions. We also intend to explore adaptation in codes with
non-iterative structure, such as task-level parallel codes and codeswith irregular phase behavior in
the near future.
Acknowledgments
This research is supported by the National Science Foundation (Grants CCR-0346867 and ACI-
0312980), the U.S. Department of Energy (Grant DE-FG02-05ER2568) and an equipment grant
from the College of William and Mary.
References
[1] T. Anderson, B. Bershad, E. Lazowska, and H. Levy. Scheduler Activations: Effective KernelSupport for the User-Level Management of Parallelism.ACM Transactions on ComputerSystems, 10(1):53–79, February 1992.
[2] U. Andersoon and P. Mucci. Analysis and Optimization of Yee Bench using Hardware Perfor-mance Counters. InProc. of the ParCo 2005 Conference, Malaga, Spain, September 2005.
[3] C. Cascaval, E. Duesterwald, P. Sweeney, and R. Wisniewski. Multiple Page Size Modelingand Optimization. InProc. of the 14th International Conference on Parallel Architectures andCompilation Techniques, pages 339–349, Saint Louis, MO, September 2005.
[4] M. Curtis-Maury, J. Dzierwa, C. Antonopoulos, and D. Nikolopoulos. Online Power-Performance Adaptation of Multithreaded Programs using Hardware Event-Based Prediction.In Proc. of the 20th ACM International Conference on Supercomputing, Queensland, Aus-tralia, June 2006.
[5] M. Curtis-Maury, J. Dzierwa, C. Antonopoulos, and D. Nikolopoulos. Online Strategies forHigh-Performance Power-Aware Thread Execution on Emerging Multiprocessors. InProc. ofthe Second Workshop on High-Performance Power-Aware Computing, Rhodes, Greece, April2006.
35

[6] A. Duran, M. Gonzalez, and J. Corbalan. Automatic Thread Distribution for Nested Paral-lelism in OpenMP. InProc. of the 19th ACM International Conference on Supercomputing,pages 121–130, Cambridge, MA, jun 2005.
[7] L. Eeckhout, S. Nussbaum, J. Smith, and K. De Bosschere. StatisticalSimulation: AddingEfficiency to the Computer Designer’s Toolbox.IEEE Micro, 23(5):26–38, September 2003.
[8] S. Eranian. The Perfmon2 Interface Specification. Technical Report HPL-2004-200R1, HPLabs, February 2005.
[9] N. Adiga et.al. An Overview of the BlueGene/L Supercomputer. InProc. of the IEEE/ACM Su-percomputing’2002: High Performance Networking and Computing Conference, Baltimore,MD, November 2002.
[10] W. Feng and C. Hsu. The Origin and Evolution of Green Destiny. InProc. of IEEE CoolChips VII: An International Symposium on Low Power and High Speed Chips, Yokohama,Japan, April 2004.
[11] V. Freeh, D. Lowenthal, F. Pan, and N. Kappiah. Using Multiple Energy Gears in MPI Pro-grams on a Power-Scalable Cluster. InProceedings of the 2005 ACM SIGPLAN Symposiumon Principles and Practices of Parallel Programming (PPoPP’05), June 2005.
[12] M. Hall and M. Martonosi. Adaptive Parallelism in Compiler-ParallelizedCode. Stanford,California, August 1997.
[13] C. Isci and M. Martonosi. Runtime Power Monitoring in High-End Processors: Methodologyand Empirical Data. InProc. of the 26th ACM/IEEE Annual International Symposium onMicroarchitecture, pages 93–104, San Diego, CA, November 2003.
[14] C. Jung, D. Lim, J. Lee, and S. Han. Adaptive Execution Techniques for SMT MultiprocessorArchitectures. InProc. of the Tenth ACM SIGPLAN Symposium on Principles and Practice ofParallel Programming, pages 236–246, Chicago, IL, June 2005.
[15] N. Kappiah, V. Freeh, and D. Lowenthal. Just In Time Dynamic Voltage Scaling: Exploit-ing Inter-Node Slack to Save Energy in MPI Programs. InProc. of IEEE/ACM Supercom-puting’2005: High Performance Computing, Networking Storage, and Analysis Conference,Seattle, WA, November 2005.
[16] S. Kirkpatrick, C. Gelatt, and M. Vecchi. Optimization by Simulated Annealing. Science,220(4598):671–680, 1983.
[17] J. Li and J. Martınez. Power-performance implications of thread-level parallelism on chipmultiprocessors. InProc. of the 2005 International Symposium on Performance Analysis ofSystems and Software (ISPASS), Austin, TX, March 2005.
[18] J. Li and J. Martınez. Dynamic Power-Performance Adaptation of Parallel Computation onChip Multiprocessors. InProc. of the 12th International Symposium on High-PerformanceComputer Architecture, Austin, TX, February 2006.
[19] J. Lu, H. Chen, P. Yew, and W. Hsu. Design and Implementation of a Lightweight DynamicOptimization System.The Journal of Instruction-Level Parallelism, 6:1–24, 2004.
36

[20] J. Marathe and F. Mueller. Hardwware Profile-Guided Automatic Page Placement for cc-NUMA Systems. InProc. of the 11th ACM SIGPLAN Symposium on Principles and Practiceof Parallel Programming, pages 90–99, New York, NY, March 2006.
[21] T. Moseley, J. Kim, D. Connors, and D. Grunwald. Methods for Modelling Resource Con-tention on Simultaneous Multithreaded Processors. InProc. of the 2005 International Confer-ence on Computer Design, pages 373–380, San Jose, CA, October 2005.
[22] OpenMP Architecture Review Board. OpenMP Fortran/C/C++ Application Programming In-terface. Version 2.0, March 2002.
[23] Nitin Patel. Multiple Linear Regression in Data Mining. MIT OpenCourseware, Lecture Notesof 15.062 Data Mining, 2003.
[24] M. Pettersson. A Linux/x86 Performance Counters Driver. Technical report.http://user.it.uu.se/∼mikpe/linux/perfctr/.
[25] A. Settle, J. Kihm, A. Janiszewski, and D. Connors. Architectural Support for Enhanced SMTJob Scheduling. InProc. of the 13th International Conference on Parallel Architectures andCompilation Techniques (PACT’04), pages 63–73, Antibes, France, September 2004.
[26] A. Tucker and A. Gupta. Process Control and Scheduling Issues for Multiprogrammed Shared-Memory Multiprocessors. InProc. of the 12th ACM Symposium on Operating Systems Prin-ciples (SOSP’89), pages 159–166, Litchfield Park, Arizona, December 1989.
[27] M. Voss and R. Eigenmann. Reducing Parallel Overheads throughDynamic Serialization. InProc. of the 13th International Parallel Processing Symposium and Symposium on Paralleland Distributed Processing (IPPS/SPDP), pages 88–92, San Juan, Puerto Rico, April 1999.
[28] M. Warren, E. Weigle, and W. Feng. High-Density Computing: A 240-processor Beowulf inOne Cubic Meter. InProc. of IEEE/ACM Supercomputing’2002: High Performance Network-ing and Computing Conference, Baltimore, MD, November 2002.
[29] A. Weissel and F. Bellosa. Process Cruise Control: Event-Driven Clock Scaling for DynamicPower Management. InProc. of the 2002 International Conference on Compilers, Architectureand Syntehsis for Embedded Systems, pages 238–246, Grenoble, France, October 2002.
[30] L. Yang, X. Ma, and F. Mueller. Cross-Platform Performance Prediction of Parallel Applica-tions using Partial Execution. InProc. of the IEEE/ACM Supercomputing’2005: High Perfor-mance Networking and Computing Conference, Seattle, WA, November 2005.
[31] K. Yue and D. Lilja. An Effective Processor Allocation Strategy forMultiprogrammedShared-Memory Multiprocessors.IEEE Transactions on Parallel and Distributed Systems,8(12):1246–1258, December 1997.
[32] Y. Zhang and M. Voss. Runtime Empirical Selection of Loop Schedulers on HyperthreadedSMPs. InProceedings of the 2005 IEEE International Parallel and Distributed ProcessingSymposium, Denver, CO, April 2005.
37