Embed Size (px)
Citation preview

Noname manuscript No.(will be inserted by the editor)
On the Diffuseness and the Impact onMaintainability of Code Smells:A Large Scale Empirical Investigation
Fabio Palomba · Gabriele Bavota ·Massimiliano Di Penta · Fausto Fasano ·Rocco Oliveto · Andrea De Lucia
Received: date / Accepted: date
Abstract Code smells are symptoms of poor design and implementationchoices that may hinder code comprehensibility and maintainability. Despitethe effort devoted by the research community in studying code smells, the ex-tent to which code smells in software systems affect software maintainabilityremains still unclear. In this paper we present a large scale empirical inves-tigation on the diffuseness of code smells and their impact on code change-and fault-proneness. The study was conducted across a total of 395 releases of30 open source projects and considering 17,350 manually validated instancesof 13 different code smell kinds. The results show that smells characterizedby long and/or complex code (e.g., Complex Class) are highly diffused, andthat smelly classes have a higher change- and fault-proneness than smell-freeclasses.
Keywords Code Smells · Empirical Studies · Mining Software Repositories
Fabio PalombaDelft University of Technology, The NetherlandsE-mail: [email protected]
Gabriele BavotaUniversita della Svizzera italiana (USI), SwitzerlandE-mail: [email protected]
Massimiliano Di PentaUniversity of Sannio, ItalyE-mail: [email protected]
Fausto Fasano, Rocco OlivetoUniversity of Molise, ItalyE-mail: [email protected] E-mail: [email protected]
Andrea De LuciaUniversity of Salerno, ItalyE-mail: [email protected]

2 Fabio Palomba et al.
1 Introduction
Bad code smells (also known as “code smells” or “smells”) were defined assymptoms of poor design and implementation choices applied by programmersduring the development of a software project (Fowler, 1999). As a form oftechnical debt (Cunningham, 1993), they could hinder the comprehensibilityand maintainability of software systems (Kruchten et al, 2012). An exampleof code smell is the God Class, a large and complex class that centralizes thebehavior of a portion of a system and only uses other classes as data holders.God Classes can rapidly grow out of control, making it harder and harder fordevelopers to understand them, to fix bugs, and to add new features.
The research community has been studying code smells from different per-spectives. On the one side, researchers developed methods and tools to detectcode smells. Such tools exploit different types of approaches, including metrics-based detection (Lanza and Marinescu, 2010; Moha et al, 2010; Marinescu,2004; Munro, 2005), graph-based techniques (Tsantalis and Chatzigeorgiou,2009), mining of code changes (Palomba et al, 2015a), textual analysis ofsource code (Palomba et al, 2016b), or search-based optimization techniques(Kessentini et al, 2010; Sahin et al, 2014). On the other side, researchers inves-tigated how relevant code smells are for developers (Yamashita and Moonen,2013; Palomba et al, 2014), when and why they are introduced (Tufano et al,2015), how they evolve over time (Arcoverde et al, 2011; Chatzigeorgiou andManakos, 2010; Lozano et al, 2007; Ratiu et al, 2004; Tufano et al, 2017), andwhether they impact on software quality properties, such as program com-prehensibility (Abbes et al, 2011), fault- and change-proneness (Khomh et al,2012, 2009a; D’Ambros et al, 2010), and code maintainability (Yamashita andMoonen, 2012, 2013; Deligiannis et al, 2004; Li and Shatnawi, 2007; Olbrichet al, 2010; Sjoberg et al, 2013).
Similarly to some previous work (Khomh et al, 2012; Li and Shatnawi,2007; Olbrich et al, 2010; Gatrell and Counsell, 2015) this paper investigatesthe relationship existing between the occurrence of code smells in softwareprojects and software change- and fault-proneness. Specifically, while previouswork shows a significant correlation between smells and code change/fault-proneness, the empirical evidence provided so far is still limited because of:
– Limited size of previous studies: the study by Khomh et al (2012)was conducted on four open source systems, while the study by D’Ambroset al (2010) was performed on seven systems. Furthermore, the studies byLi and Shatnawi (2007), Olbrich et al (2010), and Gatrell and Counsell(2015) were conducted considering the change history of only one softwareproject.
– Detected smells vs. manually validated smells: Previous work study-ing the impact of code smells on change- and fault-proneness, including theone by Khomh et al (2012), relied on data obtained from automatic smelldetectors. Although such smell detectors are often able to achieve a goodlevel of accuracy, it is still possible that their intrinsic imprecision affectsthe results of the study.

On the Diffuseness and the Impact on Maintainability of Code Smells 3
– Lack of analysis of the magnitude of the observed phenomenon:previous work indicated that some smells can be more harmful than others,but the analysis did not take into account the magnitude of the observedphenomenon. For example, even if a specific smell type may be consideredharmful when analyzing its impact on maintainability, this may not berelevant in case the number of occurrences of such a smell type in softwareprojects is limited.
– Lack of analysis of the magnitude of the effect: Previous work in-dicated that classes affected by code smells have more chances to exhibitdefects (or to undergo changes) than other classes. However, no study hasobserved the magnitude of such changes and defects, i.e., no study ad-dressed the question: How many defects would exhibit on average a classaffected by a code smell as compared to another class affected by a differentkind of smell, or not affected by any smell at all?
– Lack of within-artifact analysis: sometimes, a class has intrinsically avery high change-proneness and/or fault-proneness, e.g., because it playsa core role in the system or because it implements a very complex feature.Hence, the class may be intrinsically “smelly”. Instead, there may be classesthat become smelly during their lifetime because of maintenance activities(Tufano et al, 2017). Or else, classes where the smell was removed, possiblybecause of refactoring activities (Bavota et al, 2015). For such classes, itis of paramount importance to analyze the change- and fault-proneness ofthe class during its evolution, in order to better relate the cause (presenceof smell) with the possible effect (change- or fault-proneness).
– Lack of a temporal relation analysis between smell presence andfault introduction: While previous work correlated the presence of codesmells with high fault- and change-proneness, one may wonder whether theartifact was smelly when the fault was introduced, or whether the fault wasintroduced before the class became smelly.
To cope with the aforementioned issues, this paper aims at corroboratingprevious empirical research on the impact of code smells by analyzing theirdiffuseness and effect on change- and fault-proneness on a large set of softwareprojects. In the context of this paper, the “diffuseness” of a code smell type(e.g., God Class) refers to the percentage of code components in a systemaffected by at least one instance of the code smell type.
The study was conducted on a total of 395 releases of 30 open sourcesystems, and considered 13 different kinds of code smells. More specifically,the study aims at investigating:
1. the diffuseness of code smells in open source systems. If the magnitudeof the phenomenon is small—i.e., code smells, or some specific kinds ofcode smells, are poorly diffused—then studying their impact on the codemaintainability might not be worthwhile.
2. the impact of code smells on maintenance properties and specifically oncode change- and fault-proneness. We intend to investigate to what ex-tent the previous findings reported by Khomh et al (2012) and D’Ambros

4 Fabio Palomba et al.
et al (2010)—obtained on a smaller set of software systems and basedon smell instances automatically identified using code smell detectors—areconfirmed on a larger set of 395 software releases and considering manuallyvalidated smell instances.
To the best of our knowledge, this is to date the largest study investi-gating the relationship between the presence of code smells and source codechange- and fault-proneness. In addition, and to cope with the other limita-tions of previous studies mentioned above, this paper (i) relies on a set ofmanually-validated code smells rather than just on the output of detectiontools, (ii) analyzes the fault proneness magnitude in terms of number of codesmell instances, (iii) performs an analysis of the evolution of classes in orderto investigate how the change/fault-proneness changes when the smell was re-moved, and (iv) uses the SZZ algorithm (Sliwerski et al, 2005) to determinewhether an artifact was already smelly when a fault was induced. The datasetused in this study is publicly available in our online appendix (Palomba et al,2017).
Structure of the paper. Section 2 discusses the related literature about smelldetection and about studies on the effect of code smells. Section 3 describes thedesign and planning of the empirical study. Section 4 presents and discussesthe results of the study, while the threats that could affect their validity arediscussed in Section 5. Finally, Section 6 concludes the paper, discussing themain findings of the work.
2 Related work
The research community has been highly active in the definition of code smelldetection methods and tools, as well as in the investigation of the impact ofcode smells on software maintenance properties. In this section we report theliterature related to (i) empirical studies aimed at understanding to what ex-tent code smells are diffused in software systems and how they evolve overtime, (ii) the impact of code smells on change- and fault-proneness, and (iii)user studies conducted in order to comprehend the phenomenon from a de-veloper’s perspective. A complete overview of code smell detection techniquescan be found in related papers by Palomba et al (2015c) and Fernandes et al(2016).
2.1 Diffuseness and Evolution of Code Smells
Chatzigeorgiou and Manakos (2010) analyzed the evolution of code smells.Their results indicate that (i) the number of instances of code smells increasesduring time; and (ii) developers are reluctant to perform refactoring operationsin order to remove them. Peters and Zaidman (2012) obtained similar results,showing that developers are often aware of the presence of code smells in the

On the Diffuseness and the Impact on Maintainability of Code Smells 5
source code, but they do not invest time in performing refactoring activitiesaimed at removing them. A partial explanation for this behavior is providedby Arcoverde et al (2011), who studied the longevity of code smells showingthat they often survive for a long time in the source code. The authors pointto the will of avoiding changes to API as one of the main reason behind thisresult (Arcoverde et al, 2011).
The evolution of code smells has also been studied by Olbrich et al (2009),who analyzed the evolution of God Class and Shotgun Surgery, showing thatthere are periods in which the number of smells increases and periods in whichthis number decreases. They also show that the increase/decrease of the num-ber of instances does not depend on the size of the system.
Vaucher et al (2009) conducted a study on the evolution of the God Classsmell, aimed at understanding whether they affect software systems for longperiods of time or, instead, are refactored while the system evolves. Theirgoal was to define a method able to discriminate between God Class instancesthat are introduced by design and God Class instances that are introducedunintentionally. Recently, Tufano et al (2015) investigated when code smellsare introduced by developers, and the circumstances and reasons behind theirintroduction. They showed that most of the times code artifacts are affected bysmells since their creation and that developers introduce them not only whenimplementing new features or enhancing existing ones, but sometimes alsoduring refactoring. A similar study was also conducted on test smells (Tufanoet al, 2016). Furthermore, Tufano et al (2017) also found that almost 80% ofthe code smells are never removed from software systems, and the main causefor their removal is the removal of the smelly artifact, rather than refactoringactivities. In a closely related field, Bavota et al (2012) and Palomba et al(2016a) provided evidence that test smells are also widely diffused in test codeand impact the maintainability of JUnit test classes.
Historical information, in general, and the evolution of code smells, inparticular, was also used in the past to identify components affected by codesmells. Ratiu et al (2004) proposed an approach to detect smells based onevolutionary information of code components over their life-time. The aim isto analyze the persistence of the problem and the effort spent to maintainthese components. Historical information has also been used by Lozano et al(2007) to assess the impact of code smells on software maintenance. Gırba et al(2007) exploited formal concept analysis (FCA) to detect co-change patterns.In other words, they identified code components that change in the same wayand at the same time. Palomba et al (2015b) use association rule discovery todetect some code smell types, showing that the evolutionary-based approachoutperforms approaches based on static and dynamic analysis and could alsosuccessfully complement them.
Our investigation about the diffuseness of code smells (RQ1) is closelyrelated to the empirical studies discussed above. However, our goal is to analyzewhether the results achieved in previous work hold on the set of softwaresystems used in this paper in order to (i) corroborate previous findings on amuch larger dataset (both in terms of number of software systems and code

6 Fabio Palomba et al.
smells), and (ii) understand the confidence level for the generalizability of theresults provided through the analysis of the impact of code smells on change-and fault-proneness.
2.2 Change- and Fault-proneness of Code Smells
The main goal of this paper is to analyze the change- and fault-proneness ofclasses affected (and not) by code smells. Such a relationship has already beeninvestigated by previous research. In particular, Khomh et al (2009a) showedthat the presence of code smells increases the code change proneness. Also,they showed that code components affected by code smells are more fault-prone than non-smelly components (Khomh et al, 2012). Our work confirmsthe results achieved by Khomh et al (2012) on a larger set of code smellsand software systems, an provides some complementary hints about the phe-nomenon. In particular, other than studying the change- and fault-pronenessof smelly and non-smelly classes, we analyzed how such indicators vary whenthe smells identified are removed. Also, we use the SZZ algorithm (Sliwer-ski et al, 2005) to better investigate the temporal relationship between thepresence of code smells and fault introduction.
Gatrell and Counsell (2015) conducted an empirical study aimed at quan-tifying the effect of refactoring on class change- and fault-proneness. In partic-ular, they monitored a commercial C# system for twelve months identifyingthe refactorings applied during the first four months. They examined the sameclasses for the second four months in order to determine whether the refactor-ing results in a decrease of change- and fault-proneness. They also comparedsuch classes with the classes of the system that were not refactored in thesame period. Results revealed that classes subject to refactoring have a lowerchange- and fault-proneness. It is worth noting that Gatrell and Counsell didnot focus their attention on well known design problems (i.e., code smells)but they analyzed if refactored classes regardless of the presence of a designproblem. Instead, our study investigates the actual impact of code smells onchange- and fault-proneness. Moreover, their study was conducted on a sin-gle software system, while we analyzed 395 software releases of 30 softwaresystems.
Li and Shatnawi (2007) empirically evaluated the correlation between thepresence of code smells and the probability that the class contains errors. Theystudied the post-release evolution process showing that many code smells arepositively correlated with class errors. Olbrich et al (2010) conducted a studyon the God Class and Brain Class code smells, reporting that these code smellswere changed less frequently and had a fewer number of defects than non-smelly classes. D’Ambros et al (2010) also studied the correlation betweenthe Feature Envy and Shotgun Surgery smells and the defects in a system,reporting no consistent correlation between them. In our empirical study, wedo not consider correlation between the presence of smells and the number ofdefects, but we investigate the release history of software systems in order to

On the Diffuseness and the Impact on Maintainability of Code Smells 7
measure the actual change- and fault-proneness of classes affected (and not)by design flaws.
Finally, Saboury et al (2017) conducted an empirical investigation on theimpact of code smells on the fault-proneness of JavaScript modules, confirmingthe negative effect smells have on the maintainability of source code. Similarlyto our study, Saboury et al (2017) used of the SZZ algorithm to identify whichbugs were introduced after the introduction of the smells.
2.3 Code Smells and User Studies
Abbes et al (2011) studied the impact of two code smell types, i.e., Bloband Spaghetti Code, on program comprehension. Their results show that thepresence of a code smell in a class does not have an important impact ondevelopers’ ability to comprehend the code. Instead, a combination of morecode smells affecting the same code components strongly decreases developers’ability to deal with comprehension tasks.
The interaction between different smell instances affecting the same codecomponents was also been studied by Yamashita and Moonen (2013), who con-firmed that developers experience more difficulties when working on classesaffected by more than one code smell. The same authors also analyzed theimpact of code smells on maintainability characteristics (Yamashita and Moo-nen, 2012). They identified which maintainability factors are reflected by codesmells and which ones are not, basing their results on (i) expert-based main-tainability assessments, and (ii) observations and interviews with professionaldevelopers.
Sjoberg et al (2013) investigated the impact of twelve code smells on themaintainability of software systems. In particular, the authors conducted astudy with six industrial developers involved in three maintenance tasks onfour Java systems. The amount of time spent by each developer in performingthe required tasks whas been measured through an Eclipse plug-in, while a re-gression analysis whas been used to measure the maintenance effort on sourcecode files having specific properties, including the number of smells affectingthem. The achieved results show that smells do not always constitute a prob-lem, and that often class size impacts maintainability more than the presenceof smells.
Deligiannis et al (2004) also performed a controlled experiment showingthat the presence of God Class smell negatively affects the maintainability ofsource code. Also, the authors highlight an influence played by these smells inthe way developers apply the inheritance mechanism.
Recently, Palomba et al (2014) investigated how the developers perceivecode smells, showing that smells characterized by long and complex code arethose perceived more by developers as design problems. In this paper we pro-vide a complementary contribution to the previous work by Palomba et al(2014). Rather than looking at developers’ perception, this paper observes thepossible effect of smells in terms of change- and fault-proneness.

8 Fabio Palomba et al.
Table 1: Code smells considered in the context of the study
Name DescriptionClass Data Should Be Private (CDSBP) A class exposing its fields, violating the principle of data hiding.Complex Class A class having at least one method having a high cyclomatic complex-
ity.Feature Envy A method more interested in a class other than the one it actually is
in.God Class A large class implementing different responsibilities and centralizing
most of the system processing.Inappropriate Intimacy Two classes exhibiting a very high coupling between them.Lazy Class A class having very small dimension, few methods and low complexity.Long Method A method that is unduly long in terms of lines of code.Long Parameter List (LPL) A method having a long list of parameters, some of which avoidable.Message Chain A long chain of method invocations performed to implement a class
functionality.Middle Man A class delegating to other classes most of the methods it implements.Refused Bequest A class redefining most of the inherited methods, thus signaling a
wrong hierarchy.Spaghetti Code A class implementing complex methods interacting between them,
with no parameters, using global variables.Speculative Generality A class declared as abstract having very few children classes using its
methods.
3 Study Definition and Planning
The goal of this study is to analyze the diffuseness of 13 code smell types inreal software applications and to assess their impact on code change- and fault-proneness. It is worth remarking that the term “diffuseness”, when associatedto a code smell type, refers to the percentage of code components in a systemaffected by at least one instance of the smell type. Analyzing the diffuseness ofcode smells is a preliminary analysis needed to better interpret their effect onchange- and fault-proneness. Indeed, some smells might be highly correlatedwith fault-proneness but rarely diffused in software projects or vice versa. The13 code smell types considered in this study are listed in Table 1 together witha short description.
3.1 Research Questions and Planning
We formulated the following three research questions:
– RQ1: What is the diffuseness of code smells in software systems? This is apreliminary research question aiming at assessing to what extent softwaresystems are affected by code smells.
– RQ2: To what extent do classes affected by code smells exhibit a differentlevel of change- and fault-proneness with respect to non-smelly classes?Previous work (Khomh et al, 2012) found that classes affected by at leastone smell have a higher chance of being change- and fault-prone than non-smelly classes. In this work we are interested in measuring the change- andfault-proneness magnitude of such classes, in terms of number of changesand of bug fixes.
– RQ3: To what extent do change- and fault-proneness of classes vary as aconsequence of code smell introduction and removal? This research question

On the Diffuseness and the Impact on Maintainability of Code Smells 9
Table 2: Systems involved in the study
System Description #Releases Classes Methods KLOCsArgoUML UML Modeling Tool 16 777-1,415 6,618-10,450 147-249Ant Build System 22 83-813 769-8,540 20-204aTunes Player and Audio Manager 31 141-655 1,175-5,109 20-106Cassandra Database Management System 13 305-586 1,857-5,730 70-111Derby Relational Database Management System 9 1,440-1,929 20,517-28,119 558-734Eclipse Core Integrated Development Environment 29 744-1,181 9,006-18,234 167-441Elastic Search RESTful Search and Analytics Engine 8 1,651-2,265 10,944-17,095 192-316FreeMind Mind-mapping Tool 16 25-509 341-4,499 4-103Hadoop Tool for Distributed Computing 9 129-278 1,089-2,595 23-57HSQLDB HyperSQL Database Engine 17 54-444 876-8,808 26-260Hbase Distributed Database System 8 160-699 1,523-8148 49-271Hibernate Java Persistence Framework 11 5-5 15-18 0.4-0.5Hive Data Warehouse Software Facilitates 8 407-1,115 3,725-9,572 64-204Incubating Codebase 6 249-317 2,529-3,312 117-136Ivy Dependency Manager 11 278-349 2,816-3,775 43-58Lucene Search Manager 6 1,762-2,246 13,487-17,021 333-466JEdit Text Editor 23 228-520 1,073-5,411 39-166JHotDraw Java GUI Framework 16 159-679 1,473-6,687 18-135JFreeChart Java Chart Library 23 86-775 703-8,746 15-231JBoss Java Webserver 18 2,313-4,809 19,901-37,835 434-868JVlt Vocabulary Learning Tool 15 164-221 1,358-1,714 18-29jSL Java Service Launcher 15 5-10 26-43 0.5-1Karaf Standalone Container 5 247-470 1,371-2,678 30-56Nutch Web-search Software 7 183-259 1,131-1,937 33-51Pig Large Dataset Analyzer 8 258-922 1,755-7,619 34-184Qpid Messaging Tool 5 966-922 9,048-9,777 89-193Sax XML Parser 6 19-38 119-374 3-11Struts MVC Framework 7 619-1,002 4,059-7,506 69-152Wicket Java Application Framework 9 794-825 6,693-6,900 174-179Xerces XML Parser 16 162-736 1,790-7,342 62-201Total - 395 5-4,809 15-37,835 0.4-868
investigates whether the change- and fault-proneness of a class increaseswhen a smell is introduced, and whether it decreases when the smell isremoved. Such an analysis is of paramount importance because a class maybe intrinsically change-prone (and also fault-prone) regardless of whetherit is affected by code smells.
To answer our research questions we mined 395 releases of 30 open sourcesystems searching for instances of the 13 code smells object of our study. Table2 reports the analyzed systems, the number of releases considered for each ofthem, and their size ranges in terms of number of classes, number of methods,and KLOCs. The choice of the subject systems was driven by the will to con-sider systems having different size (ranging from 0.4 to 868 KLOCs), belongingto different application domains (modeling tools, parsers, IDEs, IR-engines,etc.), developed by different open source communities (Apache, Eclipse, etc.),and having different lifetime (from 1 to 19 years).
The need for analyzing smells in 395 project releases makes the manualdetection of the code smells prohibitively expensive. For this reason, we de-veloped a simple tool to perform smell detection. The tool outputs a list ofcandidate code components (i.e., classes or methods) potentially exhibiting asmell. Then, we manually validated the candidate code smells suggested bythe tool. The validation was performed by two of the authors who individuallyanalyzed and classified as true or false positives all candidate code smells. Fi-nally, they performed an open discussion to resolve possible conflicts and reach

10 Fabio Palomba et al.
Table 3: The rules used by our tool to detect candidate code smells
Name DescriptionCDSBP A class having at least one public field.Complex Class A class having at least one method for which McCabe cyclomatic
complexity is higher than 10.Feature Envy All methods having more calls with another class than the one they
are implemented in.God Class All classes having (i) cohesion lower than the average of the system
AND (ii) LOCs > 500.Inappropriate Intimacy All pairs of classes having a number of method’s calls between them
higher than the average number of calls between all pairs of classes.Lazy Class All classes having LOCs lower than the first quartile of the distribution
of LOCs for all system’s classes.Long Method All methods having LOCs higher than the average of the system.LPL All methods having a number of parameters higher than the average
of the system.Message Chain All chains of methods’ calls longer than three.Middle Man All classes delegating more than half of the implemented methods.Refused Bequest All classes overriding more than half of the methods inherited by a
superclass.Spaghetti Code A class implementing at least two long methods interacting between
them through method calls or shared fields.Speculative Generality A class declared as abstract having less than three children classes
using its methods.
a consensus on the detected code smells. To ensure high recall, our detectiontool uses very simple rules that overestimate the presence of code smells.
The rules for the 13 smell types considered in the study are reported inTable 3 and are inspired to the rule cards proposed by Moha et al (2010) inDECOR. The metrics’ thresholds used to discriminate whether a class/methodis affected or not by a smell are lower than the thresholds used by Moha et al(2010). Again, this was done in order to detect as many code smell instancesas possible. For example, in the case of the Complex Class smell we consideredas candidates all the classes having a cyclomatic complexity higher than 10.Such a choice was driven by recent findings reported by Lopez and Habra(2015), which found that “a threshold lower than 10 is not significant in Object-Oriented programming when interpreting the complexity of a method”. As forthe other smells we relied on (i) simple filters, e.g., in the cases of CDSBP(where we discarded from the manual validation all the classes having nopublic attributes) and Feature Envy (we only considered the methods havingmore relationships toward another class than with the class they are containedin), (ii) the analysis of the metrics’ distribution (like in the cases of Lazy Class,Inappropriate Intimacy, Long Method, and Long Parameter List), or (iii) veryconservative thresholds (e.g., a God Class should not have less than 500 LOCs).
We chose not to use existing detection tools (Marinescu, 2004; Khomhet al, 2009b; Sahin et al, 2014; Tsantalis and Chatzigeorgiou, 2009; Mohaet al, 2010; Oliveto et al, 2010; Palomba et al, 2015a, 2016b) because (i) noneof them has ever been applied to detect all the studied code smells and (ii)their detection rules are generally more restrictive to ensure a good compromisebetween recall and precision and thus may miss some smell instances. To verifythis claim, we evaluated the behavior of three existing tools, i.e., DECOR

On the Diffuseness and the Impact on Maintainability of Code Smells 11
(Moha et al, 2010), JDeodorant (Tsantalis and Chatzigeorgiou, 2009), andHIST (Palomba et al, 2015a) on one of the systems used in the empirical study,i.e., Apache Cassandra 1.1. When considering the God Class smell none of theavailable tools is able to identify all the eight actual smell instances we foundby manually analyzing the classes of this system. Indeed, DECOR identifiesonly one of the actual instances, while JDeodorant and HIST detect threeof them. Therefore, the use of existing tools would have resulted in a lesscomprehensive analysis. Of course, using rules that overestimate the presenceof code smells pays the higher recall with a lower precision with respect toother tools. However, this is not a threat for our study, because the manualvalidation of the instances detected by the tool aims at discarding the falsepositives, while keeping the true positive smell instances. A detailed overviewof the results obtained by the tools on Apache Cassandra is available in ouronline appendix (Palomba et al, 2017).
We used the collected data to answer our research questions. ConcerningRQ1 we verified what is the diffuseness of the considered code smells in theanalyzed systems. We also verified whether there is a correlation between sys-tems’ characteristics (#Classes, #Methods, and KLOCs) and the presence ofcode smells. To compute the correlation on each analyzed system release weapply the Spearman rank correlation analysis (Student, 1921) between thedifferent characteristics of the system release and the presence of code smells.Such an analysis measures the strength and direction of association betweentwo ranked variables, and ranges between -1 and 1, where 1 represents a perfectpositive linear relationship, -1 represents a perfect negative linear relationship,and values in between indicate the degree of linear dependence between theconsidered distributions. Cohen (1988) provided a set of guidelines for theinterpretation of the correlation coefficient. It is assumed that there is no cor-relation when 0 ≤ ρ < 0.1, small correlation when 0.1 ≤ ρ < 0.3, mediumcorrelation when 0.3 ≤ ρ < 0.5, and strong correlation when 0.5 ≤ ρ ≤ 1.Similar intervals also apply for negative correlations.
To answer RQ2 we mined the change history of the 30 systems subject ofour study. In particular, to compute the class change-proneness, we extractedthe change logs from their versioning systems in order to identify the set ofclasses modified in each commit. Then, we computed the change-proneness ofa class Ci in a release rj as:
change proneness(Ci, rj) = #Changes(Ci)rj−1→rj
where #Changes(Ci)rj−1→rjis the number of changes performed on Ci by
developers during the evolution of the system between the rj−1’s and the rj ’srelease dates.
As for the fault-proneness, we developed a mining tool to extract the bugsfixed over the change history of the subject systems. All considered systemsexploit Bugzilla1 or Jira2 as issue tracker. Firstly, we identified bug fixing
1 http://www.bugzilla.org2 https://www.atlassian.com/software/jira

12 Fabio Palomba et al.
commits by mining regular expressions containing issue IDs in the change logof the versioning system, e.g.,“fixed issue #ID” or “issue ID”. Secondly, foreach issue ID related to a commit, we downloaded the corresponding issue re-ports from their issue tracking system and extracted the following informationfrom them: (i) product name; (ii) issue type, i.e., whether an issue is a bug,enhancement request, etc.; (iii) issue status, i.e., whether an issue was closedor not; (iv) issue resolution, i.e., whether an issue was resolved by fixing it,or whether it was a duplicate bug report, or a “works for me” case; (v) issueopening date; (vi) issue closing date, if available.
Then, we checked each issue report to be correctly downloaded (e.g., theissue ID identified from the versioning system commit note could be a falsepositive). After that, we used the issue type field to classify the issue anddistinguish bug fixes from other issue types (e.g., enhancements). Finally, weonly considered bugs having Closed status and Fixed resolution. In this way, werestricted our attention to (i) issues that were related to bugs, and (ii) issuesthat were neither duplicate reports nor false alarms. Having bugs linked to thecommits fixing them allowed us to identify which classes were modified to fixeach bug. Thus, we computed the fault-proneness of a class Ci in a release rjas the number of bug fixing activities involving the class in the period of timebetween the rj−1 and the rj release dates.
Once extracted all the required information, we compare the distributionof change- and fault-proneness of classes affected and not by code smells. Inparticular, we present boxplots of change- and fault- proneness distributions ofthe two sets of classes and we also compare them through the Mann-Whitneystatistical test (Conover, 1998). The latter is a non-parametric test used toevaluate the null hypothesis stating that it is equally likely that a randomlyselected value from one sample will be less than or greater than a randomlyselected value from a second sample. The results are intended as statisticallysignificant at α = 0.05. We estimated the magnitude of the measured dif-ferences by using the Cliff’s Delta (or d), a non-parametric effect size mea-sure (Grissom and Kim, 2005) for ordinal data. We followed well-establishedguidelines to interpret the effect size values: negligible for |d| < 0.10, small for0.10 ≤ |d| < 0.33, medium for 0.33 ≤ |d| < 0.474, and large for |d| ≥ 0.474(Grissom and Kim, 2005).
It is important to note that the analysis of the fault-proneness might bebiased by the fact that a bug might have been introduced before the intro-duction of the code smell. This would lead to an overestimation of the actualnumber of bug fixing activities performed on smelly classes in the time periodbetween the releases rj−1 and rj . For this reason, we also analyzed the fault-proneness of smelly classes only considering bug fixing activities related tobugs introduced after the smell introduction. More formally, we computed thefault-proneness of a smelly class Ci in a release rj as the number of changes toCi aimed at fixing a bug introduced after the code smell introduction in theperiod between rj−1 and rj .

On the Diffuseness and the Impact on Maintainability of Code Smells 13
To estimate the date in which a bug was likely introduced3, we exploited theSZZ algorithm4 (Sliwerski et al, 2005), which is based on the annotation/blamefeature of versioning systems. In summary, given a bug-fix identified by thebug ID, k, the approach works as follows:
1. For each file fi, i = 1 . . .mk involved in the bug-fix k (mk is the number offiles changed in the bug-fix k), and fixed in its revision rel-fixi,k, we extractthe file revision just before the bug fixing (rel-fixi,k − 1).
2. Starting from the revision rel-fixi,k − 1, for each source line in fi changedto fix the bug k the blame feature of Git is used to identify the file revisionwhere the last change to that line occurred. In doing that, blank lines andlines that only contain comments are identified using an island grammarparser (Moonen, 2001). This produces, for each file fi, a set of ni,k fix-inducing revisions rel-bugi,j,k, j = 1 . . . ni,k. Thus, more than one commitcan be indicated by the SZZ algorithm as responsible for inducing a bug.
By adopting the process described above we were able to approximate thetime periods in which each class was affected by one or more bugs. We excludedfrom our analysis all the bugs occurring in a class Ci before it became smelly.Note that we also excluded bug-introducing changes that were recorded afterthe bug was reported, since they represent false positives.
It is worth noting that in the context of RQ2 we considered all the classesof the analyzed systems: if a class was smelly in some releases and non-smellyin other releases, it contributes to both sets of smelly and non-smelly classes.Also, in this research question we did not discriminate the specific kind ofsmell affecting a class (i.e., a class is considered smelly if it contains any kindof code smell). A fine-grained analysis of the impact of the different smelltypes on class change- and fault-proneness is presented in the next researchquestion.
In RQ3 we exploited the code smells’ oracle we built (i.e., the one reportingthe code smells affecting each class in each of the 395 considered releases) toidentify in which releases of each system a class was smelly or not smelly. Then,we focused only on classes affected by at least one smell instance in at leastone of the analyzed software releases but not in all of them. In this way, wecould compare their change- and fault-proneness when they were affected andnot affected by smells. To effectively investigate the effect of smell removalon maintainability, we considered each smell type in isolation, i.e., we tookinto account only the classes affected by a single smell rather than consideringclasses affected by more smells. For example, suppose that a class C was firstlyaffected by the God Class smell between releases ri and ri+1. Then, the smellwas not detected between releases ri+1 and ri+2. Finally, the smell re-appearedbetween releases ri+2 and ri+3. We compute the change-proneness of C whenit was smelly by summing up the change-proneness of C in the periods between
3 The right terminology is “when the bug induced the fix” because of the intrinsic lim-itations of the SZZ algorithm, which cannot precisely identify whether a change actuallyintroduced the bug.
4 SZZ stays for the last name initials of the three algorithm’s authors.

14 Fabio Palomba et al.
ri and ri+1 and between ri+2 and ri+3. Similarly, we computed the change-proneness of C when it was non-smelly by computing the change-pronenessof C in the period between ri+1 and ri+2. Following the same procedure, wecompare the fault-proneness of classes when they were affected and not by acode smell. As done for RQ2, the comparison is performed by using boxplotsand statistical tests for significance (Mann-Whitney test) and effect size (Cliff’sDelta).
4 Analysis of the Results
In this section we answer our three research questions.
4.1 Diffuseness of code smells (RQ1)
Fig. 1 shows the boxplot reporting (i) the absolute number of code smellinstances, (ii) the percentage of affected code components (i.e., percentage ofaffected classes/methods5), and (iii) the code smell density (i.e., number ofcode smells per KLOC) affecting the software systems considered in our study.For sake of clarity, we aggregated the results considering all the systems as asingle dataset. Detailed results are reported in the appendix at the end of thepaper.
The boxplots highlight significant differences in the diffuseness of codesmells. The first thing that leaps to the eyes is that code smells like FeatureEnvy, Message Chain, and Middle Man are poorly diffused in the analyzedsystems. For instance, across the 395 system releases the highest number ofFeature Envy instances in a single release (a Xerces release) is 17, leading toa percentage of affected methods of only 2.3%. We found instances of FeatureEnvy in 50% of the analyzed 395 releases.
The Message Chain smell is also poorly diffused. It affects 13% of theanalyzed releases and in the most affected release (a release of HSQLDB) onlyfour out of the 427 classes (0.9%) are instances of this smell. It is worth notingthat in previous work Message Chain resulted to be the smell having thehighest correlation with fault-proneness (Khomh et al, 2012). Therefore, theobserved results indicate that although the Message Chain smell is potentiallyharmful its diffusion is fairly limited.
Finally, the last poorly diffused code smell is the Middle Man. Only 30%of the 395 analyzed releases are affected by this smell type and the high-est number of instances of this smell type in a single release (a release ofCassandra) is eight. In particular, the classes affected by the Middle Manin Cassandra 0.6 were 8 out of 261 (3%). In this case, all identified MiddleMan instances affect classes belonging to the org.apache.cassandra.utils
package, grouping together classes delegating most of their work to classes
5 Depending on the code smell granularity, we report the percentage of affected classes ormethods.

On the Diffuseness and the Impact on Maintainability of Code Smells 15
CDSBP CC FE II GC LC LM LPL MC MM RB SC SG
020
060
010
00
Number of code smell instances
CDSBP CC FE II GC LC LM LPL MC MM RB SC SG
02
46
810
Percentage of affected code components
CDSBP CC FE II GC LC LM LPL MC MM RB SC SG
020
4060
Code smell density
Fig. 1: Absolute number, percentage, and density of code smell instances inthe analyzed systems.
in other packages. For example, the HintedHandOffManager class delegateseleven out of the twelve methods it contains to the StorageService classfrom the org.apache.cassandra.service package.
Other code smells are instead quite diffused. For example, we found atleast one instance of Long Method in 84% of the analyzed releases (331 outof 395). In particular, on average each of these 331 releases is affected by44 Long Method instances with the peak of 212 in an Apache Derby release.We manually analyzed that release (i.e., 10.1) to understand the reasons be-hind the presence of so many Long Method instances. Most of the instancesare in the org.apache.derby.impl.sql.compile package, grouping togetherclasses implementing methods responsible for parsing code statements writtenby using the SQL language. Such parsing methods are in general very com-

16 Fabio Palomba et al.
Table 4: Correlation between code smell instances and system size.
Code smell ρ with ρ with ρ with#Classes #Methods LOCs
Class Data Should Be Private 0.72 0.82 0.82Complex Class 0.49 0.71 0.73Feature Envy -0.07 -0.02 0.01God Class 0.50 0.76 0.82Inappropriate Intimacy -0.02 0.02 0.08Lazy Class 0.20 0.32 0.32Long Method 0.47 0.72 0.79Long Parameter List -0.12 -0.09 -0.05Message Chain -0.10 -0.03 0.03Middle Man 0.07 0.19 0.18Refused Bequest 0.74 0.82 0.81Spaghetti Code 0.69 0.74 0.75Speculative Generality 0.85 0.78 0.77In Italic the medium correlations, in bold the strong correlations
plex and long (on average, 259 LOC). For a similar reason, we found severalinstances of Long Method in Eclipse Core. Indeed, it contains a high numberof classes implementing methods dealing with code parsing in the IDE. Whilewe cannot draw any clear conclusion based on the manual analysis of these twosystems, our feeling is that the inherent complexity of such parsing methodsmakes it difficult for developers to (i) write the code in a more concise wayto avoid Long Method code smells, or (ii) remove the smell, for instance byapplying extract method refactoring.
Another quite diffused code smell is the Spaghetti Code, that affects 83%of the analyzed releases (327 out of 395) with the highest number of instances(54) found in a JBoss’s release. Other diffused code smells are SpeculativeGenerality (80% of affected releases), Class Data Should Be Private (77%),Inappropriate Intimacy (71%), and God Class (65%).
Interestingly, the three smallest systems considered in our study (i.e.,Hibernate, jSL, and Sax) do not present any instance of code smell in anyof the 31 analyzed releases. This result might indicate that in small systemssoftware developers are generally able to better keep under control the codequality, thus avoiding the introduction of code smells. To further investigatethis point we computed the correlation between system size (in terms of #Classes, #Methods, and LOCs) and the number of instances of each codesmell (see Table 4). As expected, some code smells have a positive correla-tion with the size attributes, meaning that the larger the system the higherthe number of code smell instances in it. There are also several code smellsfor which this correlation does not hold (i.e., Feature Envy, Inappropriate In-timacy, Long Parameter List, Message Chain, and Middle Man). With theexception of Long Parameter List, all these smells are related to “suspicious”interactions between the classes of the system (e.g., the high coupling repre-sented by the Inappropriate Intimacy smell). It is reasonable to assume that

On the Diffuseness and the Impact on Maintainability of Code Smells 17
Table 5: RQ1: Diffuseness of the studied code smells.
Code smell % affected avg. number max numberDiffuseness
releases of instances of instancesLong Method 84% 44 212 HighSpaghetti Code 83% 12 54 HighSpeculative Generality 80% 11 65 HighClass Data Should Be Private 76% 12 65 HighInappropriate Intimacy 71% 4 34 HighGod Class 65% 5 26 MediumRefused Bequest 58% 11 55 MediumComplex Class 56% 9 35 MediumLong Parameter List 47% 16 77 MediumFeature Envy 50% 3 17 LowLazy Class 47% 5 21 LowMiddle Man 30% 2 8 LowMessage Chain 13% 2 4 Low
the interactions of such classes is independent from the system size and mainlyrelated to correct/wrong design decisions.
We also compute the code smell density as the number of smell instancesper KLOC in each of the 395 analyzed releases (see bottom part of Fig. 1). Theresults confirm that the Long Method is the most diffused smell, having thehighest average density (i.e., 28 instances per KLOC). Also Refused Bequestand Complex Class smells, i.e., the code smells having the highest percentageof affected code components, are confirmed to be quite diffused in the studiedsystems. All the other smells seem to have diffuseness trends similar to theones previously discussed.
Table 5 classifies the studied code smells on the basis of their diffuseness inthe releases subject of our study. The “% of affected releases” column reportsthe percentage of analyzed releases in which we found at least one instanceof a specific smell type. For example, a smell like Long Method affects 84% ofreleases, i.e., 395*0.84=332 releases.
Summary for RQ1. Most of the analyzed smells are quite diffused, es-pecially the ones characterized by long and/or complex code (e.g., LongMethod, Complex Class). On the contrary, Feature Envy, Lazy Class, Mes-sage Chain, and Middle Man are poorly diffused.
4.2 Change- and fault-proneness of classes affected/not affected by codesmells (RQ2)
Fig. 2 shows the boxplots of change-proneness for classes affected/not affectedby code smells. Our results confirm the findings reported by Khomh et al(2012), showing that classes affected by code smells have a higher change-proneness than other classes. Indeed, the median change-proneness for classes

18 Fabio Palomba et al.
● ●●● ●● ●●●● ●●● ●●●● ●● ●● ●● ●● ●●●●●● ●●
● ●●
smel
lycl
asse
sno
n−sm
elly
clas
ses
0 20 40 60 80
# changes
Fig. 2: Change-proneness of classes affected and not by code smells
affected by code smells (32) is almost three times higher with respect to the me-dian change-proneness of the other classes (12). As an example, the Eclipse
class IndexAllProject affected by the Long Method smell (in its methodexecute) was modified 77 times during the time period between the release8 (2.1.3) and 9 (3.0), while the median value of changes for classes not af-fected by any code smell is 12. Moreover, during the change history of thesystem the number of lines of code of the method execute of this class variedbetween 671 and 968 due to the addition of several features. The results ofthe Mann-Whitney and Cliff tests highlight a statistically significant differ-ence in the change-proneness of classes affected and not affected by code smell(p-value<0.001) with a large effect size (d=0.68).
Concerning the fault-proneness, the results also show important differencesbetween classes affected and not affected by code smells, even if such differencesare less marked than those observed for the change-proneness (see Fig. 3). Themedian value of the number of bugs fixed on classes not affected by smells is3 (third quartile=5), while the median for classes affected by code smells is9 (third quartile=12). The results confirm what already observed by Khomhet al (2012). The observed difference is statistically significant (p-value<0.001)with a medium effect size (d=0.41).
When considering only the bugs induced after the smell introduction, theresults still confirm previous findings. Indeed, as shown in Fig. 4, smelly classesstill have a much higher fault-proneness with respect to non-smelly classes. Inparticular, the median value of the number of bugs fixed in non-smelly classesis 2 (third quartile=5), while it is 9 for smelly classes (third quartile=12). Thedifference is statistically significant (p-value<0.001) with a large effect size(d=0.82).

On the Diffuseness and the Impact on Maintainability of Code Smells 19
●● ● ●
smel
lycl
asse
sno
n−sm
elly
clas
ses
0 5 10 15 20 25 30 35
# defects
Fig. 3: Fault-proneness of classes affected and not affected by code smells.
●● ● ●
smel
lycl
asse
sno
n−sm
elly
clas
ses
0 5 10 15 20 25 30 35
# defects
Fig. 4: Fault-proneness of classes affected and not affected by code smells whenconsidering the bugs introduced after the smell introduction only.
This result can be explained by the findings reported in the work by Tufanoet al (2017), where the authors showed that most of the smells are introducedduring the very first commit involving the affected class (i.e., when the classis added for the first time to the repository). As a consequence, most of thebugs are introduced after the code smell appearance. This conclusion is alsosupported by the fact that in our dataset only 21% of the bugs related tosmelly classes are introduced before the smell introduction.
While the analysis carried out until now clearly highlighted a trend interms of change- and fault- proneness of smelly and non-smelly classes, it is

20 Fabio Palomba et al.
Fig. 5: Change-proneness of classes affected by different number of code smells.
Fig. 6: Fault-proneness of classes affected by different number of code smells.
important to note that a smelly class could be affected by one or more smells.For this reason, we performed an additional analysis to verify how change- andfault-proneness of classes very when considering classes affected by zero, one,two, and three code smells. In our dataset there are no classes affected bymore than three smells in the same system release. Moreover, if a class wasaffected by two code smells in release rj−1 and by three code smells in releaserj , its change- (fault-) proneness between releases rj−1 and rj contributed tothe distribution representing the change- (fault-) proneness of classes affectedby two smells while its change- (fault-) proneness between releases rj and rj+1
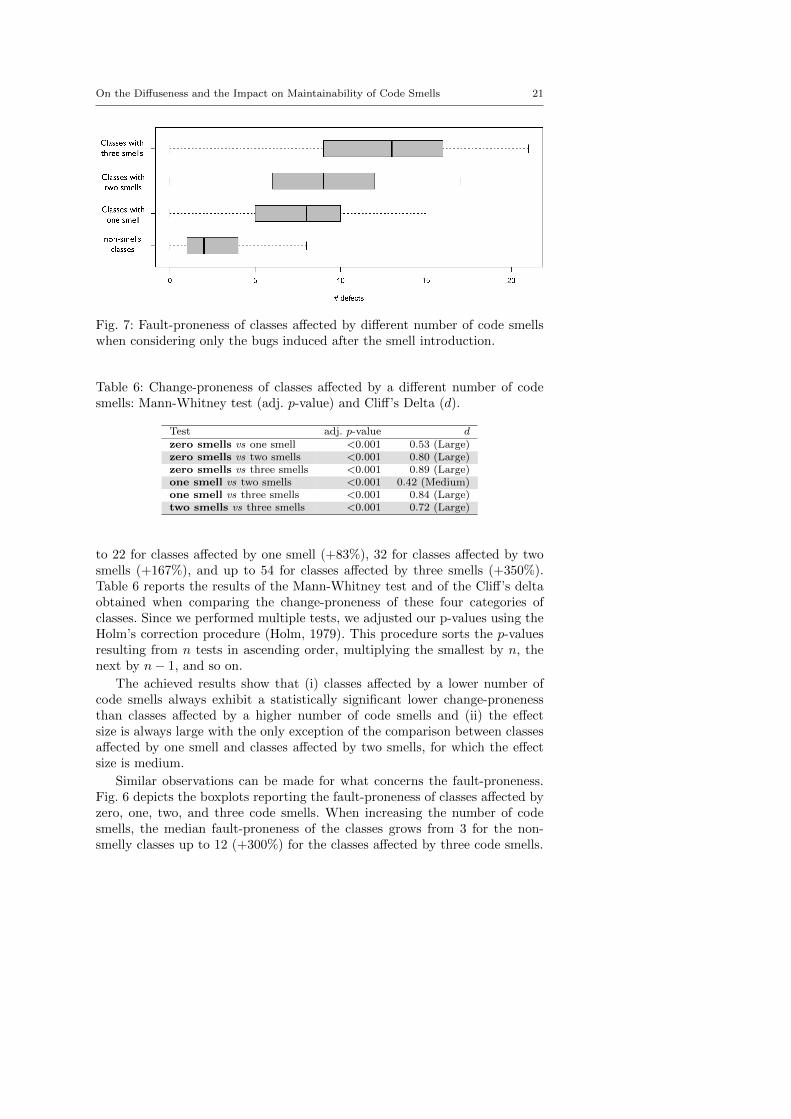
contributed to the distribution representing the change- (fault-) proneness ofclasses affected by three smells. Fig. 5 reports the change-proneness of the fourconsidered sets of classes, while Fig. 6 and Fig. 7 depict the results achievedfor fault-proneness.
In terms of change-proneness, the trend depicted in Fig. 5 shows that thehigher the number of smells affecting a class the higher its change-proneness. Inparticular, the median number of changes goes from 12 for non-smelly classes,
On the Diffuseness and the Impact on Maintainability of Code Smells 21
Fig. 7: Fault-proneness of classes affected by different number of code smellswhen considering only the bugs induced after the smell introduction.
Table 6: Change-proneness of classes affected by a different number of codesmells: Mann-Whitney test (adj. p-value) and Cliff’s Delta (d).
Test adj. p-value dzero smells vs one smell <0.001 0.53 (Large)zero smells vs two smells <0.001 0.80 (Large)zero smells vs three smells <0.001 0.89 (Large)one smell vs two smells <0.001 0.42 (Medium)one smell vs three smells <0.001 0.84 (Large)two smells vs three smells <0.001 0.72 (Large)
to 22 for classes affected by one smell (+83%), 32 for classes affected by twosmells (+167%), and up to 54 for classes affected by three smells (+350%).Table 6 reports the results of the Mann-Whitney test and of the Cliff’s deltaobtained when comparing the change-proneness of these four categories ofclasses. Since we performed multiple tests, we adjusted our p-values using theHolm’s correction procedure (Holm, 1979). This procedure sorts the p-valuesresulting from n tests in ascending order, multiplying the smallest by n, thenext by n− 1, and so on.
The achieved results show that (i) classes affected by a lower number ofcode smells always exhibit a statistically significant lower change-pronenessthan classes affected by a higher number of code smells and (ii) the effectsize is always large with the only exception of the comparison between classesaffected by one smell and classes affected by two smells, for which the effectsize is medium.
Similar observations can be made for what concerns the fault-proneness.Fig. 6 depicts the boxplots reporting the fault-proneness of classes affected byzero, one, two, and three code smells. When increasing the number of codesmells, the median fault-proneness of the classes grows from 3 for the non-smelly classes up to 12 (+300%) for the classes affected by three code smells.

22 Fabio Palomba et al.
Table 7: Fault-proneness of classes affected by a different number of codesmells: Mann-Whitney test (adj. p-value) and Cliff’s Delta (d).
Test adj. p-value dzero smells vs one smell <0.001 0.74 (Large)zero smells vs two smells <0.001 0.74 (Large)zero smells vs three smells <0.001 0.89 (Large)one smell vs two smells <0.001 0.14 (Small)one smell vs three smells <0.001 0.53 (Large)two smells vs three smells <0.001 0.40 (Medium)
Table 8: Fault-proneness of classes affected by a different number of codesmells when considering only bugs induced after the smell introduction: Mann-Whitney test (adj. p-value) and Cliff’s Delta (d).
Test adj. p-value dzero smells vs one smell <0.001 0.75 (Large)zero smells vs two smells <0.001 0.71 (Large)zero smells vs three smells <0.001 0.95 (Large)one smell vs two smells <0.001 0.19 (Small)one smell vs three smells <0.001 0.61 (Large)two smells vs three smells <0.001 0.43 (Medium)
The results of the statistical analysis reported in Table 7 confirm the signif-icant difference in the fault-proneness of classes affected by a different numberof code smells, with a large effect size in most of the comparisons.
Previous findings are also confirmed when looking at the boxplots of Fig.7, which refers to the analysis of the fault-proneness performed consideringonly the bugs introduced after the smell introduction. Indeed, the higher thenumber of code smells affecting a class the higher its fault-proneness. Thesignificant differences are also confirmed by the statistical tests reported inTable 8.
Summary for RQ2. Our results confirm the findings by Khomh et al(2012): Classes affected by code smells have a statistically significant higherchange- (large effect size) and fault- (medium effect size) proneness withrespect to classes not affected by code smells. Also, we observed a veryclear trend indicating that the higher the number of smells affecting a classthe higher its change- and fault-proneness.
4.3 Change- and fault-proneness of classes when code smells are introducedand removed (RQ3)
For each considered code smell type, Fig. 8 shows a pair of boxplots reportingthe change-proneness of the same set of classes during the time period in whichthey were affected (S in Fig. 8) and not affected (NS in Fig. 8) by that specificcode smell.

On the Diffuseness and the Impact on Maintainability of Code Smells 23
Fig. 8: Change-proneness of classes affected by a code smell (S) compared tothe change-proneness of the same classes during the time period in which theywere not affected by a code smell (NS).
In all pairs of boxplots a recurring pattern can be observed: when the classesare affected by the code smell they generally have a higher change-pronenessthan when they are not affected. This result holds for all code smells butMiddle Man (MM), Lazy Class (LC), Feature Envy (FE), and Class DataShould Be Private (CDSBP).
For classes affected by a God Class (GC) smell we can observe an increaseof +283% of the change-proneness median value (46 vs 12). The case of theBase64 class belonging to the Elastic Search system is particularly represen-
24 Fabio Palomba et al.
tative: when affected by the God Class smell, the developers modified it 87times on average (the average is computed across the 5 releases in which thisclass was smelly); instead, when the class was not affected by the code smell,the developers modified it only 10 times on average (the class was not smellyin 3 releases).
Similar results can be observed for the Complex Class (CC) smell: themedian change-proneness of classes is 55 in the time period in which they areaffected by this smell, while it is 34 when they are non-smelly. For example,when the Scanner class of the Eclipse Core project was affected by this smell,it was modified 95 times on average (across the 18 releases in which the classwas smelly), as opposed to the 27 changes observed on average across the 11releases in which it was not smelly.
The discussion is quite similar for code smells related to errors in theapplications of Object Oriented principles. For example, for classes affectedby Refused Bequest (RB) the median change-proneness goes from 43 (in thepresence of the smell) down to 26 (in the absence of the smell). The case of theclass ScriptWriterBase of the HSQLDB project is particularly interesting.On average this class was involved in 52 changes during the time period inwhich it was affected by RB (13 releases), while the average number of changesdecreased to 9 during the time period in which it was not smelly (4 releases).
It is also interesting to understand why some code smells reduce the change-proneness. For the Lazy Class smell this result is quite expected. Indeed, bydefinition this smell arises when a class has small size, few methods, low com-plexity, and it is used rarely from the other classes; in other words, as stated byFowler “the class isn’t doing enough to pay for itself” (Fowler, 1999). Remov-ing this smell could mean increasing the usefulness of the class, for exampleby implementing new features in it. This likely increases the class change-proneness. Also, the removal of a Middle Man (a class delegating most of itsresponsibilities) is expected to increase the change-proneness of classes, sincethe non-smelly class will implement (without delegation) a set of responsi-bilities that are likely to be maintained by developers, thus triggering newchanges.
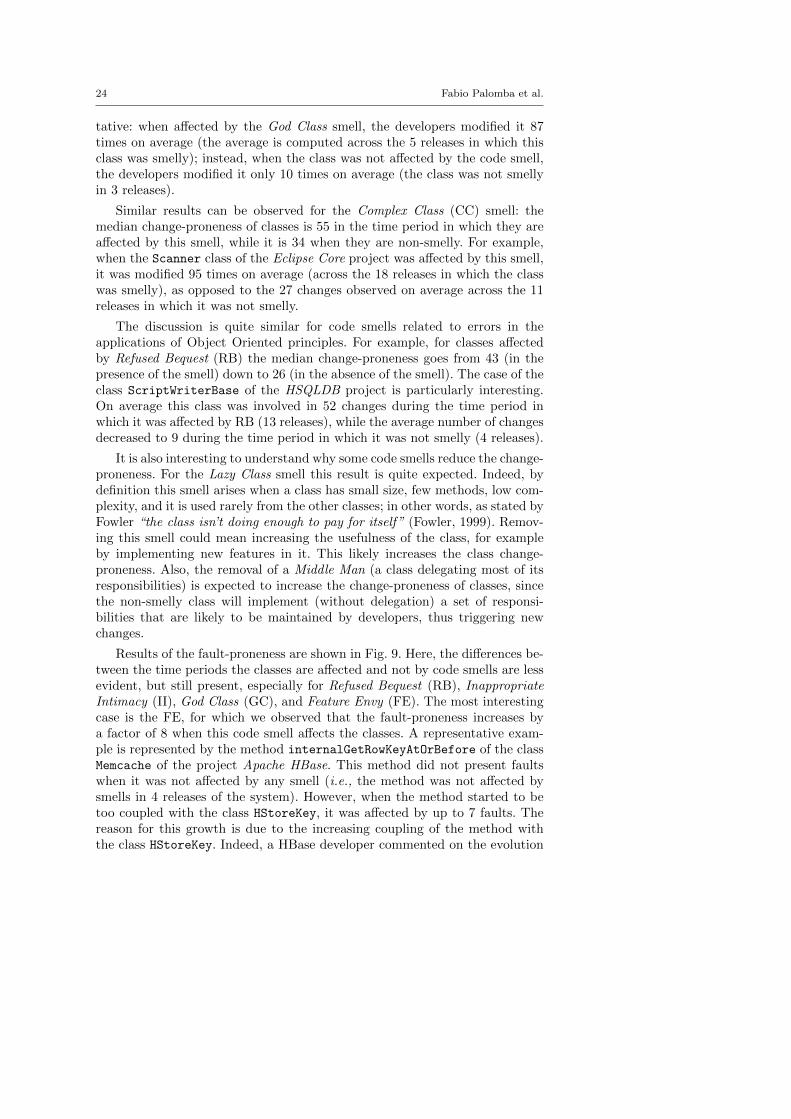
Results of the fault-proneness are shown in Fig. 9. Here, the differences be-tween the time periods the classes are affected and not by code smells are lessevident, but still present, especially for Refused Bequest (RB), InappropriateIntimacy (II), God Class (GC), and Feature Envy (FE). The most interestingcase is the FE, for which we observed that the fault-proneness increases bya factor of 8 when this code smell affects the classes. A representative exam-ple is represented by the method internalGetRowKeyAtOrBefore of the classMemcache of the project Apache HBase. This method did not present faultswhen it was not affected by any smell (i.e., the method was not affected bysmells in 4 releases of the system). However, when the method started to betoo coupled with the class HStoreKey, it was affected by up to 7 faults. Thereason for this growth is due to the increasing coupling of the method withthe class HStoreKey. Indeed, a HBase developer commented on the evolution

On the Diffuseness and the Impact on Maintainability of Code Smells 25
Fig. 9: Fault-proneness of classes affected by a code smell compared to thefault-proneness of the same classes during the time period in which they werenot affected by a code smell.
of this method in the issue tracker6: “Here’s a go at it. The logic is much morecomplicated, though it shouldn’t be too impossible to follow”.
For all other smells we did not observe any strong difference in the fault-proneness of the classes when comparing the time periods during which theywere affected and not affected by code smells. While this result might seem
6 https://issues.apache.org/jira/browse/HBASE-514

26 Fabio Palomba et al.
Table 9: ORs of independent factors when building logistic model. Statisticallysignificant ORs are reported in bold face.
Dependent Variable Smell Presence Size Their InteractionChange-proneness 4.46 1.7 8.41Defect-proneness 1.74 0.93 2.11
a contradiction with respect to what observed in RQ2 and in the previousstudy by Khomh et al (2012), our interpretation is that classes that werefault-prone in the past will still continue to be fault-prone, even if a smell wasremoved. Moreover, since a smell removal requires a change to the code, itcan have side effects like any other change, thus possibly affecting the fault-proneness independently of the smell. This is also in agreement with previousstudies that used the past fault-proneness history of classes to predict theirfuture faults (Ostrand et al, 2005). In essence, there seems to be no directcause-effect relationships between the presence of code smells and the classfault-proneness. Rather, those are two different negative phenomena that tendto occur in some classes of a software project.
When analyzing only the bugs introduced after the smell appearance (Fig.10), we can observe that also in this case the results are in line with thosereported above. Indeed, there are no relevant changes between the findingsachieved using or not such a filtering (based on the SZZ algorithm). As ex-plained before, this is simply due to the fact that most of the code smells areintroduced during the first commit of a class in the repository (Tufano et al,2017).
Finally, it is important to point out that our analyses might be influencedby several confounding factors. For instance, it is likely that larger classes aremore likely to change over time and to be subject to bug-fix activities. To ver-ify the influence of the size attribute on the results achieved in the context ofRQ2 and RQ3 we built logistic regression models (Hosmer Jr and Lemeshow,2004) relating the two phenomena, i.e., change- and fault-proneness, with in-dependent variables represented by the presence of a smell, the size of thecomponent, and their interaction. Table 9 reports the ORs achieved from suchan analysis. Statistically significant values, i.e., those for which the p-valueis lower than 0.05, are reported in bold face. From this analysis, we can no-tice that the presence of code smells is significantly related to the increase ofchange-proneness. The size of code components also affects change-proneness,although at a lower extent, while the interaction of smell presence and size hasa strong impact on the change-proneness. In terms of fault-proneness, only theinteraction between the independent variables is statistically significant. Thisconfirms what we observed in RQ3: code smells are not necessarily the directcause of the class fault-proneness.
Moreover, to be sure that the results achieved in the context of RQ2 andRQ3 were not simply due to a reflection of code size, we re-ran our analysisby considering the change- and the fault-proneness of smelly and non-smellyclasses having different size. In particular:

On the Diffuseness and the Impact on Maintainability of Code Smells 27
Fig. 10: SZZ Analysis: Fault-proneness of classes affected by a code smellcompared to the fault-proneness of the same classes during the time period inwhich they were not affected by a code smell.
1. we grouped together smelly classes with similar size by considering theirdistribution in terms of size. Specifically, we compute the distribution ofthe lines of code of classes affected by code smells. This first step results inthe construction of (i) the group composed by all the classes having a sizelower than the first quartile of the distribution of the size of the classes, i.e.,small size; (ii) the group composed by all the smelly classes having a size

28 Fabio Palomba et al.
between the first and the third quartile of the distribution, i.e., mediumsize; and (iii) the group composed by the smelly classes having a size largerthan the third quartile of the distribution of the size of the classes, i.e.,large size;
2. we applied the same strategy for grouping small, medium, and large non-smelly classes; and
3. we computed the change- and the fault-proneness for each class belongingto the six groups, in order to investigate whether smelly-classes are morechange- and fault-prone regardless of their size.
The obtained results are consistent with those discussed above. The interestedreader can find them in our online appendix (Palomba et al, 2017).
Summary for RQ3. While the class change-proneness can benefit fromcode smell removal, the presence of code smells in many cases is not neces-sarily the direct cause of the class fault-proneness, but rather a co-occurringphenomenon.
5 Threats to Validity
This section discusses the threats that might affect the validity of our study.The main threats related to the relationship between theory and observa-
tion (construct validity) are due to imprecisions/errors in the measurementswe performed. Above all, we relied on a tool we built and made publicly avail-able in our online appendix (Palomba et al, 2017) to detect candidate codesmell instances. Our tool exploits conservative detection rules aimed at en-suring high recall at the expense of low precision. Then, two of the authorsmanually validated the identified code smells to discard false positives. Still,we cannot exclude the presence of false positives/negatives in our dataset.
We assessed the change- and fault-proneness of a class Ci in a release rjas the number of changes and the number of bug fixes Ci was subject to inthe time period t between the rj and the rj+1 release dates. This implies thatthe length of t could play a role in the change- and fault-proneness of classes(i.e., the longer t the higher the class change- and fault-proneness). However,it is worth noting that:
1. This holds for both smelly and non-smelly classes, thus reducing the biasof t as a confounding factor.
2. To mitigate such a threat we completely re-run our analyses by consideringa normalized version of class change- and fault-proneness. In particular, wecomputed the change-proneness of a class Ci in a release rj as:
change proneness(Ci, rj) =#Changes(Ci)rj−1→rj
#Changes(rj−1 → rj)
where #Changes(Ci)rj−1→rjis the number of changes performed to Ci by
developers during the evolution of the system between the rj−1’s and the

On the Diffuseness and the Impact on Maintainability of Code Smells 29
rj ’s release dates and #Changes(rj−1 → rj) is the total number of changesperformed on the whole system during the same time period. In a similarway, we computed the fault-proneness of a class Ci in a release rj as:
fault proneness(Ci, rj) =NOBF (Ci)rj−1→rj
NOBF (rj−1 → rj)
where NOBF (Ci)rj−1→rjis the number of bug fixing activities performed
on Ci by developers between the rj−1’s and the rj ’s release dates andNOBF (rj−1 → rj) is the total number of bugs fixed in the whole systemduring the same time period.
The achieved results are reported in our online appendix (Palomba et al,2017) and are consistent with those reported in Section 4.
In addition, we cannot exclude imprecisions in the measurement of thefault-proneness of classes due to misclassification of issues (e.g., an enhance-ment classified as a bug) in the issue-tracking systems (Antoniol et al, 2008).At least, the systems we consider use an explicit classification of bugs, distin-guishing them from other issues.
We relied on the SZZ algorithm (Sliwerski et al, 2005) to investigate whetherthere is a temporal relationship between the occurrence of a code smell anda bug induction. We are aware that such an algorithm only gives a rough ap-proximation of the set of commits inducing a fix, because (i) the line-baseddifferencing of git has intrinsic limitations, and (ii) in some cases a bug can befixed without modifying the lines inducing it, e.g., by adding a workaround orin general changing the control-flow elsewhere.
The main threats related to the relationship between the treatment andthe outcome (conclusion validity) might be represented by the analysis methodexploited in our study. We discussed our results by presenting descriptivestatistics and using proper non-parametric correlation tests (p-values wereproperly adjusted when multiple comparisons were performed by applying theHolms correction procedure previously described). In addition, the practicalrelevance of the differences observed in terms of change- and fault-pronenessis highlighted by effect size measures.
Threats to internal validity concern factors that could influence our obser-vations. The fact that code smells disappear, may or may not be related torefactoring activities occurred between the observed releases. In other words,other changes might have produced such effects. We are aware that we cannotclaim a direct cause-effect relation between the presence of code smells andfault- and change-proneness of classes, which can be influenced by several otherfactors. In particular, our observations may be influenced by the different de-velopment phases encountered over the change history as well as by developer-related factors (e.g., experience and workload). Also, we acknowledge that suchmeasures could simply reflect the “importance” of classes in the analyzed sys-tems and in particular their central role in the software evolution process. Forexample, we expect classes controlling the business logic of a system to also bethe ones more frequently modified by developers (high change-proneness) and

30 Fabio Palomba et al.
then possibly subject to the introduction of bugs (high fault-proneness). It ispossible that such classes are also the ones more frequently affected by codesmells, thus implying high change- and fault-proneness of smelly classes. Anin-depth analysis of how such factors influence change- and fault-proneness ofclasses is part of our future agenda.
Finally, regarding the generalization of our findings (external validity) tothe best of our knowledge this is the largest study—in terms of number of soft-ware releases (395), and considered code smell types (13)—on the diffusenessof code smells and their impact on maintainability properties. However, we areaware that we limited our attention only to Java systems, due to limitationsof the infrastructure we used (e.g., the code smell detection tool only works onJava code). Further studies aiming at replicating our work on systems writtenin other programming languages are desirable. Moreover, we focused on open-source systems only, and we cannot speculate about how the results would bedifferent when analyzing industrial systems. Replications of the study in thecontext of industrial systems may be worthwhile in order to corroborate ourfindings.
6 Discussion and Conclusion
This paper reported a large study conducted on 395 releases of 30 Java opensource projects, aimed at understanding the diffuseness of code smells in Javaopen source projects and their relation with source code change- and fault-proneness. The study considered 17,350 instances of 13 different code smelltypes, firstly detected using a metric-based approach and then manually vali-dated.
The results highlighted the following findings:
– Diffuseness of smells. The most diffused smells are the one related to sizeand complexity such as Long Method, Spaghetti Code, and to some extentComplex Class or God Class. This seems to suggests that a simple metric-based monitoring of code quality could already give enough indicationsabout the presence of poor design decisions or in general of poor codequality. Smells not related to size like Message Chains and Lazy Classare less diffused, although there are also cases of such smells with highdiffuseness, see for example Class Data Should Be Private and SpeculativeGenerality.
– Relation with change- and fault-proneness. Generally speaking, ourresults confirm the results of the previous study by Khomh et al (2012),i.e., classes affected by code smells tend to be more change- and fault-pronethan others, and that this is even more evident when classes are affected bymultiple smells. At the same time, if we analyze the fault-proneness resultsfor specific types of smells, we can also notice that high fault-proneness isparticularly evident for smells such as Message Chain that are not highlydiffused.

On the Diffuseness and the Impact on Maintainability of Code Smells 31
Table 10: Summary of the results achieved
Code Smell Diffuseness Removal Effect Removal Effecton Change-Proneness on Fault-Proneness
Inappropriate Intimacy High High MediumLong Method High High LimitedSpaghetti Code High High LimitedSpeculative Generality High High LimitedGod Class Medium High LimitedComplex Class Medium High LimitedRefused Bequest Medium High LimitedMessage Chain Low Medium LimitedFeature Envy Low Limited MediumCDSBP High Limited LimitedLPL Medium Limited LimitedLazy Class Low Limited LimitedMiddle Man Low Limited Limited
– Effect of smell removal on change- and fault-proneness. Removingcode smells is beneficial most of the times for the code change-proneness.On the other side, we found no substantial differences between the fault-proneness of classes in the periods when they were affected by smells andwhen they were not (e.g., before the smell introduction, or after the smellremoval). This partially contrast the results of previous studies (Khomhet al, 2012) and seems to indicate that the smell is not the direct causeof fault-proneness but rather a co-occurring phenomenon in some parts ofthe system that are intrinsically fault-prone for various reasons. This alsoconfirms the principle that a class exhibiting faults in the past is still likelyto exhibit faults in the future (Ostrand et al, 2005).
Our findings clearly show that code smells should be carefully monitored byprogrammers, since all of them are related to maintainability aspects such aschange- and fault-proneness. Table 10 shows a summary of our findings, wherewe ranked the code smells based on the effect of their removal on change- andfault-proneness. Looking at the table we can see that the removal of sevenhighly diffused smells, i.e., Inappropriate Intimacy, Long Method, SpaghettiCode, Speculative Generality, God Class, Complex Class, and Refused Bequestprovide a high benefit in terms of change-proneness: thus, on the one handpractitioners should carefully monitor these smells and plan refactoring ac-tions to improve the overall maintainability of the code; on the other hand,researchers should focus on the construction of automatic tools able to identifyand remove these smells.
The removal of other smells seems to be less relevant from a practical per-spective, since it does not substantially help in improving the maintainabilityof the source code. Our results also suggest that developers might use codesmell detectors as a way to locate portions of source code that need moretesting activities.
As for our future research agenda, we will focus on the definition of recom-menders able to alert developers about the presence of potential problematicclasses based on their (evolution of) change- and fault-proneness and rankthem based on the potential benefits provided by their removal. Moreover,
32 Fabio Palomba et al.
we plan to further analyze other factors influencing the change- and fault-proneness of classes.
References
Abbes M, Khomh F, Gueheneuc YG, Antoniol G (2011) An empirical studyof the impact of two antipatterns, blob and spaghetti code, on programcomprehension. In: Proceedings of the 2011 15th European Conference onSoftware Maintenance and Reengineering, IEEE Computer Society, CSMR’11, pp 181–190
Antoniol G, Ayari K, Di Penta M, Khomh F, Gueheneuc YG (2008) Is it a bugor an enhancement?: a text-based approach to classify change requests. In:Proceedings of the 2008 conference of the Centre for Advanced Studies onCollaborative Research (CASCON 2008), October 27-30, 2008, RichmondHill, Ontario, Canada, p 23
Arcoverde R, Garcia A, Figueiredo E (2011) Understanding the longevity ofcode smells: preliminary results of an explanatory survey. In: Proceedingsof the International Workshop on Refactoring Tools, ACM, pp 33–36
Bavota G, Qusef A, Oliveto R, De Lucia A, Binkley D (2012) An empiricalanalysis of the distribution of unit test smells and their impact on softwaremaintenance. In: 28th IEEE International Conference on Software Mainte-nance, ICSM 2012, Trento, Italy, September 23-28, 2012, pp 56–65
Bavota G, De Lucia A, Di Penta M, Oliveto R, Palomba F (2015) An exper-imental investigation on the innate relationship between quality and refac-toring. Journal of Systems and Software 107:1–14
Chatzigeorgiou A, Manakos A (2010) Investigating the evolution of bad smellsin object-oriented code. In: Proceedings of the 2010 Seventh InternationalConference on the Quality of Information and Communications Technology,IEEE Computer Society, QUATIC ’10, pp 106–115
Cohen J (1988) Statistical power analysis for the behavioral sciences, 2nd edn.Lawrence Earlbaum Associates
Conover WJ (1998) Practical Nonparametric Statistics, 3rd edn. WileyCunningham W (1993) The WyCash portfolio management system. OOPS
Messenger 4(2):29–30, DOI 10.1145/157710.157715D’Ambros M, Bacchelli A, Lanza M (2010) On the impact of design flaws
on software defects. In: Proceedings of the 10th International Conferenceon Quality Software, QSIC 2010, Zhangjiajie, China, 14-15 July 2010, pp23–31
Deligiannis I, Stamelos I, Angelis L, Roumeliotis M, Shepperd M (2004) Acontrolled experiment investigation of an object-oriented design heuristicfor maintainability. Journal of Systems and Software 72(2):129 – 143
Fernandes E, Oliveira J, Vale G, Paiva T, Figueiredo E (2016) A review-based comparative study of bad smell detection tools. In: Proceedings ofthe 20th International Conference on Evaluation and Assessment in SoftwareEngineering, ACM, New York, NY, USA, EASE ’16, pp 18:1–18:12, DOI
On the Diffuseness and the Impact on Maintainability of Code Smells 33
10.1145/2915970.2915984, URL http://doi.acm.org/10.1145/2915970.
2915984
Fowler M (1999) Refactoring: improving the design of existing code. Addison-Wesley
Gatrell M, Counsell S (2015) The effect of refactoring on change and fault-proneness in commercial c# software. Science of Computer Programming102(0):44 – 56
Gırba T, Ducasse S, Kuhn A, Marinescu R, Daniel R (2007) Using conceptanalysis to detect co-change patterns. In: Ninth International Workshop onPrinciples of Software Evolution: In Conjunction with the 6th ESEC/FSEJoint Meeting, ACM, IWPSE ’07, pp 83–89
Grissom RJ, Kim JJ (2005) Effect sizes for research: A broad practical ap-proach, 2nd edn. Lawrence Earlbaum Associates
Holm S (1979) A simple sequentially rejective Bonferroni test procedure. Scan-dinavian Journal on Statistics 6:65–70
Hosmer Jr DW, Lemeshow S (2004) Applied logistic regression. John Wiley &Sons
Kessentini M, Vaucher S, Sahraoui H (2010) Deviance from perfection is a bet-ter criterion than closeness to evil when identifying risky code. In: Proceed-ings of the IEEE/ACM International Conference on Automated SoftwareEngineering, ACM, ASE ’10, pp 113–122
Khomh F, Di Penta M, Gueheneuc YG (2009a) An exploratory study of theimpact of code smells on software change-proneness. In: 16th Working Con-ference on Reverse Engineering, WCRE 2009, 13-16 October 2009, Lille,France, IEEE Computer Society, pp 75–84
Khomh F, Vaucher S, Gueheneuc YG, Sahraoui H (2009b) A bayesian ap-proach for the detection of code and design smells. In: Proceedings of the9th International Conference on Quality Software, IEEE CS Press, HongKong, China, pp 305–314
Khomh F, Di Penta M, Gueheneuc YG, Antoniol G (2012) An exploratorystudy of the impact of antipatterns on class change- and fault-proneness.Empirical Software Engineering 17(3):243–275
Kruchten P, Nord RL, Ozkaya I (2012) Technical debt: From metaphor totheory and practice. IEEE Software 29(6):18–21, DOI 10.1109/MS.2012.167
Lanza M, Marinescu R (2010) Object-Oriented Metrics in Practice: Using Soft-ware Metrics to Characterize, Evaluate, and Improve the Design of Object-Oriented Systems. Springer
Li W, Shatnawi R (2007) An empirical study of the bad smells and class errorprobability in the post-release object-oriented system evolution. Journal ofSystems and Software pp 1120–1128
Lopez M, Habra N (2015) Relevance of the cyclomatic complexity threshold forthe java programming language. Software Measurement European Forum
Lozano A, Wermelinger M, Nuseibeh B (2007) Assessing the impact of badsmells using historical information. In: Ninth international workshop onPrinciples of software evolution: in conjunction with the 6th ESEC/FSEjoint meeting, ACM, New York, NY, USA, IWPSE ’07, pp 31–34

34 Fabio Palomba et al.
Marinescu R (2004) Detection strategies: Metrics-based rules for detectingdesign flaws. In: 20th International Conference on Software Maintenance(ICSM 2004), 11-17 September 2004, Chicago, IL, USA, IEEE ComputerSociety, pp 350–359
Moha N, Gueheneuc YG, Duchien L, Meur AFL (2010) Decor: A method forthe specification and detection of code and design smells. IEEE Transactionson Software Engineering 36(1):20–36
Moonen L (2001) Generating robust parsers using island grammars. In:Proceedings of the Eighth Working Conference on Reverse Engineering,WCRE’01, Stuttgart, Germany, October 2-5, 2001, p 13
Munro MJ (2005) Product metrics for automatic identification of “bad smell”design problems in java source-code. In: Proceedings of the 11th Interna-tional Software Metrics Symposium, IEEE Computer Society Press
Olbrich S, Cruzes DS, Basili V, Zazworka N (2009) The evolution and impactof code smells: A case study of two open source systems. In: Proceedings ofthe 2009 3rd International Symposium on Empirical Software Engineeringand Measurement, ESEM ’09, pp 390–400
Olbrich SM, Cruzes D, Sjøberg DIK (2010) Are all code smells harmful? Astudy of god classes and brain classes in the evolution of three open sourcesystems. In: 26th IEEE International Conference on Software Maintenance(ICSM 2010), September 12-18, 2010, Timisoara, Romania, pp 1–10
Oliveto R, Khomh F, Antoniol G, Gueheneuc YG (2010) Numerical signaturesof antipatterns: An approach based on b-splines. In: Capilla R, Ferenc R,Dueas JC (eds) Proceedings of the 14th Conference on Software Maintenanceand Reengineering, IEEE Computer Society Press
Ostrand TJ, Weyuker EJ, Bell RM (2005) Predicting the location and numberof faults in large software systems. IEEE Trans Software Eng 31(4):340–355
Palomba F, Bavota G, Di Penta M, Oliveto R, De Lucia A (2014) Do theyreally smell bad? a study on developers’ perception of bad code smells.In: In Proceedings of the 30th IEEE International Conference on SoftwareMaintenance and Evolution (ICSME’14), Victoria, Canada, pp 101–110
Palomba F, Bavota G, Di Penta M, Oliveto R, Poshyvanyk D, De Lucia A(2015a) Mining version histories for detecting code smells. Software En-gineering, IEEE Transactions on 41(5):462–489, DOI 10.1109/TSE.2014.2372760
Palomba F, Bavota G, Di Penta M, Oliveto R, Poshyvanyk D, De Lu-cia A (2015b) Mining version histories for detecting code smells. IEEETrans Software Eng 41(5):462–489, DOI 10.1109/TSE.2014.2372760, URLhttp://dx.doi.org/10.1109/TSE.2014.2372760
Palomba F, De Lucia A, Bavota G, Oliveto R (2015c) Anti-pattern detection:Methods, challenges, and open issues. Advances in Computers 95:201–238,DOI 10.1016/B978-0-12-800160-8.00004-8
Palomba F, Di Nucci D, Panichella A, Oliveto R, De Lucia A (2016a) On thediffusion of test smells in automatically generated test code: An empiricalstudy. In: Proceedings of the 9th International Workshop on Search-basedSoftware Testing, SBST 2016

On the Diffuseness and the Impact on Maintainability of Code Smells 35
Palomba F, Panichella A, Lucia AD, Oliveto R, Zaidman A (2016b) Atextual-based technique for smell detection. In: 2016 IEEE 24th Inter-national Conference on Program Comprehension (ICPC), pp 1–10, DOI10.1109/ICPC.2016.7503704
Palomba F, Bavota G, Oliveto R, Fasano F, Di Penta M, De Lucia A (2017)Bad code smells study - online appendix. URL https://dibt.unimol.it/
fpalomba/reports/badSmell-analysis/index.html
Peters R, Zaidman A (2012) Evaluating the lifespan of code smells using soft-ware repository mining. In: 16th European Conference on Software Main-tenance and Reengineering, CSMR 2012, Szeged, Hungary, March 27-30,2012, pp 411–416
Ratiu D, Ducasse S, Gırba T, Marinescu R (2004) Using history informationto improve design flaws detection. In: 8th European Conference on SoftwareMaintenance and Reengineering (CSMR 2004), 24-26 March 2004, Tampere,Finland, Proceeding, IEEE Computer Society, pp 223–232
Saboury A, Musavi P, Khomh F, Antoniol G (2017) An empirical study of codesmells in javascript projects. In: 2017 IEEE 24th International Conferenceon Software Analysis, Evolution and Reengineering (SANER), pp 294–305,DOI 10.1109/SANER.2017.7884630
Sahin D, Kessentini M, Bechikh S, Deb K (2014) Code-smell detection asa bilevel problem. ACM Trans Softw Eng Methodol 24(1):6:1–6:44, DOI10.1145/2675067, URL http://doi.acm.org/10.1145/2675067
Sjoberg D, Yamashita A, Anda B, Mockus A, Dyba T (2013) Quantifyingthe effect of code smells on maintenance effort. Software Engineering, IEEETransactions on 39(8):1144–1156, DOI 10.1109/TSE.2012.89
Sliwerski J, Zimmermann T, Zeller A (2005) When do changes induce fixes?In: Proceedings of the 2005 International Workshop on Mining SoftwareRepositories, MSR 2005, ACM
Student (1921) An experimental determination of the probable error of drspearman’s correlation coefficients. Biometrika 13(2/3):263–282, URL http:
//www.jstor.org/stable/2331754
Tsantalis N, Chatzigeorgiou A (2009) Identification of move method refactor-ing opportunities. IEEE Transactions on Software Engineering 35(3):347–367
Tufano M, Palomba F, Bavota G, Oliveto R, Di Penta M, De Lucia A, Poshy-vanyk D (2015) When and why your code starts to smell bad. In: 37thIEEE/ACM International Conference on Software Engineering, ICSE 2015,Florence, Italy, May 16-24, 2015, Volume 1, pp 403–414
Tufano M, Palomba F, Bavota G, Di Penta M, Oliveto R, De Lucia A, Poshy-vanyk D (2016) An empirical investigation into the nature of test smells.In: Proceedings of the 31st IEEE/ACM International Conference on Au-tomated Software Engineering, ACM, New York, NY, USA, ASE 2016, pp4–15
Tufano M, Palomba F, Bavota G, Oliveto R, Penta MD, Lucia AD, PoshyvanykD (2017) When and why your code starts to smell bad (and whether thesmells go away). IEEE Transactions on Software Engineering PP(99):1–1,

36 Fabio Palomba et al.
DOI 10.1109/TSE.2017.2653105Vaucher S, Khomh F, Moha N, Gueheneuc YG (2009) Tracking design smells:
Lessons from a study of god classes. In: Proceedings of the 2009 16th Work-ing Conference on Reverse Engineering (WCRE’09), pp 145–158
Yamashita AF, Moonen L (2012) Do code smells reflect important maintain-ability aspects? In: 28th IEEE International Conference on Software Main-tenance, ICSM 2012, Trento, Italy, September 23-28, 2012, pp 306–315
Yamashita AF, Moonen L (2013) Exploring the impact of inter-smell relationson software maintainability: an empirical study. In: 35th International Con-ference on Software Engineering, ICSE ’13, San Francisco, CA, USA, May18-26, 2013, pp 682–691
Appendix
Table 11 shows the diffuseness of the analyzed code smells in the subjectsystems.

On the Diffuseness and the Impact on Maintainability of Code Smells 37
Tab
le11
:C
od
esm
ell
diff
use
nes
sin
the
sub
ject
syst
ems:
min
-max
inst
an
ces
inth
esy
stem
s’re
lease
s.
Syst
emC
DS
BP
Com
ple
xF
eatu
reG
od
Inap
pro
pri
ate
Lazy
Lon
gL
PL
Mes
sage
Mid
dle
Ref
use
dS
pagh
etti
Sp
ecu
lati
ve
Cla
ssE
nvy
Cla
ssIn
tim
acy
Cla
ssM
eth
od
Ch
ain
Man
Beq
ues
tC
od
eG
ener
ality
Arg
oU
ML
5-1
9(0
.6-1
.3)
4-1
0(0
.5-0
.7)
1-2
(0.1
-0.1
)2-6
(0.2
-0.4
)0-8
(0.0
-0.5
)0-0
(0.0
-0.0
)18-3
0(2
.3-2
.1)
0-0
(0.0
-0.0
)0-0
(0.0
-0.0
)1-2
(0.1
-0.1
)0-4
(0.0
-0.3
)14-2
1(1
.8-1
.5)
12-2
9(1
.5-2
.0)
Ant
1-7
(1.2
-0.9
)0-4
(0.0
-0.5
)0-6
(0.0
-0.9
)0-6
(0.0
-0.7
)2-2
2(2
.4-2
.7)
0-0
(0.0
-0.0
)6-3
8(7
.2-4
.6)
0-1
7(0
.0-2
.0)
0-3
(0.0
-0.4
)0-2
(0.0
-0.2
)0-1
4(0
.0-1
.7)
4-3
0(5
.0-3
.7)
1-4
(1.2
-0.5
)aT
un
es3-1
2(2
.0-1
.8)
0-1
(0.0
-0.2
)0-6
(0.0
-0.9
)0-1
(0.0
-0.2
)0-8
(0.0
-1.2
)1-9
(0.7
-1.4
)6-3
1(4
.3-3
.2)
0-1
1(0
.0-1
.7)
0-0
(0.0
-0.0
)0-0
(0.0
-0.0
)1-8
(0.7
-1.3
)6-2
1(4
.3-3
.4)
0-1
0(0
.0-1
.6)
Cass
an
dra
5-1
4(1
.6-2
.4)
0-4
(0.0
-0.6
)0-2
(0.0
-0.3
)0-2
(0.0
-0.4
)2-2
4(0
.0-4
.0)
0-1
(0.0
-0.2
)3-2
2(1
.0-4
.0)
0-1
6(0
.0-2
.7)
0-2
(0.0
-0.3
)2-8
(0.7
-1.4
)0-2
(0.0
-0.3
)0-6
(0.0
-0.9
)0-1
6(0
.0-2
.9)
Der
by
20-4
0(1
.3-1
.0)
21-2
5(1
.5-1
.3)
1-1
(0.6
-0.5
)20-2
6(1
.3-1
.4)
0-0
(0.0
-0.0
)1-1
(0.4
-0.5
)176-2
12
(0.8
-0.8
)0-0
(0.0
-0.0
)0-0
(0.0
-0.0
)2-2
(0.1
-0.1
)10-1
9(0
.7-0
.9)
12-1
6(0
.8-0
.8)
19-2
6(1
.3-1
.4)
Ecl
ipse
Core
15-3
2(2
.1-2
.7)
8-3
5(1
.1-2
.9)
0-6
(0.0
-0.5
)3-1
5(0
.4-1
.3)
0-1
6(0
.0-1
.4)
2-1
7(0
.2-1
.4)
36-1
80
(4.8
-15.2
)0-0
(0.0
-0.0
)0-0
(0.0
-0.0
)2-2
(0.3
-0.2
)7-3
1(0
.9-2
.6)
12-2
5(1
.6-2
.1)
4-1
5(0
.5-1
.8)
Ela
stic
Sea
rch
3-5
(0.2
-0.2
)0-5
(0.0
-0.2
)0-0
(0.0
-0.0
)1-3
(0.1
-0.1
)4-4
(0.2
-0.1
)4-7
(0.2
-0.3
)11-2
7(0
.7-1
.9)
0-0
(0.0
-0.0
)0-0
(0.0
-0.0
)0-0
(0.0
-0.0
)0-3
(0.0
-0.1
)3-8
(0.2
-0.4
)3-9
(0.2
-0.4
)F
reeM
ind
0-5
(0.0
-0.9
)0-6
(0.0
-1.2
)0-1
(0.0
-0.2
)0-2
(0.0
-0.4
)0-6
(0.0
-0.7
)0-3
(0.0
-0.6
)0-1
3(0
.0-2
.6)
0-0
(0.0
-0.0
)0-0
(0.0
-0.0
)0-1
(0.0
-0.1
)0-3
(0.0
-0.6
)0-9
(0.0
-1.9
)0-2
(0.0
-0.4
)H
ad
oop
0-3
(0.0
-0.1
)0-2
(0.0
-0.1
)0-4
(0.0
-0.1
)0-2
(0.0
-0.1
)2-1
0(1
.6-0
.1)
3-9
(2.3
-0.1
)5-1
7(3
.8-0
.1)
0-1
2(0
.0-0
.1)
0-0
(0.0
-0.1
)0-1
(0.0
-0.1
)0-0
(0.0
-0.1
)6-7
(4.6
-0.1
)3-5
(2.5
-0.1
)H
SQ
LD
B0-7
(0.0
-1.5
)0-5
(0.0
-1.1
)0-3
(0.0
-0.7
)0-1
1(0
.0-1
.5)
8-2
4(1
4.8
-5.4
)0-9
(0.0
-2.1
)10-1
24
(1.4
-14.1
)0-1
3(0
.0-2
.9)
0-4
(0.0
-0.9
)0-0
(0.0
-0.0
)0-1
3(0
.0-0
.2.8
)2-2
9(3
.7-6
.5)
0-3
(0.0
-0.7
)H
base
5-1
6(3
.1-2
.3)
2-7
(1.2
-1.0
)1-9
(0.7
-1.3
)1-8
(0.7
-1.1
)2-1
4(1
.2-2
.0)
2-2
1(1
.4-3
.1)
12-4
2(7
.5-6
.4)
3-4
5(1
.9-6
.5)
0-0
(0.0
-0.0
)0-0
(0.0
-0.0
)0-2
2(0
.0-3
.2)
3-5
(1.8
-0.7
)2-1
0(1
.3-1
.4)
Hib
ern
ate
0-0
(0.0
-0.0
)0-0
(0.0
-0.0
)0-0
(0.0
-0.0
)0-0
(0.0
-0.0
)0-0
(0.0
-0.0
)0-0
(0.0
-0.0
)0-0
(0.0
-0.0
)0-0
(0.0
-0.0
)0-0
(0.0
-0.0
)0-0
(0.0
-0.0
)0-0
(0.0
-0.0
)0-0
(0.0
-0.0
)0-0
(0.0
-0.0
)H
ive
3-7
(0.7
-0.6
)1-3
(0.1
-0.3
)4-1
1(0
.9-0
.9)
0-2
(0.0
-0.2
)0-8
(0.0
-0.7
)1-1
(0.1
-0.1
)11-8
3(2
.7-7
.4)
14-7
7(3
.4-6
.9)
0-1
(0.0
-0.1
)0-1
(0.0
-0.1
)4-6
(0.9
-0.5
)2-4
(0.5
-0.4
)6-3
1(1
.5-2
.8)
Incu
bati
ng
12-1
6(4
.8-5
.0)
6-6
(2.5
-1.9
)3-1
0(1
.1-3
.1)
6-6
(2.8
-1.7
)12-3
0(4
.8-9
.5)
1-4
(0.4
-1.3
)89-1
10
(3.5
-3.5
)27-3
5(1
0.8
-11.1
)0-0
(0.0
-0.0
)0-1
(0.0
-0.3
)10-1
7(4
.0-5
.3)
6-8
(2.4
-2.5
)6-8
(2.3
-2.5
)Iv
y1-1
(0.4
-0.3
)0-0
(0.0
-0.0
)0-0
(0.0
-0.0
)0-2
(0.0
-0.6
)0-6
(0.0
-1.7
)0-0
(0.0
-0.0
)2-2
2(0
.7-6
.3)
13-2
1(4
.6-6
.0)
0-0
(0.0
-0.0
)1-1
(0.3
-0.3
)0-0
(0.0
-0.0
)1-4
(0.4
-1.2
)4-5
(1.4
-1.4
)L
uce
ne
39-4
7(2
.2-2
.0)
3-5
(0.2
-0.2
)0-0
(0.0
-0.0
)0-0
(0.0
-0.0
)8-1
4(0
.5-0
.6)
0-1
0(0
.0-0
.5)
61-7
4(3
.5-3
.2)
0-0
(0.0
-0.0
)0-0
(0.0
-0.0
)0-0
(0.0
-0.0
)7-9
(0.4
-0.4
)10-1
6(0
.6-0
.7)
29-3
8(1
.6-1
.7)
JE
dit
0-7
(0.0
-1.3
)4-2
1(1
.8-4
.0)
0-2
(0.0
-0.4
)0-6
(0.0
-1.2
)0-8
(0.0
-1.5
)0-0
(0.0
-0.0
)8-3
3(3
.5-6
.4)
0-9
(0.0
-1.7
)0-0
(0.0
-0.0
)0-0
(0.0
-0.0
)0-3
(0.0
-0.6
)3-1
8(1
.3-3
.5)
4-1
4(1
.8-2
.7)
JH
otD
raw
0-0
(0.0
-0.0
)0-4
(0.0
-0.6
)0-0
(0.0
-0.0
)0-2
(0.0
-0.3
)0-0
(0.0
-0.0
)0-0
(0.0
-0.0
)0-0
(0.0
-0.0
)0-0
(0.0
-0.0
)0-0
(0.0
-0.0
)0-0
(0.0
-0.0
)0-0
(0.0
-0.0
)0-0
(0.0
-0.0
)0-0
(0.0
-0.0
)JF
reeC
hart
0-9
(0.0
-1.2
)0-3
(0.0
-0.4
)0-0
(0.0
-0.0
)0-9
(0.0
-1.4
)0-0
(0.0
-0.0
)0-0
(0.0
-0.0
)2-6
3(2
.3-8
.1)
8-6
7(9
.3-8
.6)
0-0
(0.0
-0.0
)0-0
(0.0
-0.0
)0-0
(0.0
-0.0
)1-3
(1.1
-0.4
)2-5
(2.3
-0.6
)JB
oss
18-6
5(0
.8-1
.4)
9-2
3(0
.4-0
.5)
0-1
(0.0
-0.1
)1-1
6(0
.1-0
.4)
0-4
(0.0
-0.1
)0-6
(0.1
-0.0
)45-1
35
(1.9
-2.8
)0-0
(0.0
-0.0
)0-0
(0.0
-0.0
)0-3
(0.0
-0.1
)24-5
5(1
.0-1
.1)
23-5
4(1
.0-1
.1)
23-6
5(1
.0-1
.4)
JV
lt0-2
(0.0
-0.9
)0-0
(0.0
-0.0
)0-4
(0.0
-1.8
)0-1
(0.0
-0.0
)2-4
(1.2
-0.5
)1-5
(0.7
-2.2
)5-7
(3.0
-3.1
)0-2
(0.0
-0.9
)0-0
(0.0
-0.0
)0-1
(0.0
-0.5
)1-3
(0.7
-1.4
)3-4
(1.8
-1.8
)1-3
(0.7
-1.3
)jS
L0-0
(0.0
-0.0
)0-0
(0.0
-0.0
)0-0
(0.0
-0.0
)0-0
(0.0
-0.0
)0-0
(0.0
-0.0
)0-0
(0.0
-0.0
)0-0
(0.0
-0.0
)0-0
(0.0
-0.0
)0-0
(0.0
-0.0
)0-0
(0.0
-0.0
)0-0
(0.0
-0.0
)0-0
(0.0
-0.0
)0-0
(0.0
-0.0
)K
ara
f0-2
(0.0
-0.4
)0-0
(0.0
-0.0
)1-1
(0.4
-0.2
)0-2
(0.0
-0.3
)0-2
(0.0
-0.3
)0-0
(0.0
-0.0
)1-5
(0.5
-1.1
)0-2
(0.0
-0.3
)0-0
(0.0
-0.0
)0-0
(0.0
-0.0
)0-0
(0.0
-0.0
)5-9
(2.0
-1.9
)2-2
(2.1
-0.4
)N
utc
h3-1
2(1
.6-4
.6)
0-0
(0.0
-0.0
)1-5
(0.5
-1.9
)0-0
(0.0
-0.0
)4-1
2(2
.1-4
.9)
1-9
(0.6
-3.5
)7-1
7(3
.8-6
.6)
0-1
6(0
.0-6
.1)
0-0
(0.0
-0.0
)0-6
(0.0
-6.3
)0-2
(0.0
-0.7
)0-4
(0.0
-1.5
)0-3
(0.0
-1.2
)P
ig3-5
(1.2
-0.5
)0-7
(0.0
-0.8
)0-1
(0.0
-0.1
2)
0-3
(0.0
-0.3
)4-1
0(1
.6-1
.1)
0-1
(0.0
-0.1
)0-4
3(0
.0-4
.7)
0-3
(0.0
-0.3
)0-1
(0.0
-0.1
)0-2
(0.0
-0.2
)0-1
3(0
.0-1
.4)
0-7
(0.0
-0.8
)4-2
0(1
.7-2
.2)
Qp
id11-1
8(1
.1-1
.9)
4-1
0(0
.4-1
.0)
0-2
(0.0
-0.2
)4-6
(0.6
-0.7
)4-1
0(0
.4-1
.1)
0-1
(0.0
-0.1
)21-3
3(2
.1-3
.6)
22-3
9(2
.2-4
.2)
0-1
(0.0
-0.1
)0-1
(0.0
-0.1
)1-8
(0.1
-0.9
)3-8
(0.4
-0.8
)32-3
8(3
.3-4
.1)
Sax
0-0
(0.0
-0.0
)0-0
(0.0
-0.0
)0-0
(0.0
-0.0
)0-0
(0.0
-0.0
)0-0
(0.0
-0.0
)0-0
(0.0
-0.0
)0-0
(0.0
-0.0
)0-0
(0.0
-0.0
)0-0
(0.0
-0.0
)0-0
(0.0
-0.0
)0-0
(0.0
-0.0
)0-0
(0.0
-0.0
)0-0
(0.0
-0.0
)S
tru
ts7-1
2(1
.1-1
.1)
0-4
(0.0
-0.4
)0-1
(0.0
-0.1
)0-2
(0.0
-0.3
)6-1
2(0
.9-1
.0)
0-0
(0.0
-0.0
)3-1
4(0
.5-1
.4)
0-0
(0.0
-0.0
)0-0
(0.0
-0.0
)0-0
(0.0
-0.0
)1-2
(0.2
-0.2
)3-9
(0.5
-0.9
)0-6
(0.0
-0.6
)W
icket
0-0
(0.0
-0.0
)2-2
(0.3
-0.2
)0-0
(0.0
-0.0
)4-4
(0.5
-0.5
)4-6
(0.5
-0.7
)0-0
(0.0
-0.0
)4-4
(0.5
-0.5
)0-0
(0.0
-0.0
)0-0
(0.0
-0.0
)0-0
(0.0
-0.0
)3-7
(0.4
-0.8
)11-1
1(1
.4-1
.3)
18-1
8(2
.7-2
.2)
Xer
ces
10-4
2(6
.0-5
.7)
4-1
0(2
.4-1
.4)
0-1
7(0
.0-2
.3)
5-1
1(3
.0-1
.5)
2-3
4(1
.2-4
.6)
0-4
(0.0
-0.5
)48-1
23
(2.7
-6.9
)4-2
9(2
.5-4
.0)
2-3
(1.3
-0.4
)0-0
(0.0
-0.0
)0-1
5(0
.0-2
.0)
4-9
(2.4
-1.3
)2-1
1(1
.2-1
.5)
Overall
0-6
5(0
.0-5
.0)
0-3
5(0
.0-4
.0)
0-1
7(0
.0-3
.1)
0-2
6(0
.0-1
.7)
0-3
4(0
.0-9
.5)
0-2
1(0
.0-3
.5)
0-2
12
(0.0-1
5.2)
0-7
7(0
.0-1
1.0)
0-4
(0.0-0
.9)
0-8
(0.0-6
.3)
0-5
5(0
.0-3
.2)
0-5
4(0
.0-6
.5)
0-6
5(0
.0-4
.1)


![House of Cards: Code Smells in Open-source C# Repositories · The presence of an excessive number of smells in a software system ... code smells [7]–[9]. Further, the impact of](https://img.pdfslide.net/doc/110x75/5ae532847f8b9a495c8f9b4f/house-of-cards-code-smells-in-open-source-c-presence-of-an-excessive-number-of.jpg)