Embed Size (px)
Citation preview
On the Growth Effect of Stock Market Liberalizations
Nandini Gupta and Kathy Yuan∗
January 2008
Abstract
Using panel data on industries in emerging markets, we investigate theeffect of a stock market liberalization on industry growth. Consistent withthe view that liberalization reduces financing constraints, we find that indus-tries that are more externally dependent and face better growth opportuni-ties grow faster following liberalization. However, this increase in industrygrowth appears to come from an expansion in the size of existing firms ratherthan through new firm entry, which is puzzling since new firms are typicallymore financially constrained. To reconcile these conflicting results we examinewhether barriers to entry arising out of institutional and regulatory frictionsaffect the impact of liberalization on new firms. We find that liberalizationleads to new firm growth at the industry level in countries that allocate capi-tal more efficiently, and in industries that privatize government-owned firms.From a policy perspective these results suggest that a stock market liberal-ization will have a larger and more uniformly distributed growth impact if itis accompanied by complementary reforms that enhance competition.
(JEL Classification Codes: E32, F30, F36, F43, G15, G18, G28. Key-words: Stock market liberalization, industrial growth, external dependence,growth opportunity, economic reforms.)
∗Nandini Gupta is at the Kelley School of Business at Indiana University,
[email protected]. Kathy Yuan is at the Ross School of Business at the University of
Michigan, [email protected]. We thank Chris Lundblad for sharing data. We also thank Cam
Harvey, Peter Henry, Rene Stulz, and Linda Tesar for helpful comments.
1 Introduction
Many developing countries have reduced restrictions on foreign investment in do-mestic equity securities and on local investment abroad. A growing literature atthe country level shows that such stock market liberalizations promote economicgrowth (Bekaert, Harvey, and Lundblad (2005)), but their impact and desirabilitycontinues to be intensely debated (see Edison, Klein, Ricci, and Sloek (2002) fora recent survey).1 To address this important question we go beyond country-levelanalyses and use industry-specific data to investigate the disaggregated impact ofliberalization.
We investigate whether the cross-sectional impact of a stock market liberaliza-tion across industries is consistent with the view that liberalization promotes eco-nomic growth by lowering the cost of external capital (Bekaert and Harvey (2000);Henry (2000a), (2000b)), and by improving the alignment between capital andgrowth opportunities at the country level (Fisman and Love (2004); Bekaert, Har-vey, Lundblad, and Siegel (2007)). Using Rajan and Zingales’ (1998) measure ofexternal finance dependence, we find that industries that are technologically moredependent on external finance for their investment needs grow significantly fasterfollowing liberalization. And, using lagged values of the global price earnings ratiofor each industry to capture growth opportunities (Bekaert, Harvey, Lundblad, andSiegel (2007)), we find that industries that face better growth opportunities expe-rience significantly higher value added growth following liberalization. Hence, theindustry level results support the view that liberalization leads to higher growthby reducing financing constraints.
However, the impact of liberalization within industries reveals a puzzle. Theincrease in value added growth following a stock market liberalization appearsto come from an expansion in the size of existing firms rather than through theentry of new firms at the industry level. This observation holds even for indus-tries that are more dependent on external financing and that face greater growthopportunities. Since new firms are likely to be more financially constrained, thisseems to contradict the finding that liberalization facilitates growth by reducing
1See Prasad, Rogoff, Wei, and Kose (2004), Eichengreen (2002), and Errunza (2005) for surveysregarding the effect of financial globalization, capital account liberalization, and foreign portfolioinvestment on economic growth, respectively.
1
financing constraints. To reconcile these conflicting results we hypothesize thatthe differential impact of liberalization on new versus existing firms may be dueto institutional and regulatory barriers to entry at the country and industry level.
Investigating barriers to entry at the country level first, we hypothesize thatnew firms may face higher entry barriers in countries that allocate capital lessefficiently because of frictions such as the quality of institutions and regulations.Using a measure of capital allocative efficiency based on Wurgler (2000), we findthat following liberalization more externally dependent industries and industriesthat face better growth opportunities experience an 8.4% and 0.4% higher growthrate respectively in the number of establishments if they are located in a countrythat allocates capital more efficiently. These results imply that a stock marketliberalization will facilitate higher new firm growth if it is accompanied by com-plementary reforms that improve the allocative efficiency of capital. Second, atthe industry level, we investigate whether industries that have natural barriers toentry arising out of technological factors such as economies of scale are differentlyaffected by liberalization. Using U.S. industry concentration ratios to capture nat-ural barriers to entry, we find that less concentrated industries, which have lowerentry barriers, grow significantly faster following liberalization.
Third, we focus on the reduction of barriers to entry at the industry level byconsidering the privatization of government-owned firms. Government-owned firmsare often successful at using their political connections to obtain protection fromcompetition (Chari and Gupta (2007)). By reducing the presence of government-owned firms, privatization may lower entry barriers for new firms, allowing them totake advantage of lower financing constraints following liberalization. Consistentwith this hypothesis, we find that following liberalization, industries that priva-tize government-owned firms experience a 15.6% higher growth in the number ofestablishments compared to industries that do not privatize.
This paper contributes to the debate on the growth effect of stock marketliberalizations by demonstrating that the benefits of liberalization are likely tobe unequally distributed across and within industries. We show that the growthimpact of a stock market liberalization is likely to be larger and more uniformlydistributed across new and existing firms if it is accompanied by complementaryreforms that enhance competition and improve the efficiency of capital alloca-
2
tion. In contrast, other studies on the growth effect of stock market liberalizationscontrol for contemporaneous reforms but do not consider complementarities withliberalization (Henry (2000a); Bekaert, Harvey, and Lundblad (2005)).
Our paper is related to the literature on financing constraints in emerging mar-kets. For example, Lins, Strickland, and Zenner (2005) show that the sensitivity ofinvestment to cash flows decreases significantly following an ADR listing by firmsfrom emerging markets, and Beck, Demirguc-Kunt, Laeven, and Levine (2004) findthat industries that are dominated by small firms grow faster in more financiallydeveloped markets. Our results suggest that financing constraints in emergingmarkets have a real impact on growth.
Among studies that examine how financial development can reduce financingconstraints, Fisman and Love (2003) show that in countries with weaker financialinstitutions, industries that depend more on trade credit exhibit higher rates ofgrowth. Laeven (2002) finds that banking sector deregulation relaxes financingconstraints more for small firms in emerging markets, and Love (2003) finds thatinvestment is less sensitive to internal funds at the firm level in more financiallydeveloped countries. Our results suggest that the reduction in financing constraintsfollowing liberalization is likely to have a larger and more uniform impact acrossfirms if liberalization is accompanied by complementary reforms that reduce entrybarriers.
The remainder of the paper is organized as follows. In section 2, we describethe average effect of liberalization across industries. In section 3, we form testablehypotheses. In section 4 we describe the data, section 5 describes the results, andsection 6 concludes the paper.
2 The average effect of liberalization on industrial growth
We start out by investigating the aggregate impact of a stock market liberalizationon industry growth by estimating the the following panel-data specification withindustry-country fixed effects:
Growthi,j,t = β1Liberalizationj,t + β2Xi,j,t−1 + Y eart + αi,j + εi,j,t, (1)
3
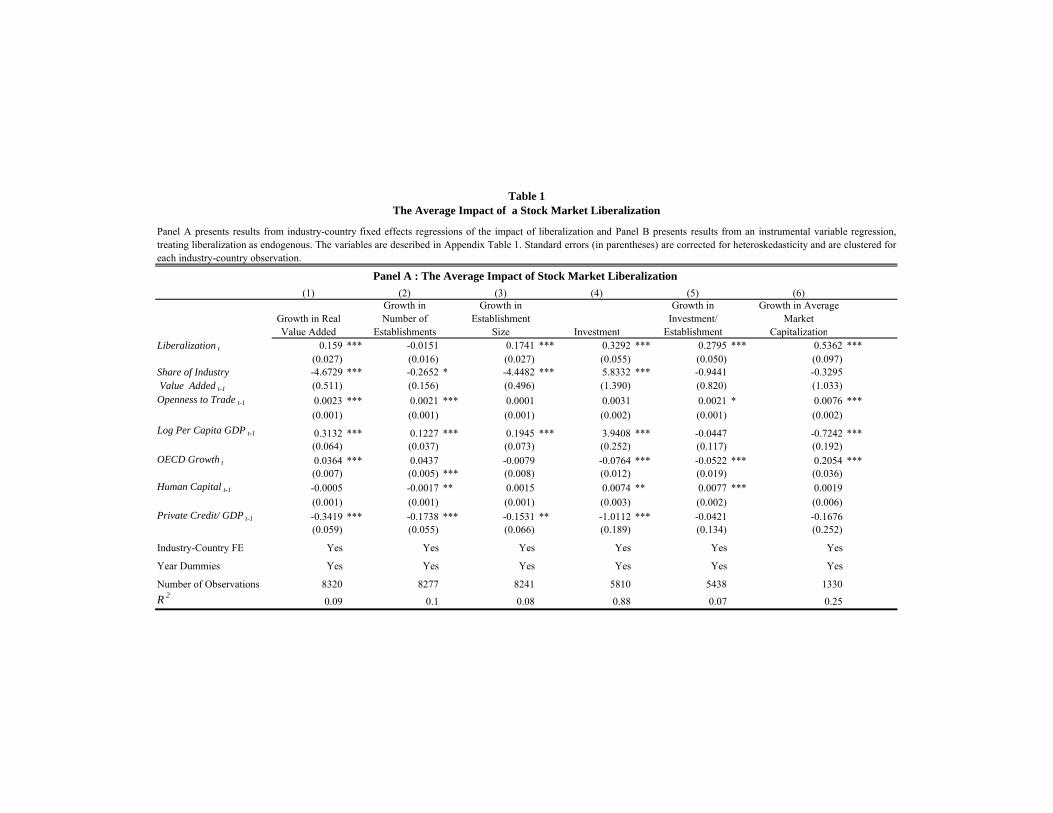
where the dependent variables are the growth rates of 1) real value added, 2) es-tablishment size, 3) number of establishments, 4) investment per establishment, 5)average market capitalization, and the level of 6) (log) investment in industry i,country j and year t; Liberalization is a dummy variable that is equal to one for allyears including and after the year of a stock market liberalization; Xi,j,t−1 repre-sents lagged values of annual industry and country-specific factors that may affectgrowth, Y eart represents year dummies that capture contemporaneous shocks;and, αi,j represents industry-country fixed effects. This is a difference in differenceapproach with a control group in each year that includes those countries in thesample that have either not yet liberalized or never liberalize their stock marketsduring the sample period. The error term εi,j,t, which captures unobservable shocksthat affect industry performance, is corrected for heteroskedasticity and clusteredfor each industry and country observation.
From the results reported in Panel A of Table 1 we note that industry growthin real value added increases by 15.9% and growth in the average size of estab-lishments increases by 17.4% on average following a stock market liberalization(columns 1 and 3). However, liberalization is not followed by an increase in thegrowth rate of the number of establishments in an industry (column 2). Hence,the increase in industry growth occurs mainly through an expansion in the sizeof existing firms rather than through the entry of new firms at the industry level.The significant increase in the level of investment (column 4), the growth ratesof investment per establishment (column 5), and average market capitalization(column 6), suggests that liberalization reduces financing constraints and the costof equity financing. The industry level evidence supports the view that a stockmarket liberalization will reduce financing constraints in the economy (Bekaertand Harvey (2000); Henry (2000a), (2000b)).
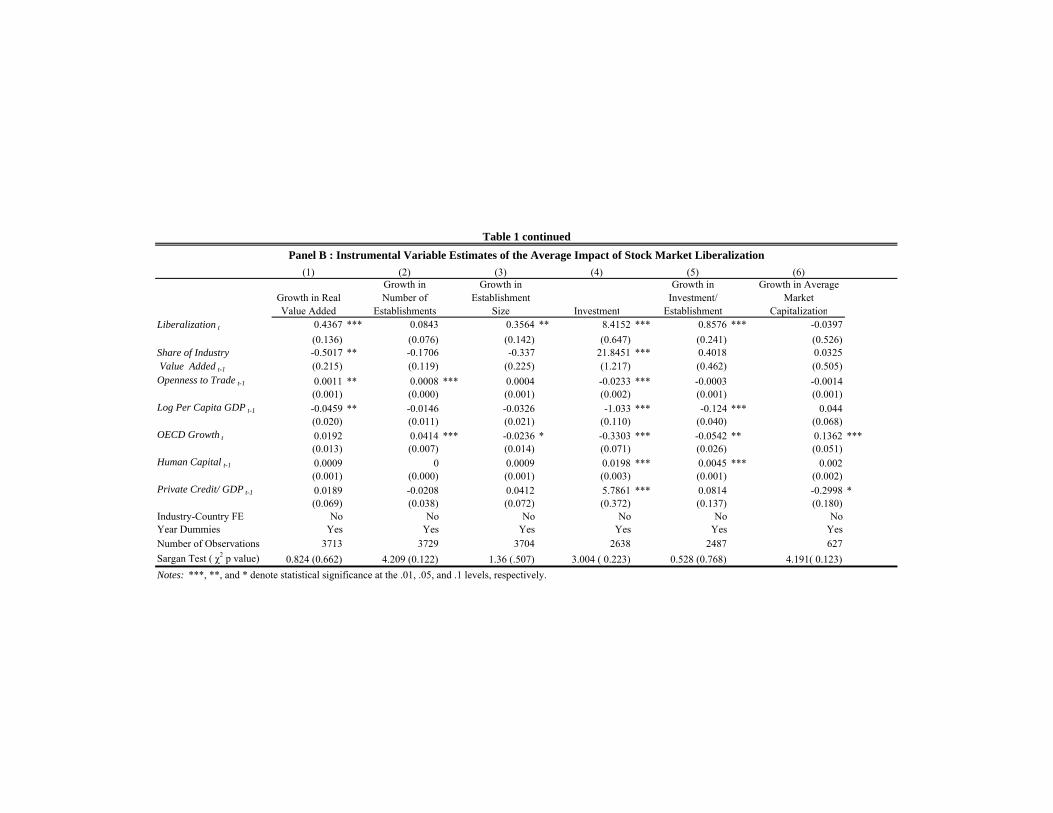
In equation (1) we control for industry-country fixed effects, which would ad-dress the endogeneity of the liberalization decision to unobservable industry andcountry factors that do not change over time. To address endogeneity that mayarise if the liberalization decision is based on time-varying unobservable factors, weprovide instrumental variable estimates in Panel B of Table 1. We use the meanpre-liberalization values of log per capita GDP and the share of international trade
4
in GDP, and the rule of law at the country level as instrumental variables.2 Thefirst two variables capture initial economic conditions that are likely to influencethe likelihood of liberalization, and have been used as an instrument for liberal-ization reforms by Godoy and Stiglitz (2006), while the rule of law variable hasbeen used as an instrument for financial market development by Claessens andLaeven (2003). Since the instrumental variables are constant we do not includefixed effects in the instrumental variable regression. Appendix Table 2B providespairwise correlations between the instrumental variables, liberalization, and indus-try growth, which show that none of the instruments are correlated with growth,while all three are significantly correlated with the probability of liberalization.3
Overall the instrumental variable results reported in Panel B of Table 1 are robustto correcting for potential omitted variable bias. The effect of liberalization re-mains similar with the exception of average market capitalization per firm. Notethat results from a Sargan overidentification test reported in Panel B indicatesthat these instruments are valid and are not correlated with any of the depen-dent variables. The first stage results with Growth in Real Value Added as thedependent variable are reported in Appendix Table 2C.
Since new firms are likely to face higher financial constraints, the lack of a sig-nificant impact of liberalization on new firm growth seems to contradict the countrylevel evidence that stock market liberalizations reduce financing constraints. Inthe remainder of this paper we examine the cross-sectional evidence to gain moreinsight into the impact of liberalization on industry growth.
3 Hypotheses
We develop hypotheses examining whether the cross-sectional impact of liberal-ization is consistent with the country level evidence that liberalization reducesfinancing constraints by lowering the cost of external capital (Bekaert and Harvey
2With the exception of Bekaert, Harvey, and Lundblad (2005), who address endogeneity by in-cluding country-specific growth opportunities in the growth regression, the literature has typicallynot addressed the endogeneity of the liberalization decision to economic growth.
3The correlations with Liberalization are estimated coefficient values obtained from univariatecross-sectional probit regressions with the error term clustered for each industry-country obser-vation. The correlations with value added growth are the estimated coefficients obtained frompooled regressions with the error term clustered for each industry-country observation.
5
(2000); Henry (2000a), (2000b)), and improving the alignment between capital andgrowth opportunities (Fisman and Love (2004); Bekaert, Harvey, Lundblad, andSiegel (2007)). Our first hypothesis provides a direct test of the argument that astock market liberalization leads to higher growth by lowering the cost of externalcapital:
Hypothesis 1 (External Dependence) If a stock market liberalization lowers thecost of external capital, then industries that depend more on external finance fortheir investment needs will grow faster following liberalization.
This industry level hypothesis is motivated by the results in Table 1 indicatingthat industry investment and market capitalization increase significantly after lib-eralization, and evidence at the country level suggesting that liberalization lowersthe cost of external capital (Bekaert and Harvey (2000); Henry (2000a), (2000b)).It is based on Rajan and Zingales’ (1998) results showing that industries that aremore dependent on external finance will grow faster in financially developed coun-tries, which have a lower wedge between the cost of external and internal capital.Therefore, if a stock market liberalization lowers the cost of external capital, thenmore externally dependent industries should grow faster following liberalization.
Our next hypothesis investigates whether liberalization facilitates industrygrowth by improving the alignment between capital and growth opportunities,as suggested by country level evidence (Fisman and Love (2004); Bekaert, Harvey,Lundblad, and Siegel (2007)). The following hypothesis describes the industry-specific implication:
Hypothesis 2 (Growth Opportunity) If a stock market liberalization improves ef-ficiency in capital allocation, then industries with better growth opportunities willgrow faster following liberalization.
The differential impact of liberalization on new versus existing firms describedin Table 1 may be due to frictions that raise entry barriers for new firms, such asthe quality of institutions and regulatory barriers. To capture this we hypothesizethat new firms may face higher entry barriers in countries that allocate capitalless efficiently due to the presence of such frictions. Inefficient allocation of capital
6
at the country level may prevent new firms from benefiting from a reduction inthe external cost of capital, or an increase in the allocative efficiency of capitalfollowing liberalization. The next two hypotheses develop this argument.
Hypothesis 3 (Allocative Efficiency and External Dependence) Following liberal-ization, industries that depend more on external finance will experience higher newfirm growth if they are located in countries that allocate capital more efficiently.
Hypothesis 4 (Allocative Efficiency and Growth Opportunity) Following liberal-ization, industries with better growth opportunities will experience higher new firmgrowth if they are located in countries that allocate capital more efficiently.
Considering entry barriers to new firms at the industry level, we examinewhether the effect of liberalization varies based on barriers arising out of the tech-nological characteristics of the industry. For example, industries that are highlyconcentrated because of economies of scale are likely to have high entry barriers.This argument leads to our next hypothesis:
Hypothesis 5 (Concentration) If more concentrated industries have higher bar-riers to entry they will experience lower growth compared to less concentrated in-dustries following a stock market liberalization.
Lastly, we consider a reduction of barriers to entry at the industry level byfocusing on the privatization of government-owned firms. Government-owned firmsare often more successful than other firms at using their political connections toobtain protection from competition through regulatory barriers (Chari and Gupta(2007)). By reducing the presence of government-owned firms, a complementaryprivatization program may lower entry barriers for new firms, thereby allowingthem to benefit from a stock market liberalization.
Hypothesis 6 (Privatization) If privatized industries have lower barriers to en-try, then these industries will grow faster following a stock market liberalization.
Therefore, the growth impact of liberalization may be larger and more uni-formly distributed if it is accompanied by complementary reforms that improvethe allocation of capital and reduce regulatory barriers to entry. In the next sec-tion we describe the data and variables used to test these hypotheses.
7
4 Data
4.1 Data on Industries
Industrial Growth: Our data consists of all emerging markets, based on the In-ternational Finance Corporation classification, that liberalized their stock marketsafter 1980 and for which we observe statistics on industrial growth. Annual dataon value added, investment, and the number of establishments at the three-digitISIC code level (International Standard Industrial Classification of All EconomicActivities) for each country are obtained from the Industrial Statistics Databasecompiled by the United Nations Industrial Development Organization (UNIDO),and data on the market capitalization of all publicly listed firms in a countryare from the Standard & Poor Emerging Markets Database. For the latter datawe match four-digit SIC (Standard Industrial Classification) categories to three-digit ISIC categories and we aggregate market capitalization across firms to obtainmarket capitalization at the three-digit ISIC industry level.
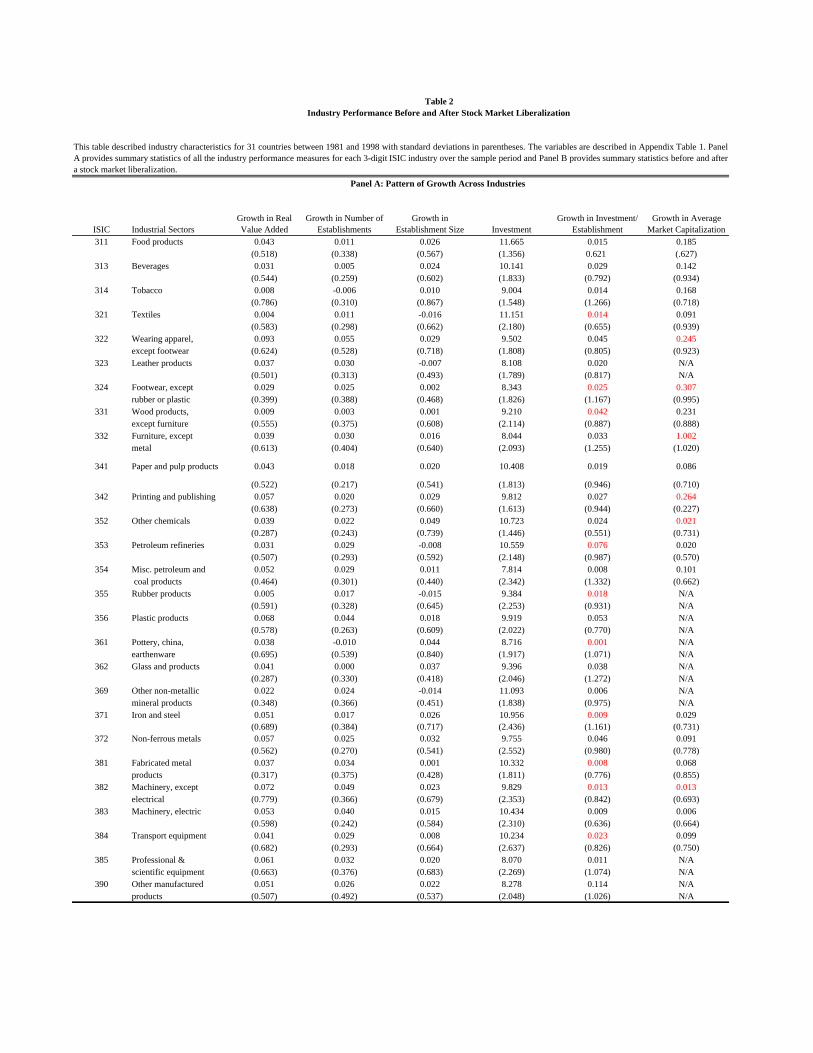
For each country and each of the 27 three-digit ISIC industrial categories weuse annual values of the level of investment and the growth rates of real valueadded, number of establishments, average establishment size, investment per es-tablishment, and average market capitalization per establishment as the depen-dent variables. Value added and investment are deflated using the GDP deflatorobtained from the World Bank’s World Development Indicators. Investment isdefined as the change in real gross fixed capital formation in an industry. We alsoconstruct the following variables: Size is defined as real value added divided bythe number of establishments in that industry, Investment per establishment isdefined as Investment divided by the number of establishments in that industry,and Average Market Capitalization is defined as the market capitalization of alllisted firms in an industry divided by the number of establishments. Growth ratesof the dependent variables are constructed as the difference in the log values ofcurrent and previous year observations. We observe an unbalanced panel of indus-trial statistics between 1981 and 1998 for the 31 countries in our sample.4 In PanelA of Table 2 we report the average values of the industry performance measures
4Countries in our data implemented stock market liberalization between 1986 and 1995.
8
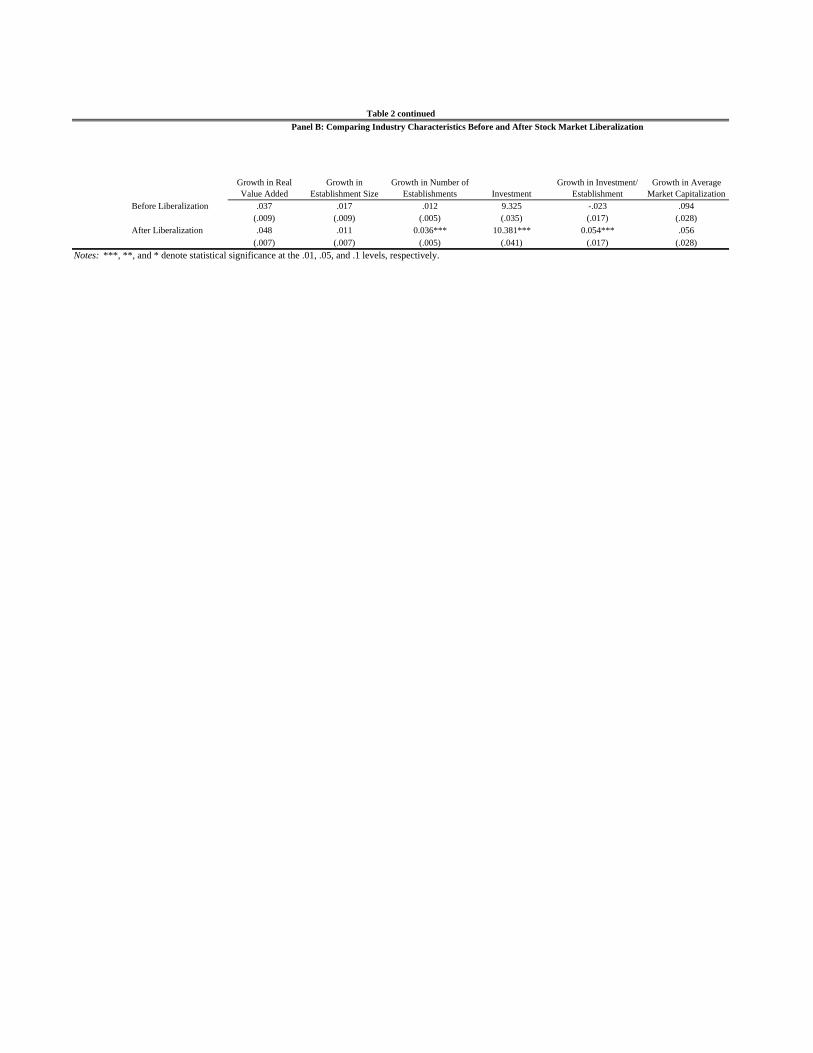
for each ISIC industry over the entire sample period. In Panel B of Table 2 weprovide descriptive statistics for the industry performance measures before andafter a stock market liberalization.
External Finance Dependence: Data on the actual use of external financingat the country and industry level is typically not available for emerging markets.Moreover, the actual level of external financing undertaken by firms will depend onthe characteristics of the financial markets in which they operate. Hence, we use anindustry’s technological dependence on external finance based on Rajan and Zin-gales (1998), which we denote External Dependence. Based on the argument thatthere are technological reasons for differences in industries’ dependence on externalfinance, implying that these differences are likely to persist across countries, Rajanand Zingales (1998) construct measures of external finance dependence using dataon listed U.S. firms. Since U.S. capital markets are relatively frictionless, this vari-able should capture differences in the technological demand for external financingamong industries. Thus, the use of external funds by U.S. firms in an industryserves as a proxy for the amount foreign firms in the same industry would raiseif their financial markets were as developed as the United States. The externalfinance dependence measure is constructed as the median value of the differencebetween capital expenditures and cash flow from operations, divided by capitalexpenditures for U.S. manufacturing firms over 1980-1989. Using Compustat datawe construct this measure for three-digit ISIC sectors.
Growth Opportunity: We use the one year lagged value of the annual globalprice to earnings ratio (Global PE Ratio) from Bekaert, Harvey, Lundblad, andSiegel (2007) to capture growth opportunities at the industry level. This is aforward-looking measure that captures investors’ expectations about an industry’sfuture growth opportunities, and it is calculated for each three-digit ISIC industryin each year between 1980 and 1997. We use the lagged value so as to allowindustries to adjust to demand shocks. Unlike the external finance dependencevariable, Global PE Ratio varies over time because growth opportunities such asthose arising out of global shocks are likely to be temporal. Note that this variablereflects exogenous growth opportunities in the world market for each industryrather than country-specific growth opportunities.
As a robustness check, we also use industry sales growth in U.S. firms to rank
9
industries according to growth opportunities, based on Fisman and Love (2004).Since capital markets in the United States are relatively frictionless, U.S. firms arelikely to react optimally to global demand shocks. Note that Fisman and Love’s(2004) growth opportunity measure does not vary over time. To capture the effectof global demand shocks, we use Compustat data to construct an annual measureof sales growth in U.S. industries, where annual Sales Growth is the industrymedian of real sales growth in each year between 1981 and 1998 for 27 three-digitISIC manufacturing industries. We use the one year lagged value of this variable.From Appendix Table 2A we note that the correlation between Fisman and Love’s(2004) constant sales growth measure, Sales Growth in 1980s, and real value addedindustry growth is equal to .159 and is not statistically significant, whereas thecorrelation between annual Sales Growth and value added growth is equal to .329and is highly significant. Note that the correlations for the time-varying variables,Global PE Ratio and Sales Growth are obtained from a panel data regressionwith value-added growth as the dependent variable and controlling for industry-country fixed effects and year dummies, with the error term clustered for eachindustry-country observation. The correlations for the constant variables, ExternalDependence and Sales Growth in 1980s are obtained from pooled regressions withthe error term clustered for each industry-country observation.
Concentration: The concentration variable is constructed using U.S. industryconcentration data from the 1992 United States Economic Census available fromthe U.S. Census Bureau. Since the United States is one of the least regulatedeconomies in the world, U.S. industry concentration is likely to most closely reflecttechnological entry barriers such as those due to economies of scale. The U.S.census data is collected for all establishments in the United States. It is availableat the four-digit SIC level, which we then match to three-digit ISIC categories.The variable Concentration is defined as the proportion of output produced bythe largest four firms in each industry. Higher values of this variable indicate thatan industry is more concentrated. Note that actual industry concentration in eachcountry, even if it were available, may capture regulatory or institutional barriersrather than technological differences across industries.
As a robustness check we use Firm Size, which measures an industry’s techno-logical composition of small firms relative to large firms. This grouping variable is
10
based on Beck, Demirguc-Kunt, Laeven, and Levine (2004), and is defined as theshare of employment in firms with less than 20 employees in each industry. It isconstructed using data on U.S. industries from the 1992 U.S. Economic Census.
Privatization: We create a new dataset on privatization at the industry andcountry level, where privatization refers to the sale of government-owned firmsto private owners. We document firm level data on privatization sales in eachcountry between 1990 and 1999 from the World Bank Privatization TransactionsDatabase. We also hand-collect data on pre-1990 privatization transactions forcountries that privatized before that year from news and government sources. Tocreate an industry level database we classify each firm according to its three-digitISIC industry code. The variable Privatization is a dummy variable that takes thevalue of one for all years including and after the year in which a government-ownedfirm is sold to private owners in a particular industry and country. Note that thisvariable varies by industry, country, and year.
4.2 Data on Countries
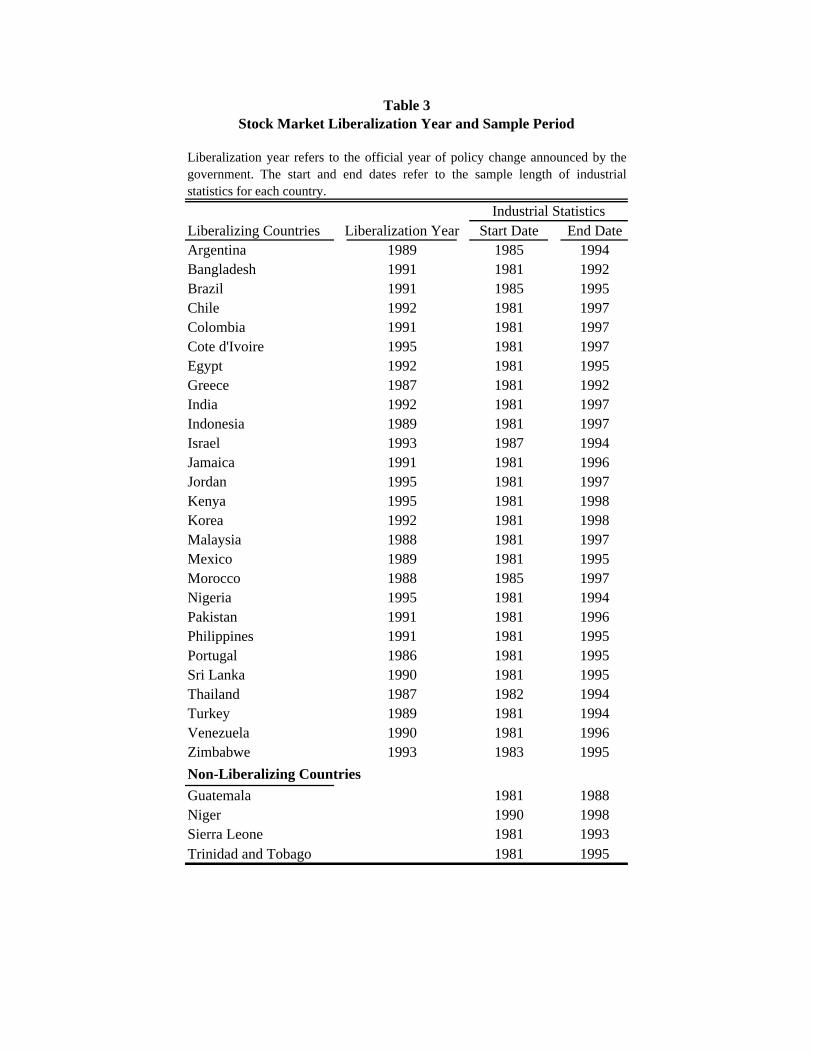
Liberalization Date: Our sample consists of 31 emerging economies of whichall but four liberalized their stock markets between 1986 and 1995. The literaturedefines a stock market liberalization as the policy decision by a country’s govern-ment to allow foreign investors to purchase shares in the country’s stock markets.We follow this convention by selecting the official liberalization date from Bekaertand Harvey (2000) and Bekaert, Harvey, and Lundblad (2005), which refers to theyear of a formal regulatory change after which foreign investors officially have theopportunity to invest in domestic equity securities in that country. In the analy-sis, Liberalization is defined as a dummy variable that is equal to one for all yearsincluding and after the year of stock market liberalization. Table 3 reports thestock market liberalization year and the sample period observed for each country.
Allocative Efficiency of Capital: We measure the efficiency of capital al-location in each country prior to a stock market liberalization, based on Wurgler(2000). Specifically, we estimate regressions with investment at the industry levelas the dependent variable and growth in real value-added as the right-hand-sidevariable for each country across all years before liberalization. The coefficient
11
of value-added growth is the measure of investment value-added elasticity at thecountry level. Higher values of this variable are associated with more efficient allo-cation of capital and therefore lower entry barriers for new firms, since it indicatesthat more investment funds are allocated to growing industries. We define Alloca-tive Efficiency as a dummy variable that is equal to one if the investment-valueadded elasticity measure of a country is above the 75th percentile of elasticity forall countries, indicating a country with lower entry barriers.
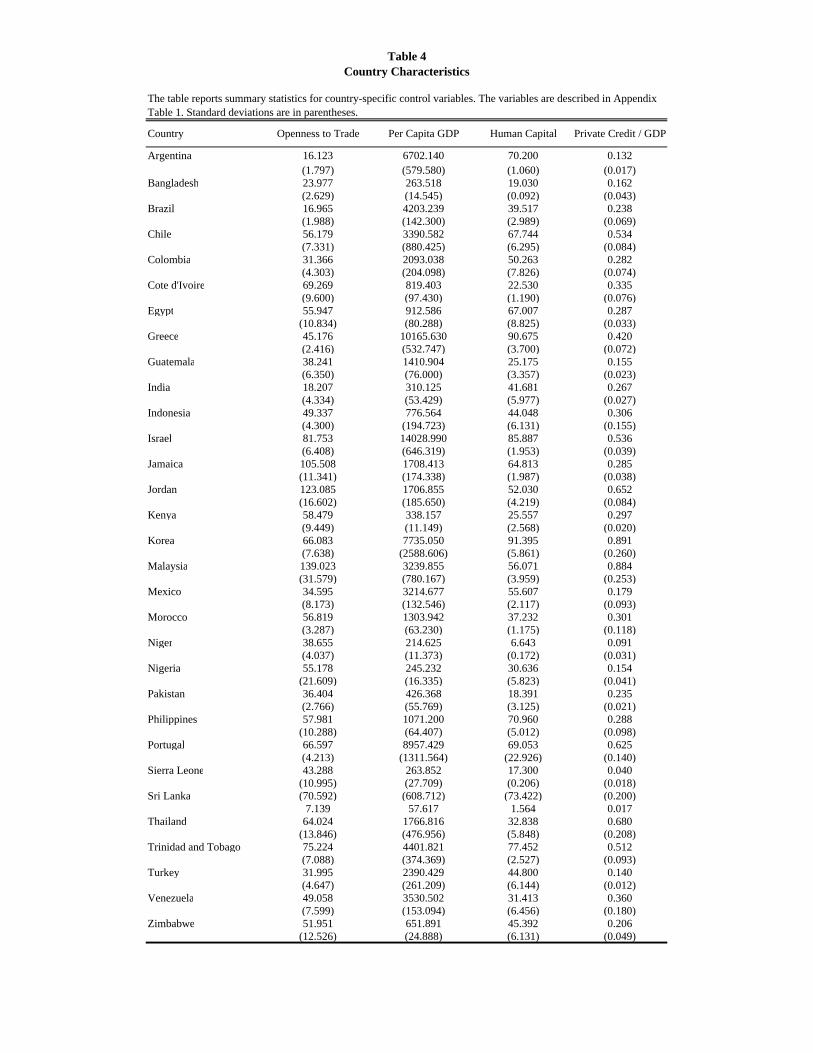
Control Variables: We control for a range of country-specific factors in theregression analysis that are expected to be related to industry growth. Theseinclude the ratio of annual exports and imports to total GDP to control for theeffects of trade liberalization and the overall availability of credit in the economyto control for other financial market reforms. Since the impact of liberalizationmay differ according to country size, we also control for annual per capita realGDP. The literature has found evidence of a significant impact of human capitalon growth (King and Levine (1993); Bekaert, Harvey, and Lundblad (2005)), so weinclude the ratio of annual secondary school enrollment to total school enrollment.We may overstate the impact of liberalization if governments time liberalizationto coincide with a boom in the world business cycle. To separate business cycleeffects and contemporaneous macroeconomic shocks from the liberalization effect,we include the average annual economic growth rate of OECD economies and yeardummies in all the regressions. To control for initial conditions and industrialstructure in an economy, all the specifications include the lagged share of eachindustry’s value added in the total value added of all industries in that country.We obtain most of the country economic variables from the World Bank’s WorldDevelopment Indicators, with the exception of the ratio of private credit to GDP,which is from Beck, Levine, and Loayza (2000). The summary statistics for all thecountry-level economic variables are reported in Table 4. As a robustness check wealso control for institutional characteristics at the country level using the CreditorRights index from La Porta, Lopez de Silanes, Shleifer, and Vishny (1998).
Contemporaneous Reforms: To control for the effect of other economicreforms, we investigate the effects of short-run macroeconomic stabilization pro-grams at the country level. Data on stabilization programs is obtained from Henry(2000a) and Hutchison (2001). We select only those stabilization dates that are
12
recorded in both sources for the countries in our data. The variable Stabilizationis equal to one for the years in which a country entered into a stand-by agreementwith the International Monetary Fund.
Instrumental Variables: For the instrumental variable analysis we use country-level data on initial economic conditions measured by the average pre-liberalizationvalues of log per capita GDP and the share of international trade in GDP. Thesedata are from the World Development Indicators Database. We also use the Ruleof Law index from La Porta, Lopez-de-Silanes, Shleifer, and Vishny (1997).
5 Disaggregating the Impact of Stock Market Liberal-
ization on Industry Growth
5.1 External Dependence and the Impact of Liberalization
To investigate the impact of a stock market liberalization across industries, weexamine whether the cross-sectional impact is consistent with the view that liber-alization reduces financing constraints by lowering the cost of external capital andimproving the alignment between capital and growth opportunities.
In Hypothesis 1 we argue that if liberalization lowers the cost of external capitalthen it will lead to higher growth in industries that are more dependent on externalfinance. To test this hypothesis we estimate the following panel data specificationwith industry-country fixed effects:
Growthi,j,t = β1Liberalizationj,t + β2(Liberalizationj,t × External Dependence)
+β3 Xi,j,t−1 + Y eart + αi,j + εi,j,t, (2)
where External Dependence captures an industry’s technological dependence onexternal finance, and the remaining variables are described below equation (1).5
This is a difference in difference approach with a control group in each year thatincludes those countries in the sample that have either not yet liberalized or neverliberalize their stock markets during the sample period. Note that in all the re-
5Note that the external dependence variable is not included separately in the specificationsince it is time-invariant and we control for industry-country fixed effects.
13
gressions here and below the error term is corrected for heteroskedasticity andclustered for each industry-country observation.
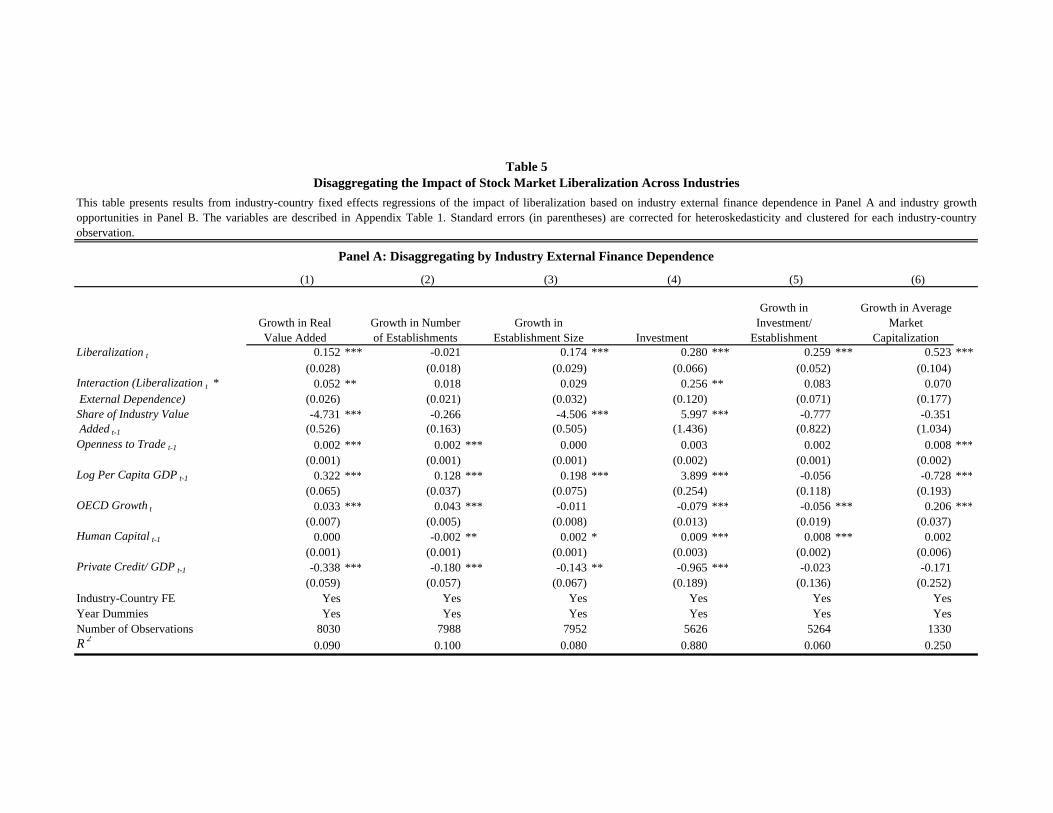
The results from estimating equation (2) are reported in Table 5, Panel A.Consistent with Hypothesis 1, we find that industries that are more dependent onexternal finance grow significantly faster following liberalization, which suggeststhat a stock market liberalization facilitates industry growth by reducing the costof external capital. For example, from the estimated coefficient of the interactionbetween liberalization and external dependence, we note that a 1 percentage pointincrease in external dependence leads to a 5.2% increase in real value added growth(column 1) and a 25.6% increase in the level of investment (column 4). This effectis economically significant compared to the unconditional effect of liberalizationdescribed in Panel B of Table 2, which shows that value added growth increasesby about one percentage point after liberalization for the whole sample. Fromthe coefficient of the interaction between liberalization and external dependence incolumn (1) we estimate that on average a stock market liberalization leads to a 1.9percentage point higher growth in real value added in the Textiles industry at the75th percentile of external finance dependence, relative to the Petroleum Refineryindustry at the 25th percentile of external finance dependence.6 These results arerobust to controlling for industry-country fixed effects and several industry andcountry characteristics. Hence, consistent with Hypothesis 1, the disaggregatedindustry level results suggest that liberalization promotes industry growth by re-ducing financing constraints. However, note that liberalization does not have asignificant impact on the growth rate of the number of establishments in moreexternally dependent industries.
The coefficient of Share in Industry Value Added suggests that there is conver-gence in industry size as smaller industries experience significantly higher growthin real value added. It also appears that countries that are more open to inter-national trade, higher-income economies, and less financially developed countrieshave higher industry growth, and that the growth rate of OECD economies has a
6This is obtained by multiplying the difference between the 75th percentile of external de-pendence (0.400) and the 25th percentile of external dependence (0.042) by 0.052, the estimatedcoefficient of the interaction between external finance dependence and liberalization reported incolumn (1) of Panel A in Table 5.
14
positive impact on real value added growth.
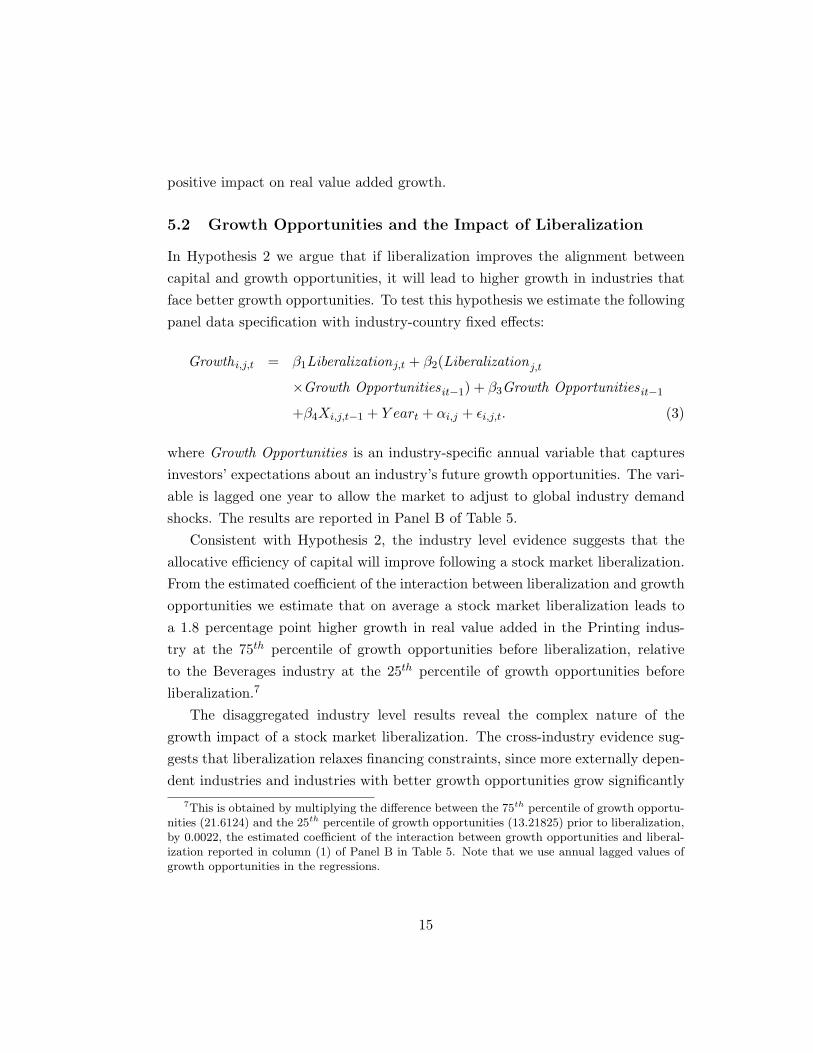
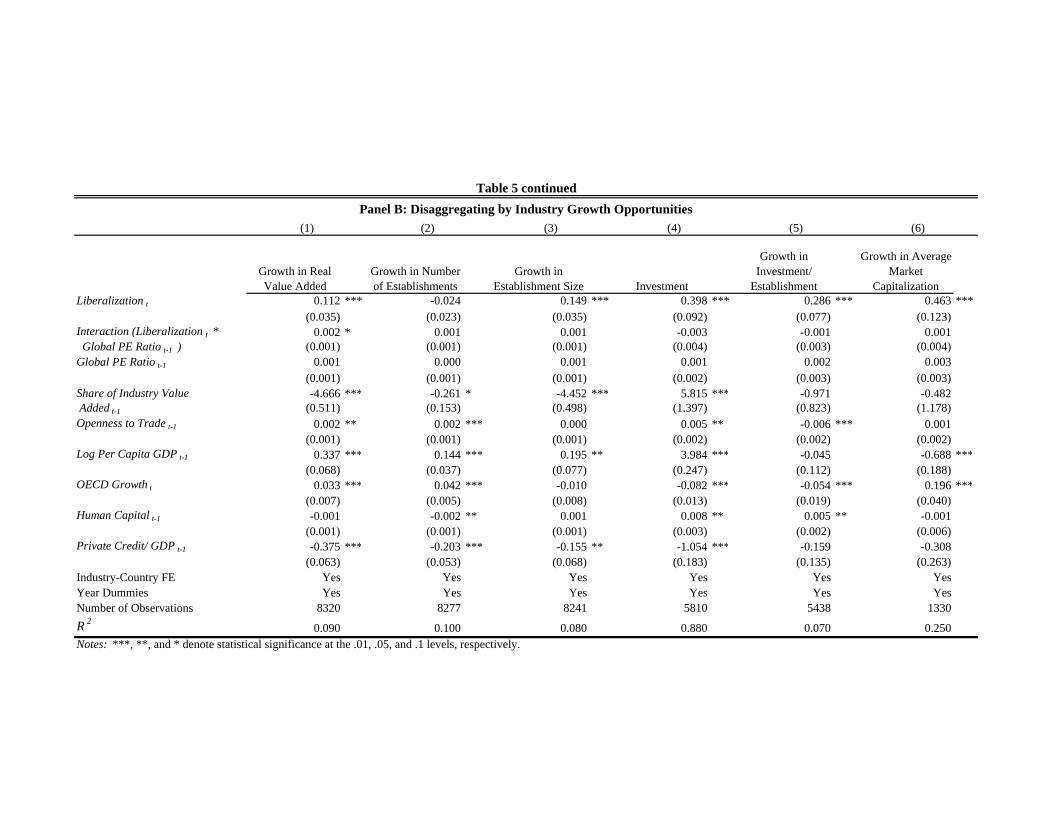
5.2 Growth Opportunities and the Impact of Liberalization
In Hypothesis 2 we argue that if liberalization improves the alignment betweencapital and growth opportunities, it will lead to higher growth in industries thatface better growth opportunities. To test this hypothesis we estimate the followingpanel data specification with industry-country fixed effects:
Growthi,j,t = β1Liberalizationj,t + β2(Liberalizationj,t
×Growth Opportunitiesit−1) + β3Growth Opportunitiesit−1
+β4Xi,j,t−1 + Y eart + αi,j + εi,j,t. (3)
where Growth Opportunities is an industry-specific annual variable that capturesinvestors’ expectations about an industry’s future growth opportunities. The vari-able is lagged one year to allow the market to adjust to global industry demandshocks. The results are reported in Panel B of Table 5.
Consistent with Hypothesis 2, the industry level evidence suggests that theallocative efficiency of capital will improve following a stock market liberalization.From the estimated coefficient of the interaction between liberalization and growthopportunities we estimate that on average a stock market liberalization leads toa 1.8 percentage point higher growth in real value added in the Printing indus-try at the 75th percentile of growth opportunities before liberalization, relativeto the Beverages industry at the 25th percentile of growth opportunities beforeliberalization.7
The disaggregated industry level results reveal the complex nature of thegrowth impact of a stock market liberalization. The cross-industry evidence sug-gests that liberalization relaxes financing constraints, since more externally depen-dent industries and industries with better growth opportunities grow significantly
7This is obtained by multiplying the difference between the 75th percentile of growth opportu-nities (21.6124) and the 25th percentile of growth opportunities (13.21825) prior to liberalization,by 0.0022, the estimated coefficient of the interaction between growth opportunities and liberal-ization reported in column (1) of Panel B in Table 5. Note that we use annual lagged values ofgrowth opportunities in the regressions.
15
faster following liberalization. However, within these industries, liberalization ap-pears to benefit existing firms rather than facilitating the entry of new firms. Thissuggests that liberalization may not ease access to credit for new firms, whichtypically face the greatest credit constraints. To reconcile these prima facie con-flicting results, we explore whether barriers to entry may prevent new firms frombenefiting from a stock market liberalization.
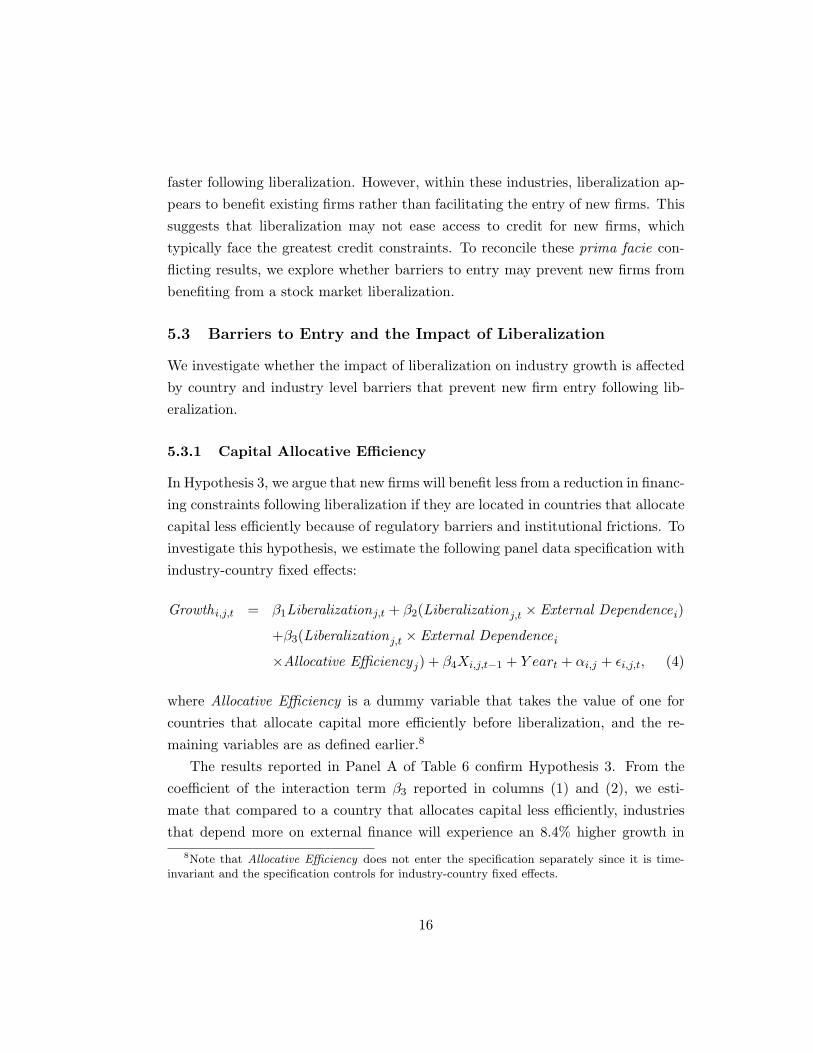
5.3 Barriers to Entry and the Impact of Liberalization
We investigate whether the impact of liberalization on industry growth is affectedby country and industry level barriers that prevent new firm entry following lib-eralization.
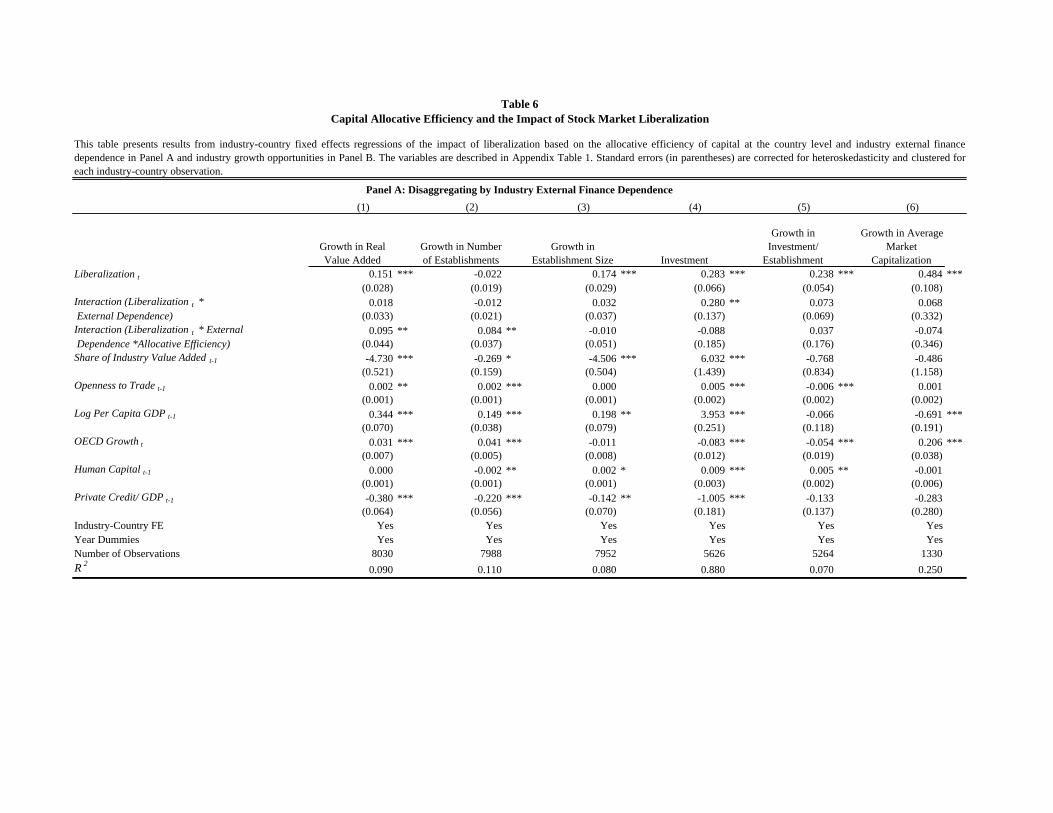
5.3.1 Capital Allocative Efficiency
In Hypothesis 3, we argue that new firms will benefit less from a reduction in financ-ing constraints following liberalization if they are located in countries that allocatecapital less efficiently because of regulatory barriers and institutional frictions. Toinvestigate this hypothesis, we estimate the following panel data specification withindustry-country fixed effects:
Growthi,j,t = β1Liberalizationj,t + β2(Liberalizationj,t × External Dependencei)
+β3(Liberalizationj,t × External Dependencei
×Allocative Efficiencyj) + β4Xi,j,t−1 + Y eart + αi,j + εi,j,t, (4)
where Allocative Efficiency is a dummy variable that takes the value of one forcountries that allocate capital more efficiently before liberalization, and the re-maining variables are as defined earlier.8
The results reported in Panel A of Table 6 confirm Hypothesis 3. From thecoefficient of the interaction term β3 reported in columns (1) and (2), we esti-mate that compared to a country that allocates capital less efficiently, industriesthat depend more on external finance will experience an 8.4% higher growth in
8Note that Allocative Efficiency does not enter the specification separately since it is time-invariant and the specification controls for industry-country fixed effects.
16
the number of establishments and a 9.5% higher growth in value added followingliberalization if they are located in a country with more efficient capital allocation.
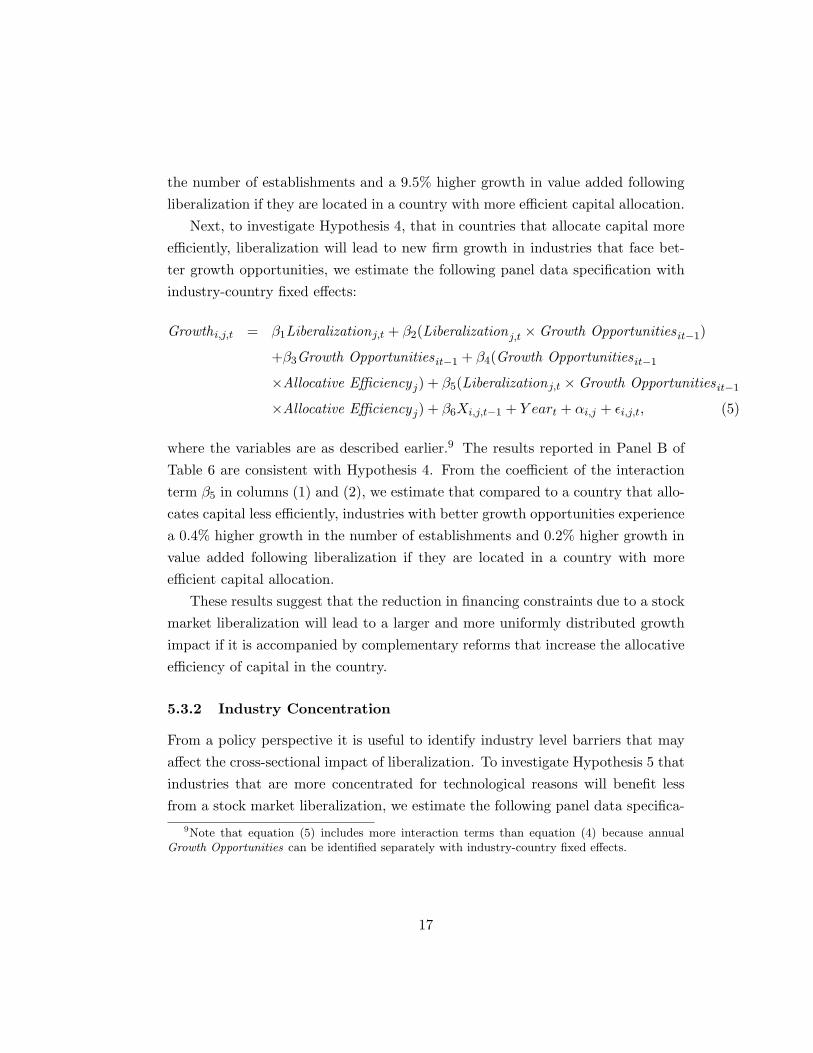
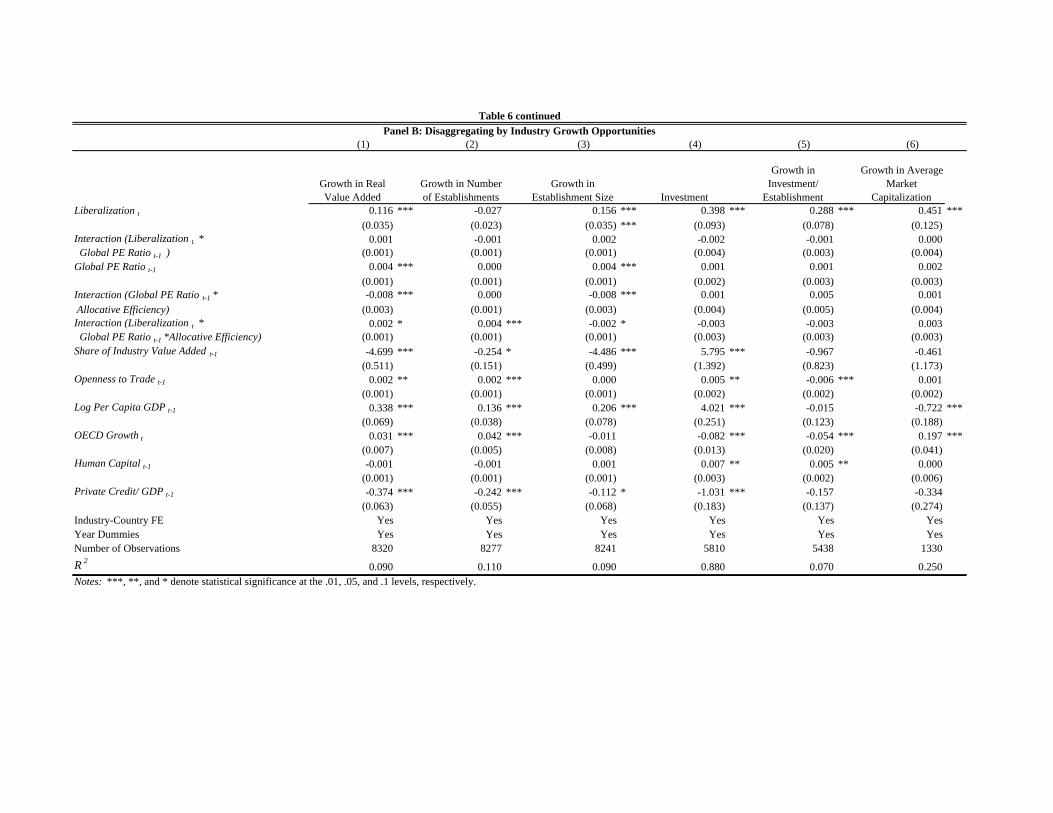
Next, to investigate Hypothesis 4, that in countries that allocate capital moreefficiently, liberalization will lead to new firm growth in industries that face bet-ter growth opportunities, we estimate the following panel data specification withindustry-country fixed effects:
Growthi,j,t = β1Liberalizationj,t + β2(Liberalizationj,t ×Growth Opportunitiesit−1)
+β3Growth Opportunitiesit−1 + β4(Growth Opportunitiesit−1
×Allocative Efficiencyj) + β5(Liberalizationj,t ×Growth Opportunitiesit−1
×Allocative Efficiencyj) + β6Xi,j,t−1 + Y eart + αi,j + εi,j,t, (5)
where the variables are as described earlier.9 The results reported in Panel B ofTable 6 are consistent with Hypothesis 4. From the coefficient of the interactionterm β5 in columns (1) and (2), we estimate that compared to a country that allo-cates capital less efficiently, industries with better growth opportunities experiencea 0.4% higher growth in the number of establishments and 0.2% higher growth invalue added following liberalization if they are located in a country with moreefficient capital allocation.
These results suggest that the reduction in financing constraints due to a stockmarket liberalization will lead to a larger and more uniformly distributed growthimpact if it is accompanied by complementary reforms that increase the allocativeefficiency of capital in the country.
5.3.2 Industry Concentration
From a policy perspective it is useful to identify industry level barriers that mayaffect the cross-sectional impact of liberalization. To investigate Hypothesis 5 thatindustries that are more concentrated for technological reasons will benefit lessfrom a stock market liberalization, we estimate the following panel data specifica-
9Note that equation (5) includes more interaction terms than equation (4) because annualGrowth Opportunities can be identified separately with industry-country fixed effects.
17
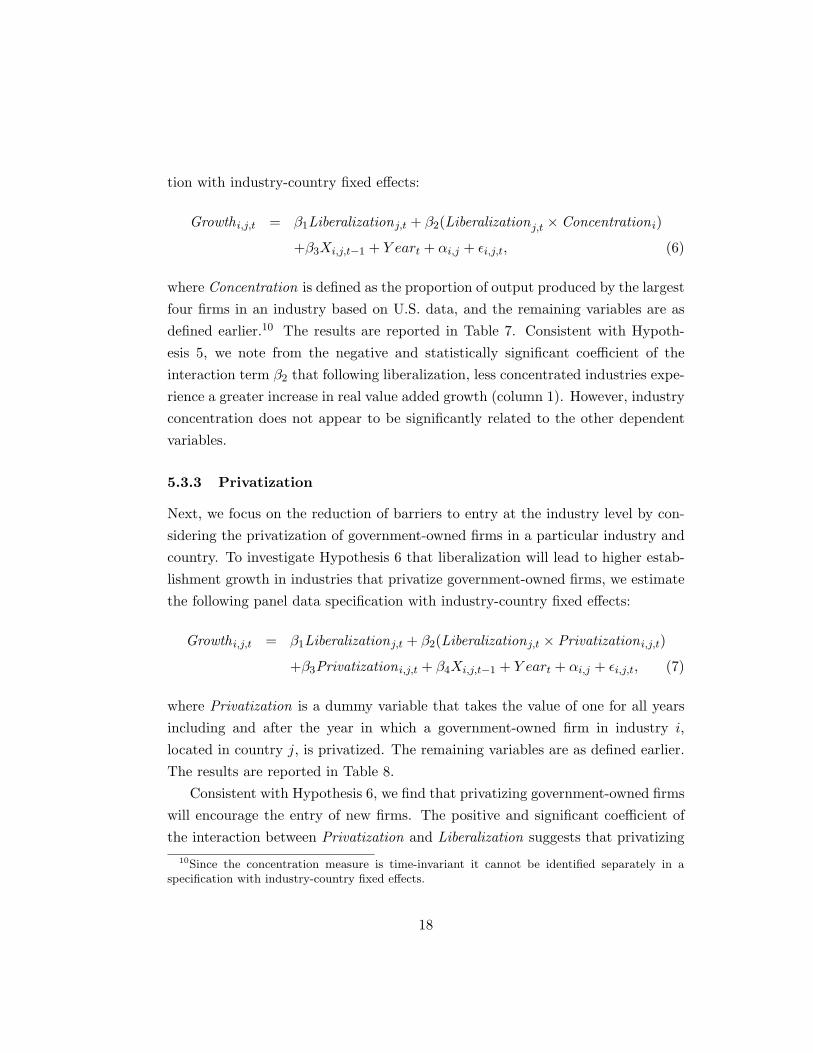
tion with industry-country fixed effects:
Growthi,j,t = β1Liberalizationj,t + β2(Liberalizationj,t × Concentrationi)
+β3Xi,j,t−1 + Y eart + αi,j + εi,j,t, (6)
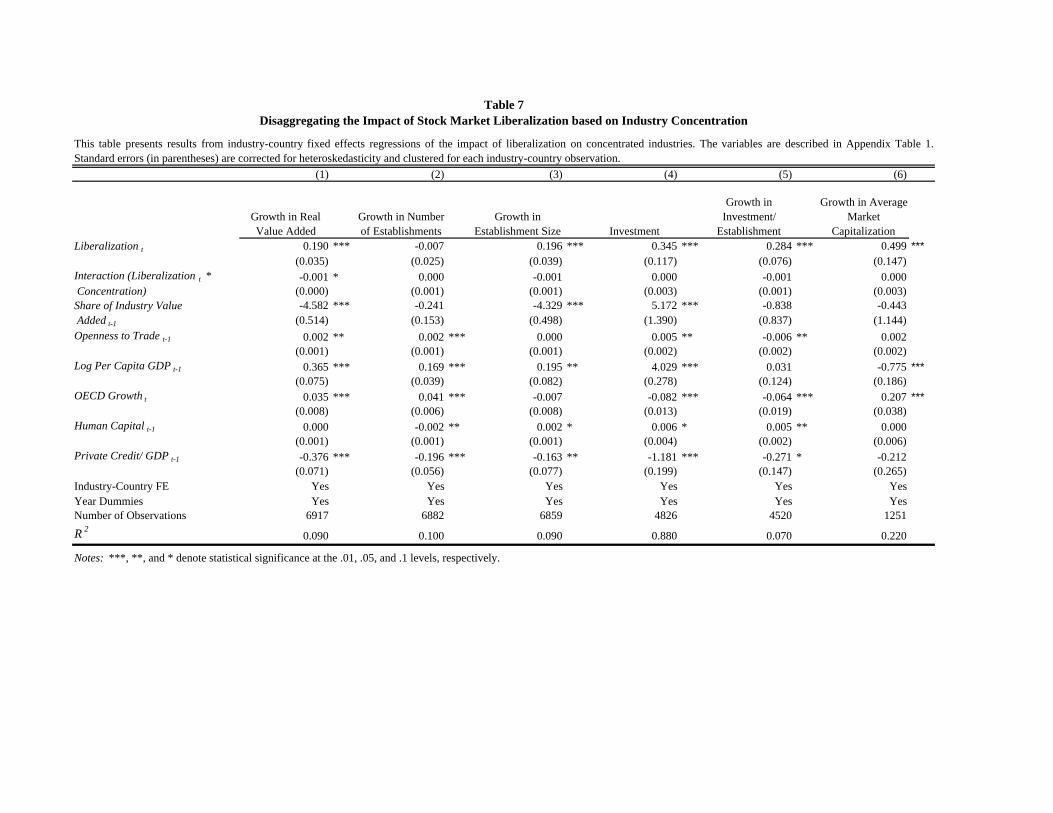
where Concentration is defined as the proportion of output produced by the largestfour firms in an industry based on U.S. data, and the remaining variables are asdefined earlier.10 The results are reported in Table 7. Consistent with Hypoth-esis 5, we note from the negative and statistically significant coefficient of theinteraction term β2 that following liberalization, less concentrated industries expe-rience a greater increase in real value added growth (column 1). However, industryconcentration does not appear to be significantly related to the other dependentvariables.
5.3.3 Privatization
Next, we focus on the reduction of barriers to entry at the industry level by con-sidering the privatization of government-owned firms in a particular industry andcountry. To investigate Hypothesis 6 that liberalization will lead to higher estab-lishment growth in industries that privatize government-owned firms, we estimatethe following panel data specification with industry-country fixed effects:
Growthi,j,t = β1Liberalizationj,t + β2(Liberalizationj,t × Privatizationi,j,t)
+β3Privatizationi,j,t + β4Xi,j,t−1 + Y eart + αi,j + εi,j,t, (7)
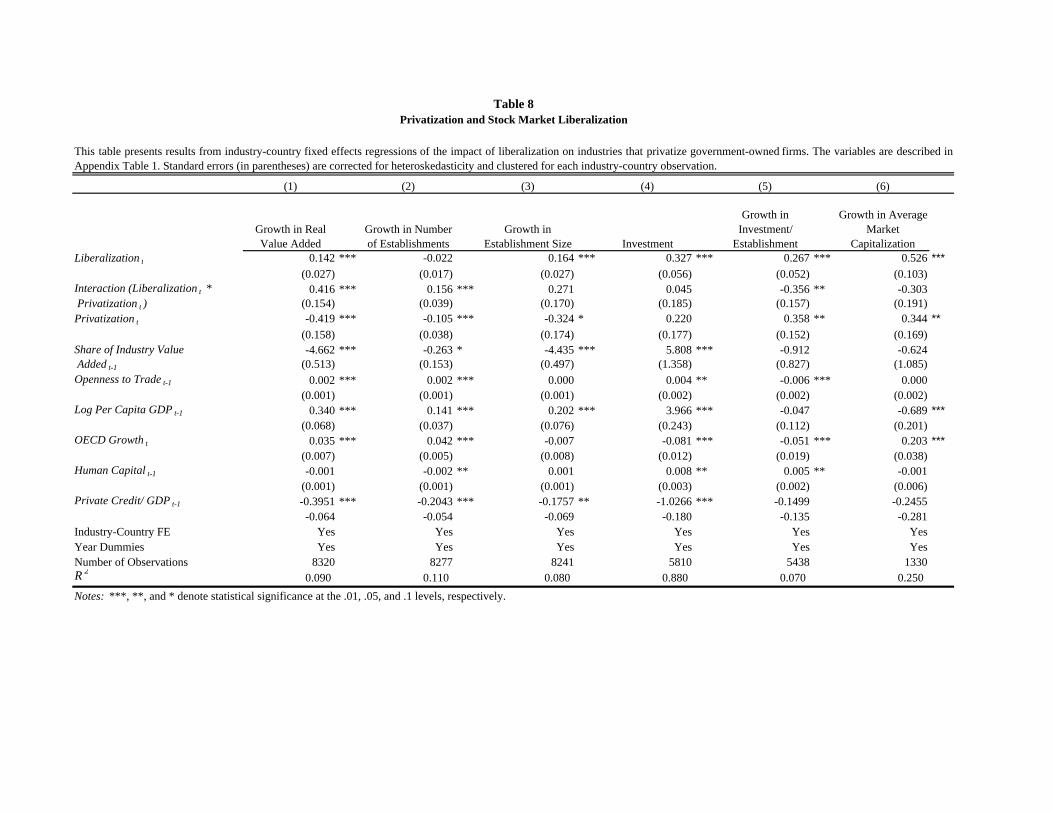
where Privatization is a dummy variable that takes the value of one for all yearsincluding and after the year in which a government-owned firm in industry i,located in country j, is privatized. The remaining variables are as defined earlier.The results are reported in Table 8.
Consistent with Hypothesis 6, we find that privatizing government-owned firmswill encourage the entry of new firms. The positive and significant coefficient ofthe interaction between Privatization and Liberalization suggests that privatizing
10Since the concentration measure is time-invariant it cannot be identified separately in aspecification with industry-country fixed effects.
18
industries experience a significant increase in both real value added and estab-lishment growth following liberalization. From the coefficient of the interactionbetween liberalization and privatization in column (2) we estimate that among pri-vatizing industries, those located in liberalized countries experience 15.6% highergrowth in the number of establishments. Note that value added growth increasesand growth in investment per establishment decreases, which is consistent withthe result that growth in the number of establishments in privatizing industriesincreases following liberalization.
The result that a stock market liberalization does not lead to an increase innew firm growth is puzzling since new firms are likely to be more financially con-strained. Disaggregating the effect of liberalization we find evidence suggestingthat other frictions in emerging markets may prevent new firms from benefitingfrom liberalization. In particular, we find that growth in the number of establish-ments is higher in more externally dependent industries and in industries that facebetter growth opportunities following liberalization, if these industries are locatedin countries that allocate capital more efficiently. We also find that industries withlower structural barriers to entry grow faster following liberalization. Lastly, theresults show that liberalization leads to new firm growth in industries that privatizegovernment-owned firms. These results suggest that a stock market liberalizationis likely to have a larger and more uniformly distributed growth impact if it isaccompanied by complementary reforms that enhance competition and increaseefficiency in capital allocation.
5.4 Additional Robustness Checks
Institutional Environment: Since financial market frictions are likely to belower in countries with better governance mechanisms, the growth impact of astock market liberalization may depend on country level governance factors. InTable 9, Panel A we investigate whether the impact of a stock market liberalizationvaries based on the protection of creditor rights in the economy. The results showthat the growth rate of the number of establishments is higher in countries withbetter creditor rights, and this effect is more pronounced following liberalization.Consistent with the previous results on barriers to entry, liberalization appears to
19
facilitate higher growth through the establishment of new firms in countries withbetter creditor rights. We also note that privatization is not a proxy for theseinstitutional factors since the coefficients of both the privatization variable and itsinteraction with liberalization retain their sign and significance in the regressions.11
Lastly, we find that industry value added growth is higher in countries with strongcreditor rights, which is consistent with the country level growth results in Bekaert,Harvey, and Lundblad (2005). Note that all the regressions in Table 9, Panels A-Dinclude all the control variables used in equations (1)−(7), which we do not reportto save space.
Contemporaneous Economic Reforms: Since stock market liberalizationsare often part of a larger economic reform program, as a robustness check we alsoinvestigate whether we are overstating the growth impact of liberalization becauseof other economic reforms that are simultaneously implemented. In particular,we control for the effect of short-run macroeconomic stabilization programs byincluding a dummy variable equal to one in the years in which a country enteredinto a stand-by agreement with the International Monetary Fund. From Table 9,Panel B we note that the results for external dependence and privatization remainrobust after controlling for the effect of contemporaneous reforms. Undertakinga stabilization program appears to significantly reduce the growth rate of realvalue added and average market capitalization in a given year, while industryinvestment increases following stabilization. However, stabilization programs arealso more likely to be implemented during an economic downturn. Note that inall the specifications we also control for trade liberalization by including opennessto trade at the country level, and for other financial market reforms by includingthe ratio of private credit to GDP.12
Firm Size: We investigate whether liberalization increases economic growthby easing financing constraints for industries that are technologically more depen-dent on small firms. Small firms may face greater financial constraints becauseof high information costs for investors. The results reported in Table 9, Panel
11The results for external dependence are also robust to controlling for creditor rights. We donot report these results to save space.
12Bekaert, Harvey, and Lundblad (2005) also control for contemporaneous reforms as an alter-native explanation for the liberalization effect.
20
C show that following liberalization, industries that are technologically more de-pendent on small firms experience significantly higher growth in real value added.This is consistent with the results obtained for industry concentration. Also notethat the results for external finance dependence and privatization are robust.
Alternative Measure of Growth Opportunities: As a robustness check,we use lagged industry sales growth in U.S. firms to rank industries according togrowth opportunities, based on Fisman and Love (2004). The results reported inTable 9, Panel D are similar although less significant than those obtained usingthe Global PE ratio in Table 6. We find that industries that face better growthopportunities experience significantly higher establishment growth following liber-alization if they are located in countries that allocate capital more efficiently.
6 Conclusion
Financial market liberalization in developing countries has generated considerablecontroversy. While one side maintains that financial liberalization sets the stagefor more rapid growth (Summers (2000)), the other side argues that it increasesthe potential for crises and a collapse in growth (Bhagwati (1998)). To gain moreinsight into this important question of whether stock market liberalization benefitsdeveloping countries we use panel data at the industry level to investigate the cross-sectional impact of liberalization on industry growth in a large sample of emergingmarkets.
We find that liberalization is followed by an increase in industry value addedgrowth, investment, and average market capitalization, which is consistent with theview that financing constraints are reduced when the stock market is liberalized.However, the increase in industry growth appears to come from an expansion in thesize of existing firms, rather than through the entry of new firms into an industry.Since new firms typically face high financial constraints, this seems to contradictthe view that liberalization promotes growth by reducing financing constraints. Toinvestigate this puzzle we examine the cross-sectional and within-industry impactof liberalization. Our results reveal the complex nature of liberalization. Whilethe cross-sectional results support the view that liberalization reduces financingconstraints, the within-industry results indicate that establishment growth in these
21

industries does not increase following liberalization.To reconcile the cross-sectional and within-industry results we find evidence
suggesting that barriers to entry at the industry and country level may preventnew firms from benefiting uniformly from liberalization. The results show thatestablishment growth is significantly higher in industries that depend more onexternal finance and industries that face better growth opportunities if these in-dustries are located in countries that allocate capital more efficiently. We also findthat barriers to entry at the industry level arising out of technological factors canaffect growth. Lastly, the evidence shows that establishment growth is significantlyhigher in privatizing industries following a stock market liberalization. This find-ing is consistent with the view that the privatization of government-owned firmsreduces entry barriers, thereby allowing new firms to benefit from a stock marketliberalization.
The result that the growth impact of stock market liberalization is larger if it isaccompanied by competition enhancing reforms implies that the issue of comple-mentarities in financial reforms deserves further research. Complementarities wereshown to be a crucial aspect of economic reforms in transition economies (e.g.,price liberalization and ownership reform (Roland (2000)), and may be similarlyimportant in financial market reforms in developing countries.
22
References
Beck, T., A. Demirguc-Kunt, L. Laeven, and R. Levine (2004): “Finance,Firm Size, and Growth,” Working Paper 10983, National Bureau of EconomicResearch.
Beck, T., R. Levine, and N. Loayza (2000): “Finance and the Sources ofGrowth,” Journal of Financial Economics, 58, 261–300.
Bekaert, G., and C. R. Harvey (2000): “Foreign Speculators and EmergingEquity Markets,” Journal of Finance, 55, 565–613.
Bekaert, G., C. R. Harvey, and C. Lundblad (2005): “Does Financial Lib-eralization Spur Growth?” Journal of Financial Economics, 77, 3–56.
Bekaert, G., C. R. Harvey, C. Lundblad, and S. Siegel (2007): “GrowthOpportunities and Market Integration,” Journal of Finance, 62, 1081–1137.
Bhagwati, J. (1998): “The Capital Myth: The Difference Between Trade inWidgets and Trade in Dollars,” Foreign Affairs, 77, 7–12.
Chari, A., and N. Gupta (2007): “Incumbents and Protectionism: The PoliticalEconomy of Foreign Entry Liberalization,” Journal of Financial Economics,forthcoming.
Claessens, S., and L. Laeven (2003): “Financial Development, PropertyRights, and Growth,” Journal of Finance, 58, 2401–2436.
Edison, H. J., M. W. Klein, L. Ricci, and T. Sloek (2002): “Capital AccountLiberalization and Economic Performance: Survey and Synthesis,” WorkingPaper 9100, National Bureau of Economic Research.
Eichengreen, B. (2002): “Capital Account Liberalization: What Do the Cross-country Studies Tell Us?” World Economic Review, 15, 341–366.
Errunza, V. R. (2005): “Foreign Portfolio Equity Investments in Economic De-velopment,” Review of International Economics, forthcoming.
23
Fisman, R., and I. Love (2003): “Trade Credit, Financial Intermediary Devel-opment, and Industry Growth,” Journal of Finance, 58, 353–374.
(2004): “Financial Development and Growth in the Short and Long Run,”Nationa Bureau of Economic Research Working Paper.
Godoy, S., and J. E. Stiglitz (2006): “Growth, Initial Conditions, Law andSpeed of Privatization in Transition Countries: 11 Years Later,” Working Paper11992, National Bureau of Economic Research.
Henry, P. B. (2000a): “Do Stock Market Liberalizations Cause InvestmentBooms?” Journal of Financial Economics, 58, 301–334.
(2000b): “Stock Market Liberalization, Economic Reform, and EmergingMarket Equity Prices,” Journal of Finance, 55, 529–563.
Hutchison, M. M. (2001): “A Cure Worse than the Disease? Currency Crisesand the Output Costs of IMF-Supported Stabilization Programs,” Working pa-per, NBER.
King, R. G., and R. Levine (1993): “Finance and Growth: Schumpeter MightBe Right,” Quarterly Journal of Economics, 108(3), 717–738.
La-Porta, R., F. L. de Silanes, A. Shleifer, and R. W. Vishny (1997):“The Legal Determinants of External Finance,” Journal of Finance, 52, 1131–1150.
(1998): “Law and Finance,” Journal of Political Economy, 106, 1113–1155.
Laeven, L. (2002): “Financial Liberalization and Financing Constraints: Evi-dence from Panel Data on Emerging Economics,” Working paper, World Bank.
Lins, K., D. Strickland, and M. Zenner (2005): “Do Non-U.S. Firms IssueEquity on U.S. Exchanges to Relax Capital Constraints?” Journal of Financialand Quantitative Analysis, 40, 109–133.
24
Love, I. (2003): “Financial Development and Financing Constraints: Interna-tional Evidence from the Structural Investment Model,” Review of FinancialStudies, 16, 765–791.
Prasad, E., K. Rogoff, H.-J. Wei, and M. A. Kose (2004): “FinancialGlobalizaiton, Growth and Volatility in Developing Countries,” NBER workingpaper 10942.
Rajan, R. G., and L. Zingales (1998): “Financial Dependence and Growth,”American Economic Review, 88, 559–586.
Roland, G. (2000): Transition and Economics: Politics, Markets, and Firms.The MIT Press, Cambridge, MA.
Summers, L. H. (2000): “International Financial Crises: Causes, Prevention, andCures,” American Economic Review, 90, 1–16.
Wurgler, J. (2000): “Financial Markets and the Allocation of Capital,” Journalof Financial Economics, 58, 187–214.
25
(1) (2) (3) (4) (5) (6)
Growth in Real Value Added
Growth in Number of
Establishments
Growth in Establishment
Size Investment
Growth in Investment/
Establishment
Growth in Average Market
CapitalizationLiberalization t 0.159 *** -0.0151 0.1741 *** 0.3292 *** 0.2795 *** 0.5362 ***
(0.027) (0.016) (0.027) (0.055) (0.050) (0.097)Share of Industry -4.6729 *** -0.2652 * -4.4482 *** 5.8332 *** -0.9441 -0.3295 Value Added t-1 (0.511) (0.156) (0.496) (1.390) (0.820) (1.033)Openness to Trade t-1 0.0023 *** 0.0021 *** 0.0001 0.0031 0.0021 * 0.0076 ***
(0.001) (0.001) (0.001) (0.002) (0.001) (0.002)Log Per Capita GDP t-1 0.3132 *** 0.1227 *** 0.1945 *** 3.9408 *** -0.0447 -0.7242 ***
(0.064) (0.037) (0.073) (0.252) (0.117) (0.192)OECD Growth t 0.0364 *** 0.0437 -0.0079 -0.0764 *** -0.0522 *** 0.2054 ***
(0.007) (0.005) *** (0.008) (0.012) (0.019) (0.036)Human Capital t-1 -0.0005 -0.0017 ** 0.0015 0.0074 ** 0.0077 *** 0.0019
(0.001) (0.001) (0.001) (0.003) (0.002) (0.006)Private Credit/ GDP t-1 -0.3419 *** -0.1738 *** -0.1531 ** -1.0112 *** -0.0421 -0.1676
(0.059) (0.055) (0.066) (0.189) (0.134) (0.252)
Industry-Country FE Yes Yes Yes Yes Yes Yes
Year Dummies Yes Yes Yes Yes Yes Yes
Number of Observations 8320 8277 8241 5810 5438 1330R 2
0.09 0.1 0.08 0.88 0.07 0.25
Table 1
Panel A presents results from industry-country fixed effects regressions of the impact of liberalization and Panel B presents results from an instrumental variable regression,treating liberalization as endogenous. The variables are described in Appendix Table 1. Standard errors (in parentheses) are corrected for heteroskedasticity and are clustered foreach industry-country observation.
The Average Impact of a Stock Market Liberalization
Panel A : The Average Impact of Stock Market Liberalization
(1) (2) (3) (4) (5) (6)
Growth in Real Value Added
Growth in Number of
Establishments
Growth in Establishment
Size Investment
Growth in Investment/
Establishment
Growth in Average Market
CapitalizationLiberalization t 0.4367 *** 0.0843 0.3564 ** 8.4152 *** 0.8576 *** -0.0397
(0.136) (0.076) (0.142) (0.647) (0.241) (0.526)Share of Industry -0.5017 ** -0.1706 -0.337 21.8451 *** 0.4018 0.0325 Value Added t-1 (0.215) (0.119) (0.225) (1.217) (0.462) (0.505)Openness to Trade t-1 0.0011 ** 0.0008 *** 0.0004 -0.0233 *** -0.0003 -0.0014
(0.001) (0.000) (0.001) (0.002) (0.001) (0.001)Log Per Capita GDP t-1 -0.0459 ** -0.0146 -0.0326 -1.033 *** -0.124 *** 0.044
(0.020) (0.011) (0.021) (0.110) (0.040) (0.068)OECD Growth t 0.0192 0.0414 *** -0.0236 * -0.3303 *** -0.0542 ** 0.1362 ***
(0.013) (0.007) (0.014) (0.071) (0.026) (0.051)Human Capital t-1 0.0009 0 0.0009 0.0198 *** 0.0045 *** 0.002
(0.001) (0.000) (0.001) (0.003) (0.001) (0.002)Private Credit/ GDP t-1 0.0189 -0.0208 0.0412 5.7861 *** 0.0814 -0.2998 *
(0.069) (0.038) (0.072) (0.372) (0.137) (0.180)Industry-Country FE No No No No No NoYear Dummies Yes Yes Yes Yes Yes YesNumber of Observations 3713 3729 3704 2638 2487 627Sargan Test ( χ2 p value) 0.824 (0.662) 4.209 (0.122) 1.36 (.507) 3.004 ( 0.223) 0.528 (0.768) 4.191( 0.123)
Panel B : Instrumental Variable Estimates of the Average Impact of Stock Market Liberalization
Notes: ***, **, and * denote statistical significance at the .01, .05, and .1 levels, respectively.
Table 1 continued
ISIC Industrial SectorsGrowth in Real Value Added
Growth in Number of Establishments
Growth in Establishment Size Investment
Growth in Investment/ Establishment
Growth in Average Market Capitalization
311 Food products 0.043 0.011 0.026 11.665 0.015 0.185(0.518) (0.338) (0.567) (1.356) 0.621 (.627)
313 Beverages 0.031 0.005 0.024 10.141 0.029 0.142(0.544) (0.259) (0.602) (1.833) (0.792) (0.934)
314 Tobacco 0.008 -0.006 0.010 9.004 0.014 0.168(0.786) (0.310) (0.867) (1.548) (1.266) (0.718)
321 Textiles 0.004 0.011 -0.016 11.151 0.014 0.091(0.583) (0.298) (0.662) (2.180) (0.655) (0.939)
322 Wearing apparel, 0.093 0.055 0.029 9.502 0.045 0.245except footwear (0.624) (0.528) (0.718) (1.808) (0.805) (0.923)
323 Leather products 0.037 0.030 -0.007 8.108 0.020 N/A(0.501) (0.313) (0.493) (1.789) (0.817) N/A
324 Footwear, except 0.029 0.025 0.002 8.343 0.025 0.307rubber or plastic (0.399) (0.388) (0.468) (1.826) (1.167) (0.995)
331 Wood products, 0.009 0.003 0.001 9.210 0.042 0.231except furniture (0.555) (0.375) (0.608) (2.114) (0.887) (0.888)
332 Furniture, except 0.039 0.030 0.016 8.044 0.033 1.002metal (0.613) (0.404) (0.640) (2.093) (1.255) (1.020)
341 Paper and pulp products 0.043 0.018 0.020 10.408 0.019 0.086
(0.522) (0.217) (0.541) (1.813) (0.946) (0.710)342 Printing and publishing 0.057 0.020 0.029 9.812 0.027 0.264
(0.638) (0.273) (0.660) (1.613) (0.944) (0.227)352 Other chemicals 0.039 0.022 0.049 10.723 0.024 0.021
(0.287) (0.243) (0.739) (1.446) (0.551) (0.731)353 Petroleum refineries 0.031 0.029 -0.008 10.559 0.076 0.020
(0.507) (0.293) (0.592) (2.148) (0.987) (0.570)354 Misc. petroleum and 0.052 0.029 0.011 7.814 0.008 0.101
coal products (0.464) (0.301) (0.440) (2.342) (1.332) (0.662)355 Rubber products 0.005 0.017 -0.015 9.384 0.018 N/A
(0.591) (0.328) (0.645) (2.253) (0.931) N/A356 Plastic products 0.068 0.044 0.018 9.919 0.053 N/A
(0.578) (0.263) (0.609) (2.022) (0.770) N/A361 Pottery, china, 0.038 -0.010 0.044 8.716 0.001 N/A
earthenware (0.695) (0.539) (0.840) (1.917) (1.071) N/A362 Glass and products 0.041 0.000 0.037 9.396 0.038 N/A
(0.287) (0.330) (0.418) (2.046) (1.272) N/A369 Other non-metallic 0.022 0.024 -0.014 11.093 0.006 N/A
mineral products (0.348) (0.366) (0.451) (1.838) (0.975) N/A371 Iron and steel 0.051 0.017 0.026 10.956 0.009 0.029
(0.689) (0.384) (0.717) (2.436) (1.161) (0.731)372 Non-ferrous metals 0.057 0.025 0.032 9.755 0.046 0.091
(0.562) (0.270) (0.541) (2.552) (0.980) (0.778)381 Fabricated metal 0.037 0.034 0.001 10.332 0.008 0.068
products (0.317) (0.375) (0.428) (1.811) (0.776) (0.855)382 Machinery, except 0.072 0.049 0.023 9.829 0.013 0.013
electrical (0.779) (0.366) (0.679) (2.353) (0.842) (0.693)383 Machinery, electric 0.053 0.040 0.015 10.434 0.009 0.006
(0.598) (0.242) (0.584) (2.310) (0.636) (0.664)384 Transport equipment 0.041 0.029 0.008 10.234 0.023 0.099
(0.682) (0.293) (0.664) (2.637) (0.826) (0.750)385 Professional & 0.061 0.032 0.020 8.070 0.011 N/A
scientific equipment (0.663) (0.376) (0.683) (2.269) (1.074) N/A390 Other manufactured 0.051 0.026 0.022 8.278 0.114 N/A
products (0.507) (0.492) (0.537) (2.048) (1.026) N/A
Panel A: Pattern of Growth Across Industries
Table 2Industry Performance Before and After Stock Market Liberalization
This table described industry characteristics for 31 countries between 1981 and 1998 with standard deviations in parentheses. The variables are described in Appendix Table 1. PanelA provides summary statistics of all the industry performance measures for each 3-digit ISIC industry over the sample period and Panel B provides summary statistics before and aftera stock market liberalization.
Growth in Real Value Added
Growth in Establishment Size
Growth in Number of Establishments Investment
Growth in Investment/ Establishment
Growth in Average Market Capitalization
Before Liberalization .037 .017 .012 9.325 -.023 .094(.009) (.009) (.005) (.035) (.017) (.028)
After Liberalization .048 .011 0.036*** 10.381*** 0.054*** .056(.007) (.007) (.005) (.041) (.017) (.028)
Table 2 continued
Notes: ***, **, and * denote statistical significance at the .01, .05, and .1 levels, respectively.
Panel B: Comparing Industry Characteristics Before and After Stock Market Liberalization
Liberalizing Countries Liberalization Year Start Date End DateArgentina 1989 1985 1994Bangladesh 1991 1981 1992Brazil 1991 1985 1995Chile 1992 1981 1997Colombia 1991 1981 1997Cote d'Ivoire 1995 1981 1997Egypt 1992 1981 1995Greece 1987 1981 1992India 1992 1981 1997Indonesia 1989 1981 1997Israel 1993 1987 1994Jamaica 1991 1981 1996Jordan 1995 1981 1997Kenya 1995 1981 1998Korea 1992 1981 1998Malaysia 1988 1981 1997Mexico 1989 1981 1995Morocco 1988 1985 1997Nigeria 1995 1981 1994Pakistan 1991 1981 1996Philippines 1991 1981 1995Portugal 1986 1981 1995Sri Lanka 1990 1981 1995Thailand 1987 1982 1994Turkey 1989 1981 1994Venezuela 1990 1981 1996Zimbabwe 1993 1983 1995Non-Liberalizing CountriesGuatemala 1981 1988Niger 1990 1998Sierra Leone 1981 1993Trinidad and Tobago 1981 1995
Stock Market Liberalization Year and Sample PeriodTable 3
Industrial Statistics
Liberalization year refers to the official year of policy change announced by thegovernment. The start and end dates refer to the sample length of industrialstatistics for each country.
Country Openness to Trade Per Capita GDP Human Capital Private Credit / GDP
Argentina 16.123 6702.140 70.200 0.132(1.797) (579.580) (1.060) (0.017)
Bangladesh 23.977 263.518 19.030 0.162(2.629) (14.545) (0.092) (0.043)
Brazil 16.965 4203.239 39.517 0.238(1.988) (142.300) (2.989) (0.069)
Chile 56.179 3390.582 67.744 0.534(7.331) (880.425) (6.295) (0.084)
Colombia 31.366 2093.038 50.263 0.282(4.303) (204.098) (7.826) (0.074)
Cote d'Ivoire 69.269 819.403 22.530 0.335(9.600) (97.430) (1.190) (0.076)
Egypt 55.947 912.586 67.007 0.287(10.834) (80.288) (8.825) (0.033)
Greece 45.176 10165.630 90.675 0.420(2.416) (532.747) (3.700) (0.072)
Guatemala 38.241 1410.904 25.175 0.155(6.350) (76.000) (3.357) (0.023)
India 18.207 310.125 41.681 0.267(4.334) (53.429) (5.977) (0.027)
Indonesia 49.337 776.564 44.048 0.306(4.300) (194.723) (6.131) (0.155)
Israel 81.753 14028.990 85.887 0.536(6.408) (646.319) (1.953) (0.039)
Jamaica 105.508 1708.413 64.813 0.285(11.341) (174.338) (1.987) (0.038)
Jordan 123.085 1706.855 52.030 0.652(16.602) (185.650) (4.219) (0.084)
Kenya 58.479 338.157 25.557 0.297(9.449) (11.149) (2.568) (0.020)
Korea 66.083 7735.050 91.395 0.891(7.638) (2588.606) (5.861) (0.260)
Malaysia 139.023 3239.855 56.071 0.884(31.579) (780.167) (3.959) (0.253)
Mexico 34.595 3214.677 55.607 0.179(8.173) (132.546) (2.117) (0.093)
Morocco 56.819 1303.942 37.232 0.301(3.287) (63.230) (1.175) (0.118)
Niger 38.655 214.625 6.643 0.091(4.037) (11.373) (0.172) (0.031)
Nigeria 55.178 245.232 30.636 0.154(21.609) (16.335) (5.823) (0.041)
Pakistan 36.404 426.368 18.391 0.235(2.766) (55.769) (3.125) (0.021)
Philippines 57.981 1071.200 70.960 0.288(10.288) (64.407) (5.012) (0.098)
Portugal 66.597 8957.429 69.053 0.625(4.213) (1311.564) (22.926) (0.140)
Sierra Leone 43.288 263.852 17.300 0.040(10.995) (27.709) (0.206) (0.018)
Sri Lanka (70.592) (608.712) (73.422) (0.200)7.139 57.617 1.564 0.017
Thailand 64.024 1766.816 32.838 0.680(13.846) (476.956) (5.848) (0.208)
Trinidad and Tobago 75.224 4401.821 77.452 0.512(7.088) (374.369) (2.527) (0.093)
Turkey 31.995 2390.429 44.800 0.140(4.647) (261.209) (6.144) (0.012)
Venezuela 49.058 3530.502 31.413 0.360(7.599) (153.094) (6.456) (0.180)
Zimbabwe 51.951 651.891 45.392 0.206(12.526) (24.888) (6.131) (0.049)
The table reports summary statistics for country-specific control variables. The variables are described in Appendix Table 1. Standard deviations are in parentheses.
Table 4Country Characteristics
Growth in Real Value Added
Growth in Number of Establishments
Growth in Establishment Size Investment
Growth in Investment/
Establishment
Growth in Average Market
CapitalizationLiberalization t 0.152 *** -0.021 0.174 *** 0.280 *** 0.259 *** 0.523 ***
(0.028) (0.018) (0.029) (0.066) (0.052) (0.104)Interaction (Liberalization t * 0.052 ** 0.018 0.029 0.256 ** 0.083 0.070 External Dependence) (0.026) (0.021) (0.032) (0.120) (0.071) (0.177)Share of Industry Value -4.731 *** -0.266 -4.506 *** 5.997 *** -0.777 -0.351 Added t-1 (0.526) (0.163) (0.505) (1.436) (0.822) (1.034)Openness to Trade t-1 0.002 *** 0.002 *** 0.000 0.003 0.002 0.008 ***
(0.001) (0.001) (0.001) (0.002) (0.001) (0.002)Log Per Capita GDP t-1 0.322 *** 0.128 *** 0.198 *** 3.899 *** -0.056 -0.728 ***
(0.065) (0.037) (0.075) (0.254) (0.118) (0.193)OECD Growth t 0.033 *** 0.043 *** -0.011 -0.079 *** -0.056 *** 0.206 ***
(0.007) (0.005) (0.008) (0.013) (0.019) (0.037)Human Capital t-1 0.000 -0.002 ** 0.002 * 0.009 *** 0.008 *** 0.002
(0.001) (0.001) (0.001) (0.003) (0.002) (0.006)Private Credit/ GDP t-1 -0.338 *** -0.180 *** -0.143 ** -0.965 *** -0.023 -0.171
(0.059) (0.057) (0.067) (0.189) (0.136) (0.252)Industry-Country FE Yes Yes Yes Yes Yes YesYear Dummies Yes Yes Yes Yes Yes YesNumber of Observations 8030 7988 7952 5626 5264 1330R 2
0.090 0.100 0.080 0.880 0.060 0.250
Disaggregating the Impact of Stock Market Liberalization Across IndustriesThis table presents results from industry-country fixed effects regressions of the impact of liberalization based on industry external finance dependence in Panel A and industry growthopportunities in Panel B. The variables are described in Appendix Table 1. Standard errors (in parentheses) are corrected for heteroskedasticity and clustered for each industry-countryobservation.
(4) (5) (6)(2) (3)
Table 5
Panel A: Disaggregating by Industry External Finance Dependence
(1)
Growth in Real Value Added
Growth in Number of Establishments
Growth in Establishment Size Investment
Growth in Investment/
Establishment
Growth in Average Market
CapitalizationLiberalization t 0.112 *** -0.024 0.149 *** 0.398 *** 0.286 *** 0.463 ***
(0.035) (0.023) (0.035) (0.092) (0.077) (0.123)Interaction (Liberalization t * 0.002 * 0.001 0.001 -0.003 -0.001 0.001 Global PE Ratio t-1 ) (0.001) (0.001) (0.001) (0.004) (0.003) (0.004)Global PE Ratio t-1 0.001 0.000 0.001 0.001 0.002 0.003
(0.001) (0.001) (0.001) (0.002) (0.003) (0.003)Share of Industry Value -4.666 *** -0.261 * -4.452 *** 5.815 *** -0.971 -0.482 Added t-1 (0.511) (0.153) (0.498) (1.397) (0.823) (1.178)Openness to Trade t-1 0.002 ** 0.002 *** 0.000 0.005 ** -0.006 *** 0.001
(0.001) (0.001) (0.001) (0.002) (0.002) (0.002)Log Per Capita GDP t-1 0.337 *** 0.144 *** 0.195 ** 3.984 *** -0.045 -0.688 ***
(0.068) (0.037) (0.077) (0.247) (0.112) (0.188)OECD Growth t 0.033 *** 0.042 *** -0.010 -0.082 *** -0.054 *** 0.196 ***
(0.007) (0.005) (0.008) (0.013) (0.019) (0.040)Human Capital t-1 -0.001 -0.002 ** 0.001 0.008 ** 0.005 ** -0.001
(0.001) (0.001) (0.001) (0.003) (0.002) (0.006)Private Credit/ GDP t-1 -0.375 *** -0.203 *** -0.155 ** -1.054 *** -0.159 -0.308
(0.063) (0.053) (0.068) (0.183) (0.135) (0.263)Industry-Country FE Yes Yes Yes Yes Yes YesYear Dummies Yes Yes Yes Yes Yes YesNumber of Observations 8320 8277 8241 5810 5438 1330R 2
0.090 0.100 0.080 0.880 0.070 0.250Notes: ***, **, and * denote statistical significance at the .01, .05, and .1 levels, respectively.
Table 5 continuedPanel B: Disaggregating by Industry Growth Opportunities
(1) (2) (3) (4) (5) (6)
Growth in Real Value Added
Growth in Number of Establishments
Growth in Establishment Size Investment
Growth in Investment/
Establishment
Growth in Average Market
CapitalizationLiberalization t 0.151 *** -0.022 0.174 *** 0.283 *** 0.238 *** 0.484 ***
(0.028) (0.019) (0.029) (0.066) (0.054) (0.108)Interaction (Liberalization t * 0.018 -0.012 0.032 0.280 ** 0.073 0.068 External Dependence) (0.033) (0.021) (0.037) (0.137) (0.069) (0.332)Interaction (Liberalization t * External 0.095 ** 0.084 ** -0.010 -0.088 0.037 -0.074 Dependence *Allocative Efficiency) (0.044) (0.037) (0.051) (0.185) (0.176) (0.346)Share of Industry Value Added t-1 -4.730 *** -0.269 * -4.506 *** 6.032 *** -0.768 -0.486 (0.521) (0.159) (0.504) (1.439) (0.834) (1.158)Openness to Trade t-1 0.002 ** 0.002 *** 0.000 0.005 *** -0.006 *** 0.001
(0.001) (0.001) (0.001) (0.002) (0.002) (0.002)Log Per Capita GDP t-1 0.344 *** 0.149 *** 0.198 ** 3.953 *** -0.066 -0.691 ***
(0.070) (0.038) (0.079) (0.251) (0.118) (0.191)OECD Growth t 0.031 *** 0.041 *** -0.011 -0.083 *** -0.054 *** 0.206 ***
(0.007) (0.005) (0.008) (0.012) (0.019) (0.038)Human Capital t-1 0.000 -0.002 ** 0.002 * 0.009 *** 0.005 ** -0.001
(0.001) (0.001) (0.001) (0.003) (0.002) (0.006)Private Credit/ GDP t-1 -0.380 *** -0.220 *** -0.142 ** -1.005 *** -0.133 -0.283
(0.064) (0.056) (0.070) (0.181) (0.137) (0.280)Industry-Country FE Yes Yes Yes Yes Yes YesYear Dummies Yes Yes Yes Yes Yes YesNumber of Observations 8030 7988 7952 5626 5264 1330R 2
0.090 0.110 0.080 0.880 0.070 0.250
Table 6
Panel A: Disaggregating by Industry External Finance Dependence
This table presents results from industry-country fixed effects regressions of the impact of liberalization based on the allocative efficiency of capital at the country level and industry external financedependence in Panel A and industry growth opportunities in Panel B. The variables are described in Appendix Table 1. Standard errors (in parentheses) are corrected for heteroskedasticity and clustered foreach industry-country observation.
(1) (2) (3) (4) (5) (6)
Capital Allocative Efficiency and the Impact of Stock Market Liberalization
Growth in Real Value Added
Growth in Number of Establishments
Growth in Establishment Size Investment
Growth in Investment/
Establishment
Growth in Average Market
CapitalizationLiberalization t 0.116 *** -0.027 0.156 *** 0.398 *** 0.288 *** 0.451 ***
(0.035) (0.023) (0.035) *** (0.093) (0.078) (0.125)Interaction (Liberalization t * 0.001 -0.001 0.002 -0.002 -0.001 0.000 Global PE Ratio t-1 ) (0.001) (0.001) (0.001) (0.004) (0.003) (0.004)Global PE Ratio t-1 0.004 *** 0.000 0.004 *** 0.001 0.001 0.002
(0.001) (0.001) (0.001) (0.002) (0.003) (0.003)Interaction (Global PE Ratio t-1 * -0.008 *** 0.000 -0.008 *** 0.001 0.005 0.001 Allocative Efficiency) (0.003) (0.001) (0.003) (0.004) (0.005) (0.004)Interaction (Liberalization t * 0.002 * 0.004 *** -0.002 * -0.003 -0.003 0.003 Global PE Ratio t-1 *Allocative Efficiency) (0.001) (0.001) (0.001) (0.003) (0.003) (0.003)Share of Industry Value Added t-1 -4.699 *** -0.254 * -4.486 *** 5.795 *** -0.967 -0.461 (0.511) (0.151) (0.499) (1.392) (0.823) (1.173)Openness to Trade t-1 0.002 ** 0.002 *** 0.000 0.005 ** -0.006 *** 0.001
(0.001) (0.001) (0.001) (0.002) (0.002) (0.002)Log Per Capita GDP t-1 0.338 *** 0.136 *** 0.206 *** 4.021 *** -0.015 -0.722 ***
(0.069) (0.038) (0.078) (0.251) (0.123) (0.188)OECD Growth t 0.031 *** 0.042 *** -0.011 -0.082 *** -0.054 *** 0.197 ***
(0.007) (0.005) (0.008) (0.013) (0.020) (0.041)Human Capital t-1 -0.001 -0.001 0.001 0.007 ** 0.005 ** 0.000
(0.001) (0.001) (0.001) (0.003) (0.002) (0.006)Private Credit/ GDP t-1 -0.374 *** -0.242 *** -0.112 * -1.031 *** -0.157 -0.334
(0.063) (0.055) (0.068) (0.183) (0.137) (0.274)Industry-Country FE Yes Yes Yes Yes Yes YesYear Dummies Yes Yes Yes Yes Yes YesNumber of Observations 8320 8277 8241 5810 5438 1330R 2
0.090 0.110 0.090 0.880 0.070 0.250Notes: ***, **, and * denote statistical significance at the .01, .05, and .1 levels, respectively.
(5) (6)
Table 6 continuedPanel B: Disaggregating by Industry Growth Opportunities
(1) (2) (3) (4)
(1) (2) (3) (4) (5) (6)
Growth in Real Value Added
Growth in Number of Establishments
Growth in Establishment Size Investment
Growth in Investment/
Establishment
Growth in Average Market
CapitalizationLiberalization t 0.190 *** -0.007 0.196 *** 0.345 *** 0.284 *** 0.499 ***
(0.035) (0.025) (0.039) (0.117) (0.076) (0.147)Interaction (Liberalization t * -0.001 * 0.000 -0.001 0.000 -0.001 0.000 Concentration) (0.000) (0.001) (0.001) (0.003) (0.001) (0.003)Share of Industry Value -4.582 *** -0.241 -4.329 *** 5.172 *** -0.838 -0.443 Added t-1 (0.514) (0.153) (0.498) (1.390) (0.837) (1.144)Openness to Trade t-1 0.002 ** 0.002 *** 0.000 0.005 ** -0.006 ** 0.002
(0.001) (0.001) (0.001) (0.002) (0.002) (0.002)Log Per Capita GDP t-1 0.365 *** 0.169 *** 0.195 ** 4.029 *** 0.031 -0.775 ***
(0.075) (0.039) (0.082) (0.278) (0.124) (0.186)OECD Growth t 0.035 *** 0.041 *** -0.007 -0.082 *** -0.064 *** 0.207 ***
(0.008) (0.006) (0.008) (0.013) (0.019) (0.038)Human Capital t-1 0.000 -0.002 ** 0.002 * 0.006 * 0.005 ** 0.000
(0.001) (0.001) (0.001) (0.004) (0.002) (0.006)Private Credit/ GDP t-1 -0.376 *** -0.196 *** -0.163 ** -1.181 *** -0.271 * -0.212
(0.071) (0.056) (0.077) (0.199) (0.147) (0.265)Industry-Country FE Yes Yes Yes Yes Yes YesYear Dummies Yes Yes Yes Yes Yes YesNumber of Observations 6917 6882 6859 4826 4520 1251
R 20.090 0.100 0.090 0.880 0.070 0.220
Notes: ***, **, and * denote statistical significance at the .01, .05, and .1 levels, respectively.
This table presents results from industry-country fixed effects regressions of the impact of liberalization on concentrated industries. The variables are described in Appendix Table 1.Standard errors (in parentheses) are corrected for heteroskedasticity and clustered for each industry-country observation.
Table 7Disaggregating the Impact of Stock Market Liberalization based on Industry Concentration
(1) (2) (3) (4) (5) (6)
Growth in Real Value Added
Growth in Number of Establishments
Growth in Establishment Size Investment
Growth in Investment/
Establishment
Growth in Average Market
CapitalizationLiberalization t 0.142 *** -0.022 0.164 *** 0.327 *** 0.267 *** 0.526 ***
(0.027) (0.017) (0.027) (0.056) (0.052) (0.103)Interaction (Liberalization t * 0.416 *** 0.156 *** 0.271 0.045 -0.356 ** -0.303 Privatization t ) (0.154) (0.039) (0.170) (0.185) (0.157) (0.191)Privatization t -0.419 *** -0.105 *** -0.324 * 0.220 0.358 ** 0.344 **
(0.158) (0.038) (0.174) (0.177) (0.152) (0.169)Share of Industry Value -4.662 *** -0.263 * -4.435 *** 5.808 *** -0.912 -0.624 Added t-1 (0.513) (0.153) (0.497) (1.358) (0.827) (1.085)Openness to Trade t-1 0.002 *** 0.002 *** 0.000 0.004 ** -0.006 *** 0.000
(0.001) (0.001) (0.001) (0.002) (0.002) (0.002)Log Per Capita GDP t-1 0.340 *** 0.141 *** 0.202 *** 3.966 *** -0.047 -0.689 ***
(0.068) (0.037) (0.076) (0.243) (0.112) (0.201)OECD Growth t 0.035 *** 0.042 *** -0.007 -0.081 *** -0.051 *** 0.203 ***
(0.007) (0.005) (0.008) (0.012) (0.019) (0.038)Human Capital t-1 -0.001 -0.002 ** 0.001 0.008 ** 0.005 ** -0.001
(0.001) (0.001) (0.001) (0.003) (0.002) (0.006)Private Credit/ GDP t-1 -0.3951 *** -0.2043 *** -0.1757 ** -1.0266 *** -0.1499 -0.2455
-0.064 -0.054 -0.069 -0.180 -0.135 -0.281Industry-Country FE Yes Yes Yes Yes Yes YesYear Dummies Yes Yes Yes Yes Yes YesNumber of Observations 8320 8277 8241 5810 5438 1330R 2
0.090 0.110 0.080 0.880 0.070 0.250
Table 8
Notes: ***, **, and * denote statistical significance at the .01, .05, and .1 levels, respectively.
This table presents results from industry-country fixed effects regressions of the impact of liberalization on industries that privatize government-owned firms. The variables are described inAppendix Table 1. Standard errors (in parentheses) are corrected for heteroskedasticity and clustered for each industry-country observation.
Privatization and Stock Market Liberalization
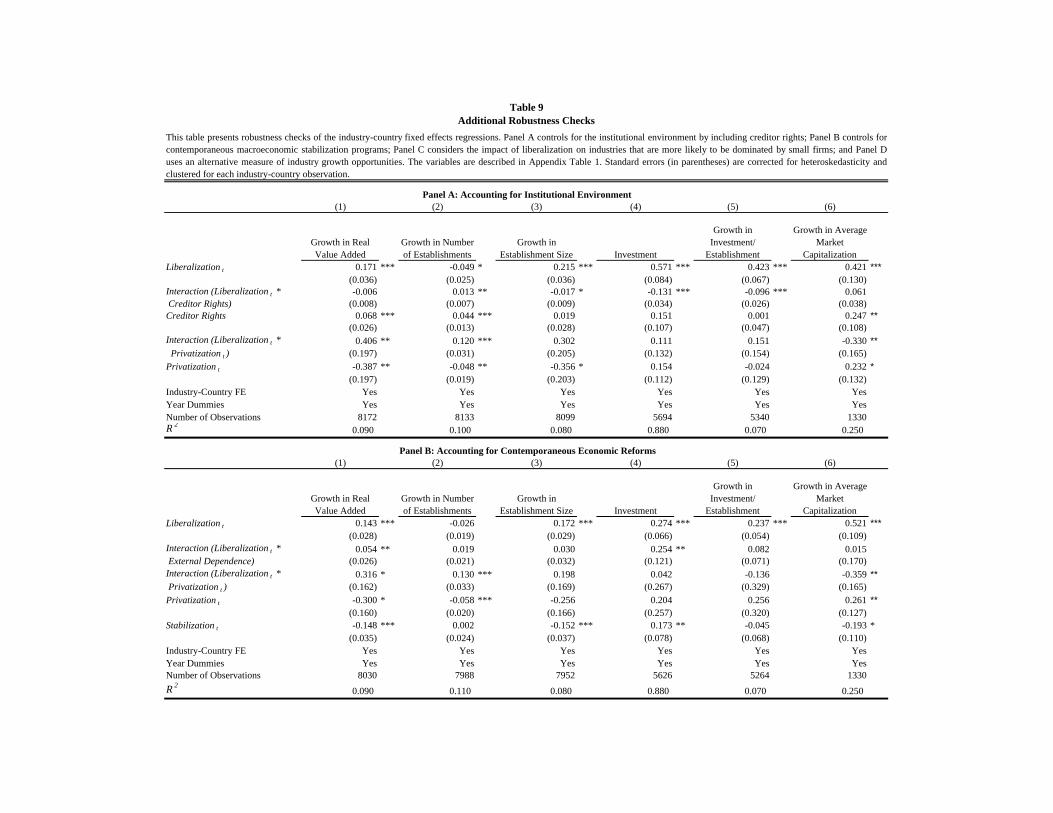
(1) (2) (3) (4) (5) (6)
Growth in Real Value Added
Growth in Number of Establishments
Growth in Establishment Size Investment
Growth in Investment/
Establishment
Growth in Average Market
CapitalizationLiberalization t 0.171 *** -0.049 * 0.215 *** 0.571 *** 0.423 *** 0.421 ***
(0.036) (0.025) (0.036) (0.084) (0.067) (0.130)Interaction (Liberalization t * -0.006 0.013 ** -0.017 * -0.131 *** -0.096 *** 0.061 Creditor Rights) (0.008) (0.007) (0.009) (0.034) (0.026) (0.038)Creditor Rights 0.068 *** 0.044 *** 0.019 0.151 0.001 0.247 **
(0.026) (0.013) (0.028) (0.107) (0.047) (0.108)Interaction (Liberalization t * 0.406 ** 0.120 *** 0.302 0.111 0.151 -0.330 ** Privatization t ) (0.197) (0.031) (0.205) (0.132) (0.154) (0.165)Privatization t -0.387 ** -0.048 ** -0.356 * 0.154 -0.024 0.232 *
(0.197) (0.019) (0.203) (0.112) (0.129) (0.132)Industry-Country FE Yes Yes Yes Yes Yes YesYear Dummies Yes Yes Yes Yes Yes YesNumber of Observations 8172 8133 8099 5694 5340 1330R 2
0.090 0.100 0.080 0.880 0.070 0.250
(1) (2) (3) (4) (5) (6)
Growth in Real Value Added
Growth in Number of Establishments
Growth in Establishment Size Investment
Growth in Investment/
Establishment
Growth in Average Market
CapitalizationLiberalization t 0.143 *** -0.026 0.172 *** 0.274 *** 0.237 *** 0.521 ***
(0.028) (0.019) (0.029) (0.066) (0.054) (0.109)Interaction (Liberalization t * 0.054 ** 0.019 0.030 0.254 ** 0.082 0.015 External Dependence) (0.026) (0.021) (0.032) (0.121) (0.071) (0.170)Interaction (Liberalization t * 0.316 * 0.130 *** 0.198 0.042 -0.136 -0.359 ** Privatization t ) (0.162) (0.033) (0.169) (0.267) (0.329) (0.165)Privatization t -0.300 * -0.058 *** -0.256 0.204 0.256 0.261 **
(0.160) (0.020) (0.166) (0.257) (0.320) (0.127)Stabilization t -0.148 *** 0.002 -0.152 *** 0.173 ** -0.045 -0.193 *
(0.035) (0.024) (0.037) (0.078) (0.068) (0.110)Industry-Country FE Yes Yes Yes Yes Yes YesYear Dummies Yes Yes Yes Yes Yes YesNumber of Observations 8030 7988 7952 5626 5264 1330R 2
0.090 0.110 0.080 0.880 0.070 0.250
Table 9
Panel B: Accounting for Contemporaneous Economic Reforms
Additional Robustness Checks
Panel A: Accounting for Institutional Environment
This table presents robustness checks of the industry-country fixed effects regressions. Panel A controls for the institutional environment by including creditor rights; Panel B controls forcontemporaneous macroeconomic stabilization programs; Panel C considers the impact of liberalization on industries that are more likely to be dominated by small firms; and Panel Duses an alternative measure of industry growth opportunities. The variables are described in Appendix Table 1. Standard errors (in parentheses) are corrected for heteroskedasticity andclustered for each industry-country observation.
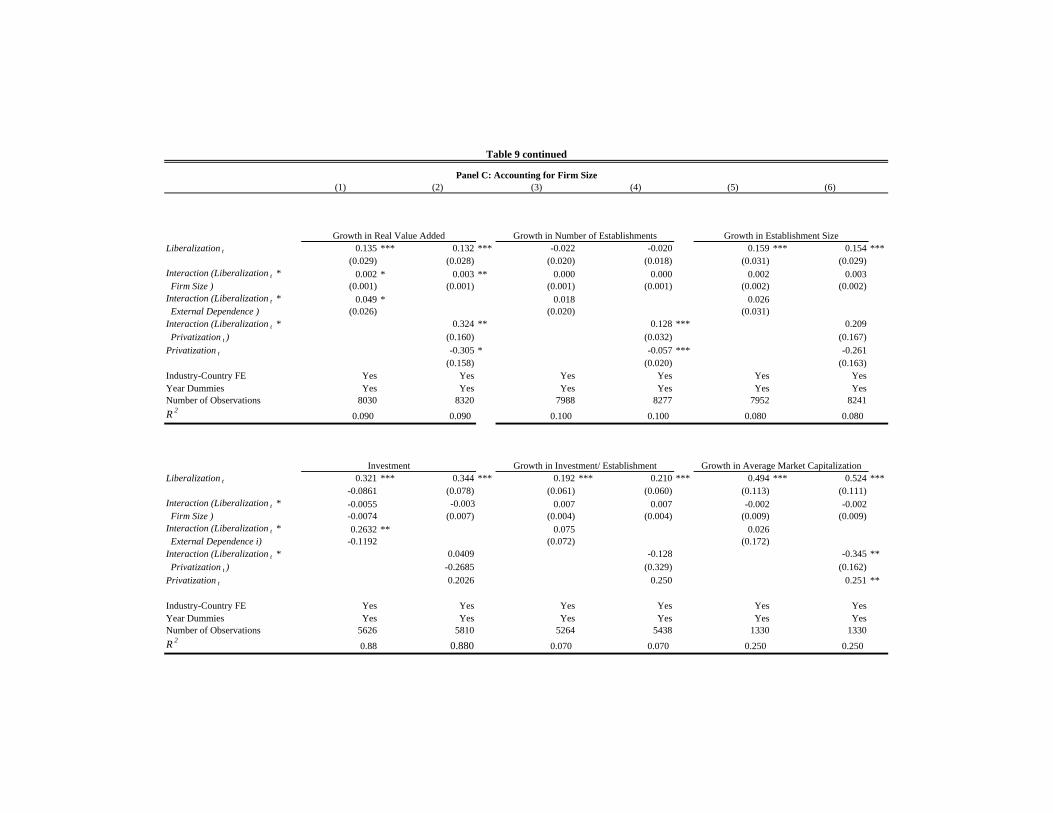
(1) (2) (3) (4) (5) (6)
Liberalization t 0.135 *** 0.132 *** -0.022 -0.020 0.159 *** 0.154 ***(0.029) (0.028) (0.020) (0.018) (0.031) (0.029)
Interaction (Liberalization t * 0.002 * 0.003 ** 0.000 0.000 0.002 0.003 Firm Size ) (0.001) (0.001) (0.001) (0.001) (0.002) (0.002)Interaction (Liberalization t * 0.049 * 0.018 0.026 External Dependence ) (0.026) (0.020) (0.031)Interaction (Liberalization t * 0.324 ** 0.128 *** 0.209 Privatization t ) (0.160) (0.032) (0.167)Privatization t -0.305 * -0.057 *** -0.261
(0.158) (0.020) (0.163)Industry-Country FE Yes Yes Yes Yes Yes YesYear Dummies Yes Yes Yes Yes Yes YesNumber of Observations 8030 8320 7988 8277 7952 8241R 2
0.090 0.090 0.100 0.100 0.080 0.080
Liberalization t 0.321 *** 0.344 *** 0.192 *** 0.210 *** 0.494 *** 0.524 ***-0.0861 (0.078) (0.061) (0.060) (0.113) (0.111)
Interaction (Liberalization t * -0.0055 -0.003 0.007 0.007 -0.002 -0.002 Firm Size ) -0.0074 (0.007) (0.004) (0.004) (0.009) (0.009)Interaction (Liberalization t * 0.2632 ** 0.075 0.026 External Dependence i) -0.1192 (0.072) (0.172)Interaction (Liberalization t * 0.0409 -0.128 -0.345 ** Privatization t ) -0.2685 (0.329) (0.162)Privatization t 0.2026 0.250 0.251 **
Industry-Country FE Yes Yes Yes Yes Yes YesYear Dummies Yes Yes Yes Yes Yes YesNumber of Observations 5626 5810 5264 5438 1330 1330R 2
0.88 0.880 0.070 0.070 0.250 0.250
Table 9 continued
Investment Growth in Investment/ Establishment Growth in Average Market Capitalization
Panel C: Accounting for Firm Size
Growth in Real Value Added Growth in Number of Establishments Growth in Establishment Size
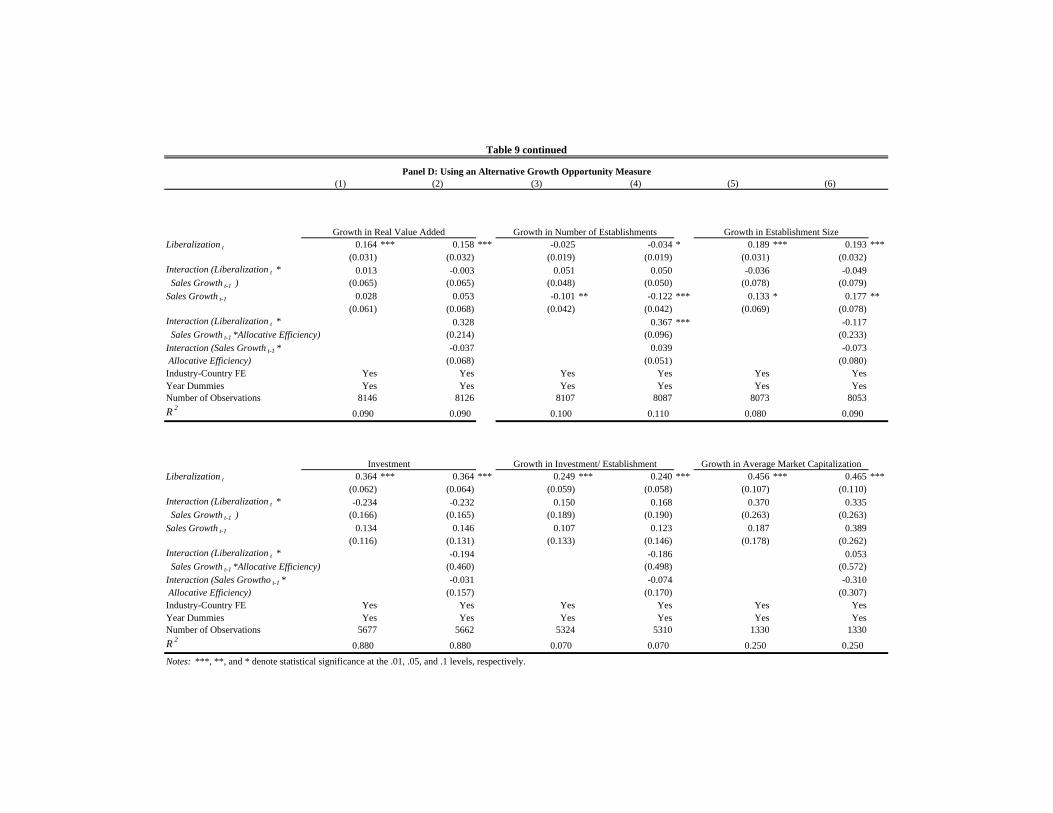
(1) (2) (3) (4) (5) (6)
Liberalization t 0.164 *** 0.158 *** -0.025 -0.034 * 0.189 *** 0.193 ***(0.031) (0.032) (0.019) (0.019) (0.031) (0.032)
Interaction (Liberalization t * 0.013 -0.003 0.051 0.050 -0.036 -0.049 Sales Growth t-1 ) (0.065) (0.065) (0.048) (0.050) (0.078) (0.079)Sales Growth t-1 0.028 0.053 -0.101 ** -0.122 *** 0.133 * 0.177 **
(0.061) (0.068) (0.042) (0.042) (0.069) (0.078)Interaction (Liberalization t * 0.328 0.367 *** -0.117 Sales Growth t-1 *Allocative Efficiency) (0.214) (0.096) (0.233)Interaction (Sales Growth t-1 * -0.037 0.039 -0.073 Allocative Efficiency) (0.068) (0.051) (0.080)Industry-Country FE Yes Yes Yes Yes Yes YesYear Dummies Yes Yes Yes Yes Yes YesNumber of Observations 8146 8126 8107 8087 8073 8053R 2
0.090 0.090 0.100 0.110 0.080 0.090
Liberalization t 0.364 *** 0.364 *** 0.249 *** 0.240 *** 0.456 *** 0.465 ***(0.062) (0.064) (0.059) (0.058) (0.107) (0.110)
Interaction (Liberalization t * -0.234 -0.232 0.150 0.168 0.370 0.335 Sales Growth t-1 ) (0.166) (0.165) (0.189) (0.190) (0.263) (0.263)Sales Growth t-1 0.134 0.146 0.107 0.123 0.187 0.389
(0.116) (0.131) (0.133) (0.146) (0.178) (0.262)Interaction (Liberalization t * -0.194 -0.186 0.053 Sales Growth t-1 *Allocative Efficiency) (0.460) (0.498) (0.572)Interaction (Sales Growtho t-1 * -0.031 -0.074 -0.310 Allocative Efficiency) (0.157) (0.170) (0.307)Industry-Country FE Yes Yes Yes Yes Yes YesYear Dummies Yes Yes Yes Yes Yes YesNumber of Observations 5677 5662 5324 5310 1330 1330R 2
0.880 0.880 0.070 0.070 0.250 0.250
Table 9 continued
Panel D: Using an Alternative Growth Opportunity Measure
Notes: ***, **, and * denote statistical significance at the .01, .05, and .1 levels, respectively.
Growth in Real Value Added Growth in Number of Establishments Growth in Establishment Size
Growth in Investment/ EstablishmentInvestment Growth in Average Market Capitalization
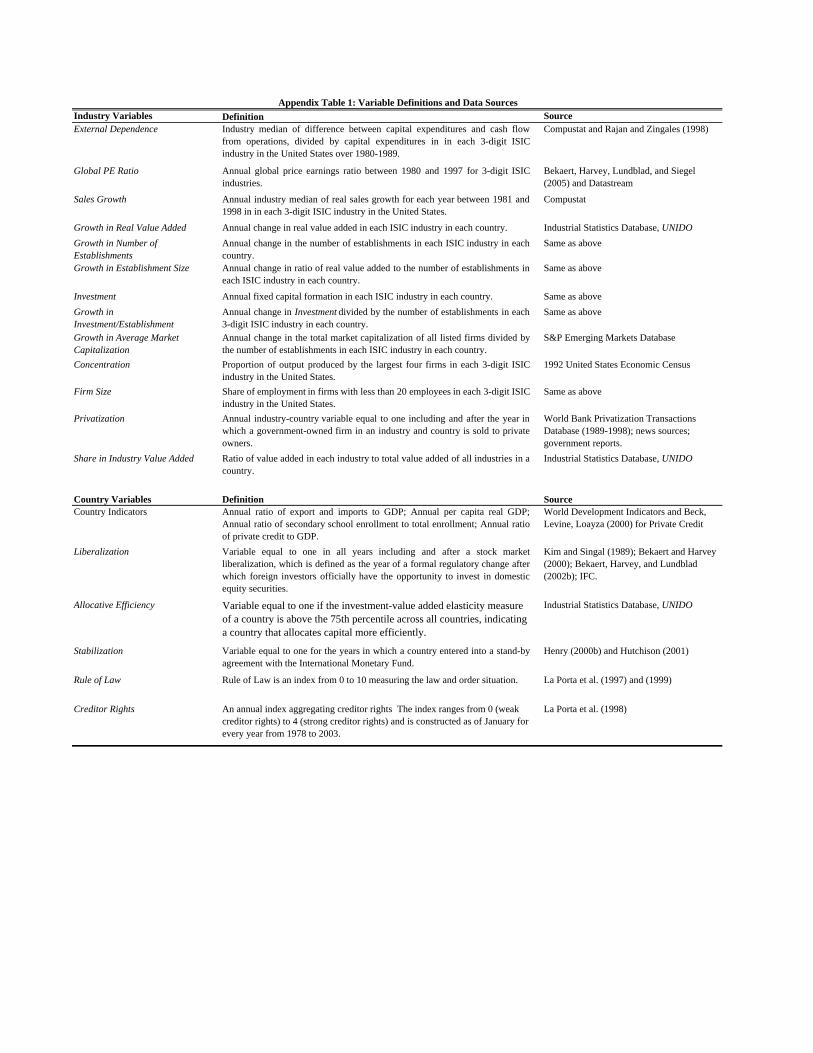
Industry Variables Definition SourceExternal Dependence Industry median of difference between capital expenditures and cash flow
from operations, divided by capital expenditures in in each 3-digit ISICindustry in the United States over 1980-1989.
Compustat and Rajan and Zingales (1998)
Global PE Ratio Annual global price earnings ratio between 1980 and 1997 for 3-digit ISICindustries.
Bekaert, Harvey, Lundblad, and Siegel (2005) and Datastream
Sales Growth Annual industry median of real sales growth for each year between 1981 and1998 in in each 3-digit ISIC industry in the United States.
Compustat
Growth in Real Value Added Annual change in real value added in each ISIC industry in each country. Industrial Statistics Database, UNIDOGrowth in Number of Establishments
Annual change in the number of establishments in each ISIC industry in eachcountry.
Same as above
Growth in Establishment Size Annual change in ratio of real value added to the number of establishments ineach ISIC industry in each country.
Same as above
Investment Annual fixed capital formation in each ISIC industry in each country. Same as aboveGrowth in Investment/Establishment
Annual change in Investment divided by the number of establishments in each3-digit ISIC industry in each country.
Same as above
Growth in Average Market Capitalization
Annual change in the total market capitalization of all listed firms divided bythe number of establishments in each ISIC industry in each country.
S&P Emerging Markets Database
Concentration Proportion of output produced by the largest four firms in each 3-digit ISICindustry in the United States.
1992 United States Economic Census
Firm Size Share of employment in firms with less than 20 employees in each 3-digit ISICindustry in the United States.
Same as above
Privatization Annual industry-country variable equal to one including and after the year inwhich a government-owned firm in an industry and country is sold to privateowners.
World Bank Privatization Transactions Database (1989-1998); news sources; government reports.
Share in Industry Value Added Ratio of value added in each industry to total value added of all industries in acountry.
Industrial Statistics Database, UNIDO
Country Variables Definition SourceCountry Indicators Annual ratio of export and imports to GDP; Annual per capita real GDP;
Annual ratio of secondary school enrollment to total enrollment; Annual ratioof private credit to GDP.
World Development Indicators and Beck, Levine, Loayza (2000) for Private Credit
Liberalization Variable equal to one in all years including and after a stock marketliberalization, which is defined as the year of a formal regulatory change afterwhich foreign investors officially have the opportunity to invest in domesticequity securities.
Kim and Singal (1989); Bekaert and Harvey (2000); Bekaert, Harvey, and Lundblad (2002b); IFC.
Allocative Efficiency Variable equal to one if the investment-value added elasticity measure of a country is above the 75th percentile across all countries, indicating a country that allocates capital more efficiently.
Industrial Statistics Database, UNIDO
Stabilization Variable equal to one for the years in which a country entered into a stand-byagreement with the International Monetary Fund.
Henry (2000b) and Hutchison (2001)
Rule of Law Rule of Law is an index from 0 to 10 measuring the law and order situation. La Porta et al. (1997) and (1999)
Creditor Rights An annual index aggregating creditor rights The index ranges from 0 (weak creditor rights) to 4 (strong creditor rights) and is constructed as of January for every year from 1978 to 2003.
La Porta et al. (1998)
Appendix Table 1: Variable Definitions and Data Sources
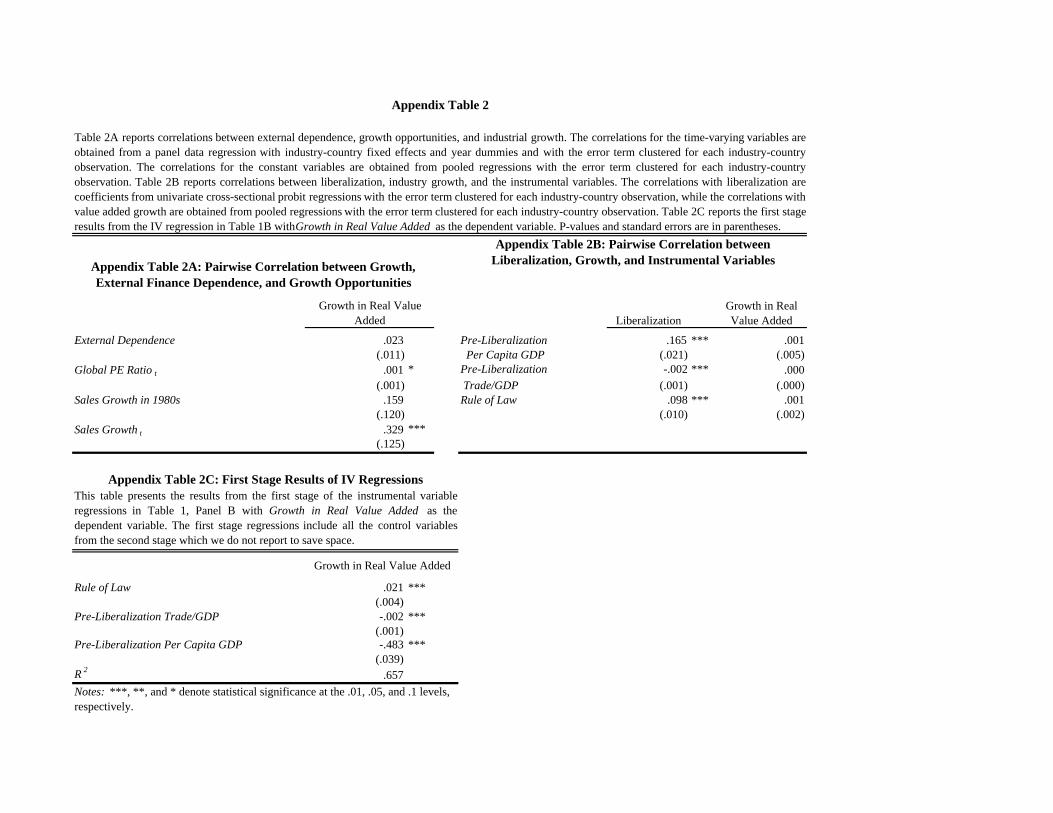
LiberalizationGrowth in Real Value Added
External Dependence .023 Pre-Liberalization .165 *** .001(.011) Per Capita GDP (.021) (.005)
Global PE Ratio t .001 * Pre-Liberalization -.002 *** .000(.001) Trade/GDP (.001) (.000)
Sales Growth in 1980s .159 Rule of Law .098 *** .001(.120) (.010) (.002)
Sales Growth t .329 ***(.125)
Rule of Law .021 ***(.004)
Pre-Liberalization Trade/GDP -.002 ***(.001)
Pre-Liberalization Per Capita GDP -.483 ***(.039)
R 2 .657
Appendix Table 2C: First Stage Results of IV RegressionsThis table presents the results from the first stage of the instrumental variableregressions in Table 1, Panel B with Growth in Real Value Added as thedependent variable. The first stage regressions include all the control variablesfrom the second stage which we do not report to save space.
Notes: ***, **, and * denote statistical significance at the .01, .05, and .1 levels, respectively.
Growth in Real Value Added
Appendix Table 2
Appendix Table 2A: Pairwise Correlation between Growth, External Finance Dependence, and Growth Opportunities
Appendix Table 2B: Pairwise Correlation between Liberalization, Growth, and Instrumental Variables
Growth in Real Value Added
Table 2A reports correlations between external dependence, growth opportunities, and industrial growth. The correlations for the time-varying variables areobtained from a panel data regression with industry-country fixed effects and year dummies and with the error term clustered for each industry-countryobservation. The correlations for the constant variables are obtained from pooled regressions with the error term clustered for each industry-countryobservation. Table 2B reports correlations between liberalization, industry growth, and the instrumental variables. The correlations with liberalization arecoefficients from univariate cross-sectional probit regressions with the error term clustered for each industry-country observation, while the correlations withvalue added growth are obtained from pooled regressions with the error term clustered for each industry-country observation. Table 2C reports the first stageresults from the IV regression in Table 1B with Growth in Real Value Added as the dependent variable. P-values and standard errors are in parentheses.