Embed Size (px)
Citation preview
798
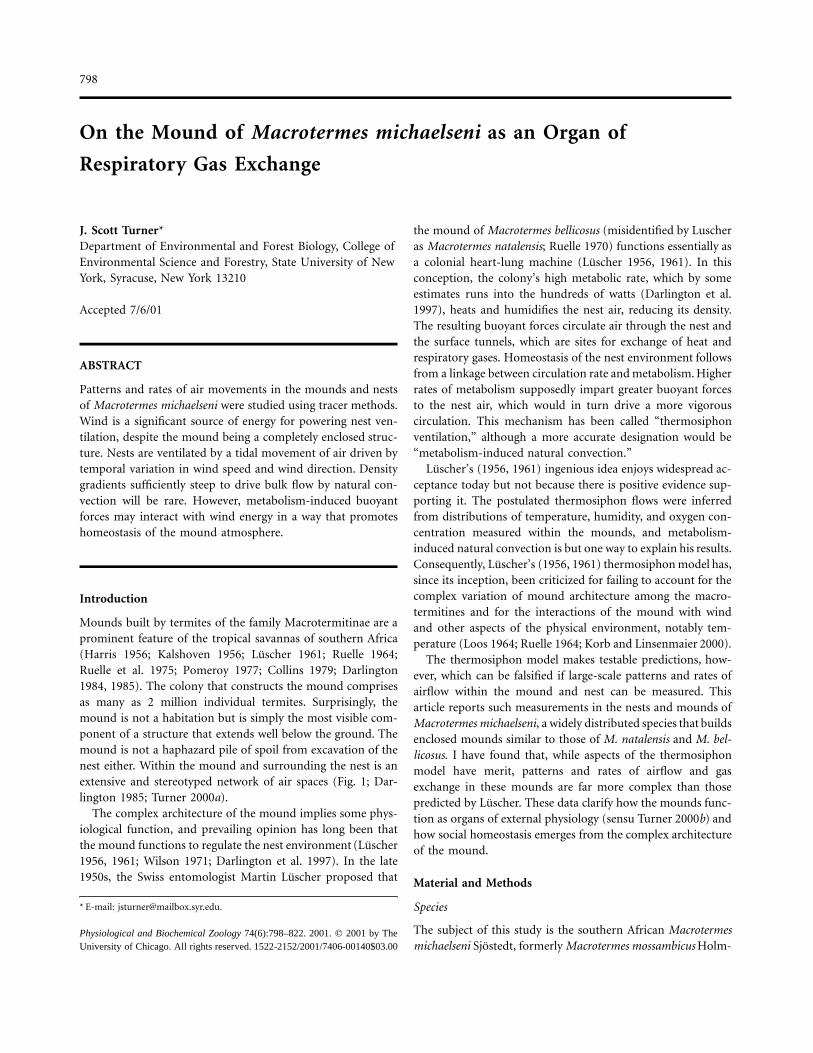
On the Mound of Macrotermes michaelseni as an Organ of
Respiratory Gas Exchange
J. Scott Turner*Department of Environmental and Forest Biology, College ofEnvironmental Science and Forestry, State University of NewYork, Syracuse, New York 13210
Accepted 7/6/01
ABSTRACT
Patterns and rates of air movements in the mounds and nestsof Macrotermes michaelseni were studied using tracer methods.Wind is a significant source of energy for powering nest ven-tilation, despite the mound being a completely enclosed struc-ture. Nests are ventilated by a tidal movement of air driven bytemporal variation in wind speed and wind direction. Densitygradients sufficiently steep to drive bulk flow by natural con-vection will be rare. However, metabolism-induced buoyantforces may interact with wind energy in a way that promoteshomeostasis of the mound atmosphere.
Introduction
Mounds built by termites of the family Macrotermitinae are aprominent feature of the tropical savannas of southern Africa(Harris 1956; Kalshoven 1956; Luscher 1961; Ruelle 1964;Ruelle et al. 1975; Pomeroy 1977; Collins 1979; Darlington1984, 1985). The colony that constructs the mound comprisesas many as 2 million individual termites. Surprisingly, themound is not a habitation but is simply the most visible com-ponent of a structure that extends well below the ground. Themound is not a haphazard pile of spoil from excavation of thenest either. Within the mound and surrounding the nest is anextensive and stereotyped network of air spaces (Fig. 1; Dar-lington 1985; Turner 2000a).
The complex architecture of the mound implies some phys-iological function, and prevailing opinion has long been thatthe mound functions to regulate the nest environment (Luscher1956, 1961; Wilson 1971; Darlington et al. 1997). In the late1950s, the Swiss entomologist Martin Luscher proposed that
* E-mail: [email protected].
Physiological and Biochemical Zoology 74(6):798–822. 2001. � 2001 by TheUniversity of Chicago. All rights reserved. 1522-2152/2001/7406-00140$03.00
the mound of Macrotermes bellicosus (misidentified by Luscheras Macrotermes natalensis; Ruelle 1970) functions essentially asa colonial heart-lung machine (Luscher 1956, 1961). In thisconception, the colony’s high metabolic rate, which by someestimates runs into the hundreds of watts (Darlington et al.1997), heats and humidifies the nest air, reducing its density.The resulting buoyant forces circulate air through the nest andthe surface tunnels, which are sites for exchange of heat andrespiratory gases. Homeostasis of the nest environment followsfrom a linkage between circulation rate and metabolism. Higherrates of metabolism supposedly impart greater buoyant forcesto the nest air, which would in turn drive a more vigorouscirculation. This mechanism has been called “thermosiphonventilation,” although a more accurate designation would be“metabolism-induced natural convection.”
Luscher’s (1956, 1961) ingenious idea enjoys widespread ac-ceptance today but not because there is positive evidence sup-porting it. The postulated thermosiphon flows were inferredfrom distributions of temperature, humidity, and oxygen con-centration measured within the mounds, and metabolism-induced natural convection is but one way to explain his results.Consequently, Luscher’s (1956, 1961) thermosiphon model has,since its inception, been criticized for failing to account for thecomplex variation of mound architecture among the macro-termitines and for the interactions of the mound with windand other aspects of the physical environment, notably tem-perature (Loos 1964; Ruelle 1964; Korb and Linsenmaier 2000).
The thermosiphon model makes testable predictions, how-ever, which can be falsified if large-scale patterns and rates ofairflow within the mound and nest can be measured. Thisarticle reports such measurements in the nests and mounds ofMacrotermes michaelseni, a widely distributed species that buildsenclosed mounds similar to those of M. natalensis and M. bel-licosus. I have found that, while aspects of the thermosiphonmodel have merit, patterns and rates of airflow and gasexchange in these mounds are far more complex than thosepredicted by Luscher. These data clarify how the mounds func-tion as organs of external physiology (sensu Turner 2000b) andhow social homeostasis emerges from the complex architectureof the mound.
Material and Methods
Species
The subject of this study is the southern African Macrotermesmichaelseni Sjostedt, formerly Macrotermes mossambicus Holm-

Gas Exchange in Macrotermes Mounds 799
Figure 2. Schematic of the two versions of the mound gas analysissystem (MGAS) used in this study. a, MGAS version 1, used to measuretemperature, oxygen, humidity, and combustible gas concentration(CG) inside and outside the mound and nest. b, MGAS version 3,which managed 12 combustible gas sensors. The three sensors desig-nated internal could also be used to measure external or surface CG.
Figure 1. Stylized cross section of the nest and mound of Macrotermesmichaelseni based upon cross sections of a mound dissected on theNamatubis study site in northern Namibia (Turner 2000a).
gren (Termitidae, Macrotermitinae; Ruelle 1975). These ter-mites are widely distributed throughout the savanna habitatsof sub-Saharan Africa (Grasse and Noirot 1961; Ruelle 1964,1985; Pomeroy 1977; Abe and Darlington 1985; Turner 2000a).Like all macrotermitines, M. michaelseni maintains a symbiosiswith a fungus, Termitomyces spp., that aids in digesting cellulose(Batra and Batra 1979; Garnier-Sillam et al. 1988; Rouland etal. 1991).
I have described the structure of the M. michaelseni moundin some detail elsewhere (Turner 2000a). However, a few com-ments about the structure of the mound and nest are necessaryhere. The workers, reproductives, and fungal symbionts arehoused in a nest that occupies a roughly spherical space about1.5–2.0 m in diameter (Fig. 1). The distribution of biomass inthe nest is stratified. The queen, workers, and nursery galleriesare contained within the nest proper, while covering the topof the nest is an array of chambers housing fungus combs, theso-called fungus garden. Surrounding the nest is a network oftunnels that extend around and below the nest (Fig. 1). Thesetunnels merge above the fungus combs to form a central chim-ney that extends upward into the mound. The chimney itselfis at the center of a reticulum of tunnels that extends through-out the mound, termed the “lateral connectives.” The lateralconnectives merge into a series of vertically oriented surfaceconduits that underlie roughly 20% of the mound surface. Thesurface conduits are separated from the outside air by a porouscovering that is 1–3 cm thick. The M. michaelseni mound is atypical “enclosed” mound (sensu Korb and Linsenmair 2000).
Study Site
The study site was situated in the Republic of Namibia, on thefarm Namatubis, 13 km north of Outjo (lat. 16�09�E, long.20�06�S; elevation 1,330 m). This region is part of the highplateau (1,200–2,000 m) that occupies most of the eastern halfof the country. The local topography is flat, interspersed withlinear ranges of low hills. The vegetation is classified by Coatonand Sheasby (1972) as mopane savanna, with about 450 mmmean annual rainfall. The work was carried out over six ex-peditions to the study site from 1995 through 1997: three inthe austral winter (July–August) and three in the austral sum-mer (December–January).
Mounds were selected for study along a 2-km stretch ofunpaved service road on the farm. Mounds were selected inthis way to keep distances for transporting equipment fromvehicles to the mound reasonably short. A total of 45 moundswas selected, drawn from a sampled area of about 40 ha. Eachmound was permanently marked with metal tags. Basal cir-cumference, mound height, and estimated volume were mea-
800 J. S. Turner
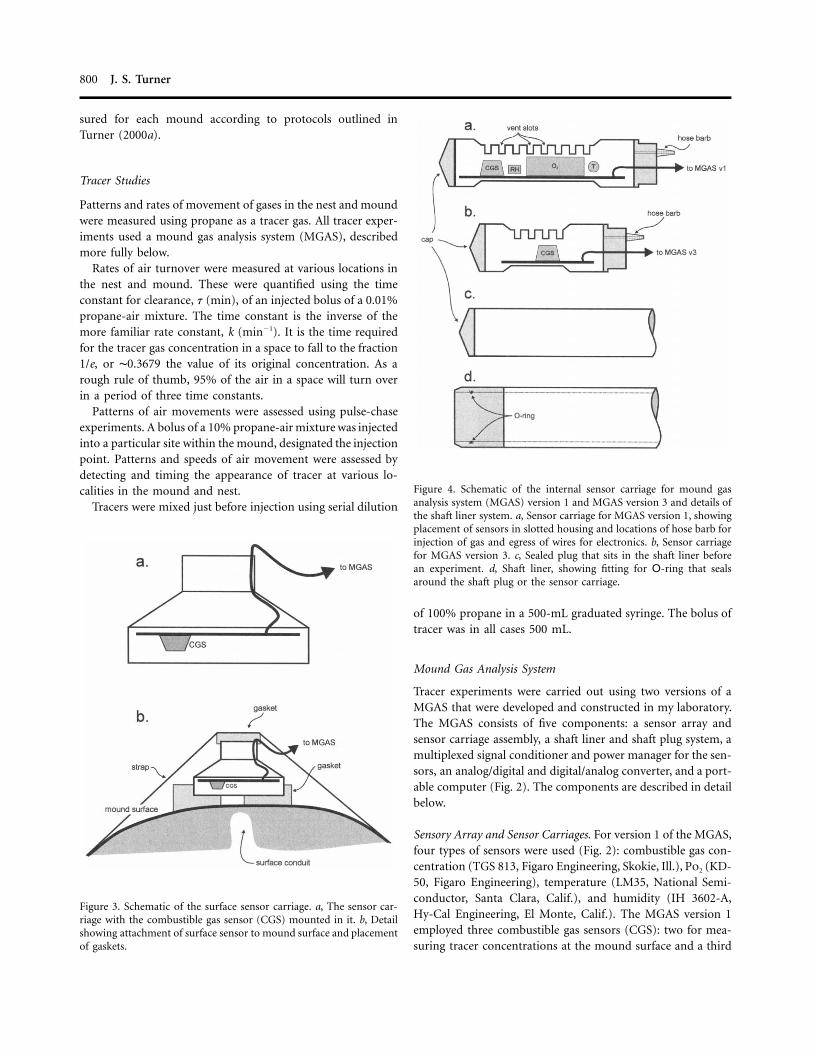
Figure 4. Schematic of the internal sensor carriage for mound gasanalysis system (MGAS) version 1 and MGAS version 3 and details ofthe shaft liner system. a, Sensor carriage for MGAS version 1, showingplacement of sensors in slotted housing and locations of hose barb forinjection of gas and egress of wires for electronics. b, Sensor carriagefor MGAS version 3. c, Sealed plug that sits in the shaft liner beforean experiment. d, Shaft liner, showing fitting for O-ring that sealsaround the shaft plug or the sensor carriage.
Figure 3. Schematic of the surface sensor carriage. a, The sensor car-riage with the combustible gas sensor (CGS) mounted in it. b, Detailshowing attachment of surface sensor to mound surface and placementof gaskets.
sured for each mound according to protocols outlined inTurner (2000a).
Tracer Studies
Patterns and rates of movement of gases in the nest and moundwere measured using propane as a tracer gas. All tracer exper-iments used a mound gas analysis system (MGAS), describedmore fully below.
Rates of air turnover were measured at various locations inthe nest and mound. These were quantified using the timeconstant for clearance, t (min), of an injected bolus of a 0.01%propane-air mixture. The time constant is the inverse of themore familiar rate constant, k (min�1). It is the time requiredfor the tracer gas concentration in a space to fall to the fraction1/e, or ∼0.3679 the value of its original concentration. As arough rule of thumb, 95% of the air in a space will turn overin a period of three time constants.
Patterns of air movements were assessed using pulse-chaseexperiments. A bolus of a 10% propane-air mixture was injectedinto a particular site within the mound, designated the injectionpoint. Patterns and speeds of air movement were assessed bydetecting and timing the appearance of tracer at various lo-calities in the mound and nest.
Tracers were mixed just before injection using serial dilution
of 100% propane in a 500-mL graduated syringe. The bolus oftracer was in all cases 500 mL.
Mound Gas Analysis System
Tracer experiments were carried out using two versions of aMGAS that were developed and constructed in my laboratory.The MGAS consists of five components: a sensor array andsensor carriage assembly, a shaft liner and shaft plug system, amultiplexed signal conditioner and power manager for the sen-sors, an analog/digital and digital/analog converter, and a port-able computer (Fig. 2). The components are described in detailbelow.
Sensory Array and Sensor Carriages. For version 1 of the MGAS,four types of sensors were used (Fig. 2): combustible gas con-centration (TGS 813, Figaro Engineering, Skokie, Ill.), Po2 (KD-50, Figaro Engineering), temperature (LM35, National Semi-conductor, Santa Clara, Calif.), and humidity (IH 3602-A,Hy-Cal Engineering, El Monte, Calif.). The MGAS version 1employed three combustible gas sensors (CGS): two for mea-suring tracer concentrations at the mound surface and a third

Gas Exchange in Macrotermes Mounds 801
Table 1: Temperature, humidity, and oxygen concentration in nests of Macrotermes michaelseni in winter andsummer
Winter Summer Morning Afternoon
Mean (SD) n Mean (SD) n Mean (SD) n Mean (SD) n
Temperature (�C):Nest 26.19 (4.18) 30 31.73 (2.94) 19 26.67 (4.93) 28 30.56 (3.02) 21Environment 23.65 (9.86) 30 31.16 (10.97) 19 21.44 (10.94) 28 33.40 (5.88) 21dT a �2.53 (6.76) 30 �.57 (8.38) 19 �5.23 (7.52) 28 �2.84 (4.03) 21
Humidity (kPa):Nest 2.58 (.29) 15 3.40 (.43) 18 2.99 (.50) 20 3.08 (.65) 13Environment .35 (.21) 15 .83 (.56) 18 .65 (.51) 20 .55 (.47) 13dPh2o
a �2.23 (.23) 15 �2.57 (.47) 18 �2.34 (.37) 20 �2.53 (.46) 13Oxygen (kPa):
dPo2a �1.81 (.59) 30 �1.53 (.69) 19 �1.55 (.56) 28 �1.89 (.69) 22
CG 964 (1,322) 11 1,448 (4,111) 11
Note. Data are reported as mean (SD); size. CG (combustible gas concentration) is reported in parts per million methanen p sample
equivalents.a .Nest � environment
Table 2: Covariation of internal and external temperaturesand humidities and the effect of season
Effect Slope (SD) r 2 (%)
Tin vs. Tout :
All Tin p 18.86 (.97) � .36 (.03) Tout 70.4
Winter only Tin p 17.79 (1.12) � .35 (.04) Tout 70.0
Summer only Tin p 24.12 (.89) � .24 (.03) Tout 82.9
ein vs. eout :
All ein p 2.55 (.11) � .79 (.14) eout 48.7
Winter only ein p 2.28 (.12) � .87 (.31) eout 37.5
Summer only ein p 3.03 (.16) � .45 (.16) eout 33.3
Note. These data are for measurements taken from the nest only.
for measuring tracer concentrations in the nest or mound in-terior. Oxygen, temperature, and humidity sensors weremounted with the internal combustible gas sensor on a sensorcarriage, described more fully below. Temperature and humiditysensors also measured these properties in the outside air.
Temperature sensors were calibrated against a standard mer-cury thermometer. Sensors for humidity were calibrated byenclosing them in sealed chambers over saturated solutions ofvarious salts (Tracy et al. 1980). The oxygen sensor was cali-brated by enclosing it in a chamber with known mixtures ofnitrogen and air. The combustible gas sensors were calibratedby enclosing them in chamber with known mixtures of methaneand air. All concentrations of combustible gas are reported asmethane equivalents.
The sensors were mounted on one of three types of sensorcarriage. Combustible gas sensors for surface measurementswere mounted on a printed circuit board fixed in the widemouth of a 1/2-inch PVC couple (Fig. 3a). The wide3 # 1end of the couple was also covered with 1-mm aluminum screento keep termites from the sensors. The surface sensor carriageswere affixed tightly to the mound surface using nylon webbingstraps, which pressed the wide end of the couple against a foamrubber gasket on the mound surface. The narrow end of thecouple was plugged with a foam rubber gasket to eliminateinterference from wind (Fig. 3b).
External sensors for temperature and relative humidity weremounted on a sensor carriage similar to the surface CGS car-riages described above. During experiments, the external tem-perature and relative humidity sensors were mounted on a 1.5-m pole in a shady location adjacent to the mound.
The internal sensor carriage for MGAS version 1 carriedsensors for combustible gas concentration, oxygen concentra-
tion, relative humidity, and temperature (Fig. 4a). Sensors weremounted on a printed circuit board inside a plugged sectionof 40-mm PVC pipe. The plugged section of the pipe had ventslots to expose the sensors to the nest’s internal atmosphereand was covered with 1-mm mesh aluminum screen to excludetermites from the sensors. The plugged pipe, along with theshaft liner system described below, provided a sealed point inthe nest or mound interior for placement of the sensors andinjection of tracer. The internal sensor carriage for MGAS ver-sion 3 was similar, except that it carried only one combustiblegas sensor (Fig. 4b). The time constants for clearance of tracergas from both types of internal sensor carriage was 23–28 s instill room air.
Shaft Liner and Shaft Plug System. A shaft liner/shaft plug systemwas devised to place internal sensors into the mound and toeliminate leaks between the outside air and the spaces occupiedby the internal sensors (Fig. 4c, 4d). The shaft liner was a lengthof 50-mm PVC pipe, fitted on the end with an internal O-ring

802 J. S. Turner
Table 3: Time constants for clearanceof tracer gases from nests and moundsof Macrotermes michaelseni
t (min) n
Season:Winter 5.69 (3.29) 14Summer 8.09 (4.60) 17
Mound location:Nest 8.09 (4.60) 17Middle chimney 13.29 (7.74) 11Upper chimney 8.96 (4.07) 11
Note. Data are reported as mean (SD); n psize.sample
Figure 5. Regional variations in atmospheric composition in moundsof Macrotermes michaelseni. a, Temperature difference with ambientair ( [�C]). b, Water vapor partial pressure difference withT � Tin out
ambient air ( [kPa]). c, Po2 difference with ambient aire � ein out
( [kPa]). d, Endogenous combustible gas concentrationPo � Po2, in 2, out
in parts per million methane equivalents.
seal (Fig. 4d). The shaft plug was a length of 40-mm PVC pipe,sealed on one end by a tight-fitting plastic cap (Fig. 4c). Whenthe shaft plug was inserted into the shaft liner, the O-ringprovided an air-tight seal between the liner’s inside surface andthe shaft plug’s outside surface. To fit the shaft liner into a nest,a 2 1/2-inch-diameter hole was drilled into the mound or nestwith a soil auger. The assembled shaft liner/shaft plug assemblywas inserted into the hole and left in place for at least 12 h.During this time, the termites built around the outer face ofthe shaft liner, providing a tight seal around the shaft liner’soutside surface. The internal sensor carriage was placed bysliding the shaft plug out and replacing it with the sensor car-riage mounted on the end of a long piece of 40-mm-outer-diameter PVC pipe. In place, the sensor carriage was sealedfrom the outside air by both the O-ring seal and the soil sealbuilt by the termites.
Interface. The interface served to deliver regulated power to thesensors, to sense and condition signals from the sensors, andto switch outputs from the sensors to the analog/digital con-verter. Switching was done through a digital multiplexer con-trolled either by a three-bit output (MGAS version 1) or a four-bit output (MGAS version 3) from the computer. Conditioningof the signals included zeroing and ranging of the outputs fromthe combustible gas sensors, conversion of the voltage from theoxygen sensor to partial pressure of oxygen, and temperaturecompensation of the relative humidity sensors.
Analog/Digital Conversion. Outputs from the interface wereconverted to digital form by an A/D converter (Remote Mea-surement Systems, Seattle) and transmitted to the computerthrough an RS 232 serial interface.
Computing and Data Logging. Control of the experiment andrecording of the data was handled by a microcomputer (TRS102, Tandy Corp, Houston). The computer controlled switch-ing between sensors via a digital signal output to the A/Dconverter and interface. The computer also logged data as in-

Gas Exchange in Macrotermes Mounds 803
Figure 6. Wind-induced surface pressure over mounds of Macrotermesmichaelseni. Pressures are reported as differences of pressure relativeto still air. Left panel reports upwind, downwind, and lateral surfacepressures at heights roughly 2.5 m above ground level. Right panelreports upwind, downwind, and lateral surface pressures at heightsroughly 0.5 m above ground level.
Figure 7. Vertical pressure differences in surface conduits as affectedby variations of wind speed. a, Pressure difference between a pressureport at roughly 2.5 m above ground and a port at roughly 0.5 m aboveground. A positive pressure difference indicates a downward-pointingpressure difference. b, Absolute pressure differences taken from a.
Table 4: Boundary layer wind speeds measuredduring summer and winter of 1998 (Namatubisstudy site)
Height above Ground (m) Wind Speed (m s�1)
.5 .72 (.43)1.5 1.38 (.64)2.5 1.90 (.62)
Note. Data are reported as mean (SD).
dicated. The computer conducted experiments according to aset protocol. The typical protocol was as follows: (1) Beforeplacing the sensors, data were logged every 30 s for 10 minwith all sensors exposed to fresh air. These data provided apreexperiment baseline. (2) Following the placement of sensorsinto or onto the mound, data were logged every 30 s for 10min. These data provided a preinjection baseline. (3) The tracerbolus was injected. (4) Data from the combustible gas sensorswere recorded at time intervals of 30 or 60 s for a period oftime, usually 1 h. In some experiments, postinjection data werelogged for as long as 3 h. These data were the experimentalresults. (5) All sensors were removed from the mound andplaced in fresh air, and their data were logged at 30-s intervalsfor an additional 10 min. These data provided correction forany drift in the sensors that arose from gradual loss of batterypower. Drift was typically less than 5%.
Measurements of Wind Speed and Wind Direction. Wind speedwas measured in two ways, depending upon available equip-ment. In the 1995 experiments, wind speeds were measuredwith a Dwyer handheld anemometer held into the wind. Wind
direction was measured by taking the compass heading of aribbon streamer tied to a pole or a branch of a nearby tree. Inthe 1996 experiments, wind speeds and wind directions at 2.5m above ground level were measured using a cup anemometerand wind vane (Davis Instruments, Hayward, Calif.). In the1997 experiments, wind speeds were measured at heights of0.5, 1.5, and 2.5 m using three cup anemometers and windvanes. In most experiments, wind speeds and directions weresampled synchronously with the sampling of combustible gasconcentrations.
Measurements of Pressures on the Mound Surface and within theMound. Pressures on the mound surface and within the surfaceconduits were measured using a multiplying microma-nometer after the design of Vogel (1981). The manometer fluidwas a soap solution mixed with a few drops of blue food col-oring. During measurements, the manometer rested on a bracedand leveled camp table set up next to the mound. The ma-nometer itself was also equipped with leveling screws. Pressureports were connected to a switching manifold that could directas many as four different pressure differences to the micro-manometer. In a typical configuration, the four pressure dif-ferences were port 1/port 2, port 1/ambient pressure, port 2/ambient pressure, and ambient pressure/ambient pressure. Thelast was used to zero the manometer. All pressures were dif-ferential pressure, not gauge pressure.

804 J. S. Turner
Figure 8. Pulse-chase experiment for mound 17 on August 1, 1996. Wind speeds averaged 3.5 m s�1, intermittently freshening with gusts upto 7.2 m s�1. Wind headings were steady out of the west-northwest (wind rosette) with a SD of 16� around the modal heading of 310�. Surfacesensors were placed at compass headings of 84� (“downwind”; black circles) and 264� (“upwind”; gray circles). Injection point was into anupwind surface conduit, indicated by the unfilled arrow. Top panel is wind speed in meters per second. Gray line represents wind speeds at30-s intervals. Black line represents the 5-min moving average of wind speed. Middle panel depicts compass cards indicating wind speed at 5-min intervals. Black and gray circles represent orientation of combustible gas sensors on the mound surface. Bottom panel graphs sensor outputof the designated sensors in millivolts.
Table 5: Densities of air at various localities within the mounds of Macrotermesmichaelseni
Nest Middle Chimney Upper Chimney
Po2 (kPa) 16.36 (.75) 16.34 (.60) 16.87 (.34)Pco2 (kPa)a 1.58 (.70) 1.60 (.61) 1.09 (.31)Ph2o (kPa) 3.40 (.43) 3.13 (.38) 2.86 (.63)Pn2 (kPa)a 64.99 (.38) 65.26 (.38) 65.51 (.60)MW (g mol�1)a 28.67 (.075) 28.70 (.078) 28.66 (.064)Tin (�C) 31.97 (2.82) 32.95 (2.11) 33.24 (2.22)Molar V (m3 mol�1)a .02939 (.0002) .02948 (.0002) .02951 (.0002)r (kg m�3)a .976 (.009) .974 (.008) .971 (.008)
Note. Data are reported as mean (SD). Nominal atmospheric pressure at Namatubis is 86.33 kPa.a Estimates.
Wind-induced surface pressures were measured at portsplaced about a centimeter off the mound surface at any of sixlocations: upwind (within �60� of the wind heading), lateralto the wind (between �60� and �120� of the wind heading),
and downwind (1�120� of the wind heading) at roughly 2.5and 0.5 m above ground level. Pressure ports were constructedfrom a center-drilled plastic rod tapped into a 1/4-inch plastichose barb. A thick-walled plastic tube connected the pressure

Gas Exchange in Macrotermes Mounds 805
Figure 9. Pulse-chase experiment for mound 9 on August 6, 1996. Wind speeds average 0.9 m s�1, freshening with occasional gusts up to 2.7m s�1. Wind headings were predominantly out of the east and highly variable, most commonly easterly, with a SD of wind direction of 58�with respect to modal wind direction of 80�. Surface sensors were placed at compass headings of 292� (“downwind”; gray circles) and 104�(“upwind”; black circles). Injection point was into an upwind surface conduit, indicated by the unfilled arrow. Conventions as in Figure 8.
port to the switching manifold that in turn connected to theports of the micromanometer.
Internal pressures were measured using the pressure portsdescribed above but with a shaft liner/shaft plug arrangementsimilar to that for the internal sensors. About 12 h before anexperiment, a 1-inch-diameter shaft was sunk into the mounduntil it reached a tunnel, and a shaft liner/shaft plug assemblywas placed. Injury to the mound was healed by the termites asdescribed above. To measure pressure, the plug was removedand replaced with a pressure port. One shaft liner was placedhigh up on the mound about a meter above another port placedlow on the mound.
Pressures were measured using a protocol that recorded windspeed, wind direction, and pressure every 30 s for a period of10 min. Each round of measurement included one with theswitching manifold in the atmosphere-atmosphere configura-tion to correct for drift in the manometer.
Estimating Air Densities
Air densities and buoyant forces within the nest and moundwere estimated from measurements of local Po2, Ph2o (bothin kPa), and air temperature (�C). Estimates of air densityinvolved first inferring the molar composition of the local at-mosphere and, from this, estimating the air’s average molecularweight (MWair). Density is calculated from MWair and molarvolume.
The atmospheric pressure (Pa), which at Namatubis is nom-inally 86.33 kPa, comprises the partial pressures of the gasesin the atmosphere:
P p Pn � Po � Pco � Ph o. (1)a 2 2 2 2
Both Po2 and Ph2o were measured. The Pco2 is estimated fromthe depletion of oxygen in the nest atmosphere, DPo p2

806 J. S. Turner
Table 6: Maximum average and maximum summedcombustible gas concentrations at surface conduits ofmounds of Macrotermes michaelseni
Position on MoundSurface Low High
Maximum average CG 1.9 (2.4) 4.6 (6.4)Wind heading relative to
maximum average CGa 109 (47) 124 (38)Maximum summed CG 13.2 (23.1) 31.2 (39.0)Wind heading relative to
maximum summedCGa 108 (44) 105 (49)
Note. Tabulated data grand averages of the maximum average CG and max-
imum summed CG for all mounds measured and SDs of the averages. CG is
in parts per million. Sensors at a “high” location are positioned at least 2 m
above ground level. Sensors at a “low” location are positioned no higher than
1 m above ground level.a In absolute degrees relative to sensor.
Figure 10. Schematic diagram for calculation of maximum average CG (a) and maximum summed CG (b) and wind directions relative tosensor position. Wind rosettes indicated average CG or summed CG with respect to wind direction. Radial axis represents the average CG orsummed CG for a particular sensor (gray circle) over a period of 60 min postinjection. Directional axis represents compass headings of winddirection. Average CG or summed CG is calculated for each 15� interval of wind direction and plotted on the wind rosette (gray-filled polygon).Maximum average CG and maximum summed CG are identified as indicated in this figure. Wind direction relative to sensor position is theshortest arc between the wind heading at which maximum average or maximum summed CG occurs and the compass heading of the sensor.
. Assuming a respiratory quotient of 0.8Po � Po2, atm 2, nest
(Peakin and Josens 1978), the elevation of Pco2 or DPco p2
. The Pco2 in the nest is therefore�0.8DPo2
Pco p Pco � 0.8DPo . (2)2, nest 2, nest 2
The atmospheric Pco2 at Namatubis was presumed to be 0.03kPa. The Pn2 is then estimated as
Pn p P � Po � Pco � Ph o. (3)2 a 2 2 2
From these pressures, the mole fractions (mf ) of each gas areestimated:
mf N p Pn /P , (4a)2 2 a
mfO p Po /P , (4b)2 2 a
mfCO p Pco /P , (4c)2 2 a
mf H O p Ph o/P . (4d)2 2 a
The average molecular weight of the air (MWair ; kg mol�1) isestimated from the mole fractions and molecular weights ofthe respective gases:
MW p mf N MWN � mfO MWOair 2 2 2 2
� mfCO MWCO � mf H O MWH O. (5)2 2 2 2
The molar volume of the gas, VM (m3), is estimated from theideal gas law:
RTV p , (6)M Pa

Gas Exchange in Macrotermes Mounds 807
Figure 11. Distributions of maximum average CG (a, b) and maximum summed CG (c, d) for 10 mounds measured in austral summer 1997.Top panels (a, c) plot numbers of sensors in each interval of relative wind direction at which maximum average or maximum summed CGoccurs. Bottom panels (b, d) plot the values of maximum average CG and maximum summed CG against relative wind direction for eachsensor.
where T is temperature in Kelvins, and R is the gas constant(8.314 J mol�1 K�1). Density (r; kg m�3) is simply the ratio ofthe air molecular weight and the molar volume:
MWairr p . (7)
VM
The tendency of a density difference to drive a flow is givenby the dimensionless Grashof number, Gr (Vogel 1981). For adensity difference between air in the nest and chimney, forexample, the Grashof number is
2r g(r � r )ch ch nestGr p , (8)2r mnest
where of air in the nest (kg m�3),r p density r pnest ch
of air in the chimney, accelerationdensity g p gravitational(9.8 m s�2), and air dynamic viscosity (1.85 kgm p the e � 5m�1 s�1). The density difference is presumed to be distributed
over a distance of 1 m. Grashof numbers are commonly quitelarge, with transitions between laminar and turbulent flowsoccurring at values of 105 to 106.
Results
Composition of the Nest Atmosphere
The nest atmosphere differed in composition and temperaturefrom the outside air and varied significantly with season (Table1). In summer, nest air was about 6�C warmer than in winter( , ). Nest air temperature was also dampedF p 6.18 P p 0.0171, 47
compared to external temperature, as indicated by the slope ofthe regression of nest air temperature versus outside air tem-perature (Table 2). Nest air temperature was significantly moredamped in summer than in winter ( , ), witht p 3.67 P ! 0.00147
a summer slope roughly 69% that in winter (Table 2).Absolute humidity of the nest atmosphere was always higher
than outside (Table 1). For both nest and outside air, absolutehumidities were higher in summer than in winter (Table 1).
808 J. S. Turner
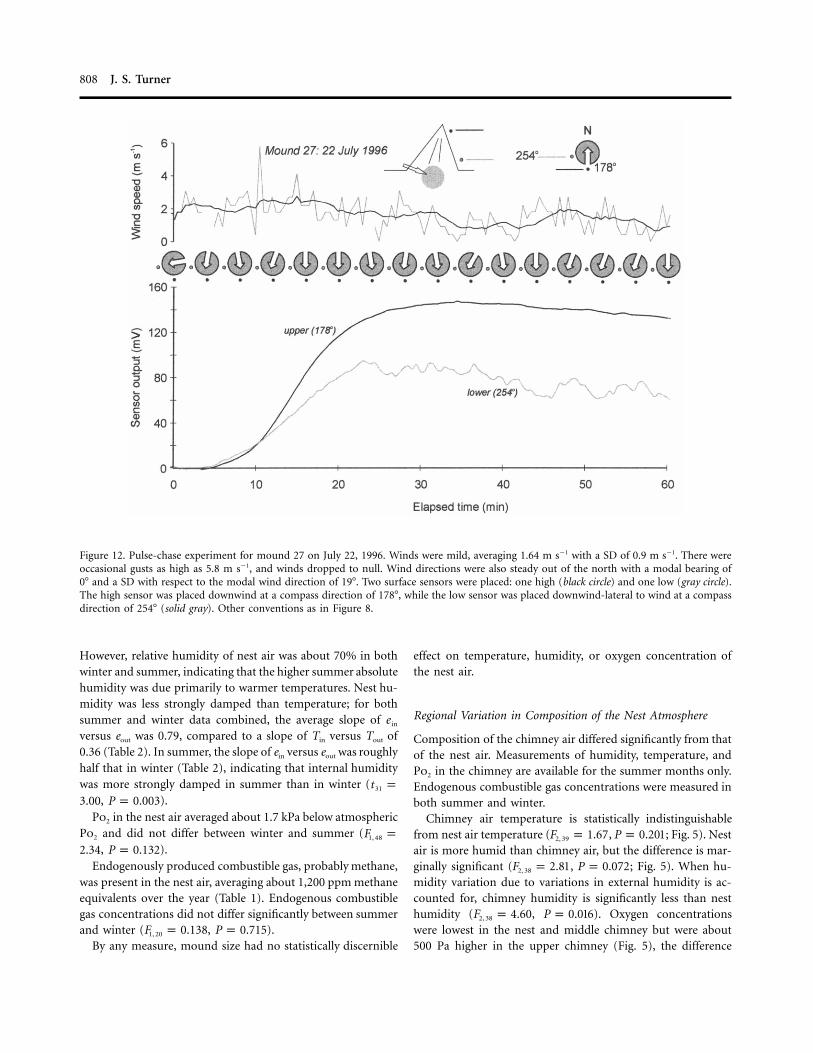
Figure 12. Pulse-chase experiment for mound 27 on July 22, 1996. Winds were mild, averaging 1.64 m s�1 with a SD of 0.9 m s�1. There wereoccasional gusts as high as 5.8 m s�1, and winds dropped to null. Wind directions were also steady out of the north with a modal bearing of0� and a SD with respect to the modal wind direction of 19�. Two surface sensors were placed: one high (black circle) and one low (gray circle).The high sensor was placed downwind at a compass direction of 178�, while the low sensor was placed downwind-lateral to wind at a compassdirection of 254� (solid gray). Other conventions as in Figure 8.
However, relative humidity of nest air was about 70% in bothwinter and summer, indicating that the higher summer absolutehumidity was due primarily to warmer temperatures. Nest hu-midity was less strongly damped than temperature; for bothsummer and winter data combined, the average slope of e in
versus eout was 0.79, compared to a slope of Tin versus Tout of0.36 (Table 2). In summer, the slope of ein versus eout was roughlyhalf that in winter (Table 2), indicating that internal humiditywas more strongly damped in summer than in winter (t p31
, ).3.00 P p 0.003Po2 in the nest air averaged about 1.7 kPa below atmospheric
Po2 and did not differ between winter and summer (F p1, 48
, ).2.34 P p 0.132Endogenously produced combustible gas, probably methane,
was present in the nest air, averaging about 1,200 ppm methaneequivalents over the year (Table 1). Endogenous combustiblegas concentrations did not differ significantly between summerand winter ( , ).F p 0.138 P p 0.7151, 20
By any measure, mound size had no statistically discernible
effect on temperature, humidity, or oxygen concentration ofthe nest air.
Regional Variation in Composition of the Nest Atmosphere
Composition of the chimney air differed significantly from thatof the nest air. Measurements of humidity, temperature, andPo2 in the chimney are available for the summer months only.Endogenous combustible gas concentrations were measured inboth summer and winter.
Chimney air temperature is statistically indistinguishablefrom nest air temperature ( , ; Fig. 5). NestF p 1.67 P p 0.2012, 39
air is more humid than chimney air, but the difference is mar-ginally significant ( , ; Fig. 5). When hu-F p 2.81 P p 0.0722, 38
midity variation due to variations in external humidity is ac-counted for, chimney humidity is significantly less than nesthumidity ( , ). Oxygen concentrationsF p 4.60 P p 0.0162, 38
were lowest in the nest and middle chimney but were about500 Pa higher in the upper chimney (Fig. 5), the difference

Gas Exchange in Macrotermes Mounds 809
Figure 13. Pulse-chase experiment for mound 7 on July 30, 1996. Winds were brisk and variable, averaging 2.4 m s�1 with a SD of 1.02 ms�1. Gusts were up to 5.4 m s�1, but wind speeds never dropped below 0.4 m s�1. Wind direction was variable out of the northwest with amodal heading of 300� and a SD of 25� with respect to modal. Two surface sensors were placed: one high (gray circles) and one low (blackcircles), both at a compass direction of 198�. Tracer was injected into the nest. Other conventions as in Figure 8.
being marginally significant ( , ). Finally,F p 2.71 P p 0.0792, 39
endogenous combustible gas differed significantly between nestand chimney ( , ), dropping from aboutF p 25.52 P ! 0.0011, 38
1,200 ppm methane equivalents in the nest to about 90 ppmmethane equivalents in the chimney (Fig. 5).
Clearance Rates for Tracer Gases from the Nest and Mound
Tracer in the nest cleared with an average time constant of 7.00min, ranging from 1.8 to 18.3 min, and did not differ signif-icantly between winter and summer ( , ;F p 2.68 P p 0.1121, 29
Table 3). Tracer cleared at different rates from different localitiesin the mound ( , ; Table 3). In the nestF p 3.13 P p 0.0562, 36
and in the upper parts of the chimney, the clearance timeconstant averaged about 8.5 min (Table 3). The chimney justabove the nest appeared to be relatively stagnant, with clearancetime constants averaging slightly over 13 min (Table 3). Moundsize had no statistically discernible influence on time constantsfor clearance from the nest.
Surface and Surface Conduit Pressures
Wind induces a complex distribution of pressure over themound’s surface (Fig. 6). Close to the ground, surface pressureswere significantly stronger than higher on the mound( , ), reflecting the boundary layer variationF p 38.2 P ! 0.0011, 948
of wind speeds ( , ; Table 4). Surface pres-F p 32.8 P ! 0.0012, 111
sure also varied significantly with position on the mound( , ). At upwind mound surfaces, pressuresF p 71.0 P ! 0.0012, 948
were positive (Fig. 6), while at downwind and lateral surfaces,pressures were negative, the strongest suction pressures beingat the mounds’ flanking surfaces (Fig. 6).
Pressure differences were evident along the surface conduitsand ranged from about �8 to �5 Pa from top to bottom ofthe mound (Fig. 7). Most commonly, surface conduit pressurewas higher at the top of the mound than the bottom, but intwo instances, the pressure difference was reversed. The pres-sure difference showed no significant relation with wind speed( , ; Fig. 8a), but the absolute pressure dif-F p 1.17 P p 0.3581, 3

810 J. S. Turner
Figure 14. Pulse-chase experiment for mound 27 on December 19, 1996. Winds were brisk and variable, averaging 2.29 m s�1 with a SD of1.17 m s�1. Wind was variable out of the southeast with an average bearing of 106�, ranging from 80� to 130�. Two surface sensors were placed:one upwind at a compass direction of 70� (gray circle) and one downwind at a compass direction of 300� (black circle). Tracer was injectedinto the middle chimney. Other conventions as in Figure 8.
ference (i.e., the pressure difference without regard to its di-rection) was significantly correlated with wind speed (F p1, 3
, ; Fig. 8b).10.59 P p 0.047
Estimated Air Densities in the Chimney and Nest
Estimated air densities throughout the mound averaged about0.974 kg m�3, and there were no statistically discernible dif-ferences between the nest and chimney ( ,F p 0.794 P p2, 37
; Table 5).0.460
Patterns of Air Movement in Nest and Mound
Air movements in the nest and mound were complex. In thefollowing results, commonly observed patterns of flow are pre-sented as a description of the pattern, followed by results that
support the assertion. Usually, these are representative resultsfrom a pulse-chase experiment on a particular mound.
The Surface Conduits Constitute at Least One Well-Mixed AirSpace That Is Stirred by Wind. If a bolus of tracer was injectedinto a surface conduit, the tracer typically migrated rapidly todownwind surface conduits, irrespective of whether tracer wasinjected into an upwind or downwind conduit.
Consider the results from mound 17 (Fig. 8). Despite beinginjected close to the upwind sensor, tracer did not appear therein appreciable amounts but concentrated strongly at the down-wind sensor within 2 min following the injection. Followingits initial appearance in the downwind surface conduits, tracerthen made intermittent appearances at the upwind sensor (atabout 16–18, 26–28, 36–40, and 48–50 min), which were cor-

Gas Exchange in Macrotermes Mounds 811
Figure 15. Pulse-chase experiment for mound 29 on January 6, 1997. Winds were light, averaging 1.5 m s�1 with a SD of 0.75 m s�1. Windwas variable out of the east with a mean heading of 90�, ranging from 30� to 220�. Three sensors were placed: two at the surface at compassdirections of 0� (gray circles) and 190� (black circles) and one in the chimney (open circle). Tracer was injected into a surface conduit near thesensor at 190�. Other conventions as in Figure 8.
related with shifts of wind direction that brought wind lateralto both sensors.
Compare the mound 17 results with those from mound 9(Fig. 9). During this experiment, winds were milder, with morevariable wind directions. A bolus of tracer was injected into aconduit below the initially upwind sensor (located at 104�),and tracer migrated quickly to the downwind surface conduit(located at 292�), as it did for mound 17 (Fig. 8). At about 32min postinjection, the wind shifted, bringing wind lateral toboth surface sensors. There was a clear and rapid migration oftracer from the sensor at 292� toward the sensor at 104�. Fol-lowing other shifts in wind direction, back to easterly at about40 min postinjection and again back to northerly at about 50min postinjection, tracer migrated rapidly to whichever sensorwas downwind or lateral to wind. Thus, variations of winddirection induce a “sloshing” movement of air back and forthin the conduits.
Exchange of Gas between the Nest and Mound Surface Is Strongly
Influenced by Wind Direction and by Boundary Layer Variationof Wind Speed. The mound experiences strong suction pressuresat the downwind and lateral-to-wind surfaces and significantpositive pressures at the upwind surface (Fig. 6). These pres-sures affect how gases are distributed in the surface conduits(Figs. 8, 9).
Ten mounds were outfitted with from six to 10 surface com-bustible gas sensors, positioned at several compass orientationson the mound, and at two vertical positions: “high” and “low”(2.5 and 0.5 m above ground level, respectively). A bolus of
tracer was injected into the nest or mound, and its appearance
at the surface sensors correlated with wind direction for 60 min
following injection. Tracer emissions were correlated with wind
direction as follows (Fig. 10). Each sensor’s position on the
mound was designated by its compass heading. Following the
injection of tracer, combustible gas concentration at each sensor
was measured every 30 s for 1 h. Wind directions were recorded
synchronously. Data for each sensor were summed, averaged,
812 J. S. Turner
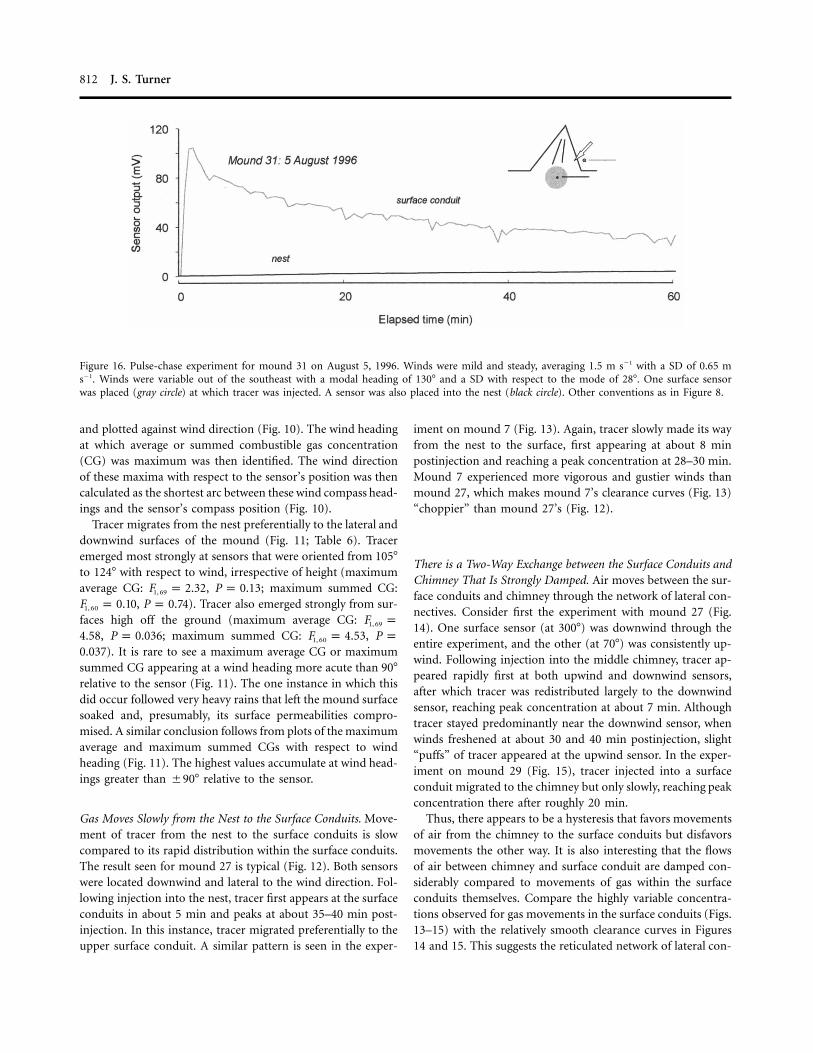
Figure 16. Pulse-chase experiment for mound 31 on August 5, 1996. Winds were mild and steady, averaging 1.5 m s�1 with a SD of 0.65 ms�1. Winds were variable out of the southeast with a modal heading of 130� and a SD with respect to the mode of 28�. One surface sensorwas placed (gray circle) at which tracer was injected. A sensor was also placed into the nest (black circle). Other conventions as in Figure 8.
and plotted against wind direction (Fig. 10). The wind headingat which average or summed combustible gas concentration(CG) was maximum was then identified. The wind directionof these maxima with respect to the sensor’s position was thencalculated as the shortest arc between these wind compass head-ings and the sensor’s compass position (Fig. 10).
Tracer migrates from the nest preferentially to the lateral anddownwind surfaces of the mound (Fig. 11; Table 6). Traceremerged most strongly at sensors that were oriented from 105�
to 124� with respect to wind, irrespective of height (maximumaverage CG: , ; maximum summed CG:F p 2.32 P p 0.131, 69
, ). Tracer also emerged strongly from sur-F p 0.10 P p 0.741, 60
faces high off the ground (maximum average CG: F p1, 69
, ; maximum summed CG: ,4.58 P p 0.036 F p 4.53 P p1, 60
). It is rare to see a maximum average CG or maximum0.037summed CG appearing at a wind heading more acute than 90�
relative to the sensor (Fig. 11). The one instance in which thisdid occur followed very heavy rains that left the mound surfacesoaked and, presumably, its surface permeabilities compro-mised. A similar conclusion follows from plots of the maximumaverage and maximum summed CGs with respect to windheading (Fig. 11). The highest values accumulate at wind head-ings greater than �90� relative to the sensor.
Gas Moves Slowly from the Nest to the Surface Conduits. Move-ment of tracer from the nest to the surface conduits is slowcompared to its rapid distribution within the surface conduits.The result seen for mound 27 is typical (Fig. 12). Both sensorswere located downwind and lateral to the wind direction. Fol-lowing injection into the nest, tracer first appears at the surfaceconduits in about 5 min and peaks at about 35–40 min post-injection. In this instance, tracer migrated preferentially to theupper surface conduit. A similar pattern is seen in the exper-
iment on mound 7 (Fig. 13). Again, tracer slowly made its wayfrom the nest to the surface, first appearing at about 8 minpostinjection and reaching a peak concentration at 28–30 min.Mound 7 experienced more vigorous and gustier winds thanmound 27, which makes mound 7’s clearance curves (Fig. 13)“choppier” than mound 27’s (Fig. 12).
There is a Two-Way Exchange between the Surface Conduits andChimney That Is Strongly Damped. Air moves between the sur-face conduits and chimney through the network of lateral con-nectives. Consider first the experiment with mound 27 (Fig.14). One surface sensor (at 300�) was downwind through theentire experiment, and the other (at 70�) was consistently up-wind. Following injection into the middle chimney, tracer ap-peared rapidly first at both upwind and downwind sensors,after which tracer was redistributed largely to the downwindsensor, reaching peak concentration at about 7 min. Althoughtracer stayed predominantly near the downwind sensor, whenwinds freshened at about 30 and 40 min postinjection, slight“puffs” of tracer appeared at the upwind sensor. In the exper-iment on mound 29 (Fig. 15), tracer injected into a surfaceconduit migrated to the chimney but only slowly, reaching peakconcentration there after roughly 20 min.
Thus, there appears to be a hysteresis that favors movementsof air from the chimney to the surface conduits but disfavorsmovements the other way. It is also interesting that the flowsof air between chimney and surface conduit are damped con-siderably compared to movements of gas within the surfaceconduits themselves. Compare the highly variable concentra-tions observed for gas movements in the surface conduits (Figs.13–15) with the relatively smooth clearance curves in Figures14 and 15. This suggests the reticulated network of lateral con-
Gas Exchange in Macrotermes Mounds 813
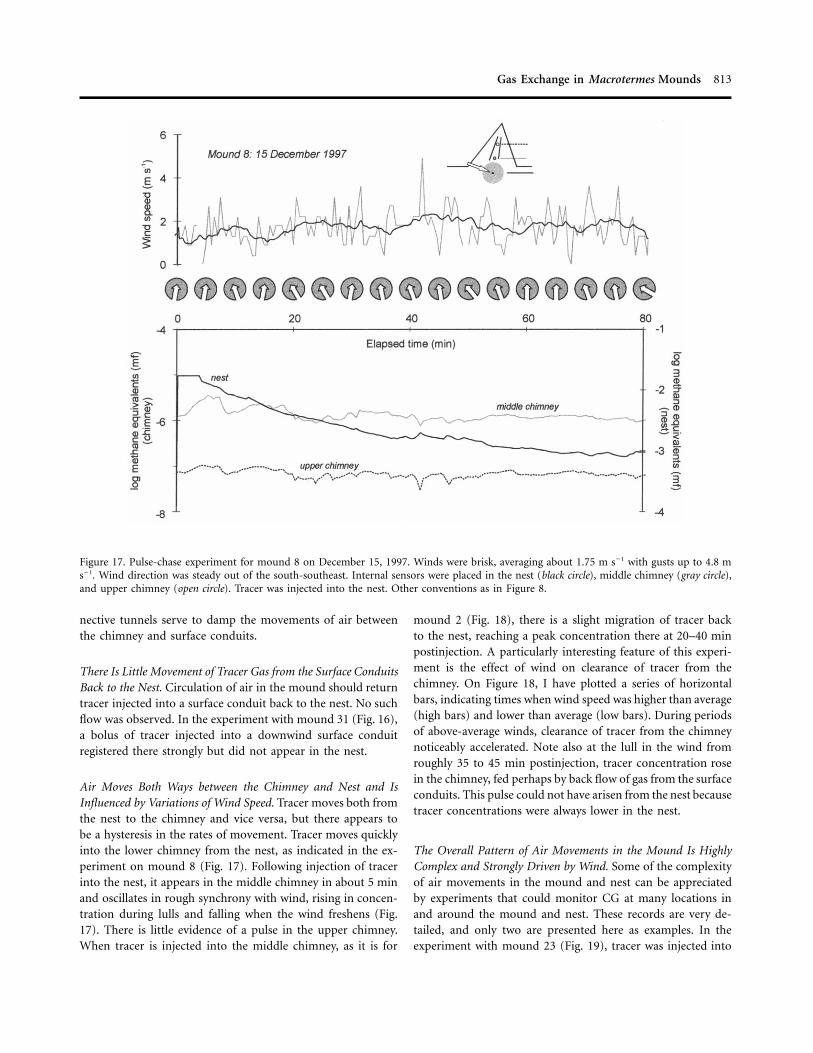
Figure 17. Pulse-chase experiment for mound 8 on December 15, 1997. Winds were brisk, averaging about 1.75 m s�1 with gusts up to 4.8 ms�1. Wind direction was steady out of the south-southeast. Internal sensors were placed in the nest (black circle), middle chimney (gray circle),and upper chimney (open circle). Tracer was injected into the nest. Other conventions as in Figure 8.
nective tunnels serve to damp the movements of air betweenthe chimney and surface conduits.
There Is Little Movement of Tracer Gas from the Surface ConduitsBack to the Nest. Circulation of air in the mound should returntracer injected into a surface conduit back to the nest. No suchflow was observed. In the experiment with mound 31 (Fig. 16),a bolus of tracer injected into a downwind surface conduitregistered there strongly but did not appear in the nest.
Air Moves Both Ways between the Chimney and Nest and IsInfluenced by Variations of Wind Speed. Tracer moves both fromthe nest to the chimney and vice versa, but there appears tobe a hysteresis in the rates of movement. Tracer moves quicklyinto the lower chimney from the nest, as indicated in the ex-periment on mound 8 (Fig. 17). Following injection of tracerinto the nest, it appears in the middle chimney in about 5 minand oscillates in rough synchrony with wind, rising in concen-tration during lulls and falling when the wind freshens (Fig.17). There is little evidence of a pulse in the upper chimney.When tracer is injected into the middle chimney, as it is for
mound 2 (Fig. 18), there is a slight migration of tracer backto the nest, reaching a peak concentration there at 20–40 minpostinjection. A particularly interesting feature of this experi-ment is the effect of wind on clearance of tracer from thechimney. On Figure 18, I have plotted a series of horizontalbars, indicating times when wind speed was higher than average(high bars) and lower than average (low bars). During periodsof above-average winds, clearance of tracer from the chimneynoticeably accelerated. Note also at the lull in the wind fromroughly 35 to 45 min postinjection, tracer concentration rosein the chimney, fed perhaps by back flow of gas from the surfaceconduits. This pulse could not have arisen from the nest becausetracer concentrations were always lower in the nest.
The Overall Pattern of Air Movements in the Mound Is HighlyComplex and Strongly Driven by Wind. Some of the complexityof air movements in the mound and nest can be appreciatedby experiments that could monitor CG at many locations inand around the mound and nest. These records are very de-tailed, and only two are presented here as examples. In theexperiment with mound 23 (Fig. 19), tracer was injected into

814 J. S. Turner
Figure 18. Pulse-chase experiment for mound 2 on August 8, 1997. In this experiment, winds were brisk and variable, averaging 2.1 m s�1
with a SD of 1.03 m s�1 and gusts up to 4.8 m s�1. Wind directions were variable out of the northeast. Internal sensors were placed in themiddle chimney (gray circle) and the nest (black circle). Tracer was injected into the middle chimney. Heavy solid lines along the top indicateperiods when winds were higher than the average (upper) or lower than the average (lower). Dashed lines laid over the trace for chimneycombustible gas concentration indicate the clearance rates during periods of higher-than-average or lower-than-average winds. Other conventionsas in Figure 8.
the nest, and its movements monitored with sensors in thechimney and at several surface locations. The second experi-ment, with mound 44 (Fig. 20), was similar except tracer wasinjected into the chimney rather than the nest.
Tracer injected into the nest appeared rapidly in the chimneyand then was distributed mostly to the upper surface conduits,reaching peak concentrations at about 18–25 min postinjection(Fig. 19). Tracer appeared to be distributed uniformly from thechimney to the upper surface conduits, seemingly without re-spect to wind direction; there was a strong pulse at the sensorat 109�, which was upwind through most of the experiment,and also at the sensors at 0� and 339�, both of which werecommonly downwind. Also noteworthy is the absence of tracerin some of the upper surface conduits, such as the sensor at256�. Only after about 40 min postinjection does tracer beginto appear at the lower surface conduits and, with one exception(the sensor at 109�), at low concentrations. Finally, the strongoscillations in tracer concentration in the chimney are stronglycorrelated with oscillations of wind speed, with lulls in the windcorresponding to increases of tracer in the chimney and with
freshening of the wind corresponding to a decline of tracer inthe chimney.
Tracer injected into the chimney (Fig. 20) shows a slow andslight migration of tracer back into the nest. Again, tracer in-jected into the chimney migrates preferentially to the uppersurface conduits, although a strong initial pulse is seen in oneof the lower surface conduits (the sensor at 197�). Wind di-rections during this experiment were highly variable, and the“sloshing” action is clearly evident at the sensors at 32�, 221�,and 248�.
Discussion
Three conclusions follow from the results reported here. First,thermosiphon ventilation does not operate in the mounds andnests of Macrotermes michaelseni. Rather, the colony’s gasexchange is driven by a complex interaction between architec-ture of the mound and nest, kinetic energy in wind, andmetabolism-induced natural convection within the nest. Sec-ond, ventilatory movements of air in the mound and nest are

Figure 19. Pulse-chase experiment for mound 23 on December 21, 1997. Sensors were placed at several localities indicated by the filled circleson the cartoons accompanying each trace. Tracer was injected into the nest. Other conventions as in Figure 8.
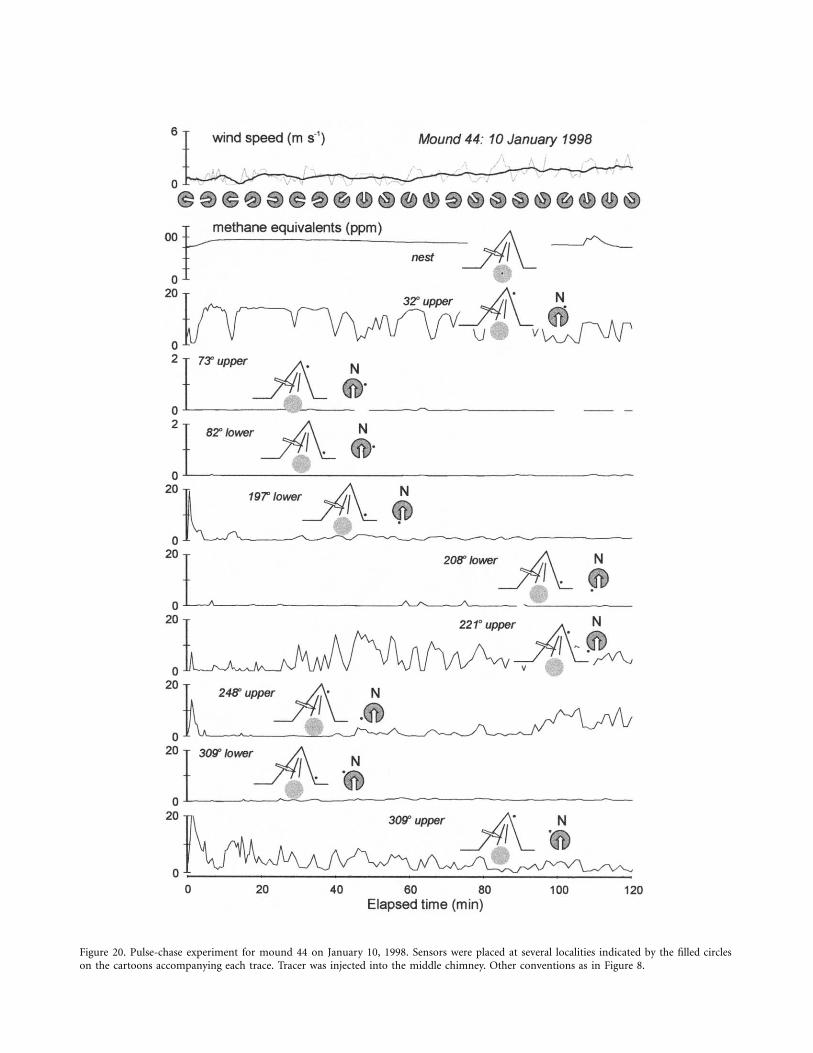
Figure 20. Pulse-chase experiment for mound 44 on January 10, 1998. Sensors were placed at several localities indicated by the filled circleson the cartoons accompanying each trace. Tracer was injected into the middle chimney. Other conventions as in Figure 8.

Gas Exchange in Macrotermes Mounds 817
Figure 22. Postulated zones of gas exchange in a Macrotermes mi-chaelseni mound and nest. Details in text.
Figure 21. Diagram representing balance of forces at point of equipoiseposited to exist in the middle chimney. Forces on a parcel of air,represented by the cube, include metabolism-induced buoyancy, rep-resented by an upward-pointing vector (black) and wind-induced pres-sure, represented by a vector (light gray) that can point either down-ward (a) or upward (b). The parcel moves under the influence of theresultant vector (dark gray), which may point either downward (a) orupward (b). As the magnitude and direction of the wind-inducedpressure vector fluctuates, air in the middle chimney moves up ordown in a tidal pattern.
tidal, not circulatory, and are driven by temporal variation inwind speed and direction. Third, metabolism-induced naturalconvection is not a significant force driving bulk flows in themound. It may, however, play a significant role in the mech-anisms that underlie homeostasis of the nest’s atmosphere.Taken together, these conclusions point to a substantially dif-ferent picture of ventilation and respiratory gas exchange inthe complex nests of macrotermitines than the thermosiphonmodel posited by Martin Luscher (1961) for Macrotermes na-talensis (bellicosus). This new perspective may illuminate im-portant questions on the mechanisms and evolution of socialphysiology, both in the termites and in other social insects.
Air flows under the influence of a balance of forces. Thethermosiphon model assumes that metabolism-induced buoy-ancy is the most significant force driving bulk flows of air inthe mound and nest. Implicit in this assumption is that air inthe mound is shielded from external sources of potential energythat could also drive flow, which include thermal energy insunlight (Korb and Linsenmair 2000) and kinetic energy inwind. The enclosed mounds built by M. michaelseni and M.natalensis would seem to provide such an effective shield. Nev-ertheless, wind strongly drives movements of air in the moundsof M. michaelseni.
Wind exerts its strongest effect on the mound’s network ofsurface conduits. Wind imposes a complex field of pressureover the mound’s surface (Figs. 9–11), and this is imparted toair in the surface conduits through their porous walls. Thesepressures drive substantial bulk movements of air within thesurface conduits. Tracer injected into a surface conduit, whetherthe point of injection be upwind or downwind, rapidly accu-mulates in downwind and flanking surface conduits, particu-larly high on the mound surface where suction pressures are

818 J. S. Turner
Figure 23. Estimation of probabilities of density gradients in the moundand nest. a, Estimate of probability that density of nest air (rnest) isless than density of chimney air, rch ( ). Cumulative proba-r 1 rch nest
bilities (P) of particular densities are estimated from the mean andvariance of estimated densities at each location. The probability thatboth nest air and chimney air have equal densities is the product ofP(rnest) and P( ). The probability that chimney air is denserr p rch nest
than nest air is the product of P(rnest) and P( ). b, Estimate ofr ! rch nest
probability that density of chimney air is at least some quantity Drgreater than nest air.
Figure 24. Estimates of the likelihood of density gradients in the moundand nest. Four scenarios are presented that describe buoyant forcesthat will loft air upward from the nest into the chimney. The firstscenario is that there will be any upwardly directed density difference( ). The second is that there will be a 10-g m�3 density dif-r 1 rch nest
ference ( kg m�3). The third is that there will be a 20-r 1 r � 0.01ch nest
g m�3 density difference ( kg m�3). The fourth is thatr 1 r � 0.02ch nest
there will be a 30-g m�3 density difference ( kg m�3).r 1 r � 0.03ch nest
Vertical dotted line represents the average density of air in the nest.Grashof numbers are estimated as described in text.
strongest (Figs. 8, 9, 12, 13). Air in the surface conduits is alsovigorously mixed when wind shifts direction, “sloshing” airfrom one side of the mound to another (Fig. 9). Thus, thesurface conduits form at least one well-mixed air space thatunderlies the entire mound surface.
The thermosiphon model predicts that air should circulatethrough the mound and nest in the following sequence: nestrchimney r surface conduits r nest. Movements of air mea-sured with tracers are only partly consistent with this pattern.Tracer injected into the nest appears in the chimney within
about 5 min (Fig. 17) and at the surface conduits only after20–30 min (Fig. 13). Similarly, tracer injected into the chimneyappears in the surface conduits within about 10 min (Fig. 14).However, tracer injected directly into a surface conduit doesnot return to the nest as would be expected in a thermosiphonflow (Fig. 16). These results are consistent with the alternativesequence: nest r chimney r lateral connectives r surface con-duits, with no return path to the nest.
The thermosiphon model treats the chimney as a conduitfor bulk transmission of spent nest air to the surface tunnels,where most of the exchanges of heat and respiratory gases occur.In contrast, the chimney of the M. michaelseni mound is animportant venue for respiratory gas exchange. If the chimneywere simply a conduit, humidity, Po2, and concentrations ofendogenous combustible gas would be similar in the nest andeverywhere within the chimney. They are not; Po2 and humiditydecline up the chimney, indicating exchange between nest airand fresh air along the chimney’s length (Fig. 5). Curiously,the decline in concentration of endogenous combustible gas,probably methane, is steeper than that for Po2, suggesting anadditional consumption of methane by methane-oxidizing bac-teria (Seiler et al. 1984; Khalil et al. 1990). Finally, if the chimneysimply conveyed spent nest air upward, there should be littleor no exchange from the chimney back to the nest. Although

Gas Exchange in Macrotermes Mounds 819
Figure 25. Posited scheme of social homeostasis in the colonies ofMacrotermes michaelseni. Details in text. After Turner (2000b).
movement of tracer from chimney to nest was slight, it didoccur, particularly under windy conditions (Figs. 18, 20). Whenit did, tracer injected into the chimney appeared in the nestand surface conduits simultaneously (Figs. 19, 20).
The exchange of gas between the chimney and surface con-duits is probably mediated by the network of lateral connectivesbetween them. Tracer injected into the chimney migrates di-rectly to the surface conduits and vice versa (Figs. 14, 15) butwith some interesting complications. First, there appears to bea hysteresis, with air moving more readily from the chimneyto the surface conduits than in the reverse (Figs. 14, 15). Second,air appears to be distributed uniformly from the chimney tothe surface conduits without respect to wind direction. Tracerinjected into the chimney commonly appears at both upwindand downwind surfaces simultaneously. Only then does winddistribute tracer to the downwind and flanking surface conduits(Figs. 14, 20). These biases in flow are likely mediated by aninteraction between metabolism-induced buoyant pressures inthe chimney and wind-induced pressures in the surface con-duits. The lateral connectives appear to form a damping net-work so that large fluctuations of pressure in the surface con-duits are damped close to the chimney. Airflows close to thechimney would therefore be dominated by metabolism-inducedbuoyant forces, which would bias air movements uniformlyoutward. Closer to the surface, wind-induced pressures wouldcome to predominate, distributing air according to their dis-tribution over the mound surface. In this scheme, the absenceof large surface vents, such as those found in other macroter-mitines like Macrotermes subhyalinus (Weir 1973) or Odonto-
termes transvaalensis (Turner 1994), matters little to the mech-anisms of ventilation; the interaction of the mound with windis governed by the damping network of tunnels deep in themound rather than by the details of the mound’s surface fea-tures. Indeed, it seems likely that a common mechanism op-erates to ventilate macrotermitine nests that vary widely inmound architecture. This is contrary to prevailing opinion,which asserts that thermosiphon circulation will be commonin enclosed nests (Luscher 1961), while unidirectional inducedflows will be common in nests with chimneys or large openvents on their mounds (Weir 1973; Darlington et al. 1997). Infact, the patterns of air movement in the nests of M. michaelseniare neither circulatory nor unidirectional but tidal. This is re-markably similar to the patterns of airflow seen in nests of O.transvaalensis, which build mounds with large open chimneys(Turner 1994).
Tidal ventilation in M. michaelseni nests relies on temporalvariation in the speed and direction of wind. A few commentson the nature of flow and wind will be helpful here. Any fluidflow can be represented by a velocity vector, which can in turnbe resolved from three mutually perpendicular component vec-tors. For laminar-steady flow, only one of the component vec-tors predominates, the one parallel to the pressure gradient thatdrives the flow. Turbulent flow, however, is marked by largevariations in all the component vectors. A mound exposed toturbulent winds will be subject not only to forces parallel tothe prevailing wind but also to substantial forces vertical toand perpendicular to the prevailing wind. Thus, as windsfreshen and become more turbulent, the pressure field aroundthe mound both strengthens and becomes more chaotic. Thiswill induce mixing of air in the surface conduits that varies aswinds alternately freshen and die.
Local weather conditions also play a role. When prevailingwinds are driven by persistent cells of high or low barometricpressure, both wind speed and wind direction are turbulent,with a large steady component of flow. Winds also arise fromlocal convective disturbances, particularly in tropical savannaswhere ground heating during the day is intense. Such windsare gusty, exhibiting substantial shifts of direction and speed,with substantial updraft or downdraft components (Rosenberg1974; Campbell 1977). On the Namatubis study site, such con-vective disturbances are common, particularly in summer.
Tidal ventilation in the mound results from an interactionbetween these complex temporal variations in wind and therelatively steady buoyant forces arising from colony metabo-lism. Metabolism-induced buoyancy provides a slight upwardbias to the movement of air into the chimney. There, spentnest air is mixed with relatively fresh air from the surface con-duits. As wind speed varies, so too will the vigor of the mixingand hence the rate of gas exchange. This is shown by the effectof gusty winds on clearance of tracer gas from the chimney(Fig. 18); when winds freshen, the clearance of tracer from thechimney speeds up, while during a lull, clearance is slower.

820 J. S. Turner
Mixing is further enhanced by the very strong influence ofwind on bulk flows in the surface conduits, most dramaticallythe “sloshing” movements of air induced by shifts of winddirection (Fig. 9). Such shifts are common with winds arisingfrom convective disturbances. Tidal ventilation results whenturbulent winds either enhance or oppose the upward biasarising from metabolism-induced buoyant forces (Fig. 21).Most commonly, winds will induce strong suction pressures atthe mound’s upper surfaces, and this will enhance the upwardmovement of air from the nest into the chimney. With changesof wind speed and wind direction, a tidal ventilation will resultsimilar to that seen when honeybees fan synchronously in placeat the entrance of an overheated hive (Southwick and Moritz1987; Turner 2000b). The overall effect is reminiscent of gasexchange in the lung but with wind rather than muscles pro-viding the motive power. As in the lung, gas exchange occursunder the influence of three regimes: a forced convection zone(that encompasses the surface conduits), a zone dominated bymetabolism-induced natural convection, and a mixing zoneencompassing the middle chimney (Fig. 22).
Tidal ventilation in the mound requires there to be in thechimney an equipoise between wind-induced pressures andmetabolism-induced buoyant forces. Several lines of evidencepoint to such an equipoise. First, metabolism-induced buoyantforces are likely to be weak; indeed, the distribution of averageair densities in the nest and mound do not favor buoyant forcesat all (Table 5). Consequently, buoyancy seems equally likelyto stratification of air in the chimney. Conditions that shouldfavor strong buoyant forces in the chimney are possible, butthey will be rare. Temperature is the largest component ofvariation in estimated air density. Temperatures that differmuch from the average may promote natural convection ormay promote stability. The likelihood for such conditions couldbe, in principle, derived from the mean and variance of tem-peratures throughout the mound and nest (Fig. 23). Althoughthere is a substantial probability that nest air will be lighter toany degree than air in the middle chimney (Korb and Linsen-mair 2000), the probability that the density difference will belarge enough to actually drive a bulk flow is considerably less.For example, the probability of a density difference of 0.01 kgm�3 is at best 6% (Fig. 24). The probability of larger densitydifferences is smaller still; for a minimum density difference of0.02 kg m�3, the probability is around 1% (Fig. 22). This cor-responds to a Grashof number of around 10,000, which issubstantially less than Grashof numbers that correspond tomost natural convection flows, which range from roughly 105
to 107. A similar analysis can be performed for temperaturevariations that promote stability, but the outcome is similar;rarely will such conditions occur.
Thus, buoyant pressures in the chimney most likely hoverat around a few pascals above or below prevailing pressure. Itis noteworthy that these pressures are similar in magnitude tothe wind-induced pressures observed in the surface conduits,
which averaged about an 8-Pa m�1 difference from top of themound to its bottom and ranged from 1 to 25 Pa m�1 (Fig.7). If these pressures were damped by the network of lateralconnectives between the chimney and surface conduits, wind-induced chimney pressures should hover at around aboutthe same level as the metabolism-induced buoyant forces:equipoise.
Clearance of tracer from different localities in the moundand nest is suggestive of such an equipoise (Table 3). Tracerclears rapidly from the upper parts of the chimney, probablydue to the vigorous action of winds high off the ground. Sim-ilarly, tracer clears rapidly from the nest into the chimney,driven there probably by metabolism-induced buoyancy. In themiddle chimney, however, the air is relatively stagnant, re-quiring roughly twice as long to clear as it does from the upperchimney and nest (Table 3). This stagnation could result froma balance between wind-induced pressures from above andmetabolism-induced pressures from below. Finally, there is aweak tidal movement of tracer between chimney and nest insynchrony with winds (Figs. 17–19), also suggestive of an equi-poise in the middle chimney.
These results shed new light on the phenomenon of socialhomeostasis in termite colonies. Homeostasis is a regulatoryprocess that matches a physiologically driven flux of matter orenergy against some physically driven flux of the same (Turner2000b). For example, a steady concentration of CO2 in the nestatmosphere of a termite nest results when the colony’s pro-duction rate of CO2 (a physiological flux) is matched to theflux rate of CO2 across the walls of the surface conduits (aphysical flux). In a M. michaelseni mound, homeostasis of thenest atmosphere could result from a simple adjustment ofmound height. Boundary layer wind speeds on-site varied sub-stantially with height (Table 4). Ventilation rate could thereforebe adjusted through adjustments in the height of the mound;taller mounds would capture more wind energy and be morevigorously ventilated than would shorter mounds. Social ho-meostasis would result from adaptive modification of moundheight so that the capture of wind energy was matched to therespiratory gas flux of the colony. The key to social homeostasisis in how the members of the colony assess whether the moundis at the “right” height.
The equipoise of pressures in the middle chimney couldprovide the termites with a gauge for indirectly assessing moundheight. An equipoise in the middle chimney is, by definition,the point at which wind energy for ventilation is equal to thecolony’s metabolism-induced buoyant forces. If these are outof balance, one of two states will occur. If the capture of windenergy is insufficient, metabolism-induced natural convectionwill dominate movements of air in the nest. The likely resultwould be an elevation of carbon dioxide concentration, hu-midity, methane, and volatile chemicals throughout the mound.However, if the mound is capturing more wind energy than isneeded to match colony respiratory flux, the opposite trends will
Gas Exchange in Macrotermes Mounds 821
ensue. Additionally, wind-driven bulk flows of air (“breezes”)will increase throughout the mound and may even extend intothe nest itself. Termites are exquisitely sensitive to changes oflocal Pco2, Po2, humidity, and slight breezes (Nicolas and Sillans1989) and will respond by altering the local structure (Stuart1972), opening holes in the mound surface if things get toostuffy, and plugging holes in response to local breezes, low Pco2,and other stimuli (Fig. 25).
Therefore, social homeostasis in a M. michaelseni colony is,at root, a problem of mound morphogenesis. If mechanismsof mound morphogenesis can be tied to functional stimuli thatinitiate these mechanisms, homeostasis should emerge more orless spontaneously from the assemblage. For example, Turner(2000a) has proposed a simple model for morphogenesis ofM. michaelseni mounds in which most of the mound’s archi-tectural features are explainable by subtle biases in the trans-location of soil by worker termites. The hypothetical biases arisefrom workers acting as conveyors of soil along gradients ofPco2, with intensity of soil translocation correlated to the steep-ness of the gradient. Thus, mound remodeling should be mostintense in those areas where gradients in Pco2 are the steepest.Homeostasis results because the resultant remodeling alsochanges the gradients in Pco2 that initiate remodeling in thefirst place. Thus, mound architecture is part of a feedback loopin which architecture is both cause and effect of the Pco2 gra-dients within the mound. Homeostasis will evolve through nat-ural selection acting on the coupling functions that link dis-tribution of Pco2 with soil translocation. This model, whichregards mound architecture as a process rather than as a su-perorganismal analogue of phenotype, is a new way of lookingat the evolution of social homeostasis in the complex nests ofthe advanced termites.
Acknowledgments
This research was supported by a grant from the EarthwatchInstitute. I am grateful to Margaret Voss and Robbin Turnerfor their invaluable help as field assistants on this project. Dr.Eugene Marais was very helpful in pointing me to sites whereMacrotermes colonies were abundant. I am also grateful to Fred-die Pretorius, who kindly allowed us to work on his farm,Namatubis, near Outjo, and to Jaco and Riette Liebenburg,who provided us with comfortable accommodations and warmhospitality through the 3 yr of this project. This work couldnot have been done without the generous contributions of time,effort, and money on the part of 69 Earthcorps volunteers whohelped on this project: Arthur Anderson, Barbara Anderson,Penny Austin, Dorothy Bailey, Margaret Baisley, Kay Bandell,Callan Bentley, Ronald Bentley, Mari Blanchard, Valeris Brissett,Mary Coroneos, William Coyle, Margaret Dales, Rita Dent,Greg Fendrich, Sue Fielden, Cheryl Foster, Clare Freeman, GaryFreeman, Marilyn Gardner, David Green, Eileen Groth, Robert
Habedanck, Mirjam Hamunghete, Liv Hansen, Margaret Hil-lenbrand, Yoshiki Hosojima, Paul Husted, Toshiaki Ichimura,Rupert Ingram, Olaf Jansen, Michael Johnson, Eriko Kanayo,Sam Kaufmann, Matthew Law, Nancy Law, Mark Lewis, PhilLoveday, Noelle Lusane, Shaw Lynds, Oliver Manaka, PeterMcCartney, Mari McIntosh, Sue McNeill, Darla Meier, Chris-tine Mergenthaler, Cheryl Mikuly, Patrine Mwetulundila, Mi-chael Novikoff, Thomas O’Donnell, David Pennack, Gilda Per-ess, Frank Perkins, Laurie Salisbury, Dorothee Saltmarsh,Josiane Schutz, James Sentman, Elaine Stambaugh, John Swan-wick, Kit Swanwick, Juan Carlos Vicente, Stan Walerczyk,Steven Wolf, and Lynda Zartarian. The work was carried outunder a permit from the Namibia Ministry of Environmentand Tourism, Republic of Namibia.
Literature Cited
Abe T. and J.P.E.C. Darlington. 1985. Distribution and abun-dance of a mound-building termite, Macrotermes michael-seni, with special reference to its subterranean colonies andant predators. Physiol Ecol Jpn 22:59–74.
Batra L.R. and S.W.T. Batra. 1979. Termite-fungus mutualism.Pp. 117–163 in L.R. Batra, ed. Insect-Fungus Symbiosis: Nu-trition, Mutualism and Commensalism. Wiley, New York.
Campbell G.S. 1977. An Introduction to Environmental Bio-physics. Springer, New York.
Coaton W.G.H. and J.L. Sheasby. 1972. Preliminary report ona survey of the termites (Isoptera) of south West Africa.Cimbebasia Mem 2:1–129.
Collins N.M. 1979. The nests of Macrotermes bellicosus (Smeath-man) from Mokwa, Nigeria. Insectes Soc 26:240–246.
Darlington J.P.E.C. 1984. Two types of mounds built by thetermite Macrotermes subhyalinus in Kenya. Insect Sci Appl5:481–492.
———. 1985. The structure of mature mounds of the termiteMacrotermes michaelseni in Kenya. Insect Sci Appl 6:149–156.
Darlington J.P.E.C., P.R. Zimmerman, J. Greenberg, C. West-berg, and P. Bakwin. 1997. Production of metabolic gases bynests of the termite Macrotermes jeaneli in Kenya. J Trop Ecol13:491–510.
Garnier-Sillam E., F. Toutain, and J. Renoux. 1988. Compa-raison de l’influence de deux termitieres (humivore et cham-pignonniste) sur las stabilite structurale des sols forestierstropicaux. Pedobiologia 32:89–97.
Grasse P.P. and C. Noirot. 1961. Nouvelles recherches sur lasystematique et l’ethologie des termites champignonnistes dugenre Bellicositermes Emerson. Insectes Soc 8:311–359.
Harris W.V. 1956. Termite mound building. Insectes Soc 3:261–268.
Kalshoven L.G.E. 1956. Observations on the inner structure ofMacrotermes gilvus mounds in Java. Insectes Soc 3:269–272.
Khalil M.A.K., R.A. Rasmussen, J.R.J. French, and J.A. Holt.1990. The influence of termites on atmospheric trace gases.

822 J. S. Turner
CH4, CO2, CHCl3, N2O, CO, H2, and light hydrocarbons. JGeophys Res 95D4:3619–3634.
Korb J. and K.E. Linsenmair. 2000. Ventilation of termitemounds: new results require a new model. Behav Ecol 11:486–494.
Loos R. 1964. A sensitive anemometer and its use for the mea-surement of air currents in the nests of Macrotermes natal-ensis (Haviland). Pp. 364–372 in A. Bouillon, ed. Etudes surles termites africains. Maisson et Cie, Paris.
Luscher M. 1956. Die Lufterneuerung im nest der termite Ma-crotermes natalensis (Haviland). Insectes Soc 3:273–276.
———. 1961. Air conditioned termite nests. Sci Am 238:138–145.
Nicolas G. and D. Sillans. 1989. Immediate and latent effectsof carbon dioxide on insects. Annu Rev Entomol 34:97–116.
Peakin G.J. and G. Josens. 1978. Respiration and energy flow.Pp. 111–163 in M.V. Brian, ed. Production Ecology of Antsand Termites. Cambridge University Press, Cambridge.
Pomeroy D.E. 1977. The distribution and abundance of largetermite mounds in Uganda. J Appl Ecol 14:465–475.
Rosenberg N.J. 1974. Microclimate: The Biological Environ-ment. Wiley, New York.
Rouland C., F. Lenoir, and M. LePage. 1991. The role of sym-biotic fungus in the digestive metabolism of several speciesof fungus-growing termites. Comp Biochem Physiol 99A:657–663.
Ruelle J., W. Coaton, and J. Sheasby. 1975. National survey ofthe Isoptera of southern Africa eight: the genus MacrotermesHolmgren (Termitidae: Macrotermitinae). Cimbebasia 3A:73–94.
Ruelle J.E. 1964. L’architecture du nid de Macrotermes natalensiset son sens fonctionnel. Pp. 327–362 in A. Bouillon, ed.Etudes sur les termites africains. Maisson et Cie, Paris.
———. 1970. A revision of the termites of the genus Macro-termes from the Ethiopian region (Isoptera: Termitidae). BullBr Mus (Nat Hist) Entomol 24:366–444.
———. 1975. Macrotermes michaelseni (Sjostedt): a new namefor Macrotermes mossambicus (Hagen) (Isoptera: Termiti-dae). J Entomol Soc South Afr 40:119.
———. 1985. Order Isoptera (termites). Pp. 53–61 in C.H.Scholtz and E. Holm, eds. Insects of Southern Africa. But-terworth, Durban.
Seiler W., R. Conrad, and D. Scharffe. 1984. Field studies ofmethane emissions from termite nests into the atmosphereand measurement of methane uptake by tropical soils. J At-mos Chem 1:171–186.
Southwick E.E. and R.F.A. Moritz. 1987. Social control of ven-tilation in colonies of honey bees, Apis mellifera. J InsectPhysiol 33:623–626.
Stuart A.M. 1972. Behavioral regulatory mechanisms in thesocial homeostasis of termites (Isoptera). Am Zool 12:589–594.
Tracy C., W. Welch, and W. Porter, eds. 1980. Properties ofAir: A Manual for Use in Biophysical Ecology. 3d ed. Uni-versity of Wisconsin Press, Madison.
Turner J.S. 1994. Ventilation and thermal constancy of a colonyof a southern African termite (Odontotermes transvaalensis:Macrotermitinae). J Arid Environ 28:231–248.
———. 2000a. Architecture and morphogenesis in the moundof Macrotermes michaelseni (Sjostedt) (Isoptera: Termitidae,Macrotermitinae) in northern Namibia. Cimbebasia 16:143–175.
———. 2000b. The Extended Organism: The Physiology ofAnimal-Built Structures. Harvard University Press, Cam-bridge, Mass.
Vogel S. 1981. Life in Moving Fluids. Willard Grant, Boston.Weir J.S. 1973. Air flow, evaporation and mineral accumulation
in mounds of Macrotermes subhyalinus. J Anim Ecol 42:509–520.
Wilson E.O. 1971. The Insect Societies. Harvard UniversityPress, Cambridge, Mass.