Embed Size (px)
Citation preview
NBER WORKING PAPER SERIES
ON THE ORIGINS OF GENDER ROLES:WOMEN AND THE PLOUGH
Alberto F. AlesinaPaola GiulianoNathan Nunn
Working Paper 17098http://www.nber.org/papers/w17098
NATIONAL BUREAU OF ECONOMIC RESEARCH1050 Massachusetts Avenue
Cambridge, MA 02138May 2011
We thank Samuel Bowles, David Clingingsmith, Esther Duflo, Raquel Fernandez, Nicole Fortin, OdedGalor, Pauline Grosjean, Judith Hellerstein, Edward Miguel, Rohini Pande, Louis Putterman, JohnWallis, as well as seminar participants at the Bank of Italy, Brown University, Harvard University,Hong Kong University of Science and Technology, MIT, New York University, Sciences Po, UCLAKaler Meeting, University of Oklahoma, Washington University St. Louis, World Bank, WAEHS,Stanford’s SITE Conference, Coevolution of Behaviors and Institutions Conference, AEA AnnualMeetings, Brooking Africa Growth Forum, NBER Political Economy Meeting, NBER Cohort StudiesMeeting, and the IZA/Science Po Workshop on Trust, Civic Spirit and Economic Performance forvaluable comments. We also thank Eva Ng for excellent research assistance. Giuliano gratefully acknowledgessupport from the UCLA Senate. The views expressed herein are those of the authors and do not necessarilyreflect the views of the National Bureau of Economic Research.
NBER working papers are circulated for discussion and comment purposes. They have not been peer-reviewed or been subject to the review by the NBER Board of Directors that accompanies officialNBER publications.
© 2011 by Alberto F. Alesina, Paola Giuliano, and Nathan Nunn. All rights reserved. Short sectionsof text, not to exceed two paragraphs, may be quoted without explicit permission provided that fullcredit, including © notice, is given to the source.
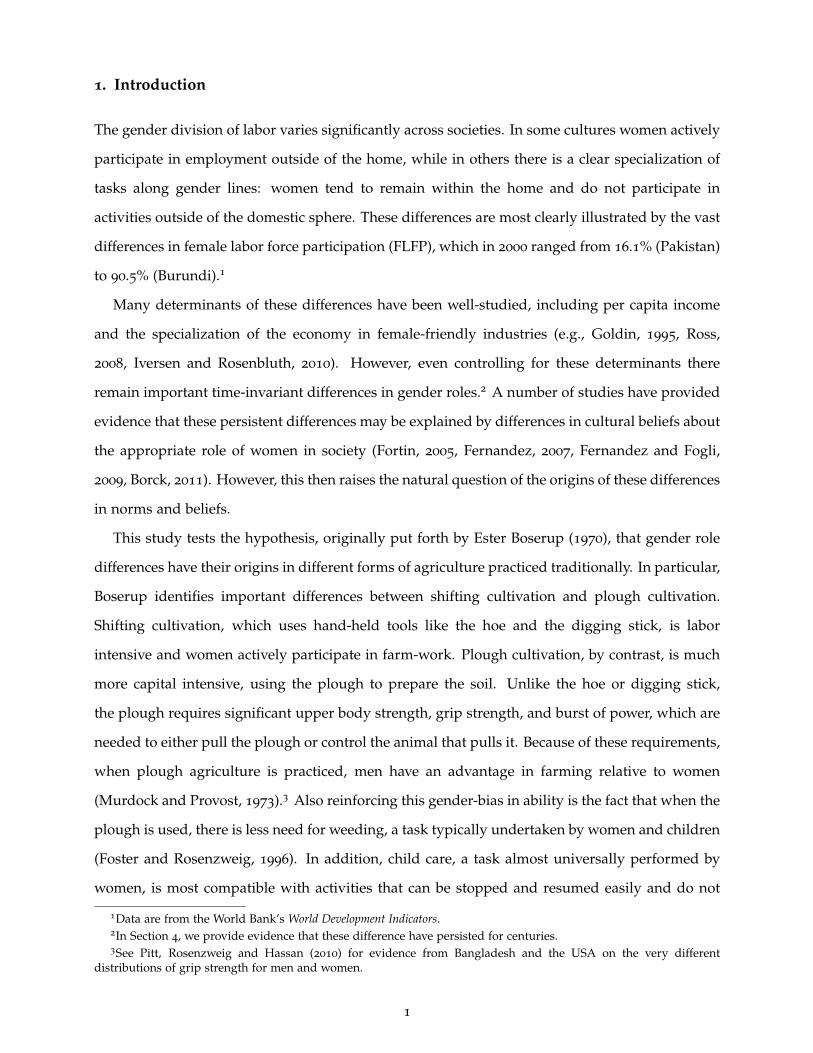
On the Origins of Gender Roles: Women and the PloughAlberto F. Alesina, Paola Giuliano, and Nathan NunnNBER Working Paper No. 17098May 2011JEL No. D03,J16,N30
ABSTRACT
This paper seeks to better understand the historical origins of current differences in norms and beliefsabout the appropriate role of women in society. We test the hypothesis that traditional agriculturalpractices influenced the historical gender division of labor and the evolution and persistence of gendernorms. We find that, consistent with existing hypotheses, the descendants of societies that traditionallypracticed plough agriculture, today have lower rates of female participation in the workplace, in politics,and in entrepreneurial activities, as well as a greater prevalence of attitudes favoring gender inequality.We identify the causal impact of traditional plough use by exploiting variation in the historical geo-climaticsuitability of the environment for growing crops that differentially benefited from the adoption of theplough. Our IV estimates, based on this variation, support the findings from OLS. To isolate the importanceof cultural transmission as a mechanism, we examine female labor force participation of second-generationimmigrants living within the US.
Alberto F. AlesinaDepartment of EconomicsHarvard UniversityLittauer Center 210Cambridge, MA 02138and IGIERand also [email protected]
Paola GiulianoAnderson School of ManagementUCLA110 Westwood PlazaC517 Entrepreneurs HallLos Angeles, CA 90095-1481and IZAand also [email protected]
Nathan NunnDepartment of EconomicsHarvard University1805 Cambridge StCambridge, Ma 02138and [email protected]
1. Introduction
The gender division of labor varies significantly across societies. In some cultures women actively
participate in employment outside of the home, while in others there is a clear specialization of
tasks along gender lines: women tend to remain within the home and do not participate in
activities outside of the domestic sphere. These differences are most clearly illustrated by the vast
differences in female labor force participation (FLFP), which in 2000 ranged from 16.1% (Pakistan)
to 90.5% (Burundi).1
Many determinants of these differences have been well-studied, including per capita income
and the specialization of the economy in female-friendly industries (e.g., Goldin, 1995, Ross,
2008, Iversen and Rosenbluth, 2010). However, even controlling for these determinants there
remain important time-invariant differences in gender roles.2 A number of studies have provided
evidence that these persistent differences may be explained by differences in cultural beliefs about
the appropriate role of women in society (Fortin, 2005, Fernandez, 2007, Fernandez and Fogli,
2009, Borck, 2011). However, this then raises the natural question of the origins of these differences
in norms and beliefs.
This study tests the hypothesis, originally put forth by Ester Boserup (1970), that gender role
differences have their origins in different forms of agriculture practiced traditionally. In particular,
Boserup identifies important differences between shifting cultivation and plough cultivation.
Shifting cultivation, which uses hand-held tools like the hoe and the digging stick, is labor
intensive and women actively participate in farm-work. Plough cultivation, by contrast, is much
more capital intensive, using the plough to prepare the soil. Unlike the hoe or digging stick,
the plough requires significant upper body strength, grip strength, and burst of power, which are
needed to either pull the plough or control the animal that pulls it. Because of these requirements,
when plough agriculture is practiced, men have an advantage in farming relative to women
(Murdock and Provost, 1973).3 Also reinforcing this gender-bias in ability is the fact that when the
plough is used, there is less need for weeding, a task typically undertaken by women and children
(Foster and Rosenzweig, 1996). In addition, child care, a task almost universally performed by
women, is most compatible with activities that can be stopped and resumed easily and do not
1Data are from the World Bank’s World Development Indicators.2In Section 4, we provide evidence that these difference have persisted for centuries.3See Pitt, Rosenzweig and Hassan (2010) for evidence from Bangladesh and the USA on the very different
distributions of grip strength for men and women.
1
put children in danger. These are characteristics that are satisfied for hoe agriculture, but not for
plough agriculture, particularly since large animals are typically used to pull the plough.
The result, according to Boserup, is that societies that traditionally practiced plough agriculture
– rather than shifting cultivation – developed a specialization of production along gender lines.
Men tended to work outside of the home in the fields, while women specialized in activities
within the home.4 This division of labor then generated norms about the appropriate role of
women in society. Societies characterized by plough agriculture, and a resulting gender-based
division of labor, developed the belief that the natural place for women is within the home.
These cultural beliefs tend to persist even if the economy moves out of agriculture, affecting the
participation of women on activities performed outside of the home, such as market employment,
entrepreneurship, or participation in politics.5
To test Boserup’s hypothesis, we combine pre-industrial ethnographic data, reporting whether
societies traditionally used plough agriculture, with contemporary measures of individuals’
views about gender roles, as well as measures of female participation in activities outside of
the home. Our analysis examines variation across countries, ethnic groups, and individuals.
Consistent with Boserup’s hypothesis, we find a strong and robust negative relationship between
historical plough-use and unequal gender roles today. Traditional plough-use is positively corre-
lated with attitudes reflecting gender inequality and negatively correlated with female labor force
participation, female firm ownership, and female participation in politics.
Although these findings support Boserup’s hypothesis, they are also consistent with other
interpretations. For example, we would observe the same relationships if societies with attitudes
favoring gender inequality were more likely to adopt the plough historically and if these attitudes
continue to persist today. To better understand whether past plough use did have a causal impact
on subsequent cultural norms, we instrument historical plough-use using specific geo-climatic
4Prior to Boserup, anthropologists and ethnographers had recognized a relationship between traditional genderroles and the use of the hoe (e.g., Baumann, 1928). However, we focus our discussion here on Boserup’s analysis sinceshe was the first to argue for the importance of agricultural technology on the subsequent evolution of norms andvalues, and their importance for the development process.
5Boserup (1970), in her analysis, most strongly argues for a relationship between traditional plough use and gendernorms when she hypothesizes that the use of the veil may be associated with the use of the plough in agriculture.She writes that plough cultivation “shows a predominantly male labor force. The land is prepared for sowingby men using draught animals, and this. . . leaves little need for weeding the crop, which is usually the women’stask. . . Because village women work less in agriculture, a considerable fraction of them are completely freed fromfarm work. Sometimes such women perform purely domestic duties, living in seclusion within their own homes onlyappearing in the street wearing a veil, a phenomenon associated with plough culture and seemingly unknown inregions of shifting cultivation where women do most of the agricultural toil.” (pp. 13–14)
2
conditions of a society’s historical location which affected the relative benefits of adopting the
plough. As Pryor (1985) shows, the benefit of the plough depends on the crop being cultivated.
The plough is more beneficial for crops that require large tracts of land to be prepared in a
short period of time (e.g., due to multiple-cropping), and can only be grown in soils that are
not shallow, sloped, or rocky.6 These crops, which Pryor refers to as ‘plough-positive’, include
teff, wheat, barley, rye and wet rice. These can be contrasted to ‘plough-negative’ crops, such as
maize, sorghum, millet and various types of root and tree crops, which require less land to be
prepared over a longer period of time, and/or can be cultivated on thin, sloped or rocky soils,
where using the plough is difficult. Unlike plough-positive crops, plough-negative crops benefit
much less from the adoption of the plough.
Using data from the FAO, we identify the geo-climatic suitability of finely defined locations for
growing plough-positive cereals (wheat, barley and rye) and plough-negative cereals (sorghum
and millet). We then use the relative differences in ethnic groups’ geo-climatic conditions for
growing plough-positive and plough-negative cereals as instruments for historical plough use.
We find that the IV estimates provide results consistent with the OLS estimates. Traditional
plough use is associated with attitudes of gender inequality, as well as less female labor force
participation, female firm-ownership, and female participation in politics.
Our analysis then considers potential underlying mechanisms. It is possible that the long-term
effect of the plough reflects persistent cultural beliefs. However, it is also possible that part of the
long-term impact arises because historical plough-use promoted the development of institutions,
policies and markets that are less conducive to the participation of women in activities outside of
the home.7 To distinguish these two channels we exploit the fact that cultural norms and beliefs
– unlike institutions, policies and markets – are internal to the individual. Therefore, when indi-
viduals move, their beliefs and values move with them, but their external environment remains
behind. Exploiting this fact, we examine variation in cultural heritage among second-generation
immigrants living in the US. All individuals born and raised in the US have been exposed to
the same institutions and markets. In effect, the analysis holds external factors constant, while
6For a recent study documenting the link between soil type and plough-use in modern India see Carranza (2010).In particular, she shows that in contemporary India plough technology is more likely to be adopted with deep loamysoils rather than shallow clay soils. She also shows that plough use is associated with less participation of women inagriculture.
7See the recent studies by Alesina, Algan, Cahuc and Giuliano (2010), Guiso, Sapienza and Zingales (2008b) andTabellini (2008) that investigate feedback effects between culture and institutions.
3
examining variation in individuals’ internal beliefs and values. We find that women from cultures
that historically used the plough have lower rates of labor force participation in the US. This
provides evidence that part of the importance of the plough arises through its impact on internal
beliefs and values.
Our focus on a historical determinant of gender roles is not meant to imply that other factors,
particularly factors that can change significantly over time, are unimportant. A number of
existing studies have examined other important determinants, including economic development,
medical progress, and the production structure of the economy (e.g., Iversen and Rosenbluth,
2010, Goldin, 2006, Ross, 2008, and Albanesi and Olivetti, 2007, 2009). As we show in section
4, even accounting for these important factors, there remains a strong persistent impact of the
plough on gender norms today.
Our analysis complements a number of descriptive studies from history, anthropology and
sociology that also examine the long-term impacts of traditional plough use on gender norms
(Goody, 1976, Whyte, 1978 and Braudel, 1998). A particularly interesting example is Fernand
Braudel’s (1998) description of how gender relations, culture, and society were impacted by the
adoption of the plough in Mesopotamia between 4,000 and 6,000 BC. He writes: “Until now,
women had been in charge of the fields and gardens where cereals were grown: everything
had depended on their tilling the soil and tending the crop. Men had been first hunters, then
herdsmen. But now men took over the plough, which they alone were allowed to use. At a
stroke, it might seem that the society would move from being matriarchal to patriarchal: that
there would be a shift away from the reign of the all-powerful mother goddesses. . . and towards
the male gods and priests who were predominant in Sumer and Babylon. . . and was accompanied
with a move towards male domination of society and its beliefs” (p. 71).
Our results also add to a recent line of research that has emphasized the relevance of cultural
norms and beliefs as important factors underlying the persistent differences in gender roles across
societies (Alesina and Giuliano, 2010, Fernandez, 2007, Fernandez and Fogli, 2009, and Fortin,
2005, 2009). Although the link between gender norms and female labor force participation is well-
established, little is known about the origin of these cultural differences. Our findings suggest that
an important determinant of these differences can be found in traditional farming practices. More
generally, our findings provide additional evidence showing that historical factors can shape the
evolution and persistence of norms and beliefs. Thus, they contribute to an emerging literature
4
that examines the historical determinants of various cultural characteristics today (e.g., Guiso,
Sapienza and Zingales, 2008a, Grosjean, 2010a,b, Becker, Boeckh, Hainz and Woessman, 2010,
Nunn and Wantchekon, 2011).
In the next section, we begin our analysis by first documenting that in societies that tradition-
ally used plough agriculture women did in fact participate less in farm-work and other activities
outside of the domestic sphere. In section 3, we then explain the procedure used to link the
historical use of the plough, which is measured at the ethnicity level, to contemporary data on
gender norms or female labor force participation, measured either at the country or individual
level. Sections 4 and 5 report OLS and IV estimates of the relationship between traditional plough
use and gender outcomes today, examining variation across individuals and countries. In section
6, we then turn to mechanisms, using second-generation US immigrants to test for persistent
impacts of the plough through cultural transmission. Section 7 offers concluding thoughts.
2. The historical impacts of traditional plough use
We begin our analysis by first confirming that societies that traditionally used plough agriculture
had lower female participation in agricultural activities. We also check whether plough use was
associated with differences in other activities within and outside of the domestic sphere.
Our analysis relies on information on pre-industrial plough use taken from the Ethnographic
Atlas, a world wide ethnicity-level database constructed by George Peter Murdock that contains
ethnographic information for 1,267 ethnic groups around the world. Information for societies
in the sample have been coded for the earliest period for which satisfactory ethnographic data
are available or can be reconstructed. The earliest observation dates are for groups in the Old
World where early written evidence is available. For the parts of the world without a written
history the information is from the earliest observers of these cultures. For some cultures the first
recorded information is from the early 20th century. However, even for these observations, the
data should capture, to the maximum extent possible, the characteristics of the ethnic group prior
to European contact. For all groups in the dataset, the variables are taken from the societies prior
to industrialization.
The database contains a measure of the historical use of plough agriculture. Groups are
classified into one of three mutually exclusive categories: (i) the plough was absent, (ii) the
plough existed at the time the group was observed but it was not aboriginal, and (iii) the plough
5
was aboriginal and found in the society prior to contact. There are data on plough use for 1,158
of the 1,267 societies in the database. There is no evidence of groups switching from one form of
agriculture to another and then back again. In other words, the use of the plough, once adopted,
remains stable over time. Using the categorization, we construct an indicator variable for plough
use which equals one if the plough was present (whether aboriginal or not) and zero otherwise.
It is possible that the plough has a larger impact on gender norms if it was adopted early.
However, because of data limitation, we are unable to test for this. From the database we only
know the rough date of adoption if it occurred after European contact. For other plough users
we do not have any information on the timing of adoption. Given this, our estimates should be
interpreted as the average effect of having adopted the plough among all ethnic groups that did
so prior to industrialization. There may be heterogeneity within the group of adopters (e.g. based
on date of adoption), but we are only able to estimate an average effect.
We measure traditional female participation in agriculture using information on the gender
division of labor in agriculture reported in the Ethnographic Atlas. Ethnicities are grouped into one
of the following five categories measuring gendered participation in agriculture: (1) males only,
(2) males appreciably more, (3) equal participation, (4) female appreciably more, and (5) females
only.8 Using this information, we construct a variable that takes on integer values ranging from 1
to 5 and is increasing in female specialization in agriculture.9
When examining the relationship between the gender division of labor in agriculture and
plough use, we are careful to control for a number of characteristics of ethnic groups which may
be correlated with plough use and gender roles. We control for the presence of large domesti-
cated animals, a measure of economic development, and a measure of political complexity. All
measures are from the Ethnographic Atlas.10 The presence of domesticated animals is measured
with an indicator variable that equals one if domesticated bovine or equine animals were present.
Economic development is measured using the density of ethnic groups’ settlements. Ethnicities
are grouped into the following categories: (1) nomadic or fully migratory, (2) semi-nomadic, (3)
semi-sedentary, (4) compact but not permanent settlements, neighborhoods of dispersed family
8The original classification in the Ethnographic Atlas distinguishes between “differentiated but equal participation”and “equal participation”. Since this distinction is not relevant for our purposes, we combine the two categories intoa single category of equal participation.
9For 232 ethnic groups agriculture was not practiced and therefore there is no measure of female participation inagriculture. For an additional 315 ethnic groups information for the variable is missing. These ethnic groups (547 intotal) are omitted from the analysis.
10Full details are provided in the paper’s appendix.
6
homesteads, (5) separate hamlets, (6) forming a single community, (7) compact and relatively
permanent settlements and (8) complex settlements. With this information, we construct a
variable that takes on integer values, ranging from 1 to 8, and is increasing in settlement density.
Political complexity is measured by the number of levels of jurisdictional hierarchies in the society.
We also control for two measures of the geographic conditions of ethnic groups. For each eth-
nicity we know the geographic coordinates of the centroid of the group. Using this information,
we calculate the fraction of land within a 200 kilometer radius of the centroid that is defined
as suitable for the cultivation of crops. The crop suitability data are from the FAO’s Global
Agro-Ecological Zones (GAEZ) 2002 database (Fischer, van Nelthuizen, Shah and Nachtergaele,
2002), which reports suitability measures for 5 arc minute by 5 arc minute (approximately 56 km
by 56 km) grid-cells globally. The suitability of the environment for agriculture is potentially
correlated with the use of the plough and may independently affect the gender division of labor.
We also use the same procedure to control for the proportion of land within the 200 kilometer
radius that is defined as being tropical or subtropical.
OLS estimates examining the impact of the historical plough use on past female participation
in agriculture are reported in column 1 of Table 1. The specification includes the five controls
variables. The estimates identify a negative relationship between plough use and participation
of women in agriculture. The use of the plough is associated with a reduction in the female
participation in agriculture variable of 0.86, which is large given that the standard deviation of
the variable is 1.0.
A natural question that arises is the exact nature of this decline in female participation in
agriculture; specifically, whether the decline is in all agricultural tasks or is it focused on only
a few. Unfortunately, the Ethnographic Atlas does not provide similar information for specific
tasks within agriculture. We therefore complement our analysis by using Murdock and White’s
(1969) Standard Cross-Cultural Sample (SCCS) which does contain this information. The SCCS
contains ethnographic information on 186 societies, intentionally chosen to be representative of
the full sample and for each ethnicity to be historically and culturally independent from the
other ethnic groups in the sample. The database was constructed by first grouping the 1267
societies from the Ethnographic Atlas into 186 clusters of closely related cultures. A particularly
well-documented and representative ethnic group was then chosen for each cluster and these
constitute the observations in the SCCS.
7
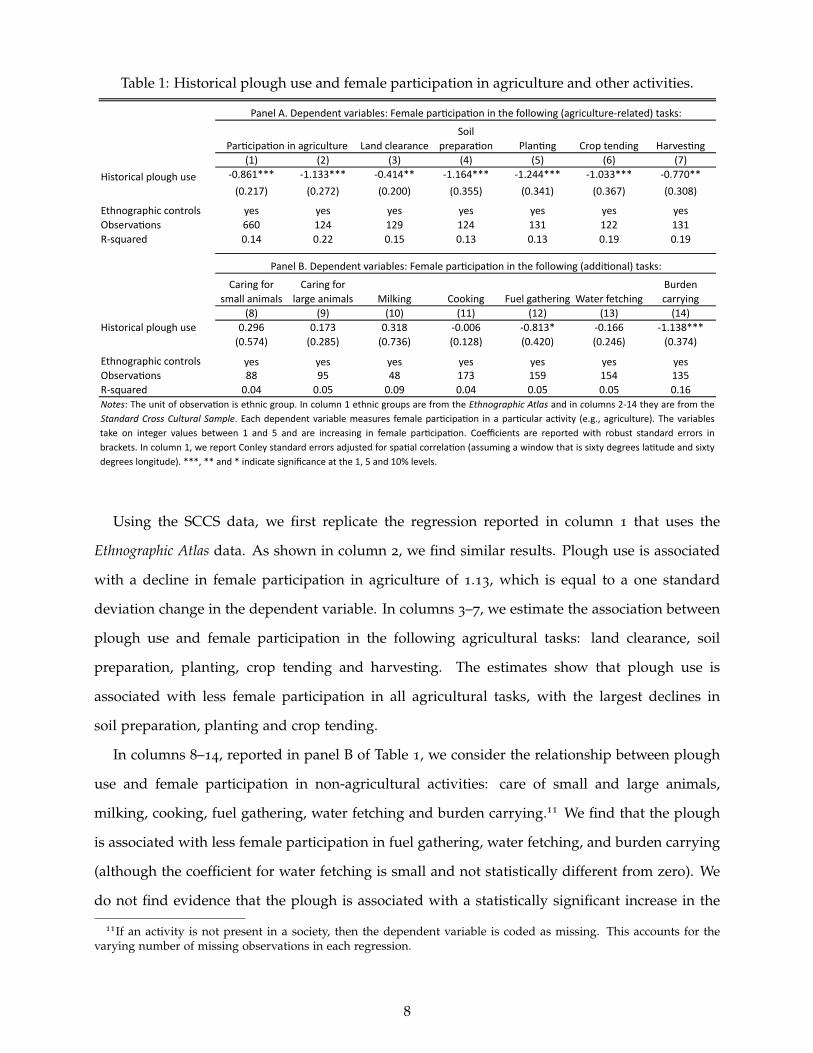
Table 1: Historical plough use and female participation in agriculture and other activities.
Land clearanceSoil
prepara.on Plan.ng Crop tending Harves.ng(1) (2) (3) (4) (5) (6) (7)
Historical plough use -‐0.861*** -‐1.133*** -‐0.414** -‐1.164*** -‐1.244*** -‐1.033*** -‐0.770**
(0.217) (0.272) (0.200) (0.355) (0.341) (0.367) (0.308)
Ethnographic controls yes yes yes yes yes yes yesObserva.ons 660 124 129 124 131 122 131R-‐squared 0.14 0.22 0.15 0.13 0.13 0.19 0.19
Caring for small animals
Caring for large animals Milking Cooking Fuel gathering Water fetching
Burden carrying
(8) (9) (10) (11) (12) (13) (14)Historical plough use 0.296 0.173 0.318 -‐0.006 -‐0.813* -‐0.166 -‐1.138***
(0.574) (0.285) (0.736) (0.128) (0.420) (0.246) (0.374)
Ethnographic controls yes yes yes yes yes yes yesObserva.ons 88 95 48 173 159 154 135R-‐squared 0.04 0.05 0.09 0.04 0.05 0.05 0.16Notes: The unit of observa.on is ethnic group. In column 1 ethnic groups are from the Ethnographic Atlas and in columns 2-‐14 they are from theStandard Cross Cultural Sample. Each dependent variable measures female par.cipa.on in a par.cular ac.vity (e.g., agriculture). The variablestake on integer values between 1 and 5 and are increasing in female par.cipa.on. Coefficients are reported with robust standard errors inbrackets. In column 1, we report Conley standard errors adjusted for spa.al correla.on (assuming a window that is sixty degrees la.tude and sixtydegrees longitude). ***, ** and * indicate significance at the 1, 5 and 10% levels.
Panel A. Dependent variables: Female par.cipa.on in the following (agriculture-‐related) tasks:
Panel B. Dependent variables: Female par.cipa.on in the following (addi.onal) tasks:
Par.cipa.on in agriculture
Using the SCCS data, we first replicate the regression reported in column 1 that uses the
Ethnographic Atlas data. As shown in column 2, we find similar results. Plough use is associated
with a decline in female participation in agriculture of 1.13, which is equal to a one standard
deviation change in the dependent variable. In columns 3–7, we estimate the association between
plough use and female participation in the following agricultural tasks: land clearance, soil
preparation, planting, crop tending and harvesting. The estimates show that plough use is
associated with less female participation in all agricultural tasks, with the largest declines in
soil preparation, planting and crop tending.
In columns 8–14, reported in panel B of Table 1, we consider the relationship between plough
use and female participation in non-agricultural activities: care of small and large animals,
milking, cooking, fuel gathering, water fetching and burden carrying.11 We find that the plough
is associated with less female participation in fuel gathering, water fetching, and burden carrying
(although the coefficient for water fetching is small and not statistically different from zero). We
do not find evidence that the plough is associated with a statistically significant increase in the
11If an activity is not present in a society, then the dependent variable is coded as missing. This accounts for thevarying number of missing observations in each regression.
8
other activities: caring for large or small animals, milking or cooking. For these activities, with
the exception of cooking, the estimated coefficients are positive, but insignificant.
Overall, the ethnographic evidence confirms that women participated less in farm activities
in societies that historically practiced plough agriculture. This is consistent with the analysis of
Boserup (1970), as well as the observations of anthropologists like Baumann (1928) and Whyte
(1978). There is some evidence that the reduced participation coincided with an increase in some
activities like milking. However, the increases are not statistically significant.
3. Linking the past to the present: Data and methodology
We next turn to an examination of the long-term impact of historical plough use. To do this,
we link historical plough-use, measured at the ethnicity level, with current outcomes of interest,
measured at the location-level (either countries or districts within countries) today. This requires
an estimate of the geographic distribution of ethnicities across the globe today. We construct this
information using the 15th edition of the Ethnologue: Languages of the World (Gordon, 2005), a
data source that maps the current geographic distribution of 7,612 different languages, each of
which we manually matched to one of the 1,267 ethnic groups from the Ethnographic Atlas. The
Ethnologue provides a shape file that divides the world’s land into polygons, with each polygon
indicating the location of a specific language. We also use the Landscan 2000 database, which
reports estimates of the world’s population for 30 arc-second by 30 arc-second (roughly 1 km by
1 km) grid-cells globally.12 We combine the Ethnologue shape file with the Landscan raster file
to obtain an estimate of the global distribution of language groups across the globe today. This
information is used to link the historical ethnicity-level data to our current outcomes of interest,
measured at the location-level.
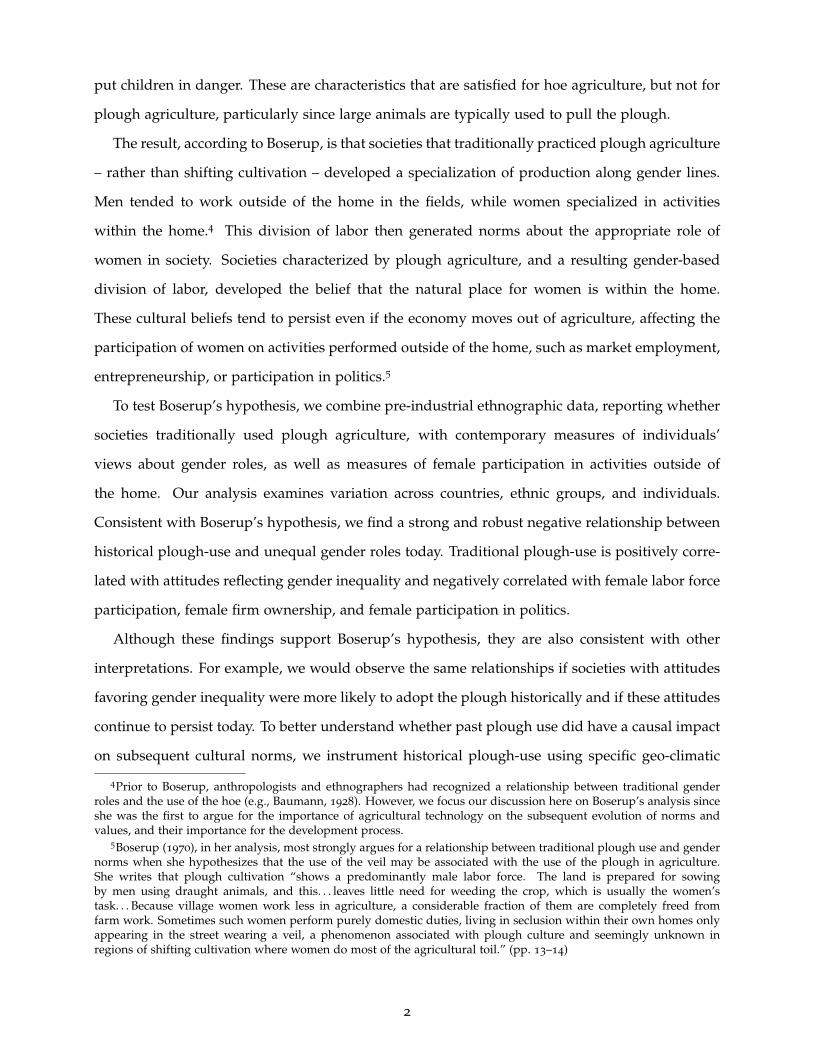
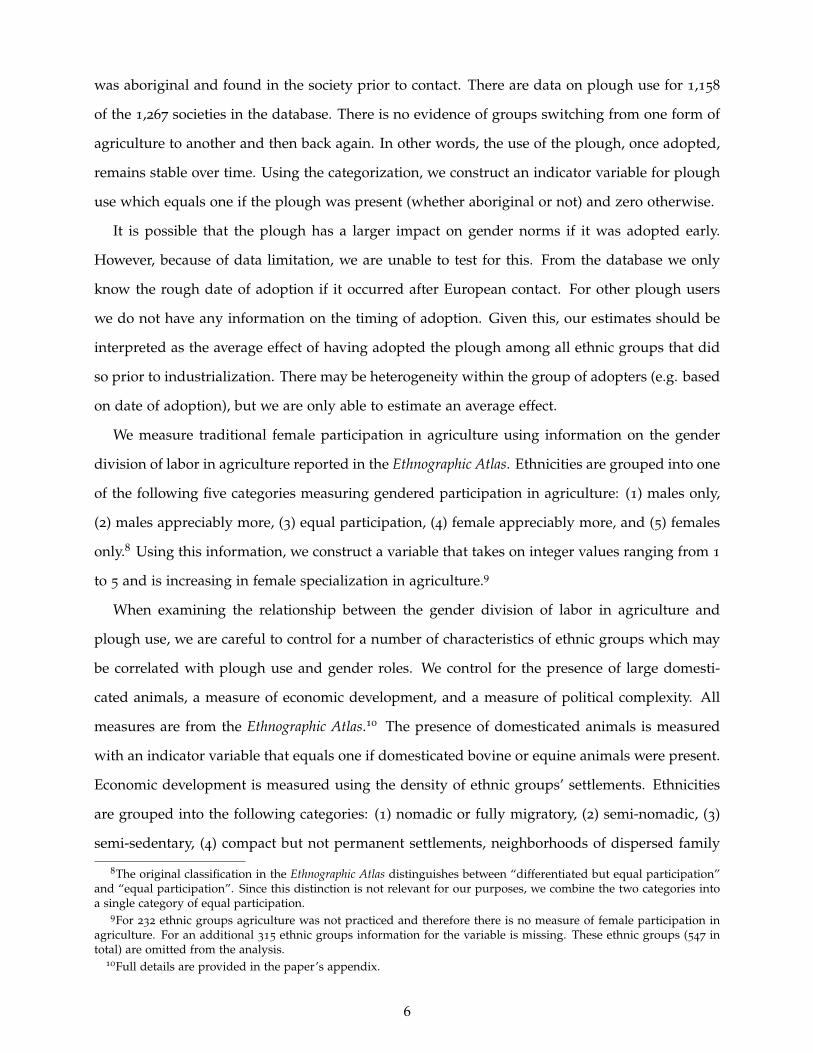
We illustrate our procedure with the example of Ethiopia. Figure 1a shows a map of the land
inhabited by different ethnic groups, i.e. groups speaking different languages. Each polygon
represents the approximate borders of a group (from Ethnologue). One should not think of the
borders as precisely defined boundaries, but rather as rough measures indicating the approxi-
mate locations of different language groups. The map also shows the Landscan estimate of the
population of each cell within the country. A darker shade indicates greater population.
12The Landscan 2000 database was produced by Oakridge Laboratories in cooperation with the US Government andNASA.
9
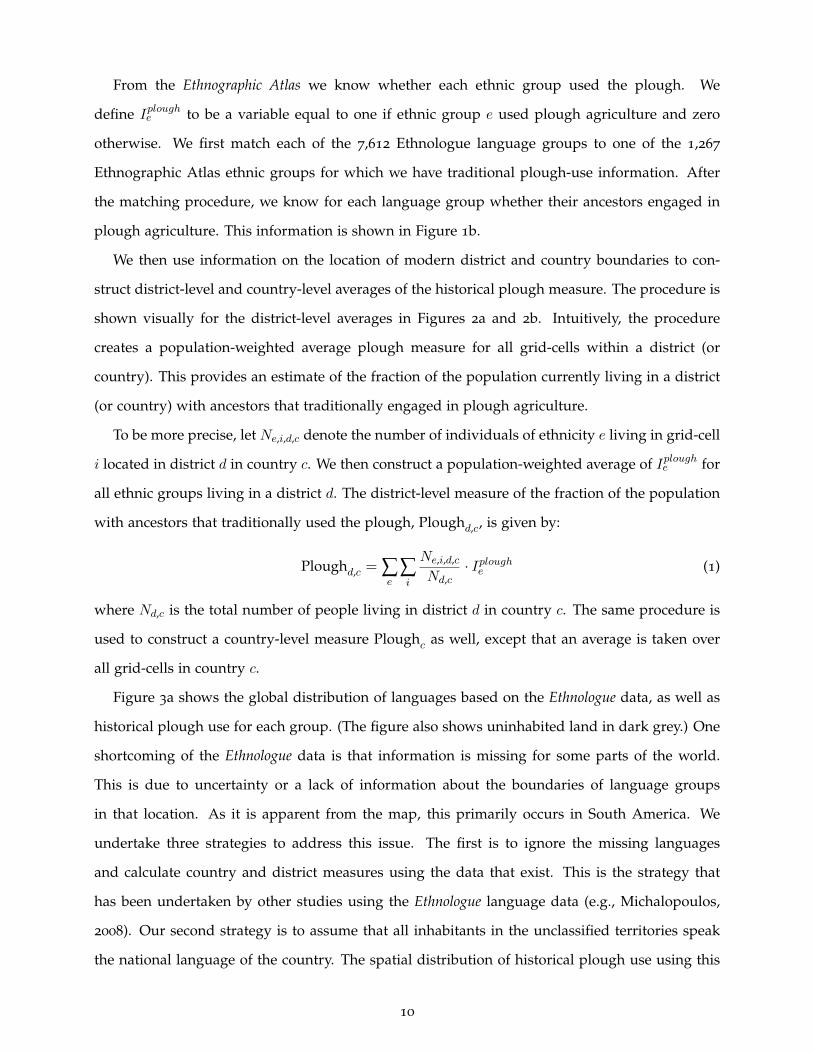
From the Ethnographic Atlas we know whether each ethnic group used the plough. We
define Iploughe to be a variable equal to one if ethnic group e used plough agriculture and zero
otherwise. We first match each of the 7,612 Ethnologue language groups to one of the 1,267
Ethnographic Atlas ethnic groups for which we have traditional plough-use information. After
the matching procedure, we know for each language group whether their ancestors engaged in
plough agriculture. This information is shown in Figure 1b.
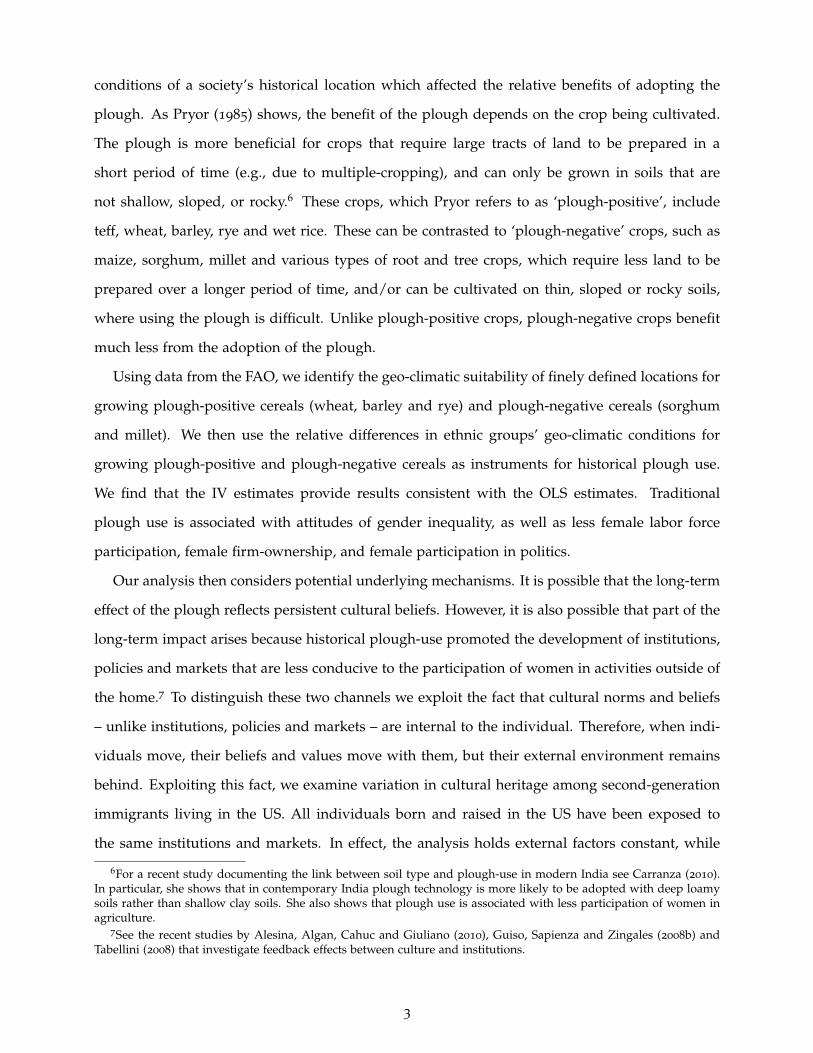
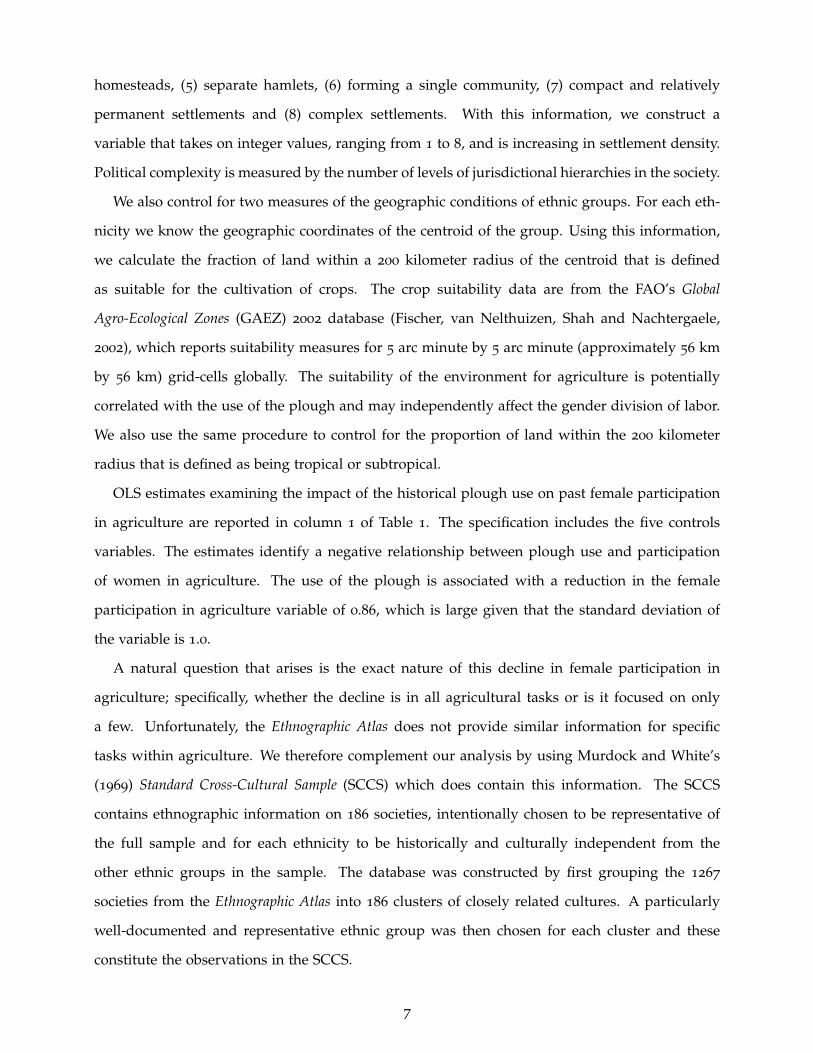
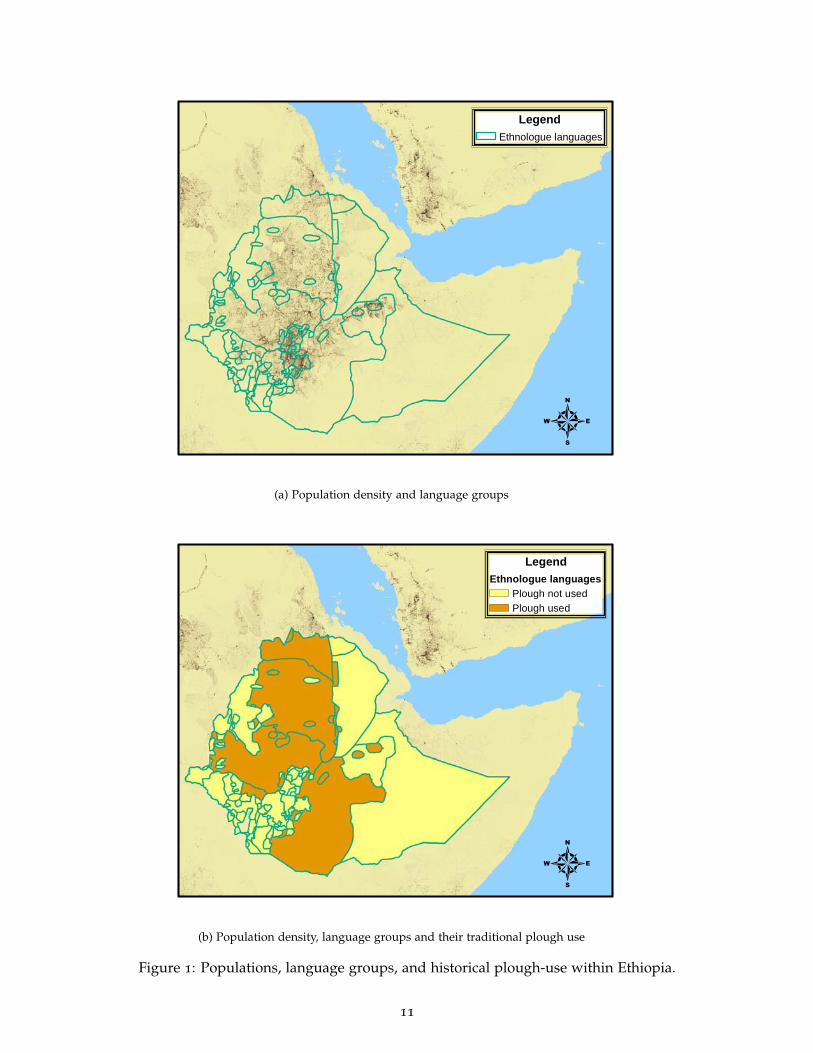
We then use information on the location of modern district and country boundaries to con-
struct district-level and country-level averages of the historical plough measure. The procedure is
shown visually for the district-level averages in Figures 2a and 2b. Intuitively, the procedure
creates a population-weighted average plough measure for all grid-cells within a district (or
country). This provides an estimate of the fraction of the population currently living in a district
(or country) with ancestors that traditionally engaged in plough agriculture.
To be more precise, let Ne,i,d,c denote the number of individuals of ethnicity e living in grid-cell
i located in district d in country c. We then construct a population-weighted average of Iploughe for
all ethnic groups living in a district d. The district-level measure of the fraction of the population
with ancestors that traditionally used the plough, Ploughd,c, is given by:
Ploughd,c = ∑e
∑i
Ne,i,d,c
Nd,c· Iploughe (1)
where Nd,c is the total number of people living in district d in country c. The same procedure is
used to construct a country-level measure Ploughc as well, except that an average is taken over
all grid-cells in country c.
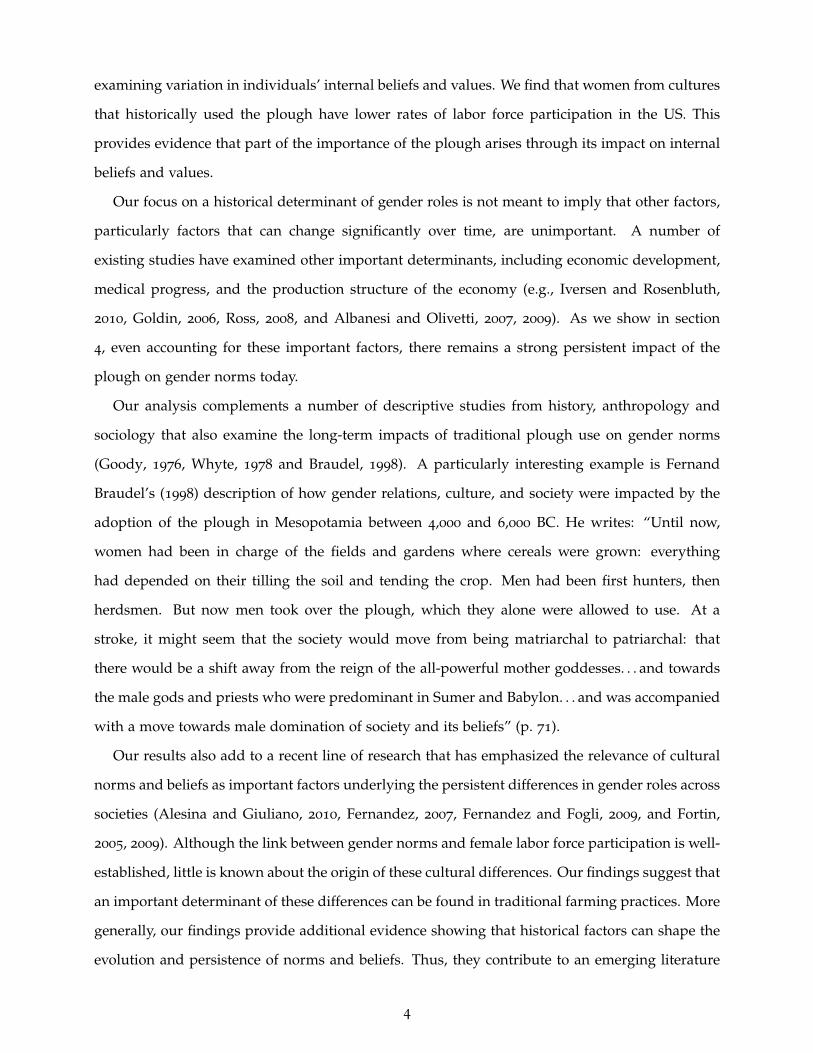
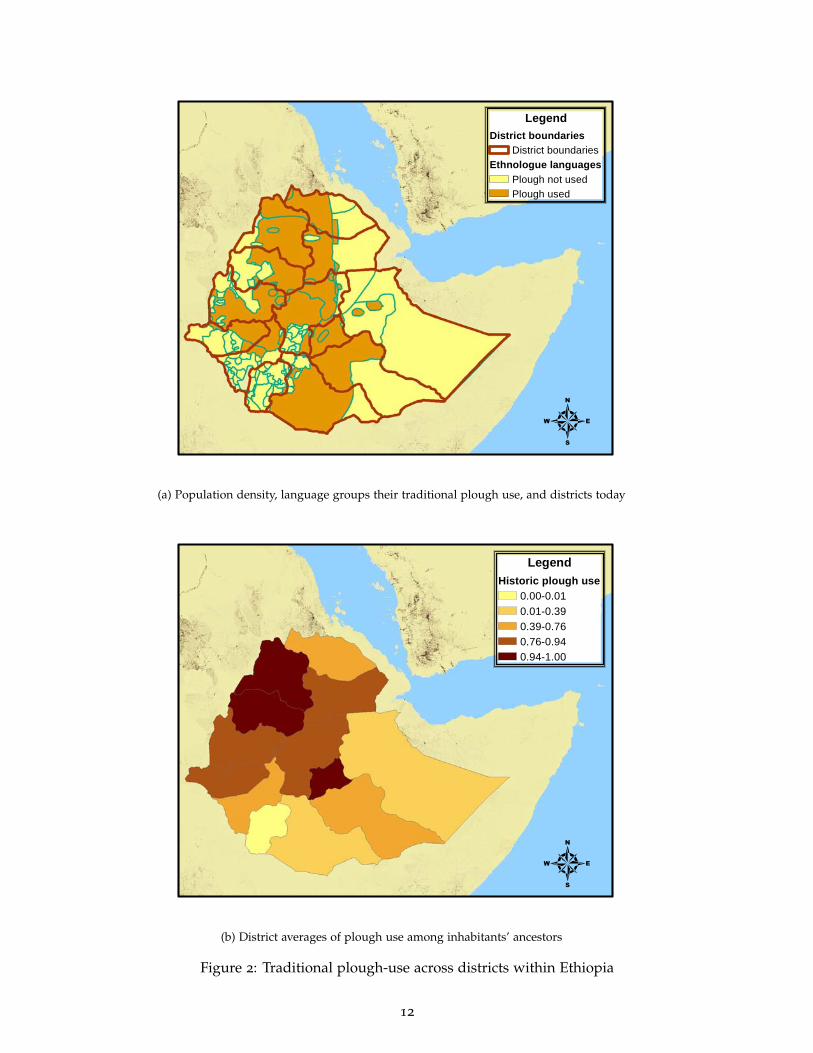
Figure 3a shows the global distribution of languages based on the Ethnologue data, as well as
historical plough use for each group. (The figure also shows uninhabited land in dark grey.) One
shortcoming of the Ethnologue data is that information is missing for some parts of the world.
This is due to uncertainty or a lack of information about the boundaries of language groups
in that location. As it is apparent from the map, this primarily occurs in South America. We
undertake three strategies to address this issue. The first is to ignore the missing languages
and calculate country and district measures using the data that exist. This is the strategy that
has been undertaken by other studies using the Ethnologue language data (e.g., Michalopoulos,
2008). Our second strategy is to assume that all inhabitants in the unclassified territories speak
the national language of the country. The spatial distribution of historical plough use using this
10
4
LegendEthnologue languages
(a) Population density and language groups
4
LegendEthnologue languages
Plough not usedPlough used
(b) Population density, language groups and their traditional plough use
Figure 1: Populations, language groups, and historical plough-use within Ethiopia.
11
4
LegendDistrict boundaries
District boundariesEthnologue languages
Plough not usedPlough used
(a) Population density, language groups their traditional plough use, and districts today
4
LegendHistoric plough use
0.00-0.010.01-0.390.39-0.760.76-0.940.94-1.00
(b) District averages of plough use among inhabitants’ ancestors
Figure 2: Traditional plough-use across districts within Ethiopia
12
LegendPlough use: No imputation
Missing plough dataNo plough usePlough use, not indigenousIndigenous plough use
Missing language dataUnpopulated landPopulated but no Ethnologue data
(a) Missing language information not imputed
LegendPlough use: imputed with nat'l language
Missing plough dataNo plough usePlough use, not indigenousIndigenous plough use
Missing language dataUnpopulated landPopulated but no Ethnologue data
(b) Missing language information imputed using the country’s official language
LegendPlough use: imputed with GREG
Missing plough dataNo plough usePlough use, not indigenousIndigenous plough use
Missing language dataUnpopulated landPopulated but no Ethnologue data
(c) Missing language information imputed using GREG ethnic groups
Figure 3: Historical plough use among the ethnic/language groups globally13
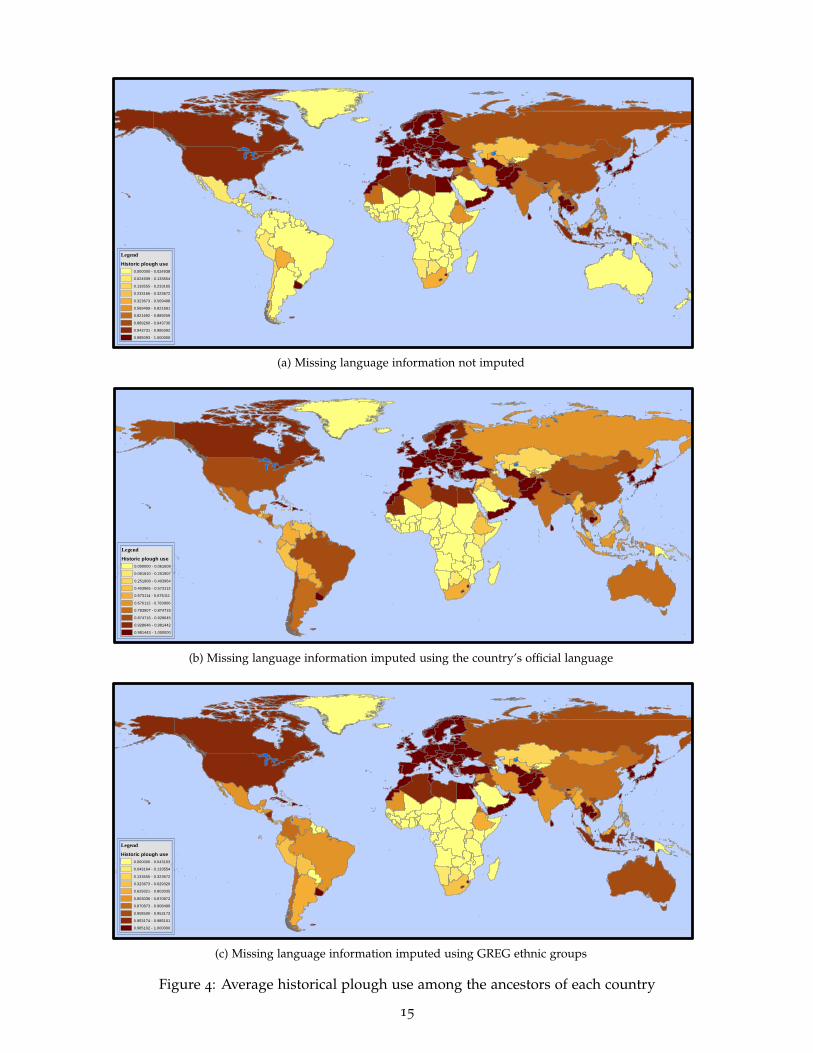
imputation procedure is reported in Figure 3b. Our third strategy is to impute the missing data
using information on the spatial distribution of ethnic groups from the Geo-Referencing of Ethnic
Groups (GREG) database (Weidmann, Rod and Cederman, 2010). Like the Ethnologue, the GREG
database provides a shape file that divides the world’s land into polygons, with each polygon
indicating the location of a specific ethnicity. The shortcoming of the GREG database is that
ethnic groups are much less finely identified relative to the Ethnologue database. The GREG
database identifies 1,364 ethnic groups, while the Ethnologue identifies 7,612 language groups.13
The spatial distribution of historical plough use using this procedure is shown in Figure 3c.
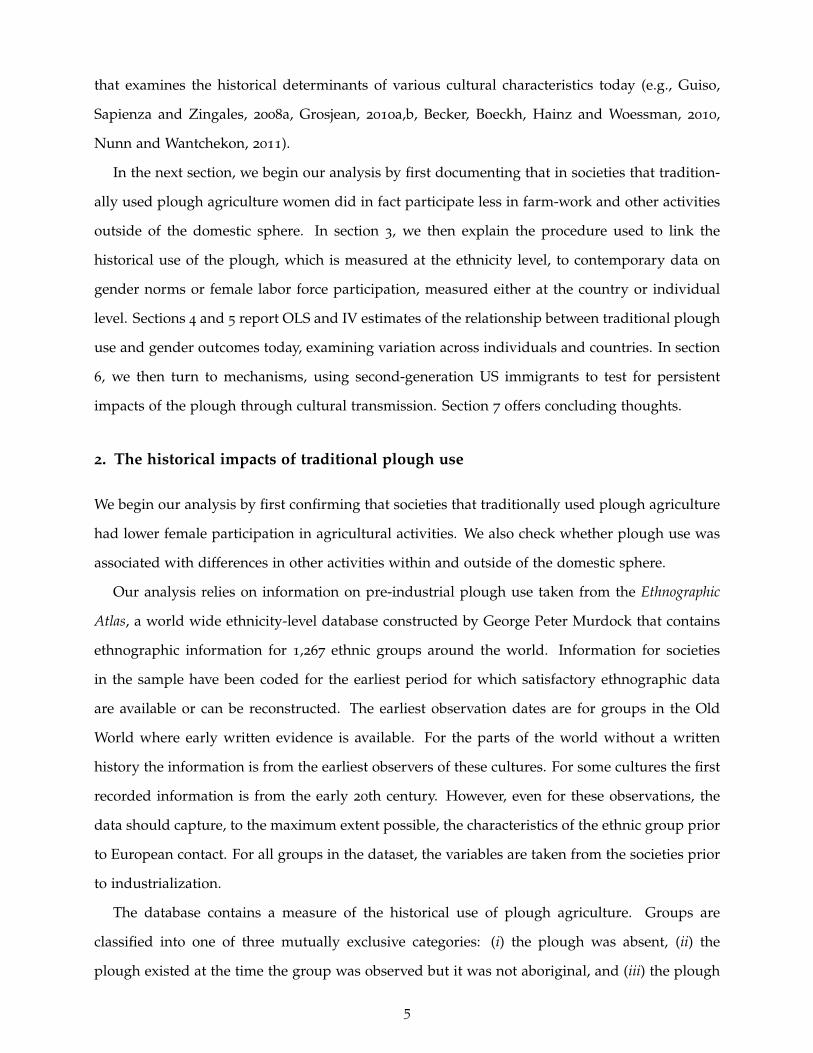
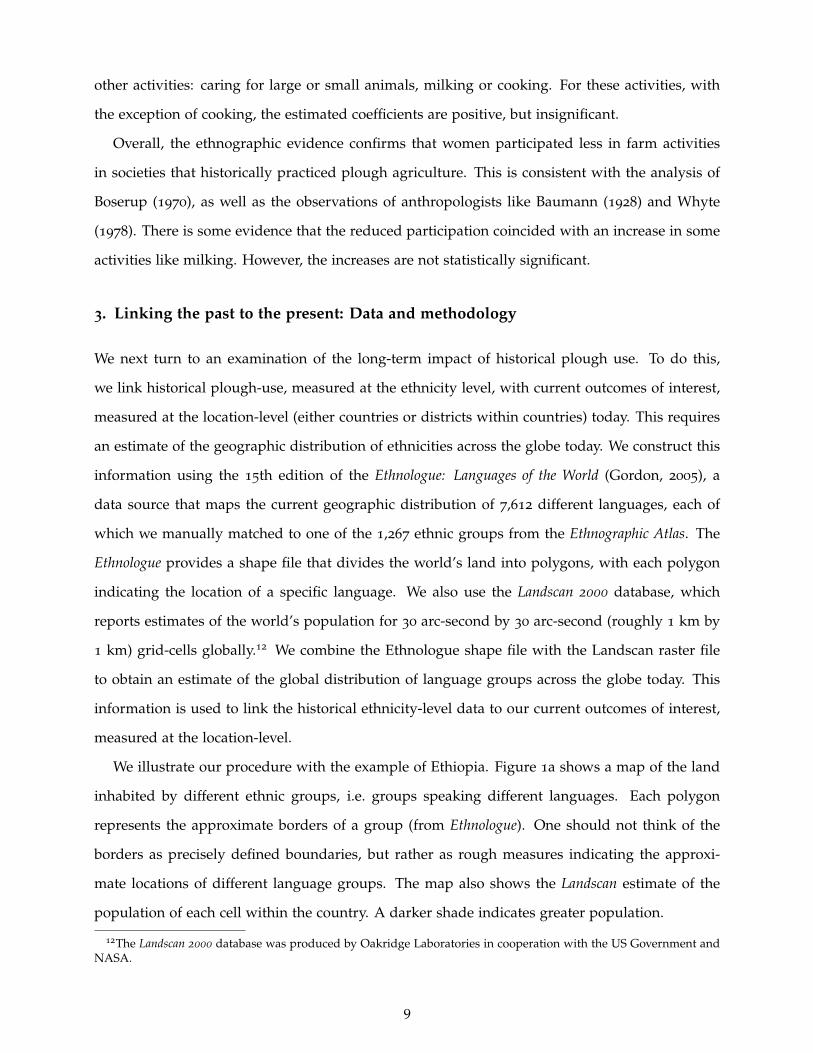
In Figures 4a–4c, we report population weighted country-level averages of historical plough
use for each of the three strategies used to address the missing language data. In our analysis,
we use the plough variable that was constructed without missing values imputed as our baseline
measure. Our results are robust to the use of either variable that imputes the missing language
data. This robustness is explained by the high correlation among the three plough measures. At
the country-level, the correlation between: (i) our baseline variable and the measure with missing
languages imputed using the country’s national language is 0.89; (ii) our baseline measure and
the measure imputed using ethnic groups from the GREG database is 0.91; and (iii) the two
variables with imputed values is 0.99.14
4. OLS estimates
Having constructed country- and district-level measures of traditional plough use, we are able to
examine the relationship between historical plough use and the role of women in societies today.
We begin by examining variation at the country level.
A. Country-level estimates
We test Boserup’s hypothesis by estimating the following equation:
yc = α+ β Ploughc + XCc Γ + XH
c Π + εc (2)
where y is an outcome of interest, c denotes countries, Ploughc is our measure of the historical
use of the plough among the ancestors of the citizens in country c, and XCc and XH
c are vectors
13An alternative strategy is to rely only on the coarser GREG classification and map. Our results are robust to thisprocedure as well.
14Descriptive statistics for the three measures are reported in Appendix Table A1.
14
LegendHistoric plough use
0.000000 - 0.0249380.024939 - 0.1335540.133555 - 0.2331650.233166 - 0.3236720.323673 - 0.5694980.569499 - 0.8216910.821692 - 0.8892590.889260 - 0.9437300.943731 - 0.9850920.985093 - 1.000000
(a) Missing language information not imputed
LegendHistoric plough use
0.000000 - 0.0616090.061610 - 0.2519070.251908 - 0.4039640.403965 - 0.5731130.573114 - 0.6761110.676112 - 0.7839060.783907 - 0.8747150.874716 - 0.9286450.928646 - 0.9814420.981443 - 1.000000
(b) Missing language information imputed using the country’s official language
LegendHistoric plough use
0.000000 - 0.0431630.043164 - 0.1335540.133555 - 0.3236720.323673 - 0.6293200.629321 - 0.8030350.803036 - 0.8708720.870873 - 0.9084990.908500 - 0.9531730.953174 - 0.9851010.985102 - 1.000000
(c) Missing language information imputed using GREG ethnic groups
Figure 4: Average historical plough use among the ancestors of each country
15
of current controls and historical ethnographic controls, all measured at the country level. XCc
includes the natural log of a country’s real per capita GDP measured in 2000, as well as the
variable squared. These controls are important given the well-established non-linear U-shaped
relationship between economic development and female labor force participation (Goldin, 1995).
We also include an indicator variable that equals one if the country was formerly communist,
since these regimes implemented policies to eliminate gender differences in the economy.15
The historical ethnographic controls XHc are based on the ethnographic characteristics used as
controls in the ethnicity-level regressions: the presence of domesticated bovine or equine animals,
economic development measured by the density of settlement, levels of political authority in the
society, agricultural suitability, and the presence of a tropical climate. We construct country-level
versions of these variables using the same procedure that is used to construct the historical plough
use variable. Thus, the ethnographic controls capture the historical characteristics of a location’s
ancestors.
Table 2 reports country-level OLS estimates. In columns 1 and 2, the dependent variable is a
country’s female labor force participation rate (FLFP) in 2000.16 In columns 3–6, we examine
women’s participation in more narrowly specified activities outside of the domestic sphere:
entrepreneurship (measured by the share of firms with owners or managers that are female) and
national politics (measured by the proportion of seats held by women in national parliament).17
The even numbered columns include controls for continent fixed effects, while the odd numbered
columns do not. The estimates show that in countries with a tradition of plough use, women are
less likely to participate in the labor market, are less likely to own or manage firms, and are less
likely to participate in politics.18 All coefficients are negative and statistically significant.
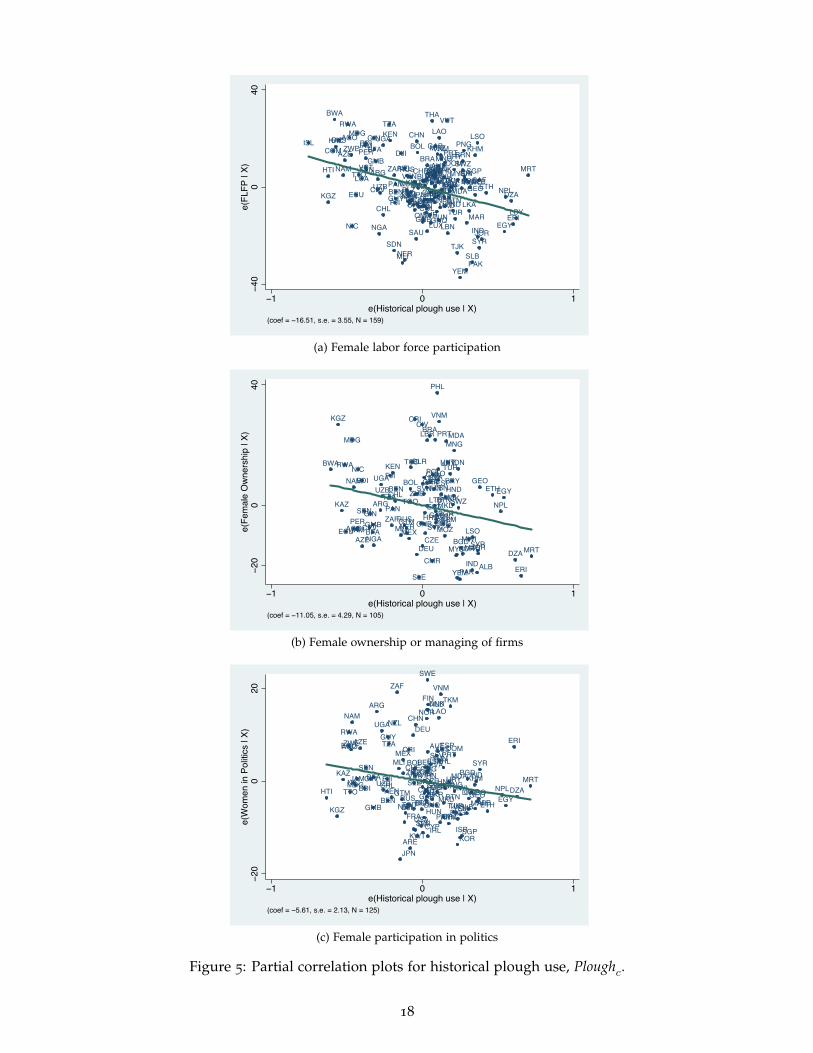
The partial correlation plots for historical plough use are show in Figures 5a–5c (for columns
15Alesina and Fuchs-Schundeln (2007) show how the impact of a communist regime on individual beliefs can belong lasting.
16FLFP is taken from the World Bank’s World Development Indicators. The variable is measured as the percentage ofwomen aged 15 to 64 that are in the labor force.
17The share of a country’s firms with some female ownership is measured as the percentage of surveyed firms witha woman among the principal owners. The data are from the World Bank Enterprise Surveys. The proportion of seats innational parliament is measured as the percent of parliamentary seats, in a single or lower chamber, held by women.The variable, measured in 2000, is taken from the United Nations’ Women’s Indicators and Statistics Database.
18Because female participation in national politics may be affected by the type of government, we also control foreach country’s level of democracy in 2000 when this outcome is examined. Democracy is measured using the ‘polity2’measure from the Polity IV database, which takes on integer values and ranges from −10 (high autocratic) to +10(highly democratic). Many countries have introduced quotas to increase the participation of women in politics. Wehave checked the robustness of our results excluding countries with gender quotas. For the restricted sample of 86
countries, the estimated coefficient is −4.85 with a standard error of 2.68.
16

Table 2: Country level OLS estimates.
(1) (2) (3) (4) (5) (6) (7) (8)
Historical plough use -‐16.506*** -‐15.417*** -‐11.052** -‐11.540** -‐5.606*** -‐4.245* -‐0.849*** -‐0.796***(3.547) (3.561) (4.287) (5.152) (2.128) (2.218) (0.140) (0.137)
Historical controls:Agricultural suitability yes yes yes yes yes yes yes yesDomesDcated animals yes yes yes yes yes yes yes yesTropics yes yes yes yes yes yes yes yesPoliDcal hierarchies yes yes yes yes yes yes yes yesEconomic complexity yes yes yes yes yes yes yes yes
Contemporary controls:
ln income, ln income2 yes yes yes yes yes yes yes yesCommunism indicator yes yes yes yes yes yes yes yesPolity no no no no yes yes no no
ConDnent fixed effects no yes no yes no yes no yes
ObservaDons 159 159 105 105 125 125 135a 135a
R-‐squared 0.41 0.43 0.15 0.21 0.28 0.32
Dependent variable:
Average effect size (AES)
Notes: OLS esDmates are reported with robust standard errors in brackets. The unit of observaDon is a country. ***, ** and * indicate significance at the 1, 5 and 10%
levels. aThis is the average number of observaDons in the regressions for the three outcomes.
Female labor force parDcipaDon
Share of firms with some female ownership Females in poliDcs
1, 3 and 5). From the figures it is clear that the coefficient for traditional plough use is not being
influenced by a small number of countries. Further, the plots also show that the coefficient
estimates are not only identified from broad differences across regions, but also from finer
within-region variation. For example, we observe African countries in the Northwest corner (e.g.,
Rwanda, Madagascar) and in the Southeast corner (e.g., Eritrea, Mauritania, Ethiopia, etc). This
is confirmed by the fact that the point estimates controlling for region fixed effects are essentially
identical to the estimates without the fixed effects (comparing the odd numbered columns to the
even numbered columns in Table 2).
Not only are the coefficient estimates statistically significant, but they are also economically
meaningful. Based on the estimates from column 1, a one-standard-deviation increase in historical
plough use (0.474) is associated with a reduction of female labor force participation (FLFP) of 7.82
percentage points (16.506 × 0.474), which is equal to 15.1% of the sample average for FLFP and
47% of its standard deviation. The impact on the share of firms with some female ownership
(based on the column 3 estimates) is a reduction of 5.23 percentage points, which is 16% of the
outcome’s mean and 38% of its standard deviation. The reduction on the participation of women
in politics (using the column 5 estimates) is 2.66 percentage points, which is 22% of the outcome’s
mean and 30% of its standard deviation.19
19See Appendix Table A1 for the means and standard deviations of the variables.
17
ISL
HTI
KGZ
COM
BWA
KAZBHS
NAM
AZE
RWA
AGOZWE
NIC
ECU
MDG
TTOLCA
JAMPER
VCT
BDI
SEN
GINBFAGMB
CPV
ARG
NGA
UZB
UGA
CHL
TZAKEN
SDN
ZAF
FJI
PANBENGUY
DJI
MLINER
NZL
NCL
RUS
TCDGTMBLZVEN
MEXJPNFRA
CHE
TGOCRI
KWT
ARE
BLR
SAU
CHN
DEU
BOL
SVNZMB
ITABEL
OMN
CYP
GNB
CZE
CIVSLEHRVHUN
POLEST
IRN
SVK
COL
LUX
UKR
BRA
LVA
LTU
SUR
CMR
TUN
USA
THA
LBR
CANGHA
AUT
SWENLD
FINDNK
IRL
NORGBRCOG
GAB
MKD
BGR
MOZ
BIHAUS
GNQ
LAO
PRI
ESP
VNMPRT
GRC
MNGPHL
SLV
URY
BTN
VUT
LBN
MDAARMPRYTKM
HND
DOM
TUR
TJK
MYS
YEM
KOR
BRNSWZ
PNG
SGPISR
PAK
IDN
MAR
MWI
LKA
BGDALB
SLB
KHM
GEO
LSO
IND
CAF
SYRJOR
ETH
EGY
NPLDZA
ERILBY
MRT
400
40e(
FLFP
| X)
1 0 1e(Historical plough use | X)
(coef = 16.51, s.e. = 3.55, N = 159)
(a) Female labor force participation
BWA
KGZ
KAZ
RWA
ECU
MDG
AGO
NAM
JAMPER
NIC
AZE
BDI
SEN
CPV
GIN
BFAGMB
NGA
ARG
UGAUZB
TZA
FJI
ZAFPAN
KEN
CHLBEN
MLIRUSGTMNER
MEX
TGO
BOL
BLRTCD
SVN
CRI
DEU
ZMB
SLE
HRV
CIV
CZE
UKRHUN
GNB
POL
EST
SVK
IRLLVA
LTU
LBRBRA
GHA
CMR
COLESP
BIH
BTN
PRT
GRCMKDBGRGAB
PHL
LAOURY
VNM
LBN
COGMOZ
SLV
MDA
VUT
ARM
TUR
PRY
TJKHND
MNG
MYSKOR
PAK
IDN
SWZ
YEM
BGDMAR
MWI
IND
LSO
ALB
SYRJOR
GEOETH
NPL
EGY
DZA
ERI
MRT
200
40e(
Fem
ale
Own
ersh
ip |
X)
1 0 1e(Historical plough use | X)
(coef = 11.05, s.e. = 4.29, N = 105)
(b) Female ownership or managing of firms
HTI
KGZ
KAZ
ECU
RWA
AGO
TTO
ZWE
NAM
NICMDGJAM
AZE
BDI
SENGIN
GMB
BFA
ARG
UGA
UZBFJICHL
BEN
GUYTZA
KEN
NZL
ZAF
MLI
JPN
GTM
MEX
CHE
FRANERDJIRUS
CRI
TCD
ARE
DEU
ZMB
SVN
BLR
BOL
SLEVEN
ITA
BEL
CHN
KWT
USA
BRA
CZE
CYP
HUN
CANPOL
GHA
EST
SVKUKRCMR
NOR
GAB
COL
DNK
SWE
LVA
AUT
LTU
IRL
NLDFIN
GBR
COGIRN
TUN
GNQTHA
MKD
SLV
BGR
ESP
LAO
PRT
GRC
VNM
AUS
PRY
PHL
BTN
URYHND
ARM
MDA
TKM
TJK
MNG
DOM
TUR
KOR
PNG
SGP
MWI
YEM
ISR
SLB
BGD
LKAMAR
CAF
KHM
ALB
IND
GEOLSO
SYR
ETH
NPLEGY
ERI
DZAMRT
200
20e(
Wom
en in
Pol
itics
| X)
1 0 1e(Historical plough use | X)
(coef = 5.61, s.e. = 2.13, N = 125)
(c) Female participation in politics
Figure 5: Partial correlation plots for historical plough use, Ploughc.
18
Columns 7 and 8 report the estimated average effect size (AES) for the three dependent
variables examined in columns 1–6. We computed the AES following Kling, Liebman, Katz and
Sanbonmatsu (2004). Let βk indicate the estimated plough coefficient for outcome variable k and
σk the standard deviation of outcome k. Then, the average effect size is equal to 1K ∑K
k=1βk
σk , where
K is the total number of outcome variables. To properly calculate the sample variance of the AES,
the coefficients βk are jointly estimated in a seemingly unrelated regression framework.20 The AES
estimates confirm the findings when examining the outcomes individually: historical plough use
is associated with less female participation in activities outside of the home today. As well,
the implied magnitudes are similar. According to the AES estimate, a one-standard-deviation
increase in plough use is associated with an average decrease (for the three outcomes) of 0.40
standard deviations.
An alternative way to assess the magnitude of the estimates is to calculate the proportion of
the total variation they explain. By this metric as well, historical plough use explains a sizable
proportion of differences in gender roles across countries. When female labor force participation
is the dependent variable (column 1 of Table 2), the inclusion of the historical plough use variable
increases the R-squared by 0.086 (from 0.326 to 0.412). Therefore, traditional plough use accounts
for 8.6% of the total variation in FLFP and 12.8% of the residual variation in FLFP unaccounted
for by the control variables.21 For the share of firms with female ownership, traditional plough
use accounts for 5% of the total variation and 6% of the residual variation. For the participation of
women in politics, historical plough use explains 3% of the total variation and 4% of the residual
variation.
Although we do not report them explicitly in here, we find that the estimated coefficients
for the control variables are generally as expected.22 For example we find evidence of a U-
shaped relationship between per capita income and female labor force participation, as well as the
other outcomes. This is consistent with previous studies that also find this same non-monotonic
relationship (Goldin, 1995). We also find that countries that experience a period of communism
have higher rates of female labor force participation.
20See Clingingsmith, Khwaja and Kremer (2009) for an alternative application and further details.21This is calculated as: (0.412 − 0.326)/(1 − 0.326) = 0.128 or 12.8%.22The estimates for the controls are available upon request.
19
Robustness to alternative plough measures
Using either of the two methods for imputing missing language data yields estimates that are
qualitatively identical to the estimates using our baseline variable. As reported in Appendix Table
A2, the alternative measures yield nearly identical point estimates that are highly significant.
As a final check to ensure that our findings are not being driven by measurement error, we
omit 17 countries that have a significant proportion of missing language data. The countries
include Australia, Argentina, Bolivia, Brazil, Chile, Colombia, Costa Rica, Ecuador, Guatemala,
Honduras, Mexico, New Zealand, Nicaragua, Panama, Paraguay, Peru and Venezuela. The
estimates, reported in Appendix Table A3, show that the impact of the plough remains robust
to this check.
The persistence of female labor force participation
To this point, we have shown that historical plough use is associated with less female participation
in agriculture historically and with less female participation in the labor force today. These
two correlations suggest long-term persistence in female participation in activities outside of
the home. As a check for this, we regress female labor force participation today on the measure
of women’s historical participation in agriculture constructed from the Ethnographic Atlas. The
regression also controls for our full set of covariates from equation (2) above. The partial
correlation plot, showing the relationship between historical female participation in agriculture
and FLFP today, is shown in Figure 6. As is apparent from the figure, there is strong persistence
over time. Female labor force participation today and female participation in agriculture in the
past are very strongly correlated.
In light of existing studies, this persistence is perhaps surprising. In fact, Goldin and Sokoloff
(1984) document that within the Northeastern United States, the low relative productivity of
women and children in agriculture (and hence their low participation) spurred industrialization
and their active participation in the manufacturing sector. In their setting, female labor force
participation in agriculture was inversely related to participation in manufacturing, suggesting
a lack of continuity of female labor force participation overtime as industrialization occurs.
However, our results show that this example does not appear to be general. Instead, areas with
low female participation in agriculture and plough use historically (because of the persistence of
20

SLV
AZE
GTMARM
HND
ISR
MDA
LBN
MNG
GNBTUR
PAK
JOR
CHL
MRT
MLI
ETHMEXPRYUSA
LBY
GEO
ERI
GIN
SEN
BHS
GMB
SYR
BLZ
CANBRA
JPN
MAR
PAN
IND
HTI
IRN
NZL
EGY
LKA
TJK
VNM
FJI
LAO
SAU
NPL
DOMLTU
LVAEST
HUN
TKM
URY
ISL
NGA
UKR
PRT
BGDESP
PRIDEUGUY
BLRCPV
NERSLB
RUS
CRI
THA
VCT
JAM
GHALCA
OMN
TTOFIN
GBRARG
CIV
NLD
IRL
SWE
UZB
VUT
CYPDNKNOR
AUT
PNG
LBR
BFAKHM
SLEAREBEL
COL
LUX
CHN
ECU
ALBTCD
BOL
DZAFRA
CHE
KAZ
PER
BENBGR
MYS
TGO
IDN
BTN
BDICOMBRNZWE
MKD
SVKBIH
MOZ
KGZ
KEN
SGP
HRV
KORPOLCZEPHL
SDN
SVN
TZA
GRCCMR
MDG
COGZMBCAF
AGO
SURITA
UGAGAB
GNQ
BWA
MWIVENZAF
RWA
LSO
SWZ
NIC
NCL
NAM
400
40e(
FLFP
| X)
2 0 2e(Historical female participation in agriculture | X)
(coef = 4.69, s.e. = 1.38, N = 154)
Figure 6: Historical female participation in agriculture and current FLFP.
norms and beliefs) today continue to have low levels of female participation in activities outside
of the home, even after the economy moves out of agriculture and into industry.
Controlling for alternative hypotheses
We now test the robustness of our estimates to alternative determinants of gender roles that
have been suggested by various scholars. A prominent alternative explanation for the origins
of gender role differences was proposed by Frederick Engels (1902). He argued that gender
inequality arose as a result of the intensification of agriculture, which resulted in the emergence
of private property, which was monopolized by men. The control of private property allowed men
to subjugate women and to introduce exclusive paternity over their children, replacing matriliny
with patrilineal descent, making wives even more dependent on husbands and their property. As
a consequence, women were no longer active and equal participants in community life.
We account for this potential mechanism by controlling for a variable that measures the
proportion of a country’s ancestors practicing intensive agriculture. We also control for the
proportion of a country’s population with ancestors without land inheritance rules, which we
take as an indicator for the absence of property rights in land. Lastly, we control for two variables
that capture the proportion of a country’s ancestors with patrilocal post-marital residence rules
and with matrilocal rules. These capture the extent to which societies were matrilineal versus
21
patrilineal. All of the controls are constructed using the Ethnographic Atlas and in the same
manner as the historical plough use and other ethnographic control variables.23
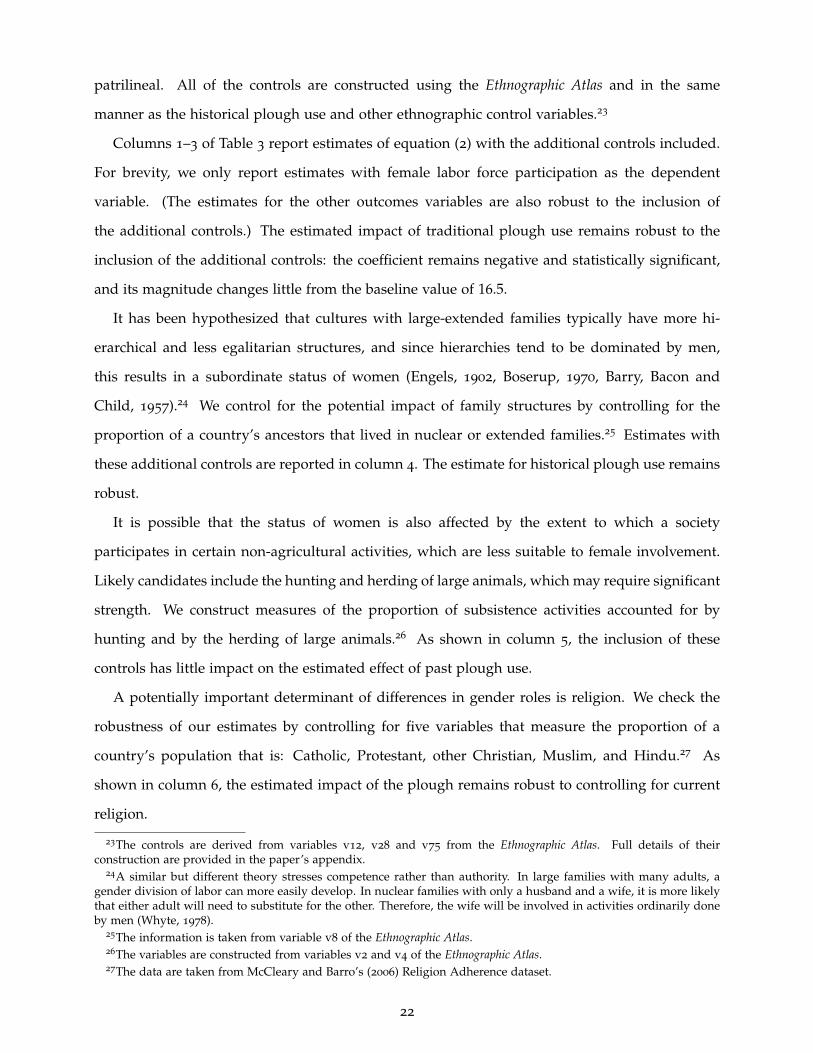
Columns 1–3 of Table 3 report estimates of equation (2) with the additional controls included.
For brevity, we only report estimates with female labor force participation as the dependent
variable. (The estimates for the other outcomes variables are also robust to the inclusion of
the additional controls.) The estimated impact of traditional plough use remains robust to the
inclusion of the additional controls: the coefficient remains negative and statistically significant,
and its magnitude changes little from the baseline value of 16.5.
It has been hypothesized that cultures with large-extended families typically have more hi-
erarchical and less egalitarian structures, and since hierarchies tend to be dominated by men,
this results in a subordinate status of women (Engels, 1902, Boserup, 1970, Barry, Bacon and
Child, 1957).24 We control for the potential impact of family structures by controlling for the
proportion of a country’s ancestors that lived in nuclear or extended families.25 Estimates with
these additional controls are reported in column 4. The estimate for historical plough use remains
robust.
It is possible that the status of women is also affected by the extent to which a society
participates in certain non-agricultural activities, which are less suitable to female involvement.
Likely candidates include the hunting and herding of large animals, which may require significant
strength. We construct measures of the proportion of subsistence activities accounted for by
hunting and by the herding of large animals.26 As shown in column 5, the inclusion of these
controls has little impact on the estimated effect of past plough use.
A potentially important determinant of differences in gender roles is religion. We check the
robustness of our estimates by controlling for five variables that measure the proportion of a
country’s population that is: Catholic, Protestant, other Christian, Muslim, and Hindu.27 As
shown in column 6, the estimated impact of the plough remains robust to controlling for current
religion.
23The controls are derived from variables v12, v28 and v75 from the Ethnographic Atlas. Full details of theirconstruction are provided in the paper’s appendix.
24A similar but different theory stresses competence rather than authority. In large families with many adults, agender division of labor can more easily develop. In nuclear families with only a husband and a wife, it is more likelythat either adult will need to substitute for the other. Therefore, the wife will be involved in activities ordinarily doneby men (Whyte, 1978).
25The information is taken from variable v8 of the Ethnographic Atlas.26The variables are constructed from variables v2 and v4 of the Ethnographic Atlas.27The data are taken from McCleary and Barro’s (2006) Religion Adherence dataset.
22
Table 3: Robustness of OLS estimates to alternative controls.
(1) (2) (3) (4) (5) (6)
Historical plough use -‐14.734*** -‐16.814*** -‐17.073*** -‐14.570*** -‐15.417*** -‐12.041***(4.856) (3.769) (3.568) (3.568) (3.692) (3.967)
Prac@ces intensive agriculture yesAbsence of private property yesPatrilocal society, matrilocal society yesNuclear family, extended family yesPropor@on of subsistence from: hun@ng, herding yesProp of pop belonging to five major religions yesBaseline historical and contemporary controls yes yes yes yes yes yesObserva@ons 159 156 159 159 159 157R-‐squared 0.41 0.41 0.42 0.46 0.43 0.57
(7) (8) (9) (10) (11) (12)Historical plough use -‐16.435*** -‐15.767*** -‐18.474*** -‐16.467*** -‐16.519*** -‐15.375***
(3.536) (3.538) (4.112) (3.564) (3.592) (3.844)Oil produc@on per capita yesTrade/GDP yesAgric., manuf. and services share of GDP yesYears of civil conflicts (1816-‐2007) yesYears of interstate conflicts (1816-‐2007) yesFrac@on of European descent yesBaseline historical and contemporary controls yes yes yes yes yes yesObserva@ons 157 159 157 157 157 151R-‐squared 0.43 0.42 0.42 0.41 0.41 0.42Notes: OLS es@mates are reported with robust standard errors in brackets. The unit of observa@on is a country. Each regression includes the full set ofcontrol variables (historical and contemporary). ***, ** and * indicate significance at the 1, 5 and 10% levels.
Dependent variable: FLFP
Ross (2008) challenges the view that religion – particularly Islam – has an important impact
on gender roles. He argues instead for the importance of a country’s endowment of oil reserves.
According to his hypothesis, oil causes a country’s domestic currency to strengthen, making
exports less competitive and causing a decline in light manufacturing, a sector particularly well-
suited for female employment. We account for this possibility by controlling for per capita oil
production and the trade-to-GDP ratio, both measured in 2000. We also control for the economic
structure of each country by including three variables that capture the share of GDP accounted for
by agriculture, manufacturing and services.28 Estimates with the additional controls are reported
in columns 7–9. The impact of the plough remains robust.
Differences in gender roles could potentially be influenced by differences in the prevalence of
warfare across societies. However, a priori, the direction of the effect is unclear (see Whyte, 1978).
Involvement in warfare may cause societies to become more hierarchical and male dominated,
suggesting a negative relationship between conflict and female work outside the home. On the
other hand, being involved in warfare can generate a greater need for female involvement outside
of the home. We control for the potential impacts of warfare, by calculating, for each country, the
28The data are from the World Development Indicators, except for the oil production data which is from BP Oil (2006).
23
number of years since 1816 (the first year data are available) that the country was involved in
either internal or interstate warfare.29 The results, reported in columns 10 and 11, show that the
impact of plough use robust to controlling for warfare.30
The last factor that we consider is motivated by the fact that country-level ancestral plough
use is affected by historical European migration. European ancestry may have an effect on female
labor force participation independent of historical plough use. We address this possibility by
controlling for the fraction of each country’s population in 2000 with ancestors that came from
Europe.31 As reported in column 12, the estimates remain robust to controlling for European
ancestry.32
Overall, the estimated impact of the plough remains highly robust across the various specifi-
cations reported in Table 3. The coefficient is always negative and statistically significant, and the
point estimates remain stable, ranging from −0.12 to −0.18.
B. Individual-level estimates
We now turn to our specification that examines variation across individuals, linking them to a
tradition of plough agriculture using the district they live in. The analysis relies on data from the
World Value Survey (WVS), a compilation of national individual-level surveys on a wide variety
of topics, including attitudes and preferences, as well as information on standard demographic
characteristics, such as gender, age, education, labor market status, income, religion, etc.33 Using
the WVS we construct, for females, an indicator variable that equals one if she is in the labor
force, which is defined as full-time, part-time or self-employment. Women are not in the labor
force if they report being retired, a housewife or a student.34
We also examine two measures of individuals’ attitudes (male and female) about the appropri-
ate role of women in society. The first measure is based on each respondent’s view of the following
29The data are from version 4 of the Correlates of War Database.30In Table 3, we control for the two types of warfare separately. Including both controls simultaneously does not
alter the conclusion. In this case the coefficient is equal to −16.512 with a standard error of 3.578.31The measure is taken from Nunn and Puga (2011), who calculate the variable using Putterman and Weil’s (2010)
World Migration Matrix.32An alternative, more brut-force strategy, is to omit all European and the neo-European countries (Australia, New
Zealand, Canada, the US) from the sample. As reported in Appendix Table A4, the results also remain robust to thischeck.
33Five waves of the WVS were carried out between 1981 and 2007. In our analysis, we use the four most recent wavesof the survey, since the first wave does not contain information on the district in which the respondent lives. Becauseregional classifications often vary by wave, we use the wave with the most finely defined location data.
34The results are qualitatively identical if we exclude retired women and students from the sample.
24
statement: “When jobs are scarce, men should have more right to a job than women”. The
respondents are then asked to choose between agree, disagree, neither or don’t know. We omit
observations for which the respondents answered ‘neither’ or ‘don’t know’, and code ‘disagree’
as 0 and ‘agree’ as 1.35 Therefore, the constructed variable is increasing in the extent to which a
respondent’s view is characterized by gender inequality.
We also consider a second variable derived from a survey question based on the following
statement: “On the whole, men make better political leaders than women do”. Respondents are
then asked to choose between ‘strongly disagree’, ‘disagree’, ‘agree’, ‘agree strongly’, or ‘don’t
know’. We omit observations in which the respondent answered ‘don’t know’ and create a
variable that takes on the value of 1 for ‘strongly disagree’, 2 for ‘disagree’, 3 for ‘agree’ and
4 for ‘agree strongly’. This variable, like the first, is increasing in the respondent’s view of gender
inequality.
An appealing aspect of the two subjective belief-based variables is that they provide measures
of the values that form the foundation of the objective outcome variables from the cross-country
analysis. The first question reflects differences in individual beliefs about whether women should
have equal access to jobs, which likely affect observed differences in female labor force partici-
pation rates across countries. The second question reflects values about the ability of women to
take on roles of leadership and responsibility, which likely affects observed differences in female
participation in politics and female firm ownership and management. Therefore, there is a close
link between the objective measures from the country-level analysis and the subjective measures
in the individual-level analysis.
Examining the three outcomes – female participation in the labor force, attitudes about female
employment, and attitudes about female leadership – we estimate the following individual-level
equation:
yi,d,c = αr(c) + β Ploughd + XCc Γ + XH
d Π + XiΦ + εi,d,c (3)
where i denotes an individual, d denotes a district within a country c, and r(c) denotes the
continent of country c. Ploughd is our measure of traditional plough use among the ancestors
of individuals living in district d. XCc are the same contemporary country-level controls as in
35We omit observations that respond ‘neither’ because it is ambiguous whether this represents an intermediate viewor whether they have chosen not to answer the question or whether they do not know their answer. If we interpretthis response as reflecting an intermediate position and code a variable that takes on the values 0, 1, and 2, then weobtain qualitatively identical results to what we report here.
25
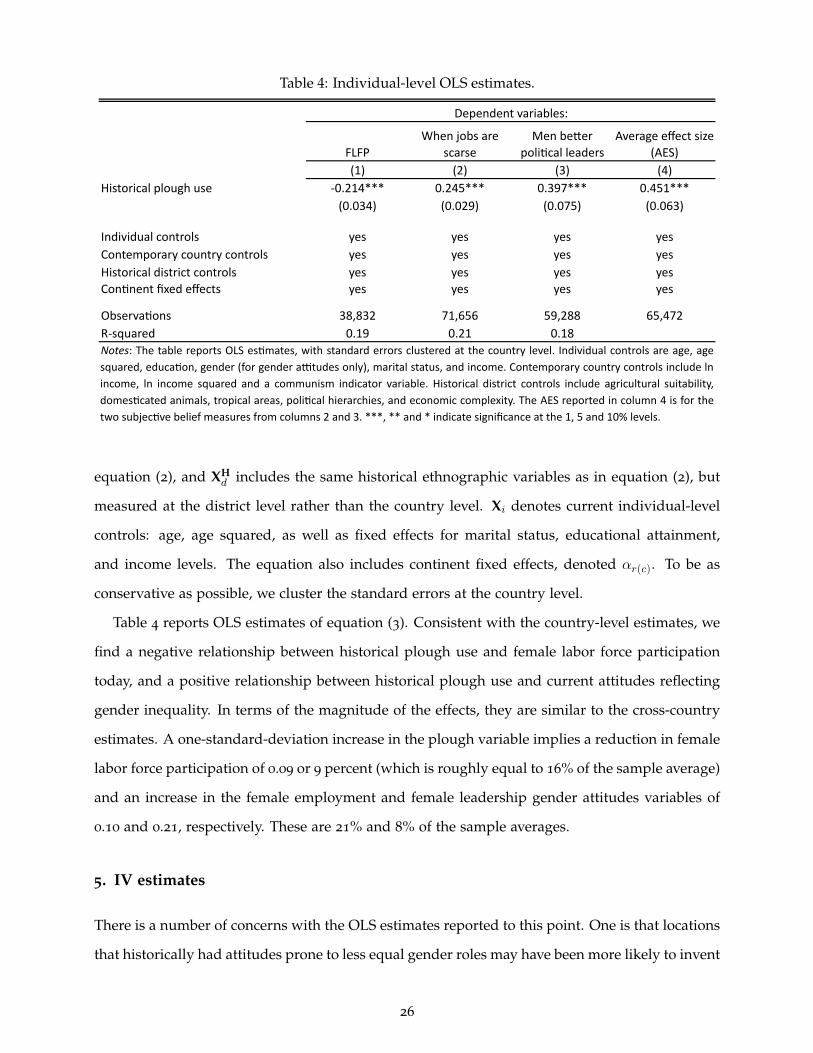
Table 4: Individual-level OLS estimates.
Average effect size (AES)
(1) (2) (3) (4)Historical plough use -‐0.214*** 0.245*** 0.397*** 0.451***
(0.034) (0.029) (0.075) (0.063)
Individual controls yes yes yes yesContemporary country controls yes yes yes yesHistorical district controls yes yes yes yesConJnent fixed effects yes yes yes yes
ObservaJons 38,832 71,656 59,288 65,472R-‐squared 0.19 0.21 0.18Notes: The table reports OLS esJmates, with standard errors clustered at the country level. Individual controls are age, agesquared, educaJon, gender (for gender aXtudes only), marital status, and income. Contemporary country controls include lnincome, ln income squared and a communism indicator variable. Historical district controls include agricultural suitability,domesJcated animals, tropical areas, poliJcal hierarchies, and economic complexity. The AES reported in column 4 is for thetwo subjecJve belief measures from columns 2 and 3. ***, ** and * indicate significance at the 1, 5 and 10% levels.
FLFPWhen jobs are
scarseMen be_er
poliJcal leaders
Dependent variables:
equation (2), and XHd includes the same historical ethnographic variables as in equation (2), but
measured at the district level rather than the country level. Xi denotes current individual-level
controls: age, age squared, as well as fixed effects for marital status, educational attainment,
and income levels. The equation also includes continent fixed effects, denoted αr(c). To be as
conservative as possible, we cluster the standard errors at the country level.
Table 4 reports OLS estimates of equation (3). Consistent with the country-level estimates, we
find a negative relationship between historical plough use and female labor force participation
today, and a positive relationship between historical plough use and current attitudes reflecting
gender inequality. In terms of the magnitude of the effects, they are similar to the cross-country
estimates. A one-standard-deviation increase in the plough variable implies a reduction in female
labor force participation of 0.09 or 9 percent (which is roughly equal to 16% of the sample average)
and an increase in the female employment and female leadership gender attitudes variables of
0.10 and 0.21, respectively. These are 21% and 8% of the sample averages.
5. IV estimates
There is a number of concerns with the OLS estimates reported to this point. One is that locations
that historically had attitudes prone to less equal gender roles may have been more likely to invent
26
or adopt the plough. This would bias our OLS estimates away from zero. It is also possible that
locations that were economically more developed were more likely to have adopted the plough.
Since these areas today are richer and more prone to attitudes about gender role equality, this
would tend to bias our OLS towards zero.
Our first strategy to address these, and related, concerns is to control for observable character-
istics. This is done in the previous section. In this section, we pursue an alternative strategy using
instrumental variables. As instruments we exploit one determinant of historical plough use that
has been emphasized in the anthropological literature: the type of crops grown in a particular
location (Pryor, 1985).
The primary benefit of the plough is that it facilitates the cultivation of larger amounts of
land over a shorter period of time. This capability is more advantageous for crops that require
specific planting conditions that are only met during narrow windows of time or for crops that
require larger tracts of land to cultivate a given amount of calories. The benefit of the plough
is also reduced for crops grown in swampy, sloped, rocky, or shallow soils, all of which make
the plough less efficient or impossible to use. Taking these factors into consideration, Pryor
(1985) has classified crops into those whose cultivation benefits greatly from the adoption of the
plough – he calls these plough positive crops – and those whose cultivation benefits less – called
plough-negative crops. Plough-positive crops, which include wheat, teff, barley and rye, tend to
be cultivated on large expanses of land (per calorie of output) that is flat, deep, with soil that
are not too rocky or swampy, and have shorter growing seasons. Plough negative crops, which
include sorghum, maize, millet, roots and tubers, and tree crops, tend to yield more calories per
acre, have longer growing seasons, and can be cultivated on more marginal land (Pryor, 1985, p.
732).
Because the cultivation of plough-positive and plough-negative crops is an endogenous out-
come, we do not use this as our instrument. Instead, we measure geo-climatic conditions that
are unaffected by human actions, but which impact the suitability of a location for growing both
types of crops. Our strategy uses two instruments. The first is a measure of the average suitability
of the location of each observation’s ancestors for cultivating plough positive cereal crops – wheat,
barley and rye. The second is the same measure of ancestral suitability, but for cultivating millet
and sorghum, which are plough-negative cereal crops. We intentionally choose to consider this
set of crops because they are similar in many other dimensions except for the extent to which
27
they benefit from the use of the plough. Both sets of crops are cereals that have been cultivated in
the Eastern Hemisphere since the Neolithic revolution (Mazoyer and Roudart, 2006, pp. 71–99).
Both sets of crops require similar preparations for consumption, all being used for flour, porridge,
bread or in beverages (Recklein, 1987). Both sets also produce similar yields and therefore neither
clearly dominates the other in terms of the population it can support (Pryor, 1985, p. 732).
We obtain information on the suitability of a location for cultivating the plough-positive and
plough-negative cereal crops from the FAO’s Global Agro-Ecological Zones (GAEZ) 2002 database
(Fischer et al., 2002). The database reports suitability for the cultivation of numerous crops for 5
arc minutes by 5 arc-minute grid-cell globally. The measures are constructed from measures of the
geo-climatic characteristics of a location: precipitation, frequency of wet days, mean temperature,
daily temperature range, vapor pressure, cloud cover, sunshine, ground-frost frequency, wind
speed, soil slope, and soil characteristics. The data are then combined with the specific growing
requirements of crops to produce a measure of whether the crop can be grown in a location, and
if so, how productively. It is important to note that the models of crop growth are based solely
on previously established technical requirements and constraints for crop growth. The model’s
parameters, and the final measures, are not affected by where crops are actually cultivated. As
well, the final estimates are not simple functions of the geographic characteristics used, but are
based on precise, highly non-linear crop-specific models of evapotranspiration, water-balance,
temperature profiles, temperature growing periods, length of growing period, thermal regimes,
etc. This last point is particularly important as it allows us to check the robustness of our IV results
to controlling for important geo-climatic characteristics which may be different in plough-positive
and plough-negative environments.36
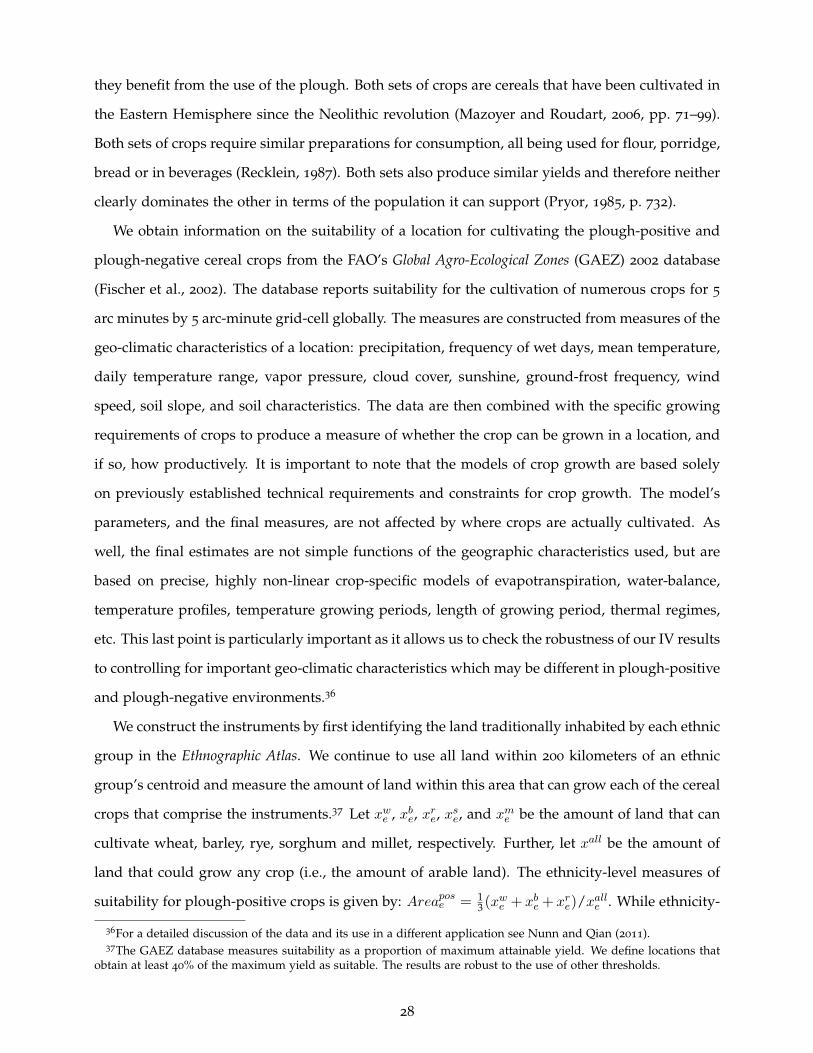
We construct the instruments by first identifying the land traditionally inhabited by each ethnic
group in the Ethnographic Atlas. We continue to use all land within 200 kilometers of an ethnic
group’s centroid and measure the amount of land within this area that can grow each of the cereal
crops that comprise the instruments.37 Let xwe , xbe, xre, xse, and xme be the amount of land that can
cultivate wheat, barley, rye, sorghum and millet, respectively. Further, let xall be the amount of
land that could grow any crop (i.e., the amount of arable land). The ethnicity-level measures of
suitability for plough-positive crops is given by: Areapose = 13 (x
we + xbe+ xre)/xalle . While ethnicity-
36For a detailed discussion of the data and its use in a different application see Nunn and Qian (2011).37The GAEZ database measures suitability as a proportion of maximum attainable yield. We define locations that
obtain at least 40% of the maximum yield as suitable. The results are robust to the use of other thresholds.
28
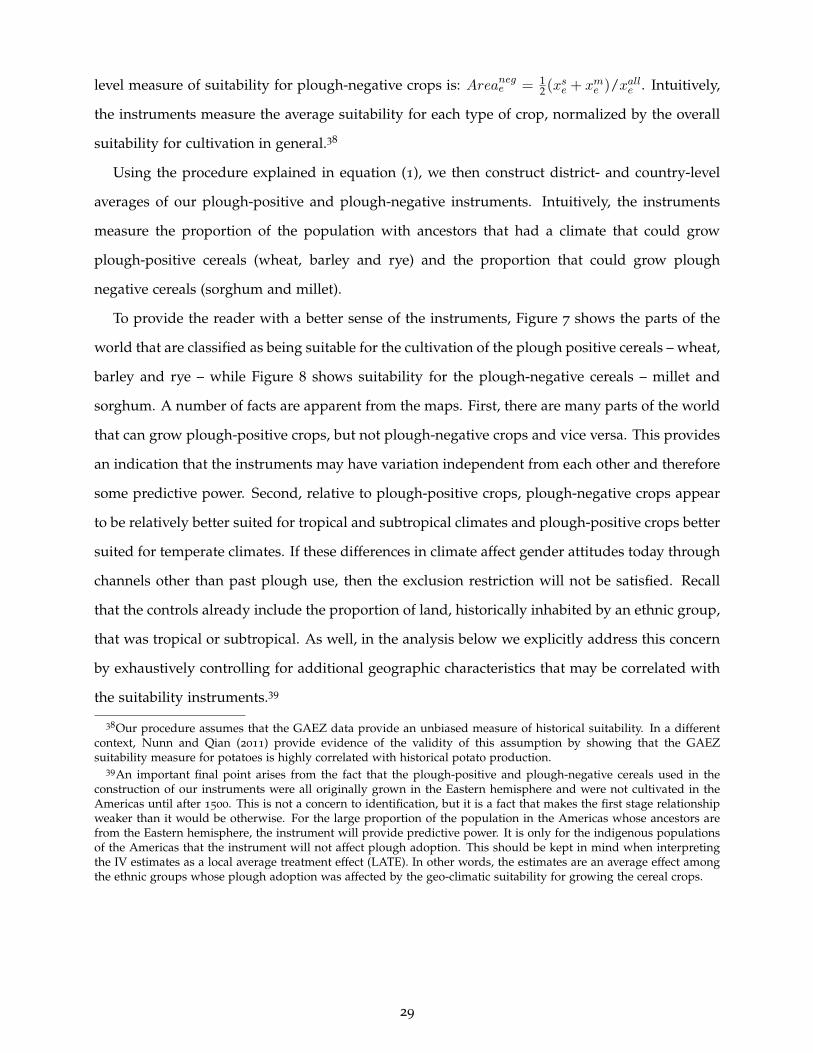
level measure of suitability for plough-negative crops is: Areanege = 12 (x
se + xme )/xalle . Intuitively,
the instruments measure the average suitability for each type of crop, normalized by the overall
suitability for cultivation in general.38
Using the procedure explained in equation (1), we then construct district- and country-level
averages of our plough-positive and plough-negative instruments. Intuitively, the instruments
measure the proportion of the population with ancestors that had a climate that could grow
plough-positive cereals (wheat, barley and rye) and the proportion that could grow plough
negative cereals (sorghum and millet).
To provide the reader with a better sense of the instruments, Figure 7 shows the parts of the
world that are classified as being suitable for the cultivation of the plough positive cereals – wheat,
barley and rye – while Figure 8 shows suitability for the plough-negative cereals – millet and
sorghum. A number of facts are apparent from the maps. First, there are many parts of the world
that can grow plough-positive crops, but not plough-negative crops and vice versa. This provides
an indication that the instruments may have variation independent from each other and therefore
some predictive power. Second, relative to plough-positive crops, plough-negative crops appear
to be relatively better suited for tropical and subtropical climates and plough-positive crops better
suited for temperate climates. If these differences in climate affect gender attitudes today through
channels other than past plough use, then the exclusion restriction will not be satisfied. Recall
that the controls already include the proportion of land, historically inhabited by an ethnic group,
that was tropical or subtropical. As well, in the analysis below we explicitly address this concern
by exhaustively controlling for additional geographic characteristics that may be correlated with
the suitability instruments.39
38Our procedure assumes that the GAEZ data provide an unbiased measure of historical suitability. In a differentcontext, Nunn and Qian (2011) provide evidence of the validity of this assumption by showing that the GAEZsuitability measure for potatoes is highly correlated with historical potato production.
39An important final point arises from the fact that the plough-positive and plough-negative cereals used in theconstruction of our instruments were all originally grown in the Eastern hemisphere and were not cultivated in theAmericas until after 1500. This is not a concern to identification, but it is a fact that makes the first stage relationshipweaker than it would be otherwise. For the large proportion of the population in the Americas whose ancestors arefrom the Eastern hemisphere, the instrument will provide predictive power. It is only for the indigenous populationsof the Americas that the instrument will not affect plough adoption. This should be kept in mind when interpretingthe IV estimates as a local average treatment effect (LATE). In other words, the estimates are an average effect amongthe ethnic groups whose plough adoption was affected by the geo-climatic suitability for growing the cereal crops.
29
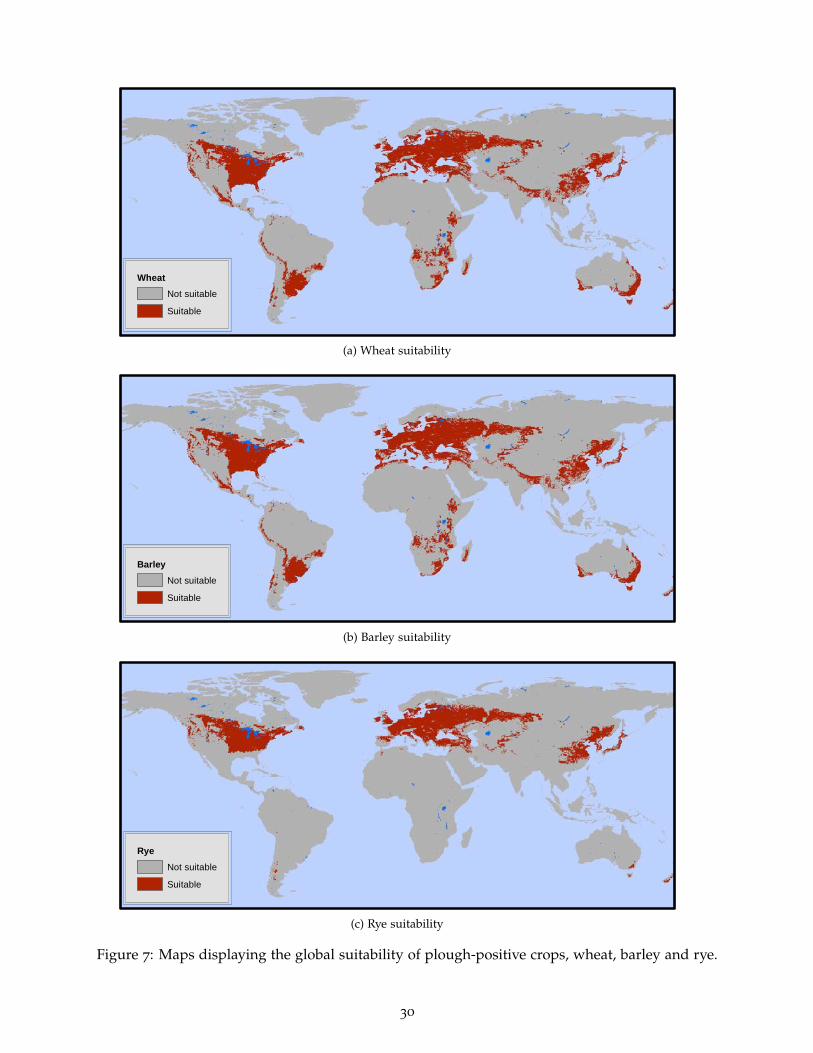
WheatNot suitableSuitable
(a) Wheat suitability
BarleyNot suitableSuitable
(b) Barley suitability
RyeNot suitableSuitable
(c) Rye suitability
Figure 7: Maps displaying the global suitability of plough-positive crops, wheat, barley and rye.
30
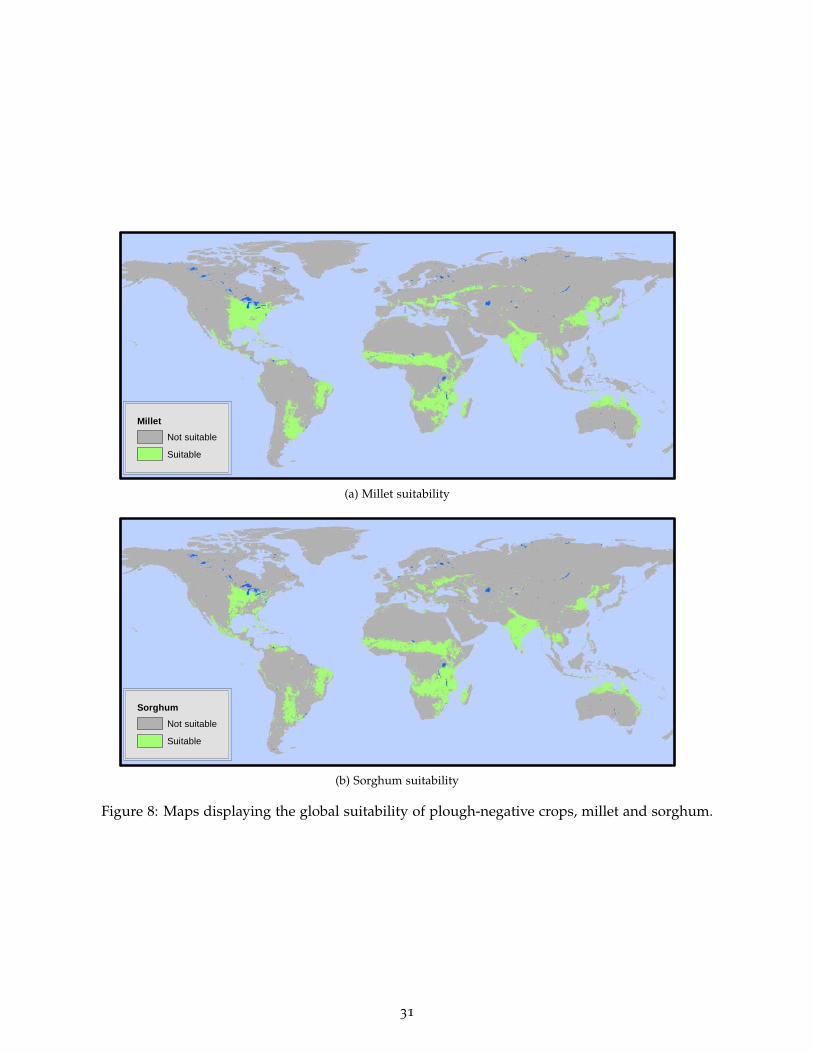
MilletNot suitableSuitable
(a) Millet suitability
SorghumNot suitableSuitable
(b) Sorghum suitability
Figure 8: Maps displaying the global suitability of plough-negative crops, millet and sorghum.
31
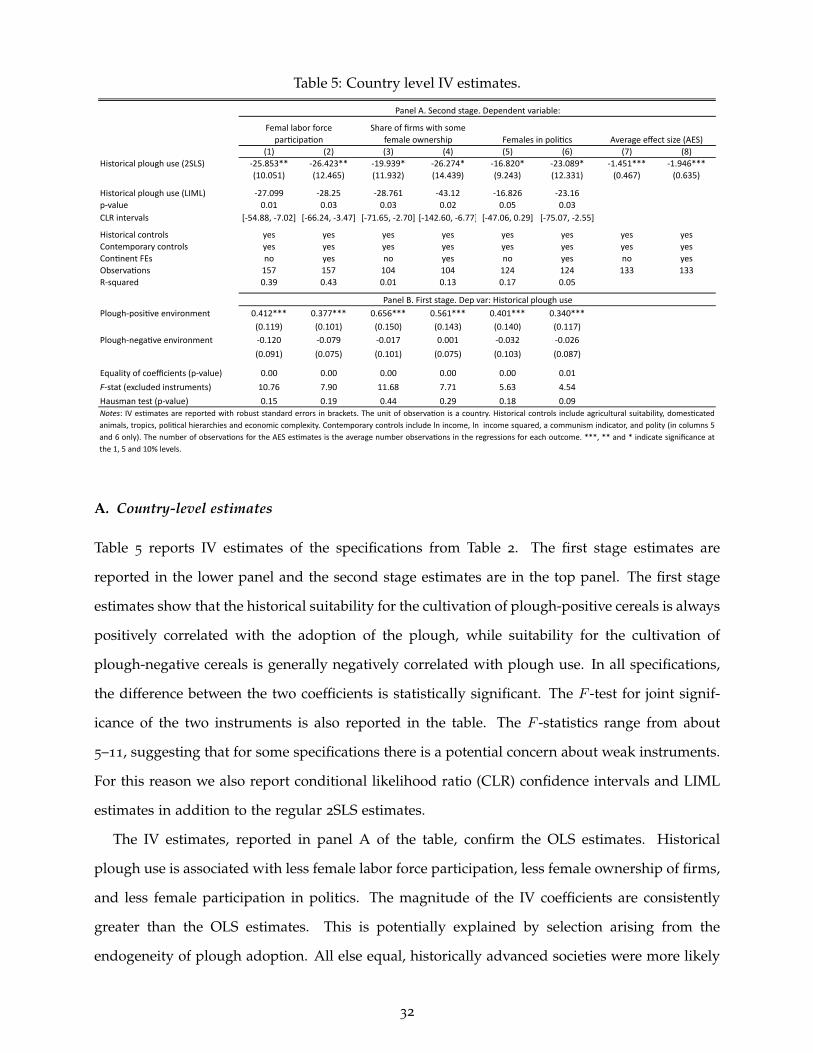
Table 5: Country level IV estimates.
(1) (2) (3) (4) (5) (6) (7) (8)Historical plough use (2SLS) -‐25.853** -‐26.423** -‐19.939* -‐26.274* -‐16.820* -‐23.089* -‐1.451*** -‐1.946***
(10.051) (12.465) (11.932) (14.439) (9.243) (12.331) (0.467) (0.635)
Historical plough use (LIML) -‐27.099 -‐28.25 -‐28.761 -‐43.12 -‐16.826 -‐23.16p-‐value 0.01 0.03 0.03 0.02 0.05 0.03CLR intervals [-‐54.88, -‐7.02] [-‐66.24, -‐3.47] [-‐71.65, -‐2.70] [-‐142.60, -‐6.77] [-‐47.06, 0.29] [-‐75.07, -‐2.55]
Historical controls yes yes yes yes yes yes yes yesContemporary controls yes yes yes yes yes yes yes yesConLnent FEs no yes no yes no yes no yesObservaLons 157 157 104 104 124 124 133 133R-‐squared 0.39 0.43 0.01 0.13 0.17 0.05
Plough-‐posiLve environment 0.412*** 0.377*** 0.656*** 0.561*** 0.401*** 0.340***(0.119) (0.101) (0.150) (0.143) (0.140) (0.117)
Plough-‐negaLve environment -‐0.120 -‐0.079 -‐0.017 0.001 -‐0.032 -‐0.026
(0.091) (0.075) (0.101) (0.075) (0.103) (0.087)
Equality of coefficients (p-‐value) 0.00 0.00 0.00 0.00 0.00 0.01
F-‐stat (excluded instruments) 10.76 7.90 11.68 7.71 5.63 4.54
Hausman test (p-‐value) 0.15 0.19 0.44 0.29 0.18 0.09Notes: IV esLmates are reported with robust standard errors in brackets. The unit of observaLon is a country. Historical controls include agricultural suitability, domesLcatedanimals, tropics, poliLcal hierarchies and economic complexity. Contemporary controls include ln income, ln income squared, a communism indicator, and polity (in columns 5and 6 only). The number of observaLons for the AES esLmates is the average number observaLons in the regressions for each outcome. ***, ** and * indicate significance atthe 1, 5 and 10% levels.
Panel A. Second stage. Dependent variable:
Panel B. First stage. Dep var: Historical plough use
Average effect size (AES)Femal labor force parLcipaLon
Share of firms with some female ownership Females in poliLcs
A. Country-level estimates
Table 5 reports IV estimates of the specifications from Table 2. The first stage estimates are
reported in the lower panel and the second stage estimates are in the top panel. The first stage
estimates show that the historical suitability for the cultivation of plough-positive cereals is always
positively correlated with the adoption of the plough, while suitability for the cultivation of
plough-negative cereals is generally negatively correlated with plough use. In all specifications,
the difference between the two coefficients is statistically significant. The F -test for joint signif-
icance of the two instruments is also reported in the table. The F -statistics range from about
5–11, suggesting that for some specifications there is a potential concern about weak instruments.
For this reason we also report conditional likelihood ratio (CLR) confidence intervals and LIML
estimates in addition to the regular 2SLS estimates.
The IV estimates, reported in panel A of the table, confirm the OLS estimates. Historical
plough use is associated with less female labor force participation, less female ownership of firms,
and less female participation in politics. The magnitude of the IV coefficients are consistently
greater than the OLS estimates. This is potentially explained by selection arising from the
endogeneity of plough adoption. All else equal, historically advanced societies were more likely
32
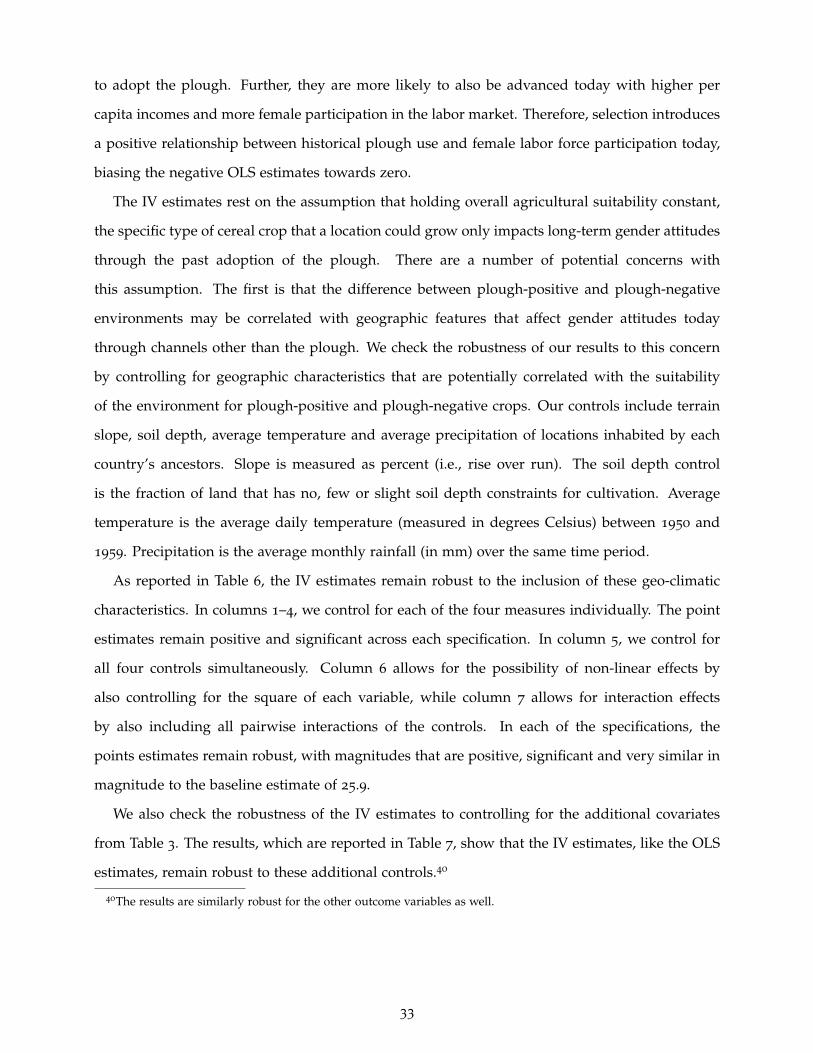
to adopt the plough. Further, they are more likely to also be advanced today with higher per
capita incomes and more female participation in the labor market. Therefore, selection introduces
a positive relationship between historical plough use and female labor force participation today,
biasing the negative OLS estimates towards zero.
The IV estimates rest on the assumption that holding overall agricultural suitability constant,
the specific type of cereal crop that a location could grow only impacts long-term gender attitudes
through the past adoption of the plough. There are a number of potential concerns with
this assumption. The first is that the difference between plough-positive and plough-negative
environments may be correlated with geographic features that affect gender attitudes today
through channels other than the plough. We check the robustness of our results to this concern
by controlling for geographic characteristics that are potentially correlated with the suitability
of the environment for plough-positive and plough-negative crops. Our controls include terrain
slope, soil depth, average temperature and average precipitation of locations inhabited by each
country’s ancestors. Slope is measured as percent (i.e., rise over run). The soil depth control
is the fraction of land that has no, few or slight soil depth constraints for cultivation. Average
temperature is the average daily temperature (measured in degrees Celsius) between 1950 and
1959. Precipitation is the average monthly rainfall (in mm) over the same time period.
As reported in Table 6, the IV estimates remain robust to the inclusion of these geo-climatic
characteristics. In columns 1–4, we control for each of the four measures individually. The point
estimates remain positive and significant across each specification. In column 5, we control for
all four controls simultaneously. Column 6 allows for the possibility of non-linear effects by
also controlling for the square of each variable, while column 7 allows for interaction effects
by also including all pairwise interactions of the controls. In each of the specifications, the
points estimates remain robust, with magnitudes that are positive, significant and very similar in
magnitude to the baseline estimate of 25.9.
We also check the robustness of the IV estimates to controlling for the additional covariates
from Table 3. The results, which are reported in Table 7, show that the IV estimates, like the OLS
estimates, remain robust to these additional controls.40
40The results are similarly robust for the other outcome variables as well.
33
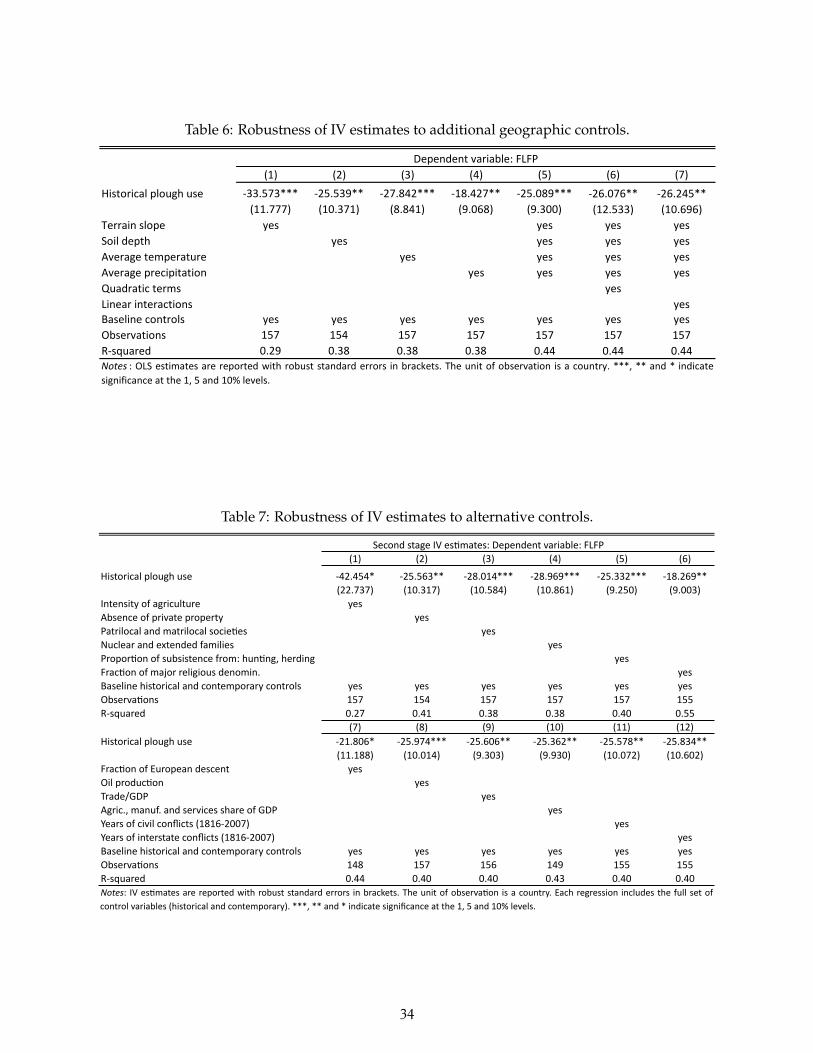
Table 6: Robustness of IV estimates to additional geographic controls.
(1) (2) (3) (4) (5) (6) (7)
Historical plough use -33.573*** -25.539** -27.842*** -18.427** -25.089*** -26.076** -26.245**(11.777) (10.371) (8.841) (9.068) (9.300) (12.533) (10.696)
Terrain slope yes yes yes yesSoil depth yes yes yes yesAverage temperature yes yes yes yesAverage precipitation yes yes yes yesQuadratic terms yesLinear interactions yesBaseline controls yes yes yes yes yes yes yesObservations 157 154 157 157 157 157 157R-squared 0.29 0.38 0.38 0.38 0.44 0.44 0.44Notes : OLS estimates are reported with robust standard errors in brackets. The unit of observation is a country. ***, ** and * indicatesignificance at the 1, 5 and 10% levels.
Dependent variable: FLFP
Table 7: Robustness of IV estimates to alternative controls.
(1) (2) (3) (4) (5) (6)
Historical plough use -‐42.454* -‐25.563** -‐28.014*** -‐28.969*** -‐25.332*** -‐18.269**(22.737) (10.317) (10.584) (10.861) (9.250) (9.003)
Intensity of agriculture yesAbsence of private property yesPatrilocal and matrilocal socieIes yesNuclear and extended families yesProporIon of subsistence from: hunIng, herding yesFracIon of major religious denomin. yesBaseline historical and contemporary controls yes yes yes yes yes yesObservaIons 157 154 157 157 157 155R-‐squared 0.27 0.41 0.38 0.38 0.40 0.55
(7) (8) (9) (10) (11) (12)Historical plough use -‐21.806* -‐25.974*** -‐25.606** -‐25.362** -‐25.578** -‐25.834**
(11.188) (10.014) (9.303) (9.930) (10.072) (10.602)FracIon of European descent yesOil producIon yesTrade/GDP yesAgric., manuf. and services share of GDP yesYears of civil conflicts (1816-‐2007) yesYears of interstate conflicts (1816-‐2007) yesBaseline historical and contemporary controls yes yes yes yes yes yesObservaIons 148 157 156 149 155 155R-‐squared 0.44 0.40 0.40 0.43 0.40 0.40
Second stage IV esImates: Dependent variable: FLFP
Notes: IV esImates are reported with robust standard errors in brackets. The unit of observaIon is a country. Each regression includes the full set ofcontrol variables (historical and contemporary). ***, ** and * indicate significance at the 1, 5 and 10% levels.
34
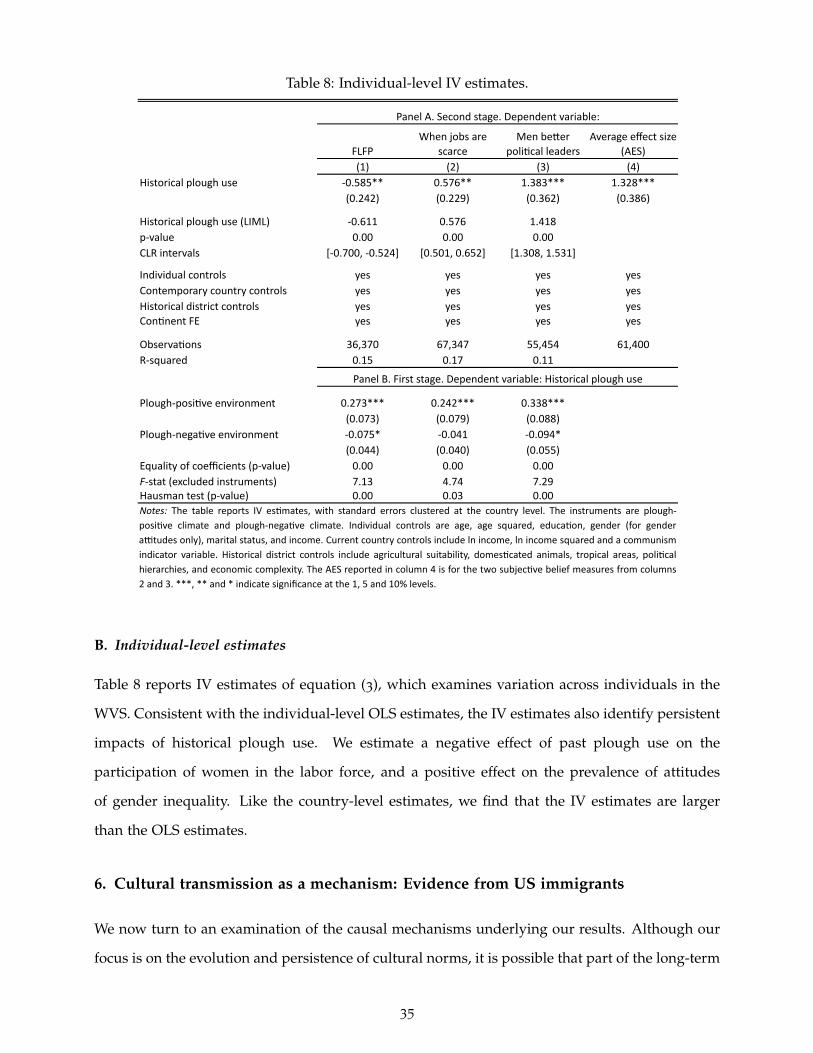
Table 8: Individual-level IV estimates.
When jobs are scarce
Men be.er poli2cal leaders
Average effect size (AES)
(1) (2) (3) (4)Historical plough use -‐0.585** 0.576** 1.383*** 1.328***
(0.242) (0.229) (0.362) (0.386)
Historical plough use (LIML) -‐0.611 0.576 1.418p-‐value 0.00 0.00 0.00CLR intervals [-‐0.700, -‐0.524] [0.501, 0.652] [1.308, 1.531]
Individual controls yes yes yes yesContemporary country controls yes yes yes yesHistorical district controls yes yes yes yesCon2nent FE yes yes yes yes
Observa2ons 36,370 67,347 55,454 61,400R-‐squared 0.15 0.17 0.11
Plough-‐posi2ve environment 0.273*** 0.242*** 0.338***(0.073) (0.079) (0.088)
Plough-‐nega2ve environment -‐0.075* -‐0.041 -‐0.094*(0.044) (0.040) (0.055)
Equality of coefficients (p-‐value) 0.00 0.00 0.00F-‐stat (excluded instruments) 7.13 4.74 7.29Hausman test (p-‐value) 0.00 0.03 0.00
Panel B. First stage. Dependent variable: Historical plough use
Notes: The table reports IV es2mates, with standard errors clustered at the country level. The instruments are plough-‐posi2ve climate and plough-‐nega2ve climate. Individual controls are age, age squared, educa2on, gender (for genderactudes only), marital status, and income. Current country controls include ln income, ln income squared and a communismindicator variable. Historical district controls include agricultural suitability, domes2cated animals, tropical areas, poli2calhierarchies, and economic complexity. The AES reported in column 4 is for the two subjec2ve belief measures from columns2 and 3. ***, ** and * indicate significance at the 1, 5 and 10% levels.
Panel A. Second stage. Dependent variable:
FLFP
B. Individual-level estimates
Table 8 reports IV estimates of equation (3), which examines variation across individuals in the
WVS. Consistent with the individual-level OLS estimates, the IV estimates also identify persistent
impacts of historical plough use. We estimate a negative effect of past plough use on the
participation of women in the labor force, and a positive effect on the prevalence of attitudes
of gender inequality. Like the country-level estimates, we find that the IV estimates are larger
than the OLS estimates.
6. Cultural transmission as a mechanism: Evidence from US immigrants
We now turn to an examination of the causal mechanisms underlying our results. Although our
focus is on the evolution and persistence of cultural norms, it is possible that part of the long-term
35
effect of the plough may have arisen because it led to the development of institutions and markets
which are less conducive to the participation of women in activities outside of the domestic
sphere. Through this channel, the plough causes less female participation in market activities
because it affects the costs and benefits of these activities, not because it affects individuals’
beliefs about whether these are appropriate activities for women.
Our individual-level estimates, showing an impact of the plough on gender-role attitudes,
provide evidence that the plough has impacted beliefs and values. However, these effects may
have resulted from differences in external factors (e.g., institutions, policies, markets, etc), which
in turn shape individual beliefs. To better isolate the causal impact of the plough on individual
beliefs and values, we examine variation among second-generation immigrants – a group of
individuals from diverse cultural backgrounds with different histories of ancestral plough use,
but facing the same external environment, including markets, institutions and policies. Using
data from the March Supplement of the Current Population Survey (CPS), we examine whether
women with an ancestry of plough agriculture are less likely to be in the labor force today.41
We identify the ancestry of women in the sample using their parents’ country-of-birth, measured
using either the mother’s country of birth, the father’s country of birth, or both parents’ country
of birth (after restricting the sample to those with parents that have the same country of birth).
One benefit of the different definitions of ancestry is that it allows us to examine whether cultural
transmission is stronger from the father to the daughter, the mother to the daughter, or when
both occur together.
Our analysis examines two samples of women, one that includes all women aged 15 to 64 and
another that only includes married women in the same age group. When we examine married
women only, we are able to also examine the impact of traditional plough use working through
the husband’s lineage. We identify a tradition of plough use among the husband’s ancestor using
either his father’s country of birth, his mother’s country of birth, or both.
We estimate the impact of the plough on immigrant populations using the following equation:
yi,s,c = αs + β Ploughc + XCc Γ + XH
c Π + XiΦ + εi,s,c (4)
where i denotes a second-generation woman currently living in state s, whose country of origin
is country c. As in equation (2), Ploughc denotes the historical plough-use of those in country
41Starting in 1994, the CPS asks individuals about their country of origin and their parents’ country of origin. Weuse all the years available since 1994.
36
c. αs denote state fixed effects. The dependent variable, yi,s,c, is an indicator variable that equals
one if individual i is in the labor market. XCc and XH
c denote the same vectors of covariates as
in equation (2), which include current and historical ethnographic controls. Xi indicates a vector
of individual level controls, which includes dummies for education, a quadratic for age, real
personal income, marital status, fixed effects for whether the person lives in a metropolitan or
rural area, and fixed effects for the year of the survey. When we use the sample of married women
we also include controls for characteristics of the husband: a quadratic of the husband’s age, the
husband’s education, and his income. Because our variable of interest Ploughc only varies at the
country of origin-level, we cluster all standard errors at this level.
The OLS estimates are reported in Table 9. Columns 1–3 report estimates using the full sample
of women. Column 1 identifies the women’s ancestry by her father’s country of birth, while
column 2 uses the mother’s country of birth. In column 3, we restrict the sample to women
whose parents were both born in the same country. For all three specifications, we estimate a
negative relationship between a tradition of plough-use in the home country and the women’s
participation in the labor force. IV estimates of the same specifications, reported in columns 1–3
of Table 10, yield nearly identical results.
Columns 4–9 of Tables 9 and 10 report OLS and IV estimates using the sample of married
women. Columns 4–6 reproduce the estimates of columns 1–3 for the sample of married women,
when we identify ancestry using the wife’s parents. We continue to find a negative impact
of traditional plough use on female labor force participation, although we now find a smaller
estimated impact when we identify ancestry using the father’s country of birth. The impact is
roughly 50% lower for both the OLS and IV estimates. This provides evidence that, at least for
the subsample of married women, the transmission of values and beliefs (originating from the
plough) is stronger from mothers to daughters than from fathers to daughters.
We next consider the possibility that a married woman’s participation in the labor market may
be influenced by her husband’s beliefs and values, which were transmitted from his parents and
their cultural background. Columns 7–9 of Tables 9 and 10, reproduce the estimates of columns
4–6 from the same tables, when we identify ancestry using the husband’s parents rather than the
wife’s parents. The estimates provide evidence for an impact of a history of plough use among
the husband’s ancestors on the wife’s participation in the labor market. Differentiating between
the husband’s parent’s and their ancestry, we find a weaker estimate when we use the husband’s
37

Tabl
e9:I
mm
igra
ntO
LSre
gres
sion
s.
Father's
coun
try
Mothe
r's
coun
try
Parents same
coun
try
Father's
coun
try
Mothe
r's
coun
try
Parents same
coun
try
Father's
coun
try
Mothe
r's
coun
try
Parents same
coun
try
(1)
(2)
(3)
(4)
(5)
(6)
(7)
(8)
(9)
Historical plough use
-‐0.042***
-‐0.047***
-‐0.065***
-‐0.015
-‐0.043
*-‐0.044
*-‐0.027
-‐0.049**
-‐0.047**
(0.011
)(0.012
)(0.013
)(0.021
)(0.022
)(0.024
)(0.018
)(0.024
)(0.022
)
Individu
al con
trols
yes
yes
yes
yes
yes
yes
yes
yes
yes
Husband
con
trols
n/a
n/a
n/a
yes
yes
yes
yes
yes
yes
Historical cou
ntry con
trols
yes
yes
yes
yes
yes
yes
yes
yes
yes
Contem
porary cou
ntry con
trols
yes
yes
yes
yes
yes
yes
yes
yes
yes
State fixed
effe
cts
yes
yes
yes
yes
yes
yes
yes
yes
yes
ObservaQo
ns48,910
47,219
27,550
8,864
8,261
5,832
9,505
8,886
7,211
R-‐squared
0.37
0.38
0.40
0.37
0.37
0.39
0.37
0.37
0.38
All wom
en
Notes:O
LSesQm
ates
arerepo
rted
with
standard
errorsclusteredat
thecoun
trylevel.Anob
servaQ
onisaUSsecond
gene
raQo
nim
migrant
wom
an.Ind
ividualcon
trolsinclud
eage,age
squared,
educaQ
on,m
arita
lstatusandincome.
Husband
controlsinclud
ehu
sband'sage,
agesquared,
educaQ
onandincome.
Historicalcou
ntry
controlsinclud
etheorigin
coun
try's
historicalagricultu
ralsuitability,do
mesQcaQ
onof
anim
als,trop
ics,po
liQcalhierarchies
andecon
omiccomplexity.C
ontempo
rary
coun
trycontrolsinclud
eln
income,ln
incomesquared,
and a commun
ism indicator variable. A
ll regression
s also con
trol fo
r state, year and metropo
litan area fixed
effe
cts. ***, ** and * indicate significance at the
1, 5 and
10%
levels.
Dep
ende
nt variable: Labor fo
rce parQcipaQo
n indicator
Married
wom
en
Wom
en's ancestry
Husband
's ancestry
Wom
en's ancestry
38
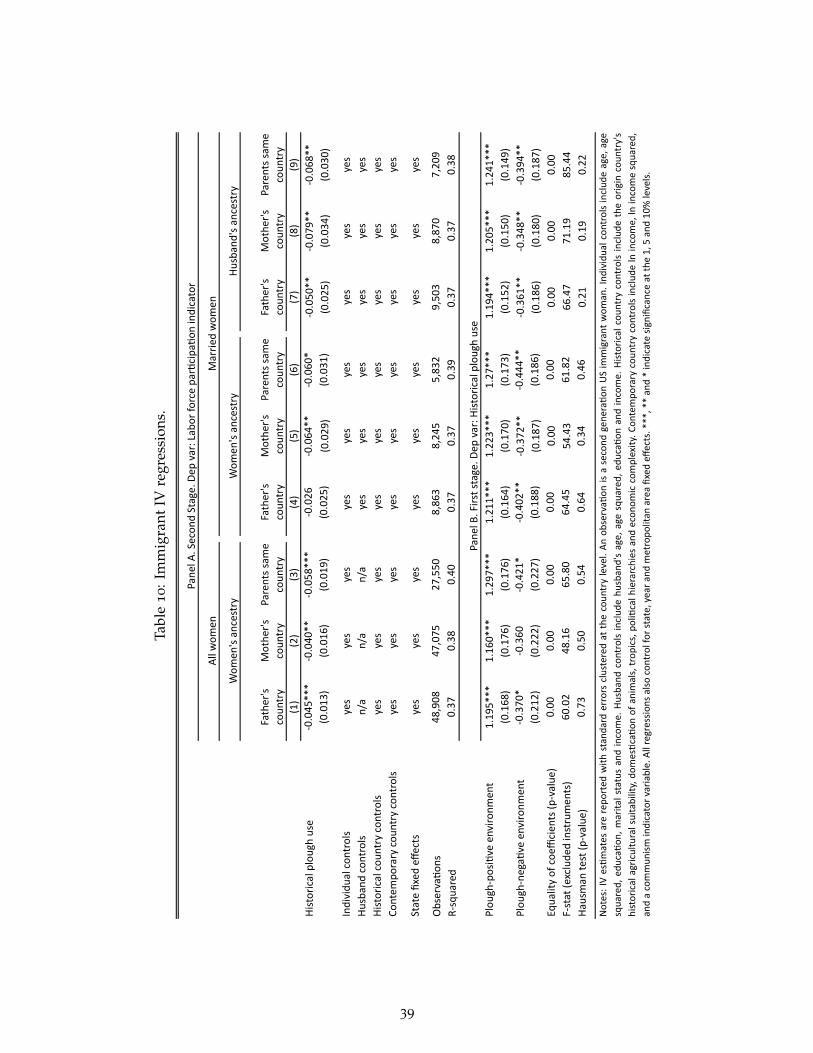
Tabl
e10:I
mm
igra
ntIV
regr
essi
ons.
Father's
coun
try
Mothe
r's
coun
try
Parents same
coun
try
Father's
coun
try
Mothe
r's
coun
try
Parents same
coun
try
Father's
coun
try
Mothe
r's
coun
try
Parents same
coun
try
(1)
(2)
(3)
(4)
(5)
(6)
(7)
(8)
(9)
Historical plough use
-‐0.045***
-‐0.040**
-‐0.058***
-‐0.026
-‐0.064**
-‐0.060
*-‐0.050**
-‐0.079**
-‐0.068**
(0.013
)(0.016
)(0.019
)(0.025
)(0.029
)(0.031
)(0.025
)(0.034
)(0.030
)
Individu
al con
trols
yes
yes
yes
yes
yes
yes
yes
yes
yes
Husband
con
trols
n/a
n/a
n/a
yes
yes
yes
yes
yes
yes
Historical cou
ntry con
trols
yes
yes
yes
yes
yes
yes
yes
yes
yes
Contem
porary cou
ntry con
trols
yes
yes
yes
yes
yes
yes
yes
yes
yes
State fixed
effe
cts
yes
yes
yes
yes
yes
yes
yes
yes
yes
ObservaQo
ns48,908
47,075
27,550
8,863
8,245
5,832
9,503
8,870
7,209
R-‐squared
0.37
0.38
0.40
0.37
0.37
0.39
0.37
0.37
0.38
Plou
gh-‐posiQve enviro
nment
1.195***
1.160***
1.297***
1.211***
1.223***
1.27***
1.194***
1.205***
1.241***
(0.168
)(0.176
)(0.176
)(0.164
)(0.170
)(0.173
)(0.152
)(0.150
)(0.149
)Plou
gh-‐negaQ
ve enviro
nmen
t-‐0.370
*-‐0.360
-‐0.421
*-‐0.402**
-‐0.372**
-‐0.444**
-‐0.361**
-‐0.348**
-‐0.394**
(0.212
)(0.222
)(0.227
)(0.188
)(0.187
)(0.186
)(0.186
)(0.180
)(0.187
)Equality of coe
fficien
ts (p
-‐value
)0.00
0.00
0.00
0.00
0.00
0.00
0.00
0.00
0.00
F-‐stat (exclude
d instrumen
ts)
60.02
48.16
65.80
64.45
54.43
61.82
66.47
71.19
85.44
Hausm
an te
st (p
-‐value
)0.73
0.50
0.54
0.64
0.34
0.46
0.21
0.19
0.22
Notes:IVesQm
ates
arerepo
rted
with
standard
errors
clusteredat
thecoun
trylevel.Anob
servaQ
onisasecond
gene
raQo
nUSim
migrant
wom
an.Ind
ividualcon
trolsinclud
eage,
age
squared,
educaQ
on,marita
lstatusandincome.
Husband
controlsinclud
ehu
sband'sage,
agesquared,
educaQ
onandincome.
Historicalcou
ntry
controlsinclud
etheorigin
coun
try's
historicalagricultu
ralsuitability,do
mesQcaQ
onof
anim
als,trop
ics,po
liQcalh
ierarchies
andecon
omiccomplexity.C
ontempo
rary
coun
trycontrolsinclud
eln
income,
lnincomesquared,
and a commun
ism indicator variable. A
ll regression
s also con
trol fo
r state, year and metropo
litan area fixed
effe
cts. ***, ** and * indicate significance at the
1, 5 and
10%
levels.
Pane
l B. First stage. D
ep var: H
istorical plough use
Pane
l A. Secon
d Stage. Dep
var: Labor fo
rce parQcipaQo
n indicator
All wom
enMarried
wom
en
Wom
en's ancestry
Wom
en's ancestry
Husband
's ancestry
39
father’s country of birth than the husband’s mother’s country of birth. Like the case for the
women’s parents, these estimates identify weaker transmission from the father than from the
mother. In other words, the transmission of beliefs about gender appears stronger from mothers
(than fathers), whether it is from the wife’s mother to the wife or the husband’s mother to the
husband.
It is also interesting that, in every specification, the estimated impact of the plough transmitted
through the husband’s parents is stronger than the impact of the plough transmitted through the
wife’s parents (i.e., compare columns 4–6 with 7–8). This suggests that the beliefs of the husband
are at least as important, if not more important, than the beliefs of the wife in determining
whether she enters the labor force. This result is consistent with the previous findings of
Fernandez and Fogli (2009).
Comparing the magnitude of the immigrant estimates with the country-level estimates allows
us to glean some evidence of the relative importance of cultural transmission, relative to other
channels, in explaining the relationship between historical plough use and female labor force
participation. The impact of the plough on US second-generation immigrant women is much
smaller than the estimated impact from the country-level regressions. Consider the estimated
impact on female labor force participation from a one-unit change in historical plough use (i.e.,
an increase zero to one). Using the country-level OLS estimates (column 1 of Table 2), this is
associated with an increase in FLFP by 16 percentage points. The individual-level estimates
(column 1 of Table 4) suggest impacts of a similar magnitude: 21 percentage points. However, the
magnitudes based on the immigrant-level estimates are much smaller in magnitude, ranging from
4 to 6 percentage points (columns 1–9 of Table 9). Although one must interpret these findings
with caution, the relative magnitudes suggest that internal norms (identified in the immigrant
regressions) account for approximately a quarter to a third of the overall impact of the plough on
gender roles.
7. Conclusions
Social anthropologists have long-considered the use of shifting hoe cultivation vs. plough cultiva-
tion as an important determinant of the evolution and persistence of traditional gender roles and
norms. We formally test this hypothesis by combining ethnographic data on traditional plough
40
use, measured at the ethnicity level, with contemporary data measuring gender attitudes and
female participation outside of the domestic sphere.
Our findings provide evidence that current differences in gender attitudes and female behavior
have indeed been shaped by historical differences in agricultural systems. Specifically, we have
shown that individuals, ethnicities and countries whose ancestors used the plough have beliefs
that exhibit greater gender inequality today and have less female participation in non-domestic
activities, like market employment, entrepreneurship, and politics. In an effort to identify a chan-
nel of cultural persistence, we examined variation across second-generation female immigrants
born and living in the US, but from different cultural backgrounds. We find that even among
this group of individuals, who face the same labor market, institutions, and policies, a history of
plough use is associated with less female labor force participation.
References
Albanesi, Stefania and Claudia Olivetti, “Gender Roles and Technological Progress,” WorkingPaper 13179, NBER June 2007.
and , “Home Production, Market Production and the Gender Wage Gap: Incentives andExpectations,” Review of Economic Dynamics, 2009, 12, 80–107.
Alesina, Alberto and Nicola Fuchs-Schundeln, “Good-Bye Lenin (or Not?): The Effect of Com-munism on People’s Preferences,” American Economic Review, 2007, 97 (4), 1507–1528.
and Paola Giuliano, “The Power of the Family,” Journal of Economic Growth, June 2010, 15 (2),93–125.
, Yann Algan, Pierre Cahuc, and Paola Giuliano, “Family Values and the Regulation of Labor,”2010. NBER Working Paper 15747.
Barry, H., M. Bacon, and I. Child, “A Cross-Cultural Survey of Some Sex Differences in Social-ization,” Journal of Abnormal and Social Psychology, 1957, 55, 327–332.
Baumann, Hermann, “The Division of Work According to Sex in African Hoe Culture,” Africa:Journal fo the International African Institute, 1928, 1 (3), 289–319.
Becker, Sasha O., Katrin Boeckh, Christa Hainz, and Ludger Woessman, “The Empire is Dead!Long Live the Empire,” 2010. Mimeo, University of Stirling.
Borck, Rainald, “Adieu Rabenmutter – The Effect of Culture on Fertility, Female Labor Supply,the Gender Wage Gap and Childcare,” 2011. CESIFO Working Paper No. 3337.
Boserup, Ester, Woman’s Role in Economic Development, London: George Allen and Unwin Ltd.,1970.
BP Oil, “Quantifying Energy,” 2006. BP Statistical Review of World Energy, June 2006.
Braudel, Fernand, Mediterranean in the Ancient World, London: Allen Lane, 1998.
41
Carranza, Eliana, “Soil Endowments, Production Technologies and Missing Women in India,”2010. Mimeo, Harvard University.
Clingingsmith, David, Asim Ijaz Khwaja, and Michael Kremer, “Estimating the Impact of theHajj: Religion and Tolerance in Islam’s Global Gathering,” Quarterly Journal of Economics, 2009,124 (3), 1133–1170.
Engels, Frederick, The Origin of the Family, Private Property and the State, Chicago: Charles H. Kerr& Company Cooperative, 1902.
Fernandez, Raquel, “Women, Work and Culture,” Journal of the European Economic Association,2007, 5 (2–3), 305–332.
and Alessandra Fogli, “Culture: An Empirical Investigation of Beliefs, Work, and Fertility,”American Economic Journal: Macroeconomics, 2009, 1 (1), 146–177.
Fischer, Gunther, Harrij van Nelthuizen, Mahendra Shah, and Freddy Nachtergaele, GlobalAgro-Ecological Assessment for Agriculture in the 21st Century: Methodology and Results, Rome:Food and Agriculture Organization of the United Nations, 2002.
Fortin, Nicole, “Gender Role Attitudes and the Labour Market Outcomes of Women AcrossOECD Countries,” Oxford Review of Economic Policy, 2005, 21, 416–438.
, “Gender Role Attitudes and Women’s Labor Market Participation: Opting-Out, AIDS, and thePersistent Appeal of Housewifery,” 2009. Mimeo, University of British Columbia.
Foster, Andrew D. and Mark R. Rosenzweig, “Comparative Advantage, Information and theAllocation of Workers Tasks: Evidence from an Agricultural Labour Market,” Review of EconomicStudies, 1996, 63 (3), 347–374.
Goldin, Claudia, “The U Shaped Female Labor Force Function in Economic Development,” inT. Paul Schultz, ed., Investment in Women Human Capital, Chicago: University of Chicago Press,1995, pp. 61–90.
, “The Quiet Revolution that Transformed Women’s Employment Education and Family,”American Economic Review Papers and Proceedings, 2006, 96 (2), 1–23.
and Kenneth Sokoloff, “The Relative Productivity Hypothesis of Industrialization: TheAmerican Case, 1820 to 1850,” Quarterly Journal of Economics, 1984, 99 (3), 461–487.
Goody, Jack, Production and Reproduction, Cambridge, UK: Cambridge University Press, 1976.
Gordon, Raymond G., Ethnologue: Languages of the World, 15th Edition, SIL International, 2005.
Grosjean, Pauline, “The Determinants of Cultural Integration: A Gravity Approach,” 2010.Mimeo, University of San Francisco.
, “A History of Violence: Testing the “Culture of Honor” in the US South,” 2010. Mimeo,University of San Francisco.
Guiso, Luigi, Paola Sapienza, and Luigi Zingales, “Long-Term Persistence,” 2008. Mimeo.
, , and , “Social Capital as Good Culture,” Journal of the European Economic Association, 2008,6 (2-3), 295–320.
Iversen, Torben and Francis Rosenbluth, Women, Work, and Politics: The Political Economy ofGender Inequality, New Haven: Yale University Press, 2010.
42
Kling, Jeffrey, Jeffrey Liebman, Lawrence Katz, and Lisa Sanbonmatsu, “Moving to Oppor-tunity and Tranquility: Neighborhood Effects on Adult Economic Self-Sufficiency and Healthfrom a Randomized Housing Voucher Experiment,” 2004. Mimeo, Harvard University.
Mazoyer, Marcel and Laurence Roudart, A History of World Agriculture: From the Neolithic Age tothe Curren Crisis, New York: Monthly Review Press, 2006.
McCleary, Rachel M. and Robert J. Barro, “Religion and Economy,” Journal of Economic Perspec-tives, 2006, 20 (2), 49–72.
Michalopoulos, Stelios, “The Origins of Ethnolinguistic Diversity: Theory and Evidence,” 2008.Mimeo, Tufts University.
Murdock, George Peter and Caterina Provost, “Factors in the Division of Labor by Sex,” Ethnol-ogy, 1973, 12 (4), 203–225.
and Douglas R. White, “Standard Cross-Cultural Sample,” Ethnology, October 1969, 8 (4),329–369.
Nunn, Nathan and Diego Puga, “Ruggedness: The Blessing of Bad Geography in Africa,” Reviewof Economics and Statistics, 2011, p. forthcoming.
and Leonard Wantchekon, “The Slave Trade and Origins of Mistrust in Africa,” AmericanEconomic Review, 2011, p. forthcoming.
and Nancy Qian, “The Potato’s Contribution to Population and Urbanization: Evidence froman Historical Experiment,” Quarterly Journal of Economics, 2011, p. forthcoming.
Pitt, Mark M., Mark R. Rosenzweig, and Nazmul Hassan, “Human Capital Investment and theGender Division of Labor in a Brawn-Based Economy,” 2010. Mimeo.
Pryor, Frederic, “The Invention of the Plow,” Comparative Studies in Society and History, 1985, 27(4), 727–743.
Putterman, Louis and David N. Weil, “Post-1500 Population Flows and the Long-Run Determi-nants of Economic Growth and Inequality,” Quarterly Journal of Economics, November 2010, 125(4), 1627–1682.
Recklein, John C., A Profile of Economic Plants, Oxford: Transaction Books, 1987.
Ross, Michael L., “Oil, Islam and Women,” American Political Science Review, 2008, 102 (1), 107–123.
Tabellini, Guido, “The Scope of Cooperation: Values and Incentives,” Quarterly Journal of Eco-nomics, 2008, 123 (3), 905–950.
Weidmann, Nils B., Jan Ketil Rod, and Lars-Erik Cederman, “Representing Ethnic Groups inSpace: A New Dataset,” Journal of Peace Research, 2010, 47 (4), 491–499.
Whyte, Martin King, The Status of Women in Pre-Industrial Societies, Princeton, N.J.: PrincetoneUniversity Press, 1978.
43