Embed Size (px)
Citation preview
ON THE PATTERNS OF TRADE LIBERALIZATION,OLIGOPOLISTIC CONCENTRATION AND PROFITABILITY:
Reflections from Post-1980 Turkish Manufacturing∗∗
Kivilcim Metin-OzcanBilkent University
Ebru VoyvodaBilkent University
voyvoda@bilkent edu.tr
and
Erinc YeldanBilkent University
October, 2000
∗ Authors are, respectively, Assistant Professor, Research Assistant, and Professor in the Department ofEconomics, Bilkent University. Author names are in alphabetical order and do not necessarily implyauthorship seignority. Previous versions of this paper were presented at the IVth Annual METUConference on Economics, Ankara, September, 2000, and the VIIth Annual Conference of theEconomic Research Forum, Amman, October, 2000. We are grateful to Carlos Martinez-Mongay,Ziya Özcan, Korkut Boratav, Ahmet Köse, Refet Gürkaynak, Burcu Duygan, Alpay Filiztekin, ÖnerGünçavdý, Ercan Erkul, Hakan Berüment and the participants of the above conferences for theircomments and suggestions on earlier drafts of the paper, and to the State Institute of Statisticspersonnel for invaluable supplies of the data base. We further gratefully acknowledge the financialsupport of the ERF on an earlier draft of the paper.
For correspondence: Erinç Yeldan, Bilkent University, Department of Economics, 06533, Ankara,Turkey. Tel: 90-312-266 4807; Fax: 90-312-266 5140.
1
ON THE PATTERNS OF TRADE LIBERALIZATION,OLIGOPOLISTIC CONCENTRATION AND PROFITABILITY:
Reflections from Post-1980 Turkish Manufacturing
ABSTRACT
In this paper we investigate the structural consequences of the post-1980 outward-orientation on the market concentration and accumulation patterns in the Turkishmanufacturing industries. Using various panel data procedures over 29-subsectors ofTurkish manufacturing for the period 1980-1996, we focus on three sets of issues: (i)the effect of openness on the extent of market concentration as measured in CR4 ratios;(ii) the behavior of gross profit margins (mark-ups) in relation to openness,concentration ratios, and real wage costs; and (iii) the behavior of sectoral realinvestments (by destination) in relation to the profit margins, real wage costs, and theopenness indicator.
Our results suggest very little structural change in the sectoral composition and natureof market concentration and behavior of profit margins under the post-1980 structuraladjustment reforms and outward-orientation. We find that contrary to expectations,“openness” had very little impact, if any, on profit margins (mark-ups), and, withinmanufacturing, the trade–adjusting sectors reveal a positive relationship between theprofit margins and openness. Profit margins are found to be positively andsignificantly related to concentration power and real wage cost increases. Realinvestments in the sector display positive relationship with profit margins and realwages, yet bear a statistically insignificant relationship vis-à-vis openness.
I. Introduction
In this paper, we investigate the structural consequences of the post-1980 outward-orientation on the market concentration and accumulation patterns in the Turkishmanufacturing industries. The period under analysis is known to span the overalltransformation of the Turkish economy from domestic demand-oriented import-substitutionist industrialization to one with export-orientation and integration with theglobal commodity and financial markets. During this period the manufacturingindustry has evolved as the main sector in both leading the export-orientation of theeconomy, and also as a focal sector wherein the distribution patterns between wage-labor and capital have been re-shaped.
Existing independent studies1 and rudimentary data from official agenciessuggest both formal and anecdotal evidence that one of the major structuraldeficiencies of the sector reveals itself in the rather loose association between the
1 See, e.g., Boratav, Yeldan and Köse (2000), Onaran (2000), Yeldan and Köse (1999), Filiztekin(1999), Ercan (1999), Pamukçu and de Boer (1999), Köse and Yeldan (1998a and 1998b), Yentürk(1997 and 1999), Uygur 91996), Kepenek (1996), Þenses (1996), Bulutay (1995), and Maraþlýoðlu andTýktýk (1991).
2
gains in export penetration and labor productivity on the one hand, and the dismalpatterns of employment, accumulation, and of remunerations of wage labor, on theother. This deformation is, in fact, observed to be a perennial feature of the post-1980structural adjustment era. In their analysis on the decomposition of labor productivityin manufacturing, for instance, Voyvoda and Yeldan (1999) report that, since theinception of the structural adjustment reforms and outward-orientation, the underlyingsources of productivity gains were not significantly altered in the sector. They foundthat none of the leading export sectors of the 1980s could have generated sufficientlystrong productivity contributions, nor admitted strong inter-industry linkages to serveas the leading sectors propelling the rest of the economy.
Given this background, there exists further considerable evidence on theextent of monopolization and high concentration in the Turkish manufacturingindustries. The State Institute of Statistics data suggest, for instance, that the processof export orientation and overall trade liberalization since 1980 has not affected thestructural characteristics of the manufacturing industry. Many of the monopolisticallycompetitive sectors either kept their existing high rates of concentration, or evensuffered from increased monopolization as measured by their CR4 ratios or Hirfindahlindexes. Even among many competitive sectors of 1980, one observes increases inthe CR4 ratios by 1996.2
These observations suggest that, contrary to expectations, the opening processwas unable to introduce warranted increases in competition in the industrialcommodity markets. In this paper, we attempt to formalize on these observations anddeduce econometric hypotheses on the patterns of trade liberalization, concentrationand profitability. To this end, we estimate our empirical questions using variouspanel data procedures. Our data cover 29-subsectors of Turkish manufacturing for theperiod, 1980-1996. We focus on three sets of issues: (i) effect of openness on theextent of market concentration as measured in CR4 rates; (ii) the behavior of grossprofit margins (mark-ups) in relation to openness, concentration rates, and real wagecosts; and (iii) the behavior of sectoral real investments (by destination) in relation tothe mark-ups, real wage costs, and the openness indicator.
Tackling on a similar set of issues as ours, Yalçýn (2000) performed a two-stage least square estimation of price-cost margins (mark-ups) using panel data ofISIC four-digit level of Turkish manufacturing industries over 1983-1994. Yalçýn’sanalysis is directly focused on the “import-discipline hypothesis” –whether the importpenetration due to foreign trade liberalization of the 1980s was sufficient to removethe excess profits of the oligopolistic domestic firms, enhancing a relativelycompetitive market behavior. Utilizing panel data analyses for the public versusprivate sectors separately, Yalçýn (2000) has found that even though there had been anoverall decrease in the profit-margins in the entire private sector, profit-margins in thehighly concentrated sub-sectors of private manufacturing did in fact increase alongwith import penetration. In contrast, using private manufacturing data over the 1977-1985 period, Forouton (1991) reported that import penetration in the concentrated
2 See, for instance, Güneº (1996), Kaytaz, Altýn and Güneº (1993) Katýrcýoðlu (1990) and ªahinkaya(1993) for the evaluation of market concentration and patterns of oligopolistic mark-up pricing in theindustrial commodity markets. Güneº, Köse and Yeldan (1997), in turn, document comprehensivepanel data on the degree of concentration in Turkish manufacturing using the standard Input-Outputclassification for the period 1985-1993.
3
sectors has led to a reduction in the gross profit margins. Similarly, Engin,Katýrcýoðlu, and Akçay (1995) noted that, despite the nominal expectations ofcompetitive pressures on the mark-ups via the discipline of import penetration, theyfound a positive –yet statistically insignificant– relationship between importpenetration and profit margins in the private sector.
As such, the existing literature on the Turkish manufacturing industry fails toprovide an unambiguous indication of increased competitiveness and falling profitmargins despite expectations of pressures of global commodity markets. Thus, anexclusive purpose of this paper is to provide a formal assessment of these issues. Theplan of the remaining pages of the paper is as follows: In the next section we presentan overview of the post-1980 cycles of growth of the Turkish manufacturing sectorfrom the viewpoints of accumulation, productivity and distribution. In section III, weintroduce main hypotheses of our econometric methodology and data sources. Weinvestigate and discuss our econometric findings in section IV. Finally section Vsummarizes and concludes.
II. Phases of Macroeconomic Adjustment in Turkish Manufacturing
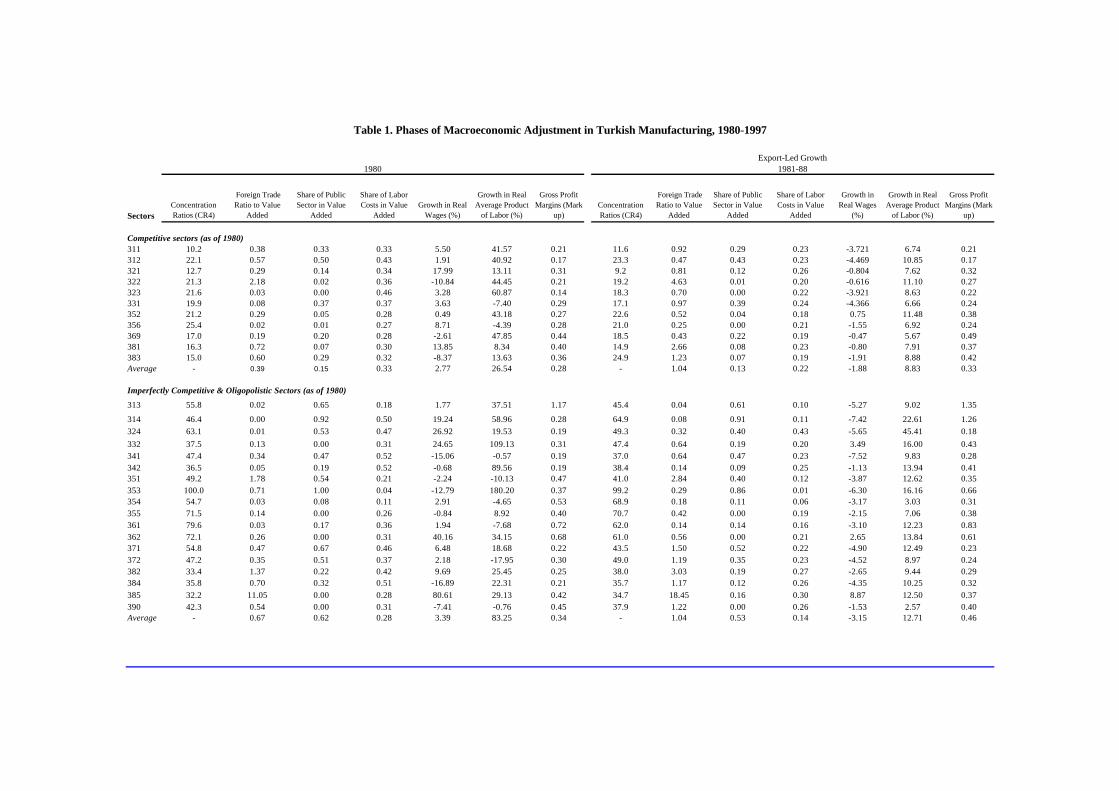
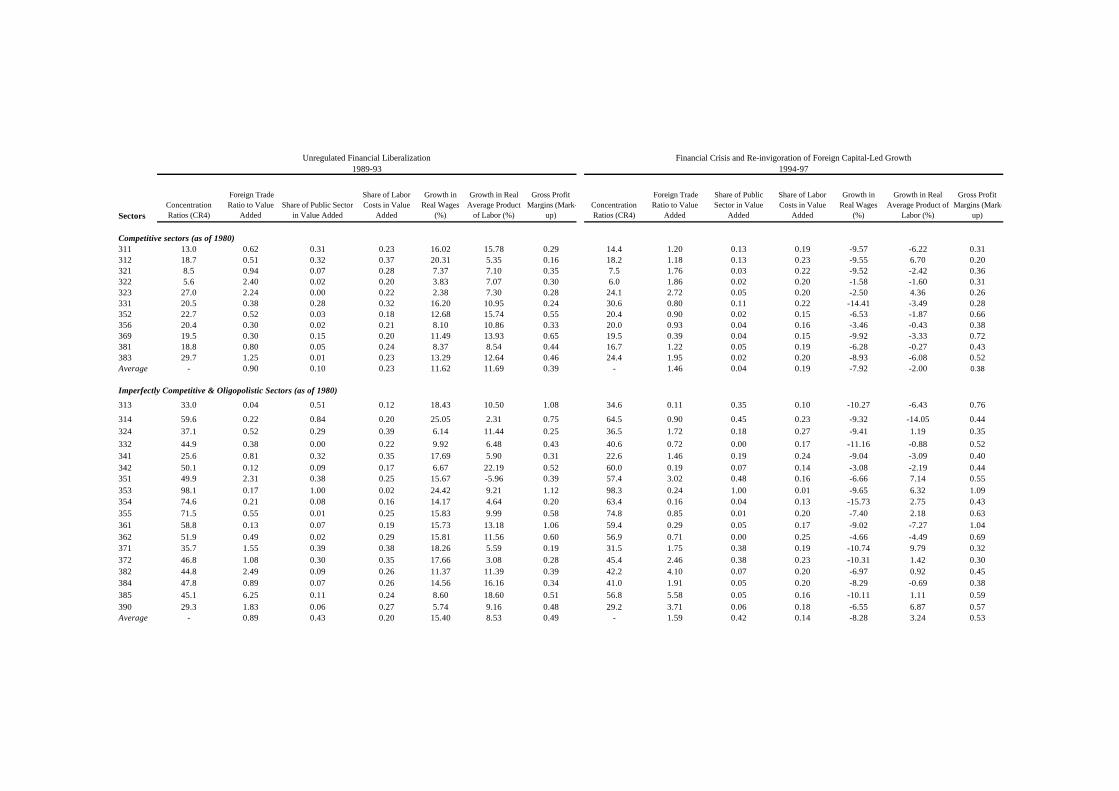
Table 1 summarizes the main indicators of the manufacturing industry under the post-1980 adjustments. To document the extend of the oligopolistic structure of the sector,we tabulate the rate of market concentration in the manufacturing industry sub-sectorsas calculated by the shares of the four largest enterprises in the total sales (revenues)of the sector (hence the acronym, CR4). Accordingly, we classify those sectors withCR4 ratios above 30% to be imperfectly competitive, and those having CR4 ratiosbelow this threshold as competitive.3 Data on other sectoral variables come from theState Institute of Statistics (SIS) Manufacturing Industry Annual Surveys. To arriveat “wage rates” and the “average labor product”, we have used data on “total wagespaid” and “value added” divided, respectively, by “average number of workersengaged”. We have used the sectoral wholesale producer prices in deflating nominalmagnitudes.
<Insert table 1 here>
The periodization of the table follows the adjustment path of the overalleconomy. Over the last two decades, Turkish economy is observed to go throughthree distinct cycles of growth-crisis-and adjustment: The first covers broadly theperiod 1980-1989, with its main attribute being the increased export-orientation of theeconomy. Following the foreign exchange crisis of 1977-80 growth was re-invigorated following the introduction of a structural adjustment programme inJanuary, 1980 under the auspices of the international centers such as the World Bankand the IMF. The period 1981-87 was marked with commodity trade liberalizationand export promotion along with a price reform aimed at reducing the state’s role ineconomic affairs. The existing system of fixed exchange rate administration wasreplaced by a flexible regime of crawling-peg, and together with the introduction of a
3 This is the threshold used by Boratav, Yeldan and Köse (2000) and Yeldan and Köse (1999), where,on a further level of finesse, the sectors which had CR4 ratios between 30% and 49% are classified as“monopolistically competitive”, and those sectors with CR4 ratios exceeding 50% are regarded to be“oligopolistic”.
4
complex system of direct export subsidization, acted as the main instruments for thepromotion of exports and pursuit of macroeconomic stability.4
During the period 1983-87, export revenues increased at an annual rate of10.8%, and gross domestic product rose at an annual rate of 6.5%. The period wasalso characterized by severe erosion of wage incomes via hostile measures againstorganized labor. The suppression of wages was instrumental both in loweringproduction costs and in squeezing the domestic absorption capacity. The share ofwage-labor in manufacturing value added receded from its average of 35.6% in 1977-80, to 20.6% in 1988. In this process, the average mark up rate (profit margins) inprivate manufacturing has increased from 31% to 38%.
During the 1980s, the composition of total fixed investments displayed quiteadverse trends at the sectoral level from the point of view of strategic targets. In fact,as gross fixed investments of the private sector increased by 14.1% during 1983-87,only a small portion of this amount was directed to manufacturing. The rate ofgrowth of private manufacturing investments has been on the order of half of thisfigure, at a rate of only 7.7% per annum, and could not reach its pre-1980 levels inreal terms until the end of 1989. Much of the expansion in private manufacturinginvestments originated from the pull from housing investments which expanded by anannual average of 24.5% during 1983-87. This resulted in a significant anomaly asfar as the official stance towards industrialization was concerned: in a period whereoutward orientation was supposedly directed to increased manufacturing exportsthrough significant price and subsidy incentives, distribution of investments revealeda declining trend for the sector. The implications of this non-conformity between thestated foreign trade objectives towards manufacturing exports and the realizedpatterns of accumulation away from manufacturing constituted one of the mainstructural deficiencies of the export oriented growth strategy of the 1980’s, andaccording to our view, had played a crucial role in the failure of maintaining theexport promotion programme as a sustainable strategy of development.
As this unbalanced structure failed to generate the necessary accumulationpatterns, the artificial growth path generated by way of wage suppression and pricesubsidies was observed to reach its economic and political limits by 1988. Starting1988, we observe real wage earnings to enter a period of recovery following the gainsof union movement, and also of the new wave of populist pressures. As can bewitnessed from data tabulated in Table 1, all sub-sectors of manufacturingexperienced significant rises in wage remunerations. On the average, real wages inmanufacturing increased at an annual rate of 10.2% consecutively, from 1989 to 1993.In retrospect, it can be argued that the post-1988 populism could evidently befinanced by expanding the tax base over the so-called “unrecorded privatecommercial transactions”, and by moving towards a “fair” tax system. Yet, thestrategic preference of the government was the maintenance of its current stancetowards erosion of taxable capital incomes and absorption of all costs of adjustment infavor of profit incomes against the culminating wage pressures (Boratav, Yeldan and
4 See Boratav and Türel (1993), ªenses (1994), Celasun and Rodrik (1989), Uygur (1993), and Celasun(1994) for a thorough overview of the post-1980 Turkish structural adjustment reforms. For aquantitative assessment of the export subsidization programme, see Milanovic (1986) and Togan(1996).
5
Köse, 2000; Cizre-Sakallýoðlu and Yeldan, 2000; and Türel, 1999). As one of themajor indicators of the (functional) distribution of income, we observe that the profitmargins in fact followed a rising trend, and reached to 47% in 1994, from its averageof 33.5% in 1989. See Figure 1 for the portrayal of mark-ups and real wage costs overthe 1980-1996 time horizon.
<Insert Figure 1 here>
Given these broad shifts in the macroeconomic environment, the 1989 policymaneuver of capital account liberalization served as one of the major policy initiativesto a new round of growth. This policy maneuver paved the way for injection ofliquidity to the domestic economy in terms of short term foreign capital (flows of “hotmoney”). Such inflows enabled, on the one hand, financing of the accelerated publicsector expenditures, and also provided relief of the increased pressures of aggregatedemand on the domestic markets by way of cheapening costs of imports.5
Consequently, the bonanza of cheap imported intermediates fueled the second waveof the growth cycle between 1989-93.
Erratic movements in the current account, a rising trade deficit (from 3.5% ofGNP in 1985-88 to 6% in 1990-93) and a drastic deterioration of fiscal balancesdisclose the unsustainable character of the post-1989 populism financed by foreigncapital inflows. This prolonged instability reached its climax during the fourthquarter of 1993, when the currency appreciation and the consequent current accountdeficits rose to unprecedented levels. With the sudden drainage of short-term funds inthe beginning of January 1994, imports dwindled by 15%, GDP fell by 5.5%, and theinflation rate soared to 106%. Together with this contraction, the post-1994 crisismanagement gave rise to significant shifts in income distribution, and real wages inmanufacturing declined by 36.3%. Likewise, dollar-denominated wage costsdecreased substantially and enabled export earnings to rise. In this manner, Turkeyhas, once again, switched back to its classic mode of surplus extraction wherebyexport performance of industrial sectors depended on savings on wage costs. In fact,the disequilibrium could have only been accommodated by the massive (downward)flexibility displayed by real remunerations of wage-labor. Thus, the post-1995 periodwitnessed the reinvigoration of foreign capital-led growth –the third cycle. Finally,the global deceleration following the contagion of the Asian financial crisis hit theTurkish economy starting August of 1998 under the already adverse conditions ofsevere macroeconomic disequilibria with accelerating fiscal and current accountdeficits, high inflation and unemployment, and increased social unrest.
Clearly, the inherent characteristics of the growth-crisis-adjustment cyclesidentified thus far have had quite different macroeconomic dynamics in operation.The export-orientation phase (1980-1988) was driven by commodity tradeliberalization and real depreciation under conditions of wage suppression. The post-1989 financial liberalization completed the integration of the domestic economy withthe global commodity and financial markets, and initiated a process of short-termforeign capital-led growth with abrupt mini cycles of boom and crisis throughout the1990s. While the former cycle relied on domestic surplus creation via squeezing 5 See Özatay (1999); Balkan and Yeldan (1998); Selçuk (1997); Boratav, Türel and Yeldan (1996);Ekinci (1998); and Yentürk (1999) for an extensive discussion of the post-financial liberalizationmacroeconomic adjustments in Turkey.
6
wage incomes, the latter mostly relied on foreign finance under conditions of highwages.
We follow the microeconomic swings across the individual sub-sectors withinmanufacturing from Table 1. Given our criterion of distinguishing individual sectorsas competitive versus imperfectly competitive based on their CR4 ratios, we observethat 18 of the 29 sectors fall under the “imperfectly competitive & oligopolistic”group in 1980. Eight of them have CR4 ratios higher than 50%. By 1996 there isvery little change in these sub-groups. As of 1996 the share of value added of theimperfectly competitive sectors in manufacturing total reaches to 51%. Furthermore,these sectors employ 31% of total manufacturing employment in our data base. Incontrast, the output share of the imperfectly competitive sectors was 55%, and theiremployment share was 42% in 1980.
Leaving sector 353 (Petroleum Rafineries) aside due to its exclusive publicownership, as of the 1994-96 average, the highest degree of concentration is observedin:
Rubber and Plastics (355) 74.8%Tobacco Manufactures (314) 64.5%Miscellaneous Petroleum and Coal (354) 63.4%Printing and Publishing (342) 60.0%
It is interesting to note that the size of the public sector is not necessarily the mainactor in these sectors, with public share being 0.01 in 355; 0.04 in 354; and 0.07 in342. Sectors 321 (textiles) and 322 (wearing apparel) display the most competitiveenvironment with respect to their CR4 ratios.
Overall, one witnesses a mixed pattern of concentration over 1980-96. Ingeneral, there is very little structural shift across the two sub-groups. We record 341(paper and paper products) to be the only sector to change its imperfectly competitivestatus from CR4 of 47.1% in 1980, to 22.6% in 1996. Per contra, it is interesting tonote that one also witnesses a competitive sector such as manufacture of woodproducts (331) to increase its concentration level beyond the imperfectly competitivethreshold of 30% by 1996.
At the expense of over-generalization, we can nevertheless confer a tendencyfor higher mark-up rates within the imperfectly competitive block. PetroleumRafineries (353), Soil Products (361), and Non-Metals (369) have the highest mark-uprates over 1994-96 with 1.07, 1.04, and 0.72, respectively. On the other hand, sectors312, 323, and 324 yield the lowest mark-ups. We further observe that growth in realwages has been consistently negative over the 1981-88 and 1994-97 episodes, whilereal wage costs have been on an upward trend under the financial de-regulation of1989-93. As of 1994-97, the highest share of labor costs in value added is recorded inManufacture of Footwear (324) with 0.27. This is followed by Glass Products (362)with 0.25, and Paper and Paper Products (341) with 0.24. The dis-associationbetween the real wage movements and labor productivity is clearly visible over theclassic export-led manufacturing era, 1981-88. Even though real wages seem to havecaught up with real average labor products over 1989-93, this pattern is observed tofall short of its momentum, and by 1994-97, real wages start to follow acontractionary trend.
7
In the next section, we turn to an analytical investigation of these dynamicsfrom the view points of growth, accumulation, and distribution. We first provide aformal presentation of our methodology and data sources.
III. Econometric Investigation
We now turn to the econometric investigation of the dynamics of Turkishmanufacturing industry over the post-1980 era. To this end, we focus on the 29 sub-sectors of manufacturing based on 3-digit ISI-Classification. (The ISIC codes andtheir sectoral identification are laid in Appendix Table 1).
We utilize two specifications: we first study the distributional issues andanalyze the behavior of gross profit margins (mark-up rates) in relation to tradeliberalization, sectoral concentration, and swings in real wage costs. Secondly, weanalyze the patterns of accumulation, and study the behavior of sectoral investment(by destination) against the behavior of mark-up rates, real wage costs, and openness.
We continue to rely on our initial classification based on their CR4 ratios.Accordingly, we classify those sectors which have a CR4 in excess of 0.30 as“imperfectly competitive/oligopolistic”; and those with CR4 less than 0.30 as“perfectly competitive”. On a different spectrum, sectors are to be regarded as “open”provided that their trade volume (measured as imports plus exports) as a ratio ofsectoral value added exceed 0.50. Per contra, sectors with trade volume-to-valueadded ratios less than 0.50 are regarded as “inward-looking”. We carry thisclassification based on the characteristics of the 29 sectors in 1980. We thus obtainthe following tabulation (see Appendix Table 1 for identification of the ISIC codes):
Open sectorsInward-Looking
Sectors
Competitive Sectors 312, 322, 381, 383
311, 321, 323, 331, 352, 356, 369
Imperfectly Competitive
Sectors351, 353, 382, 384,
385, 390
313, 314, 324, 332, 341, 342, 354, 355, 361, 362, 371, 372
III-1. Data Sources
Our data come from the State Institute of statistics (SIS) Manufacturing IndustryAnnual Surveys and Indicators of Concentration. The survey covers all public sectorestablishments and those private enterprises employing more than 10 workers.
Various concentration measures were available in addition to the CR4 ratio,such as CR10 and Hirfindahl indexes in our data. We chose to adhere to the CR4 as
8
the relevant measure of concentration due to its simplicity and also popularity.6 Wagecosts include all payments in the form of wages and salaries and per diems, grossincome tax, social security, and pension fund premiums. It also includes socialsecurity, pension, contributions, and the like payable by the employer, and overtimepayments, bonuses, indemnities and payments in kind. Annual wages and salariespaid are compiled for production workers and other staff. Profit margins (mark-uprates) are defined as the ratio of total profits to total costs of wages and intermediateinputs. In the absence of reliable capital stock estimates, this variable provides a goodproxy on the profitability of capital. Finally, sectoral investments are given by theannual gross fixed additions to capital stock.7
III-2. Method of Econometric Estimation
Our essential estimating equations are the following:
MRit=f(αi, Oit, CR4it, RWit) (1)
RIit= f(αi, MRit, Oit, RWit) (2)
The first implicit function represents the trade orientation and distributionalaspects of the manufacturing industry where MRit denotes mark-up rates; CR4it
denotes concentration ratios; Oit stands for “openness” of each sector, (ratio ofimports plus exports to sectoral value added), and RWit denotes real wage costs. Thesecond relationship tries to explain the process of capital accumulation using threepossible determinants namely mark-ups, real wage costs, and the openness, where RIit
is the real investment of each manufacturing industry sector. The index {i=1,2,...,N}refers to the individual unit, and {t=1,2,...,T} refers to a given time period. Thecoefficients αi (sector specific composite term) have two components: αi1, a sectorspecific intercept, and αi2t, a sector-specific deterministic growth trend.
Each equation is estimated using a panel data estimator, so that variation overboth the cross section and time series dimensions are jointly considered. Theadvantages of using panel data estimation are various. Firstly, panel data enable majorsteps to overcome the problems associated with the lack of sufficient historical datafor efficient estimation using single sector time series analysis. Secondly, it mostlycompensates for the dissatisfaction with using a cross section estimation. Sincetemporal variation is ignored in cross section estimation, changes occurred in policy
6 Given that the idea of “seller concentration” refers to the size distribution of firms that sell aparticular product, the concept is usually regarded as a significant dimension of market structure sinceit is thought to play an important part in determining market power. Some researchers who have beenstudying market power have sought to measure it by using indexes based on microeconomic theorydating back to Lerner (1934) who suggested that the difference between price and marginal costdivided by price could serve as a direct measure of departures from the competitive ideal. Despite itsintuitive appeal, the Lerner index is criticized on the grounds that it is essentially an ex post measure ofallocative efficiency. Curry and George (1983) provide a thorough evaluation of these issues.
7 For a more detailed information on these and related concepts see SIS Manufacturing Annual IndustrySurveys and the SIS web site at http://www.die.gov.tr.
9
in the specific sectors of the manufacturing industries over the years can not beobserved. In contrast, panel data estimation uses all the information available in timeseries and the cross section-based procedures.
Panel data estimation considers the sector specific differences. Observed staticdifferences between sectors of the manufacturing industries can be taken intoconsideration in variation in the intercept terms, αi’s . The intercept is allowed to varyonly across individual sectors, not over the time period under consideration. Note thatas the intercept-shifting dummy variables have been included, time-invariantregressors cannot simultaneously be introduced as this would induce multicollinearity.There would be two types of specifications. The first one allows only one interceptcoefficient and one slope coefficient on each regressor using a simple pooledregression. The second one permits the intercept to vary across sectors and theestimation technique assumes constant slope coefficients across sectors. This is lessrestrictive than the former.
The general form of our specifications are assumed to be linear:
For trade orientation and distribution:MRit=αi + β1 Oit + β2 CR4it + β3 RWit (1’)
For accumulation:RIit=αi + β1 MRit + β2 Oit + β3 RWit (2’)
Two special cases of these general forms arise, depending upon whether thesector specific effects (αi's) have a fixed component, which is called the “fixed effectmodel” (FEM) or a random component, which is called the “random effects model”(REM). The choice of the model can be based on a priori assumptions. A priori, inthe sense that we are dealing with individual sectors, and random selections from apopulation would support the adoption of the fixed effects model where inferences arerestricted to the effects within the sample. However, not satisfied with looking at onlya prior assumptions, we test the appropriateness of the FEM against the REM usingthe F-test and the Hausman chi-squared test (Hausman (1979), Hausman and Taylor(1981)). The Hausman statistic tests for the correlation between the sector–specificeffects and explanatory variables. If they are correlated, the fixed effect estimator(the within, or the least squares dummy variable estimator) is consistent, while therandom effects estimator (the feasible GLS estimator) is biased. The within estimatormakes use of the variation of variables within each individual. The feasible GLSestimator is a weighted average of the within and between estimators which utilisesvariation between individuals (see Hasio (1990) and Judge et al., (1985)). Rejectionof the null of no correlation would lead to the adoption of the fixed effect estimatorusing the specification defined as (1’ and 2’) above. 8
8 We estimated three specifications, one withMRit=α+β1Oit+β2CR4it+β3RWit +β4D1+β5D2+β6D1Oit+β7D2Oit where D1 is a dummy for open sectorstaking a value 1 and inward looking sectors taking a value 0. D2 is a dummy for competitive sectorstaking a value 1 and imperfectly competitive ones taking a value 0. D1Oit and D2Oit are respectiveinteraction dummies with the openness. α, β1, β2, and β3, are common intercept and slope coeefficients,respectively. This specification is estimated using pooled least squares for all sectors. Second one is anunrestricted form of the former specification written as
10
IV. Analysis of Econometric Results
We employ panel data estimation on specification (1’) in six sets of equations. First,we estimate equation (1’) for the whole sample, in other words for i = {1,2,...,29} andt = {1980,1981,...,1996}. Then, we take each of the identified cells as one individualgroup exclusively and re-do the estimation. Finally, we distinguish those sectorswhich were “inward-oriented” in 1980, but became “open” by 1996. That is, sectorsi∈{2 and 4} in 1980 and i∈{1 and 3} in 1996. This leaves us with the followingsectors: {311, 314, 321, 323, 324, 331, 332, 341, 352, 355, 356, 362, 371, 372}. Weclassify this group with the identifier “trade adjusters”.
Distributional Indicators: Behavior of Gross Profit Margins
We start our econometric investigation with the analysis of the behavior of grossprofit margins (mark-ups). Our bird’s-eye-view observations on the mark-ups, asportrayed in Figure 1 above, reflect a general rise of the average profit marginsdespite the increased openness and the secular rise of wage costs after 1989.
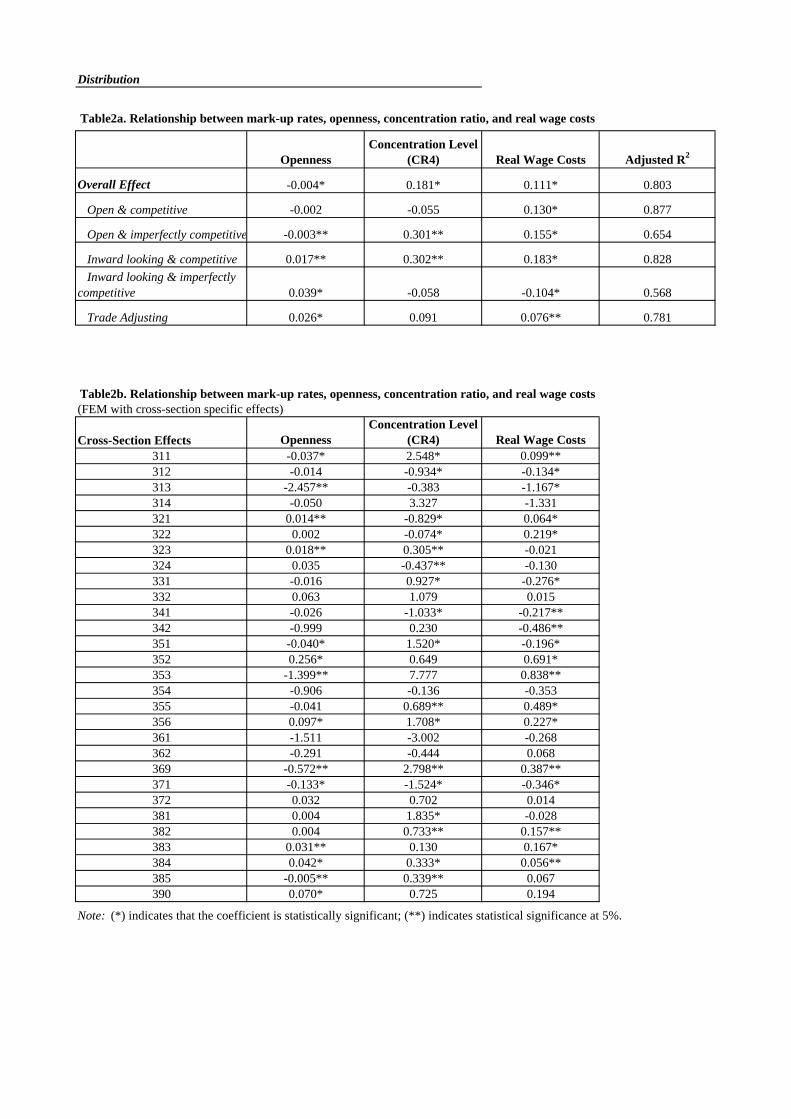
To test these hypotheses, we regress mark-up rates on openness, concentration(CR4 ratios), and real wage costs using the panel data. The results are tabulated inTables 2a and 2b.
<Insert tables 2a and 2b here>
Our econometric results reveal the following relationship for the mark-upequation when all sectors are considered:
MRit=αi -0.004 Oit + 0.181 CR4it + 0.111 RWit
(-5.107) (6.361) (13.108)
where αi is the of sector specific term. Thus, for whole sample, overall coefficient ofopenness is estimated to be a mere –0.004. The magnitude, which is found to bestatistically significant, is nevertheless very small, suggesting that the 16 years ofadjustment to foreign integration has not brought a meaningful change in the marketstructure of the Turkish manufacturing industry. As such, the speed of adjustment ofgross profit margins is revealed to be very slow in spite of the import discipline or MRit= αit+β1Oit+β2CR4it+β3RWit+β4D1Oit+β5D2Oit and estimated as fixed effect model where α it’s areestimated as intercept terms of each respective sectors.
Using F test we tested the null hypothesis of pooled OLS against the alternative of FEM. F test favorFEM (F=26.8 F26, 455=1.70 at α=0.01). The same equation is estimated using REM and specified asMRit=α+αit+β1Oit+β2CR4it+β3RWit+β4D1Oit+β5D2Oit where α is a common intercept and αit’s areconsidered as intercepts in the REM namely residuals. The null is here REM, and alternative is FEM.Using F-test we reject the null (F=2.03 and F28,455=1.46 at α=0.05). This type of testing also performedfor considering equation (2') and results consistently favor FEM. Haussman χ2 test also concludes thatcontemporaneous correlation between the residuals and the explanatory variables does exist for bothequation (1') and (2') where each test statistic is found to be greater than χ2
(1) = 3.84 at a 5%significance level. Estimation results are not provided here but can be requested from the authors.
11
export penetration, and the technological and institutional barriers to entry seem topersist over the post-1980 reform era.
Concentration rates, on the other hand, have a statistically significant and ahigher (positive) coefficient with 0.181. Thus, a one percent increase in the level ofconcentration as measured through the CR4 ratio is likely to affect the average profitmargin of the sector by +0.18 percent. The a priori theoretical expectation that higherconcentration levels would be indicative of higher profit margins is confirmed in theaggregate. What is more interesting, however, is that mark-ups do have a positiverelationship with respect to real wage costs, with 0.111. These observations suggestthat the sector has been characterized by Sraffian dynamics in the aggregate, withpersistence of mark-ups against wage increases. (See also Boratav, Yeldan and Köse,2000, and Yentürk and Onaran, 1999 for a further assessment of the behavior ofmark-ups against the post 1989 wage cycle in Turkish private manufacturing).
Across the sub-groups, we observe that, in general, “open” sectors (as of1980) have a negative relationship with “openness”. “Inward-looking” (as of 1980)sectors, on the other hand, display a positive relationship against the same variable.Most importantly, “trade adjusters” carry a coefficient of +0.026 vis-à-vis openness.Thus, for those sectors which were inward-looking by 1980, the process of openingcould not have been associated with a competitive discipline squeezing the cost-margins (mark-ups). On the contrary, there seems evidence that the inward-lookingsectors (as of 1980) have adjusted the new trade environment by way of increasingtheir profit margins (with an estimated coefficient of +0.026 vis-à-vis openness).Trade adjusters, as a group, displayed positive coefficients in relation with theconcentration indicator (CR4) and the real wage costs. Except for the “inward-looking & imperfectly competitive” group, mark-ups have positive relationship withreal wage costs under all groups. Thus, generally speaking, it seems that themanufacturing sectors could have responded to the shocks of trade policy and the realwage costs by increasing their profit margins over the post-1980 reform era.
At a finer level of detail of 3-digit ISI-classification, individual branchesdisplay much variation. Overall, among the statistically significant results, mark-upsrespond negatively to openness in seven sub-sectors, and positively in seven sub-sectors. The sector that has the highest negative coefficient is beverage industry(313). Petroleum industries (353) and Non-Metals (369) also have significantly highnegative coefficients. Sector 353, however, is a pure public monopoly, and its pricingbehavior is likely to be attributable to mostly political factors.
On the other end of the spectrum, important intermediate good producers, suchas Chemicals (352), Plastics (354), and Electrical Machinery (383) openness hasrelatively high positive responses on profit margins with +0.256, +0.097, and+0.0031, respectively. Within the “trade adjusters” only Food Manufacturing (321)and Iron and Steel (371) display statistically significant, negative, coefficients vis-à-vis openness.
When we analyze the sectoral effects of concentration and real wagemovements against the mark-ups, we witness higher responsiveness coefficients. Themost important sectors displaying high coefficients between concentration and profitmargins are:
12
Non-metallic minerals (369) 2.798Food Processing (311) 2.548Metal products (381) 1.835Plastics (356) 1.708Chemicals (351) 1.520
Except for Chemicals, all these sectors disclose positive coefficients of realwage costs on mark-ups, as well. In fact, counting only the statistically significantresults, of the eleven sectors which had positive relationship between mark-ups andthe concentration levels, seven carry positive responsiveness vis-a-vis real wage costs.These findings provide supporting evidence confirming the hypothesis that increasedreal wage costs could have been translated into higher mark-ups via power of marketconcentration. The sectors that revealed the highest positive relationship betweenmark-ups and real wage costs are the following:
Petroleum Rafineries (353) 0.838Other Chemicals (352) 0.691Rubber Products (355) 0.489Non-Metals (369) 0.387Plastic Products (356) 0.227
Summarizing, our econometric results reflect a pattern of sluggishness of theexisting levels of concentration and mark-up induced non-competitive pricing inTurkish manufacturing against a 16-year long period of trade liberalizationadjustments. With a relatively small rate of change of mark-up rates (averaging –0.004 for the whole period), the sector seems to display a resistance to increasedcompetition despite the import discipline the post-1980 adjustments have brought. Itis also notable that the sectors that are characterized by high concentrationcoefficients do not necessarily reflect high shares of public ownership, and thatreductions in the share of the public companies in the sector do not lead directly to anincrease in the degree of competitiveness. In this respect, comparing the data for1980 and 1996, one can see that there are sectors in which concentration rates (CR4)have declined parallel to a decrease in the share of the public sector (iron and steel371; beverages 313; paper and paper products 341), whereas there have also beensectors (chemicals 351, tobacco 314) in which monopolization increased as a result ofthe same process. These observations reveal that, contrary to expectations of theorthodox theory, the process of trade liberalization has, in general, been insufficient tointroduce the expected increase in competition in the industrial commodity markets.This verdict brings us to issues of distribution and pricing.
Investment Behavior and Patterns of Accumulation
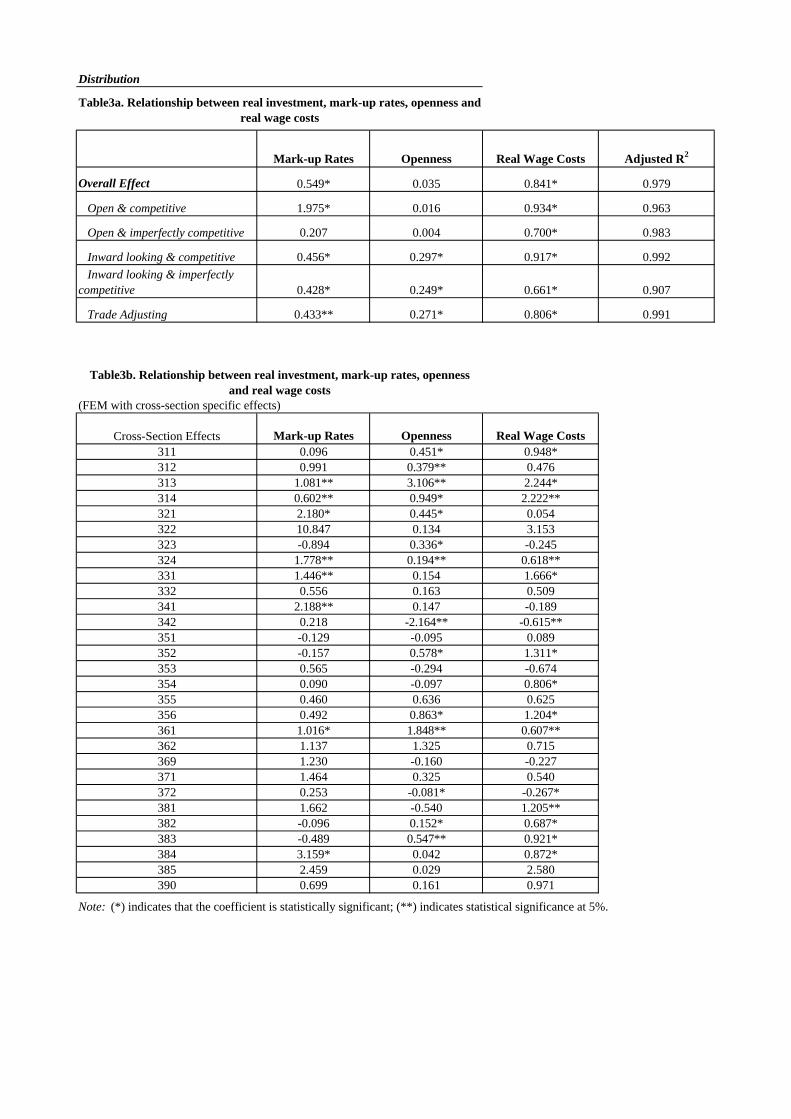
Now we turn our attention to the analysis of the behavior of sectoral investment inresponse to openness, mark-up rates (profitability) and real wage costs by regressingsectoral real investments against CR4, MR and RW (equation 2’). Results aretabulated in Tables 3a and 3b.
<Insert Table 3a and 3b here>
13
The overall effect of profit margins on manufacturing real investment is quitestrong with an elasticity of 0.548. This suggests the presence of strong accelerationistinvestment patterns in the sector. Openness, though positive, carries a smallerelasticity with 0.035. (Yet, it is not found to be statistically significant).
The estimated equation has been found to be:
RIit = αi +0.548 MRit + 0.035 Oit + 0.841 RWit
(5.956) (1.439) (15.063)
The most interesting result is the estimated positive impact of real wages onreal investment with a coefficient of +0.841. In other words, real wages seem to actas an accelerationist variable, stimulating real fixed investments in the manufacturingsector, while the effect of openness –as measured in ratios of trade volume to valueadded– has been found to be in-significant. The un-orthodox behavior of real wagesin stimulating both gross profit margins and real investments in a positive mannersuggests the continued importance of domestic demand factors in the Turkishindustrial commodity markets. These results concur with the findings of Yentürk andOnaran (1999) in their classification of the post-1980 Turkish manufacturing asfollowing a wage-led growth pattern.
Sectoral responses of investment to mark-ups have generally very highcoefficients. Sectors such as Transport Equipment (384), Textiles (321), ProfessionalEquipment Goods (385) and Printing (341) have elasticities exceeding 2.0. It isinteresting to observe that across the above-identified sectors, only Textiles (321),carry a statistically significant relationship of the effect of trade openness.Furthermore, we witness two sectors, Printing (341) and Non-Ferrous Metals (372),with negative elasticities of investment with respect to real wages, with –0.615 and –0.267, respectively. The highest effect of real wages on investment is found inBeverages (313) with +2.244. This is followed by Tobacco Manufacturing (314) with+2.222; Wood Products (331) with 1.666; and Other Chemicals (352) with 1.311.
V. Concluding Comments
In this paper, we investigated the structural consequences of the post-1980 outward-orientation on the market concentration, pricing behavior and accumulation patternsin the Turkish manufacturing industries. Utilizing existing evidence on the extent ofmonopolization and high concentration in the Turkish manufacturing industries, weattempted to formalize on these observations to deduce econometric hypotheses onthe patterns of trade liberalization, accumulation, and profitability. To this end, weinvestigated our empirical questions using various panel data procedures over 29-subsectors of Turkish manufacturing for the period 1980-1996.
Existing data reveal very little structural change in the sectoral compositionand nature of market concentration and behavior of profit margins under the post-1980 Turkish structural adjustment reforms and outward-orientation. It is also notablethat the sectors which are characterized by high concentration coefficients do notnecessarily reflect high shares of public ownership, and that reductions in the share of
14
the public companies do not lead directly to an increase in the degree ofcompetitiveness. As such, the speed of adjustment of concentration is revealed to bevery slow in spite of the import discipline or export penetration and the technologicaland institutional barriers to entry seem to persist over the post-1980 reform era.
We found that “openness” had very little impact, if any, on the levels of profitmargins (mark-ups) and also on the behavior of sectoral investments. Oureconometric results reflect a pattern of sluggishness of the existing levels of mark-upsin Turkish manufacturing against a 16-year long period of trade liberalizationadjustments. With a relatively small effect of “openness” on gross profit margins(averaging –0.004 for the whole period), the sector seems to display a resistance toincreased competition despite the import discipline the post-1980 adjustments havebrought. In fact, those “trade adjusting” sectors which were classified as “inward-looking” in 1980, and became “open” by 1996 display a positive response (+0.026) ofprofit margins vis-à-vis openness. Thus, our results suggest that, contrary to theprognostications of the orthodox theory, the post-1980 export orientation of Turkishmanufacturing could not lend itself into gains in competitiveness, and could not besustained as a viable strategy of “export-led industrialization” via increasedinvestments.
Profit margins (mark-ups) are further found to be positively and significantlyaffected from concentration power and real wage cost increases. Thus, there seems tobe evidence that the manufacturing sectors have responded to shocks of trade policyand real wage costs by increasing their indigenous profit margins. Real investments,in turn, have been found to have a statistically insignificant relationship with“openness”; yet, significant and positive responses to profit margins and real wages.This finding suggests the continued importance of the domestic demand factors in theTurkish industrial commodity markets, and an overall wage-led growth pattern withboth profit margins and real wages acting as accelerationist variables to stimulatefixed investments.
References
Balkan, E. and E. Yeldan (1998) “Financial Liberalization in Developing Countries:The Turkish Experience” in Medhora, R. and J. Fanelli (ed.) FinancialLiberalization in Developing Countries Macmillan Press.
Boratav, K., E. Yeldan and A. Köse (2000) “Globalization, Distribution And SocialPolicy: Turkey: 1980-1998” CEPA and The New School for Social Research,Working Paper Series, No 20. New York, February.
Boratav, K., O. Türel and E. Yeldan (1996) “Dilemmas of Structural Adjustment andEnvironmental Policies under Instability: Post-1980 Turkey” WorldDevelopment, 24(2): 373-393.
15
Boratav, K. and O. Türel (1993) “Turkey” in L. Taylor (ed.) The Rocky Road toReform Cambridge, Mass. & London: MIT Press.
Bulutay, T. (1995) Employment, Unemplyoment and Wages in Turkey, ILO/SIS,Ankara.
Celasun, M. (1994) “Trade and Industrialization in Turkey: Initial Conditions, Policyand Performance in the 1980s” in G. K. Helleiner (ed.) Trade Policy andIndustrialization in Turbulent Times London: Routledge.
Celasun, M. and D, Rodrik (1989) “Debt, Adjustment and Growth: Turkey” in J.Sachs and S.M. Collins (eds) Developing Country Debt and EconomicPerformance, Country Studies The University of Chicago Press Book IV: 615-808.
Cizre-Sakallýoðlu, Ü. and E. Yeldan (2000) “Politics, Society and FinancialLiberalization: Turkey in the 1990s" Development and Change, 31(1):481-508.
Curry, B. and K.D. George (1983) “Industrial Concentration: A Survey” The Journalof Industrial Economics, 31(3), March: 203-255.
Ekinci, N. (1998) “Dynamics of Growth and Crisis in the Turkish Economy” (inTurkish) Toplum ve Bilim No. 77: 7-27.
Engin, N., E. Katýrcýoðlu and C. Akcay (1995) “The Impact of Trade Liberalizationon the Turkish Manufacturing Industry: An Empirical assessment” in R. Erzan(ed.) Policies for Competition and Competitiveness, UNIDO.
Ercan, Hakan (1999) “Non-Wage Labor Cost in Turkish Manufacturing Industry: AnInternational Comparison” in T. Bulutay, (ed) The Burdens Related withTurkish Labor Markets and Policies, State Institute of Statistics, Ankara.
Filiztekin, A. (1999) “Growth and Dynamics of Productivity in TurkishManufacturing” Koc University, Department of Economics, mimeo.
Forouton, F. (1991) “Foreign Trade and Its Relation to Competition and Productivityin Turkish Industry” The World Bank Working Papers, No 604, WashingtonD.C.
Güneº, M (1991) “Concentration Criterias in Turkish Manufacturing Industry: 1985-1989” (in Turkish), Research Symposium 91, State Institute of Statistics,Ankara.
Güneº, M; Köse, A. H. and E. Yeldan (1996) Concentration Trends in TurkishManufacturing Industry in Accordance with IO Table’s SectoralClassification, (in Turkish), Ekonomik Yaklaþým, 8(26): 33-47.
Hausman, J. (1979) ‘Specification Tests in Econometrics’ Econometrica, 46, 1251-1271.
16
Hausman, J. And Taylor, W. (1981) ‘Panel Data and Unobservable IndividualEffects’, Econometrica, 49, 1377-1397.
Hasio, C. (1990), Analysis of Panel Data, Cambridge: Cambridge University Press.
Judge, G., Griffiths, W., Carter Hill, R., Lutkepohl, H. And Lee, T. (1985), TheTheory and Practice of Econometrics, New York: John Wiley and Sons.
Katýrcýoðlu, E (1990) Concentration in Turkish Manufacturing and The FactorsDetermine Concentration: 1975-1988, (in Turkish) TÜSES, Istanbul.
Kaytaz, E; S, Altýn and M, Güneº (1993) “Concentration in Turkish ManufacturingIndustry” (in Turkish), TMMOB Proceedings of the Congress on Industry Vol.1, Chamber of Engineers, Ankara.
Kepenek, Y. (1996) “Data on the Turkish Labor Markets from the View Point of ItsUsers” (in Turkish) METU Studies In Development Vol 23 No 1: 35-57.
Köse, A. and E. Yeldan (1998a) “Dynamics of the Turkish Economy in the Process ofOpening”: 1980-1997” (in Turkish) Toplum ve Bilim, Summer, p.45-67.
Köse, A. and E. Yeldan (1998b) “Turkish Economy in 1990s: An Assessment ofFiscal Policies, Labor Markets and Foreign Trade” New Perspectives onTurkey, No: 18, Spring.
Lerner, A.P. (1934) “The Concept of Monopoly and the Measurement of MonopolyPower” Review of Economic Studies 1(3): 157-175.
Maraþlýoðlu, H. and A. Týktýk (1991) “Sectoral Developments in the TurkishEconomy: Production, Capital accumulation, and Employment: 1968-1988”(in Turkish) State Planning Organization, Ankara, mimeo.
Metin-Özcan, K., E. Voyvoda and E. Yeldan (1999) “Dynamics of MacroeconomicAdjustment in A Globalized Developing Economy: Growth, Accumulationand Distribution, Turkey 1969-1998” Bilkent University, Department ofEconomics Discussion Paper, No: 99-5, July.
Milanovic, B. (1986) “Export Incentives and Turkish Manufactured Exports: 1980-1984” World Bank Staff Working paper, No. 602.
Onaran, Ö. (2000) “Labor Market Flexibility During Structural Adjustment inTurkey” Istanbul Technical University Discussion papers in ManagementEngineering, No. 00/1, January.
Pamukcu, T. and Paul de Boer (1999) “Technological change and Industrialization:An Implication of Structural Decomposition Analysis to the Turkish Economy(1968-1990)” Ekonomik Yaklasim 10(32): 5-30.
17
Selçuk, F. (1997) “Consumption Smoothing and Current Account: TurkishExperience, 1987-1995” METU Studies in Development, 24(4): 519-530.
ª ahinkaya, S (1993) "Sectoral Labor Productivity, Real Wages, and Gross ProfitMargins or Mark-up Rates in Manufacturing Industry (Turkey 1963-1988)”(in Turkish), Toplum ve Ekonomi, No 4.
ª enses, F. (1996) “Structural Adjustment Policies and Employment in Turkey”Middle East Technical University EDC Working Paper No 96/01.
ª enses, F. (1994) “The Stabilization and Structural Adjustment Program and theProcess of Turkish Industrialization: Main Policies and Their Impact” in F.ªenses (ed.) Recent Industrialization Experience of Turkey in A GlobalContext Westport, CT: Greenwood Press.
Togan, S. (1993) “How to assess the Significance of the Export Incentives: AnApplication To Turkey” Weltwirtschaftliches Archives.
Türel, O. (1999) “Restructuring the Public Sector in Post-1980 Turkey: AnAssessment” Middle East Technical University, ERC Working Papers, No.99/6.
Uygur, E. (1993) Financial Liberalization and Economic Performance of Turkey TheCentral Bank of Turkey, Ankara.
Uygur, E. (1996) “Export Policies and Export Performance: The Case of Turkey”Ankara University, Faculty of Political Science, mimeo.
Voyvoda, E. and E. Yeldan (1999) “Labor Productivity and the Evolution ofIndustrial Wages in Turkey: A Quantitative Assessment” Bilkent UniversityDepartment of Economics, Working paper No. 99-9, July.
Yalçýn, C. (2000) ‘Price-Cost Margins and Trade Liberalization in TurkishManufacturing Industry: A Panel Data Analysis” Central Bank of the Republicof Turkey, Research Department, March, mimeo.
Yeldan, E. and A. Köse (1999) “An Assessment of The Turkish Labor MarketAgainst its Macroeconomics Policies”, in T. Bulutay, (ed) The BurdensRelated with Turkish Labor Markets and Policies, State Institute of Statistics,Ankara.
Yeldan, E. (1995) “Surplus Creation and Extraction under Structural Adjustment:Turkey, 1980-1992” Review of Radical Political Economics, 27(2): 38-72,June.
Yentürk, N. (1999) “Short term Capital Inflows and Their Impact on MacroeconomicStructure: Turkey in the 1990s”, The Developing Economies, 37(1): 89-113.
Yentürk, N. (1997) Türk Ýmalat Sanayiinde Ücretler, Ýstihdam ve Birikim, FriedrichEbert Stiftung, Ýstanbul.
18
Yentürk, N. and Onaran, Ö (1999) “Do Wages Stimulate Investments? An Analysis ofthe Relationship Between Wages and Investments in the TurkishManufacturing Industry”. Istanbul Technical University Discussion papers inManagement Engineering, No. 99/11, December.
SectorsConcentration Ratios (CR4)
Foreign Trade Ratio to Value
Added
Share of Public Sector in Value
Added
Share of Labor Costs in Value
AddedGrowth in Real
Wages (%)
Growth in Real Average Product
of Labor (%)
Gross Profit Margins (Mark-
up)Concentration Ratios (CR4)
Foreign Trade Ratio to Value
Added
Share of Public Sector in Value
Added
Share of Labor Costs in Value
Added
Growth in Real Wages
(%)
Growth in Real Average Product
of Labor (%)
Gross Profit Margins (Mark-
up)
Competitive sectors (as of 1980)311 10.2 0.38 0.33 0.33 5.50 41.57 0.21 11.6 0.92 0.29 0.23 -3.721 6.74 0.21312 22.1 0.57 0.50 0.43 1.91 40.92 0.17 23.3 0.47 0.43 0.23 -4.469 10.85 0.17321 12.7 0.29 0.14 0.34 17.99 13.11 0.31 9.2 0.81 0.12 0.26 -0.804 7.62 0.32322 21.3 2.18 0.02 0.36 -10.84 44.45 0.21 19.2 4.63 0.01 0.20 -0.616 11.10 0.27323 21.6 0.03 0.00 0.46 3.28 60.87 0.14 18.3 0.70 0.00 0.22 -3.921 8.63 0.22331 19.9 0.08 0.37 0.37 3.63 -7.40 0.29 17.1 0.97 0.39 0.24 -4.366 6.66 0.24352 21.2 0.29 0.05 0.28 0.49 43.18 0.27 22.6 0.52 0.04 0.18 0.75 11.48 0.38356 25.4 0.02 0.01 0.27 8.71 -4.39 0.28 21.0 0.25 0.00 0.21 -1.55 6.92 0.24369 17.0 0.19 0.20 0.28 -2.61 47.85 0.44 18.5 0.43 0.22 0.19 -0.47 5.67 0.49381 16.3 0.72 0.07 0.30 13.85 8.34 0.40 14.9 2.66 0.08 0.23 -0.80 7.91 0.37383 15.0 0.60 0.29 0.32 -8.37 13.63 0.36 24.9 1.23 0.07 0.19 -1.91 8.88 0.42Average - 0.39 0.15 0.33 2.77 26.54 0.28 - 1.04 0.13 0.22 -1.88 8.83 0.33
Imperfectly Competitive & Oligopolistic Sectors (as of 1980)
313 55.8 0.02 0.65 0.18 1.77 37.51 1.17 45.4 0.04 0.61 0.10 -5.27 9.02 1.35
314 46.4 0.00 0.92 0.50 19.24 58.96 0.28 64.9 0.08 0.91 0.11 -7.42 22.61 1.26
324 63.1 0.01 0.53 0.47 26.92 19.53 0.19 49.3 0.32 0.40 0.43 -5.65 45.41 0.18
332 37.5 0.13 0.00 0.31 24.65 109.13 0.31 47.4 0.64 0.19 0.20 3.49 16.00 0.43341 47.4 0.34 0.47 0.52 -15.06 -0.57 0.19 37.0 0.64 0.47 0.23 -7.52 9.83 0.28342 36.5 0.05 0.19 0.52 -0.68 89.56 0.19 38.4 0.14 0.09 0.25 -1.13 13.94 0.41351 49.2 1.78 0.54 0.21 -2.24 -10.13 0.47 41.0 2.84 0.40 0.12 -3.87 12.62 0.35353 100.0 0.71 1.00 0.04 -12.79 180.20 0.37 99.2 0.29 0.86 0.01 -6.30 16.16 0.66354 54.7 0.03 0.08 0.11 2.91 -4.65 0.53 68.9 0.18 0.11 0.06 -3.17 3.03 0.31355 71.5 0.14 0.00 0.26 -0.84 8.92 0.40 70.7 0.42 0.00 0.19 -2.15 7.06 0.38361 79.6 0.03 0.17 0.36 1.94 -7.68 0.72 62.0 0.14 0.14 0.16 -3.10 12.23 0.83362 72.1 0.26 0.00 0.31 40.16 34.15 0.68 61.0 0.56 0.00 0.21 2.65 13.84 0.61371 54.8 0.47 0.67 0.46 6.48 18.68 0.22 43.5 1.50 0.52 0.22 -4.90 12.49 0.23372 47.2 0.35 0.51 0.37 2.18 -17.95 0.30 49.0 1.19 0.35 0.23 -4.52 8.97 0.24382 33.4 1.37 0.22 0.42 9.69 25.45 0.25 38.0 3.03 0.19 0.27 -2.65 9.44 0.29384 35.8 0.70 0.32 0.51 -16.89 22.31 0.21 35.7 1.17 0.12 0.26 -4.35 10.25 0.32
385 32.2 11.05 0.00 0.28 80.61 29.13 0.42 34.7 18.45 0.16 0.30 8.87 12.50 0.37390 42.3 0.54 0.00 0.31 -7.41 -0.76 0.45 37.9 1.22 0.00 0.26 -1.53 2.57 0.40Average - 0.67 0.62 0.28 3.39 83.25 0.34 - 1.04 0.53 0.14 -3.15 12.71 0.46
1981-88
Table 1. Phases of Macroeconomic Adjustment in Turkish Manufacturing, 1980-1997
1980Export-Led Growth
SectorsConcentration Ratios (CR4)
Foreign Trade Ratio to Value
AddedShare of Public Sector
in Value Added
Share of Labor Costs in Value
Added
Growth in Real Wages
(%)
Growth in Real Average Product
of Labor (%)
Gross Profit Margins (Mark-
up)Concentration Ratios (CR4)
Foreign Trade Ratio to Value
Added
Share of Public Sector in Value
Added
Share of Labor Costs in Value
Added
Growth in Real Wages
(%)
Growth in Real Average Product of
Labor (%)
Gross Profit Margins (Mark-
up)
Competitive sectors (as of 1980)311 13.0 0.62 0.31 0.23 16.02 15.78 0.29 14.4 1.20 0.13 0.19 -9.57 -6.22 0.31312 18.7 0.51 0.32 0.37 20.31 5.35 0.16 18.2 1.18 0.13 0.23 -9.55 6.70 0.20321 8.5 0.94 0.07 0.28 7.37 7.10 0.35 7.5 1.76 0.03 0.22 -9.52 -2.42 0.36322 5.6 2.40 0.02 0.20 3.83 7.07 0.30 6.0 1.86 0.02 0.20 -1.58 -1.60 0.31323 27.0 2.24 0.00 0.22 2.38 7.30 0.28 24.1 2.72 0.05 0.20 -2.50 4.36 0.26331 20.5 0.38 0.28 0.32 16.20 10.95 0.24 30.6 0.80 0.11 0.22 -14.41 -3.49 0.28352 22.7 0.52 0.03 0.18 12.68 15.74 0.55 20.4 0.90 0.02 0.15 -6.53 -1.87 0.66356 20.4 0.30 0.02 0.21 8.10 10.86 0.33 20.0 0.93 0.04 0.16 -3.46 -0.43 0.38369 19.5 0.30 0.15 0.20 11.49 13.93 0.65 19.5 0.39 0.04 0.15 -9.92 -3.33 0.72381 18.8 0.80 0.05 0.24 8.37 8.54 0.44 16.7 1.22 0.05 0.19 -6.28 -0.27 0.43383 29.7 1.25 0.01 0.23 13.29 12.64 0.46 24.4 1.95 0.02 0.20 -8.93 -6.08 0.52Average - 0.90 0.10 0.23 11.62 11.69 0.39 - 1.46 0.04 0.19 -7.92 -2.00 0.38
Imperfectly Competitive & Oligopolistic Sectors (as of 1980)
313 33.0 0.04 0.51 0.12 18.43 10.50 1.08 34.6 0.11 0.35 0.10 -10.27 -6.43 0.76
314 59.6 0.22 0.84 0.20 25.05 2.31 0.75 64.5 0.90 0.45 0.23 -9.32 -14.05 0.44
324 37.1 0.52 0.29 0.39 6.14 11.44 0.25 36.5 1.72 0.18 0.27 -9.41 1.19 0.35
332 44.9 0.38 0.00 0.22 9.92 6.48 0.43 40.6 0.72 0.00 0.17 -11.16 -0.88 0.52341 25.6 0.81 0.32 0.35 17.69 5.90 0.31 22.6 1.46 0.19 0.24 -9.04 -3.09 0.40342 50.1 0.12 0.09 0.17 6.67 22.19 0.52 60.0 0.19 0.07 0.14 -3.08 -2.19 0.44351 49.9 2.31 0.38 0.25 15.67 -5.96 0.39 57.4 3.02 0.48 0.16 -6.66 7.14 0.55353 98.1 0.17 1.00 0.02 24.42 9.21 1.12 98.3 0.24 1.00 0.01 -9.65 6.32 1.09354 74.6 0.21 0.08 0.16 14.17 4.64 0.20 63.4 0.16 0.04 0.13 -15.73 2.75 0.43355 71.5 0.55 0.01 0.25 15.83 9.99 0.58 74.8 0.85 0.01 0.20 -7.40 2.18 0.63361 58.8 0.13 0.07 0.19 15.73 13.18 1.06 59.4 0.29 0.05 0.17 -9.02 -7.27 1.04362 51.9 0.49 0.02 0.29 15.81 11.56 0.60 56.9 0.71 0.00 0.25 -4.66 -4.49 0.69371 35.7 1.55 0.39 0.38 18.26 5.59 0.19 31.5 1.75 0.38 0.19 -10.74 9.79 0.32372 46.8 1.08 0.30 0.35 17.66 3.08 0.28 45.4 2.46 0.38 0.23 -10.31 1.42 0.30382 44.8 2.49 0.09 0.26 11.37 11.39 0.39 42.2 4.10 0.07 0.20 -6.97 0.92 0.45384 47.8 0.89 0.07 0.26 14.56 16.16 0.34 41.0 1.91 0.05 0.20 -8.29 -0.69 0.38
385 45.1 6.25 0.11 0.24 8.60 18.60 0.51 56.8 5.58 0.05 0.16 -10.11 1.11 0.59390 29.3 1.83 0.06 0.27 5.74 9.16 0.48 29.2 3.71 0.06 0.18 -6.55 6.87 0.57Average - 0.89 0.43 0.20 15.40 8.53 0.49 - 1.59 0.42 0.14 -8.28 3.24 0.53
Financial Crisis and Re-invigoration of Foreign Capital-Led Growth1994-97
Unregulated Financial Liberalization1989-93
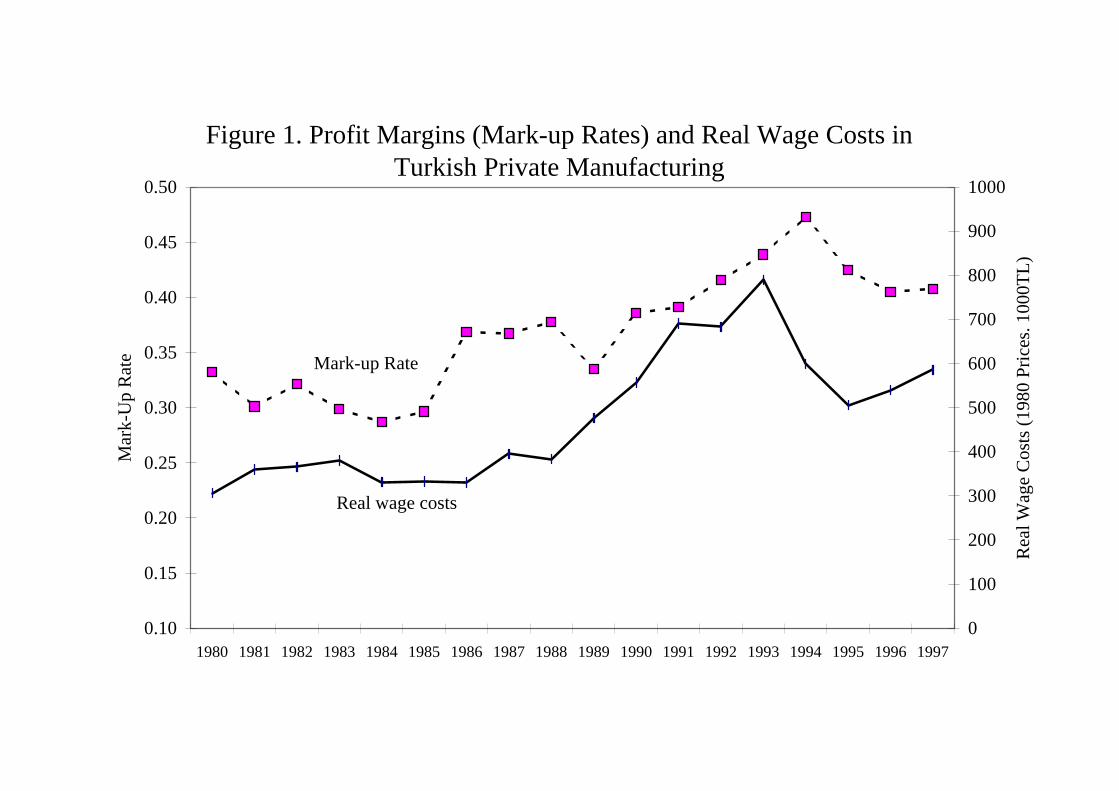
Figure 1. Profit Margins (Mark-up Rates) and Real Wage Costs in Turkish Private Manufacturing
0.10
0.15
0.20
0.25
0.30
0.35
0.40
0.45
0.50
1980 1981 1982 1983 1984 1985 1986 1987 1988 1989 1990 1991 1992 1993 1994 1995 1996 1997
Mar
k-U
p R
ate
0
100
200
300
400
500
600
700
800
900
1000
Rea
l Wag
e C
osts
(19
80 P
rice
s. 1
000T
L)
Mark-up Rate
Real wage costs
Distribution
OpennessConcentration Level
(CR4) Real Wage Costs Adjusted R2
Overall Effect -0.004* 0.181* 0.111* 0.803
Open & competitive -0.002 -0.055 0.130* 0.877
Open & imperfectly competitive -0.003** 0.301** 0.155* 0.654
Inward looking & competitive 0.017** 0.302** 0.183* 0.828
Inward looking & imperfectly competitive 0.039* -0.058 -0.104* 0.568
Trade Adjusting 0.026* 0.091 0.076** 0.781
(FEM with cross-section specific effects)
Cross-Section Effects OpennessConcentration Level
(CR4) Real Wage Costs311 -0.037* 2.548* 0.099**312 -0.014 -0.934* -0.134*313 -2.457** -0.383 -1.167*314 -0.050 3.327 -1.331321 0.014** -0.829* 0.064*322 0.002 -0.074* 0.219*323 0.018** 0.305** -0.021324 0.035 -0.437** -0.130331 -0.016 0.927* -0.276*332 0.063 1.079 0.015341 -0.026 -1.033* -0.217**342 -0.999 0.230 -0.486**351 -0.040* 1.520* -0.196*352 0.256* 0.649 0.691*353 -1.399** 7.777 0.838**354 -0.906 -0.136 -0.353355 -0.041 0.689** 0.489*356 0.097* 1.708* 0.227*361 -1.511 -3.002 -0.268362 -0.291 -0.444 0.068369 -0.572** 2.798** 0.387**371 -0.133* -1.524* -0.346*372 0.032 0.702 0.014381 0.004 1.835* -0.028382 0.004 0.733** 0.157**383 0.031** 0.130 0.167*384 0.042* 0.333* 0.056**385 -0.005** 0.339** 0.067390 0.070* 0.725 0.194
Note: (*) indicates that the coefficient is statistically significant; (**) indicates statistical significance at 5%.
Table2a. Relationship between mark-up rates, openness, concentration ratio, and real wage costs
Table2b. Relationship between mark-up rates, openness, concentration ratio, and real wage costs
Distribution
Mark-up Rates Openness Real Wage Costs Adjusted R2
Overall Effect 0.549* 0.035 0.841* 0.979
Open & competitive 1.975* 0.016 0.934* 0.963
Open & imperfectly competitive 0.207 0.004 0.700* 0.983
Inward looking & competitive 0.456* 0.297* 0.917* 0.992
Inward looking & imperfectly competitive 0.428* 0.249* 0.661* 0.907
Trade Adjusting 0.433** 0.271* 0.806* 0.991
(FEM with cross-section specific effects)
Cross-Section Effects Mark-up Rates Openness Real Wage Costs311 0.096 0.451* 0.948*312 0.991 0.379** 0.476313 1.081** 3.106** 2.244*314 0.602** 0.949* 2.222**321 2.180* 0.445* 0.054322 10.847 0.134 3.153323 -0.894 0.336* -0.245324 1.778** 0.194** 0.618**331 1.446** 0.154 1.666*332 0.556 0.163 0.509341 2.188** 0.147 -0.189342 0.218 -2.164** -0.615**351 -0.129 -0.095 0.089352 -0.157 0.578* 1.311*353 0.565 -0.294 -0.674354 0.090 -0.097 0.806*355 0.460 0.636 0.625356 0.492 0.863* 1.204*361 1.016* 1.848** 0.607**362 1.137 1.325 0.715369 1.230 -0.160 -0.227371 1.464 0.325 0.540372 0.253 -0.081* -0.267*381 1.662 -0.540 1.205**382 -0.096 0.152* 0.687*383 -0.489 0.547** 0.921*384 3.159* 0.042 0.872*385 2.459 0.029 2.580390 0.699 0.161 0.971
Note: (*) indicates that the coefficient is statistically significant; (**) indicates statistical significance at 5%.
Table3a. Relationship between real investment, mark-up rates, openness and real wage costs
Table3b. Relationship between real investment, mark-up rates, openness and real wage costs
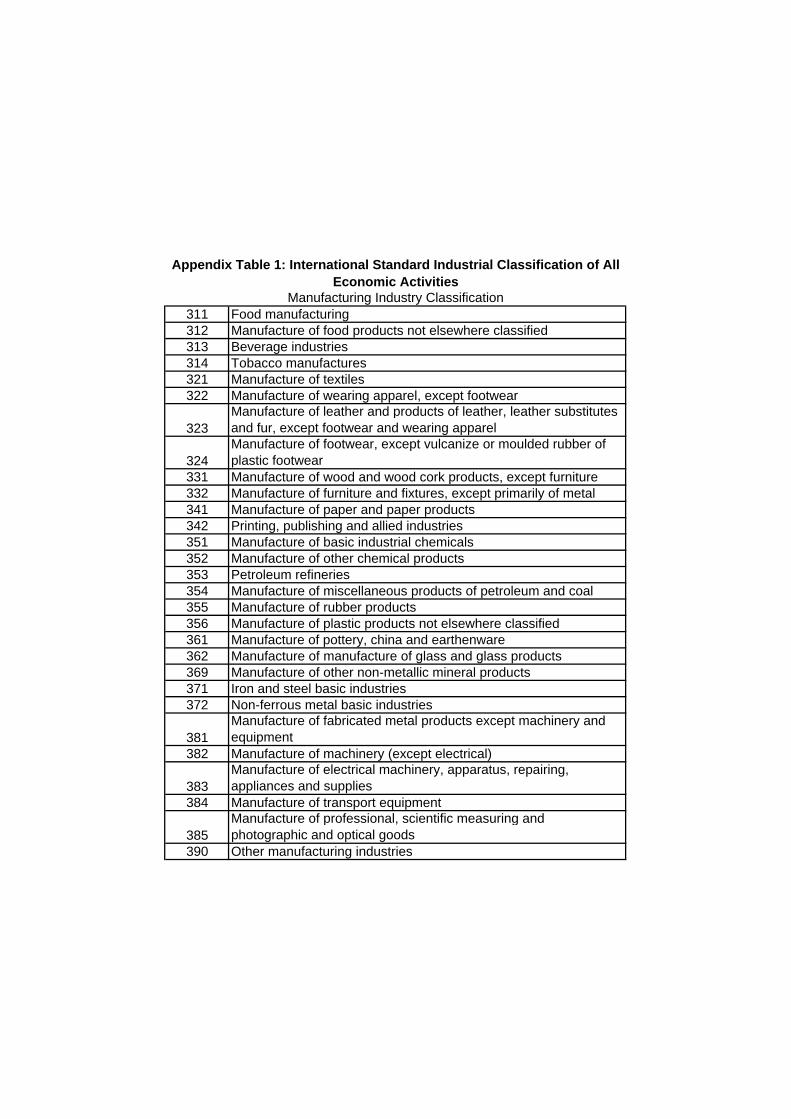
311 Food manufacturing312 Manufacture of food products not elsewhere classified313 Beverage industries314 Tobacco manufactures321 Manufacture of textiles322 Manufacture of wearing apparel, except footwear
331 Manufacture of wood and wood cork products, except furniture332 Manufacture of furniture and fixtures, except primarily of metal341 Manufacture of paper and paper products342 Printing, publishing and allied industries351 Manufacture of basic industrial chemicals352 Manufacture of other chemical products353 Petroleum refineries354 Manufacture of miscellaneous products of petroleum and coal355 Manufacture of rubber products356 Manufacture of plastic products not elsewhere classified361 Manufacture of pottery, china and earthenware362 Manufacture of manufacture of glass and glass products369 Manufacture of other non-metallic mineral products371 Iron and steel basic industries372 Non-ferrous metal basic industries
382 Manufacture of machinery (except electrical)
384 Manufacture of transport equipment
390 Other manufacturing industries
383
385
Manufacture of fabricated metal products except machinery and equipment
Manufacture of electrical machinery, apparatus, repairing, appliances and supplies
Manufacture of professional, scientific measuring and photographic and optical goods
381
Appendix Table 1: International Standard Industrial Classification of All Economic Activities
Manufacturing Industry Classification
Manufacture of leather and products of leather, leather substitutes and fur, except footwear and wearing apparelManufacture of footwear, except vulcanize or moulded rubber of plastic footwear
323
324