Embed Size (px)
Citation preview
Shell Technology Center Bangalore, RMZ Centennial Campus B, #8B, Kundanahalli Main Road,
Bangalore 560048, India.
P-512
On the pore volume compressibility and its application
as a petrophysical parameter
Peter Schutjens *, SHELL, and Wolfgang Heidug
Summary
This paper aims to improve the understanding of the “pore volume compressibility” Cpp in four ways. Firstly, using the theory
of poro-elasticity as outlined in the literature, we re- state the compressibility definitions and the exact equations to calculate
pore volume and porosity change as a function of depletion in a rock on which the total stress does not change. Secondly, we
show the impact of a correct determination of Cpp to describe reservoir pore volume changes as a function of depletion,
highlighting its importance in low-porosity tight sandstones where wrong interpretation of experimental compaction data can
lead to errors of several percent in reservoir fluid volume. Thirdly, we present a method to calculate Cpp from observations
of pore fluid volume expelled from a core sample compacted in a laboratory deformation experiment. Fourthly, having
described and correctly measured Cpp, we focus on its application to determine the in-situ reservoir porosity from porosity
data obtained in the laboratory. In most cases, this is measured in experiments done under increasing isostatic (confining)
pressure and at a constant pore pressure. We present an empirical method, using experimentally measured Cpp and field
stress data, to calculate porosity in a virgin reservoir and in a reservoir that has been depleted under a non-isotropic increase
in effective stress.
Keywords: Pore volume compressibility, reservoir compaction, depletion, laboratory deformation experiment, in -situ
reservoir porosity
Introduction
For decades, the theory of poro-elasticity has been applied
to rocks and excellent descriptions of its foundation,
applications and limitations are given in several textbooks
and in hundreds of papers. Essentially, geomechanicists use
the theory to compute how rocks will deform as a function
of the production-induced decrease in pore fluid pressure
(depletion) and the injection-induced increase in pore fluid
pressure (inflation). Depletion will increase the average
effective stress acting on the load-bearing grain-to-grain
contact framework, and generally leads to compaction
(densification) and to porosity reduction. Inflation of the
pore pressure will be accompanied by bulk rock volume
increase (dilation), a decrease in bulk rock density, and to a
porosity increase. The effect of pore pressure change on
reservoir deformation and its compaction is of prime
interest to the geoscientist worried about damage to well
due to localized high-strain deformation (buckling) or
shearing (Bruno et al. 1990, Sayers et al. 2006), the
formation of subsidence bowls above compacting
reservoirs (Geertsma 1973), and slip along new or geologic
faults induced by reservoir-compaction-induced total stress
changes in the overburden (Segall 1989, Grasso 1992),
possibly affecting caprock-seal integrity. The effect of pore
pressure change on porosity change is of interest primarily
to the reservoir engineer, essentially for three reasons.
Firstly, depletion-induced compaction decreases the pore
volume available for the pore fluid. As a result, the pore
fluid pressure will increase and thus the driving force for
hydrocarbons to flow to the wells will increase. This
“compaction drive” is very important in relatively high-
porosity high-compressibility rocks filled with high-
viscosity ("thick") oil. Understanding compaction drive can
make a significant contribution to flow rate and ultimate
recovery, see Dake (1983), Settari and Walters (1999),
Longuemare (2001) and Sen and Settari (2005).
2
The second reason for the interest in compaction is that it
may change the permeability (see Schutjens et al. 2004). In
most cases observed in the field and in the laboratory,
compaction will lead to a permeability reduction, but very
low-porosity (< 10%) rocks could undergo an increase in
porosity too if cemented zones would break, e.g. due to
grain-scale shearing or differential compaction triggering
faulting.
Thirdly, together with the net reservoir volume (i.e. after
subtraction of the volume of rocks containing no
hydrocarbons), the porosity is a key parameter to determine
the hydrocarbon volume-in-place. Even a small error in
porosity (because of wrong core, bad experiments or
incorrect calculations) can have a huge impact on reservoir
fluid volume. For example, consider the case of an oil field
containing 500 million barrels of oil in a 20%-porosity
reservoir. An error in porosity of 0.1% of its true value
would be equivalent to 2.5 million barrels of oil, which at
today‟s oil prices represents a revenue of about 250 million
USD. Of course, there are many parameters governing in-
situ reservoir fluid volumes, of which porosity is just one.
Yet, in view of the importance of correct reserves
estimation, reservoir engineers take a keen interest in
reservoir porosity and in the compaction reducing it.
Triggered by the interest of the applied geomechanics
community in compaction and its effect on porosity, this
paper has the following aims:
1) To list the definitions of bulk-volume compressibility
and pore-volume compressibility of rocks,
2) To describe a pitfall in the way the pore volume
compressibility is determined in laboratory
deformation experiments on core samples,
3) To propose a method to correct for this, and
4) To present a method to determine in-situ porosity from
a core deformation experiment and field stress data.
Theory
Definitions of compressibility
A porous rock can be subjected to an isostatic stress Pc and
to an internal "pore" pressure (Pp) that acts over the surface
of the pore walls. It is also necessary to account for at least
two different volumes: the bulk volume or outer volume of
the rock (Vb) and the pore volume (Vp), the difference
between the two being the volume (Vr) occupied by
mineral grains. There are four compressibilities that can be
associated with a porous rock, each of which relates
changes in Vb or Vp to changes in either Pc or Pp. Adopting
the notation scheme by Zimmerman et al. (1991) in which
the first subscript indicates the relevant volume change (b =
bulk volume; p = pore volume) and the second subscript
indicates the pressure that is varied (c = Pc, p = Pp), these
compressibilities are defined as follows:
These four definitions are referred to in the paper as
volumetric compressibilities, since they define the response
of a bulk volume or pore volume to a change in confining
pressure or pore fluid pressure. Regarding the sign
convention,
a compressive stress is positive,
a compaction strain (densification) is positive
and defined as = -V/Vref., and
depletion is a decrease from the original reservoir
pore pressure to the actual (depleted) pore pressure,
and thusnegative.
The minus sign in definitions (2) and (4) ensures that these
compressibilities will be positive. The first two of these
compressibilities Cbc and Cbp are each referred to as bulk
volume compressibilities, and involve changes in the
volume of the rock that are measured macroscopically. The
other two compressibilities Cpc and Cpp are pore volume
compressibilities, and express the effect of
pressurevariations on the volume of pore space in the rock.
We will also be concerned with the compressibility Cr of
the individual grains in the load-bearing grain
framework of the rock. This solid-grain compressibility is
defined by
3
Cr is a mechanical property of the material constituting the
rock matrix, in the sense that Cr depends only on the
composition of the grains but not on the rock micostructure
or porosity. To this end, Geertsma (1957, 1973) pointed to
an interesting aspect of Cr of rocks and how it could be
measured in a laboratory. Consider a unit volume of porous
rock, the pores being homogenously distributed throughout
the material and forming a network through which fluids
can flow (a drained system). The system of total stresses
dPc and pore pressure dPp will be denoted by {dPc, dPp}.
For the special loading situation where dPc = dPp = dP, the
resulting incremental stress state in the rock is that of a
uniform isostatic pressure of magnitude dP throughout the
load-bearing grain framework. This state of stress satisfies
the stress equilibrium equations and the boundary
conditions on both the outer and inner surfaces of this
framework. It is important to realize here that the state of
stress and strain within the framework is exactly the same
as that which would occur if the pores were hypothetically
filled up with framework material, and the boundary
conditions on the outer surface were left unchanged
(e.g.,Geertsma 1957). As a result, the volumetric
compaction behavior is governed by the volumetric
compressibility of the grains (often termed grain
compressibility or rock matrix compressibility), that is, by
Zimmerman and coworkers (1986, 1991, 2000) use
the superposition principle of linear elasticity to argue that
the stress increment {dPc, dPp} can be separated into the
sum of the two increments {dPc, 0} and {0, dPp}. Under
successive application of these stress increments the rock
deforms with compressibilities Cbc and Cbp, their difference
being Cr. Accordingly
and, by a similar argument,
Relations between the volumetric compressibilities
As mentioned above, we can measure a change in bulk
volume in response to a change in confining pressure or
pore fluid pressure, but from theoretical considerations we
know that the grains will change their volume as well. How
can we envisage both grain deformation and volume
deformation taking place at the same time? What is their
relative importance, and how will it affect pore volume
change and porosity? Building on the pioneering work of
Biot in the 1940s and 50s, it was Geertsma (1957, 1971,
1973) who brought poro-elasticity into the realm of
production geomechanics. Since then, many workers have
investigated the mechanism of poro-elasticity in rocks
ingreat detail and wrote the books and papers that are used
today. We mention here the work of Rice and Cleary
(1976), Zimmerman (1991, 2000), Berryman (1991, 1992),
Kümpel (1991), Detournay and Cheng (1993),
Charlez(1997), Mavko et al. (1998), Jaeger et al. (2007),
Fjaer, Holt and coworkers (2008) and recently Leroy,
Lehner, and their coworkers (2011). From all their work we
take the considerations, parameters and equations described
below1.
The bulk volume compressibilities Cbc and Cbp and the pore
volume compressibilities Cpc and Cpp can be related
through the Betti reciprocal theorem. This theorem states
that if an elastic body is acted upon by two sets of forces,
say F1 and F2, the work done by F1 acting through the
displacements due to F2 will exactly equal to the work done
by F2 acting through the displacements due to F1. In the
context of our model of a solid with connected pores: The
product of the bulk volume change times the change in pore
pressure Pp (with confining pressure Pc constant) is the
same as the product of the pore volume change times the
change in Pc (with Pp constant).
Applying the Betti theorem to the two pressures considered
here namely {dPc,0} and {0,dPp}, the work W done by the
first pressure acting through the displacements due to the
second pressure is given by
1 The present paper contains no new theory; - all equations shown
here are found in textbooks and papers by the authors listed
here, see the reference section for their papers and books. In the text
below we will not further refer to these sources.

4
where eq. (2) has been used. No minus sign is needed in the
definition of the equation for W12, since a decrease in pore
pressure leads to an decrease in bulk rock volume (i.e., to
compaction). Similarly, W21 is given by:
where eq. (3) has been used. Since an increase in confining
pressure leads to a decrease in pore volume, a minus sign is
introduced in eq. (10) to obtain a positive work.
The Betti reciprocal theorem states that W12 = W21 for all
combinations of pore pressure change and confining
pressure change. Taking then dPc = dPp it follows that
CbpVb = CpcVp.
Since the porosity is defined as Vp/Vb, this results in
From combination of eqs. (7) and (11) follows
which relates the bulk volume compressibility and the pore
volume compressibility at a constant pore fluid pressure.
Combining eqs. (8) and (11) gives:
which relates the bulk volume compressibility and the pore
volume compressibility as a function of pore pressure at a
constant confining pressure. Combination of eqs. (8) and
(12) gives
In the framework of reservoir compaction, this equation
(14) shows that the pore volume reduction under depletion
conditions (at a constant confining pressure) can be
obtained from three parameters:
1) the bulk volume change per unit increase in confining
pressure (Cbc) obtained from experimental
compaction of core at constant pore pressure,
2) the grain compressibility (Cr) which depends on
the rock composition and is well-known for rock
forming minerals (see Mavko et al. 1998), and
3) the porosity , which is typically measured on
core under ambient conditions2.
Defining the Biot-Willis coefficientb as
we can write equation (14) as
Some background on this important parameter b is in the
Appendix. For the practical geomechanicist, it suffices to
know that the Biot-Willis coefficient used in this paper is
b, and that it is determined from comparison of bulk
volume strains induced by changes in confining
pressure and pore pressure. b should not be confused
with p determined from pore volume strains induced by
changes in confining pressure and pore pressure (see the
Appendix).
From combination of eqs. (12) and (15) follows that, in
a compaction experiment at constant pore pressure, we
have
so that, in such an experiment, over a given pressure step,
Poro-elasticity theory also shows that the change in
porosity as a function of change X in confining pressure (at
a constant pore pressure) is equal to the change in porosity
as a function of the change X in pore pressure (at a constant
confining pressure)
but only if it can be assumed that p is 1 (see Appendix). 2Reservoir rock can be damaged at all scales during its coring and
during tripping-induced anisotropic stress relaxation (generating high
shear stress), transport, storage, dehydration, and mechanical
vibration when drilling samples (Hettema et al. (2006). How this will
influence porosity and how to apply a "core damage correction" has
been investigated by Nieto et al. (1994) and Holt et al (2000), but core
analysts continue to struggle with the topic. The "ambient" porosity is
often measured after a small confining stress of a few MPa has been
applied to the sample, in an attempt to close cracks between grains
that formed during and after the coring process.

5
The validity of this assumption for a set of sandstones is
demonstrated in Figure 4 (presented below). By
superposition of the porosity changes in eq. (19) with
respect to reference ref we obtain
Since porosity is such an important parameter for the
reservoir geoscientist, it is tempting to rewrite eq. (20) in
the form of a "porosity compressibility (Cp)"
As outlined by Mavko et al. (1998) and Schutjens et al.
(2004), care must be taken in defining this “porosity
compressibility” in eq. (21). There is confusion about its
definition and there are errors in the literature regarding its
relation to the theory of poro-elasticity. It is advised to use
eqs. (16) and (20) to derive the pore volume
compressibility and porosity change for use in fluid flow
simulators and fluid-volume calculation models. Once the
these are calculated as a function of the change in effective
stress (caused by the combined effect of changes in pore
pressure and total stress), then the porosity can be
calculated separately at the pressure or time step of interest.
Experiment
Introduction
The correct measurement of pore volume compressibility
Cpp of rocks requires three conditions to be fulfilled.
Firstly, the sample must be taken from core of good quality,
i.e. not mechanically disturbed (i.e. no "fresh" fractures,
grain-contact-cement breakage, grains shifted position, etc.)
or chemically altered (e.g. dried out). In this paper we will
assume that this is the case, so we neglect core damage.
Secondly, the correct parameters must be measured, which
requires that the correct equations must be used.
Thirdly, whilst the theory above is for an isotropic increase
in total and effective stress, the depletion-induced stress
path in the reservoir is probably anisotropic in many cases.
This is because, in response to the depletion-induced
reservoir contraction, there will be an orientation-
dependent change in total stress (see Teufel et al. 1991,
Holt 1999, Sayers and Schutjens 2007, Fjaer et al. 2008). In
the vertical direction, the change in total vertical stress per
unit of reservoir depletion, defined here as the
verticalstress path coefficient v = Sv/Pp, will be small.
This is because the Earth surface above the reservoir can
move up and down, i.e. it can be viewed as a "free"
surface". However, at the sides of the reservoir, the
sideburden rock is laterally constrained, and will deform
controlled by poro- elastic or brittle deformation (Hettema
et al. 2000, Zoback 2007). The resulting total stress
change divided by the reservoir pore pressure change
is called the horizontal stress path coefficient h =
Sh/Pp. Because the total horizontal stress varies with
orientation, h will also vary with orientation. In practice,
we use the horizontal stress path coefficients for the
minimum and maximum totalhorizontal stress, defined
h = Sh/Pp and H = SH/Pp, respectively. The
observation that v, h and H in a compacting reservoir
have different magnitudes (which may vary with
depletion) poses the important question on the validity of
volumetric compaction experiments by isostatic loading,
be it conducted by increasing the confining pressure at
constant pore pressure, or by decreasing the pore pressure at
a constant confining pressure. This will be addressed at the
end of the paper. We will first discuss a common mistake
in measuring pore volume compressibility from laboratory
experiments, and present a method to correct for it.
The common (wrong) way to determine the pore
volume compressibility Cpp
We will assume here that the goal of the experiment is
measurement of the change in pore volume per unit
change in depletion at constant confining pressure, defined
as Cpp in equation 16. Driven mainly by cost-cutting and
safety considerations3, some experiments in industry
laboratories are done by increasing the confining pressure
at a constant pore pressure. What is measured is the volume
of expelled pore fluid as a function of confining pressure,
see Figure 1, but not the change in bulk volume of the
3It is faster, cheaper and generally safer to increase only theconfining
pressure with the sample pore space connected to ambient pressure
(one atmosphere) than applying bothconfining pressure and pore fluid
pressure. An important costreduction factor is also that, in the former
test, several samplecan be compacted in one experiment (since only
Pc must bcontrolled), all connected to burettes so the expelled
porvolume can be easily measured, see Figure 1 (for one sample).

6
sample. It is therefore impossible to determine the porosity
from such an experiment (though this is sometimes
reported by the experimentalists of certain laboratories as
"raw data", apparently ready for use in further
modeling work). Clearly, such "porosity data" must have
been computed by either assuming the grains in the rock to
be incompressible
(b = 1 resulting in Vexpelled = Vp = Vb)
which is or (even worse) that there is no bulk volume
change at all.
Figure 1: Measurement of the expelled pore volume during
isostatic compaction (at a constant pore pressure) is not a
measurement of (the change in) bulk volume of the rock sample.
The above equations show that expelled pore fluid alone is
insufficient to determine Cpp, and one either has to assume
a given grain compressibility or assume it is negligible
compared to the bulk volume compressibility Cbc (i.e. that
b = 1). But in doing so, we will be making errors. How
large are these, and should we worry about it given the
other uncertainties in reservoir characterization? The
answer is Yes, and this can be illustrated as follows.
Imagine a set of samples of different porosity in the
range5% to 35% loaded in a laboratory experiment by
increasing the confining pressure by a given amount
(Pc) at a constant pore fluid pressure. This Pc could
be the depletion-induced increase in effective isostatic
(confining) stress, or the depletion proper. We will
assume that the volumetric compressibility of the sample
does not change during loading, and that there is a one-
step porosity change from a reference porosity at a
reference Pc to the porosity at the increased confining
pressure level Pc + Pc. We now define the error index Q1
as the ratio of the incorrect pore volume compressibility
Cpp,incorrect and the correct pore volume compressibility
Cpp,correct. The Cpp,incorrect is the Cpp determined using eq.
(16) using the expelled pore fluid volume to get
calculate Cbc assuming Cr = 0 (b = 1) and thus
Vb=Vp. Cpp,correct is the Cpp with inclusion of the grain
compressibility, so Cr > 0 (b < 1) and Vb > Vp, see
eq. (18). This b can come from literature or because
bulk volume change was measured as well, so b could be
determined with eq. (15). We can now write index Q1 as:
Since Q1 will always be larger than 1 for the real-rock case
of b < 1, this equation shows that neglecting the grain
compressibility will lead to an overestimation of Cpp.
Figure 2 shows Q1 as a function of b for the porosity
range 5% to 35%. The calculations indicate that the error in
Cpp is (1) up to a factor of 2.2 for b in the range 0.6 to 1.0,
and (2) increasing with decreasing b and increasing .
Figure 2: Error index Q1 as a function of coefficient b
Along the same token, we define error index Q2 as the ratio
of incorrect and correct, where incorrect is determined
using eq. (20) based only on measurements of expelled
pore fluid volume and assuming incompressible grains
(sob = 1), while correct is the calculated with inclusion
of grain compressibility (so b < 1),
Since index Q2 will be always be larger than one for the
real-rock case of b < 1, this equation shows that neglecting
the grain compressibility will lead to an overestimation of
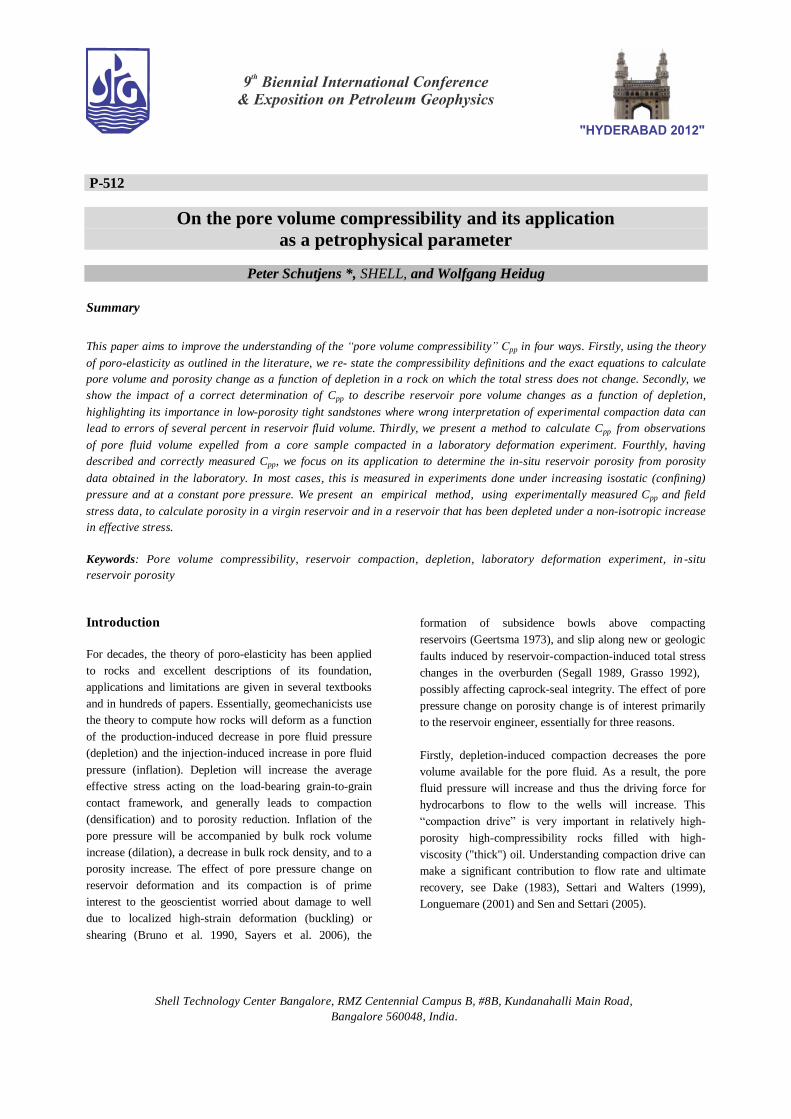
the compaction-induced porosity reduction. Figure 3
shows Q2 as a function of b for the reference porosity
range 5% to 35%. The calculations indicate that the error in
is (1) up to a factor of 2.6 for b in the range 0.6 to 1.0,
and (2) increasing with decreasing b and increasing .
7
Figure 3: Error index Q2 as a function of coefficient b
Figures 2 and 3 are interesting from a rock physics point of
view but not very handy for practical error quantification.
Hence, low porosity rocks (5% to 15% of BV) tend to have
relatively low values of b0.4 to 0.7, whereas high-
porosity rocks ( > 25%) typically have high values of b
close to 1. This can be directly seen from equation 15,
realizing that Cbc in rocks will increase with increasing
porosity, driving b up. So how large are the error indices
Q1 to Q4 for real rocks, like typical reservoir sandstones ?
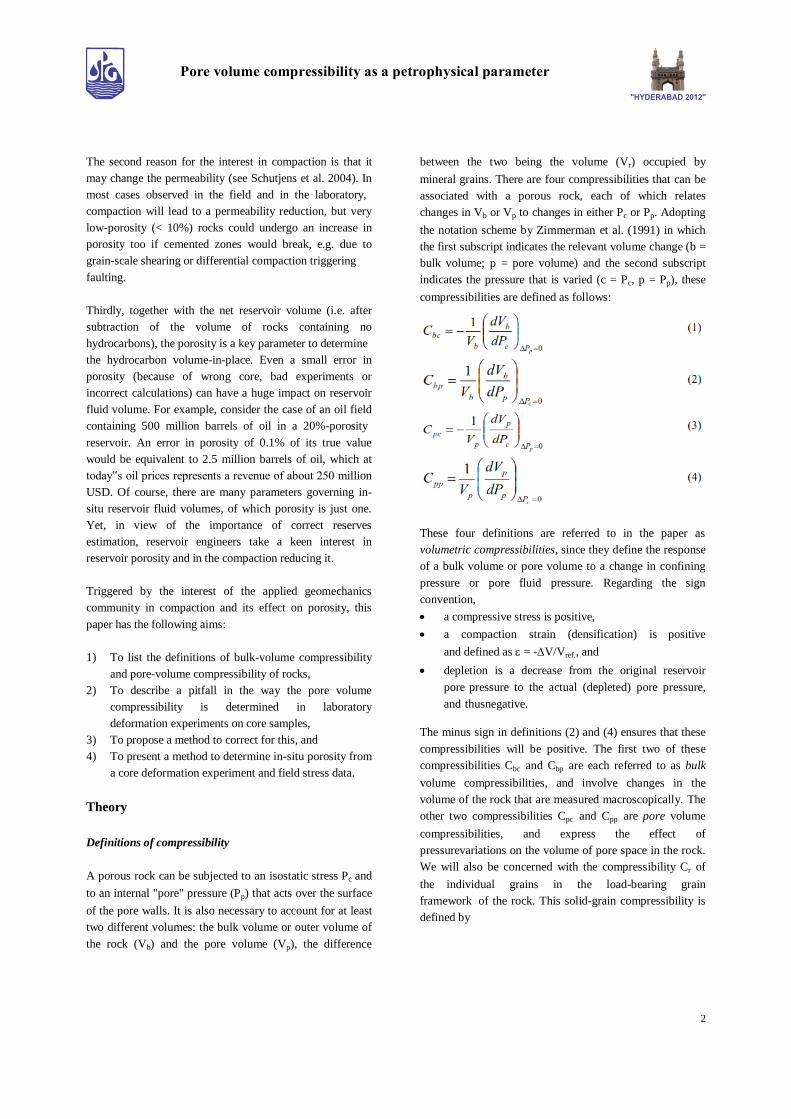
To gain a first insight in the magnitude of such Q-indices,
we will assume a dependence of Cbc on porosity as shown
by the black line in Figure 4. This trend line is based on in-
house data combined with experimental data by Fatt
(1958a,b), Wong et al. and data in Zimmerman (1991).
Figure 4: Models for Cbc and b and p as a function of porosity
This Cbc- dependence is combined in eq. (15) with a Cr
of 2.7 x 10⁻⁵/MPa (of pure quartz) to calculate the
dependence of b and p on porosity. This is also plotted
in Figure 4. As expected, b is increasing with
increasing porosity. Note that p is close to 1, which
validates neglecting p in the derivation of equations (19)
and (20) of compaction- induced porosity reduction (pers.
comm. Peter Fokker).
In what follows, we present calculations of Cpp, and
using the above equations for samples with a porosity
of 5%, 10%, 15%, 20%, 25%, 30% and 35%. In one set,
we will include the grain compressibility, and in the other
set we will neglect it, i.e. we will take Cr = 0, and thus
b=1. The data points (calculation results) are connected by
straight lines to depict the general trend and to highlight the
difference between calculations with and without Cr.
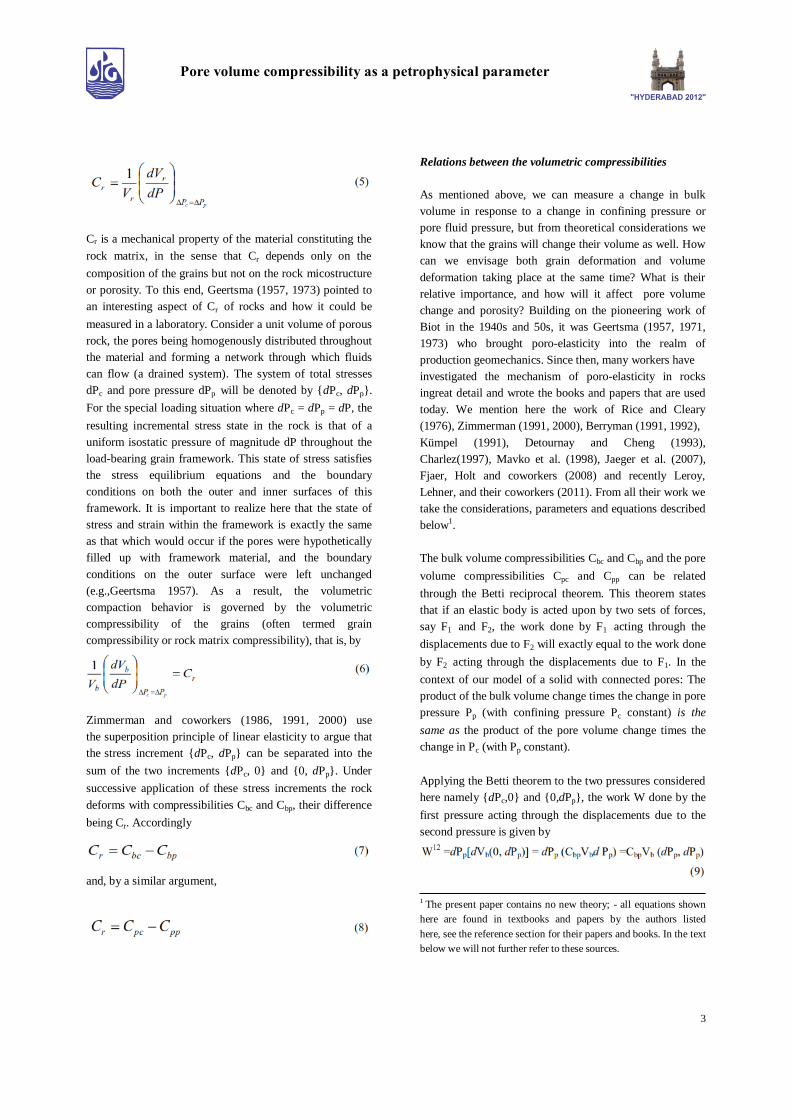
Turning to the pore compressibility values first, Figure 5
shows Cpp,correct and Cpp,incorrect as a function of
porosity using the values for b and Cbc shown in
Figure 4.
Figure 5: Cpp,incorrect and Cpp,correct as a function of porosity
We observe that (1) Cpp,correct is smaller than Cpp,incorrect over
the entire porosity range, (2) this difference decreases with
increasing porosity, and (3) the largest values of Cpp,correct
occur at relatively low and high porosities, and (4) the
lowest values of Cpp,correct are reached around 20% porosity.
The first two observations can be explained using the
equations above. The third and fourth observation
result from the non-linearity in compaction as a function of
porosity shown in Figure 4. In consolidated sandstones, Cpp
typically decreases with increasing porosity up to about
20% porosity. This is because the pore volume
reduction (per unit increase in effective stress) increases
quite slowly over this porosity range, see the linear Cbc-
relation at the left side of Figure 4, showing that the
increase in bulk volume compressibility from 5% porosity
rock to 20% porosity rock is about a factor of two. In
8
contrast, the reference porosity increases by a factor of
four from 5% to20% porosity. Because the relative
increase in reference porosity is larger than the relative
increase in pore volume strain per unit increase in
stress, the pore volume compressibility will decrease
with increasing porosity up to about 20% porosity (see
the left side of Figure 5). At porosity values larger than
about 20%, many sandstones show a higher dependence
of compressibility on porosity than at lower porosity
values. This is also shown in Figure 4, and is attributed
to an increasing contribution of inelastic4 compaction
caused by brittle or crystal-plastic deformation of grains
and cement, enabling grain sliding and grain rotation
(Bernabé et al. 1994, Wong et al. 1992, 1999). This
higher strain (per unit increase in stress) will dominate over
the reference porosity term in the denominator of the Cpp
definition, and results in the increasing Cpp with
increasing porosity shown at the right side of Figure 5.
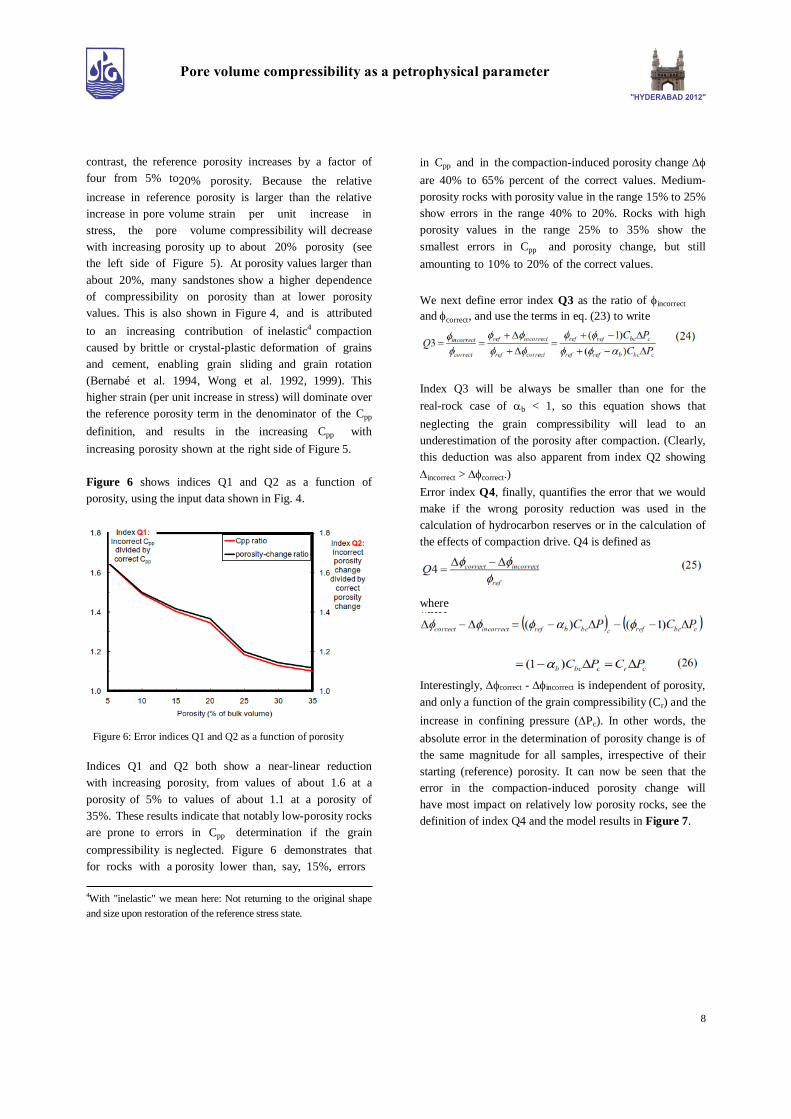
Figure 6 shows indices Q1 and Q2 as a function of
porosity, using the input data shown in Fig. 4.
Figure 6: Error indices Q1 and Q2 as a function of porosity
Indices Q1 and Q2 both show a near-linear reduction
with increasing porosity, from values of about 1.6 at a
porosity of 5% to values of about 1.1 at a porosity of
35%. These results indicate that notably low-porosity rocks
are prone to errors in Cpp determination if the grain
compressibility is neglected. Figure 6 demonstrates that
for rocks with a porosity lower than, say, 15%, errors
4With "inelastic" we mean here: Not returning to the original shape
and size upon restoration of the reference stress state.
in Cpp and in the compaction-induced porosity change
are 40% to 65% percent of the correct values. Medium-
porosity rocks with porosity value in the range 15% to 25%
show errors in the range 40% to 20%. Rocks with high
porosity values in the range 25% to 35% show the
smallest errors in Cpp and porosity change, but still
amounting to 10% to 20% of the correct values.
We next define error index Q3 as the ratio of incorrect
and correct, and use the terms in eq. (23) to write
Index Q3 will be always be smaller than one for the
real-rock case of b < 1, so this equation shows that
neglecting the grain compressibility will lead to an
underestimation of the porosity after compaction. (Clearly,
this deduction was also apparent from index Q2 showing
incorrect > correct.)
Error index Q4, finally, quantifies the error that we would
make if the wrong porosity reduction was used in the
calculation of hydrocarbon reserves or in the calculation of
the effects of compaction drive. Q4 is defined as
where
Interestingly, correct - incorrect is independent of porosity,
and only a function of the grain compressibility (Cr) and the
increase in confining pressure (Pc). In other words, the
absolute error in the determination of porosity change is of
the same magnitude for all samples, irrespective of their
starting (reference) porosity. It can now be seen that the
error in the compaction-induced porosity change will
have most impact on relatively low porosity rocks, see the
definition of index Q4 and the model results in Figure 7.

9
Figure 7: Error index Q4 as a function of porosity
Based on Figure 7, for low-porosity rocks of 5% to 10%
porosity, a wrong interpretation of a compaction
experiment by neglecting the grain compressibility leads to
an error of the in-place pore fluid volume of 2% to 3% (of
to the correct volume). For relatively high-porosity rocks in
the range 25% to 35% this reduces to around 0.5%. Yet, in
absolute terms, because of the relatively high porosity, such
an error may involve considerable volumes of pore fluid
and thus have a significant impact on models for fluid
flow and ultimate recovery, and thus on the field
economics.
A method to estimate Cpp from pore fluid expulsion data
Armed with insight in the theory of pore volume
compressibility, we now proceed to present a method to
determine Cpp from a compaction experiment where (1)
only expelled pore fluid volumes have been measured as a
function of confining pressure and (2) we can assume
that the sample is fully saturated with pore fluid and
drained to1 atmosphere (i.e. all pores are connected, so
there is a homogeneous pore pressure). Also, we know
(1) the bulk volume of sample at the reference pressure,
and (2) the reference porosity, typically this is the porosity
at a reference pressure, e.g. 1 atm. or the confining
pressure representing the effective isostatic stress before
depletion.
Step 1: Estimate the Biot-Willis coefficient alpha (b1)
using equation 15. For quartz rich sandstones use Cr = 2.7 x
10-5/MPa, see Mavko et al. (2008) for other rocks. We get
In this equation, Cbc,1 is the bulk volume compressibility
defined for practical purposes (not theoretically correct) as
where dVexpelled,total is the total volume of expelled pore
fluid over the total increase in confining pressure
(dPc,full_range), so it is an experiment-average Cbc estimate.
Step 2: Use eq. (18) to estimate the change in bulk volume
from the measurements of expelled fluid at discrete Pc
steps along the loading path, according to
Step 4: Update calculation of b1 using Cbc2 and eq. (15)
Step 5: Approximating the pore volume from Vp,ini and
from dVexpelled = dVpore, and the bulk volume from Vb,ini
and dVb1 calculated above, we calculate the instantaneous
porosity 1 as
The method should now be applied in an iterative
mode, starting at step 2 and ending at step 6, with
iteratively updating the Biot-Willis coefficient bx
until the
trend of Cpp as function of Pc no longer shows strong
changes (i.e. "convergence" is reached). The method
10
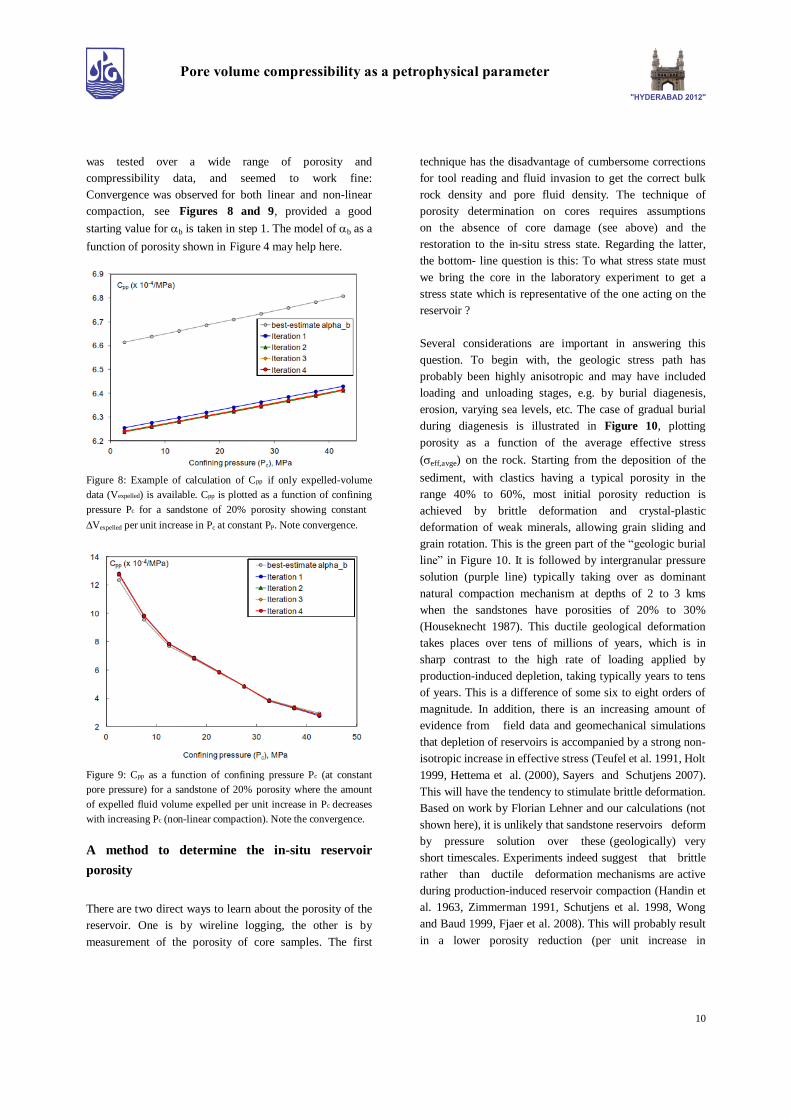
was tested over a wide range of porosity and
compressibility data, and seemed to work fine:
Convergence was observed for both linear and non-linear
compaction, see Figures 8 and 9, provided a good
starting value for b is taken in step 1. The model of b as a
function of porosity shown in Figure 4 may help here.
Figure 8: Example of calculation of Cpp if only expelled-volume
data (Vexpelled) is available. Cpp is plotted as a function of confining
pressure Pc for a sandstone of 20% porosity showing constant
Vexpelled per unit increase in Pc at constant PP. Note convergence.
Figure 9: Cpp as a function of confining pressure Pc (at constant
pore pressure) for a sandstone of 20% porosity where the amount
of expelled fluid volume expelled per unit increase in Pc decreases
with increasing Pc (non-linear compaction). Note the convergence.
A method to determine the in-situ reservoir
porosity
There are two direct ways to learn about the porosity of the
reservoir. One is by wireline logging, the other is by
measurement of the porosity of core samples. The first
technique has the disadvantage of cumbersome corrections
for tool reading and fluid invasion to get the correct bulk
rock density and pore fluid density. The technique of
porosity determination on cores requires assumptions
on the absence of core damage (see above) and the
restoration to the in-situ stress state. Regarding the latter,
the bottom- line question is this: To what stress state must
we bring the core in the laboratory experiment to get a
stress state which is representative of the one acting on the
reservoir ?
Several considerations are important in answering this
question. To begin with, the geologic stress path has
probably been highly anisotropic and may have included
loading and unloading stages, e.g. by burial diagenesis,
erosion, varying sea levels, etc. The case of gradual burial
during diagenesis is illustrated in Figure 10, plotting
porosity as a function of the average effective stress
(eff,avge) on the rock. Starting from the deposition of the
sediment, with clastics having a typical porosity in the
range 40% to 60%, most initial porosity reduction is
achieved by brittle deformation and crystal-plastic
deformation of weak minerals, allowing grain sliding and
grain rotation. This is the green part of the “geologic burial
line” in Figure 10. It is followed by intergranular pressure
solution (purple line) typically taking over as dominant
natural compaction mechanism at depths of 2 to 3 kms
when the sandstones have porosities of 20% to 30%
(Houseknecht 1987). This ductile geological deformation
takes places over tens of millions of years, which is in
sharp contrast to the high rate of loading applied by
production-induced depletion, taking typically years to tens
of years. This is a difference of some six to eight orders of
magnitude. In addition, there is an increasing amount of
evidence from field data and geomechanical simulations
that depletion of reservoirs is accompanied by a strong non-
isotropic increase in effective stress (Teufel et al. 1991, Holt
1999, Hettema et al. (2000), Sayers and Schutjens 2007).
This will have the tendency to stimulate brittle deformation.
Based on work by Florian Lehner and our calculations (not
shown here), it is unlikely that sandstone reservoirs deform
by pressure solution over these (geologically) very
short timescales. Experiments indeed suggest that brittle
rather than ductile deformation mechanisms are active
during production-induced reservoir compaction (Handin et
al. 1963, Zimmerman 1991, Schutjens et al. 1998, Wong
and Baud 1999, Fjaer et al. 2008). This will probably result
in a lower porosity reduction (per unit increase in

11
illustrated by the blue line in Fig. 10. Coring and
subsequent reloading of core samples in the laboratory takes
place at loading rates of hours to days, so at rates that are
three to four orders of magnitude higher than during
production (so 10 to 12 o.o.m. faster than by geologic
burial). The associated porosity change is the red line in
Figure 10 (assuming no hysteresis) and is often
measured under isostatic loading by increasing the
confining pressure at a constant pore pressure (see Fig. 1).
Figure 10: Cartoon of porosity evolution in sandstone as a function
of the average effective stress. The green and purple lines indicate
mechanical compaction and chemical compaction by diagenetic
burial. Starting from the present-day in-situ stress (black dot), the
blue line indicates reservoir compaction caused by production-
induced depletion. The red line is the unloading-reloading during
coring and reloading in the laboratory test (no hysteresis assumed).
With such huge differences in loading rate and stress path,
and with different deformation mechanisms acting during
diagenesis, production and experimental loading, what
hope can we have to restore the in-situ stress state and thus
get the correct in-situ porosity from the experiment ?
Fortunately, there are a few insights that we can use.
Firstly, consider Figure 10 again. The geological loading
probably occurs on a different porosity-stress trend than the
man-induced loading by reservoir depletion and in the
laboratory experiment. For the problem of stress
restoration, frankly, we do not need to understand the stress
path and mechanism of geological loading, as our starting
point is the in-situ stress (indicated by the black dot).
Secondly, regarding the validity of isostatic loading in
relation to the real (probably anisotropic) stress state and
stress path, Schutjens et al. (2004) compared experimental
compaction data collected on consolidated-sandstone
samples with an initial porosity ranging from 5% to 35%
and loaded by a variety of stress paths. They observed that
porosity reduction was mainly controlled by the “average
effective stress” defined as:
and not a (strong) function of stress path5. This is good
news, as it simplifies our laboratory experiment: All we
apparently need to do is apply the correct average effective
stress state acting on the reservoir6.
In equation (27), the total vertical stress is determined by
integration of the bulk rock density over depth of burial7.
The minimum total horizontal stress can be determined
from (extended) Leak-Off tests or from injection tests
(mini/micro-fractures, hydraulic fractures) and is defined as
so the equation for the average effective stress reduces to
Figure 11 shows the application of the above eff,avge
restoration technique to a non-linearly compacting
sandstone with an ambient porosity of 23%. (Note
again that we neglect porosity differences between
core and reservoir caused by core damage or by the
application of a different stress path during coring and
during reloading in the laboratory deformation
experiment).
5
We assume here that the Cartesian stresses are equal to the
principal stresses and that Sh = SH (good first-order assumption). 6
The effective stress state in the Earth should be defined with
total stress and pore pressure only, i.e., without including b
because the present-day „„geologic‟‟ stress state in rocks cannot be
viewed as a stress change from a reference condition, controlled by
poro-elastic deformation.
7 Note that this gives Sv for a horizontal pancake-shaped reservoir
of infinite lateral extent (quite an unrealistic geology).
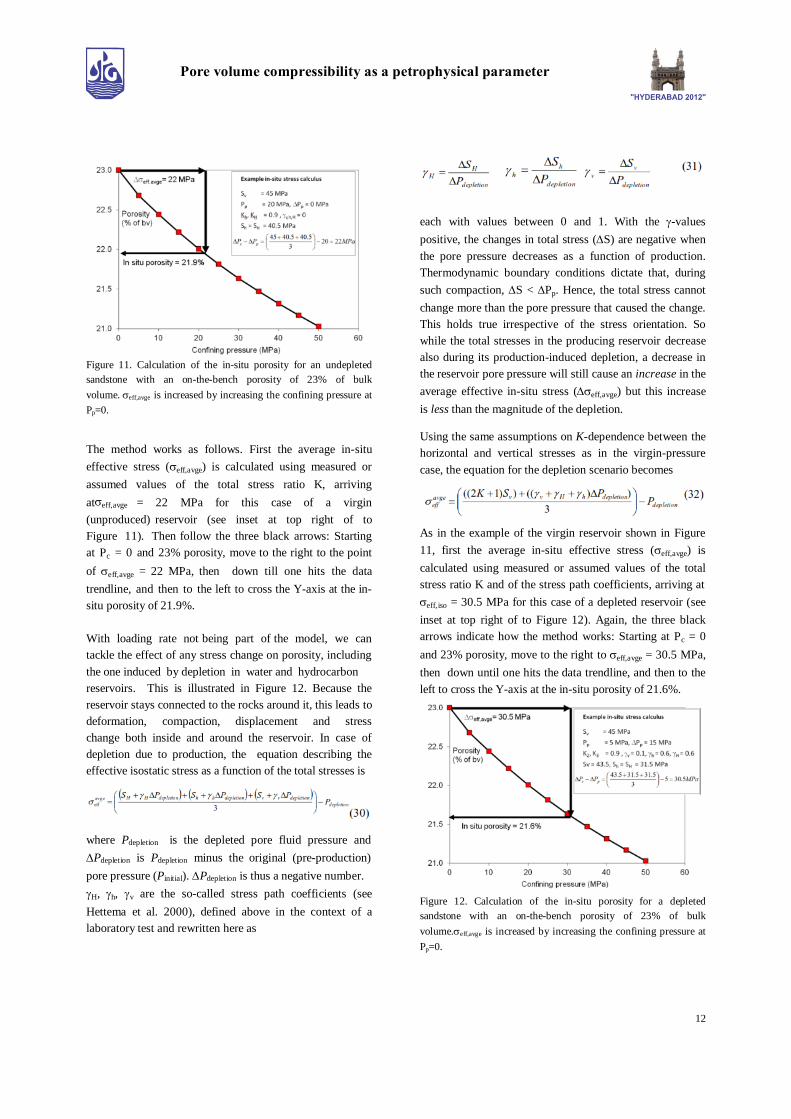
12
Figure 11. Calculation of the in-situ porosity for an undepleted
sandstone with an on-the-bench porosity of 23% of bulk
volume.eff,avge is increased by increasing the confining pressure at
Pp=0.
The method works as follows. First the average in-situ
effective stress (eff,avge) is calculated using measured or
assumed values of the total stress ratio K, arriving
ateff,avge = 22 MPa for this case of a virgin
(unproduced) reservoir (see inset at top right of to
Figure 11). Then follow the three black arrows: Starting
at Pc = 0 and 23% porosity, move to the right to the point
of eff,avge = 22 MPa, then down till one hits the data
trendline, and then to the left to cross the Y-axis at the in-
situ porosity of 21.9%.
With loading rate not being part of the model, we can
tackle the effect of any stress change on porosity, including
the one induced by depletion in water and hydrocarbon
reservoirs. This is illustrated in Figure 12. Because the
reservoir stays connected to the rocks around it, this leads to
deformation, compaction, displacement and stress
change both inside and around the reservoir. In case of
depletion due to production, the equation describing the
effective isostatic stress as a function of the total stresses is
where Pdepletion is the depleted pore fluid pressure and
Pdepletion is Pdepletion minus the original (pre-production)
pore pressure (Pinitial). Pdepletion is thus a negative number.
H, h, v are the so-called stress path coefficients (see
Hettema et al. 2000), defined above in the context of a
laboratory test and rewritten here as
each with values between 0 and 1. With the -values
positive, the changes in total stress (S) are negative when
the pore pressure decreases as a function of production.
Thermodynamic boundary conditions dictate that, during
such compaction, S < Pp. Hence, the total stress cannot
change more than the pore pressure that caused the change.
This holds true irrespective of the stress orientation. So
while the total stresses in the producing reservoir decrease
also during its production-induced depletion, a decrease in
the reservoir pore pressure will still cause an increase in the
average effective in-situ stress (eff,avge) but this increase
is less than the magnitude of the depletion.
Using the same assumptions on K-dependence between the
horizontal and vertical stresses as in the virgin-pressure
case, the equation for the depletion scenario becomes
As in the example of the virgin reservoir shown in Figure
11, first the average in-situ effective stress (eff,avge) is
calculated using measured or assumed values of the total
stress ratio K and of the stress path coefficients, arriving at
eff,iso = 30.5 MPa for this case of a depleted reservoir (see
inset at top right of to Figure 12). Again, the three black
arrows indicate how the method works: Starting at Pc = 0
and 23% porosity, move to the right to eff,avge = 30.5 MPa,
then down until one hits the data trendline, and then to the
left to cross the Y-axis at the in-situ porosity of 21.6%.
Figure 12. Calculation of the in-situ porosity for a depleted
sandstone with an on-the-bench porosity of 23% of bulk
volume.eff,avge is increased by increasing the confining pressure at
Pp=0.
13
The topic of reservoir stress path and its effect on
geomechanics is just a few decades old, and insight grows
as more field data becomes available. Typical values for the
stress path coefficients v, h, H are v = 0.05, and h = H =
0.4 to 0.8, see Sayers and Schutjens (2007). Reservoir
structure, mechanical rock property contrast, and
overpressure all affect the -values. Ideally, one would like
to measure the stress path coefficients, e.g. by plotting LOT
field data as a function of depletion. Unfortunately, such
data is scarce, and often recourse is taken to poro-elastic
theory. Numerical geomechanical simulation can also give
insight in the stress path coefficients (see e.g., De Gennaro
et al. 2010, Schutjens et al. 2011) but these models must be
calibrated with good-quality field data before they can be
used to predict geomechanical effects of production.
Conclusions and recommendation
1) The theory of poro-elasticity shows that it is
impossible to determine the porosity from laboratory
compaction tests where only expelled pore volume is
measured as a function of confining pressure. Such
"porosity data" must be treated with great care (or
even better: be discarded) because it must have
been computed by either assuming the grains in
the rock to be incompressible (b=1, which is
physically impossible), or (even worse) that there is no
bulk volume change.
2) Poro-elasticity theory was used to quantify the errors
made when the grain compressibility is neglected
in analyzing rock compaction data. For sandstones,
both the ratio of the wrong over the correct pore
volume compressibility (termed error index Q1 in
this paper) and the ratio of the wrong over the correct
porosity change (termed error index Q2) are larger
than 1 and show a near-linear dependence on porosity
from values of about 1.6 at a porosity of 5% to
values of about 1.1 at a porosity of 35%. So, our
analysis indicates that notably low-porosity rocks are
prone to errors in Cpp determination if the grain
compressibility is neglected.
3) For low-porosity rocks of 5% to 10% porosity,
the wrong interpretation of a compaction experiment
by neglecting the grain compressibility can easily
lead to an error of the in-place pore fluid volume of
2% to 3%. For relatively high-porosity rocks in the
range 25% to 35% this error reduces to around 0.5%.
Such errors may involve considerable pore fluid
volumes, and may impact models for production and
ultimate hydrocarbon recovery and thus the return on
investment in the field.
4) Methods were presented to calculate (1) Cpp from
a laboratory experiment where only expelled pore
fluid data is available, and (2) in-situ porosity of a
reservoir before and after depletion-induced
compaction.
5) In calculating in-situ porosity, we assumed that the
compaction-induced porosity reduction is only a
function of the average effective stress eff,avge and
not of the effective stress path that the sample has
“travelled” since it was cored from the reservoir.
Experimental justification by Schutjens et al.
(2004) that this assumption is, to a first order, valid
for sandstones should be confirmed by new
experiments.
Acknowledgements
Valuable advice and support was given by Florian Lehner,
Jan Coremans, Peter Fokker, Famke Kraaijeveld, Boris
Kuvshinov, Sergio de Gennaro, Dirk Doornhof, Hajo van
Hasselt, Bob Smits, Richard Hakvoort, André de Kuijper,
Ibbel Ansink and Rupal Joshi. Shell Exploration and
Production is thanked for permission to publish this paper.
List of symbols

14
References
Bernabé, Y., D.T. Fryer and R.M. Shively, 1994,
Experimental observations of the elastic and inelastic
behavior of porous sandstones; Geophys. J. Int. Vol. 117,
p. 403-418.
Berryman, J. G., 1992, Effective stress for transport
properties of inhomogeneous porous rock; Journal of
Geophysical Research, 97,17409–17424.
Berryman, J. G., 1993, Effective stress rules for pore-fluid
transport in rocks containing two minerals; International
Journal of Rock Mechanics, 30,1165–1168.
Biot, M.A., 1941, General theory of three-dimensional
consolidation,; Journal of appl. physics, 1941, 12, 155-164.
Biot, M.A., 1955, Theory of elasticity and consolidation
for a porous anisotropic solid; Journal of applied
physics, 1955, 26, 182-185.
Biot, M.A., 1956, General solutions of the equations of
elasticity and consolidation for a porous material;
Journal of applied mechanics, Trans. ASME, 1956, 78, 91-
96.
Biot, M.A. and Willis, D.G., 1957, The elastic coefficients
of the theory of consolidation; Journal of applied
mechanics, 1957, 24, 594-601.
Bruno, M.S., 1990, Subsidence-induced well failure,
SPE 20058, Presented at the 60th California Reg. Meeting,
Ventura, USA, Apr. 4-6 1990, 383.
Charlez, Ph. A. 1997. Rock Mechanics. Vol. 2: Petroleum
Applications. Editions Technip, Paris.
Dake, L.P., 1983, Fundamentals of reservoir
engineering First edition, Elsevier, Amsterdam.
DeTournay, E. and Cheng, A. H.-D., 1993,
Fundamentals of poroelasticity, In: Comprehensive Rock
Engineering (Hudson, ed.), Volume 2: Analysis and design
methods, Pergamon Press, Oxford.
De Gennaro, S., Schutjens, P., Frumau, M. and Fuery, M.,
Ita. J. and Fokker, P., The role of geomechanics in
the development of an HPHT Field; paper presented at the
Am. Rock. Mech. Conference Conference 2010, paper 10-
450.
Fatt, I., 1958a, Compressibility of sandstones at low to
moderate pressures; Bull. of the AAPG 42 (8), 1924-1957.
Fatt, I., 1958b, Pore volume compressibilities of sandstone
reservoir rock; Petroleum Transactions of the AIME 213,
362-364.
Fjaer, E., R.M. Holt, P. Horsrud, A.M. Raaen and R.
Risnes, 2008, Petroleum related rock mechanics; 2nd
edition. Developments in Petroleum Science Vol. 53.
Geertsma, J., 1957, The effect of fluid pressure decline on
volumetric changes of porous rocks; Rock Mech. Min.
Sci., 1957, 9, 757-766.
Geertsma. J., 1973, A basic history of subsidence due to
reservoir compaction: The homogeneous case; Verh. Kon.
Geol. Mijnbouwk. Gen. 28, 1973, 43-62.
Geertsma, J., 1973, Land subsidence above compacting oil
and gas reservoirs; J. Petroleum Techn. Vol. 25, 1973, 734.
Grasso, J.R., 1992, Mechanics of seismic instabilities
induced by the recovery of hydrocarbons; Pure and
Applied Geophysics 139, No 3/4, 507-534.
Handin, J., R.V. Hager, M. Friedman and J.N. Feather,
1963, Experimental deformation of sedimentary rock under
confining pressure: Pore pressure effects; AAPG
Bulletin, 47, p. 717-755.
Hettema, M.H.H., Schutjens, P.M.T.M., Verboom, B.J.M.
and Gussinklo, H.J.: 2000 Production-induced
compaction of a sandstone reservoir: The strong
influence of stress path. SPE Reservoir Eval. & Eng.
Volume 3(4), 2000, 342.
Hettema, M., Hanssen, T. and Jones, B.L. 2006,
Minimising coring-induced damage in consolidated rock;
SPE/ISRM 78156.
Holt, R.M. 1999. Reservoir stress path: Evaluation of core
and field data. In: Rock mechanics for industry, Amadei,
Kranz, Scott and Smeallie (eds). Balkema, Rotterdam.
Holt, R.M., Brignoli, M. and Kenter, C., 2000, Core
quality: quantification of coring-induced alteration; Int. J.
Rock mechanics and Mining sciences 37, p. 889-907.
15
Houseknecht, D.W., 1987, Assessing the relative
importance of compaction processes and cementation to
reduction of porosity in sandstones; Bull. Am. Ass. Petrol.
Geol., 1987, 71, 633.
Jaeger, J.C., Cook, N.G.W. and Zimmerman, R.W. 2007.
Fundamentals of rock mechanics. 4th ed. Blackwell Publ.
Kümpel, H-J, Poroelasticity: parameters reviewed;
Geophys. J. Int. 1905, 783-799.
Leroy, Y. and Lehner, F.K. (eds), 2011, Mechanics of
crustal rocks. CISM Courses and lectures, Vol. 533.
Published by the Int. Center for Mechanical Sciences.
Springer (Wien, New York).
Lehner, F.K., 2011, A review of the linear theory of
anisotropic poroelastic solids. In: Leroy, Y. and Lehner,
F.K. (eds) 2011. Mechanics of crustal rocks. CISM Courses
and lectures, Vol. 533. Published by the Int. Center for
Mechanical Sciences. Springer (Wien, New York).
Longuemare, P. (ed.) 2001, Geomechanics in reservoir
simulation; Les Rencontres scientifiques de l'IFP, Dec. 5-7
2001, Rueil Malmaison, France. Editions Technip.
Nieto, J.A., Yale, D.P. and Evans, R.J., 1994, Improved
methods for correcting core porosity to reservoir
conditions; The Log Analyst, May-June 1994.
Rice, J.R. and Cleary, M.P., 1976, Some basic stress
diffusion solutions for fluid-saturated elastic porous media
with compressible constituents; Rev. Geophys. & Space
Physics 14, 227-241.
Sayers C.M., Den Boer, L., Lee, D., Hooyman P. and
Lawrence R., 2006, Predicting reservoir compaction and
casing deformation in deepwater turbidites using a 3D
mechanical earth model; SPE 103926.
Sayers, C.M and Schutjens, P.M.T.M. 2007, An
introduction to reservoir mechanics; The Leading Edge,
26, 597-601.
Sen, V. and Settari, T., 2005, Coupled geomechanical and
flow modelling of compacting reservoirs. The Leading
Edge December 2005 v. 24 no. 12 p. 1284-1286.
Segall, P., 1989, Earthquakes triggered by fluid extraction;
Geology 17, 942-946.
Settari, T. and D. Walters, 1999, Advances in coupled
geomechanics and reservoir modelling with applications to
reservoir compaction; SPE 51927.
Schutjens, P.M.T.M. and H. de Ruig, 1997, The
influence of stress path on compressibility and
permeability of an overpressured reservoir sandstone :
Some experimental data. Phys. Chem. Earth 22, N° 1-2, p.
97-103.
Schutjens, P.M.T.M., T.L. Blanton, J.W. Martin, B.C. Lehr
and M.N. and Baaijens, 1998. Depletion-induced
compaction of an overpressured reservoir sandstone:
Experimental approach. SPE/ISRM 47277, p. 53-62.
Schutjens, P.M.T.M., Hanssen, T.-H., Hettema, M.H.H..
Merour, J., Bree, Ph. De, Coremans J.W.A., and Helliesen,
G., 2004, Compaction-induced porosity/permeability
reduction in sandstone reservoirs: Data and model for
elasticity-dominated deformation. SPE 71337.
Schutjens, P.M.T.M., Snippe, J.R., Mahani, H., Turner, J.,
Ita, J. and Mossop A. P. (2011) Production-induced stress
change in and above a reservoir pierced by two salt domes:
A geomechanical model and its applications; SPE 131590.
Teufel, L.W., Rhett, D.W. and Farrell, H.E., 1991, Effect of
reservoir depletion and pore pressure drawdown on in situ
stress and deformation in the Ekofisk field, North Sea.
Published in: Roegiers (ed.) Rock Mechanics as a
Multidisciplinary Science, Balkema, 1991, 63-72.
Wong, T.-f., H. Szeto and J. Zhang, 1992, Effect of loading
path and porosity on the failure mode of porous rocks;
Appl. Mech. Rev. 45, p. 281-293.
Wong, T.-f. and P. Baud, 1999, Mechanical compaction
of porous sandstone; Oil & Gas Science and Technology
– Rev. IFP, Vol. 54, p. 785-797.
Zimmerman, R.W., Somerton, W.H. and King, M.S., 1986,
Compressibility of porous rocks; J. Geophys. Res. 91,
12765-12777.
Zimmerman, R.W., 1991, Compressibility of sandstones;
Developments in Petroleum Sci. 29, Elsevier, Amsterdam.
Zimmerman, R.W., 2000, Pore compressibility under
uniaxial strain. In: Carbognin, L., G. Gambolati and A. I.
Johnson (eds). Land Subsidence. Proceedings of SISOLS,
Ravenna (Italy), September 2000. p. 57-65.

16
Zoback et al., 2007, Reservoir mechanics. Cambridge
University Press.
Appendix
The Biot-Willis coefficient
Since pore pressure and confining pressure tend to have
opposite effects on rock volume (as well as on most
petrophysical properties), it is convenient to subtract some
fraction of the pore pressure from the confining pressure,
and then treat the resulting "effective" pressure Pe as a
single variable. The Biot-Willis coefficient (or Biot-
coefficient) appears in the definition of poro-elastic
effective stress to take this into account.
Following Zimmerman and coworkers (1991, 2000), and
using the work of Betti (1991, 1992), Jaeger et al. (2007)
and Lehner (2011), the general form for expressing the
effective stress concept for elastic porous rock deformation
are the following equations for bulk and pore strains
Here Cbc and Cpc depend on the variables Pc - mbPp and Pc -
mpPp, i.e. Cbc = Cbc(Pc - mbPp), Cpc = Cpc(Pc - mpPp), with
the effective stress coefficients m governing the manner in
which the compressibilities vary with pressure. Exploiting
the fact that b and p are single-value functions of Pc and
Pp, it can be shown that mb
= mp = 1 (see Zimmerman,
1991, p. 42 and p. 43). The coefficients b and p reflect
the relative amounts of additional strain caused by
increments in the pore and confining pressure, and are
called the Biot-Willis coefficients.
From geometrical arguments it follows that the bulk and
pore strain increments can be expressed in terms of the rock
compressibilities as
Comparison of eqs. (A1 - A4) shows that the Biot-Willis
coefficients b and p are simply equal to the ratios of the
appropriate compressibilities,
where the relationships between the various types of
volumetric compressibilities have been used. Essentially b
is determined from comparison of bulk volume strains
induced by changes in confining pressure and pore
pressure, and p from comparison of pore volume strains.
Note that both coefficients are in the range 0 to 1 and that
p > b. Both coefficients can be measured in the
laboratory, but such experiments are quite difficult because
of the small strains involved (essentially controlled by grain
compressibility). p is generally quantified from theoretical
considerations and is probably close to 1 in many rocks. In
practical geomechanics, it is often assumed that p = , and
the coefficient is actually b written without subscripts.
Combining eq. (A6) with eq. (12) results in the general
definition of Cpp stated in eq. (14). In the main text, we then
introduce b in the equation (16) for Cpp, which is exact.
However, when dealing with porosity change due to
changes in confining pressure and pore pressure, we can
only write it in the simple form of our eqs. (19) and (20) if
it assumed that Cpp = Cpc, i.e., that p = 1 (pers. comm.
Peter Fokker). The general validity of this assumption is
demonstrated in Figure 4 of this paper using data from
sandstones, but it needs further experimental investigation.
It can be seen by qualitative arguments that the Biot-Willis
coefficient must appear in the general relationship for the
effective stress. Regarding the bulk compressibility case,
which is of interest to modelling compaction and
subsidence, application of pore pressure will have two
effects: (1) to counteract the movement of grains into the
pores and to resist the total stress acting on the rock, and
17
(2) to isostatically compress the grains. The first effect acts
in the opposite direction as the second effect. Writing the
volumetric strain in a poro-elastic material as a sum of
three parts, the first one due to the confining pressure and
the other two due to the pore fluid pressure, namely
and therefore recover eq. (A3).
In the limiting case where the grain compressibility is
negligible compared to the bulk compressibility, b is also
equal to 1. The pore pressure will then simply counteract
the confining pressure, and the effective stress law in its
simplest form Pe = Pc - Pp
will apply (Terzaghi's law). In
the limiting case of b = 0, a change in pore fluid pressure
will have no effect on the bulk volume; the bulk volume
reduction due to movement of solid into the pores will be
exactly counterbalanced by the expansion of the grains
under the decreasing Pp.


![Research Article - University of Bristolgljpv/PDFS/Angus_2013_ISRNGeophysics.pdf · m is the pore volume compressibility. 3. Microseismic data Verdon et al. [18] compared the microseismicity](https://img.pdfslide.net/doc/110x75/5e81c58137b0ea27621509ea/research-article-university-of-bristol-gljpvpdfsangus2013-m-is-the-pore.jpg)