Embed Size (px)
Citation preview
On the possibility of scotopic color vision
An interdisciplinary approach
Emma Klaassen and Rob Klabbers
Thesis for Liberal Arts and Sciences, Utrecht University.
Supervisor: Herman Hendriks
Advisors: Astrid Kappers and Susan te Pas
January 5, 2012
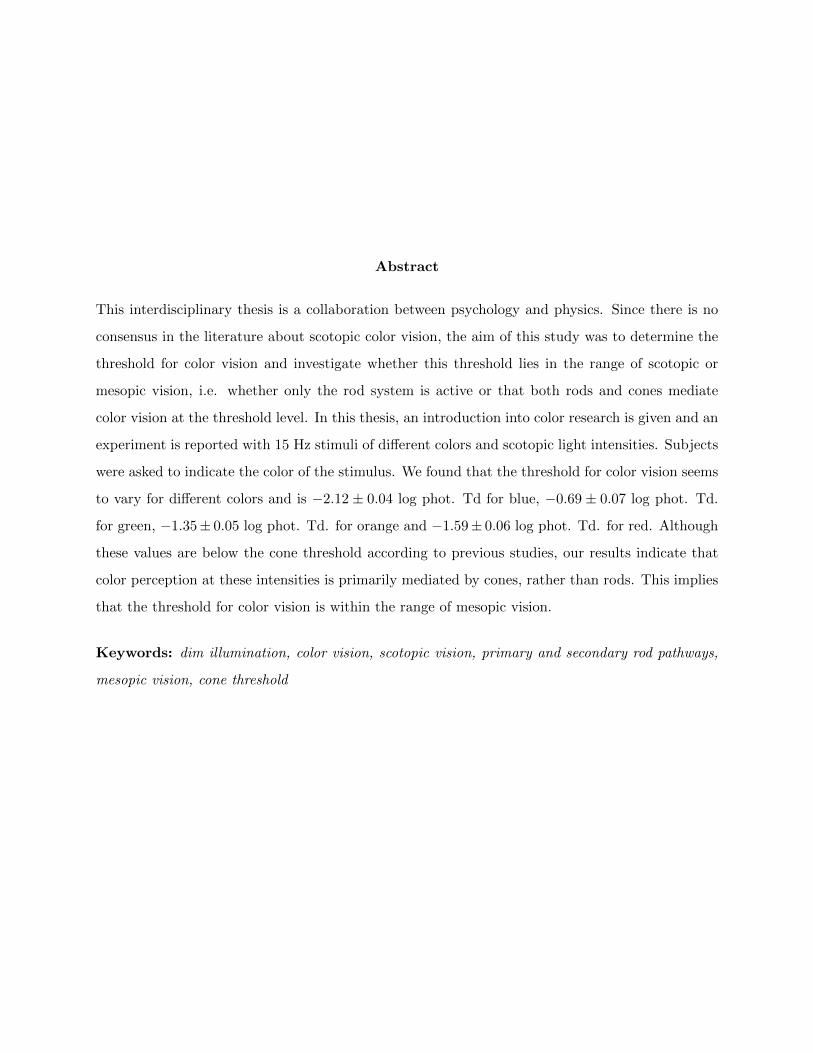
Abstract
This interdisciplinary thesis is a collaboration between psychology and physics. Since there is no
consensus in the literature about scotopic color vision, the aim of this study was to determine the
threshold for color vision and investigate whether this threshold lies in the range of scotopic or
mesopic vision, i.e. whether only the rod system is active or that both rods and cones mediate
color vision at the threshold level. In this thesis, an introduction into color research is given and an
experiment is reported with 15 Hz stimuli of different colors and scotopic light intensities. Subjects
were asked to indicate the color of the stimulus. We found that the threshold for color vision seems
to vary for different colors and is −2.12 ± 0.04 log phot. Td for blue, −0.69 ± 0.07 log phot. Td.
for green, −1.35± 0.05 log phot. Td. for orange and −1.59± 0.06 log phot. Td. for red. Although
these values are below the cone threshold according to previous studies, our results indicate that
color perception at these intensities is primarily mediated by cones, rather than rods. This implies
that the threshold for color vision is within the range of mesopic vision.
Keywords: dim illumination, color vision, scotopic vision, primary and secondary rod pathways,
mesopic vision, cone threshold
Acknowledgements
First, we would like to thank all the people from the department Physics of Man at the Helmholtz
Institute at Utrecht University for the opportunity of doing this research with them and for the
advise they gave. We would especially like to thank Mieke Bijveld, who has spent so much time
guiding us during the process of this thesis and showing us around at Bartimeus. Also a special
thanks to Astrid Kappers and Susan te Pas. They helped us to understand the fundamentals of
color research and gave us expert advice on doing experimental research. Of course, we thank
Herman Hendriks, who gave us the confidence needed to shape this thesis into an experimental
study and gave us advice to do so. Moreover, thanks to Willem van der Deijl, who commented on
parts of this thesis and to all our subjects for partaking in our study. Lastly, we thank our friends
and family for their support.
1
”Color is neither physics nor psychology; it is both. Physics cannot predict the appearance of
a given energy distribution nor can psychology predict the color of a subtractive mixture. Both
together should be able to do both; this and similar aims should be the goal of the science of color.”
Evans, R.(1948). An introduction to Color. New York: John Wiley and Sons Inc., p.77
2
Contents
1 Interdisciplinary introduction 5
2 The research process 8
3 Disciplinary introduction 11
3.1 Research on color and color perception . . . . . . . . . . . . . . . . . . . . . . . . . . 11
3.2 Anatomy of the human visual system . . . . . . . . . . . . . . . . . . . . . . . . . . . 13
3.2.1 Anatomy of the human eye . . . . . . . . . . . . . . . . . . . . . . . . . . . . 13
3.2.2 Processing and pathways in the retina . . . . . . . . . . . . . . . . . . . . . . 14
3.2.3 Sensitivity and acuity . . . . . . . . . . . . . . . . . . . . . . . . . . . . . . . 18
3.3 The color of an object . . . . . . . . . . . . . . . . . . . . . . . . . . . . . . . . . . . 20
3.3.1 Spectral content of the light source . . . . . . . . . . . . . . . . . . . . . . . . 20
3.3.2 Interaction with the object . . . . . . . . . . . . . . . . . . . . . . . . . . . . 20
3.3.3 Light scattering in the medium . . . . . . . . . . . . . . . . . . . . . . . . . . 21
3.3.4 Interaction with other objects . . . . . . . . . . . . . . . . . . . . . . . . . . . 22
3.3.5 Interaction in the eye . . . . . . . . . . . . . . . . . . . . . . . . . . . . . . . 22
3.4 Technical aspects of color and color perception . . . . . . . . . . . . . . . . . . . . . 22
3.4.1 Brightness . . . . . . . . . . . . . . . . . . . . . . . . . . . . . . . . . . . . . . 23
3.4.2 Luminance . . . . . . . . . . . . . . . . . . . . . . . . . . . . . . . . . . . . . 24
3.4.3 Spectral sensitivity . . . . . . . . . . . . . . . . . . . . . . . . . . . . . . . . . 26
3.4.4 Detectability . . . . . . . . . . . . . . . . . . . . . . . . . . . . . . . . . . . . 27
3.4.5 Univariance . . . . . . . . . . . . . . . . . . . . . . . . . . . . . . . . . . . . . 28
3.5 The perception of color . . . . . . . . . . . . . . . . . . . . . . . . . . . . . . . . . . 29
3.5.1 LGN and opponent color channels . . . . . . . . . . . . . . . . . . . . . . . . 29
3
3.5.2 Cortical areas concerned with color . . . . . . . . . . . . . . . . . . . . . . . . 30
3.5.3 Complex effect: Color constancy . . . . . . . . . . . . . . . . . . . . . . . . . 32
4 Research article 35
4.1 Introduction . . . . . . . . . . . . . . . . . . . . . . . . . . . . . . . . . . . . . . . . . 35
4.1.1 Anatomy . . . . . . . . . . . . . . . . . . . . . . . . . . . . . . . . . . . . . . 35
4.1.2 Perception . . . . . . . . . . . . . . . . . . . . . . . . . . . . . . . . . . . . . . 37
4.1.3 Thresholds . . . . . . . . . . . . . . . . . . . . . . . . . . . . . . . . . . . . . 39
4.2 Methods . . . . . . . . . . . . . . . . . . . . . . . . . . . . . . . . . . . . . . . . . . . 39
4.2.1 Subjects . . . . . . . . . . . . . . . . . . . . . . . . . . . . . . . . . . . . . . . 39
4.2.2 Stimuli . . . . . . . . . . . . . . . . . . . . . . . . . . . . . . . . . . . . . . . 40
4.2.3 Apparatus . . . . . . . . . . . . . . . . . . . . . . . . . . . . . . . . . . . . . . 40
4.2.4 Procedure . . . . . . . . . . . . . . . . . . . . . . . . . . . . . . . . . . . . . . 40
4.2.5 Data-analysis . . . . . . . . . . . . . . . . . . . . . . . . . . . . . . . . . . . . 41
4.3 Results . . . . . . . . . . . . . . . . . . . . . . . . . . . . . . . . . . . . . . . . . . . . 43
4.3.1 General . . . . . . . . . . . . . . . . . . . . . . . . . . . . . . . . . . . . . . . 43
4.3.2 Psychometric curves . . . . . . . . . . . . . . . . . . . . . . . . . . . . . . . . 43
4.3.3 The psychometric curves in other units . . . . . . . . . . . . . . . . . . . . . 44
4.4 Discussion . . . . . . . . . . . . . . . . . . . . . . . . . . . . . . . . . . . . . . . . . . 46
4.4.1 Threshold for color vision . . . . . . . . . . . . . . . . . . . . . . . . . . . . . 46
4.4.2 Mesopic or scotopic color vision . . . . . . . . . . . . . . . . . . . . . . . . . . 46
4.4.3 Points of consideration . . . . . . . . . . . . . . . . . . . . . . . . . . . . . . . 48
4.4.4 Further research . . . . . . . . . . . . . . . . . . . . . . . . . . . . . . . . . . 50
5 Interdisciplinary reflection 51
5.1 Conflicts . . . . . . . . . . . . . . . . . . . . . . . . . . . . . . . . . . . . . . . . . . . 51
5.2 Common ground . . . . . . . . . . . . . . . . . . . . . . . . . . . . . . . . . . . . . . 53
5.3 Desintegration . . . . . . . . . . . . . . . . . . . . . . . . . . . . . . . . . . . . . . . 53
6 Conclusion 55
Appendix 56
Bibliography 62
4
Chapter 1
Interdisciplinary introduction
Most people are able to recognize colors in everyday life. While the number of colors discriminated
by a person depends on culture, almost all cultures and languages possess a notion of color. For
most people color is such an ordinary phenomenon that no attention is paid to it, except when
picking out clothes or a car. This is not surprising from an evolutionary perspective: color vision
is the reason why humans and other animals are capable of differentiating between edible and poi-
sonous fruits and crops. It goes without saying, however, that color vision nowadays is no longer
crucial for the survival of most humans.
From a scientific perspective, color is a highly interesting subject. Since the sixteenth century people
have been reflecting on the origin of color. The main question then was where the color of an object
originated: was it an intrinsic quality of the object or was it contained in the light that reflected
on the object? Could humans perhaps perceive color in the absence of any physical attribute? In
other words, did color only exist in the brain? These issues drew the attention of scientists from
various disciplines who came up with heaps of new questions. They set out to investigate light and
discovered that a beam of white light consists of a variety of colors. After instruments for detailed
and precise scientific research on small structures had been developed, scientists studied the human
eye and discovered the existence of cones in the retina. They concluded on the basis of experiments
that these cones are responsible for the fact that humans have color vision.
Nowadays lots of research is done on the human visual system. Apart from a scientific curiosity,
there is a great importance in doing research in this field: to recover and compensate for all kinds
of blindness, such as color blindness. Knowing which processes are relevant for the perception of
5
color is indeed important in designing a treatment for visually impaired people.
In this thesis, the light intensity for which humans are able to see color will be studied. By es-
tablishing the threshold for color vision and inferring which type of photoreceptors are active at
this threshold, more insights on the human visual system can be gained. This matter is worth
investigating, for current research has demonstrated that, contrary to the current believes, it is
possible for humans to perceive colors under dim illumination (Pokorny et al., 2006). However,
the current leading consensus in human vision denies the necessity to investigate color perception
under dim illumination: because of the dichotomy between rods and cones, people with normal
vision are assumed not to be capable of perceiving colors in the dark. Recent research has however
to a certain extent suggested the contrary: people are possibly able to discriminate colors under
dim illumination. Therefore, the aim of this thesis is to examine at what light intensity humans
are able to see colors. Little research in this field of study has been performed, meaning that there
currently is a gap in the knowledge about the human visual system and extensive research on this
topic could eventually lead to a paradigm shift.
With this research, also a public cause is pursued: research on the perception of color under dim
illuminations can be meaningful for the understanding of diseases such as Retinis Pigmentosa, a
progressive degeneration of the retina that affects night vision and peripheral vision (Wolfe et al.,
2009). Treatment of this disease can be improved if more details of the visual system are known.
The question of at what light intensity humans are able to see colors requires an interdisciplinary
approach, because of its complex nature: human vision is an object of study for several disciplines,
including biology, physics and psychology. Moreover, not one of these disciplines covers all the
relevant variables. Physics for example focuses mainly on the light reaching the eye and the mea-
surable (electrical) eye responses, whereas psychology is concerned with the neural pathways and
processing of neural signals from the eye and biology researches the physical structure of and the
chemical processes within the human eye. When a colored light stimulus is observed by a person,
very different effects can come into play: the physical content of a light stimulus does not determine
the color one sees completely. Complicated effects in the retina and higher-order processes in the
brain can be of great importance. Specifically, at low light intensities other information, such as
prior experience can influence the ability of a person to perceive a certain color. For a complete
6
view of the concepts and insights associated with questions about human vision, it is important to
combine the efforts of (some of) these disciplines.
Several disciplines are relevant for this research project. Biology is relevant, because it researches
the human eye. Cognitive psychology researches the signal processing of human sensory mecha-
nisms and is therefore able to shed light on the intricate pathways signals follow from the eye to
the brain. In addition, cognitive psychology provides useful research methodologies. Physics as a
discipline has developed several important research methods for human vision, including colorime-
try and electro retinoscopy. Furthermore, physics studies light as a natural phenomenon.
In practice, these disciplines are not as divided as the preceding paragraph may suggest: researchers
in the field of human vision use many results of research that has been done by other disciplines,
because most topics lie in the scope of several disciplines. Therefore, in a way, almost all research
in human vision is interdisciplinary. In the present thesis, the insights of physics and cognitive psy-
chology are combined. However, since physics, biology and cognitive psychology are so intricately
interlaced, relevant biological concepts and insights are also incorporated whenever necessary, thus
making it possible to study all the relevant variables involved.
Since the topic of this thesis constitutes a gap in our scientific knowledge, not much literature
is available. This led us to set up an experimental study, executed under the supervision of the
Helmholtz Institute at Utrecht University. Given the experimental nature of the work reported in
it, the thesis is structured as follows. It starts with an introduction into the field of color vision,
containing both insights from physics and psychology. This introduction is followed by a report of
the experiment. After that, a common ground is created for integration of insights of the two dis-
ciplines. Finally, an interdisciplinary conclusion is drawn which will contribute to a more complete
understanding of color vision under dim illumination.
7
Chapter 2
The research process
An important aspect of every bachelor program is learning how to set up a research project. Writing
a bachelor’s thesis is one of the best ways to learn this. The way research is done varies however
from discipline to discipline: Most sciences use experimental studies, while most of the humanities
perform literature-based studies. These differences are reflected in the way the bachelor’s theses at
Utrecht University are incorporated in the curricula.
The bachelor’s thesis for Liberal Arts and Sciences usually has the form of a literature study. In a
very early stage of the planning of this thesis (around December 2010), we came to the conclusion
that an experimental approach seemed more suitable with regard to our potential research questions.
The department Physics of Man at the Helmholtz Institute helped us to set up our research by
allowing us to investigate an effect that was observed in a recent experiment by one of their
PhD-students, Mieke Bijveld, who would become our advisor. Our advisor from Liberal Arts
was supportive in our decision to start researching at the Helmholtz institute. The choice for an
experimental research has changed a lot about our research process. We feel that it is important
to make these differences known to the reader, because in the report of an experimental study a
large part of the whole process is not discussed. A research article usually does not discuss all the
thinking, the testing and the various tried experimental set ups needed to design a good experiment.
Since we are supposed to learn how to do research, we think that it is important to discuss the
process that led to our final experiment.
As a start, we went to the Bartimeus Institute for the Visually Impaired with our advisor Mieke
Bijveld, who works there as a PhD-student, to see the equipment we would use in our experiment
8
as well as learn more about the practical implications of color research. We observed several
sessions where children were diagnosed. We also conducted a first pilot experiment, in which
Emma participated as a subject. This pilot showed us that the results that Mieke had observed in
her previous research were easily reproducible, but also that our crude set-up of that pilot would
not suffice if we wanted to make a proper analysis of our experiment.
Shortly after this intern day at Bartimeus, we discussed the design of our experiment in greater
detail and came up with a couple of preliminary questions that needed answering before we could
finish our design. To answer these questions, we spent another day at Bartimeus to conduct more
pilot studies. Firstly, we determined the intensity ranges of our experiment, making sure that
the highest intensity had an obvious color for all our subjects and that the lowest intensity was
colorless for our subjects, but still visible. Secondly, we found out that with our possibilities, it was
impossible to properly find an intensity range in which subjects would not detect a flicker (for more
information on the origin and importance of flicker detection, see the Introduction of the research
article). Thirdly, we tested wether presenting our stimuli in a random order would have an effect
on perception. We found that the effect of dark adaptation, which makes the visual system more
sensitive, was not significantly decreased when high-intensity stimuli were presented. In addition,
presenting a high-intensity stimulus of a certain color followed by a colorless stimulus did not seem
to alter the color judgments of our subjects significantly. As a final test, we also tried out different
ways of asking a subject which color was shown and allowing different kinds of answers. It was
immediately clear to us that leaving the way a subject could answer completely open would lead to
very obscure color tags in our data, such as turquoise or magenta. This would make it very hard
to analyze our data without making severe compromises. On the other hand, allowing a subject to
choose only between the colors that were actually shown could leave out information that might
be important for future research. Since our experiment was also meant as a exploratory study of
the phenomenon, we found it important to collect that information and thus decided that subjects
could chose from a specific set of colors to describe their perception.
After we had made a final design for our experiment using the data from our pilots, we made sure
that we would not be surprised by unforeseen effects by testing our whole experiment using a naıve
subject. This turned out to be a good decision, since some important changes were made: we altered
the intensity levels slightly and also increased the number of times a stimulus was presented from
9

two to three. This was done to investigate whether subjects were consistent in their judgments.
Finally, the actual experiment took place in mid-April and was spread over two days. In addition
to our pilots, we also attended some of the weekly meetings of the department Physics of Man, to
talk about our own progress as well as the work that other researchers were doing. We tried to
attend the meetings as often as possible, or when our schedule would allow it. The feedback we
got from those meetings was very valuable.
10
Chapter 3
Disciplinary introduction
In this chapter the fields of color research within psychology and physics will be explored. The
concepts introduced in this chapter are important for our research. Since many aspects of color
vision are closely related to the anatomical structure of the human eye, this anatomy will be
discussed first. In particular, the pathways along which the neural signals travel through the
retina and the photoreceptors are discussed. Subsequently, several variables that are important for
the color of an object are reviewed, showing that color vision is not the simple concept it might
seem. Furthermore, technical aspects regarding color will be dealt with and lastly, the process of
perceiving color will be discussed as well as the complex effect of color constancy.
3.1 Research on color and color perception
Research in physics
The phenomenon of color vision has fascinated many of the great minds in physics, including
Isaac Newton, James Clark Maxwell and Erwin Schrodinger. In a sense, these physicists were the
founders of color research. The early scientists tried to find the origin of a color of an object,
whether it was in the light or in the object itself. This led to discoveries like the fact that white
light consists of many different wavelengths and that the mixing of colors can be modeled with
mathematical tools. Later on, scientists started to include the human eye in the research as well as
subjects. Maxwell in particular developed the important research methodology of colorimetry, in
which a beam is compared with reference beams to determine its color, using a subject (Maxwell,
1872). This has formed the basis of modern color science. At present, the questions in color science
11
are becoming more and more complex, because other variables come into play. Since the research
that can be done on human neural systems and brain processing is rapidly increasing, problems
can be solved using knowledge generated by scientists from many different fields, including biology,
physics and psychology.
Research in psychology
Whereas physics is concerned with the physical properties of world, cognitive psychology deals with
how the physical world is perceived by the interpretation of signals from the human senses. The field
of cognitive psychology has blurry boundaries and has a significant overlap with other disciplines
such as human biology. In the last decades, the interdisciplinary field of cognitive neuroscience
has experienced a major growth and increasing popularity. To obtain a complete understanding
of the human brain and mental processes is the aim of this field. Among the disciplines that
have contributed to the foundations of cognitive science are artificial intelligence, human-computer
interaction, linguistics, medicine, neuroscience, psychology and sociology (Schunn et al., 1998).
Insights from these disciplines are integrated to obtain a more complete understanding of the human
brain. Research in cognitive sciences is done through experimental studies and through simulation
of the functional anatomy of the brain by computer programs. Due to the development of modern
non-invasive techniques for studying and simulating the brain, new insights quickly succeed one
another in this meta-discipline. These insights even have a much wider scope as they influence
theories in a broad range of disciplines, among them anthropology, philosophy and engineering. As
perception in general is an important topic in cognitive neuroscience, the perception of color under
dim illuminations lies within the scope of this discipline. Psychology investigates the perception
of color as a higher cognitive process and examines questions about color constancy, color naming
and experience of color.
Definition of color
Although in every day life the term ”color” is intuitively clear, it is impossible to give a correct,
complete definition that is accurate for all color research. In trying so, one would encounter different
aspects of human vision that make it the complex system that it is (Evans, 1948). To make it
possible to communicate meaningfully about color in this thesis, it is, however, important to have
some kind of definition to start with: we define color as the quality of an object or substance that is
12
primarily dependent on the spectral energy distribution of the light that reflects from the object or
substance. Moreover, we will make a distinction between color and color perception. Whereas color
can be seen as the attribute of an object, the perception of color is a cognitive process that involves
the interpretation of neural signals. These two concepts can not be studied separately since they
interact: the colortag one is prepared to give to a particular object is dependent on many other
variables than spectral content alone. To be able to discuss these variables properly, we will first
discuss the anatomy of the human eye.
3.2 Anatomy of the human visual system
3.2.1 Anatomy of the human eye
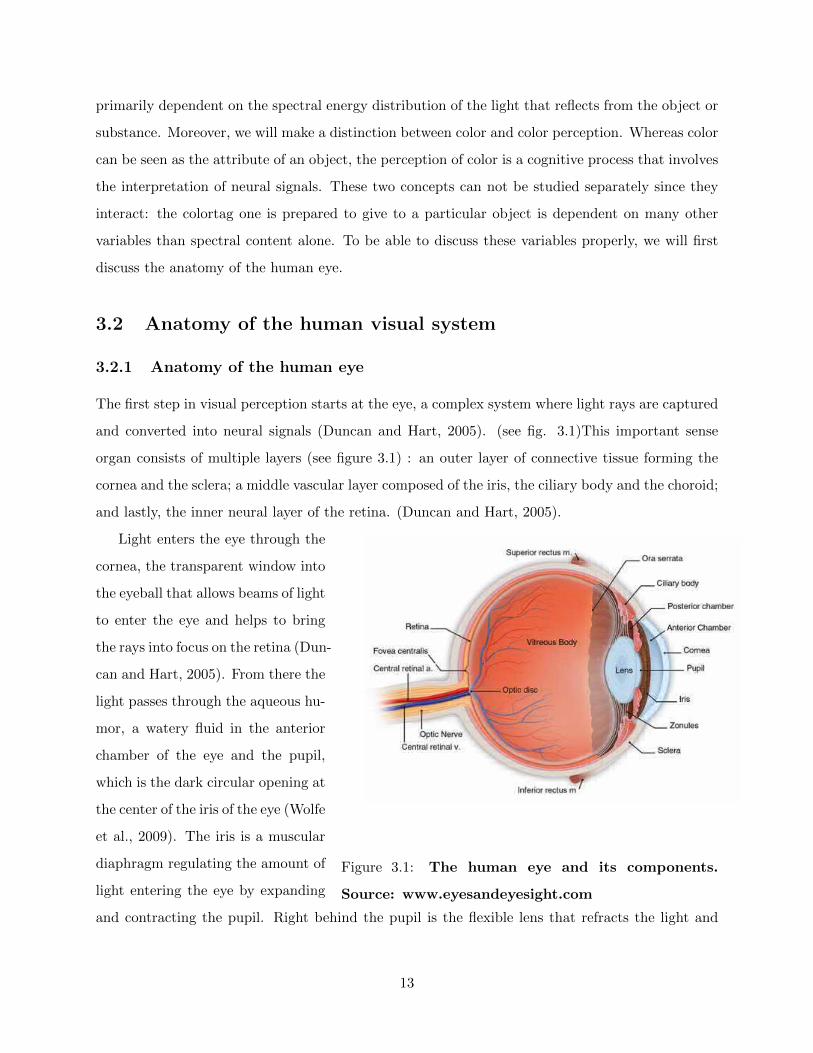
The first step in visual perception starts at the eye, a complex system where light rays are captured
and converted into neural signals (Duncan and Hart, 2005). (see fig. 3.1)This important sense
organ consists of multiple layers (see figure 3.1) : an outer layer of connective tissue forming the
cornea and the sclera; a middle vascular layer composed of the iris, the ciliary body and the choroid;
and lastly, the inner neural layer of the retina. (Duncan and Hart, 2005).
Light enters the eye through the
Figure 3.1: The human eye and its components.
Source: www.eyesandeyesight.com
cornea, the transparent window into
the eyeball that allows beams of light
to enter the eye and helps to bring
the rays into focus on the retina (Dun-
can and Hart, 2005). From there the
light passes through the aqueous hu-
mor, a watery fluid in the anterior
chamber of the eye and the pupil,
which is the dark circular opening at
the center of the iris of the eye (Wolfe
et al., 2009). The iris is a muscular
diaphragm regulating the amount of
light entering the eye by expanding
and contracting the pupil. Right behind the pupil is the flexible lens that refracts the light and
13
enables focus by accommodation due to variation in curvature of the lens established by the zonules
of Zinn and the ciliary muscles that are attached to them. When refracted by the lens, the light
enters the vitreous chamber containing a transparent fluid that fills the posterior part of the eye.
A large part of the light will be lost in this chamber and only a small portion will fall on the retina.
This light-sensitive membrane in the back of the eye, which contains the macula and the optic disc
(Duncan and Hart, 2005), translates the light into neural signals that are sent to the brain through
the optic nerve (Duncan and Hart, 2005; Wolfe et al., 2009).
3.2.2 Processing and pathways in the retina
The retina is the part of eye where information processing takes place: this tissue converts light
energy into a neural signal. The retina can be divided into different layers containing various types
of cells that each have another function in the processing of visual information. These cells include
photoreceptor, horizontal, bipolar, amacrine and ganglion cells (Bruce et al., 2003). The retina
roughly consists of two pathways: a vertical and a horizontal one.
The vertical pathway
The vertical pathway that lies perpendicular to the retina, consists of photoreceptors, bipolar cells
and ganglion cells. The human retina contains ciliary receptor types, so called photoreceptors, which
form the first link in the pathway from the retina to the brain. These light-sensitive receptors lie in
the posterior layer of the retina (Solomon and Lennie, 2007). To arrive at this layer, the photons
have to pass all other layers of the retina.
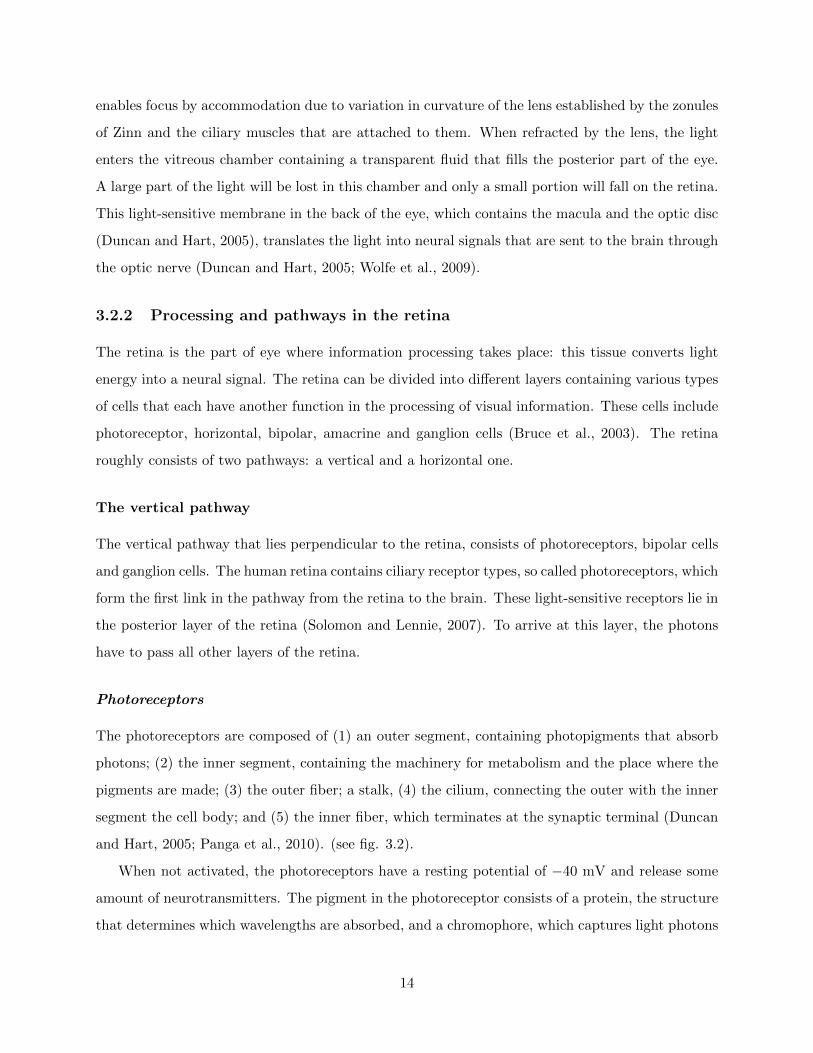
Photoreceptors
The photoreceptors are composed of (1) an outer segment, containing photopigments that absorb
photons; (2) the inner segment, containing the machinery for metabolism and the place where the
pigments are made; (3) the outer fiber; a stalk, (4) the cilium, connecting the outer with the inner
segment the cell body; and (5) the inner fiber, which terminates at the synaptic terminal (Duncan
and Hart, 2005; Panga et al., 2010). (see fig. 3.2).
When not activated, the photoreceptors have a resting potential of −40 mV and release some
amount of neurotransmitters. The pigment in the photoreceptor consists of a protein, the structure
that determines which wavelengths are absorbed, and a chromophore, which captures light photons
14
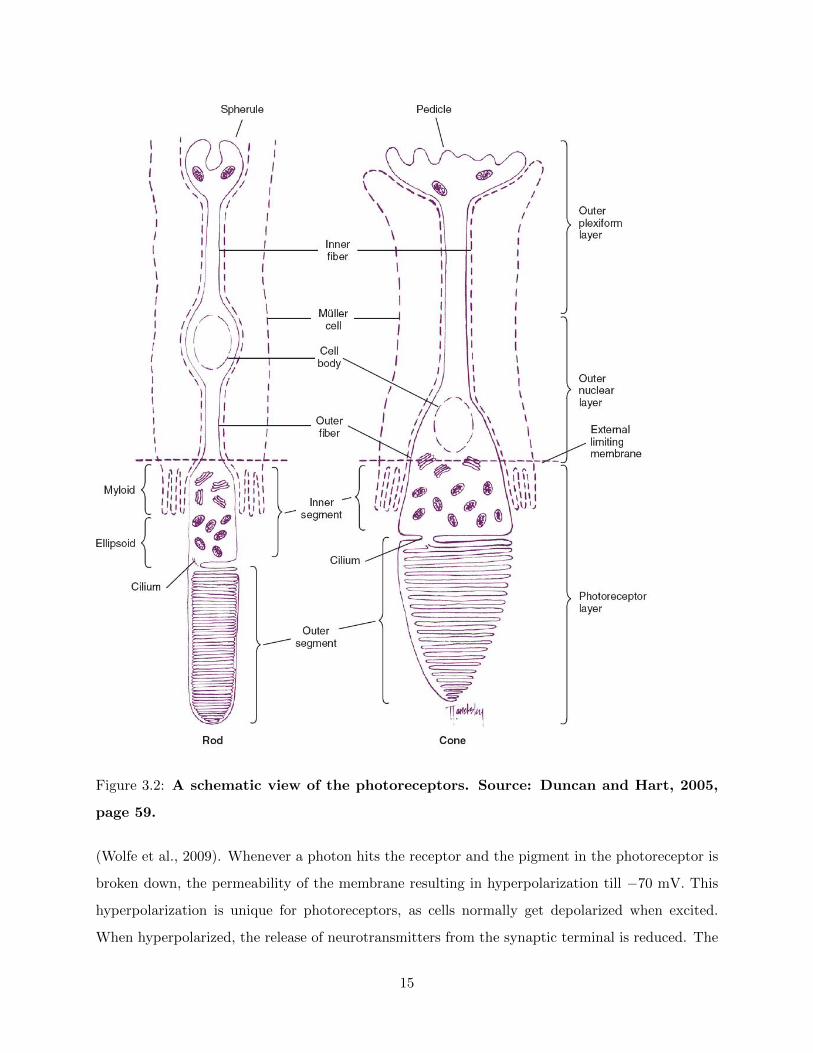
Figure 3.2: A schematic view of the photoreceptors. Source: Duncan and Hart, 2005,
page 59.
(Wolfe et al., 2009). Whenever a photon hits the receptor and the pigment in the photoreceptor is
broken down, the permeability of the membrane resulting in hyperpolarization till −70 mV. This
hyperpolarization is unique for photoreceptors, as cells normally get depolarized when excited.
When hyperpolarized, the release of neurotransmitters from the synaptic terminal is reduced. The
15
size of this receptor potential is proportional to the logarithm of the intensity of light striking the
cell (Bruce et al., 2003).
The human visual system is highly specialized but at the same time functional in a broad range of
light intensities. To be able to see under so variable lighting conditions, the system can adapt its
capacity to respond in various levels of illumination due to the activation of different photoreceptors
and the adaptation of photoreceptors (Gegenfurtner and Sharpe, 2001). The retina contains two
types of photoreceptors, the rods and the cones each sensitive in another range of light intensities.
The human eye has about 80 to 110 million rods and 4 to 5 million cones. During high luminance
(photopic vision) the cones are most sensitive and the rods are saturated. Cones dominate photopic
vision and, according to the current paradigm, mediate color vision (Duncan and Hart, 2005).
However, during low luminance (scotopic vision), the rods are most active and the cones are not
active (Wolfe et al., 2009; Duncan and Hart, 2005). Rods are extremely sensitive under dim
illumination. When a critical mass of photons with the right amount of energy hits a receptor, the
cell will send a signal to the next layer of cells, the bipolar cells (Gegenfurtner and Sharpe, 2001).
Bipolar cells
The bipolar cells are the second link in the visual vertical pathway. The dendrites of these cells are
connected to photoreceptors and horizontal cells, and the axons of bipolar cell synapse with ganglion
cells and amacrine cells (Solomon and Lennie, 2007)(see fig. 3.3). Bipolar cells are part of both the
vertical and horizontal pathway: they transmit information from photoreceptors to ganglion cells,
horizontal and amacrine cells, and secondly, they receive feedback from the amacrine cells. There
are many different types of bipolar cells known (Duncan and Hart, 2005), among them are the
diffuse and midget bipolar cells. Diffuse bipolar cells are present in the periphery and receive input
from multiple photoreceptors, either a population of rods or of cones. Another kind of bipolar cells,
the so-called midget cells receive input from one cone and synapse with a single ganglion cell. This
pathway is called the one-to-one cone pathway and can only be found in the center of the retina,
the fovea (Solomon and Lennie, 2007). The diffuse bipolar cells have a high sensitivity but a low
acuity. The midget bipolar cell, however, has a low sensitivity but a high acuity. These bipolar
cells can be subdivided into two kinds: ON and OFF bipolar cells. The ON bipolar cells responds
to an increase in light captured by the cones by inverting the inhibitory signal from the cones into
an excitatory signal. The OFF bipolar cell, on the other hand, responds to a decrease in light.
16
This cell does not invert the inhibiting signal from the photoreceptors but also hyperpolarizes when
activated (Wolfe et al., 2009).
Ganglion cells
The bipolar cells synapse in turn
Figure 3.3: The coupling of photoreceptors and bipo-
lar cells. Source: Duncan and Hart, 2005, page 63.
with ganglion cells. The ganglion
cells receive visual information from
photoreceptors via two intermediate
neuron types, the bipolar cells and
amacrine cells (Duncan and Hart, 2005).
There are three different kinds of gan-
glion cells. Firstly the P ganglion
cells, which are small cells that re-
ceive excitatory input from single midget
bipolar cells in the central retina. The
P cells have a sustained response and
are wavelength-selective (Zeki, 1993).
These cells have small receptive fields
and hence a high visual acuity. Sec-
ondly, there are M ganglion cells which
receive excitatory input from diffuse bipolar cells. This type of ganglion cells responds transiently
and is not selective for the wavelength of the stimulus (Zeki, 1993). These ganglion cells have large
receptive fields and are therefore more sensitive under low lighting conditions. The last type of
cell is the koniocellular ganglion cell (Wolfe et al., 2009). The axons of ganglion cells run over the
surface of the retina to the blind spot, where they are bundled together to form the optic nerve.
The horizontal pathway
The horizontal pathway provides feedback to the retinal cells and modifies and integrates neural
signals before they are sent to the brain. The pathway consists of three different types of cells:
horizontal cells, amacrine cells and interplexiform neurons. Horizontal cells communicate with
17
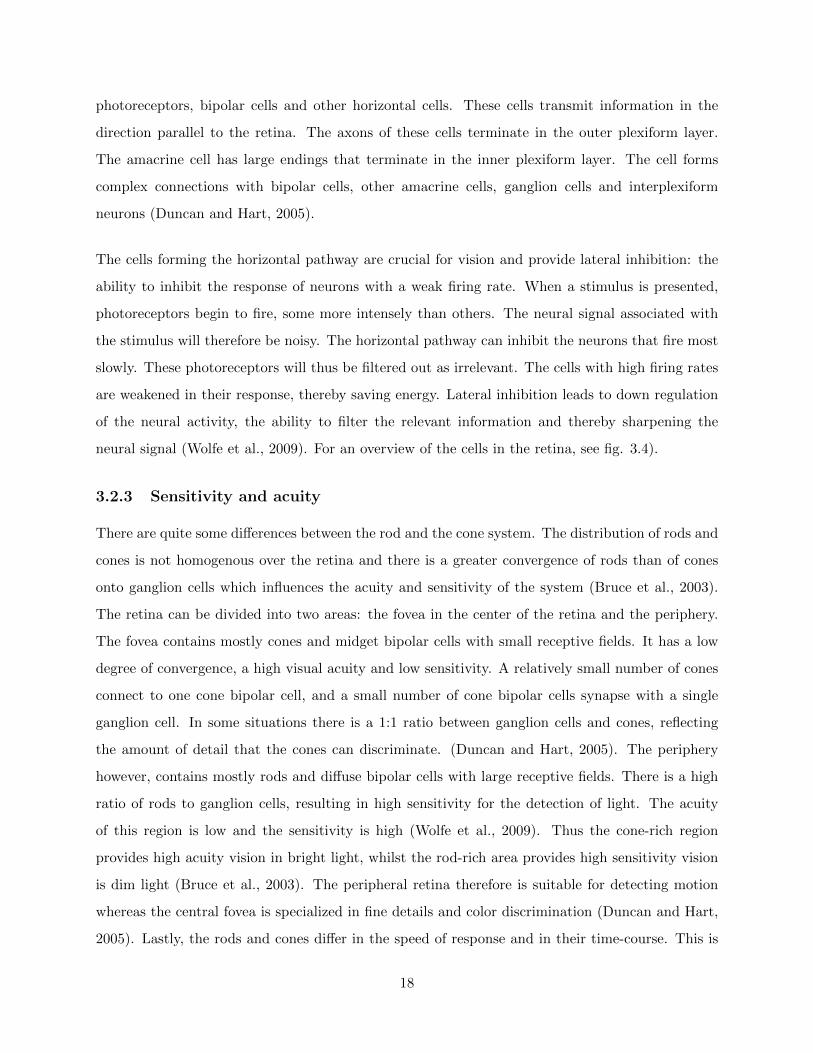
photoreceptors, bipolar cells and other horizontal cells. These cells transmit information in the
direction parallel to the retina. The axons of these cells terminate in the outer plexiform layer.
The amacrine cell has large endings that terminate in the inner plexiform layer. The cell forms
complex connections with bipolar cells, other amacrine cells, ganglion cells and interplexiform
neurons (Duncan and Hart, 2005).
The cells forming the horizontal pathway are crucial for vision and provide lateral inhibition: the
ability to inhibit the response of neurons with a weak firing rate. When a stimulus is presented,
photoreceptors begin to fire, some more intensely than others. The neural signal associated with
the stimulus will therefore be noisy. The horizontal pathway can inhibit the neurons that fire most
slowly. These photoreceptors will thus be filtered out as irrelevant. The cells with high firing rates
are weakened in their response, thereby saving energy. Lateral inhibition leads to down regulation
of the neural activity, the ability to filter the relevant information and thereby sharpening the
neural signal (Wolfe et al., 2009). For an overview of the cells in the retina, see fig. 3.4).
3.2.3 Sensitivity and acuity
There are quite some differences between the rod and the cone system. The distribution of rods and
cones is not homogenous over the retina and there is a greater convergence of rods than of cones
onto ganglion cells which influences the acuity and sensitivity of the system (Bruce et al., 2003).
The retina can be divided into two areas: the fovea in the center of the retina and the periphery.
The fovea contains mostly cones and midget bipolar cells with small receptive fields. It has a low
degree of convergence, a high visual acuity and low sensitivity. A relatively small number of cones
connect to one cone bipolar cell, and a small number of cone bipolar cells synapse with a single
ganglion cell. In some situations there is a 1:1 ratio between ganglion cells and cones, reflecting
the amount of detail that the cones can discriminate. (Duncan and Hart, 2005). The periphery
however, contains mostly rods and diffuse bipolar cells with large receptive fields. There is a high
ratio of rods to ganglion cells, resulting in high sensitivity for the detection of light. The acuity
of this region is low and the sensitivity is high (Wolfe et al., 2009). Thus the cone-rich region
provides high acuity vision in bright light, whilst the rod-rich area provides high sensitivity vision
is dim light (Bruce et al., 2003). The peripheral retina therefore is suitable for detecting motion
whereas the central fovea is specialized in fine details and color discrimination (Duncan and Hart,
2005). Lastly, the rods and cones differ in the speed of response and in their time-course. This is
18
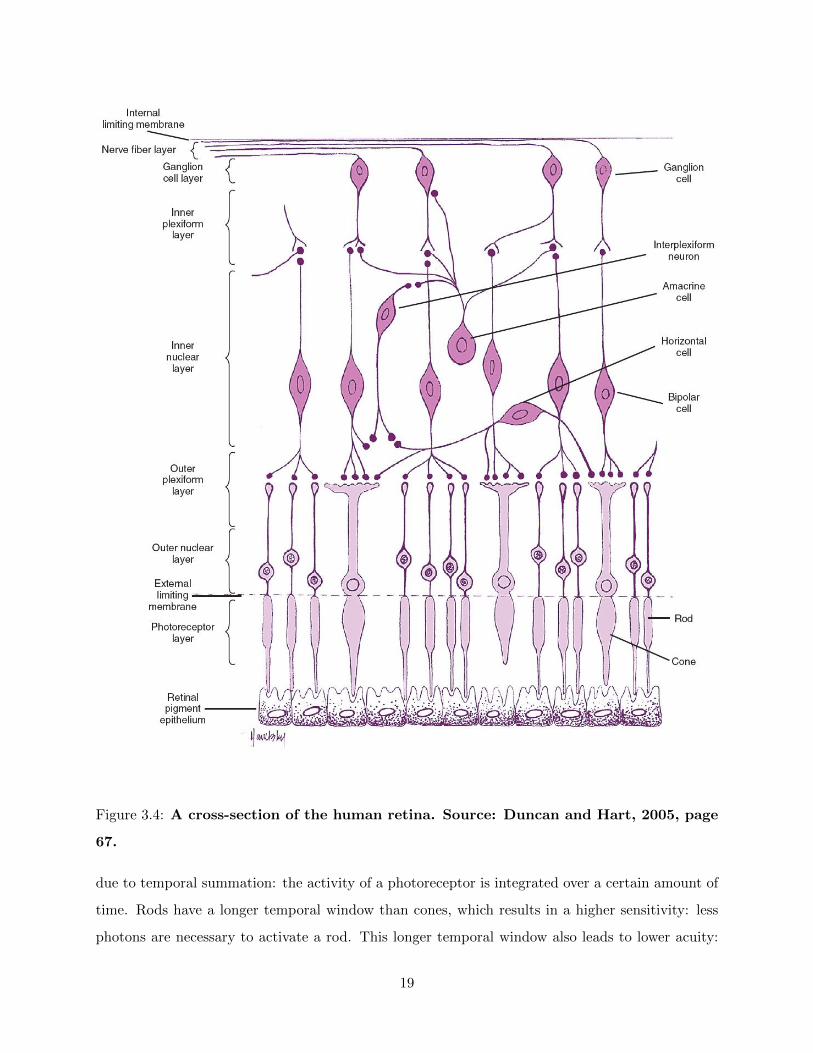
Figure 3.4: A cross-section of the human retina. Source: Duncan and Hart, 2005, page
67.
due to temporal summation: the activity of a photoreceptor is integrated over a certain amount of
time. Rods have a longer temporal window than cones, which results in a higher sensitivity: less
photons are necessary to activate a rod. This longer temporal window also leads to lower acuity:
19
the inability to detect fast changes in the dark (Wolfe et al., 2009).
3.3 The color of an object
The color of an object at first glance does not seem a very difficult phenomenon: Light with a
certain spectral energy distribution travels from a source to an object, interacts with the object,
which changes its spectral energy distribution and then continues to travel to the observer’s eye.
The spectral energy distribution of the light that enters the eye then determines what color the
observer will ascribe to the object under observation.
In practice, this model is, however, too simple. Although the dependencies in this crude model
definitely exist, their relation to the assignment of a particular color is non-trivial and other variables
come into play as well. A typical situation in which color perception is studied consists of a light
source, a medium, an object that is irradiated by the light source and an observer, who perceives the
object. There are now at least five different variables that determine the color and the perception
of color.
3.3.1 Spectral content of the light source
The light source can be a variety of things, such as the sun, a light bulb or a flame. It is possible to
describe the light source by the wavelengths that are present in the light as well as the intensities
of the different wavelengths. This is called the spectral energy distribution and is usually presented
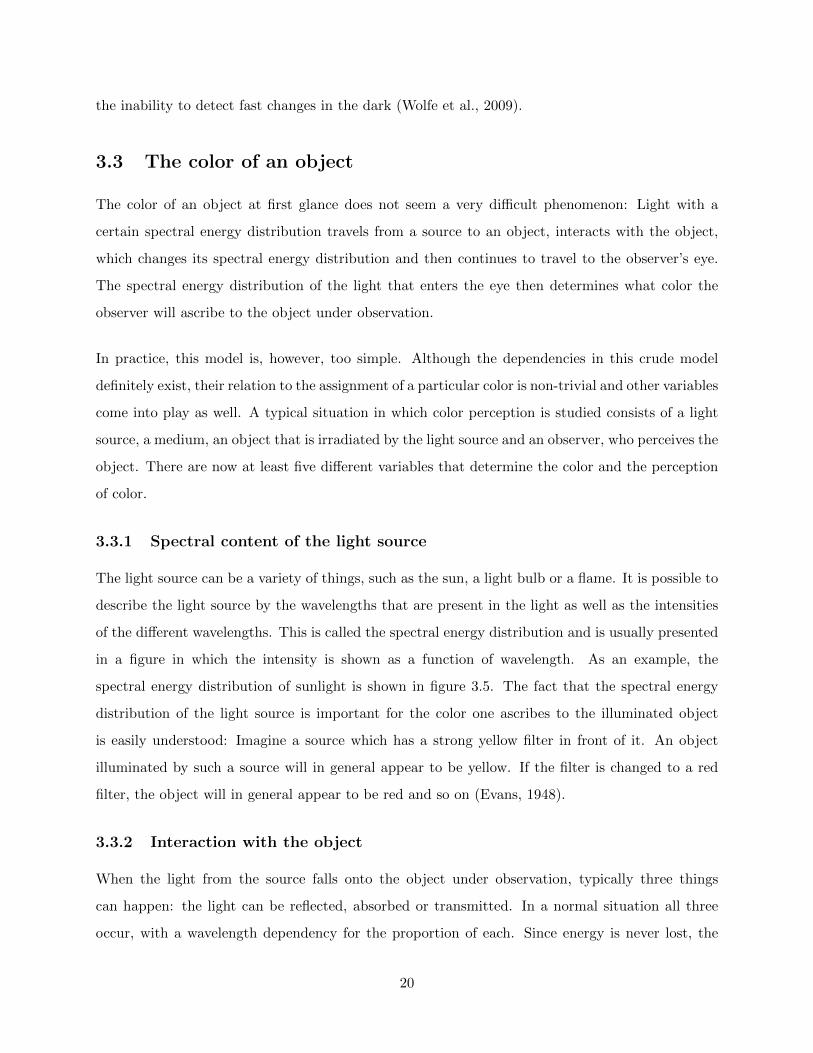
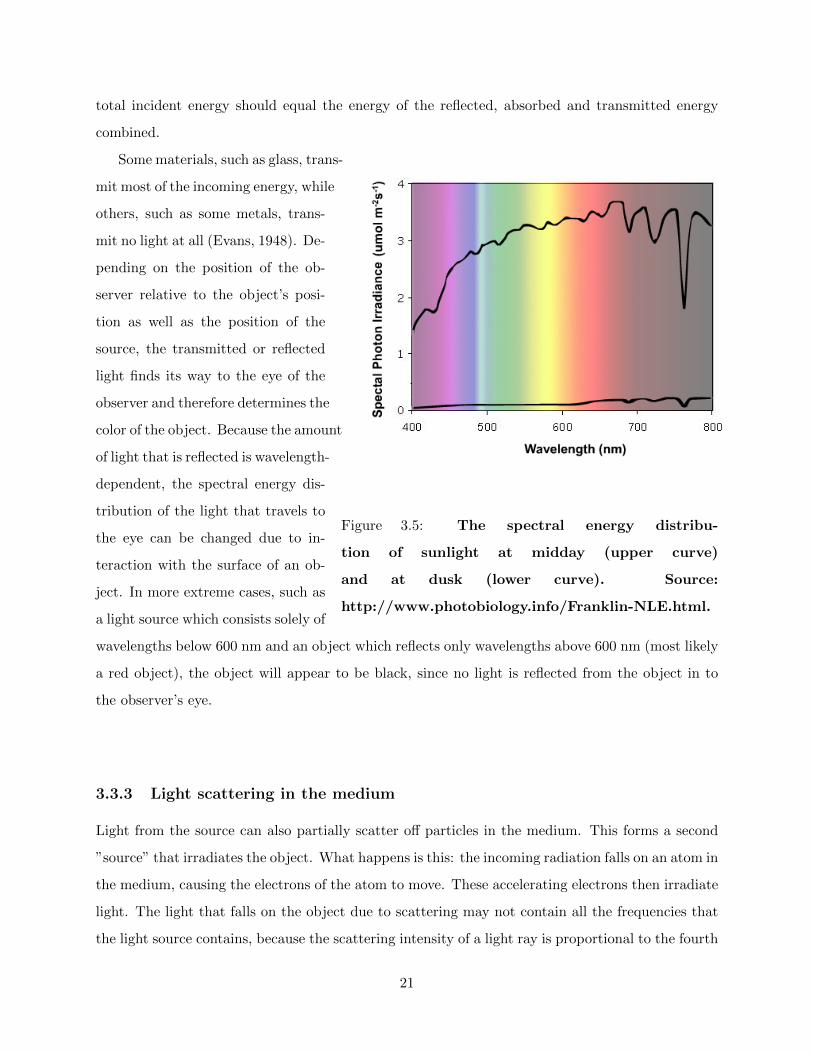
in a figure in which the intensity is shown as a function of wavelength. As an example, the
spectral energy distribution of sunlight is shown in figure 3.5. The fact that the spectral energy
distribution of the light source is important for the color one ascribes to the illuminated object
is easily understood: Imagine a source which has a strong yellow filter in front of it. An object
illuminated by such a source will in general appear to be yellow. If the filter is changed to a red
filter, the object will in general appear to be red and so on (Evans, 1948).
3.3.2 Interaction with the object
When the light from the source falls onto the object under observation, typically three things
can happen: the light can be reflected, absorbed or transmitted. In a normal situation all three
occur, with a wavelength dependency for the proportion of each. Since energy is never lost, the
20
total incident energy should equal the energy of the reflected, absorbed and transmitted energy
combined.
Some materials, such as glass, trans-
Figure 3.5: The spectral energy distribu-
tion of sunlight at midday (upper curve)
and at dusk (lower curve). Source:
http://www.photobiology.info/Franklin-NLE.html.
mit most of the incoming energy, while
others, such as some metals, trans-
mit no light at all (Evans, 1948). De-
pending on the position of the ob-
server relative to the object’s posi-
tion as well as the position of the
source, the transmitted or reflected
light finds its way to the eye of the
observer and therefore determines the
color of the object. Because the amount
of light that is reflected is wavelength-
dependent, the spectral energy dis-
tribution of the light that travels to
the eye can be changed due to in-
teraction with the surface of an ob-
ject. In more extreme cases, such as
a light source which consists solely of
wavelengths below 600 nm and an object which reflects only wavelengths above 600 nm (most likely
a red object), the object will appear to be black, since no light is reflected from the object in to
the observer’s eye.
3.3.3 Light scattering in the medium
Light from the source can also partially scatter off particles in the medium. This forms a second
”source” that irradiates the object. What happens is this: the incoming radiation falls on an atom in
the medium, causing the electrons of the atom to move. These accelerating electrons then irradiate
light. The light that falls on the object due to scattering may not contain all the frequencies that
the light source contains, because the scattering intensity of a light ray is proportional to the fourth
21
power of the frequency of the light, thereby favoring ”blue” lights. In some situations therefore,
the additional source may be viewed as a primarily blue source (Feynman et al., 1964).
3.3.4 Interaction with other objects
In the same way that light scattering can cause additional light to fall on to the object, also
interaction of the source light with other objects can lead to a different spectral energy distribution
of the light that falls on the object under observation. When light from the source reflects or is
transmitted through other objects, it is possible that this light travels to the object. As is shown
before, this light may possess an entirely different spectral energy distribution than the source
light and may therefore change the total spectral content of the incoming light. In addition, the
presence of other objects in the observed scene may change the color of the observed object due to
color constancy. The latter effect will be explored later in greater detail (Koenderink and Kappers,
2002).
3.3.5 Interaction in the eye
When the light of the object reaches the eye, its spectral energy distribution can still be changed,
due to reflectance and absorption in the eye as well as scattering in the eye media. The biggest
factor in the eye itself is the macular pigment, that can be found mainly in the center of the retina.
It absorbs most strongly from 400 nm to 550 nm and thus removes a lot of ”blue” from the incoming
light. The amount of pigment present in a person’s eye differs greatly over the population and is
thus responsible for the fact that different people may see the same color slightly different (Shevell,
2003; Wyszecki and Stiles, 2000).
Although the above list is not as excessive as it could be, it is clear from this list that color vision
is not as straightforward as one might intuitively think.
3.4 Technical aspects of color and color perception
As many other scientific fields, color research has developed a rich disciplinary jargon, which reflects
the fact that it is very difficult to define certain phenomena studied by the discipline. One can use
many different terms to describe aspects of a color, for example, hue, saturation and brightness.
These aspects are dependent on cognitive processes as well as the physical origin of the stimulus
22
and may differ from individual to individual (Evans, 1948).
Hue may be described as the quality in color that changes most noticeably when one changes the
wavelength of the light. For example, in a red beam the hue of the beam will indicate the fact that
the beam is red. For monochromatic beams, hue is thus closely related to the wavelength of the
beam. The amount of hue present in the beam is called the saturation and reflects the vividness
of the color. The brightness of a certain beam is closely related to the amount of light or total
radiant energy in the beam and can be defined as the effect the amount of light has on an observer
(Evans, 1948). In colorless beams, brightness is the only aspect of a beam that can change without
changing from colorless to colored (Grassmann, 1853).
These definitions are not as deeply rooted in the physical world as one might want: as shown
before, assuming a direct relationship between these characteristics and the physical world would
be erratic. Still, these terms are still widely used in the field, though need to be interpreted with
care.
3.4.1 Brightness
For those who have studied the variables on which color is dependent, it may come as no surprise
that the concept of brightness is a very complex one. Neurological processes play an important role
in the judgment of a color on its brightness, explaining why the study of brightness has to consist
of experiments with subjects. Since the differences between subjects can be great, this may lead to
problems, as is illustrated by the next example.
In a typical colorimetric experiment, in which the color of a beam is judged by a subject, the subject
sees a field through an eyepiece or a hole, half of which is filled with the beam one wants to measure.
The other half of this field is filled with the reference beam from a source that is controlled by the
experimenter. When the two halves of the field merge into one uniformly colored circle, the two
beams appear to the observer to have the same color. When a comparable experiment is set up in
which not the color, but only the brightness of a beam is compared to that of a reference beam, the
merging of the two halves may not occur, since the hue or saturation of the beams may differ. The
situations are therefore very different, as expressed by Erwin Schrodinger: ”Whereas the condition
of distinguishableness of two fields is logically absolutely clear and does not require any further
23
definition, this is by no means true of the condition of being equally bright, which is allegedly
accomplished in this case” (Schrodinger, 1926). This is why the question wether the two halves are
equally bright is more complicated than the question wether there are two distinguishable halves
and leaves room for interpretation. It is therefore not possible to test the brightness of a beam
in the way just described, without accepting a certain amount of subjectivity, which in cognitive
experiments has to be eliminated. Of course, even when the standard colorimetric set-up is used,
some subjectivity remains: subjects still have to judge if the two halves are distinct or not. It is
however impossible to design an experiment which is based on judgments of subjects that is not
subjective: the subjectivity is an intrinsic property of judgments. An experimenter can only try to
eliminate subjectivity as much as possible.
Of course there are other methods by which brightness can be defined. One could define brightness
operationally, as a certain variable in a precise experimental setup, or in a theoretical way, as an
aspect of a specific color in the mathematical framework. Both options have their problems: defini-
tions that are based on an experimental setup are subject to arbitrariness. The theoretical options
for definitions of brightness have as a common problem that they do not necessarily correspond
to actual human observation and may ascribe very different values to colors that for humans look
equally bright (Koenderink and Kappers, 2002).
3.4.2 Luminance
As a way to eliminate cognitive processes as a factor in judging the intensity of a light beam, the
term luminance, with unit candela per m2, was created. As said before, the photoreceptors in
the human eye detect light of different wavelengths with different efficiency. To account for this
efficiency, a curve was introduced called the luminosity function V (λ) (see fig. 3.6) by the CIE, the
Commission Internationale de l’Eclairage (Internation Committee on Illumination), which allows
one to calculate under certain conditions the amount of light necessary for a certain color to be as
bright as another given color. This curve was calculated by the CIE with the data from several
psychophysical measurements. Since the first introduction of the curve in 1924, several other curves
were introduced that can be used under other conditions than the first curve. For example, the
CIE 1931 10◦-curve can be used for visual fields of around 10◦, whereas the original curve is valid
only for fields smaller than 4◦ (Shevell, 2003). With the CIE 1931 10◦-curve, luminance is defined
24
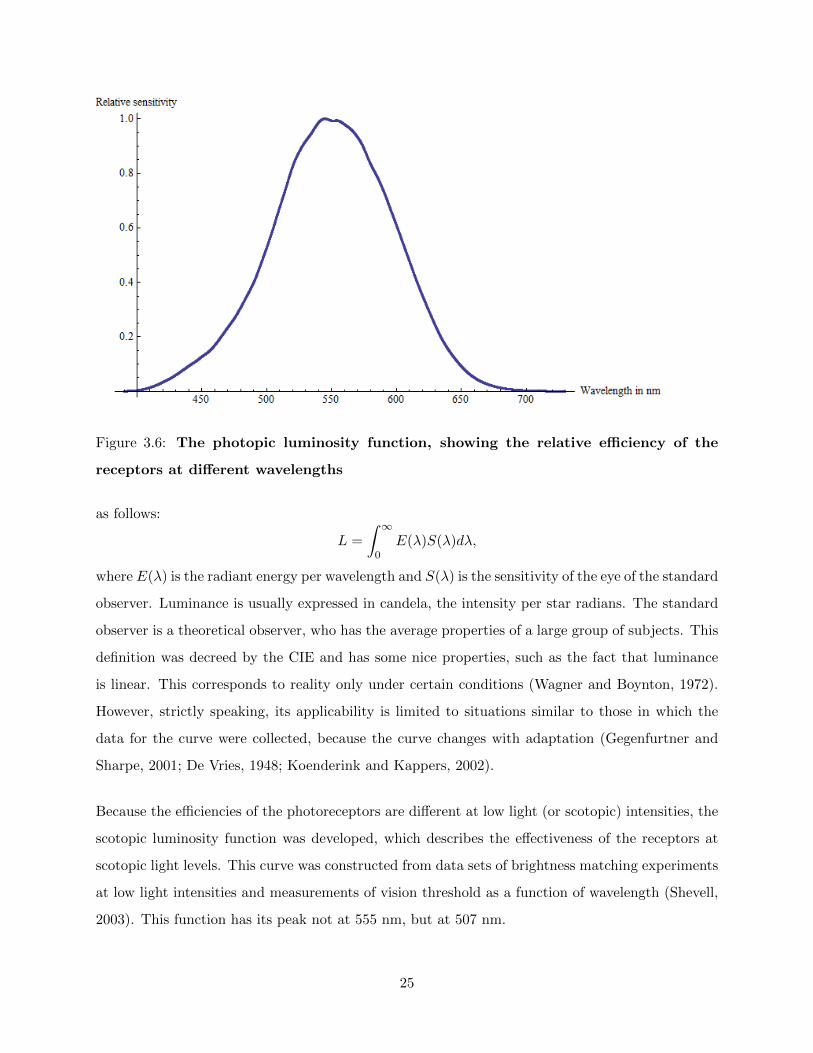
Figure 3.6: The photopic luminosity function, showing the relative efficiency of the
receptors at different wavelengths
as follows:
L =
∫ ∞0
E(λ)S(λ)dλ,
where E(λ) is the radiant energy per wavelength and S(λ) is the sensitivity of the eye of the standard
observer. Luminance is usually expressed in candela, the intensity per star radians. The standard
observer is a theoretical observer, who has the average properties of a large group of subjects. This
definition was decreed by the CIE and has some nice properties, such as the fact that luminance
is linear. This corresponds to reality only under certain conditions (Wagner and Boynton, 1972).
However, strictly speaking, its applicability is limited to situations similar to those in which the
data for the curve were collected, because the curve changes with adaptation (Gegenfurtner and
Sharpe, 2001; De Vries, 1948; Koenderink and Kappers, 2002).
Because the efficiencies of the photoreceptors are different at low light (or scotopic) intensities, the
scotopic luminosity function was developed, which describes the effectiveness of the receptors at
scotopic light levels. This curve was constructed from data sets of brightness matching experiments
at low light intensities and measurements of vision threshold as a function of wavelength (Shevell,
2003). This function has its peak not at 555 nm, but at 507 nm.
25
The luminosity curve is widely used in color research as a tool to express results in terms of a
standard observer. Additionally, with the definition of luminance, the definition of the unit troland
was created, to account for the dilation of a human’s pupil, as Td = Lv ·p, where Lv is the luminance
in cd m−2 and p is the area of the pupil in mm2. In this thesis the unit scotopic troland will be
used, the unit that is derived from the scotopic luminosity curve. Other units, such as the lumen
and the lux are also important: lumen measures the luminous flux and lux measures the intensity
of the light on a certain surface. 1 lumen is defined as the luminous flux of a light beam with an
intensity of 1 candela and 1 star radian in angular area. If such a beam falls on a surface of 1 m2,
the intensity at that surface is 1 lux (Wyszecki and Stiles, 2000).
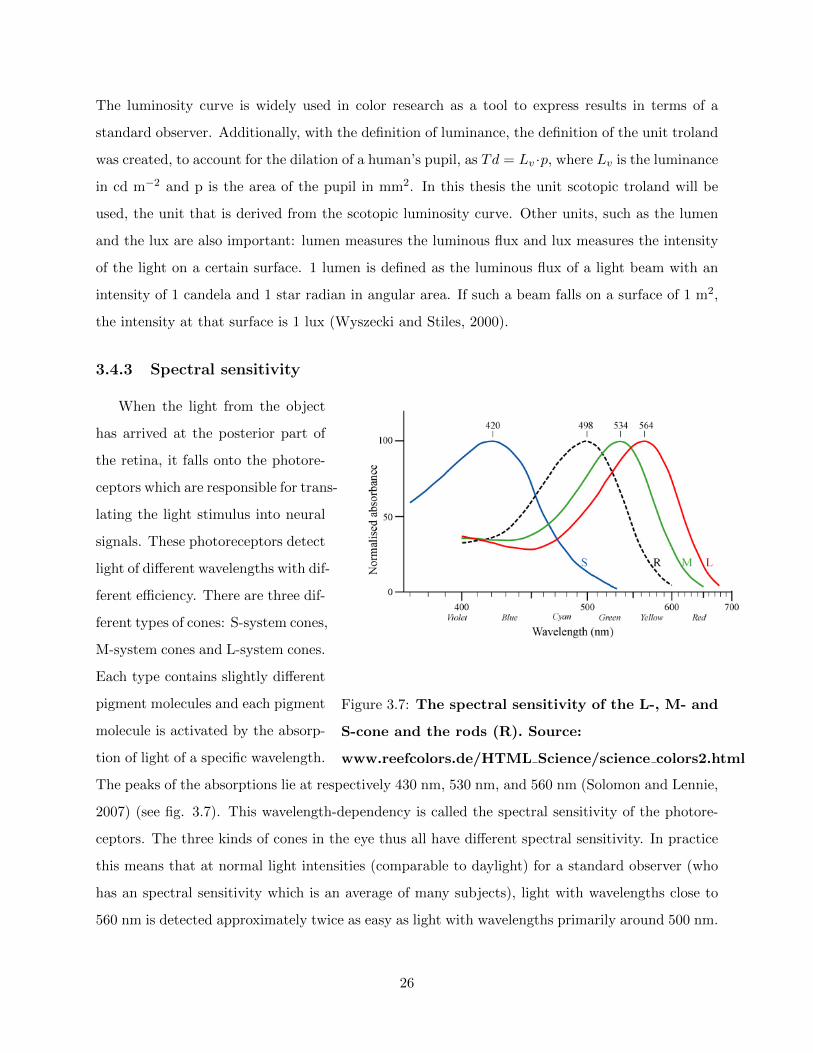
3.4.3 Spectral sensitivity
When the light from the object
Figure 3.7: The spectral sensitivity of the L-, M- and
S-cone and the rods (R). Source:
www.reefcolors.de/HTML Science/science colors2.html
has arrived at the posterior part of
the retina, it falls onto the photore-
ceptors which are responsible for trans-
lating the light stimulus into neural
signals. These photoreceptors detect
light of different wavelengths with dif-
ferent efficiency. There are three dif-
ferent types of cones: S-system cones,
M-system cones and L-system cones.
Each type contains slightly different
pigment molecules and each pigment
molecule is activated by the absorp-
tion of light of a specific wavelength.
The peaks of the absorptions lie at respectively 430 nm, 530 nm, and 560 nm (Solomon and Lennie,
2007) (see fig. 3.7). This wavelength-dependency is called the spectral sensitivity of the photore-
ceptors. The three kinds of cones in the eye thus all have different spectral sensitivity. In practice
this means that at normal light intensities (comparable to daylight) for a standard observer (who
has an spectral sensitivity which is an average of many subjects), light with wavelengths close to
560 nm is detected approximately twice as easy as light with wavelengths primarily around 500 nm.
26
However, the spectral sensitivity is different for different observers and is an important factor in the
process of color perception (Evans, 1948). The standard observer is most sensitive to wavelengths
that correspond to the color green. If the photoreceptors had a uniform spectral sensitivity, i.e. if
the photoreceptors were equally sensitive to all wavelengths, the world would look less green.
It is also important that the spectral sensitivity of the human eye is different at different il-
lumination levels. At light levels where the rods are active and the cones are not (at dusk or
night), the spectral sensitivity of the eye is dominated by the rods. This leads to the explanation of
the empirical fact that since rods are more sensitive to short wavelengths than cones, at low light
intensities everything looks bluer than at normal illumination levels: the so-called Purkinje shift
(Shevell, 2003).
3.4.4 Detectability
When no light from an object reaches the eye of an observer, it is obvious that the observer will
be unable to detect the object. However, when only a very small amount of light reaches the
eye, observers are typically still unable to detect the object. The threshold of how much light is
necessary to detect an object, depends on several factors, such as the position of the object in the
visual field and the size of the patch on the retina that is illuminated by the incident light from
the object. This is mainly due to the location of rods and cones on the retina and the mechanisms
that create signals in these photoreceptors.
Signals are created only when at least one photon is absorbed by a receptor. When light intensity
is very low, the quantum nature of photons becomes important. The arrival of photons at a specific
place at the retina can be modeled using a Poisson distribution. So even when the average number
of photons is larger than zero, it is still possible that at a specific moment no photons arrive (Shevell,
2003). This gives important insights concerning the threshold of vision: when a stimulus illuminates
only a very small patch on the retina, has a very short duration and is of very low intensity, it is
possible that an individual is unable to see the stimulus. This is especially true in the fovea, where
the only receptors present are cones. Only a few cones connect to a single cone bipolar cell there,
causing the chance that no signal is sent to the brain when photons fall on a small patch on the
fovea to be significantly greater than zero. Of course, the larger the area that is stimulated by a
light becomes, the smaller the chance that no signal is sent. For a very small stimulus (only 1’ (or
27
1 arc minute) at the cornea) that illuminates only the fovea, about 203 photons are needed for a
subject to see the stimulus (Koenig and Hofer, 2011).
The rods operate in a slightly different manner. A single rod needs less photons to create a signal
than a single cone due to temporal summation, which in rods is done over a longer time period
than in cones. The number of rods that connect to a single bipolar cell is large, lowering the chance
that quantum fluctuations in the stimulus are of great influence. Of course, when the number of
incident photons is dropped, the fluctuations can still become important. A recent study has shown
that for a stimulus with a diameter of 27’ (or 27 arc minutes) that illuminates the retina at 11
degrees temporal, only 50 photons are needed for a subject to detect the stimulus (Koenig and
Hofer, 2011). This is only one-fourth of the number of photons per second needed to activate the
cones.
3.4.5 Univariance
When it comes to seeing color, the output of a single photoreceptor is ambiguous. A difference in
the spectral composition of light falling on two neighboring receptors containing the same pigment
will cause a difference in their electrical response, but a difference in just the intensity of light
can have exactly the same effect (Bruce et al., 2003). The spectral sensitivity of a photoreceptor
is best understood as a measure of the probability that the receptor will absorb a photon of a
particular wavelength. Once absorbed, the identity of the photon is lost, so no single photoreceptor
can distinguish a change in the wavelength of light from a change in its intensity. This is the prin-
ciple of univariance (Solomon and Lennie, 2007): an infinite set of different wavelengths-intensity
combinations can elicit exactly the same response, so the output of a single photoreceptor cannot
by itself give information about the wavelengths stimulating it (Duncan and Hart, 2005; Panga et
al., 2010). Furthermore, the output of the photoreceptors is ambiguous since they do not give any
absolute information about the spectral composition of the light due to the existence of metamers:
different mixtures of wavelengths that elicit the same combination of responses in the photore-
ceptors. Metameric color stimuli are color stimuli with the same tristimulus values but different
spectral radiant power distributions (Wyszecki and Stiles, 2000). This also means that they are
perceived as the same color. More generally, metamers can be defined as any pair of stimuli that
are perceived as identical in spite of physical differences (Wolfe et al., 2009). In a retina containing
only one type of receptor cell, the pattern of receptor potentials therefore cannot provide separate
28
information about the patterns of intensity and of spectral composition and thus color vision is not
possible (Bruce et al., 2003). This is also why, according to the current paradigm, color vision is not
possible at scotopic light levels: all rods have the same spectral sensitivity and thus the problem
of univariance makes it impossible to discriminate colors. Color vision, the ability to distinguish
lights of different spectral composition, regardless of intensity, thus depends on the comparison of
activity from photoreceptors with different spectral sensitivities (Solomon and Lennie, 2007). The
trichromatic theory of color vision states that the color of any light is defined by the relationships
of three numbers, the outputs of three receptor types now known to be the three cones. If the
combined output from the receptors is the same, the same color is perceived (Bruce et al., 2003).
Thus, due to the spectral sensitivity and the fact that univariance is not an issue, the cones
are able to discriminate light beams of different spectral components. Based on the principle of
univariance, one would infer that during scotopic vision, when only the rod system is active, color
vision is not possible (Duncan and Hart, 2005).
3.5 The perception of color
Since the human brain is the final interpreter of the neural signals transmitted by the eye, it is not
surprising that brain processes can influence color vision. In this section, the areas in the brain that
interpret the incoming signals are discussed, as well as their functions. The signals from the retina
are transmitted through the optic nerve via the Lateral Geniculate Nucleus (LGN) in the thalamus
to the primary visual cortex (V1) in the brain (Stockman et al., 1995; Sharpe and Stockman, 1999).
3.5.1 LGN and opponent color channels
LGN is the relay station situated in the thalamus for visual information. Most of the fibers arriving
at LGN terminate in V1; only about 10 % of the fibers terminate in another nucleus in the thalamus,
the Superior Colliculus. LGN has a retinotipic and complex, six layered structure. It contains two
lower magnocellular layers that receive input from the M ganglion cells and four upper parvocellular
layers, receiving input from the P ganglion cells (Wolfe et al., 2009; Zeki, 1993). This nucleus, which
is present in both hemispheres, gets information from both the contra- and the ipsalateral eye, which
is segregated into different layers. Due to the organization of LGN, the retina is represented six
times over in each LGN, three times for each eye (Wolfe et al., 2009). As mentioned earlier, P-
ganglion cells have small receptive fields and some degree of wavelength specificity, whereas the
29
M-ganglion cells have large receptive fields and are not sensitive to different wavelengths. Since the
P-ganglion cells project to the parvocellular layers in LGN, only these layers are concerned with
color vision (Zeki, 1993).
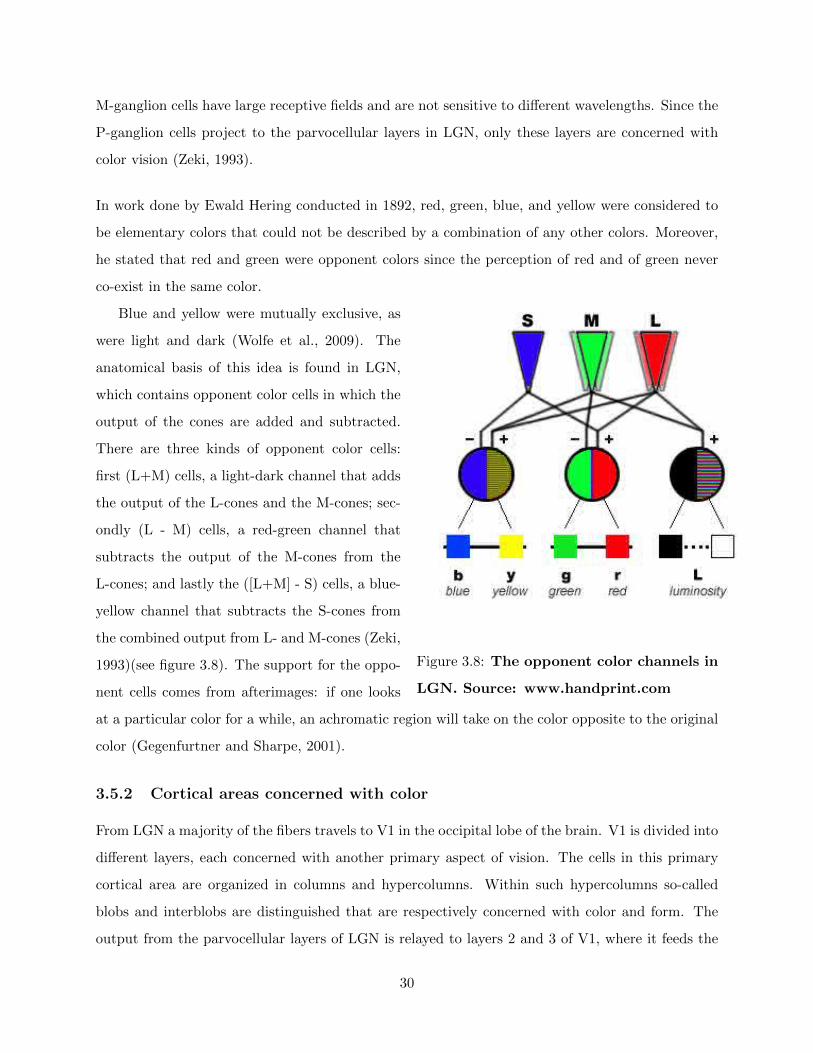
In work done by Ewald Hering conducted in 1892, red, green, blue, and yellow were considered to
be elementary colors that could not be described by a combination of any other colors. Moreover,
he stated that red and green were opponent colors since the perception of red and of green never
co-exist in the same color.
Blue and yellow were mutually exclusive, as
Figure 3.8: The opponent color channels in
LGN. Source: www.handprint.com
were light and dark (Wolfe et al., 2009). The
anatomical basis of this idea is found in LGN,
which contains opponent color cells in which the
output of the cones are added and subtracted.
There are three kinds of opponent color cells:
first (L+M) cells, a light-dark channel that adds
the output of the L-cones and the M-cones; sec-
ondly (L - M) cells, a red-green channel that
subtracts the output of the M-cones from the
L-cones; and lastly the ([L+M] - S) cells, a blue-
yellow channel that subtracts the S-cones from
the combined output from L- and M-cones (Zeki,
1993)(see figure 3.8). The support for the oppo-
nent cells comes from afterimages: if one looks
at a particular color for a while, an achromatic region will take on the color opposite to the original
color (Gegenfurtner and Sharpe, 2001).
3.5.2 Cortical areas concerned with color
From LGN a majority of the fibers travels to V1 in the occipital lobe of the brain. V1 is divided into
different layers, each concerned with another primary aspect of vision. The cells in this primary
cortical area are organized in columns and hypercolumns. Within such hypercolumns so-called
blobs and interblobs are distinguished that are respectively concerned with color and form. The
output from the parvocellular layers of LGN is relayed to layers 2 and 3 of V1, where it feeds the
30
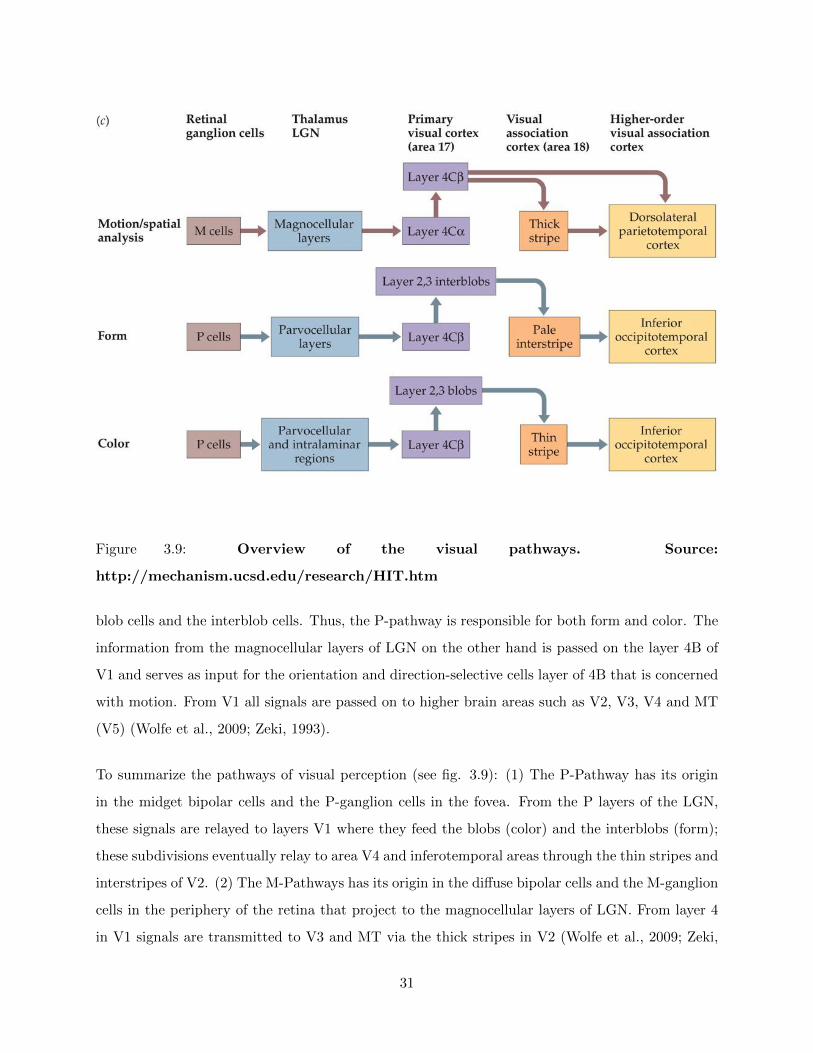
Figure 3.9: Overview of the visual pathways. Source:
http://mechanism.ucsd.edu/research/HIT.htm
blob cells and the interblob cells. Thus, the P-pathway is responsible for both form and color. The
information from the magnocellular layers of LGN on the other hand is passed on the layer 4B of
V1 and serves as input for the orientation and direction-selective cells layer of 4B that is concerned
with motion. From V1 all signals are passed on to higher brain areas such as V2, V3, V4 and MT
(V5) (Wolfe et al., 2009; Zeki, 1993).
To summarize the pathways of visual perception (see fig. 3.9): (1) The P-Pathway has its origin
in the midget bipolar cells and the P-ganglion cells in the fovea. From the P layers of the LGN,
these signals are relayed to layers V1 where they feed the blobs (color) and the interblobs (form);
these subdivisions eventually relay to area V4 and inferotemporal areas through the thin stripes and
interstripes of V2. (2) The M-Pathways has its origin in the diffuse bipolar cells and the M-ganglion
cells in the periphery of the retina that project to the magnocellular layers of LGN. From layer 4
in V1 signals are transmitted to V3 and MT via the thick stripes in V2 (Wolfe et al., 2009; Zeki,
31
1993). Studies on patients with lesions in LGN show that the magnocellular pathway responds to
large, fast-moving objects, and the parcocellular pathway responds to details of stationary targets.
More generally, it is said that the P-pathway is concerned with form and color while the M-pathway
codes for motion (Shevell, 2003).
3.5.3 Complex effect: Color constancy
Now that the path of visual perception has been explained, there remains one question: where is
color generated? Since color perception and experience involves much more than the determination
of the spectral composition of a light, color cannot be generated by low-level mechanisms of the
pathway of color vision. Evidence that perception of color is not a straight-forward process, but a
higher cognitive phenomenon involving knowledge about the world comes from the phenomenon of
color constancy.
The same object illuminated by two different lights will generate two different patterns of activity in
the cones. However, under certain circumstance, a shift in the perceived color may arise such that
the object will be perceived as to have the same color under both illuminants. This phenomenon is
known as color constancy (Zeki, 1993; Lin and Sun, 2008). To achieve color constancy, an object’s
spectral reflectance is the constant color parameter that needs to be evaluated and the light source
should be disregarded since it is a variable. A lot of variables are required to characterize both the
surface reflectance function and the spectral power distribution of the illuminant. Any information
that better describes these two parameters is a cue to color constancy (Gegenfurtner and Sharpe,
2001).
The phenomenon of color constancy may arise due to low-level analysis in the retina such as the
determination of local color contrast. Moreover, the depressions in the sensitivity of the photore-
ceptors, called color adaptation, seem to play an important role in color constancy: when the eye
is exposed to, for example, green light, the M-cone will be temporarily depressed in sensitivity,
causing subsequent lights to look less green. This effect is stronger when the first light is of higher
intensity and can cause a subsequent yellow light to look orange (because the L-cone has a stronger
response than the M-cone this case). In general, then, when the eye is exposed to light for a long
time, the sensitivity of all cones is changed due to the energy distribution of the source. Since a
higher intensity causes a greater deficiency, the spectral sensitivity of the eye is opposite to the
32
energy distribution of the source and causes an object with a flat reflectance curve to look white.
This goes for all objects: every object will have approximately the same appearance as it would
have had under standard illumination (Evans, 1948). This effect of color constancy is not complete
however, in the sense that for sources with an energy distribution very different from average day-
light or for objects with a sharp distribution, changes in colors may be observed:
Imagine a surface with a very sharp energy distribution in the yellow, illuminated by a source which
is one-fifth as strong in the blue, one-third in the green as compared to the red. The eye is therefore
five times as sensitive to blue, three times as sensitive to green as it is to red, compared to the
situation in average daylight. The spectral content of the reflected light from the surface is changed
only slightly, because the distribution of the surface is sharp. But with the adapted receptors, the
output of the M-cone will be three times as high as the output of the L-cone causing the surface
to look green-yellow instead of the yellow in normal daylight (Evans, 1948).
However, color constancy can not be fully explained by low-level processes, as higher-order pro-
cesses in the brain are also of importance. An analysis that extracts the average chromaticity from
the scene as a way to estimate the illuminant requires spatial integration that does not occur in
the retina or LGN (Gegenfurtner and Sharpe, 2001). Therefore, higher-order processes, such as
feedback and learning, are necessary for achieving color constancy. One V1 mechanism postulated
to contribute to color constancy is a neuron with a double opponent receptive field (Gegenfurtner
and Sharpe, 2001). Moreover, Zeki has suggested that the cortical area V4 has an important role
in color constancy (Zeki, 1993). Some other cues to color constancy are global contrast and mutual
reflections (Wolfe et al., 2009). Research suggests that when perceiving objects, people rely also
heavily on form information and space information to achieve color constancy, as opposed to using
only information about spectral reflectance or illumination chromaticity (Lin and Sun, 2008).
Color constancy has a more profound effect on every day vision than most people realize (Evans,
1948). But not only the colors (or hue) of objects seem constant under different illuminations,
also brightness constancy occurs. In contrast, an effect called brightness enhancement is shown to
exist for flickering lights. Flickering lights appear brighter than steady lights of equal luminance
(Evans, 1948; Wu et al., 1996). Experiments concerning brightness enhancement have only detected
enhancement at light intensities higher than 1 log phot. Td. (Wu et al., 1996; Van der Horst and
33

Muis, 1969; Magnussen and Glad, 1975).
34
Chapter 4
Research article
4.1 Introduction
4.1.1 Anatomy
Early anatomical studies showed that bipolar
cells receive segregated rod and cone synap-
tic input. This traditional view has long been
challenged (Panga et al., 2010). It has been
known for decades that the pathways for rods
and cones are not strictly separated. The rod
pathway appears to be superimposed on the al-
ready existing cone pathways that allow mul-
tiple ways for signal transmission (Sharpe and
Stockman, 1999).
The primary rod pathway connects rods to ON
bipolar cells and AII amacrine cells. The lat-
ter connect to both midget and diffuse bipo-
lar cells, hereby providing input to the P- and
the M-pathway. These AII cells have the same
response threshold, saturation levels and spec-
tral sensitivity as rods and are therefore called
’rod amacrine cells’ (Bloomfield and Dacheux,
2001). The signals from these cells are trans-
mitted via two routes: either via the main cone
pathway by synapsing on ON cone bipolar cells
through gap junctions that are responsible for
the electrical synaptic transmission between neu-
rons (Bloomfield and Dacheux, 2001) or via
OFF cone bipolar cells by conventional synapses
(Stockman et al., 1995; Sharpe and Stockman,
1999). This pathway is sensitive, slow and ac-
tive mainly at low scotopic intensities (Stock-
man et al., 1995). The secondary rod path-
way connects to the cone pathway at an earlier
stage through a rod-cone gap junction. One
rod spherule can have up to five gap junctions
that link to L- or M-cones. Through these
junctions, rod signals have direct access to ON
and OFF cone bipolar cells and ganglion cells
(Stockman et al., 1995; Sharpe and Stockman,
1999). As light level increases to mesopic level,
this fast and insensitive pathway becomes ac-
tive (Sharpe and Stockman, 1999).
Evidence for the two rod pathways in the retina
comes from (1) psychophysical, (2) electrophys-
iological and (3) anatomical and biochemical
35
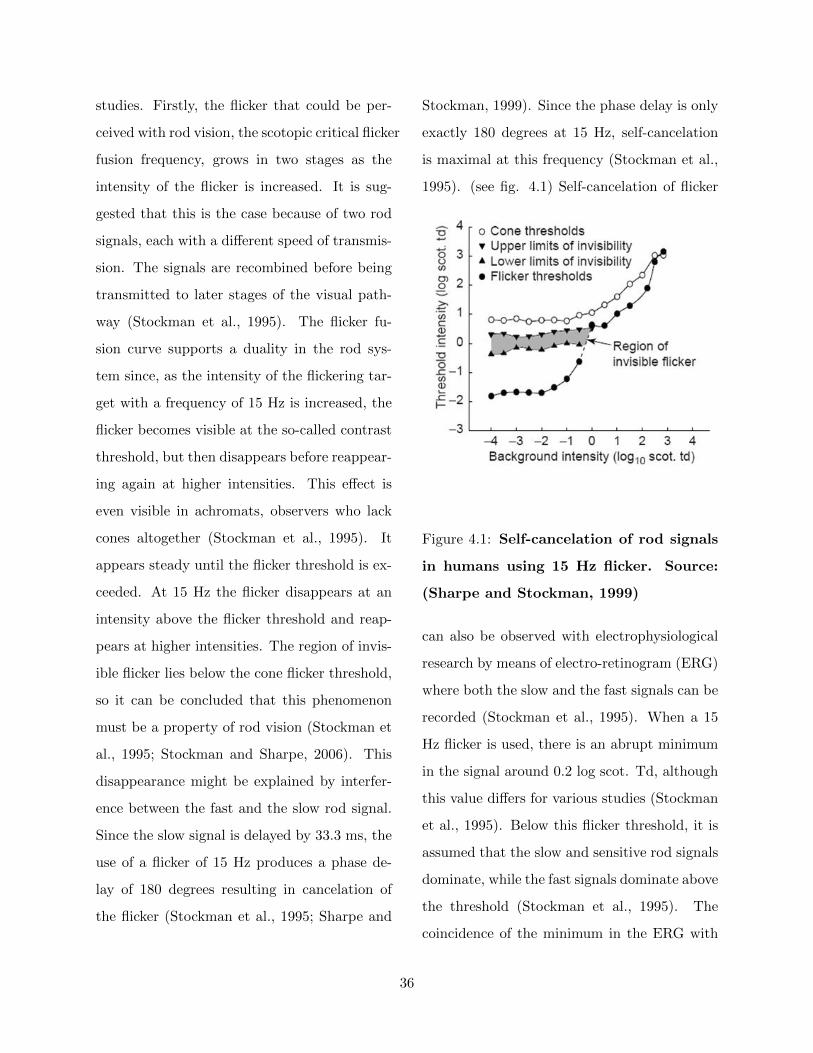
studies. Firstly, the flicker that could be per-
ceived with rod vision, the scotopic critical flicker
fusion frequency, grows in two stages as the
intensity of the flicker is increased. It is sug-
gested that this is the case because of two rod
signals, each with a different speed of transmis-
sion. The signals are recombined before being
transmitted to later stages of the visual path-
way (Stockman et al., 1995). The flicker fu-
sion curve supports a duality in the rod sys-
tem since, as the intensity of the flickering tar-
get with a frequency of 15 Hz is increased, the
flicker becomes visible at the so-called contrast
threshold, but then disappears before reappear-
ing again at higher intensities. This effect is
even visible in achromats, observers who lack
cones altogether (Stockman et al., 1995). It
appears steady until the flicker threshold is ex-
ceeded. At 15 Hz the flicker disappears at an
intensity above the flicker threshold and reap-
pears at higher intensities. The region of invis-
ible flicker lies below the cone flicker threshold,
so it can be concluded that this phenomenon
must be a property of rod vision (Stockman et
al., 1995; Stockman and Sharpe, 2006). This
disappearance might be explained by interfer-
ence between the fast and the slow rod signal.
Since the slow signal is delayed by 33.3 ms, the
use of a flicker of 15 Hz produces a phase de-
lay of 180 degrees resulting in cancelation of
the flicker (Stockman et al., 1995; Sharpe and
Stockman, 1999). Since the phase delay is only
exactly 180 degrees at 15 Hz, self-cancelation
is maximal at this frequency (Stockman et al.,
1995). (see fig. 4.1) Self-cancelation of flicker
Figure 4.1: Self-cancelation of rod signals
in humans using 15 Hz flicker. Source:
(Sharpe and Stockman, 1999)
can also be observed with electrophysiological
research by means of electro-retinogram (ERG)
where both the slow and the fast signals can be
recorded (Stockman et al., 1995). When a 15
Hz flicker is used, there is an abrupt minimum
in the signal around 0.2 log scot. Td, although
this value differs for various studies (Stockman
et al., 1995). Below this flicker threshold, it is
assumed that the slow and sensitive rod signals
dominate, while the fast signals dominate above
the threshold (Stockman et al., 1995). The
coincidence of the minimum in the ERG with
36
the perceptual invisible flicker is important be-
cause it suggests that the electrical cancelation
measured electro-physiologically and the neu-
ral cancelation measured perceptually are man-
ifestations of the same phenomenon (Stockman
and Sharpe, 2006). Lastly, anatomical and bio-
chemical studies have been executed on other
mammals. Research on mice, for example, has
shown, firstly that the rod bipolar cells receive
input from cones and, secondly, that a subpop-
ulation of the cone bipolar cells receives input
from rods (Panga et al., 2010). Pharmacologi-
cal experiments indicate that fast scotopic sig-
nals carried by the cone bipolar cells do not
pass across the gap junction to AII amacrine
cells but bypass them completely (Bloomfield
and Dacheux, 2001). Experiments on mammals
with similar retinal organization indicate a di-
vision between the rod pathways concerning in-
nervations of different ganglion cell types and
the signals they send to the brain (Bloomfield
and Dacheux, 2001).
Thus, the existence of two different rod path-
ways is very plausible on the basis of psychophys-
ical and electro-physiological studies on humans
and anatomical and biochemical research on
other mammals. Evidence for a third path-
way for signal transmission in scotopic lighting
in mammals is sparse (Sharpe and Stockman,
1999).
4.1.2 Perception
Although the presumed dichotomy between rods
and cones in terms of anatomy and pathways
in the retina has been rejected about a decade
ago (Stockman et al., 1995), the dichotomy as
regards the function of rods and cones still ex-
ists today. The understanding about color vi-
sion that the cones facilitate color vision during
photopic lighting and the rods mediate vision
in scotopic luminance is, however, being recon-
sidered. Because of the presumed dichotomy
between rods and cones, people with normal
vision are not at all supposed to be capable of
perceiving colors in the dark. Yet, recent re-
search has suggested the contrary, namely that
people are able to discriminate colors under dim
illumination (Pokorny et al., 2006, 2008).
As light intensity decreases, perception does
not abruptly change, but the human visual sys-
tem adapts gradually to the transition between
daylight and twilight (Pokorny et al., 2006).
In this middle range of mesopic vision, both
rods and cones are active. Color appearance
in mesopic vision differs from that in photopic
vision and is not easily estimated only from
knowledge of photopic and scotopic vision. To
predict a color appearance in mesopic vision, it
is necessary to determine the interactions be-
tween cone and rod signals at the levels of mesopic
vision (Shin et al., 2004). It is known that
37
rods influence color perception. The most con-
vincing evidence for this is the Purkinje shift
(Wolfe et al., 2009): as rods become dominant
in scotopic vision, the peak of visual sensitivity
shifts towards shorter wavelengths due to the
spectral sensitivity of the rods. As a result, ob-
jects reflecting mid and short wavelengths light
appear relatively brighter than objects that re-
flect long wavelength light (Pokorny et al., 2006).
When light intensity decreases and rods become
the dominant photoreceptor type, temporal re-
sponse slows down and temporal integration in-
creases (Zele et al., 2008). Moreover, rod acti-
vation alters all three attributes of color per-
ception (hue, saturation and brightness) and
enhances brightness and decreases saturation of
spectral lights (Cao et al., 2005). Since signals
originating from rods or cones are transmitted
in shared pathways, it is not surprising that
rod-cone interactions can alter color perception
(Cao et al., 2005).
Evidence that rods alone can mediate the per-
ception of color, and that even in the absence
of cone contributions various color percepts can
be observed (Pokorny et al., 2006), is less abun-
dant. (Pokorny et al., 2006, 2008) concluded
that there were salient and diverse color per-
cepts mediated by the rods at light intensities
between −2.5 and −3.5 log Lux. At these light
levels, color-normal observers consistently re-
ported color names. These percepts were based
on relative sample scotopic lightness and there-
fore the authors suggested that colors seen un-
der conditions where rods exclusively mediate
vision are relational (Pokorny et al., 2008).
Overcoming the problem of univariance, ’sco-
topic color vision’ according to Cao et al., arises
because rod stimulation mimics activation of
the M-cones, thereby maintaining some distinc-
tion between long and short wavelength color
appearance (Cao et al., 2005). According to
Pokorny, scotopic color vision can be explained
by experience in photopic color vision: given
the experience with viewing familiar objects in
the natural environment under dim illumina-
tion, it can be inferred that bright appearing
objects are richer in short wavelength light com-
pared to dim appearing objects. Pokorny spec-
ulates that in scotopic vision with input solely
from rods, the visual system estimates proba-
ble colors based on natural visual experience
(Pokorny et al., 2006). Some evidence for this
hypothesis comes from a study with color de-
fective observers (Pokorny et al., 2008). The
color categories of these observers at scotopic
luminance levels do not reveal an association of
scotopic brightness and spectral composition.
This can be explained by the fact that dichro-
mats have a reduced color gamut at photopic
light levels, which may contribute to their lim-
ited association of rod color perception with the
spectral composition of objects differing in sco-
38
topic reflectance (Pokorny et al., 2008).
4.1.3 Thresholds
Determining the exact transition between sco-
topic and mesopic vision, i.e. determining the
thresholds for rod and cone activity in the hu-
man visual system, is very difficult. Several
thresholds have been defined that are not in
agreement with each other. This is due to the
fact that different kinds of stimuli can have a
different effect on an observer, especially in the
range of mesopic vision (Stockman and Sharpe,
2006). We can therefore only compare thresh-
olds found using the same kind of stimuli.
In a study conducted by Sharpe and Stockman
in 2006, measurements of a cone threshold us-
ing flicker stimuli with a flicker frequency of 15
Hz yielded a result of 0.8 ± 0.1 log scot. Td.
using a 500 nm stimulus with a visual angle of
6 degrees. This is approximately 0.17± 0.1 log
phot. Td. (Stockman and Sharpe, 2006).
Another study by Bijveld et al. on color per-
ception under dim illuminance of large stimuli
using both behavioral and electrophysiological
methods also reports a threshold, namely
12.5 log quanta·deg−2 (Bijveld et al., 2010).
This unit does not correct for spectral sensi-
tivity. We can express the intensity in phot.
Td. for different colors using T = N · cph V (λ)λ ,
where T is the intensity in phot. Td., cph is a
constant with a value of 4.454 · 10−13 and N is
the intensity in quanta· deg−2.
The aim of the present study is to go further
into the findings of (Stockman and Sharpe, 2006)
and make a first guess at the threshold for color
vision, in order to determine the lowest light
intensity at which humans are able to perceive
colors. Furthermore, after the threshold has
been set, we infer, based on previous research
on the cone threshold and our own experiment,
which types of photoreceptors were most likely
to be active at the threshold, in order to eventu-
ally be able to conclude whether or not color vi-
sion is possible with rods as the only active pho-
toreceptors. Based on (Stockman and Sharpe,
2006) we expect that it is possible to perceive
colors at light intensities between 11 and 12.5
log quanta·deg−2 or perhaps even at lower in-
tensity levels.
4.2 Methods
4.2.1 Subjects
Fourteen subjects, twelve females and two males
took part in the study. All of them were be-
tween the age of 20 and 27. All had normal
color vision as assessed by the Farnsworth’s di-
chotomus test 15D type and the Ishahara Test
for Color Blindness (38 plates edition). The
subjects were naıve about the subject of the
study, participated voluntarily and did not re-
39
ceive any financial compensation for their par-
taking.
4.2.2 Stimuli
The stimuli consisted of 15 Hz lights with a par-
ticular color and a particular intensity. Five dif-
ferent colors were used: red, amber, blue, green
and white. Light intensity was classified in nine
levels ranging from 1.58 · 1010 quanta·deg−2 to
1.51 · 1012 quanta·deg−2. Each stimulus with
one of five possible spectral compositions and
one of nine intensity levels was presented three
times. Duration of presentation was 5 seconds
and the stimuli covered the entire visual field.
Since the software of the sphere automatically
corrected for the V-lambda curve, the input for
each stimulus was converted so that the num-
ber of photons reaching the eye was equal for
each color for a particular intensity level. To
be able to give the subject stimuli of very low
light intensities, glasses were used that only let
through 1 % of all lightIn total there were five
colors, nine intensity levels, and each combina-
tion of color and intensity level was presented
three times. The actual experiment thus con-
sisted of 135 stimuli which were presented in
random order. For a detailed description of the
stimuli, see Appendix A.
4.2.3 Apparatus
The study was executed in Bartimeus Institute
for the Visually Impaired at Zeist. Stimuli were
presented in a sphere: a Ganzfeld stimulator
(whole field stimulator) of the type Standalone
Colordome system (Diagnosys LLC). The room
was completely dark and the sphere had no
background illumination. The program Espion
versie 5 (Diagnosys LLC) was used to control
the sphere.
4.2.4 Procedure
The subjects were seated in front of the sphere.
The curtains were closed and 20 minutes of
dark-adaptation followed during which the ex-
perimenter explained the subject about the pro-
cedure of the experiment. 15 test stimuli were
included for the subjects to get used to the
range of colors and intensities. Each of the five
colors was presented with a low, average and
high intensity level. The test stimuli were pre-
sented in random order. Subjects were asked
to respond to each stimulus by naming which
color they perceived. For their response, they
could choose from a number of colors: black,
gray, white, red, blue, green and orange. A
response could consist of a combination of a
main color and a sub-color, for example blue-
gray, or merely a main color. After completion
of the test phase, the actual experiment consis-
ting of 135 stimuli began. After presentation of
40
a stimulus, the subjects gave a verbal response
and the experimenter wrote the response down
on a personal form and entered the response
in Open Office Calc. 3.2.0. After the exper-
iment, subjects performed two tests to assess
color vision: the Farnsworth’s dichotomus test
and the Ishahara Test for Color Blindness. The
results were written down on the personal form
that the subjects were asked to sign. Lastly,
they were offered a piece of pie as a reward for
their partaking in the study. In total 150 stim-
uli were presented, each with a duration of 5
seconds. One trial consisting of presentation of
the stimulus and a response took about 15 sec-
onds. The whole study, including 20 minutes of
dark-adaptation, explanation and the tests for
color vision, took about 1 hour per subject.
4.2.5 Data-analysis
Wolfram Mathematica 7.0 and Open Office Calc.
3.2.0 were used to compute the light intensity
levels, to generate random lists for the stimuli,
to analyze the data and to create all the graph-
ics. First, the responses of all subjects for one
color were plotted in a chart; secondly, the data
from each color was fit onto a standard psycho-
metric function; and lastly, the above-change
threshold for the perception of color was deter-
mined for each color. To be able to determine
a threshold, it was necessary to decide which
responses from subjects are ’correct’ and which
are incorrect. It is obvious that responses that
do not contain the color of the given stimulus
are incorrect, such as ”Red-Gray” for a green
stimulus. In our view, responses like ”Blue-
Gray” suggest that a subject recognized the
stimulus as blue, but wanted to include the
overall brightness of the stimulus in the addi-
tion of a colorless subcolor. If a subject would
not have had the opportunity to assign a sub-
color, he would have given the response ”Blue”.
This can of course be disputed, but seems rea-
sonable in this phase of the research. We will
therefore define ’correct’ to be those responses
which match the color of the given stimulus,
with the possibility that a colorless subtag was
given. All other responses are incorrect. With
this sense of correctness, a performance analy-
sis could be made. Since each unique combi-
nation of intensity and color was represented
three times to each subject, three answers per
subject were collected for every intensity-color
tuple. Those three answers are a dependent
set, because they stem from the same subject.
However, the set consisting of the averages of
such a set is independent, because the averages
come from different subjects. This set contains
thus 14 data points per intensity.
41
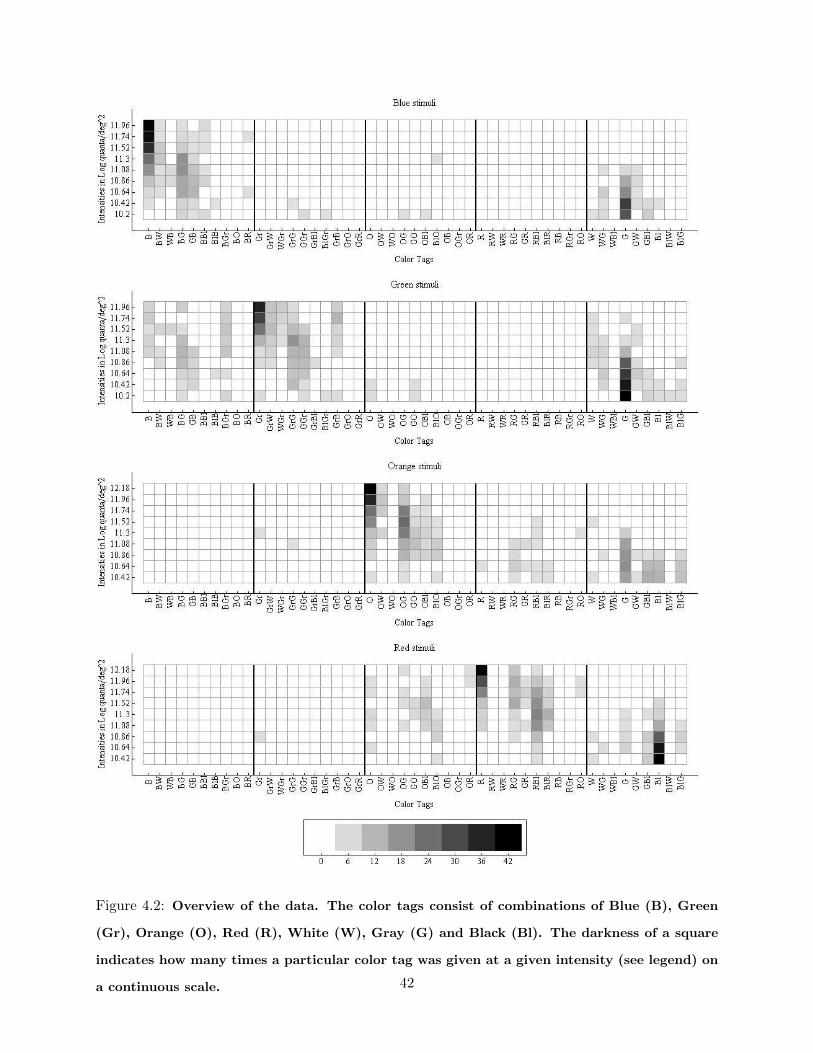
Figure 4.2: Overview of the data. The color tags consist of combinations of Blue (B), Green
(Gr), Orange (O), Red (R), White (W), Gray (G) and Black (Bl). The darkness of a square
indicates how many times a particular color tag was given at a given intensity (see legend) on
a continuous scale. 42
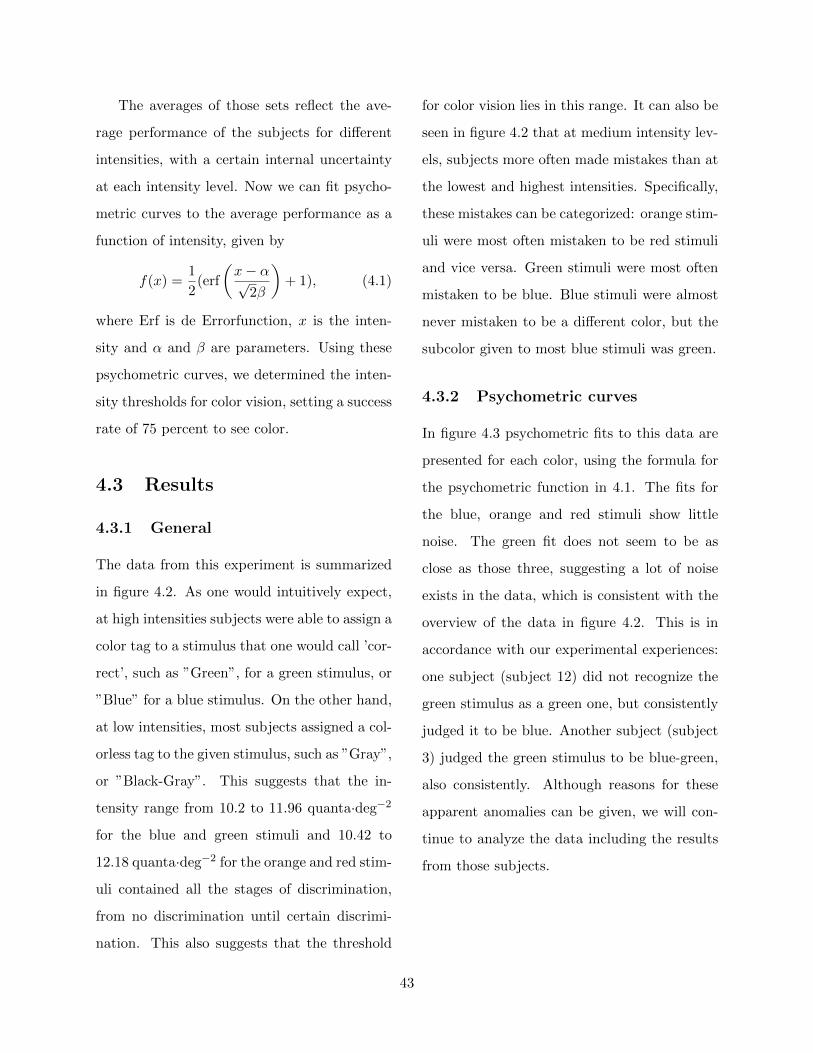
The averages of those sets reflect the ave-
rage performance of the subjects for different
intensities, with a certain internal uncertainty
at each intensity level. Now we can fit psycho-
metric curves to the average performance as a
function of intensity, given by
f(x) =1
2(erf
(x− α√
2β
)+ 1), (4.1)
where Erf is de Errorfunction, x is the inten-
sity and α and β are parameters. Using these
psychometric curves, we determined the inten-
sity thresholds for color vision, setting a success
rate of 75 percent to see color.
4.3 Results
4.3.1 General
The data from this experiment is summarized
in figure 4.2. As one would intuitively expect,
at high intensities subjects were able to assign a
color tag to a stimulus that one would call ’cor-
rect’, such as ”Green”, for a green stimulus, or
”Blue” for a blue stimulus. On the other hand,
at low intensities, most subjects assigned a col-
orless tag to the given stimulus, such as ”Gray”,
or ”Black-Gray”. This suggests that the in-
tensity range from 10.2 to 11.96 quanta·deg−2
for the blue and green stimuli and 10.42 to
12.18 quanta·deg−2 for the orange and red stim-
uli contained all the stages of discrimination,
from no discrimination until certain discrimi-
nation. This also suggests that the threshold
for color vision lies in this range. It can also be
seen in figure 4.2 that at medium intensity lev-
els, subjects more often made mistakes than at
the lowest and highest intensities. Specifically,
these mistakes can be categorized: orange stim-
uli were most often mistaken to be red stimuli
and vice versa. Green stimuli were most often
mistaken to be blue. Blue stimuli were almost
never mistaken to be a different color, but the
subcolor given to most blue stimuli was green.
4.3.2 Psychometric curves
In figure 4.3 psychometric fits to this data are
presented for each color, using the formula for
the psychometric function in 4.1. The fits for
the blue, orange and red stimuli show little
noise. The green fit does not seem to be as
close as those three, suggesting a lot of noise
exists in the data, which is consistent with the
overview of the data in figure 4.2. This is in
accordance with our experimental experiences:
one subject (subject 12) did not recognize the
green stimulus as a green one, but consistently
judged it to be blue. Another subject (subject
3) judged the green stimulus to be blue-green,
also consistently. Although reasons for these
apparent anomalies can be given, we will con-
tinue to analyze the data including the results
from those subjects.
43
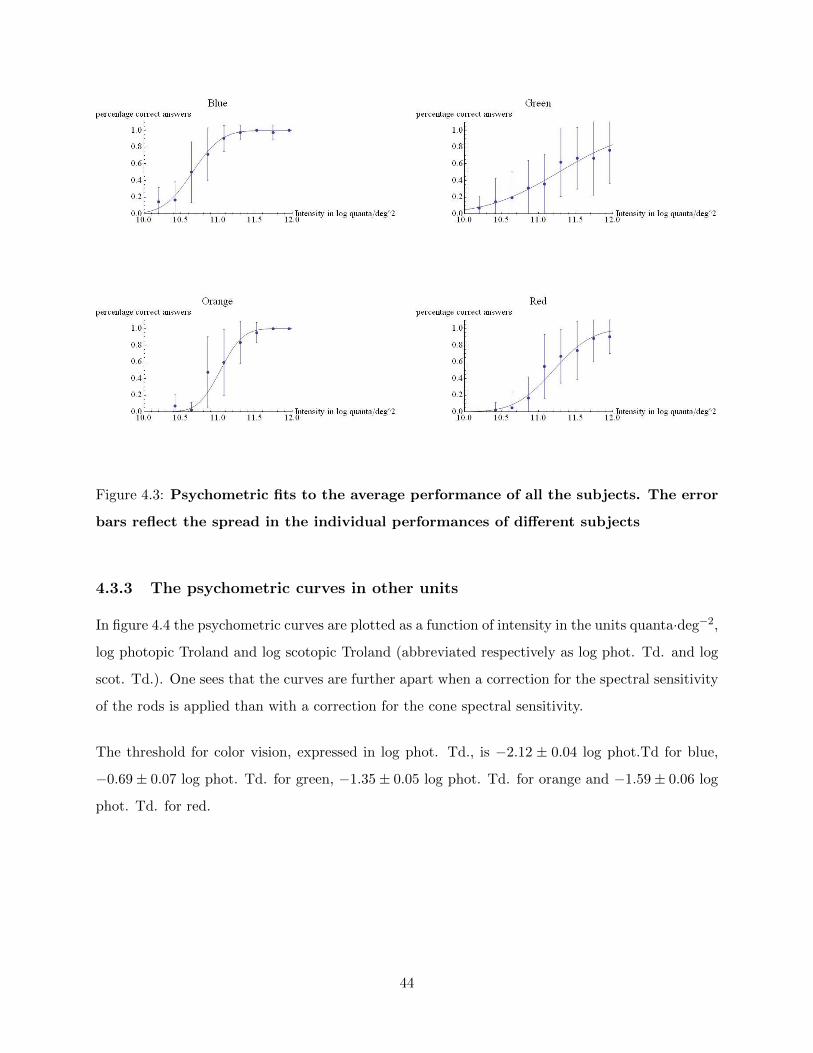
Figure 4.3: Psychometric fits to the average performance of all the subjects. The error
bars reflect the spread in the individual performances of different subjects
4.3.3 The psychometric curves in other units
In figure 4.4 the psychometric curves are plotted as a function of intensity in the units quanta·deg−2,
log photopic Troland and log scotopic Troland (abbreviated respectively as log phot. Td. and log
scot. Td.). One sees that the curves are further apart when a correction for the spectral sensitivity
of the rods is applied than with a correction for the cone spectral sensitivity.
The threshold for color vision, expressed in log phot. Td., is −2.12 ± 0.04 log phot.Td for blue,
−0.69± 0.07 log phot. Td. for green, −1.35± 0.05 log phot. Td. for orange and −1.59± 0.06 log
phot. Td. for red.
44
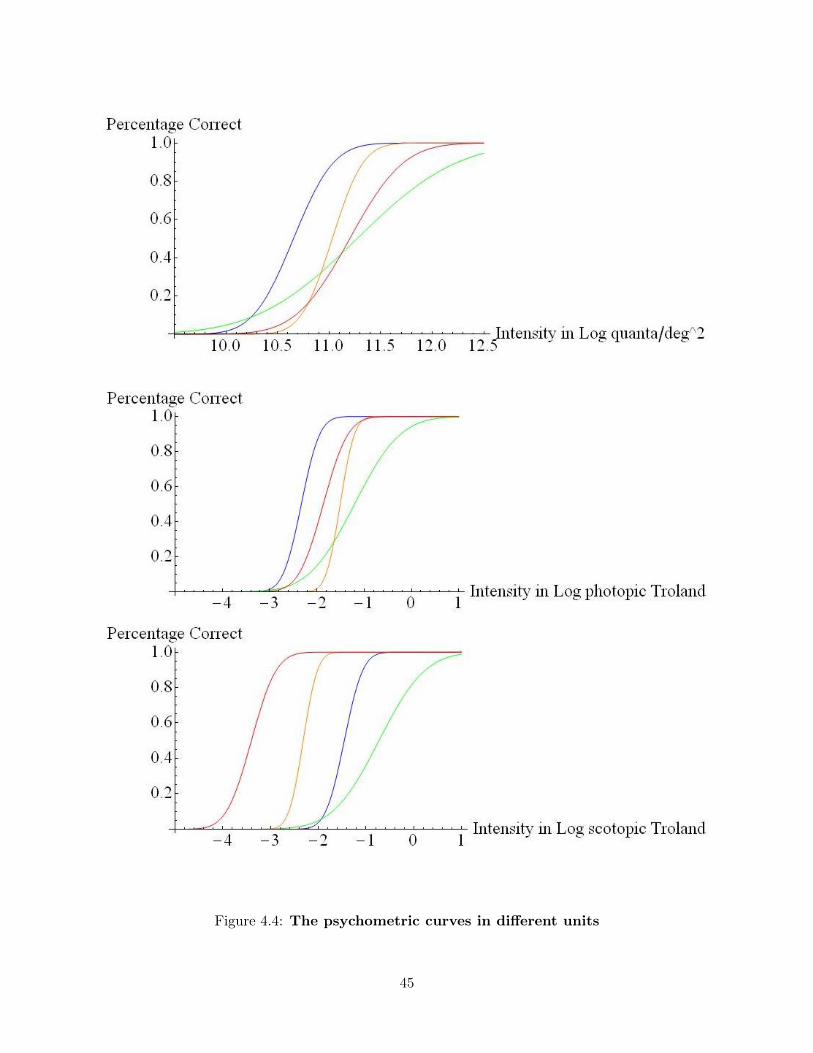
Figure 4.4: The psychometric curves in different units
45
4.4 Discussion
The most important results from this experi-
ment are as follows: the threshold for color vi-
sion seems to vary for different colors, between
−0.62 and −2.16 log phot. Td.; The results
also indicate that color perception at the inten-
sities used in this experimental set-up is primar-
ily mediated by cones, rather than rods. This
is seen from figure 4.4: one would expect that
when a correction for the spectral sensitivity
of the dominant photoreceptor is applied, the
curves would coincide. It is shown in figure 4.4
that the curves that are corrected for the cone
spectral sensitivity (expressed in log phot. Td.)
are much closer together than those that are
corrected for the rod spectral sensitivity (ex-
pressed in log scot. Td.) and thus suggest that
the perception of color at threshold level seems
to be dominated by cones.
4.4.1 Threshold for color vision
Our finding that humans are able to distinguish
colors at intensities below −1.5 log phot. Td.
is in accordance with the results of Pokorny
(Pokorny et al., 2006). In addition, our re-
sults also corroborate the findings of Pokorny
that colors at very dim illumination levels can
be ordered in a blue-green- and a red-orange
group; mistakes between red and orange and
between blue and green were significantly more
frequent than confusions between for example
orange and blue. Our findings corroborate the
conclusion of Bijveld et al., namely that it is
possible to perceive colors at intensities below
12.5 log quanta·deg−2 (Bijveld et al., 2010).
4.4.2 Mesopic or scotopic color vision
The mesopic region is defined as the intensity
region where both rods and cones are active
and spans thus from the intensity range beyond
cone threshold for which rods are not yet fully
saturated. There is no consensus yet on which
type of photoreceptor is active at the light in-
tensity of our threshold.
On the one hand, there is some support the
claim that only rods were active at threshold
level: Pokorny states that at the lowest illumi-
nation levels used in his studies (of −3.5 until
−2.5 log lux or equivalently for fully darkness-
adapted eyes with pupil diameter of 6.5 mm ap-
proximately −1.7 until −0.7 log phot td) only
rods mediate vision (Pokorny et al., 2006). Fur-
thermore, Sharpe and Stockman reported a cone
threshold of 0.17 ± 0.1 log phot. Td., which
is well above our threshold for a comparable
stimulus (Stockman and Sharpe, 2006). In-
deed, the difference between our threshold for
a green stimulus with an average wavelength of
approximately 517 nm of −0.69±0.07 log phot.
Td. and the one found by Sharpe and Stock-
man is 0.86±0.2 log phot. Td. (Stockman and
Sharpe, 2006). Thus, according to Sharpe and
46
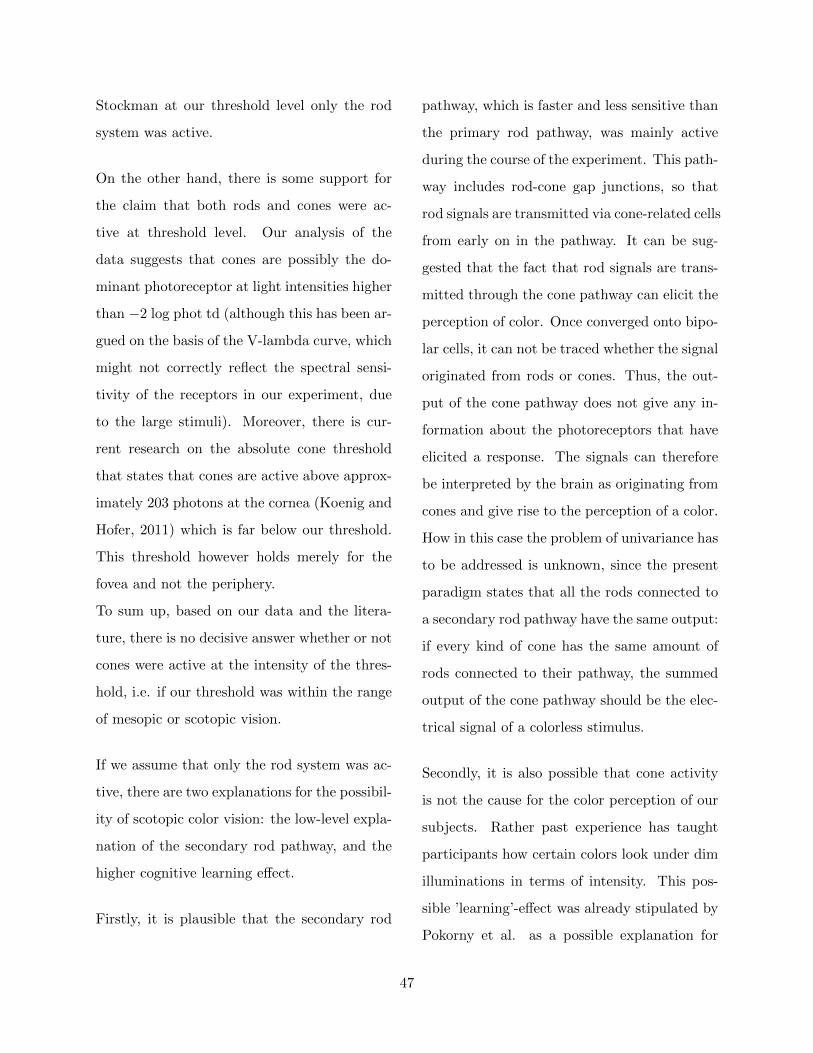
Stockman at our threshold level only the rod
system was active.
On the other hand, there is some support for
the claim that both rods and cones were ac-
tive at threshold level. Our analysis of the
data suggests that cones are possibly the do-
minant photoreceptor at light intensities higher
than −2 log phot td (although this has been ar-
gued on the basis of the V-lambda curve, which
might not correctly reflect the spectral sensi-
tivity of the receptors in our experiment, due
to the large stimuli). Moreover, there is cur-
rent research on the absolute cone threshold
that states that cones are active above approx-
imately 203 photons at the cornea (Koenig and
Hofer, 2011) which is far below our threshold.
This threshold however holds merely for the
fovea and not the periphery.
To sum up, based on our data and the litera-
ture, there is no decisive answer whether or not
cones were active at the intensity of the thres-
hold, i.e. if our threshold was within the range
of mesopic or scotopic vision.
If we assume that only the rod system was ac-
tive, there are two explanations for the possibil-
ity of scotopic color vision: the low-level expla-
nation of the secondary rod pathway, and the
higher cognitive learning effect.
Firstly, it is plausible that the secondary rod
pathway, which is faster and less sensitive than
the primary rod pathway, was mainly active
during the course of the experiment. This path-
way includes rod-cone gap junctions, so that
rod signals are transmitted via cone-related cells
from early on in the pathway. It can be sug-
gested that the fact that rod signals are trans-
mitted through the cone pathway can elicit the
perception of color. Once converged onto bipo-
lar cells, it can not be traced whether the signal
originated from rods or cones. Thus, the out-
put of the cone pathway does not give any in-
formation about the photoreceptors that have
elicited a response. The signals can therefore
be interpreted by the brain as originating from
cones and give rise to the perception of a color.
How in this case the problem of univariance has
to be addressed is unknown, since the present
paradigm states that all the rods connected to
a secondary rod pathway have the same output:
if every kind of cone has the same amount of
rods connected to their pathway, the summed
output of the cone pathway should be the elec-
trical signal of a colorless stimulus.
Secondly, it is also possible that cone activity
is not the cause for the color perception of our
subjects. Rather past experience has taught
participants how certain colors look under dim
illuminations in terms of intensity. This pos-
sible ’learning’-effect was already stipulated by
Pokorny et al. as a possible explanation for
47
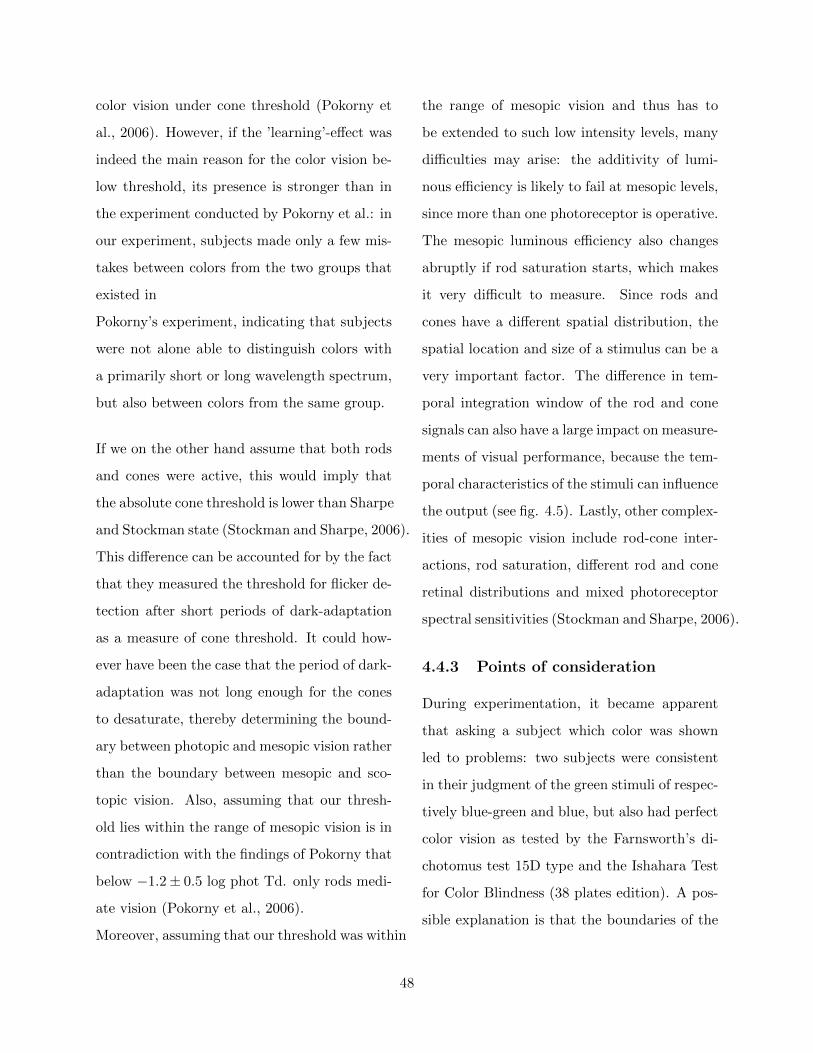
color vision under cone threshold (Pokorny et
al., 2006). However, if the ’learning’-effect was
indeed the main reason for the color vision be-
low threshold, its presence is stronger than in
the experiment conducted by Pokorny et al.: in
our experiment, subjects made only a few mis-
takes between colors from the two groups that
existed in
Pokorny’s experiment, indicating that subjects
were not alone able to distinguish colors with
a primarily short or long wavelength spectrum,
but also between colors from the same group.
If we on the other hand assume that both rods
and cones were active, this would imply that
the absolute cone threshold is lower than Sharpe
and Stockman state (Stockman and Sharpe, 2006).
This difference can be accounted for by the fact
that they measured the threshold for flicker de-
tection after short periods of dark-adaptation
as a measure of cone threshold. It could how-
ever have been the case that the period of dark-
adaptation was not long enough for the cones
to desaturate, thereby determining the bound-
ary between photopic and mesopic vision rather
than the boundary between mesopic and sco-
topic vision. Also, assuming that our thresh-
old lies within the range of mesopic vision is in
contradiction with the findings of Pokorny that
below −1.2± 0.5 log phot Td. only rods medi-
ate vision (Pokorny et al., 2006).
Moreover, assuming that our threshold was within
the range of mesopic vision and thus has to
be extended to such low intensity levels, many
difficulties may arise: the additivity of lumi-
nous efficiency is likely to fail at mesopic levels,
since more than one photoreceptor is operative.
The mesopic luminous efficiency also changes
abruptly if rod saturation starts, which makes
it very difficult to measure. Since rods and
cones have a different spatial distribution, the
spatial location and size of a stimulus can be a
very important factor. The difference in tem-
poral integration window of the rod and cone
signals can also have a large impact on measure-
ments of visual performance, because the tem-
poral characteristics of the stimuli can influence
the output (see fig. 4.5). Lastly, other complex-
ities of mesopic vision include rod-cone inter-
actions, rod saturation, different rod and cone
retinal distributions and mixed photoreceptor
spectral sensitivities (Stockman and Sharpe, 2006).
4.4.3 Points of consideration
During experimentation, it became apparent
that asking a subject which color was shown
led to problems: two subjects were consistent
in their judgment of the green stimuli of respec-
tively blue-green and blue, but also had perfect
color vision as tested by the Farnsworth’s di-
chotomus test 15D type and the Ishahara Test
for Color Blindness (38 plates edition). A pos-
sible explanation is that the boundaries of the
48
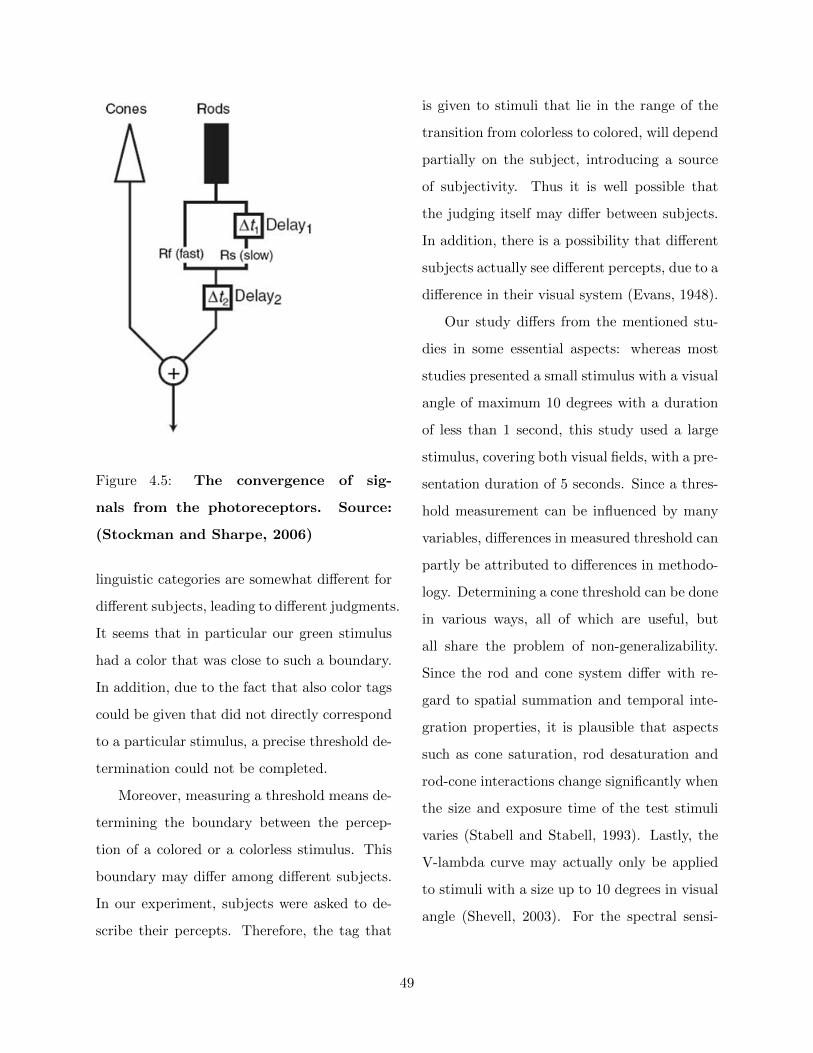
Figure 4.5: The convergence of sig-
nals from the photoreceptors. Source:
(Stockman and Sharpe, 2006)
linguistic categories are somewhat different for
different subjects, leading to different judgments.
It seems that in particular our green stimulus
had a color that was close to such a boundary.
In addition, due to the fact that also color tags
could be given that did not directly correspond
to a particular stimulus, a precise threshold de-
termination could not be completed.
Moreover, measuring a threshold means de-
termining the boundary between the percep-
tion of a colored or a colorless stimulus. This
boundary may differ among different subjects.
In our experiment, subjects were asked to de-
scribe their percepts. Therefore, the tag that
is given to stimuli that lie in the range of the
transition from colorless to colored, will depend
partially on the subject, introducing a source
of subjectivity. Thus it is well possible that
the judging itself may differ between subjects.
In addition, there is a possibility that different
subjects actually see different percepts, due to a
difference in their visual system (Evans, 1948).
Our study differs from the mentioned stu-
dies in some essential aspects: whereas most
studies presented a small stimulus with a visual
angle of maximum 10 degrees with a duration
of less than 1 second, this study used a large
stimulus, covering both visual fields, with a pre-
sentation duration of 5 seconds. Since a thres-
hold measurement can be influenced by many
variables, differences in measured threshold can
partly be attributed to differences in methodo-
logy. Determining a cone threshold can be done
in various ways, all of which are useful, but
all share the problem of non-generalizability.
Since the rod and cone system differ with re-
gard to spatial summation and temporal inte-
gration properties, it is plausible that aspects
such as cone saturation, rod desaturation and
rod-cone interactions change significantly when
the size and exposure time of the test stimuli
varies (Stabell and Stabell, 1993). Lastly, the
V-lambda curve may actually only be applied
to stimuli with a size up to 10 degrees in visual
angle (Shevell, 2003). For the spectral sensi-
49
tivity correction of larger stimuli, there is no
special V-lambda curve.
4.4.4 Further research
The findings of this research have strengthened
the results of Bijveld and Pokorny that color vi-
sion is possible below −1.5 log phot. Td. (Bi-
jveld et al., 2010; Pokorny et al., 2006). The
threshold determination using the psychome-
tric fits can be improved, for example using a
staircase measurement, a widely accepted method
for determining thresholds (Wolfe et al., 2009).
To prevent problems with linguistic categories,
separate measurement series should be used for
different colors, using only one color and gray
for every series.
The study of Bijveld that measures color per-
ception under dim illuminance of large stim-
uli using both behavioral and electrophysiolog-
ical methods reports a threshold of 12.5 log
quanta·deg−2 (Bijveld et al., 2010). Our results
suggest that there is cone activity well below
this value, namely below 11.8 log quanta·deg−2,
corroborating their hypothesis that using ERG
very small but significant signals from bipolar
cells cannot be detected. Thus, it could well
be that the critical mass of cones necessary
for color vision is less than the critical mass of
cones necessary for detection using ERG. Fur-
ther investigation is necessary to determine the
exact possibilities and limitations of ERG re-
search. Although Pokorny’s study on color de-
fective observers has provided some support for
the hypothesis (Pokorny et al., 2008), more re-
search should be done to investigate the validity
of the ’learning’-effect that under dim illumi-
nations, subjects estimate the color using the
observed intensity and prior experience.
In addition, to be able to draw proper conclu-
sions concerning the activity of photoreceptors,
the absolute cone threshold for stimuli with a
large visual angle should be determined.
50
Chapter 5
Interdisciplinary reflection
5.1 Conflicts
Our research points out that the threshold for color vision varies for different colors, between−0.69±
0.07 and −2.12 ± 0.04 log phot. Td. Moreover, the possibility of the perception of color at this
light intensity can be accounted for by different explanations. The anatomy of the eye, containing
two rod pathways, can be important, due to the fact that the second rod pathway is connected
to the pathways of cones. In addition, the spectral sensitivity of the human photoreceptors can
be important, because a difference in sensitivity allows for differentiating between different colors.
Moreover, the so-called learning effect that Pokorny suggested can be important, since higher-
order processes can compensate for the lack of information from the cones. All these explanations
contribute to the understanding of scotopic color vision, but none of these is in itself sufficient for
accounting for this phenomenon.
The insights can be distinguished on the basis of their disciplinary character. The issue of spectral
sensitivity and detectibility lie in the scope of physics, whereas the learning effect is a higher-
cognitive process studied by psychology. The issue of the pathways in the retina does not fit
into either two disciplines but actually belongs to biology. When one is studying perception, it is
possible to distinguish three main parameters: the thing that is perceived, the signal that contains
information about the perceived thing, and the perceiver, who receives this signal. The first step
of perception, the traveling of a signal through a medium to a perceiver and the first interactions
between the signal and the human receptors, is what one intuitively would ascribe to the realm
of physics. The second step, the further processing of the signal in the brain, belongs to the
51
realm of psychology. The realm of biology starts from the first interactions of the signal with
the human receptors, since part of the research subject of biology includes the human body and
its interactions with the outside world. One could argue that the realm of biology usually stops
where the processes become too complicated to study them using chemical methods, EEG or other
measuring techniques. There they become the subject of psychology alone.
In practice, most researchers do not respect the above boundaries. When a subject is studied
that lies very near such a boundary, knowledge from both adjacent disciplines is used to create a
complete understanding of the studied phenomenon. An example of such a subject is the pathway
of the signals from the receptors to the brain. This subject can be studied using ERG, dissection
of a retina or flicker detection experiments. These methods typically belong to different disciplines.
One could thus say that in the process of perception, physics, biology and psychology are all relevant,
respectively, for the characteristics of the light entering the eye, for the anatomy of the sense organ
and the neural pathways transmitting signals to the brain, and lastly for the interpretation of neural
signals. The respective disciplines overlap at various points: physics and biology both study the
spectral sensitivity of the photoreceptors as well as other measurable aspects of the human eye. In
addition, all three disciplines investigate the path followed by the signals from the photoreceptors to
the brain. In this thesis, the biological gap in the process of perception can be filled with knowledge
from both physics and psychology, because all the relevant knowledge is also used and researched in
these two disciplines. Moreover, since scientific disciplines tend to extend their research field, new
disciplines arise in the form of combinations of primary disciplines, such as biophysics, biochemistry
and neurobiological psychology. We feel that the aspects of biology that are relevant for this thesis
can be understood from the frameworks of biophysics and neurobiological psychology, which are
part of our disciplines.
The concepts concerning color vision that are used in physics and psychology are for a large part the
same. Although concepts like ’V-lambda curve’ and ’spectral energy distribution’ are mainly used
in physics, their contents is not different when used in the context of psychology. This also holds
for psychological concepts used in physics. Thus, although concepts are created in one discipline,
after their content has been determined they are adopted by other disciplines. This has led to
a rich and conflict-free terminology regarding color vision. One exception is ’color constancy’.
52
Although the content of this concept is the same in physics and psychology, the explanations
related to it have a different emphasis: whereas physical ’color constancy’ states that altering
spectral sensitivity compensates for small changes in illumination, psychological ’color constancy’
focuses on a higher-order cognitive process in which experience and learning are essential. Whenever
necessary, we always use the phrase ’physical color constancy’ when discussing spectral sensitivity
and ’psychological color constancy’ when discussing higher-order processes. Thus, regarding insights
and terminology, physics and psychology are mostly complementary. Also, none of these disciplines
alone is sufficient for explaining scotopic color vision.
5.2 Common ground
The common ground needs not to be created but can be discovered easily. Since the disciplinary
insights are merely complementary and do not contradict each other in the area in which they
overlap, our common ground theory results from the accumulation of all disciplinary insights,
resulting in a theory of scotopic color vision. The area of overlap consists of the path followed by
a signal entering the eye until it reaches the brain.
5.3 Desintegration
It has become clear to us that research on color constitutes a separate discipline where researchers
from a wide range of disciplines cooperate. Although the emphasis of the researchers will differ
depending on their academic background, they all investigate aspects of color vision using the same
assumptions and terminology without worrying about the boundaries of their respective disciplines.
The interdisciplinary character of color science is reflected in the literature: the important journals
in this field, Vision research, Visual Neuroscience and Ophthal. Physiol. Opt. include contributions
from physics, medial sciences and psychology. The quote on page 2 above, repeated here, describes
the intimate relation between physics and psychology when it comes to color research: ”Color is
neither physics nor psychology; it is both. Physics cannot predict the appearance of a given energy
distribution nor can psychology predict the color of a subtractive mixture. Both together should
be able to do both; this and similar aims should be the goal of the science of color.” (Evans, 1948).
We have, however, noticed our difference in academic background while working on this thesis. The
division of labor was quite clear: while physicist Rob studied the V-lambda curve and did all the
53
calculations, psychologist Emma investigated the pathways of the retina and the higher cognitive
processes. It was sometimes hard for us to understand the work of our partner since each lacked
some knowledge of the other’s discipline. Therefore, close teamwork was essential, particularly at
the early stages. It was very rewarding to see that towards the end, differences in knowledge began
to disappear, due to the fact that we both felt the necessity to understand every relevant aspect.
This meant that our partnership was no longer one between a psychologist and a physicist, but one
between two color researchers. The fact that this transition was possible also corroborates that the
field is highly interdisciplinary.
54
Chapter 6
Conclusion
This thesis is an investigation into the possibility of scotopic color vision. Our study has shown that
it is possible to see colors at intensities as low as −2 log phot. Td., depending on the color. Using
the spectral sensitivity of the receptors, we were able to give counterevidence against the claim
that, at these intensities, rods mediate vision. However, this evidence is not convincing enough
to reject the possibility of rod color vision altogether, due to the possibility that using a learning
effect, people are able to correctly ’guess’ the color of an object using past experience. In addition,
our research has given evidence that not all the cone activity is measured when ERG is used; it
is possible that small cone populations are active in situations where an ERG shows no activity.
Since determining the cone threshold is difficult and the boundary between scotopic and mesopic
vision remains blurry, more research to further investigate the possibility of scotopic color vision is
necessary.
55
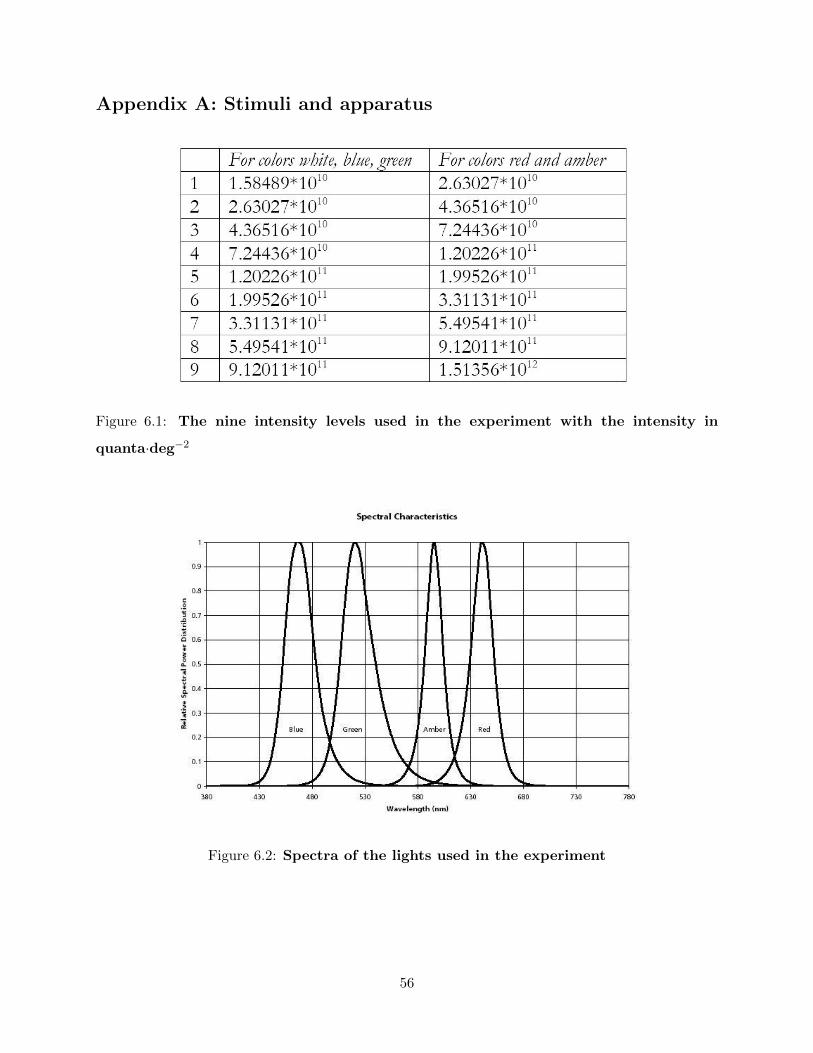
Appendix A: Stimuli and apparatus
Figure 6.1: The nine intensity levels used in the experiment with the intensity in
quanta·deg−2
Figure 6.2: Spectra of the lights used in the experiment
56
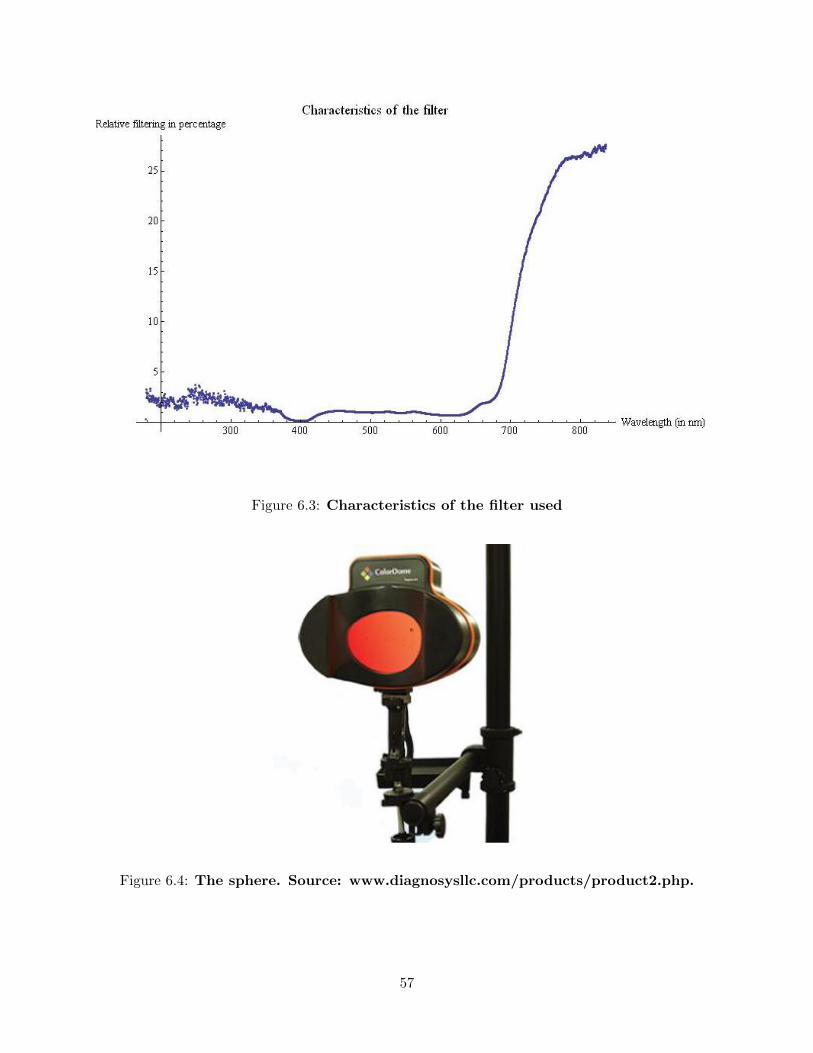
Figure 6.3: Characteristics of the filter used
Figure 6.4: The sphere. Source: www.diagnosysllc.com/products/product2.php.
57
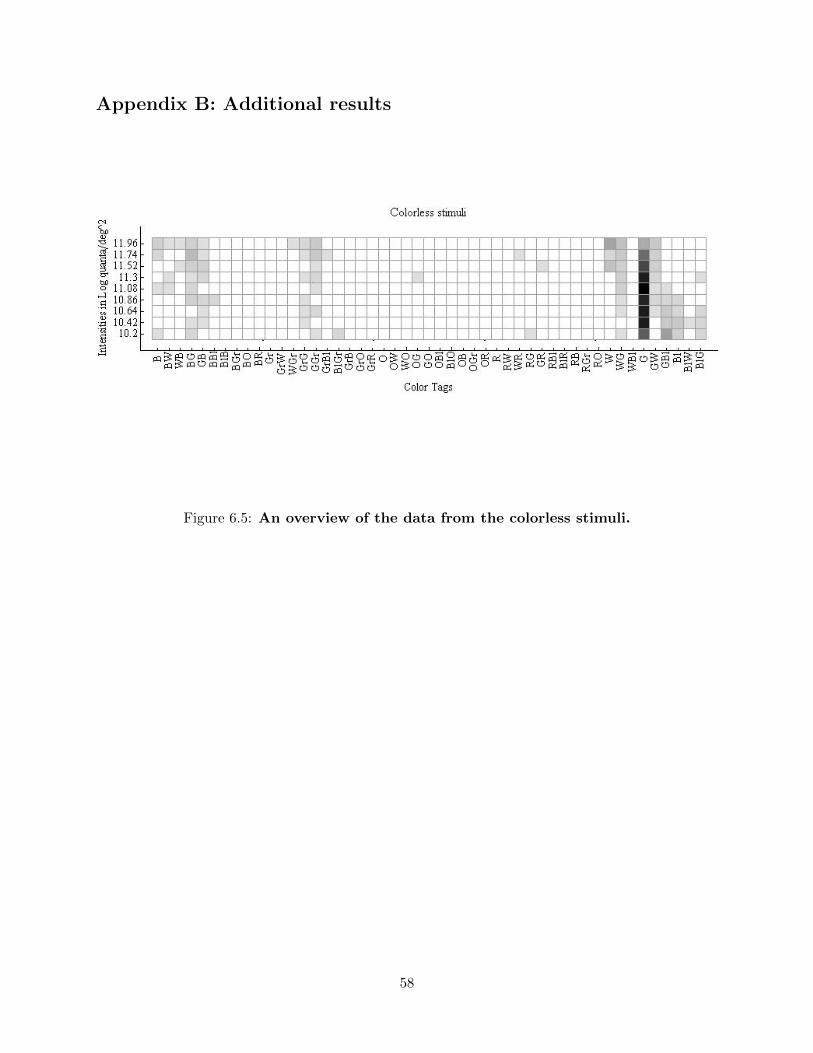
Appendix B: Additional results
Figure 6.5: An overview of the data from the colorless stimuli.
58
Appendix C: Glossary
Absolute cone threshold: the light intensity at which the cones become active.
Brightness: The effect the amount of light has on an observer. In colorless beams, brightness is
the only aspect of a beam that can change without changing from colorless to colored.
Color constancy: the effect that, in specific situations, if the same object is illuminated by two
different light sources, it will be perceived as having the same color under both illuminants.
Cones: the photoreceptor type that are active at high luminance and mediate color vision. There
are three different types of cones: S-system cones, M-system cones and L-system cones.
Dark-adaption: a period of darkness in which the rods desaturate. After a period of approxi-
mately 20 minutes, a person’s rods are completely desaturated and at their maximum sensitivity.
Detectability: A property of a stimulus; a stimulus is detectable if an observer is able to see the
stimulus.
ERG: Electroretinogram, a technique to determine the activity of photoreceptors by measuring
electrical signals at the cornea.
Fovea: the center of the retina with a very high acuity, containing small receptive fields and only
cones, no rods.
Illuminance: The total luminous flux on a particular area. It measures the intensity of incident
light per time unit. Usually illuminance is expressed in lux (or log lux).
Log lux: the unit of illuminance. It is derived from the SI unit cd · sr · m−2, where sr is star
radians.
Log quanta·deg−2: A unit that measures intensity. It expresses the photon flux through an angle
of 1 star radian.
Luminance: The intensity of a given light beam in a given direction per unit area. It is measured
59
in cd·m−2. If the spectral energy distribution E(λ) of the beam is known, one can calculate the
intensity of the beam using L =∫E(λ)V (λ)dλ, where V (λ) is the photopic V-lambda curve (if the
intensity is in the range of photopic vision) or by using L′
=∫E(λ)V
′(λ)dλ, where V
′(λ) is the
scotopic V-lambda curve.
Mesopic vision: the range of light intensities in which both rods and cones are active.
Metamers: different mixtures of wavelengths that elicit the same combination of responses in the
photoreceptors.
Periphery: the edges of the retina that contain larger receptive fields and both rods and cones.
Photon flux: The amount of photons through a particular area per unit time (usually measured
in star radians per second or m−2s−1).
Photopic vision: the range of light intensities in which only cones are active.
Photopic troland: a unit of intensity that corrects for the spectral sensitivity of the cones using
the photopic V -lambda curve and takes into account the area of the pupil. The formula for the
intensity of a light beam in scotopic troland is I = L′λ · p, whereL
′λ is the intensity in cd·m−2 and
p is the area of the pupil in mm2. This unit is sometimes abbreviated as phot. Td..
Retina: the light-sensitive neural tissue at the posterior part of the eye where light energy is
converted. into neural signals.
Rods: the photoreceptor type active at low light intensities.
Rod saturation: the process that the rods become saturated when light intensity increases.
Scotopic vision: the range of light intensities in which only rods are active.
Scotopic color vision: the effect that color perception is possible at light intensities where only
rods are active.
Scotopic troland: a unit of intensity that corrects for the spectral sensitivity of the rods using
60
the scotopic V -lambda curve and takes into account the area of the pupil. The formula for the
intensity of a light beam in photopic troland is I = L′λ · p, whereL
′λ is the intensity in cd·m−2 and
p is the area of the pupil in mm2. This unit is sometimes abbreviated as scot. Td..
Self-cancelation of flicker: the effect due to the 33.3 ms delay of the slow rod signal, that when
using a 15 Hz flicker, a phase delay of 180 degrees will result in interference of the slow and fast
rod signal, so that the flicker will be cancellated.
Spatial summation: the summation of neural signals over a spatial window.
Spectral energy distribution: A table, graph or function that expresses the intensity of the
beam at every wavelength.
Spectral sensitivity: the phenomenon that the human photoreceptors detect light with different
wavelengths with different efficiency. The spectral sensitivity of the rods and cones is different; both
are expressed using a function, the so-called V-lambda (for the cone sensitivity) and V’-lambda
curve (for the rod sensitivity). These curves are averages from a large amount of subjects. The ac-
tual spectral sensitivity of a particular observer may be very different from the standard observer’s
spectral sensitivity, not only when an observer is color blind.
Temporal integration: the summation of neural signals over a temporal window.
Univariance: the effect that an infinite set of different wavelengths-intensity combinations can
elicit exactly the same response, so that the output of a single photoreceptor cannot by itself give
information about the wavelengths stimulating it.
V-lambda curve (and V’-lambda curve): Functions that express the spectral sensitivity of
the human photoreceptors. The V-lambda curve expresses the sensitivity of the cones and the
V’-lambda curve the sensitivity of the rods. These functions are decreed by the CIE and are de-
rived from experimentations. The actual spectral sensitivity of a particular observer may be very
different from the spectral sensitivity of the standard observer, not only when an observer is color
blind.
61
Bibliography
Bijveld, M.M.C., van Genderen, M.M., Hoeben, F.P., Kappers, A.M.L, Riemslag, F.C.C. (2010).
Colour perception in scotopic stimuli. Perception, 39, ECVP Abstract Supplement, 84
Bloomfield, S.A., Dacheux, R.F. (2001). Rod Vision: Pathways and Processingin the Mammalian
Retina. Progress in Retinal and Eye Research, 20 (3), 351 - 384
Bruce, V., Green, P.R., Georgeson, M.A. (2003). Visual perception: physiology, psychology and
ecology (4th edition). New York: Psychology Press. Pages used: 3 - 74
Cao, D., Pokorny, J., Smith, V.C. (2005). Matching rod percepts with cone stimuli. Vision Research,
45, 2119 - 2128
De Vries, H.L. (1948). The Luminosity curve of the eye as determined by measurements with the
flickerphotometer. Physica, 14 (5), 319-333. Pages used: 333
Duncan, L., Hart, C.M. (2005). Clinical anatomy visual system. St. Louis: Elsevier (Googlebooks).
Pages used: 58 - 82
Evans, R. (1948) An introduction to Color. New York: John Wiley and Sons Inc. Pages used: 1,
61, 118, 132, 156-159, 198
Feynman, R., Leigthon R. and Sands, M. (1964), The Feynman Lectures on Physics. Reading
(Mass): Addison Wesley Publishing Company. Pages used: 32-8
Gegenfurtner, K.R., Sharpe, L.T. (2001). Color Vision: from genes to perception, 2nd edition.
Cambridge: Cambridge University Press. Pages used: 78, 142 - 219, 245 - 247
Grassmann, H.G. (1853). Theory of Compound Colors. Annalen der Physik und Chemie, 89, 69-84.
Translated: anonymous (1854), Philosophical Magazine, 4 (7), 254-264. Consulted via MacAdam,
D.L.(1970). Sources of Color Science. Cambridge (Mass): MIT press. Pages used: 54
62
Koenderink, J.J., Kappers, A.M.L (2002). Color space, 6th edition. College notes for the course
The structure of matter at Utrecht University.
Koenig, D., Hofer, H. (2011). The absolute threshold of cone vision. Journal of Vision, 11 (1):21, 1
- 24
Lin, T., Sun, C. (2008). Representation or context as a cognitive strategy in colour constancy?
Perception, 37, 1353 - 1367
Magnussen, S., Glad, A. (1975). Brightness and Darkness Enhancement During Flicker: Perceptual
correlates of Neuronal B- and D-systems in human vision. Experimental Brain Research, 22, 399-
413. Pages used: 402
Maxwell, J.C. (1872). On Color Vision. Proceedings of the Royal Institution of Great Britain, 6,
260-271. Consulted via MacAdam, D.L., (1970). Sources of Color Science. Cambridge (Mass):
MIT press. Pages used: 77
Shevell, S.K. (2003). The Science of Color. Oxford: Optical Society of America (Googlebooks).
Pages used: 49, 64, 90, 217 - 242.
Panga, J., Gao, F., Lem, J., Bramblett, D.E., Paul, D.L. et al. (2010). Direct rod input to cone
BCs and direct cone input to rod BCs challenge the traditional view of mammalian BC circuitry.
PNAS, 107 (1), 395 - 400
Pokorny, J., Lutze, M., Cao, D., Zele, A.J. (2006). The color of night: Surface color perception
under dim illuminations. Visual Neuroscience, 23, 525 - 530
Pokorny, J., Lutze, M., Cao, D., Zele, A.J. (2008). The color of night: Surface color categorization
by color defective observers under dim illuminations. Visual Neuroscience, 25, 475 - 480.
Schrodinger, E. (1926). Thresholds of Color Differences. Muller-Pouillets Lehrbuch der Physik,
2nd edition, Vol. 2, Part 1, Chapter 2. Consulted via MacAdam, D.L. (1970). Sources of Color
Science. Cambridge (Mass): MIT press. Pages used: 185
Schunn, C.D., Crowley, K., Okada, T. (1998). The Growth of Multidisciplinarity in the Cognitive
Science Society. Cognitive Science, 22 (1), 107 - 130
Sharpe, L.T., Stockman, A. (1999). Rod pathways: the importance of seeing nothing. Trends in
Neuroscience, 22, 497 - 504
63
Shin, J.C., Yaguchi, H., Shioiri, S. (2004). Change of Color Appearance in Photopic, Mesopic and
Scotopic Vision. Optical Review, 11 (4), 265 - 271
Solomon, S.G., Lennie, P. (2007). The machinery of color vision. Nature, 8, 276 - 286
Stabell, B., Stabell, U. (1993). Mechanisms of Chromatic Rod Vision in Scotopic Illumination.
Vision Research, 34 (8), 1019 - 1027
Stabell, B., Stabell, U. (1996). Peripheral Colour Vision: Effects of Rod Intrusion at Different
Eccentricities. Vision Research, 36 (21), 3407 - 3414
Stockman, A., Sharpe, L.T. (2006). Into the twilight zone: the complexities of mesopic vision and
luminous efficiency. Ophthal. Physiol. Opt., 26, 225 - 239
Stockman, A., Sharpe, L.T., Ruther, K., Nordby, K. (1995). Two signals in the human rod visual
system: a model based on electrophysiological data. Visual Neuroscience, 12, 951 - 970
Van der Horst, G.J.C., Muis, W. (1969). Hue Shift and Brightness Enhancement of Flickering Light.
Vision Research, 9 (8), 953-963. Pages used: 953
Wagner, G., Boynton R.M. (1972) Comparison of four methods of heterochromatic photometry.
Journal of the optical Society of America, 62 (12), 1508-1515. Consulted via Pease. P.L. (1982).
Color and Color Vision: Selected Reprints, Stony Brook (NY): American Association of Physics
Teachers. Pages used: 1508
Wolfe, J.M., Kluender, K.R., Levi, D.M. (2009). Sensation and Perception (2nd edition). Sunder-
land: Sinauer Associates. Pages used: 28 - 78, 104 - 132
Wu, S., Burns, S.A., Reeves, A. and Elsner, A.E. (1996). Flicker Brightness Enhancement and
Visual Nonlinearity. Vision Research, 36 (11), 1573-1583. Pages used: 1573
Wyszecki, G., Stiles, W.S. (2000). Color Science: Concepts and Methods, Quantitative Data and
Formulae (2nd edition). New York: Wiley-Interscience. Pages used: 102 - 108, 519 - 557, 183 -
184
Zeki, S. (1993). A vision of the brain. Oxford: Blackwell Scientific Publications
Zele, A.J., Cao, D., Pokorny, J. (2008). Rod-cone interactions and the temporal impulse response
of the cone pathway. Vision Research, 48, 2593 - 2598
64