Embed Size (px)
Citation preview
IEEE Transactions on Electrical Insulation Vol. 23 No. 4, August 1888 715
On the Relation Between Current Pulses and Discharges
M. 1. Qureshi
Electrical Engineering Department, King Saud University, Riyadh, Saudi Arabia
and W. G. Chadband Electrical Engineering Department, University of Salford, Salford, UK
ABSTRACT
This paper reports the results of a study of the current fluctua- tions which occur when a point-plane electrode system is highly stressed by a de voltage. The current pulses can be used as a trigger to initiate the capture of shadowgraph pictures. Polar- ity effects and the magnitude of the charge associated with the current pulses are both considered. It is found that shadow- graph pictures can invariably be produced when the pulse is sufficiently large to trigger the system, suggesting that the cur- rent pulses are associated with the propagation of partial dis- charges in the liquid. The form of the shadow pictures recorded for de voltage when compared with those produced by short pulsed voltage suggests that the former are influenced by local space charge. The effect of the point radius on the discharge initiation and propagation, and on the shape of the recorded current pulse is presented.
INTRODUCTION electrical breakdown of the system, unless precautions are taken. In addition to an intensive cleaning of the system and filtration of the liquid entering the test cell, the usual preparatory procedure is to stress-condition the system. The voltage is held at a constant value for a sufficiently long period for the pulse activity to sub- side, thereby allowing the voltage to be raised a little
URRENT instabilities in the form of randomly occur- ring pulses are a problem encountered by all who
endeavor to produce current-voltage characteristics for a liquid insulant. These pulses signal the impending
C
0018-0367/88/0800-715$1.00 @ 1088 IEEE

718
120
100
Qureshi and Chadband: On the relation between current pulses and discharges
- 2.0-
( a ) -
and the whole process to be repeated. This technique has allowed current measurements a t high values of elec- tric stress. Figure 1 illustrates a typical plot obtained in this manner using a plane-plane electrode configura- tion in hexane. The original onset of the pulse activ- ity is indicated on the graph. A similar characteristic is obtained if the plane cathode is replaced by a point cathode (shown also in Figure 1). Although the current magnitudes are greater with a point cathode, the onset of the current pulses is seen to occur a t the same relative part of the curve.
THE ORIGIN OF THE CURRENT PULSES
OUSE (1957) [l] attributed the conditioning effect H to changes on the electrode surface. By inference the origin of the current pulses was therefore also as- sociated with the electrode surface. Sletten (1959) [2] discussed the influence of dissolved air on the condi- tioning process. For liquids with a high air content
the conditioned state was easily and rapidly achieved. With degased liquid violent fluctuations of the current were observed and these showed little tendency to de- crease with time. Huq and Tropper (1964) [3] employed noise measurement techniques to study the random cur- rent fluctuations. They noted that air (oxygen) affected their results. Megahed and Tropper (1971) [4] observed a pressure dependence of the current pulses and deduced the involvement of a gas phase.
Singh et al. (1972) [5], in a comprehensive series of experiments, related the current pulses observed in a point-plane electrode system to a range of other phe- nomena, including light emission and bubble produc- tion. These authors implicated an electrical discharge as a cause of the current fluctuations. Kao and Rashwan (1974) [6] found some correlation between pulses and flashes of light and proposed that the light flashes were related to discharges within bubbles. Birlasekran and Darveniza (1976) [7] however discounted this suggestion and instead proposed micro-discharges a t the electrode as the source of the light. Many authors have seen par- ticle movement as the source of both current pulses and of pulses of light. Buffam and Brignell (1979) [8] re- ported that particles were poor and infrequent carriers of charge. They found no evidence of any relationship
IEEE !l’ransactions on Electrical Insulation Vol. 23 No. 4 , August 1988
Pulse Seper- Comparison & ation C k t . -3 ulse shaping
L U h 3 L -
400M R DC-Power Supply t 30kV
Time Delay Genera to r
U I
Camera p-- - -0-
f U i A L n
H . V . Source r
Trig. Pulse Generator
0 h
717
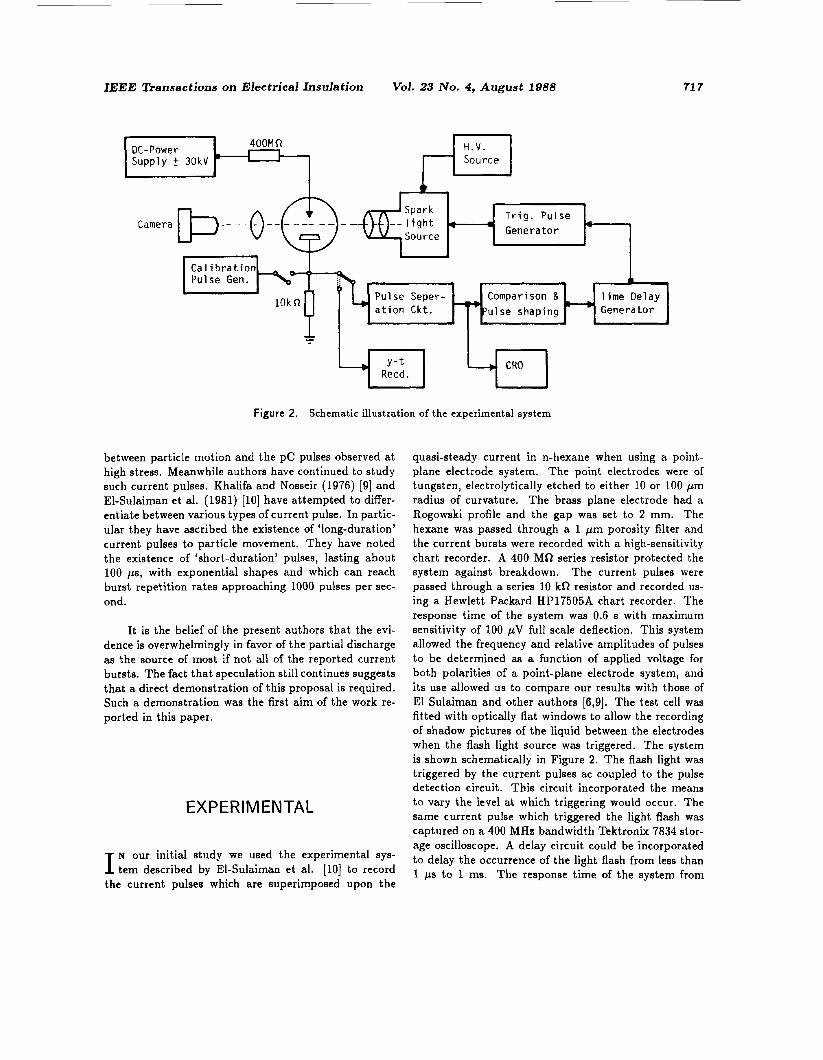
Figure 2. Schematic illustration of the experimental system
between particle motion and the pC pulses observed a t high stress. Meanwhile authors have continued to study such current pulses. Khalifa and Nosseir (1976) [9] and El-Sulaiman et al. (1981) [lo] have attempted to differ- entiate between various types of current pulse. In partic- ular they have ascribed the existence of ‘long-duration’ current pulses to particle movement. They have noted the existence of ‘short-duration’ pulses, lasting about 100 ps, with exponential shapes and which can reach burst repetition rates approaching 1000 pulses per sec- ond.
It is the belief of the present authors that the evi- dence is overwhelmingly in favor of the partial discharge as the source of most if not all of the reported current bursts. The fact that speculation still continues suggests that a direct demonstration of this proposal is required. Such a demonstration was the first aim of the work re- ported in this paper.
EX P E R I M EN TAL
N our initial study we used the experimental sys- I tem described by El-Sulaiman et al. [lo] to record the current pulses which are superimposed upon the
quasi-steady current in n-hexane when using a point- plane electrode system. The point electrodes were of tungsten, electrolytically etched to either 10 or 100 pm radius of curvature. The brass plane electrode had a Rogowski profile and the gap waa set to 2 mm. The hexane was passed through a 1 pm porosity filter and the current bursts were recorded with a high-sensitivity chart recorder. A 400 MR series resistor protected the system against breakdown. The current pulses were passed through a series 10 kR resistor and recorded us- ing a Hewlett Packard HP17505A chart recorder. The response time of the system was 0.6 s with maximum sensitivity of 100 pV full scale deflection. This system allowed the frequency and relative amplitudes of pulses to be determined as a function of applied voltage for both polarities of a point-plane electrode system, and its use allowed us to compare our results with those of El Sulaiman and other authors [6,9]. The test cell was fitted with optically flat windows to allow the recording of shadow pictures of the liquid between the electrodes when the flash light source was triggered. The system is shown schematically in Figure 2. The flash light was triggered by the current pulses ac coupled to the pulse detection circuit. This circuit incorporated the means to vary the level at which triggering would occur. The same current pulse which triggered the light flash was captured on a 400 MHz bandwidth Tektronix 7834 stor- age oscilloscope. A delay circuit could be incorporated to delay the occurrence of the light flash from less than 1 ps to 1 ms. The response time of the system from
718 Qureshi and Chadband: On the relation between current pulses and discharges
pulse detection to peak flash illumination was 1.8 ps. Table 2. Positive point
No. of pulses recorded.
Charge
Magnitude 12 16 20 26 kV RESULTS OBTAINED
NTEGRATION of the area under the current-time trace I gives a charge value associated with the pulse. We expect the charge value derived for the traces recorded on the fast oscilloscope to represent the true values of the charge involved. The chart records are dominated by the slow response of the chart recorder. We have found from a comprehensive study of pulses simulta- neously recorded by both systems that charge values derived from the chart recorder are consistently high by a factor of about 1000. This provides the numeri- cal factor necessary for comparing both our, and other authors [6,9,10] chart-recorder readings with fast oscil- loscope readings:
Table 1. Negative point
No. of pulses recorded
Charge
-Magnitude 12 16 20 26 kV
1 to 10 1 7 59 57 0
10 t o 50 5 24 3a 60
50 t o 500 0 5 6 1 1
over 500 1 2 1 7
Tables 1 and 2 summarize the corrected results pro- duced by the chart recorder indicating the relative fre- quency and amplitude of the current pulses from a neg- ative and from a positive point in n- hexane. For neg- ative points both the number and the magnitudes of the current bursts increase with applied voltage. This is true for all burst magnitudes, but particularly so in the middle range. For positive points there is no obvi- ous relationship between the number of current bursts and applied voltage, once a threshold voltage has been achieved. In the test series illustrated here the num- ber of bursts decreased with increasing voltage with a
1 to 10 59 19 18* * 10 to 50 a 9 o * * 50 t o 500 1 3 1 * *
0 0 1 * * over 500
* = Breakdown a t 20kV a f t e r 300s
point anode. However for both polarities the number of large magnitude bursts increased with increasing volt- age. Breakdown of a positive point system occurs at a lower voltage than for the point cathode case.
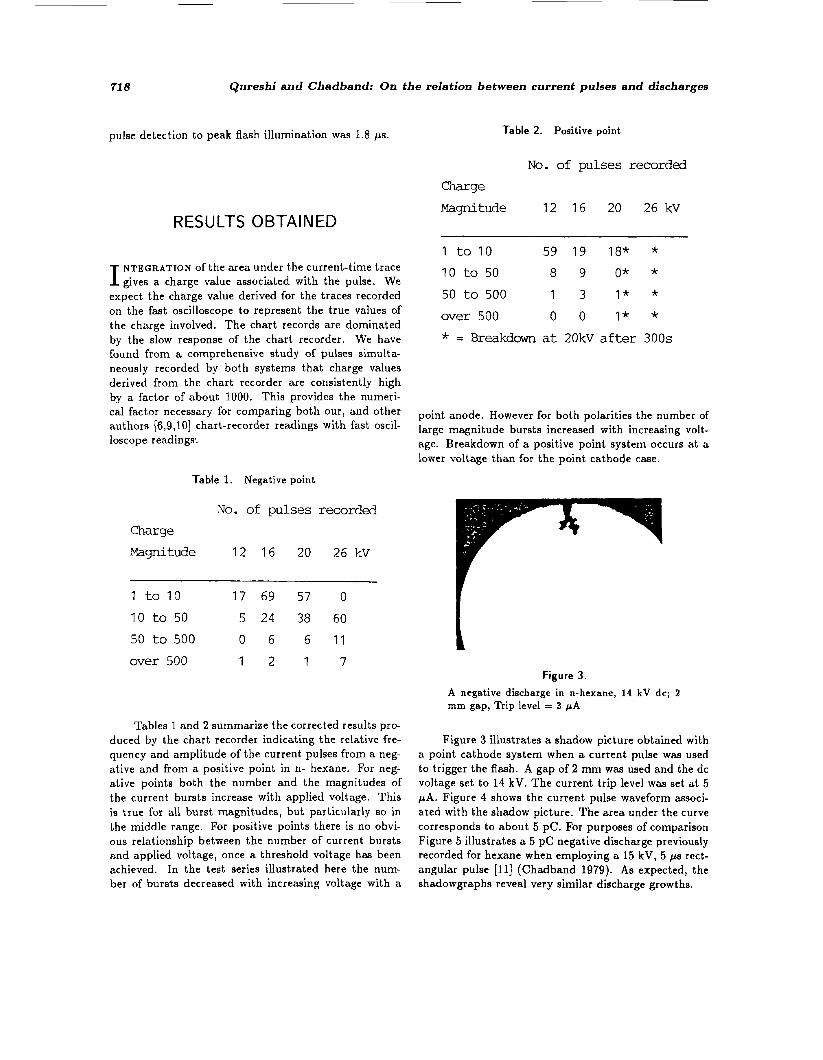
Figure 3. A negative discharge in n-hexane, 14 kV dc; 2 mm gap, Trip level = 3 pA
Figure 3 illustrates a shadow picture obtained with a point cathode system when a current pulse was used to trigger the flash. A gap of 2 mm was used and the dc voltage set to 14 kV. The current trip level was set at 5 p A . Figure 4 shows the current pulse waveform associ- ated with the shadow picture. The area under the curve corresponds to about 5 pC. For purposes of comparison Figure 5 illustrates a 5 pC negative discharge previously recorded for hexane when employing a 15 kV, 5 pi rect- angular pulse [ll] (Chadband 1979). As expected, the shadowgraphs reveal very similar discharge growths.

IEEE nansactions on Electrical Insulation Vol. 23 No. 4, August 1088 719
1 2 3 4 5 1 1 s
Figure 4. T h e current pulse which triggered the photo- graph shown as Figure 3. Area under curve = 5 pC, Point radius 100 pm
Figure 5. A 5 p C negative discharge picture obtained using a 15 kV, 5 ps voltage pulse. gap = 2 mm
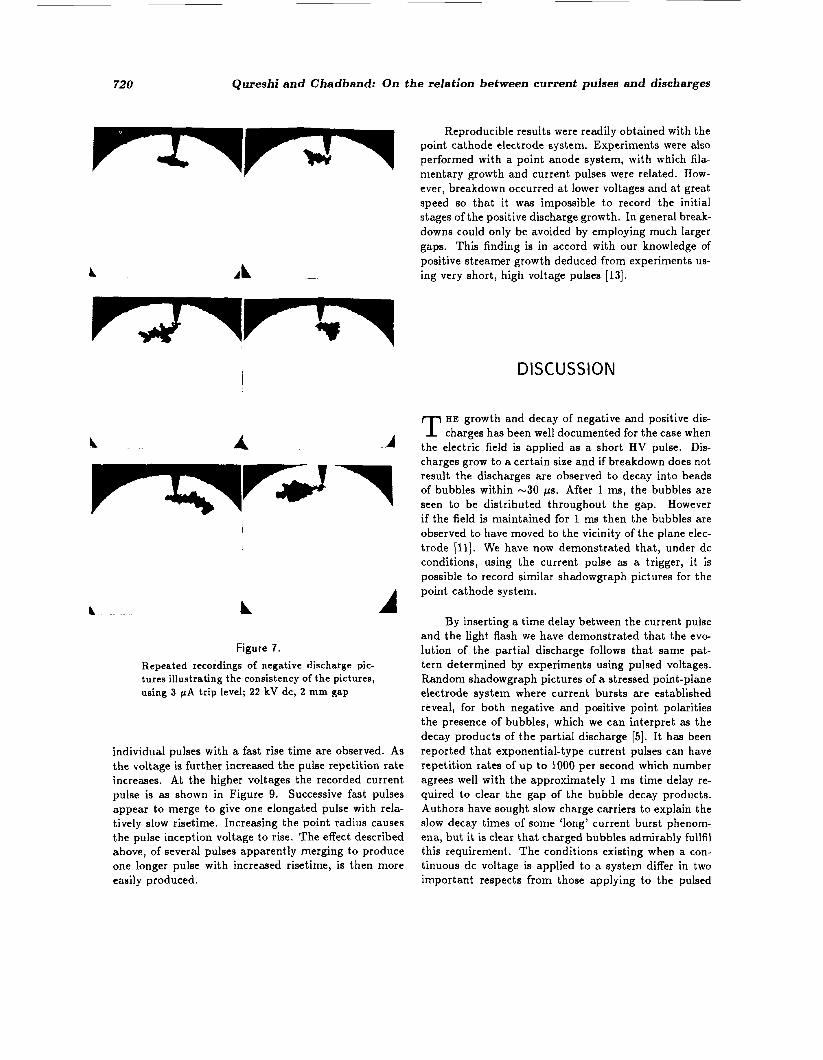
If the trip level is increased then only larger cur- rent pulses will trigger pictures and larger shadow pic- tures are to be expected. Figures S(a-c) illustrate the effect of progressively increasing the trip level. Average propagation velocities of about 1 km/s are observed, as expected, with 25 kV applied voltage. Figure 7(a- f ) shows several shots recorded a t 22 kV with a 3 pA trip level. The general variation in results is illustrated. Of particular interest in these results was the fact that growth does not normally follow the axis of the system, but rather acts as though its axial growth is blocked in some way. This behavior is contrary to that observed with pulsed voltage application [ll],
By adding a time delay between the arrival of the current trigger pulse and the firing of the light flash it
Figure 6. Shadow pictures obtained using varying trip lev- els, 2 mm gap 22 kV dc. (a) 3, (b) 6 and (c) 12 P A
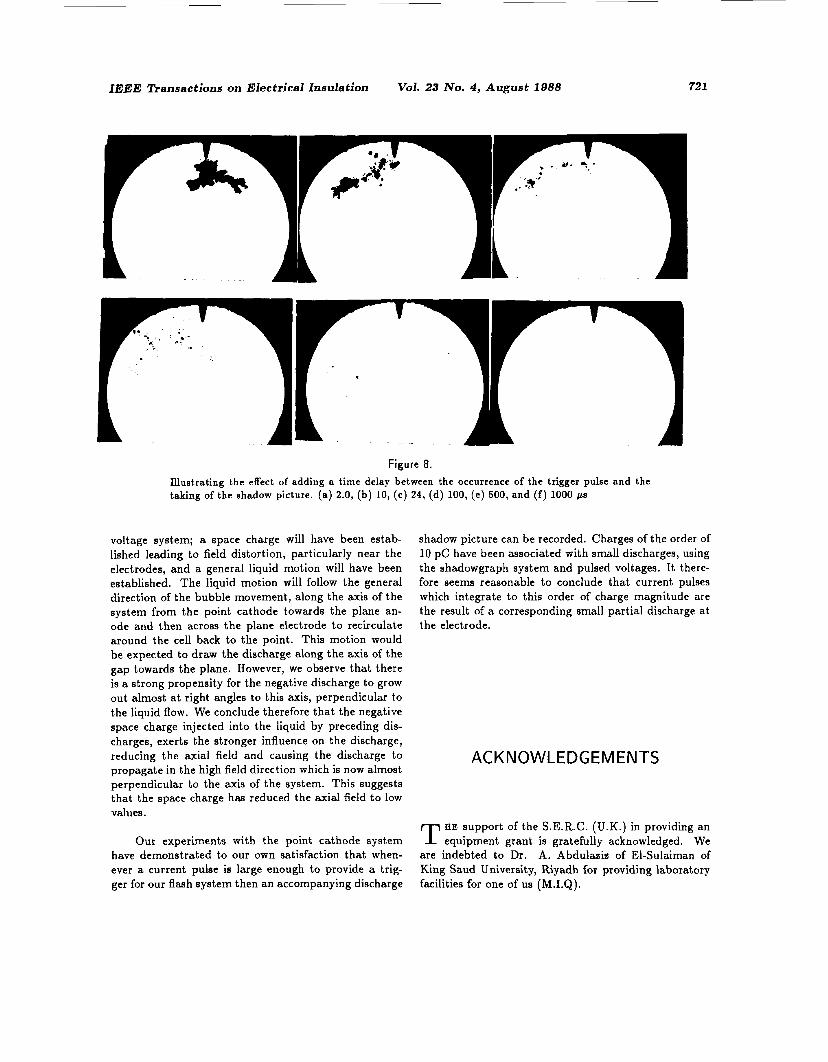
has proved possible to see the decay of the negative dis- charge into a cluster of bubbles. This effect is illustrated by the sequence of pictures shown in Figure 8. The ob- served negative discharge decay for dc appears to be similar to the negative discharge decay recorded using short HV rectangular pulses [ll]. The onset of disinte- gration becomes apparent for hexane after about 10 ps. Within about 100 ps only clusters of bubbles remain, and these mostly clear the gap in times of - 1 ms. It is a feature of the sequence of experiments that bubbles from the decay of previous discharges may be recorded by the system. These 'old' bubbles did not serve as a focus to attract the subsequent discharges - rather the reverse.
The point radius has an effect on the form of the current pulse. With point radii not exceeding 10 pm and applied voltages near the pulse inception voltage,
720 Qureshi and Chadband: On the relation between current pulses and discharges
Reproducible results were readily obtained with the point cathode electrode system. Experiments were also performed with a point anode system, with which fila- mentary growth and current pulses were related. How-
L
ever, breakdown occurred at lower voltages and at great speed so that it was impossible to record the initial stages of the positive discharge growth. In general break- downs could only be avoided by employing much larger gaps. This finding is in accord with our knowledge of positive streamer growth deduced from experiments us- ing very short, high voltage pulses [13].
DISCUSSION i
A HE growth and decay of negative and positive dis- T charges has been well documented for the case when
the electric field is applied as a short HV pulse. Dis- A charges grow to a certain size and if breakdown does not result the discharges are observed to decay into beads of bubbles within -30 pi. After 1 ms, the bubbles are seen to be distributed throughout the gap. However if the field is maintained for 1 ms then the bubbles are
A L A Figure 7.
Repeated recordings of negative discharge pic- tures illustrating the consistency of the pictures, using 3 pA trip level; 22 kV dc, 2 mm gap
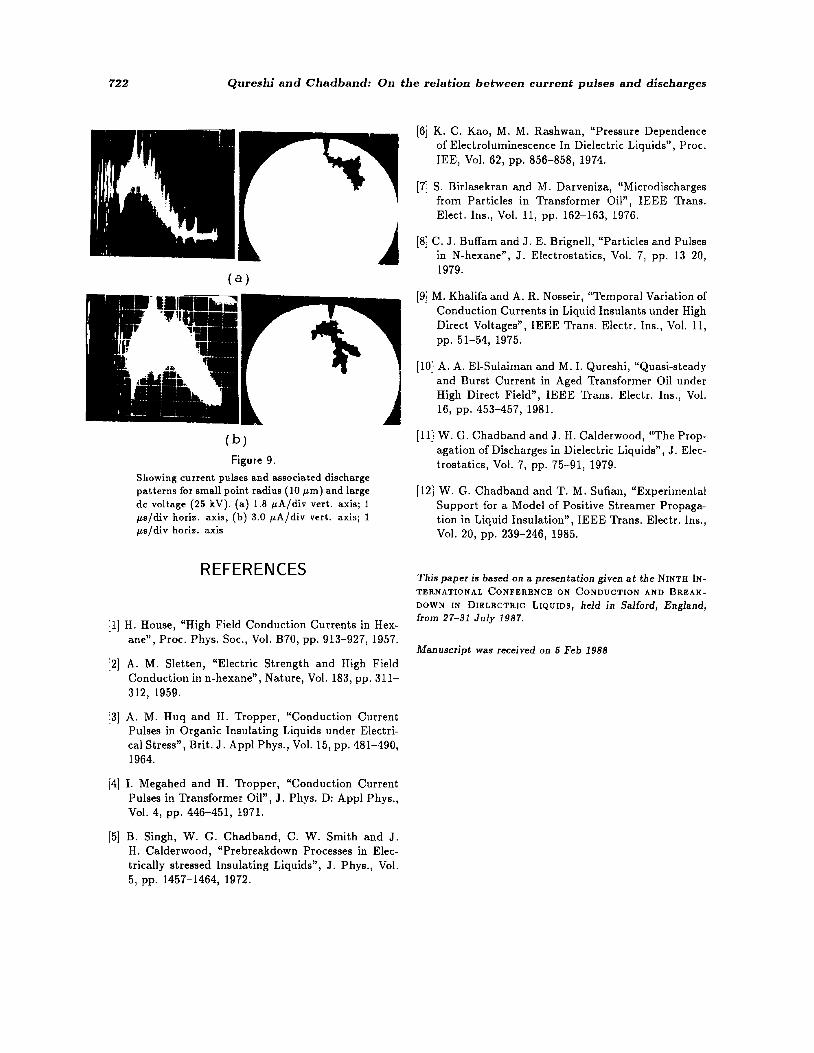
individual pulses with a fast rise time are observed. As the voltage is further increased the pulse repetition rate increases. At the higher voltages the recorded current pulse is as shown in Figure 9. Successive fast pulses appear to merge to give one elongated pulse with rela- tively slow risetime. Increasing the point radius causes the pulse inception voltage to rise. The effect described above, of several pulses apparently merging to produce one longer pulse with increased risetime, is then more easily produced.
observed to have moved to the vicinity of the plane elec- trode [ll]. We have now demonstrated that, under dc conditions, using the current pulse as a trigger, it is possible to record similar shadowgraph pictures for the point cathode system.
By inserting a time delay between the current pulse and the light flash we have demonstrated that the evo- lution of the partial discharge follows that same pat- tern determined by experiments using pulsed voltages. Random shadowgraph pictures of a stressed point-plane electrode system where current bursts are established reveal, for both negative and positive point polarities the presence of bubbles, which we can interpret as the decay products of the partial discharge [5] . It has been reported that exponential-type current pulses can have repetition rates of up to 1000 per second which number agrees well with the approximately 1 ms time delay re- quired to clear the gap of the bubble decay products. Authors have sought slow charge carriers to explain the slow decay times of some ‘long’ current burst phenom- ena, but it is clear that charged bubbles admirably fullfil this requirement. The conditions existing when a con- tinuous dc voltage is applied to a system differ in two important respects from those applying to the pulsed
IEEE lkansactions on Electrical Insulation Vol. 23 No. 4 , August 1088 721
Figure 8. Illustrating the effect of adding a time delay between the occurrence of the trigger pulse and the taking of the shadow picture. (a) 2.0, (b) 10, (c) 24, (d) 100, (e) 500, and (f) 1000 ps
voltage system; a space charge will have been estab- lished leading to field distortion, particularly near the electrodes, and a general liquid motion will have been established. The liquid motion will follow the general direction of the bubble movement, along the axis of the system from the point cathode towards the plane an- ode and then across the plane electrode to recirculate around the cell back to the point. This motion would be expected to draw the discharge along the axis of the gap towards the plane. However, we observe that there is a strong propensity for the negative discharge to grow out almost a t right angles to this axis, perpendicular to the liquid flow. We conclude therefore that the negative space charge injected into the liquid by preceding dis- charges, exerts the stronger influence on the discharge, reducing the axial field and causing the discharge to propagate in the high field direction which is now almost perpendicular to the axis of the system. This suggests that the space charge has reduced the axial field to low values.
Our experiments with the point cathode system have demonstrated to our own satisfaction that when- ever a current pulse is large enough to provide a trig- ger for our flash system then an accompanying discharge
shadow picture can be recorded. Charges of the order of 10 pC have been associated with small discharges, using the shadowgraph system and pulsed voltages. It there- fore seems reasonable to conclude that current pulses which integrate to this order of charge magnitude are the result of a corresponding small partial discharge at the electrode.
ACKNOWLEDGEMENTS
HE support of the S.E.R.C. (U.K.) in providing an T equipment grant is gratefully acknowledged. We are indebted to Dr. A. Abdulazis of El-Sulaiman of King Saud University, Riyadh for providing laboratory facilities for one of us (M.1.Q).
722 Qureshi and Chadband: On the relation between current pulses and discharges
(4 Figure 9.
Showing current pulses and associated discharge patterns for small point radius (10 pm) and large dc voltage (25 kV). (a) 1.8 pA/div vert. axis; 1 ps/div horiz. axis, (b) 3.0 pA/div vert. axis; 1 ps f div horis. axis
REFERENCES
H. House, “High Field Conduction Currents in Hex- ane”, Proc. Phys. Soc., Vol. B70, pp. 913-927, 1957.
A. M. Sletten, “Electric Strength and High Field Conduction in n-hexane”, Nature, Vol. 183, pp. 311- 312, 1959.
A. M. Huq and H. Tropper, “Conduction Current Pulses in Organic Insulating Liquids under Electri- cal Stress”, Brit. J . Appl Phys., Vol. 15, pp. 481-490, 1964.
I. Megahed and H. Tropper, “Conduction Current Pulses in Transformer Oil”, J . Phys. D: Appl Phys., Vol. 4, pp. 446-451, 1971.
B. Singh, W. G . Chadband, C. W. Smith and J . H. Calderwood, “Prebreakdown Processes in Elec- trically stressed Insulating Liquids”, J. Phys., Vol. 5, pp. 1457-1464, 1972.
[6] K. C. Kao, M. M. Rashwan, “Pressure Dependence of Electroluminescence In Dielectric Liquids”, Proc. IEE, Vol. 62, pp. 856-858, 1974.
[7] S. Birlasekran and M. Darveniza, “Microdischarges from Particles in Transformer Oil”, IEEE Trans. Elect. Ins., Vol. 11, pp. 162-163, 1976.
[8] C. J . Buffam and J. E. Brignell, “Particles and Pulses in N-hexane”, J . Electrostatics, Vol. 7, pp. 13-20, 1979.
[9] M. Khalifa and A. R. Nosseir, “Temporal Variation of Conduction Currents in Liquid Insulants under High Direct Voltages”, IEEE Trans. Electr. Ins., Vol. 11, pp. 51-54, 1975.
[lo] A. A. El-Sulaiman and M. I. Qureshi, “Quasi-steady and Burst Current in Aged Transformer Oil under High Direct Field”, IEEE Trans. Electr. Ins., Vol. 16, pp. 453-457, 1981.
[ll] W. G. Chadband and J . H. Calderwood, “The Prop- agation of Discharges in Dielectric Liquids”, J. Elec- trostatics, Vol. 7, pp. 75-91, 1979.
[12] W. G. Chadband and T. M. Sufian, “Experimental Support for a Model of Positive Streamer Propaga- tion in Liquid Insulation”, IEEE Trans. Electr. Ins., Vol. 20, pp. 239-246, 1985.
This paper is based on a presentation given at the NINTH IN-
D O W N IN DIELECTRIC LIQUIDS, held in Salford, England, from 27-31 July 1987.
TERNATIONAL C O N F E R E N C E ON C O N D U C T I O N A N D BREAK-
Manuscript was received on 5 Feb 1988