Embed Size (px)
Citation preview

Det Kgl . Danske Videnskabernes Selskab .
Mathematisk-fysiske Meddelelser XIV, 12 .
ON THE SELECTIVE CAPTURE
OF SLOW NEUTRONS
RY
O. R. FRISC H
KØBENHAVNLEVIN & MUNKSGAARD
EJNAR MUNKSGAAR D
1937
Printed in Denmark .
Bianco Lunos Bogtrykkeri A/S .

We deal in this paper with the selective capture of slow
neutrons (1, 2) in arsenic, iodine, and gold (3) . On
capturing a neutron, the nuclei of these elements are trans -
formed into unstable ones, which revert to stable nucle i
again by the emission of a beta-particle :
As + ôn = 33As 3sAs -> 31Se half-value period 27 hours
î23J+
ô n =153J
153J
1 54'
„ 25 min .
1 79Au ; ôn =' 79Au INAuL 1 sôHg „
2 .8 day s
These elements were selected because they show th e
phenomenon of selective capture in a marked degree ,
because only one stable isotope is known in each case ,
and because the corresponding unstable isotopes have
periods which are convenient for measurement .
Samples of the substance under investigation were ex-
posed under various conditions to the neutrons emerging
from a block of paraffin wax, containing a source of fast
neutrons (Ra + Be or radon + Be) . The samples wer e
then transferred to a GEIGER-MULLER counter, and the
activity shown by the counter was taken as a measure o f
the number of neutrons captured within the sample .
The observations have been interpreted on the assump-
tion (4, 5) that the capturing nucleus together with th e
incoming neutron forms a "compound nucleus" with wel l1*

4
Nr . 12 . O. R . FßIäCF :
defined energy levels whose width is small compared wit h
their separation, in the energy region concerned. In the
first instance, however, we shall only assume one suc h
level in each case, and the evidence for and against this
assumption will be discussed .
-~ E = energy of neuf ons
Fig . 1 .
The conditions in the one level case are shown schema-
tically in fig. 1 . The full line indicates the dependance of
the capture cross-section a on the kinetic energy E of th e
incoming neutrons ; this dependence (5) is given by the
formula
a
E
ER = Resonance energy
` E
R
ER)2V/ E / aR = Resonance cross-section \
d-Biz
2Bß = Half-value width of re-
sonance line .
In all cases so far investigated the "resonance cross-section "
a R is much larger than the corresponding„value of e fo r
neutrons of thermal energy; still the thermal neutrons
contribute considerably to the activation of the sample, o n
_ihermal neutrons
resonance fin e
I8c

On the Selective Capture of Slow Neutrons .
5
account of their large number (the estimated energy distri-
bution of the neutrons emerging from a paraffin block (6, 7 )
is indicated by the dotted line) . A screen of cadmium wa s
therefore used to remove the thermal neutrons in the usua l
way; the main part of the activity is then due to neutron s
with energies near ER. In what follows, these neutrons wil l
simply be called "resonance neutrons" .
In order to determine the resonance energy ER , the
absorption of the resonance neutrons in boron was com-
pared with the absorption of thermal neutrons in boron (8) .
Theoretical arguments have been given for the assumptio n
that the absorbing cross-section of boron is inversely pro -
portional to the velocity of the neutrons (8, 9) . This " 1 -law"v
should hold for neutron velocities up to at least 10' cm ./sec.
(energies of 50 eV.) when the capture cross-section
becomes of the order of ordinary nuclear cross-sections .
Experimental checks are in qualitative agreement with thi s
assumption (10, 11) . In this paper the validity of the 1 -lawv
will be taken as established . We have made no attempt t o
verify it .
The resonance cross-section aR was determined by
measuring the absorption of the resonance neutrons in th e
element under investigation . Absorption curves under
various geometrical conditions have been obtained an d
compared with theory .
Two different ways of obtaining an estimate of th e
width of the resonance level are discussed in the case o f
gold. An attempt has been made to discover a broadening
of the absorption line on increasing the temperature of the
absorber (thermal Doppler-effect) but no conclusive result
has been obtained so far .

6
Nr . 12 . O. R . FRISCH :
1 . Determination of Resonance Energies .
Experimental procedure . Theneutronsource(500 mg .
radium in the form of RaSO 4 , mixed with beryllium) was
placed at the centre of a cube of paraffin wax of side 13 ems .
To investigate the resonance energy of gold, four gold
discs (15 mms . diameter, 0 .1 mm. thick) were placed 2 ems .
below the lower face of the cube and arranged at the cor-
ners of a square of 3 ems . sides, situated symmetricall y
with respect to the cube. Absorbers of 3 ems . in diameter of
amorphous boron (pressed without binding material) wer e
placed on three of the gold plates, the absorber thicknesses
being 0 .10, 0 .20, and 0 .40 gr ./cm. 2 , respectively . On com-
paring the activities induced in the four gold plates, a n
absorption curve, in boron, of the resonance neutrons o f
gold is obtained. A shield of 0 .4 gr ./cm .' cadmium was
placed immediately below the paraffin to cut off the therma l
neutrons, and a double shield (0 .4 gr ./cm . 2 cadmium
+ 0 .5 gr ./cm . 2 gold) against stray neutrons was placed
under the gold. After two days exposure the activity of th e
gold plates was measured by means of GEIGER-MÜLLE R
counters having a 10 mms . diameter window of mic a
(0 .0065 gm./cm . 2) . In order to reduce the time necessary
for a sufficiently high count three counters were use d
simultaneously ; small differences in the counting rates o f
the counters were eliminated by measuring the activit y
of every disc on each of the three counters and taking th e
average .
Information on the behaviour of neutrons filtered
through about 0 .15 gr ./cm . 2 gold was obtained by measuring
the activity both of the lower and the upper sides of th e
gold plates ; since the electrons emitted by gold are very
s
On the Selective Capture of Slow Neutrons .
7
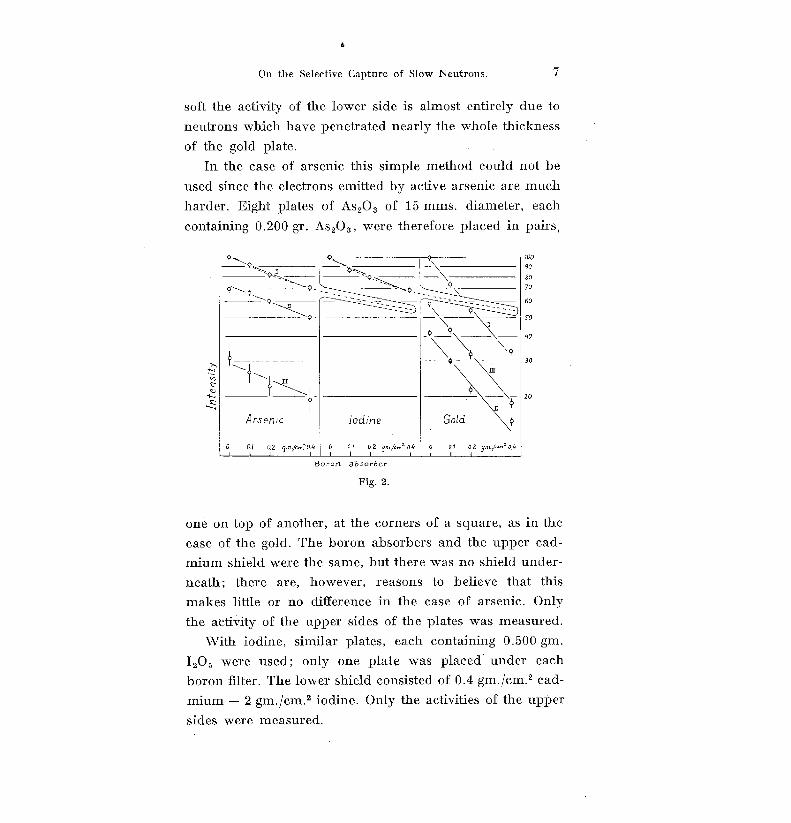
soft the activity of the lower side is almost entirely due t o
neutrons which have penetrated nearly the whole thicknes s
of the gold plate .
In the case of arsenic this simple method could not b e
used since the electrons emitted by active arsenic are muc h
harder. Eight plates of As 2 O 3 of 15 mms . diameter, each
containing 0 .200 gr . As 203 , were therefore placed in pairs ,
Y\4 ~\ 41 v~4`I
ç\ ¢
o_ ;
-~_ _
\
` Q\
„0 -
4
¢\~\
A
4p 4
~I
~
\
IQ`I\
-
Arsenic Iodine Gol d
0
0.1
0.2
om~m~0.4 0
0J
0 .2
gn,/ ~04 0
0.1
02 9m~u~' 0p
I
1
I ~
1
I
I 1
l
Boron absorbe r
Fig. 2 .
one on top of another, at the corners of a square, as in th e
case of the gold . The boron absorbers and the upper cad-
mium shield were the same, but there was no shield under-
neath ; there are, however, reasons to believe that thi s
makes little or no difference in the case of arsenic . Only
the activity of the upper sides of the plates was measured .
With iodine, similar plates, each containing 0 .500 gm .
I 205 were used; only one plate was placed . under each
boron filter . The lower shield consisted of 0 .4 gm ./cm . 2 cad -
mium + 2 gm./cm . 2 iodine . Only the activities of the upper
sides were measured .
100
9 0
80
7 0
6 0
50
4 0
3 0
20
8
Nr . 12. O. R . Fmsca :
Results of 'measurements . The results are sum-
marized in fig . 2 where the activities are plotted on a
logarithmic scale against the thickness of the boron absorber ;
the units are such that the intensity without any absorber is
always 100 . (I = unfiltered neutrons, II = filtered, III = I-II) .
In the case of gold, the absorption in boron is seen to
be fairly well exponential, and the ratio of the activities
of the upper and lower sides does not change appreciabl y
with increasing boron thickness . This supports the view
that most of the activity in gold is produced by one narro w
range of neutron velocities, or in other words, that on e
nuclear level is responsible for most of the activation .
In the case of arsenic, the reduction in activity by the
thickest boron absorber used was only 30 0 /a, so no definit e
conclusion can be drawn from the straightness of th e
absorption curves. Furthermore the difference betwee n
curves I and II is only a small one (the arsenic filter wa s
too thin) so too much weight should not be laid on th e
constancy of their ratio . In the case of iodine the point s
might suggest a slight curvature in the absorption curve .
Absorption of thermal neutrons in boron . Th e
absorption of thermal neutrons in boron was determine d
using, as detector, a boron lined ionisation chamber, con-
nected to a linear amplifier and mechanical counter . The
sensitive boron layer covered a circle of 15 mms . diameter
and was brought into the same position relative to the
paraffin as the plates to be activated in the foregoin g
experiments ; in this way identical geometrical condition s
were secured l. A screen of cadmium was used to dis -
criminate between thermal and faster neutrons . The pro-
f The chamber was placed above instead of below the paraffin block .
On the Selective Capture of Slow Neutrons .
9
cedure was the usual one : counts were made (a) withou t
absorber, (b) with 0 .4 gm ./cm . 2 cadmium, (c) with 0 .020
gm ./cm . 2 boron, (d) with cadmium and boron. The rati o
(c - d) : (a - b) gives the transmission in boron of th e
neutrons stopped by cadmium (C-neutrons) ; it was found
to be (51 .5 + 1 .5) 0 / 0 .
Some doubt may arise as to the degree of temperatur e
equilibrium of the neutrons defined in the way describe d
above, although a large part of the C-neutrons has certainly
got thermal velocities as may be deduced from temperatur e
variation (12, 13) and rotating wheel (14) experiments . The
following experiment was therefore carried out : counts
were taken, in the way described above, with the differenc e
that the cadmium was not placed on top of the paraffin
but at a certain depth below the surface. The ratio
(c - d) : (a - b) then gives the absorption, in boron, of
those neutrons which were slow enough at that depth t o
be stopped by cadmium but had, however, to diffus e
through a certain layer of paraffin wax before reaching th e
boron absorber and the ionisation chamber . We should
expect those neutrons to be more nearly in temperatur e
equilibrium than the C-neutrons . As a matter of fact, th e
ratio (c- d) : (a - b) was found to be unchanged, fo r
depths up to 3 ems . of paraffin, within the limit of error
of about 5 0/0 . It seems therefore reasonable to assum e
that this ratio would be essentially the same for a beam o f
neutrons in perfect temperature equilibrium .
The effective velocity of neutrons with a Maxwellia n
velocity distribution, that is, the velocity of homogeneou s
neutrons showing the same absorption in boron, depend s
somewhat on the thickness of the boron absorber used .
For thin boron absorbers it corresponds to an energy of
10 Nr . 12 . O. R . FRISCH :
T kT; when about 50 °/ 0 of the neutrons are absorbed a
slightly higher energy of very nearly kT has to be used (15) .
Oblique Incidence . Under the geometrical conditions
employed, oblique neutrons from directions forming angles
up to about 70° with the normal were involved . The deter-
mination of the mass absorption coefficient of boro n
would therefore require a serious correction and thereb y
become rather inaccurate . The determination of En , how-
ever, requires a knowledge of the ratio only of two mas s
absorption coefficients, which is, in the first instance, equal
to the inverse ratio of the respective boron thicknesse s
required to obtain equal absorption .
The geometrical conditions are, however, not quit e
identical since the different detectors used respond in a
different way to oblique neutrons so that a small correctio n
has to be applied . In the boron chamber, the probabilit y
of a neutron being counted is larger for oblique neutron s
since their path inside the effective boron layer (that is, th e
layer from which disintegration alpha-particles may escap e
into the chamber) is longer ("thin detector") . In gold,
however, most of the resonance neutrons are absorbed i n
a layer which is thin compared with the mean range o f
the electrons emitted by the active gold ; therefore, th e
probability of a resonance neutron being counted is almos t
independent of the angle of incidence ("Thick detector") .
In the case of gold, therefore, a correction of 5 °/0 has been
applied (see appendix I) while in the case of arsenic an d
iodine the detectors used were regarded as thin, and con-
sequently the uncorrected values were taken .
Discussion of Resonance Energies . The final
results are summarised in table 1 . The results of H . H.
On the Selective Capture of Slow Neutrons .
1 1
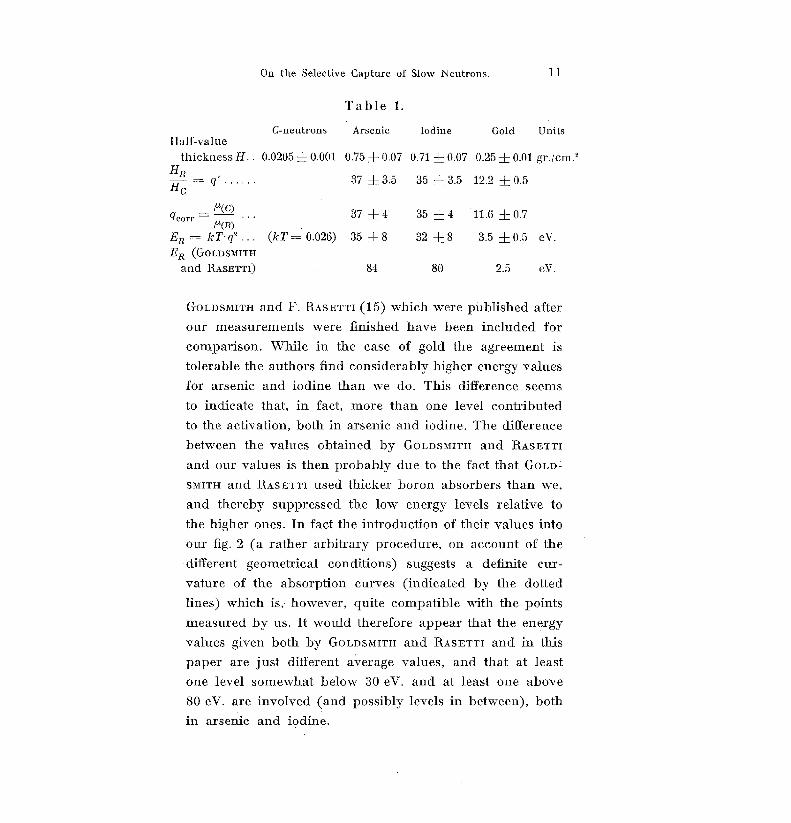
Table 1 .
C-neutrons Arsenic Iodine Gold
Unit sHalf-value
thickness H . . 0 .0205 + 0 .001 0 .75 ± 0 .07 0 .71 + 0 .07 0 .25 + 0 .01 gr./cm . 'HR
' 3 7
37
+ 3 . 5
4+
35
35
± 3 . 5
4
12 .2 + 0 .5
11 .6
0 . 7
H = gG
u (G)-qcorr
• • •
(kT = 0.026) 35 ± 8 32 + 8
+
3 .5 ± 0 .5
eV .ER = kT g2 . . .
ER (GOLDSMITH
84 80 2.5
eV .and RASETTI)
GOLDSMITH and F . RASETTI (15) which were published after
our measurements were finished have been included for
comparison. While in the case of gold the agreement is
tolerable the authors find considerably higher energy value s
for arsenic and iodine than we do. This difference seems
to indicate that, in fact, more than one level contributed
to the activation, both in arsenic and iodine . The differenc e
between the values obtained by GOLDSMITH and RASETT I
and our values is then probably due to the fact that GOLD -
SMITH and RASETTI used thicker boron absorbers than we ,
and thereby suppressed the low energy levels relative t o
the higher ones. In fact the introduction of their values int o
our fig. 2 (a rather arbitrary procedure, on account of th e
different geometrical conditions) suggests a definite cur -
vature of the absorption curves (indicated by the dotte d
lines) which is, however, quite compatible with the point s
measured by us . It would therefore appear that the energy
values given both by GOLDSMITH and RASETTI and in thi s
paper are just different average values, and that at leas t
one level somewhat below 30 eV. and at least one abov e
80 eV. are involved (and possibly levels in between), bot h
in arsenic and iodine .
12
Nr . 12 . 0. R . FRISCH :
It seems very doubtful whether much additional imform-
ation may be expected from this type of experiments since
the boron absorption method is rather ineffective as soo n
as more than one component is involved, like all method s
where absorption curves are analysed into exponentials
(e . g. gamma ray analysis by absorption) .
2. Determination of Resonance Cross Sections .
Determinations of resonance cross sections by differen t
authors have so far not been very consistent among them -
selves . This is probably due to the phenomenon of self-
reversal (16) : neutrons with velocities near to the centr e
of the absorption line are quickly absorbed, those at th e
sides showing a smaller absorption . The apparent absorp-
tion coefficient will, therefore, depend on the thickness of
the absorber used, decreasing with increasing absorber
thickness ; in other words, the absorption curve is no t
exponential but flattens out at large absorber thicknesses .
We shall first discuss the shape of the absorption curv e
theoretically and then compare it with experiment . Our
calculation is based on the assumptions that only one
resonance level is involved the width of which is small com-
pared with the resonance energy, and that the neutrons hav e
a uniform energy distribution in the energy region con-
cerned. The first assumption permits us to neglect th e
1-factor in the capture cross section which becomes im -a
portant, anyhow, only for very slow neutrons which in th e
experiments have been removed by a cadmium screen .
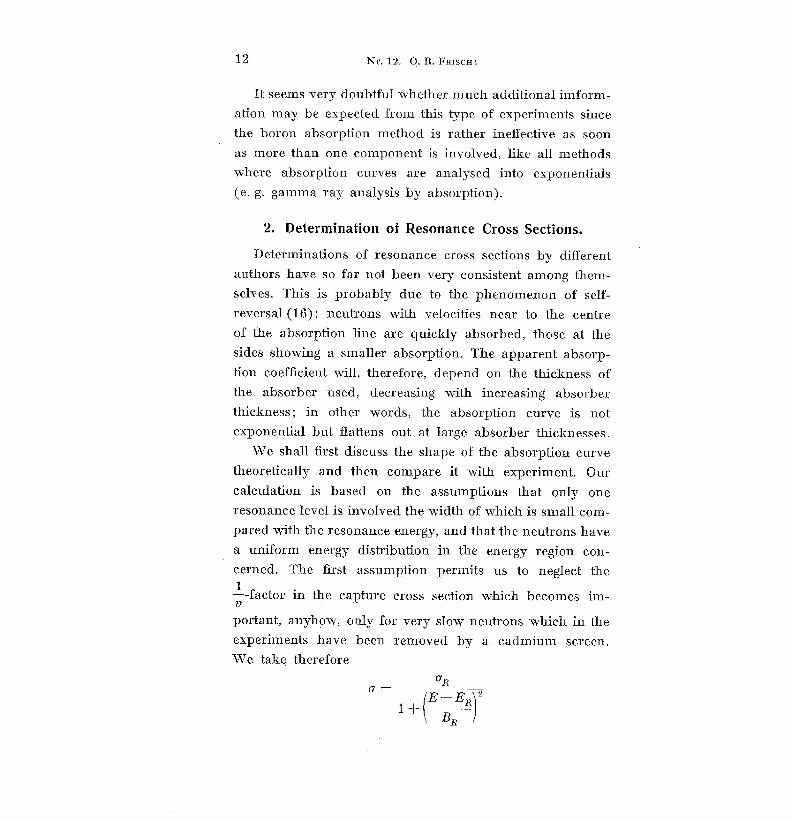
We take therefore
6R
+ (E -ER1 2
BR
On the Selective Capture of Slow Neutrons .
1 3
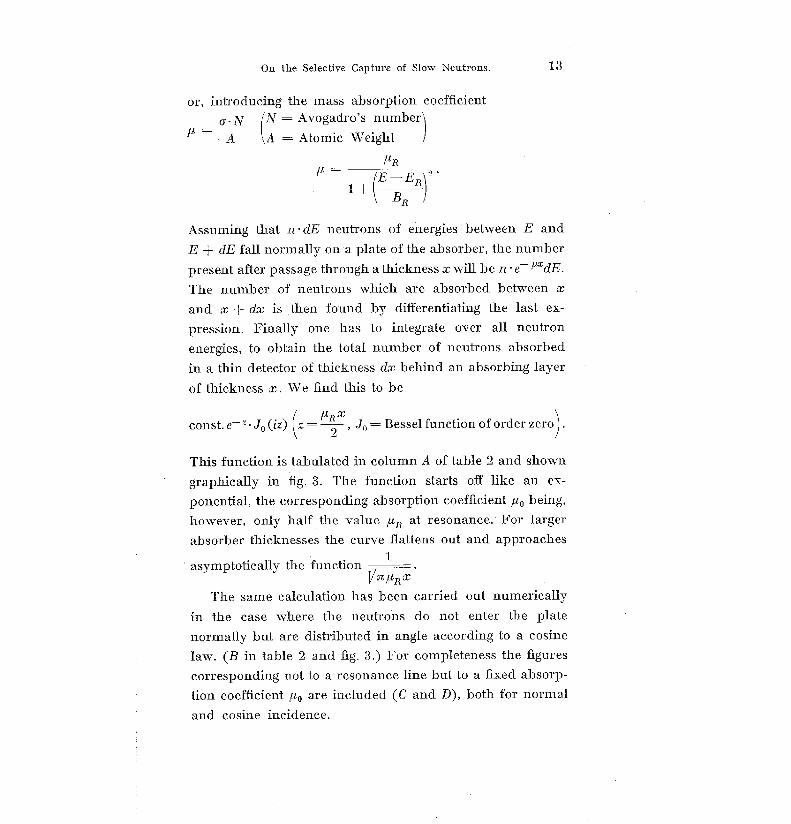
or, introducing the mass absorption coefficien t
~ . N (N = Avogadro's number
A
\ A = Atomic Weight
PR=
l1 f-(E-ER
B1z
Assuming that n • dE neutrons of energies between E an d
E + dE fall normally on a plate of the absorber, the numbe r
present after passage through a thickness x will be n • e PxdE .
The number of neutrons which are absorbed between x
and x + dx is then found by differentiating the last ex -
pression. Finally one has to integrate over all neutron
energies, to obtain the total number of neutrons absorbe d
in a thin detector of thickness dx behind an absorbing layer
of thickness x . We find this to be
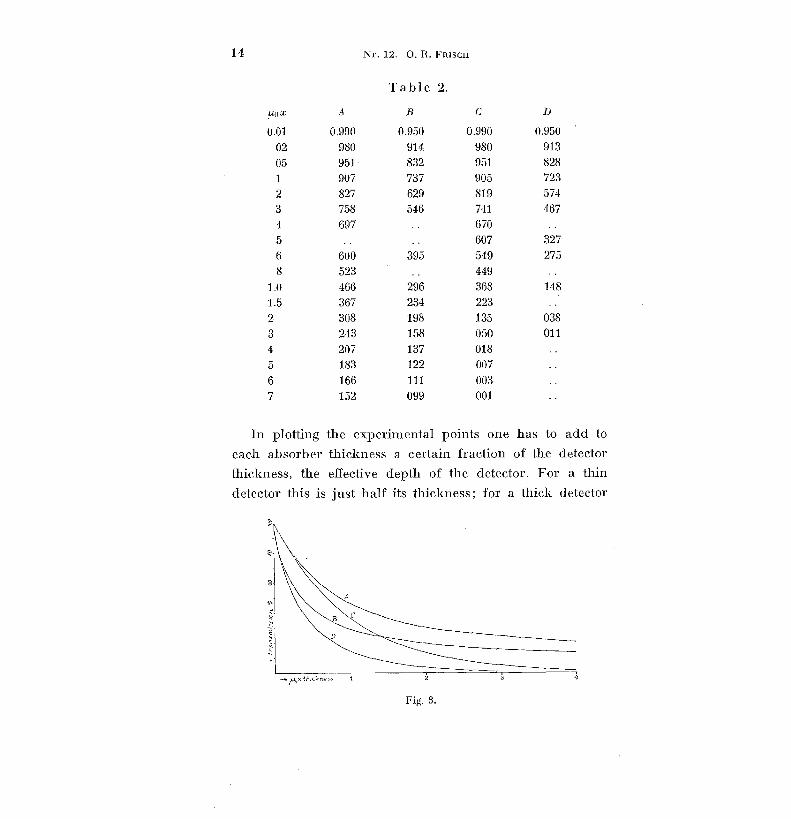
xconst. e- z . Jo (iz) (z = 2, Jo = Bessel function of order zero .
This function is tabulated in column A of table 2 and show n
graphically in fig . 3. The function starts off like an ex-
ponential, the corresponding absorption coefficient po being ,
however, only half the value yR at resonance . For larger
absorber thicknesses the curve flattens out and approache s
asymptotically the function
1
v7t [RxThe same calculation has been carried out numerically
in the case where the neutrons do not enter the plat e
normally but are distributed in angle according to a cosin e
law. (B in table 2 and fig . 3 .) For completeness the figures
corresponding not to a resonance line but Lo a fixed absorp-
tion coefficient po are included (C and D), both for norma l
and cosine incidence .
14
Nr . 12 . O. R . FRISCH
Table 2 .
pax A B C D
0 .01 0 .990 0 .950 0 .990 0 .95 0
02 980 914 980 913
05 951 832 951 828
1 907 737 905 723
2 827 629 819 574
3 758 546 741 467
4 697 . . 670
5 . . 607 32 7
6 600 395 549 27 5
8 523 . . 449
1 .0 466 296 368 14 8
1 .5 367 234 2232 308 198 135 038
3 243 158 050 01 1
4 207 137 018
5 1 .83 122 007
6 166 111 003
7 152 099 001
In plotting the experimental points one has to add t o
each absorber thickness a certain fraction of the detecto r
thickness, the effective depth of the detector . For a thin
detector this is just half its thickness ; for a thick detector
Fig . 3 .

On the Selective Capture of Slow Neutrons .
1 5
0, 5
0.2
0.05
0.02
0.0 1
of thickness a the absorption of the electrons emitted in th e
detector has to be taken into account . We have done thi s
in a rough way by measuring the absorption coefficient ,ae
of the electrons in the detector material and by using fo rd
it ethe effective depth the expression 1
11 - ape
e
1 - e a µe ~/
k 2
3 4 5 6 810nimn~.nnn~~~.n n
nn~~...nCn
=MIMInnMI~\\nn11El
mn=INN =EMI II iii
TI~i
1bb___1111I .n.__.___....n__. nnn__Win=_-nnnnn___n--Ennnn1111=1nnnnnn1111111MII=MU=III
nnnI I=IN=El =nnN=MI1111 ,-.1=111.n.,1"n-".,=•iiniii 11111
11111111Thickness (in units of,u o )
Fig . 4.
In comparing the theoretical curves with the experiment s
we must remember the following point. The scales of the
ordinate and abscissa of the theoretical and experimental
curves are not the same. The adjustment of the scales can
be most easily effected by plotting both the ordinate an d
abscissa logarithmically, for then a change of scale merely
causes a shifting of the origin . The theoretical curves ar e
ta.1
b
e
16
Nr . 12 . O. R . FRISQH :
first plotted (fig . 4) ; comparison is then carried out by
plotting the experimental points on the same scale on a
piece of transparent paper and by attempting to obtai n
coincidence by means of vertical and horizontal translation s
of the paper .
Experimental procedure . A nearly parallel beam of
neutrons would obviously be the best for measuring their
absorption, but intensity considerations force one to content
oneself with rather bad geometrical arrangements . We have
used two types . In one of them, a block of paraffin wa x
shaped like a cone was used as a source of slow neutrons ,
and the detector was placed in such a way that only neutron s
forming angles of about 45°, or less, with the normal wer e
able to reach it . In the other one, the absorbers and th e
detector were placed immediately on top of a flat paraffi n
block. For the determination of the initial absorption
coefficient the "conical" arrangement was always used ; the
"flat" arrangement, yielding larger intensity, was used t o
obtain, in some cases, the shape of the absorption curv e
up to higher absorbing thicknesses .
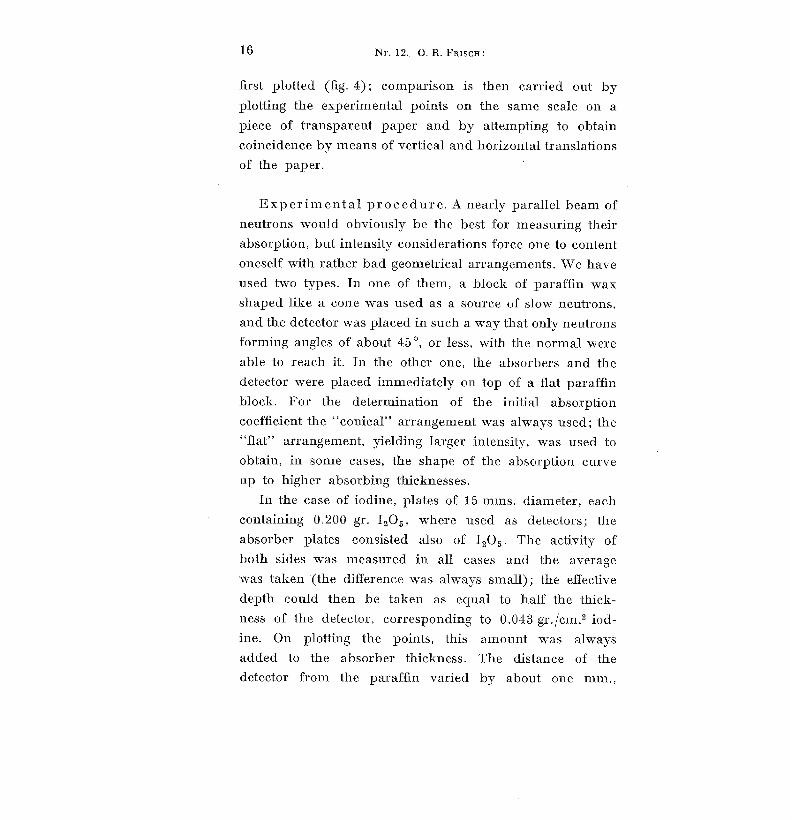
In the case of iodine, plates of 15 rams . diameter, each
containing 0 .200 gr . I205 , where used as detectors ; the
absorber plates consisted also of I205 . The activity o f
both sides was measured in all cases and the averag e
was taken (the difference was always small) ; the effective
depth could then be taken as equal to half the thick-
ness of the detector, corresponding to 0 .043 gr ./cm . 2
ine. On plotting the points, this amount was always
added to the absorber thickness . The distance of the
detector from the paraffin varied by about one mm. .,

On the Selective Capture of Slow Neutrons .
1 7
depending on the absorber used ; to allow for this, a smal l
correction of 4 °/ 0 at most was applied .
The points obtained are plotted, on a double logarithmi c
scale, in fig . 5 . The effective absorber thickness (in gr ./cm . 2 )
has been written under each point while the correcte d
intensity is written on top of it, in arbitrary units . On com-
paring the points with different curves of type A (see fig . 4)
one sees that none of them fits all the observed points . Doppler
Fig . 5 .
broadening of the line would make the absorption stil l
steeper and thereby make the discrepancy still worse . The
only possibility seems again to be to assume that mor e
than one level is involved . If we assume, for example, tha t
about 20 0 /0 of the activation of the detector without absorber
is due to some group of neutrons which are only weakl y
absorbed in iodine and that 80 0 /0 is due to a line with
,uo = 5 cm . 2/gr. (oß - 2 .1 •10 -21 cm . 2) then we get the
dotted line which fits the observed points perfectly. It
should be emphasized that, of course, many other com-
binations of neutron groups with different absorptio nVidensk : Selsk ., Math .-fys. Medd . XIV . 12 .
2

18
Nr. 12 . O . R. Fn7scfI :
coefficient could be found which would fit the point s
equally well . A small part of the activation might be due
to the primary neutrons from the (Ra + Be) source ; thi s
might account for some of the weakly absorbable neutrons .
In the case of arsenic, the absorption coefficient was
determined in a similar way, using detectors of 15 mms .
Fig . 6 .
diameter, each containing 0 .200 gr . As 2O 3 , and the conical
paraffin arrangement . The results are plotted in fig . 6 . An
additional experiment in which larger absorbing thick-
nesses were employed was carried out with the flat arrange -
ment. The first three points of this fit the correspondin g
curve with the same value of uo (3 .1 cm . 2 /gr .) determined
in the conical arrangement. The other two points deviat e
from the curve in a similar way to the case of iodine, but
the deviation seems to be smaller .
Both with arsenic and iodine, the oxygen contained in

On the Selective Capture f Slow Neutrons .
1 9
the absorbers had no measurable influence ; this was
checked by special experiments .
In the case of gold, the initial absorption coefficient ,uo
was determined by using gold foils of about 0 .004 mm .
thickness as detector and absorber . Two such foils (of15 mms. diameter) were simultaneously exposed to the
neutrons with the conical arrangement, on top of one
another, and the activity induced in both of them was
measured . A small correction of 3 0 /o was applied to the
activity ratio measuréd since in a preliminary experiment .
it had been found that one of the foils showed 3 0 /o more
activity when both had been exposed under identical con-
ditions. Since only two points are measured and the intensit y
ratio is small one may work out the absorption coefficient
assuming an exponential absorption law. In this way on e
gets ,uo = 41 cm . 2 /gr . (oblique incidence having been
allowed for) . Some uncertainty, however, arises from th e
inhomogeneity of the gold foils used ; if, instead of 3 °/o ,
a correction of 7 0/ 0 is applied to the ratio measured, in
view of the fact that there was a 7 0 / 0 difference in weight
between the foils, one gets ,uo = 35 cm . 2 /gr. As a safe
estimate we would propose the value ,uo = (40 + 5) cm .2 /gr .
(corresponding to ßx = 2 .6 . 10-20 cm . 2) .
On account of this high value, together with the high
density of gold, it has been possible to follow the absorptio n
curve of gold for a very large range of thicknesses, varyin g
in ratio from 1 to 5000 . For this purpose, a pile of 29 gol d
plates of different thickness, the total thickness being abou t6 mms., was placed on top of the flat paraffin block . To
prevent neutrons from entering the pile from the sides, a
"guard ring" of gold, of 15 mms. internal and 25 mms .
external diameter, was placed round the pile. After three2*

T
Fig. 7 .

On the Selective Capture of Slow Neutrons .
2 1
days exposure the activities of a suitable selection of foil s
were measured, the corresponding absorbing thicknesse s
having a fairly uniform distribution on a logarithmic scale .
Ten of the gold foils selected for measurement were o f
nearly equal thickness (0 .004 mm.) ; small differences in
thickness were allowed for by dividing the measured
activity by the weight of each foil . For thicker absorbin g
layers, however, the intensity becomes too small to b e
measured by such thin detectors ; plates of 0 .1 mm . thick-
ness were therefore used and their activity was divided
by the empirical figure seven, to match them with the thi n
detectors . The results are shown in fig . 7 . The curve draw n
through the points is a curve of type B (see fig . 4), for
yo = 40 cm . 2 /gr . The fit is remarkably good, considerin g
the great range of thickness, and offers a very conclusiv e
proof of the "resonance shape" of the absorption line .
The deviations present are too small to offer a basis for
discussion .
3. Width of Resonance Level .
width 2Bß can be calculated if ER , ,uß and the absorptio n
coefficient at another velocity, e . g. for thermal neutron s
(u .) is known. In the case of gold, taking ER = 3 .5 eV . ,
,uß = 2 uo = 80 cm . 2 /gr ., and ,u T = 0.29 cm . 2 /gr ., we obtain
2 Bß = 0.12 eV. This result is, however, uncertain becaus e
other levels might contribute to the absorption coefficient
yTat thermal energies, possibly also levels below "zero" ,
that is, levels with smaller energies than would correspon d
to an incoming neutron with zero velocity .
EFrom the formula =
E z• 1 E the half-valu e(
B R
)1+ BR

22
Nr. 12 . O . R. FßiscH :
From measurements on the relative intensity of activatio n
due to thermal and resonance neutrons one may obtain
information on the width of resonance (17, 11) withou t
assuming only one level . A very rough estimate on thi s
basis gave a width of about 0 .1 eV. which is the same orde r
of magnitude as had been obtained in silver and rho-
dium (11) .
In the case of such narrow absorption lines the Dopple r
broadening, due to the thermal agitation of the capturing
nuclei, is not at all negligible . For a infinitely sharp level
the Doppler half-value width of the absorption line would
be 4 Virg 2 • j/kTT.El
(A = atomic weight) which, in the cas e
of gold at room temperature, is equal to 0 .06 eV. An attempt
was therefore made to find an influence of temperatur e
on the width of the absorption line .
Gold foils of 0 .01 mm. thickness were exposed to slow
neutrons filtered with cadmium, the gold being either a t
room temperature or at a faint red glow (about 600° C) .
Since neutrons near the centre of the absorption line ar e
almost completely absorbed in that thickness of gold the
broadening of the line with increasing temperature wa s
expected to result in increased activity . The experiments ar e
rendered laborious by the smallness of the differences t o
be measured and by the inhomogeneiLy of the gold foils .
Still, from four runs carried our with different gold foil s
and arrangements, a difference in activity, in favour o f
the hot foil, of (7 .5 1 .5) °/p seemed to be fairly well
established .
A check experiment, however, in which the cadmiu m
screen was removed, showed about the same difference i n
activity between the hot and the cold foil . Since about

On the Selective Capture of Slow Neutrons .
2 3
three-quarters of the activity obtained under these con-
ditions was due to thermal neutrons, this result is hard t o
understand . For thermal neutrons the rate of capture per
unit time should be independent of the velocity (1law! )and consequently there should be no temperature effect .
It is therefore doubtful wether the effect observed with th e
cadmium screen present is genuine, and it may be that all th e
effects observed are due to some still undetected source
of error .
APPENDIX I .
Obliquity Corrections .
Calculations have been carried out regarding the ab -
sorption curve of radiation with a given absorption coefficient
,i, under geometrical conditions roughly the same as thos e
actually used. For the directional distribution of the neutron s
emerging from the paraffin, the expressio n
Jz, sindzid(p= (cos 79' -r• cos' 19) sin 19' dd Ø
was taken (11) . This is also the number of neutrons fro m
different directions, indicated by a "thick" detector whic h
responds equally well to neutrons from all directions . In
a "thin" detector, however, oblique neutrons have a pro-
bability of being detected, larger by a factor 1 /cos & I n
this case, the directional distribution of indicated neutrons
is given by
J1 sin?dcp = (1 +I/3•cos19') sinz9d~9dcp .
If the detector is not placed directly on top of th e
paraffin, no neutrons emerging at a very flat angle wil l
hit the detector . The directional distribution of indicated

F1 =
2(1-a) -{-j/3 (1-a3)
k
é [2-{-j/3(1 -e
[2a+)3 (a2-ak)][L+'(k) - E/k
)
\ a(2k- v 3 ' k2)
_ kx r3(1- k) -I- j/ 3 (2 --k-{- k')] -e " [3(a'-ak) -{- j/ 3 (2 a '3 - a 2 k-{- ak') [
3
3(1-a 2)+ 2 V 3(1 -a3)
(a = cos l9 0 , k = /Ix, E (y)
edz) .
z
E(k)-E (3 k 2 - j/ 3 • k.3)+ / k
\a

On the Selective Capture of Slow Neutrons .
2 5
neutrons becomes, then, very complicated, depending o n
the shape of the paraffin surface and the distribution o f
neutron brightness along it . In the calculation the assumption
was made, for the sake of simplicity, that for 19 < 19 0 the
directional distribution given above is valid while for 0 > t0
no neutrons are indicated at all, where '19. o is a suitably
chosen angle .
The relative number of neutrons indicated behind an
absorbing plate of thickness x is then given b y
~0 2 at
y x
ÇJ . e cos 'a . sin'19dz9d92F = o°o
?9p 2 n
'
~ J•sln9i'd79(i g0
o
If the integration is carried out, taking either Ji or J2 for the
distribution of indicated neutrons, the expressions on page 2 4
are obtained .
These formulae have been kindly evaluated by Mr . FROD E
HJERTING ; the results are given in table 3 .
For practical purposes, the set of curves given in fig . 8
may be found convenient . Each curve corresponds to a
value of t9 0 ; the abscissae are the observed transmissions
(absorptions), and the ordinate gives, then, the factor f by
which one has to multiply the absorber thickness in order
to obtain a thickness which would, in the case of a parallel
beam, give the transmission observed . In other words : i f
one has calculated the "apparent" absorption coefficien t
from an absorption experiment, neglecting obliquity, then
one has to divide it by f in order to obtain the true one .
For not too bad geometrical conditions (I9 0 not larger than
about 60°) the absorption is nearly exponential and, there-

26
Nr. 12 . O. R . Fciiscx :
Table 3 .
0.0 cos 0.0 I ua = 0 .01 0 .02 0 .05 0 .1
0 .2 0 .5 1 .0 2 . 0
90° 0 0 .964 0 .936 0.866 0 .774 0 .634 0 .381 0 .181 0 .04884° 0 .1 978 957 899 812
671 404 193 05 1F1
77° 0 .2 982 964 913 835
703 432 207 055thin
71° 0 .333 985 969 929 856
731 470 232 062de-
60° 0 .5 987 973 934 874
764 512 267 080tector
48° 0 .667 988 976 942 886
786 548 302 0930° 1 990 980 951 905
819 607 368 135
90° 0 983 967 920 849
728 471 240 06884° 0 .1 984 968 922 852
731 474 242 069F)
77° 0 .2 985 970 926 858
739 481 246 070thick
71° 0 .333 986 972 931 867
753 498 257 074de-
60° 0 .5 987 974 937 878
771 525 279 082tector
48° 0 .667 988 977 942 888
788 553 307 0960° 1 990 980 951 905
819 607 368 135
20 30 4 0
% Absorption.
50 60 70
80 90
3
T 2
f
2
Tf1090 80 70 60 50 40 30 2 0
0/0 Transmission
Fig . 8 .

On the Selective Capture of Slow Neutrons .
27
fore, fis fairly independent of the absorber thickness . For
D'° smaller than 45 °, f is nearly equal to (1+ cos,
both
for thin and thick detectors .
In applying the obliquity correction to the experiments
with the paraffin cube, a value of t ° = 71° has been
adopted . Consequently the apparent absorption coefficien t
has to be divided by 1 .42 in the case of gold, and by 1 .52
in the case of the other detectors used . This would result
in a correction of 7 0 / 0 in the value of q, for gold ; for various
reasons, this correction was lowered to 5 °I0 .
APPENDIX II .
Cut-off Energy of Cadmium .
In order to obtain some information on the energy limi t
up to which the high absorbing power of cadmium extend s
(cut-off energy) the absorption in boron of those neutron s
which penetrate through cadmium (as detected by a boro n
chamber) has been compared with the absorption of therma l
neutrons in boron (9) . The residual neutrons were found
to be about six times less absorbable than the thermal ones ,
and it was concluded from this that cadmium is fairl y
transparent for neutrons with energies as small as 1 eV .
These experiments have been repeated and extended
over a large range of boron thicknesses without, however ,
changing very much the result which was obtained first .
In table 4 the results of an experiment are collected where
the absorption in boron of neutrons detected by a boro n
chamber was studied with and without a screen of 1 gr ./cm . 2
cadmium. The source of neutrons was a tin can filled wit h
water (17 ems. diameter and 18 ems . high), with 200 mgr .

28
Nr . 12 . O. R . Fa]SCH :
Table 4 .
boron absorber
A Bwith a screen
C
same as B
D
A- Bthickness i n
gr ./cm . 2without
cadmium
of 1 gr ./cm . '
Cd (unit as (unit changed to make firs tin A) value = 100)
0 100 ÿ 2 6 .9 ± 0 .15 100 + 2 100 + 2
0 .020 59 ± 2 (6 .6) 56.5+ 20.030 45 (6 .4) 41.5+ 20 .049 32 + 1 .5 6.1 +0.2 89+3 28
+1 .5
0 .10 13 .3 + 0 .6 5 .6 +0 .2 81+3 8.3+0 .70 .20 4.4 +0.2 64+ 3
0 .40 3 .1 + 0 .3 2 .9+ 0 .15 42+2 0 .2 + 0 .4
1 .0 1 .8 + 0 .15 26+2
Ra + Be placed in its centre ; the detecting boron layer had
a diameter of 15 mms ., as in the experiments describe d
above, and was placed 8 cm. above the water surface .
The absorption curves both for the residual neutrons an d
those stopped by the cadmium screen are shown in fig . 9 .
The fact that the half value thickness for the residual
~
.- 4
1 0
70
0.4
To./c,,,`2 boron
Fig . 9,
.OS o.1
0.2 T. 0

On the Selective Capture of Slow Neutrons .
2 9
neutrons is seen to be about 15 times larger than for therma l
neutrons shows that they are absorbed like a homogeneous
group of -about 5 eV. energy. This value may be regarde d
as a kind of average energy of the residual neutrons .
As a rough approximation to the velocity distributio n
of the residual neutrons one may assume that no neutrons
are present with velocities below a certain limit v L , while
above this limit the number of neutrons entering the boro n
chamber per unit time with velocities between v and v + dv
is proportional todv
(7, 11) .v
The absorption curve for this distribution has been
calculated, taking into account the 1-sensitivity of the boronv
chamber, and the result is
= boron thicknes s
1 _epL•X I ,uL = absorption coefficient of boronJ
_J
°
y L . x
for neutrons of velocity vL
(energy EL) .
Taking EL equal to 0 .87 eV. we obtain the curve shown
in fig . 9 . From the good agreement of this curve with th e
points measured we may deduce that the cut-off energy o f
a screen of i gr./cm . 2 cadmium is slightly below one volt .
Of course, the cut-off is not a sharp one ; there will be still
lower energies transmitted, to some extent, and highe r
energies will still be somewhat absorbed . A careful stud y
of the cadmium absorption curve combined with measure-
ments of the absorption in boron of the transmitted neutrons
may give more information on this point .
SUMMARY
The selective capture of slow neutrons in gold can b e
attributed mainly to one resonance level . The resonance

30
Nr . 12 . O. R . FnlscH :
energy is found to be 3 .5 ± 0.4 eV. (using the " boron
absorption method"), the resonance cross-section i s
(2.6 + 0 .3) • 10 -20 cm . 2 . The half-value width of the absorp-
tion line is estimated to be of the order of 0 .1 eV. An attemp t
of finding an influence of temperature on the line widt h
(thermal Doppler effect) gave no conclusive results .
In the case of arsenic and iodine there are indication s
that more than one level contributes to the activation ; in
both cases, the boron absorption method gives a value of
about 30 eV . for the average resonance energy if fairly thin
boron absorbers are used, while GoLnsmmf and RASETT I
find a value of about 80 eV ., using thicker absorbers . It i s
concluded that at least one level below 30 eV . and one above
80 eV. contribute to the activation both of arsenic and iodine .
Absorption curves obtained in the element under in-
vestigation also indicate the presence of more than one leve l
in the case of arsenic and iodine, while the absorption curv e
of gold is in accord with the assumption of one level only .
The influence of oblique incidence on absorptio n
measurements is discussed in detail, and a diagram i s
given by means of which the corrections can be carrie d
out readily .
The "cut-off" energy of a screen of 1 gr ./cm 2 . cadmium
is found to be nearly 1 eV .
In conclusion, I wish to thank Prof. Dr . N. BOHR for
his kind interest in this work, and Dr. G . PLACZEK, Dr .
V . WEISSKOPF and Dr. G . NICK for many helpful and
stimulating discussions . Furthermore, my thanks are du e
to the Rask-Ørsted foundation for a grant which enabled
me to carry out this investigation at the Institut for teoretisk
Fysik at Copenhagen .
On the Selective Capture of Slow Neutrons .
31
REFERENCES
1) E . AMALDI, E . FERMI, Ric . Scient . VI-II, 344 (1935) .2) L . SZILARD, Nature 136, 950 (1935) .3) O . R . FRISCH, H. A . C . MCKAY, G . HEVESY, Nature 137, 149 (1936).4) N . Boni, Nature 137, 344 (1936) .5) G . BREIT, E. WIGNER, Phys . Rev. 49, 519 (1936) .6) T . BJERGE, C. H. WESTCOTT, ProC . Roy . Soc . A 150, 709 (1935) .7) P . B . MooN, Proc . Phys. Soc. 48, 648 (1936) .8) D. F . `VEEKES, M . S . LIVINGSTON, H . A. BETHE, Phys . Rev. 49,
471 (1936) .9) O . R . FRISCH, G. PLACZEK, Nature 137, 357 (1936) .
10) H . v . HALBAN, P . PREISWERK, Nature 137, 905 (1936) .11) E . AMALnI, E . FERriu, Phys . Rev. 50, 899 (1936) .12) P . B . MooN, J. R . TILLMAN, Proc. Roy . Soc . A 153, 476 (1936) .13) P . PREISWERK, H . v . HALBAN, Nature 136, 1027 (1935) .14) J . R . DUNNING, G . B . PEGRAM, G . A . FINK, D . P . MITCHELL, E . SEGRÈ ,
Phys . Rev. 48, 704 (1935) .15) H. H. GOLDSMITH, F . RASETTI, Phys . Rev. 50, 328 (1936) .16) H . v . HALLIAN, P. PREIS`VERK, Nature 138, 163 (1936), J . de Phys .
8, 36 (1937) .17) E . AMALDI, E . FERMI, Ric . Scient . VII-I, 310 (1936) .
Fardig fra Trykkeriet den 21 . Juni 3527 .