Embed Size (px)
Citation preview

Tampere University of Technology
On the Variability of the Transcription Process in Escherichia coli
CitationMäkelä, J. (2016). On the Variability of the Transcription Process in Escherichia coli. (Tampere University ofTechnology. Publication; Vol. 1407). Tampere University of Technology.
Year2016
VersionPublisher's PDF (version of record)
Link to publicationTUTCRIS Portal (http://www.tut.fi/tutcris)
Take down policyIf you believe that this document breaches copyright, please contact [email protected], and we will remove accessto the work immediately and investigate your claim.
Download date:03.04.2020

Jarno MäkeläOn the Variability of the Transcription Process in Escherichia coli
Julkaisu 1407 • Publication 1407
Tampere 2016
Tampereen teknillinen yliopisto. Julkaisu 1407Tampere University of Technology. Publication 1407
Jarno Mäkelä
On the Variability of the Transcription Process inEscherichia coli
Thesis for the degree of Doctor of Science in Technology to be presented with duepermission for public examination and criticism in Sähkötalo Building, Auditorium SA203,at Tampere University of Technology, on the 9th of September 2016, at 12 noon.
Tampereen teknillinen yliopisto - Tampere University of TechnologyTampere 2016
Supervisor: Assoc. Prof. Andre S. RibeiroTampere University of TechnologyFinland
Pre-examiners: Prof. Jeff GellesBrandeis UniversityUnited States of America
Assist. Prof. Alvaro SanchezYale UniversityUnited States of America
Opponent: Prof. Achillefs N. KapanidisUniversity of OxfordUnited Kingdom
ISBN 978-952-15-3794-3 (printed)ISBN 978-952-15-3797-4 (PDF)ISSN 1459-2045

Abstract
In all organisms, cellular functions, such as growth and differentiation, are coordi-nated by gene networks. These networks control both which genes are transcribedas well as when these events occur, based on intracellular and environmentalinformation. Due to the often small number of specific regulatory molecules inthe cell, stochastic fluctuations in molecular numbers tangibly affect the controlof transcription. The stochasticity has consequences on the phenotype of the celland the course of future cellular events. To obtain a detailed understanding ofthe dynamics of these processes, one must use techniques that allow observingindividual events in time. Recent advancements in single-molecule detectiontechniques in live cells have made this possible and studies using these techniquesare beginning to shed light on the functioning of cellular processes at a molecularlevel.
In this thesis, the dynamics of the multi-step transcription process in Escherichiacoli was characterized using a combination of in vivo single-RNA detection tech-niques and single-nucleotide level stochastic models. Fluctuations at differentstages of the transcription process and their propagation were investigated.
First, intake and transcription dynamics were investigated in different promotersand various induction schemes. Following the beginning of induction, waitingtimes for the first transcription event and the time intervals between consecutiveones were measured. The measurements were conducted using an MS2-GFPRNA tagging technique to detect single RNA molecules in vivo. To accuratelymeasure the time moments when novel transcripts are produced, an automaticmethod for detecting non-spurious changes in time series data was developed.The stochasticity of the intake dynamics of inducers was found to be responsiblefor a large transient variability in RNA numbers that gradually vanishes, asthe fluctuations from active transcription on the intracellular RNA numbersaccumulate.
Next, contributions from the promoter dynamics and steps in transcription andtranslation elongation to fluctuations in RNA and protein numbers were studied.For this, stochastic single-nucleotide-level models to observe the dynamics ofinitiation at the promoter region and the dynamics of coupled transcription andtranslation elongation were constructed. In the closely spaced promoter regions,
i

ii Abstract
interference between RNA polymerases was shown to affect the dynamics andcreate transient correlations in transcription initiations. During coupled elongationphases, the propagation of fluctuations from transcription to translation was shownto depend on both transcription and translation processes. For example, sequence-dependent transcriptional pauses were shown to affect simultaneously transcriptionand translation elongation. Together these findings suggest that the dynamicsof transcript production is sensitive to the sequence-dependent mechanisms ofinitiation and elongation.
These results contribute to understanding how different sources of fluctuationscontribute to the outcomes of gene expression. While the in vivo single-moleculedetection techniques allow quantifying the fluctuations in principal componentsof the process at a molecular level, stochastic modeling contributes to the studyby explaining how they fluctuate, as different mechanisms can give rise to similarbehaviors. Combination of these methodologies will be crucial in future efforts forbetter understanding of biological systems.

Preface
This study was carried out at the Department of Signal Processing, Faculty ofComputing and Electrical Engineering, Tampere University of Technology underthe supervision of Associate Professor Andre S. Ribeiro.
First, I would like to express my sincere gratitude to my supervisor, AssociateProfessor Andre S. Ribeiro, for his persistent guidance and support during mydoctoral studies. It has been an honor to be a member of your group and learnthe ways of science along the way.
Next, I would like to thank all co-authors and members of the Laboratory ofBiosystem Dynamics, including alumni. The LBD has been a fantastic workingenvironment with great atmosphere. The discussions and knowledge from theinteractions have made this thesis possible in the current form, holding fragmentsof each contribution in it. I would especially like to thank Jason Lloyd-Price andAntti Häkkinen for their contributions on the theoretical aspects, and SamuelOliveira for the practical aspects.
I would also like to thank the TUT President’s graduate programme for supportingmy doctoral studies.
I am also grateful to the two pre-examiners, Jeff Gelles and Alvaro Sanchez, fortheir insightful suggestions which have helped improve this thesis.
Finally, I am deeply grateful to my family, for all their love and support duringthe years, which have made working on something like this possible.
Tampere, June 2016Jarno Mäkelä
iii

Contents
Abstract i
Preface iii
List of Abbreviations vii
List of Publications ix
1 Introduction 11.1 Background and Motivation . . . . . . . . . . . . . . . . . . . . . . 11.2 Thesis Objectives . . . . . . . . . . . . . . . . . . . . . . . . . . . . 21.3 Thesis Outline . . . . . . . . . . . . . . . . . . . . . . . . . . . . . 3
2 Biological Background 52.1 Gene Expression in Escherichia coli . . . . . . . . . . . . . . . . . 52.2 Mechanisms of Transcription and Translation . . . . . . . . . . . . 7
2.2.1 Transcription Initiation . . . . . . . . . . . . . . . . . . . . 82.2.2 Transcription and Translation Elongation . . . . . . . . . . 11
2.3 Regulation of Transcription . . . . . . . . . . . . . . . . . . . . . . 142.3.1 Transcription Factor Dynamics . . . . . . . . . . . . . . . . 142.3.2 Transcription Induction . . . . . . . . . . . . . . . . . . . . 162.3.3 Arabinose Operon . . . . . . . . . . . . . . . . . . . . . . . 17
2.4 Closely Spaced Promoters . . . . . . . . . . . . . . . . . . . . . . . 192.5 Noise in Gene Expression . . . . . . . . . . . . . . . . . . . . . . . 21
3 Theoretical Background 253.1 Chemical Master Equation . . . . . . . . . . . . . . . . . . . . . . . 253.2 Stochastic Simulation Algorithm . . . . . . . . . . . . . . . . . . . 27
3.2.1 Delayed SSA . . . . . . . . . . . . . . . . . . . . . . . . . . 283.3 Modeling Gene Expression . . . . . . . . . . . . . . . . . . . . . . . 303.4 Detailed Model of Transcription and Translation . . . . . . . . . . 33
3.4.1 SGNS2 . . . . . . . . . . . . . . . . . . . . . . . . . . . . . 373.5 Finite State Projection Algorithm . . . . . . . . . . . . . . . . . . 38
v
vi Contents
4 Measurements and Analysis 414.1 Fluorescent Proteins and Microscopy . . . . . . . . . . . . . . . . . 414.2 Single-Molecule Approaches for RNA Detection . . . . . . . . . . . 42
4.2.1 MS2-GFP Tagging Method . . . . . . . . . . . . . . . . . . 444.3 Image Analysis and Data Extraction . . . . . . . . . . . . . . . . . 46
4.3.1 Image Analysis and RNA Quantification . . . . . . . . . . . 464.3.2 Measurement of Intervals . . . . . . . . . . . . . . . . . . . 47
4.4 Change Point Detection Methods . . . . . . . . . . . . . . . . . . . 49
5 Conclusions and Discussion 53
Bibliography 59
Publications 77
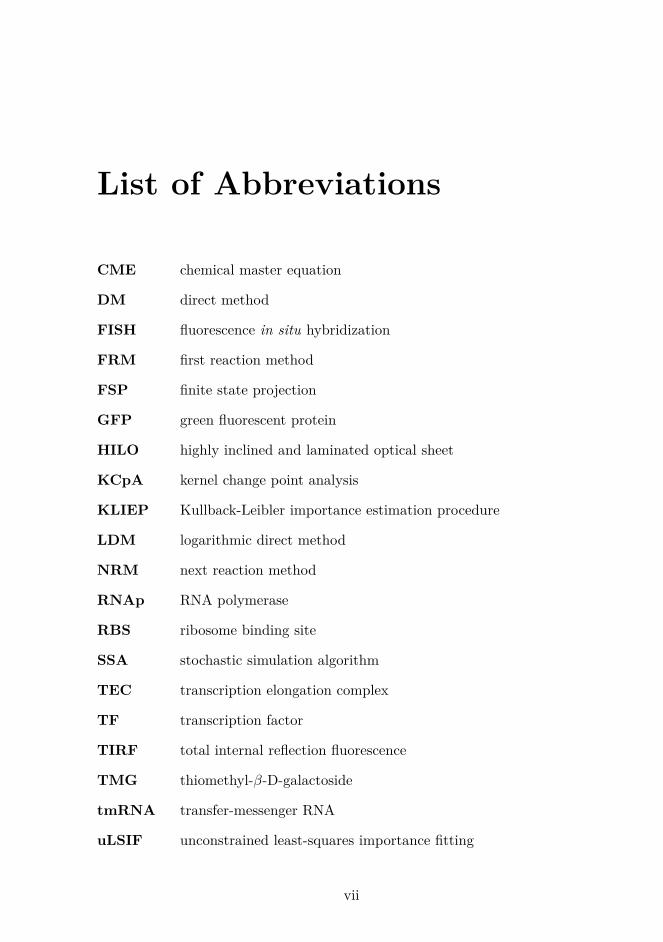
List of Abbreviations
CME chemical master equation
DM direct method
FISH fluorescence in situ hybridization
FRM first reaction method
FSP finite state projection
GFP green fluorescent protein
HILO highly inclined and laminated optical sheet
KCpA kernel change point analysis
KLIEP Kullback-Leibler importance estimation procedure
LDM logarithmic direct method
NRM next reaction method
RNAp RNA polymerase
RBS ribosome binding site
SSA stochastic simulation algorithm
TEC transcription elongation complex
TF transcription factor
TIRF total internal reflection fluorescence
TMG thiomethyl-β-D-galactoside
tmRNA transfer-messenger RNA
uLSIF unconstrained least-squares importance fitting
vii

List of Publications
This thesis is a compilation of the following publications. In the text, these arereferred to as Publication I, Publication II and so on.
I J. Mäkelä, H. Huttunen, M. Kandhavelu, O. Yli-Harja, and A.S. Ribeiro,“Automatic detection of changes in the dynamics of delayed stochastic genenetworks and in vivo production of RNA molecules in Escherichia coli”,Bioinformatics, 27(19):2714-2720, 2011.
II J. Mäkelä, M. Kandhavelu, S.M.D. Oliveira, J.G. Chandraseelan, J. Lloyd-Price, J. Peltonen, O. Yli-Harja, and A.S. Ribeiro, “In vivo single-moleculekinetics of activation and subsequent activity of the arabinose promoter”,Nucleic Acids Research, 41(13):6544-6552, 2013.
III L. Martins*, J. Mäkelä*, A. Häkkinen, M. Kandhavelu, O. Yli Harja, J.M.Fonseca and A.S. Ribeiro, “Dynamics of transcription of closely spacedpromoters in Escherichia coli, one event at a time”, Journal of TheoreticalBiology, 301:83–94, 2012. (*equal contribution)
IV J. Mäkelä, J. Lloyd-Price, O. Yli-Harja, and A.S. Ribeiro, “Stochasticsequence-level model of coupled transcription and translation in prokaryotes”,BMC Bioinformatics 12:121, 2011.
The author of this thesis contributed to these publications as follows. In Pub-lication I, the author performed the simulations, analyzed the results with H.Huttunen and A.S. Ribeiro, and contributed to the writing of the manuscript.In Publication II, the author conceived the study with A.S. Ribeiro, designedthe experiments, carried out the microscopy experiments and image analysiswith S.M.D. Oliveira, designed and implemented the models with J. Lloyd-Price,analyzed the results with A.S. Ribeiro, and contributed to the writing of themanuscript. In Publication III, the author conceived the model with A.S.Ribeiro, simulated the model and analyzed the results with L. Martins, andcontributed to the writing of the manuscript. In Publication IV, the authorconceived the model, implemented and simulated the model with J. Lloyd-Price,
ix

x List of Publications
analyzed the results with J. Lloyd-Price and A.S. Ribeiro, and contributed to thewriting of the manuscript.
Publication II has been used by J.G. Chandraseelan in his PhD dissertation.
1 Introduction
1.1 Background and Motivation
In all organisms, from viruses to mammals, gene regulatory networks coordinatecellular functions, such as growth and differentiation (Arkin et al. 1998; Süel et al.2007; Acar et al. 2005; Takahashi and Yamanaka 2006). These networks controlboth which genes are transcribed as well as when these events occur, based onintracellular and environmental information. Such regulation is essential for cellsto alternate between different physiological and morphological states, in order tocope with changing environmental conditions (Errington 2003; Süel et al. 2006;Balaban et al. 2004). Notably, not all cellular decisions to change phenotypicstate are driven by environmental or internal signals (Arkin et al. 1998; Lewis2007; Kearns and Losick 2005). Namely, evidence suggests that monoclonal cellsin a homogenous environment can exhibit a mixture of different phenotypes in astochastic manner (Norman et al. 2015). The main source of phenotypic diversityhas been identified to be stochasticity in gene expression (Elowitz et al. 2002).
Many regulatory molecules in cells exist in very low copy-numbers (Kaern et al.2005; Taniguchi et al. 2010). Molecular events involving such low-abundancemolecules, such as in gene expression, are poised with randomness in the timingof events. Stochasticity in gene expression causes identical cells in the sameenvironment to exhibit different numbers of RNA and proteins (Paulsson 2004).Aside from this, small differences in cell size, cellular history, etc., have beenshown to contribute to the diversity of cell fates (St-Pierre and Endy 2008; Zenget al. 2010; Robert et al. 2010). Relevantly, not all stochasticity is detrimental,as in some cases, it is the mean by which cellular organisms adjust to challengesposed by the competition and environmental fluctuations (Leibler and Kussell2010; Süel et al. 2006; Balaban et al. 2004; Raj et al. 2010; Ribeiro et al. 2008).
Gene expression consists of transcription, the reading of DNA and production ofa specific RNA molecule, and translation, the reading of the RNA sequence andengineering of a correspondent peptide. Both are complex, multi-step processeswith sequence-dependent dynamics (McClure 1985; Saecker et al. 2011; Ramakr-ishnan 2002). For example, the promoter sequence has been shown to controlboth the mean and variability in constitutive expression in Escherichia coli (Jones
1
2 Chapter 1. Introduction
et al. 2014). The regulation of the steps in transcription initiation, especiallythe closed and open complex formations, allow cells to regulate the rate of RNAproduction (Lutz et al. 2001; McClure 1980; Sanchez et al. 2011). The couplingbetween transcription and translation in prokaryotes allows this regulation alsoto be extended to peptide production dynamics (Yarchuk et al. 1992).
Recent advancements in single-molecule detection techniques have made possiblemeasurements of fluctuations in the RNA and protein numbers in individualcells (Golding et al. 2005; Yu et al. 2006; Fusco et al. 2003; Taniguchi et al.2010). The fluorescence in situ hybridization (FISH) and tagging of RNAs withfluorescent proteins, e.g., MS2-GFP method (Fusco et al. 2003), have rapidlybecome popular due to their ability to probe variability in endogenous RNAnumbers, which is not attainable from averaged measurements of abundance(Raj and van Oudenaarden 2009). By measuring fluctuations in the number ofmolecules, quantitative information about the underlying processes responsiblefor the observed fluctuations and even the dynamics, can be determined. Suchmeasurements have been used to probe different stages of transcription, such asRNAp binding, transcription initiation, and elongation, which has proven to beinsightful for the understanding of the transcription process (Larson et al. 2011;Friedman et al. 2013; Muthukrishnan et al. 2012).
From the measurements, models of gene expression have been constructed. Theseseek to explain how the fluctuations in the numbers of involved components ariseand how they contribute to the overall dynamics (Sanchez et al. 2011; Garciaet al. 2012). To incorporate stochasticity, gene expression has been modeled usingstochastic modeling approaches (Arkin et al. 1998; Ribeiro et al. 2010). Thestochastic simulation algorithm (SSA) is a common way to simulate exact sampletrajectories from the distribution described by the chemical master equation(CME), which captures the dynamics of molecular scale interactions (Gillespie1992; Gillespie 2007). Other methods, such as finite state projection (FSP)algorithm (Munsky and Khammash 2006), can provide approximations or exactanalytical solutions for biological systems with small number of species. Meanwhile,dynamics of a system with a large number of interacting species can be onlysimulated with SSA.
1.2 Thesis Objectives
This thesis focuses on studying variability in the transcription process in E. coli.First, an automatic methodology to detect changes from time series data ispresented. The method aimed to be general and applicable to different biolog-ical systems, e.g., single genes, small gene networks, and large-scale networks.Relevantly, it can be used to detect changes in simulated time series and inmeasurements from time-lapse microscopy. Second, the induction kinetics andsubsequent transcription dynamics in live cells for a few promoters and induction
1.3. Thesis Outline 3
schemes were studied. Specifically, time intervals between transcription events andthe waiting time for the first transcription event were measured using an MS2-GFPRNA tagging method. Third, closely spaced promoters, common in E. coli andother organisms, were studied assuming various configurations and localizationsof promoter start sites using stochastic, single-nucleotide level models. Also, theco-regulation of the promoters with shared transcription factor binding sites wascharacterized. Finally, a stochastic transcription and translation elongation modelat the single nucleotide and codon level was developed. This model was used tostudy the propagation of fluctuations in transcription kinetics into translationkinetics as a function of the underlying processes.
The thesis has three objectives:
I Propose a novel automatic method to detect changes in the dynamics of generegulatory networks. This method has to be general so as to be applicableto the study of a broad type of changes in synthetic and empirical timeseries data.
II Study the timing of promoter activation and consequent transcription dy-namics using single-RNA measurement techniques. Characterize the conse-quences of asynchronous promoter dynamics on the temporal populationvariability.
III Characterize the dynamics of transcription initiation and coupled tran-scription and translation elongation using single nucleotide level stochasticmodels. The models should account for the detailed processes occurringduring initiation and elongation of both transcription and translation.
Objective I was completed in Publication I. Objective II was completed inPublication II. Finally, Objective III was completed in Publication III andPublication IV.
1.3 Thesis OutlineThis thesis is organized as follows. Chapter 2 introduces the biological backgroundby describing the current knowledge on transcription and translation initiation,elongation and regulation in E. coli. Chapter 3 introduces the models, modelingstrategies and simulation algorithms employed in the publications of this thesis.In particular, the CME, the SSA and the FSP algorithms to model biochemicalsystems are described in this chapter. Chapter 4 presents fluorescence microscopytechniques to measure in vivo single RNA numbers in individual cells. In particular,the measurements and analysis of in vivo single RNA detection experiments usedin this thesis are discussed. Finally, conclusions and discussion are presented inChapter 5.

2 Biological Background
This chapter gives an overview on the biological processes studied in this thesis.It includes a description of transcription and translation in Escherichia coli alongwith a more detailed view into transcription initiation, elongation, regulation,closely spaced promoters and noise in gene expression.
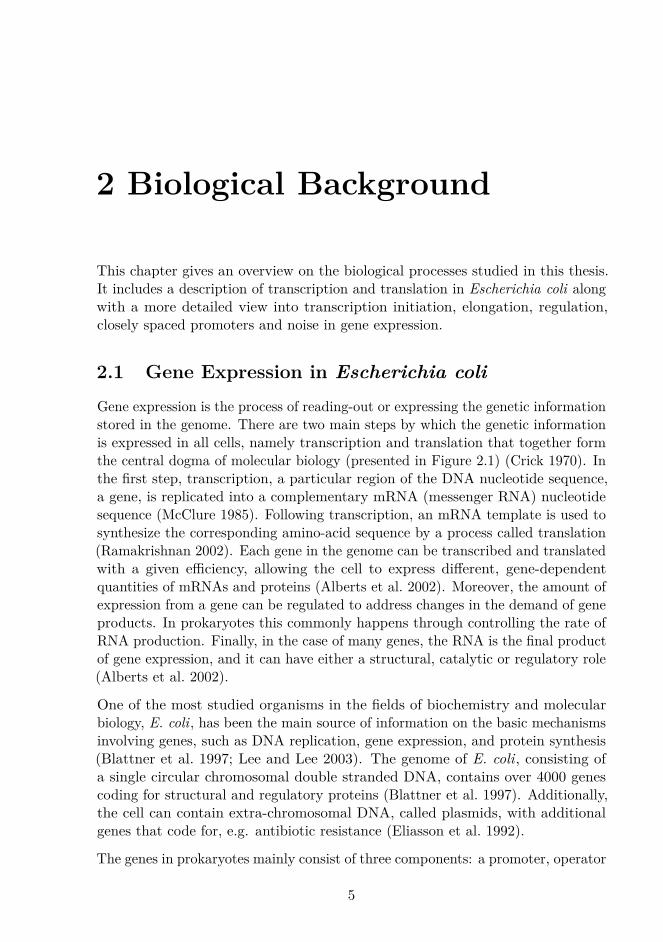
2.1 Gene Expression in Escherichia coliGene expression is the process of reading-out or expressing the genetic informationstored in the genome. There are two main steps by which the genetic informationis expressed in all cells, namely transcription and translation that together formthe central dogma of molecular biology (presented in Figure 2.1) (Crick 1970). Inthe first step, transcription, a particular region of the DNA nucleotide sequence,a gene, is replicated into a complementary mRNA (messenger RNA) nucleotidesequence (McClure 1985). Following transcription, an mRNA template is used tosynthesize the corresponding amino-acid sequence by a process called translation(Ramakrishnan 2002). Each gene in the genome can be transcribed and translatedwith a given efficiency, allowing the cell to express different, gene-dependentquantities of mRNAs and proteins (Alberts et al. 2002). Moreover, the amount ofexpression from a gene can be regulated to address changes in the demand of geneproducts. In prokaryotes this commonly happens through controlling the rate ofRNA production. Finally, in the case of many genes, the RNA is the final productof gene expression, and it can have either a structural, catalytic or regulatory role(Alberts et al. 2002).
One of the most studied organisms in the fields of biochemistry and molecularbiology, E. coli, has been the main source of information on the basic mechanismsinvolving genes, such as DNA replication, gene expression, and protein synthesis(Blattner et al. 1997; Lee and Lee 2003). The genome of E. coli, consisting ofa single circular chromosomal double stranded DNA, contains over 4000 genescoding for structural and regulatory proteins (Blattner et al. 1997). Additionally,the cell can contain extra-chromosomal DNA, called plasmids, with additionalgenes that code for, e.g. antibiotic resistance (Eliasson et al. 1992).
The genes in prokaryotes mainly consist of three components: a promoter, operator
5
6 Chapter 2. Biological Background
DNA RNA Protein
Transcription TranslationReplication
Figure 2.1: The central dogma of molecular biology. The informationstored in the DNA can be transferred to mRNA by transcription and fromthe mRNA to proteins by translation. Information in the DNA can bereplicated in the process of DNA replication. Additionally, in special cases,information from the RNA can be transferred to the DNA in a process calledreverse transcription.
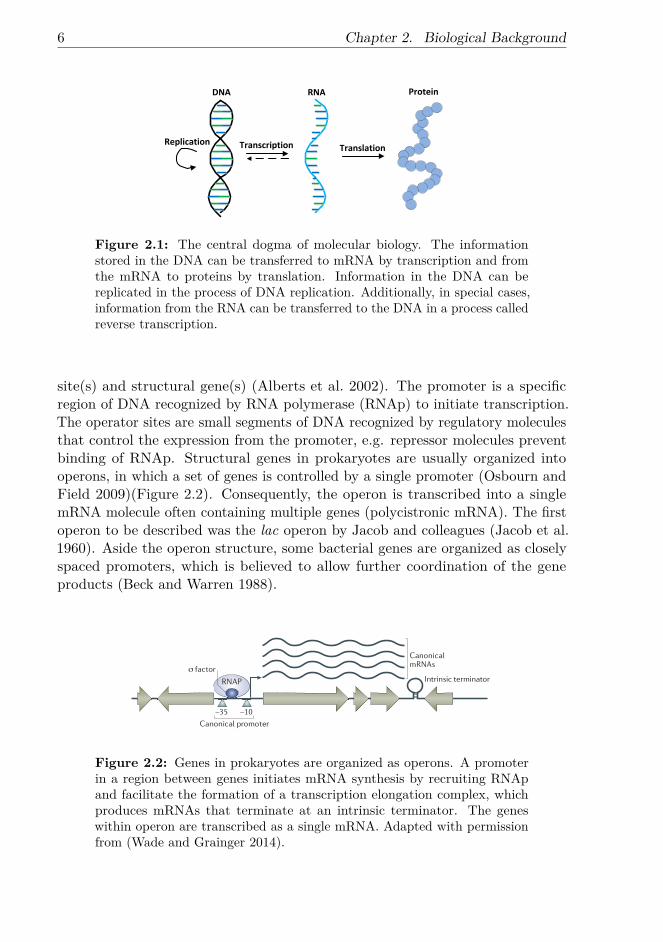
site(s) and structural gene(s) (Alberts et al. 2002). The promoter is a specificregion of DNA recognized by RNA polymerase (RNAp) to initiate transcription.The operator sites are small segments of DNA recognized by regulatory moleculesthat control the expression from the promoter, e.g. repressor molecules preventbinding of RNAp. Structural genes in prokaryotes are usually organized intooperons, in which a set of genes is controlled by a single promoter (Osbourn andField 2009)(Figure 2.2). Consequently, the operon is transcribed into a singlemRNA molecule often containing multiple genes (polycistronic mRNA). The firstoperon to be described was the lac operon by Jacob and colleagues (Jacob et al.1960). Aside the operon structure, some bacterial genes are organized as closelyspaced promoters, which is believed to allow further coordination of the geneproducts (Beck and Warren 1988).
Β
ρ ρ
λΓΒ∆ΥΠΣ
3/∀1
∃ΒΟΠΟϑ∆ΒΜΘΣΠΝΠΥΦΣ
∗ΟΥΣϑΟΤϑ∆ΥΦΣΝϑΟΒΥΠΣ
∃ΒΟΠΟϑ∆ΒΜΝ3/∀Τ
Figure 2.2: Genes in prokaryotes are organized as operons. A promoterin a region between genes initiates mRNA synthesis by recruiting RNApand facilitate the formation of a transcription elongation complex, whichproduces mRNAs that terminate at an intrinsic terminator. The geneswithin operon are transcribed as a single mRNA. Adapted with permissionfrom (Wade and Grainger 2014).
2.2. Mechanisms of Transcription and Translation 7
2.2 Mechanisms of Transcription and TranslationThe main enzyme involved in transcription is the core RNAp. It consists of severalsubunits (ββ’α2ω) and contains all necessary enzymatic components required forthe synthesis of RNA but it cannot initiate transcription from a promoter (Younget al. 2002). To bind specifically to the promoter and initiate transcription, thecore RNAp must be bound by one of the σ-subunits (Murakami et al. 2002). Thisproduces an RNAp in the holoenzyme form (Eσ), which contains exactly oneσ-subunit that has affinity for specific promoters in the genome. E.g., σ32 is aheat shock sigma factor in that it allows the RNAp to express the genes associatedwith the response of E. coli to heat shock conditions (Alberts et al. 2002).
∋Β∆ΥΠΣΝΦΕϑΒΥΦΕΒΟΥϑΘΒςΤϑΟΗΠΣΒΟΥϑΥΦΣΝϑΟΒΥϑΠΟ
Β∗ΟϑΥϑΒΥϑΠΟ
Χ&ΜΠΟΗΒΥϑΠΟΒΟΕΥΦΣΝϑΟΒΥϑΠΟ
_ΘϑΟ∆ΦΣ
_υΘϑΟ∆ΦΣ∀∆ΥϑΩΦΤϑΥΦ
1ϑΟ∆ΦΣΤΠΘΦΟ
1ϑΟ∆ΦΣΤΠΘΦΟ1ϑΟ∆ΦΣΤ∆ΜΠΤΦΕ 1ϑΟ∆ΦΣΤΠΘΦΟ 1ϑΟ∆ΦΣΤΠΘΦΟ
1ϑΟ∆ΦΣΤ∆ΜΠΤΦΕ
1ϑΟ∆ΦΣΤΠΘΦΟ 1ϑΟ∆ΦΣΤ∆ΜΠΤΦΕ 1ϑΟ∆ΦΣΤ∆ΜΠΤΦΕ
Ν3/∀
Ν3/∀
3/∀1 %/∀
&ΜΠΟΗΒΥϑΟΗ3/∀1
∋Β∆ΥΠΣΝΦΕϑΒΥΦΕΘΒςΤϑΟΗ 4ΘΠΟΥΒΟΦΠςΤΘΒςΤϑΟΗ 5ΦΣΝϑΟΒΥϑΠΟ
5ΦΝΘΜΒΥΦ%/∀
∃ΜΠΤΦΕ∆ΠΝΘΜΦΨΤΙΠΣΥΜϑΩΦΕ
1ΣΠΝΠΥΦΣ
∃ΜΠΤΦΕ∆ΠΝΘΜΦΨΜΠΟΗΦΣΜϑΩΦΕ
0ΘΦΟ∆ΠΝΘΜΦΨ
&ΜΠΟΗΒΥϑΠΟ∆ΠΝΘΜΦΨΒΧΠΣΥϑΩΦ
ΥΣΒΟΤ∆ΣϑΘΥϑΠΟ3ΒΥΦΜϑΝϑΥϑΟΗΤΥΦΘ
/ΥΣ∃ρ∀51 /ΥΣ∃ρ∀%1 1 ϑ
3/∀1
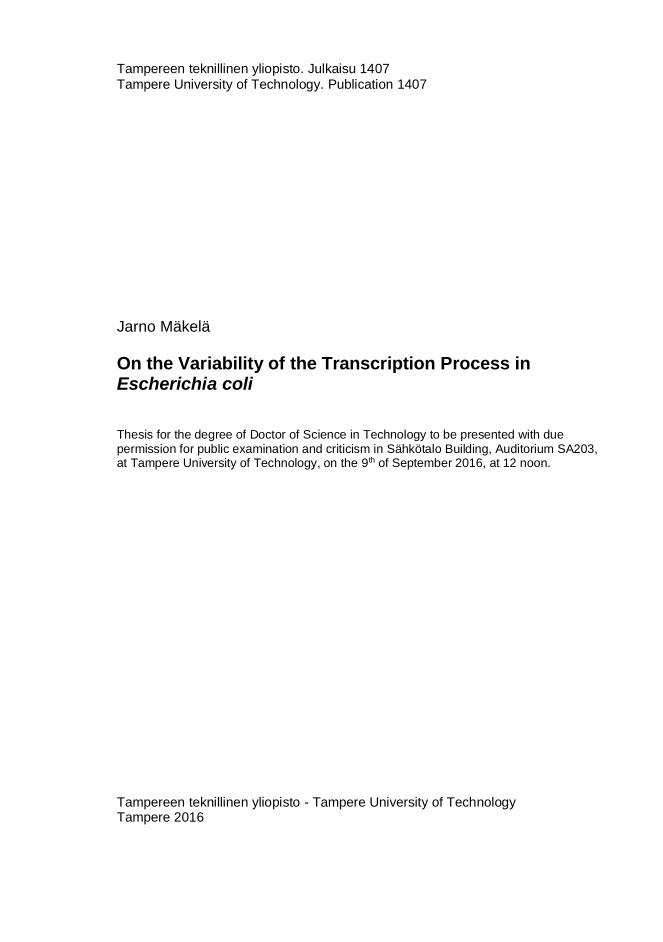
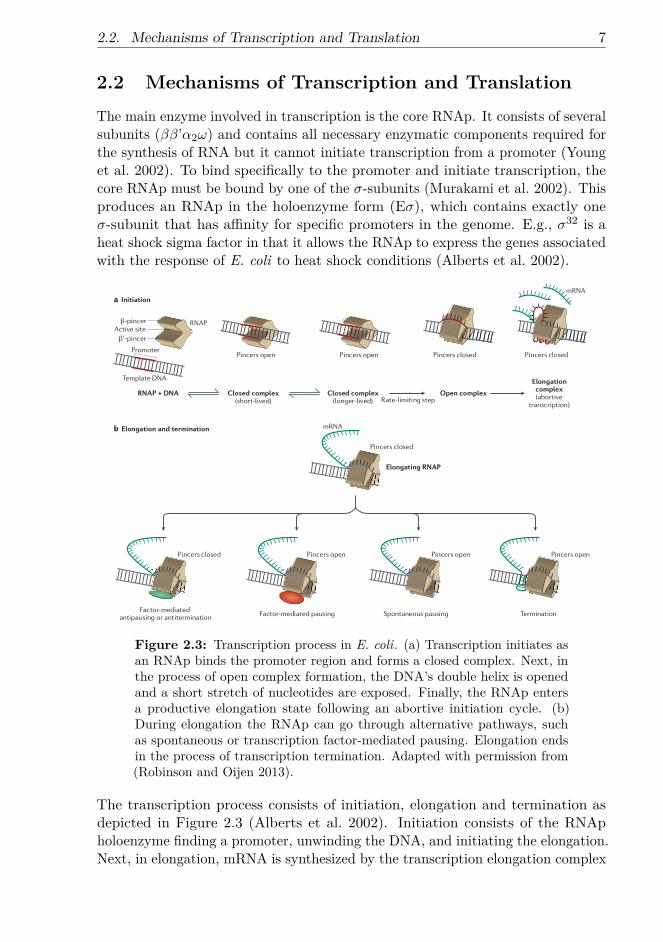
Figure 2.3: Transcription process in E. coli. (a) Transcription initiates asan RNAp binds the promoter region and forms a closed complex. Next, inthe process of open complex formation, the DNA’s double helix is openedand a short stretch of nucleotides are exposed. Finally, the RNAp entersa productive elongation state following an abortive initiation cycle. (b)During elongation the RNAp can go through alternative pathways, suchas spontaneous or transcription factor-mediated pausing. Elongation endsin the process of transcription termination. Adapted with permission from(Robinson and Oijen 2013).
The transcription process consists of initiation, elongation and termination asdepicted in Figure 2.3 (Alberts et al. 2002). Initiation consists of the RNApholoenzyme finding a promoter, unwinding the DNA, and initiating the elongation.Next, in elongation, mRNA is synthesized by the transcription elongation complex
8 Chapter 2. Biological Background
(TEC) moving along the DNA template in 3’ to 5’ direction. Reaching a specifictermination signal encoded into the DNA, elongation is terminated and a newlytranscribed mRNA is released. The termination signal typically destabilizes theTEC on the DNA by forming an secondary RNA structure. In prokaryotes,translation can initiate as soon as the 5’ end of an mRNA including a ribosomebinding site (RBS) is synthesized (Miller et al. 1970; Yarchuk et al. 1992).
A translation cycle, similar to transcription, consists of initiation, elongation andtermination. Translation in prokaryotes is conducted by ribosomes that are highlycomplex molecular machines consisting of ribosomal proteins and specialized RNAmolecules (rRNAs). E. coli ribosome (70S) consists, as in other species, of twomain sub-units: a small (30S) and a large (50S) subunit (Ramakrishnan 2002).The small subunit contains a 16S RNA subunit and 21 proteins. The large subunitcontains a 5S RNA subunit, a 23S RNA subunit and 31 proteins.
Translation is initiated at the start codon AUG, which is recognized by a specialinitiator tRNA carrying N -formylmethionine (fMet). mRNA contains the RBSconsisting of a specific Shine-Dalgarno sequence which is located upstream ofthe initiation codon (Ramakrishnan 2002). The RBS is recognized by the 16SrRNA of the ribosome. To initiate translation, first, the small ribosomal subunit(30S) of the ribosome binds to the RBS of the mRNA and fMet-tRNA bindsto the P-site forming a 30S-RNA complex (Ramakrishnan 2002). Next, thelarge ribosomal subunit (50S) binds to the complex to complete the ribosome(70S) and initiates the translation elongation. During the elongation, transferRNAs (tRNAs), carrying specific amino acids, bind to the appropriate codonsin mRNA and with the help of the ribosome, an amino acid is added to thegrowing polypeptide until stop codon is reached (Ramakrishnan 2002). Followingthis, a release factor binds to the ribosome releasing both the ribosome and thecompleted polypeptide.
2.2.1 Transcription Initiation
Transcription initiation in prokaryotes is a complex, multi-stepped process that hasbeen observed to include three main steps: binding, isomerization and promoterclearance (McClure 1985; Saecker et al. 2011):
R + P KB←→ RPCkf−→ RPO →→→ RNA (2.1)
This scheme was first suggested by Walter, Zillig and colleagues (McClure 1985;Walter et al. 1967; Chamberlin 1974). It involves binding of a holoenzyme (R) to apromoter (P) with an equilibrium binding constant, KB, to form a closed complex,RPc, which subsequently isomerizes with a rate constant kf to form a stable opencomplex, RPo. After an initial RNA synthesis, the RNAp breaks its interactionswith the promoter and enters into an elongation phase. Various alterations of this
2.2. Mechanisms of Transcription and Translation 9
scheme exist in different promoters and these may include additional steps andequilibrium reactions.
A promoter region in E. coli is defined by a consensus sequence at -10 and -35positions upstream of the transcription start site (Cho et al. 2009; Harley andReynolds 1987). The highly conserved consensus sequence is required for theRNAp holoenzyme to recognize the transcription initiation site (Hippel et al.1984). To initiate transcription, the holoenzyme must first find and bind to thepromoter. DNA binding proteins have been shown to find the target site fasterthan the 3D diffusion limit (Riggs et al. 1970). To achieve this, additional searchmechanisms such as 1D sliding, 1D hopping and inter-segment transfer are likelynecessary (Dangkulwanich et al. 2014; Hammar et al. 2012). The holoenzyme isknown to adhere only weakly to non-specific DNA and to slide rapidly along theDNA molecule until it dissociates from it, unless a start site is found (McClure1985). Recent studies tracking single fluorescent holoenzymes in vitro reportedthat long-range 1D sliding does not significantly affect the search times (Friedmanet al. 2013; Wang et al. 2013). Nevertheless, the exact contribution of differentmechanisms for the binding of the holoenzyme to the promoter region have notbeen thoroughly quantified in live cells. Once the holoenzyme finds the promoter,it recognizes the promoter site by making specific contacts with the bases thatare exposed on the outside of the helix in the consensus sequence (Alberts et al.2002).
Following the binding of the holoenzyme to the promoter, the holoenzyme unwindsthe DNA’s double helix and exposes a short stretch of nucleotides on each strand.This does not require ATP energy in σ70 promoters as it is achieved through areversible structural change of the holoenzyme-DNA complex that is more favorablethan the initial state (Alberts et al. 2002). The consequent isomerization into theopen complex form is found to contain at least three intermediate steps, namelyDNA loading, DNA unwinding, and assembly of the polymerase clamp (Saeckeret al. 2011). To enter the elongation phase of transcription, the holoenzyme goesthrough an abortive initiation cycle before committing to elongation (Goldmanet al. 2009; Hsu 2002). Consequently, the holoenzyme synthesizes small transcriptsof length up to 10 nucleotides. The abortive initiation is shown to occur via a’scrunching’ mechanism, in which the holoenzyme remains stationary while thedownstream DNA is pulled into the active site (Revyakin et al. 2006; Kapanidiset al. 2006). After initial RNA synthesis, the holoenzyme breaks its interactionwith the promoter and finally enters into elongation phase. The exact momentof σ70 release remains unclear and it has been suggested to remain bound topromoter, be released in beginning of elongation, or be retained in TEC (Bar-Nahum and Nudler 2001; Kapanidis et al. 2005; Raffaelle et al. 2005; Harden et al.2016). A recent study using in vitro techniques showed that a substantial fractionof elongating TEC retained the σ70-factor throughout elongation (Harden et al.2016).
10 Chapter 2. Biological Background
Regulation of the steps in transcription initiation have been traditionally studiedwith abortive initiation and in vitro transcription assays (Buc and McClure 1985;McClure et al. 1978; McClure 1980; Lutz et al. 2001). The open complex formationrate can be derived from the delay of reaching the steady-state production ofthe abortive product assays (McClure et al. 1978; McClure 1980). The closedcomplex formation is dependent on the RNAp concentration, which allows itto be distinguished from the open complex formation (Buc and McClure 1985).This dependence of the lag time for the RNAp concentration allows drawing aτ -plot, which portrays a direct relationship between lag times and the reciprocalRNAp concentration (McClure 1980; Patrick et al. 2015). From this plot, theslope yields the mean time for the closed complex formation and the interceptgives the mean time for the open complex formation. Compared to the timerequired for elementary steps in enzyme catalyzed reactions, the observed lagsare much longer, spanning from a few seconds to several minutes. As such, theseprocesses are rate-limiting for transcription initiation (McClure 1985; Saeckeret al. 2011). Studies of transcription reactions in vitro have also showed thatthe reactions times were sequence-dependent as they differed between promoters(Bertrand-Burggraf et al. 1984; McClure 1985; Saecker et al. 2011).
More recent techniques, based kinetic and intermediate trapping experiments,as well as footprinting and crystallographic analysis, have identified multipleintermediate steps during the initiation (Sclavi et al. 2005; Davis et al. 2007;Saecker et al. 2011). Recently, in vitro single-molecule fluorescence spectroscopywas used to visualize the rate-limiting steps in transcription initiation includingbinding, open complex formation, transcript production, and σ54 dissociation(Friedman and Gelles 2012). The main steps of the initiation process, includingreversible intermediates, were characterized. The isomerization step was found tolimit the initiation rate, in agreement with previous findings of DNA supercoilingaltering initiation rates in certain σ54-dependent promoters (Amit et al. 2011;Huo et al. 2006).
Compared to in vitro environment, in vivo measurements of the transcriptioninitiation rates are much more complicated to execute. Most studies quantifyingthe transcription process have used measurements of the heterogeneity in numberof RNAs per cell e.g., using FISH (Jones et al. 2014; So et al. 2011). Themeasurements have shown that the sequence-dependent transcription initiationprocess dictates both the mean and variability in mRNA numbers (Jones et al.2014). Aside from the observed population variability, recent in vivo single-RNA level measurements have quantified the time intervals between consecutiveproduction events in single cells for various promoters (Kandhavelu et al. 2011;Kandhavelu et al. 2012a; Kandhavelu et al. 2012b; Muthukrishnan et al. 2012).These studies proposed that the distributions of time intervals could not beexplained by a single elementary step. Thus, it was suggested that the dynamicscould be explained by multiple rate-limiting steps in transcription in line with theresults from in vitro studies. Alternatively, the nature of the rate-limiting steps
2.2. Mechanisms of Transcription and Translation 11
may correspond to other mechanisms than elementary steps in the transcriptioncycle.
In Publication II, measurements of time intervals between consecutive produc-tion events were conducted to study the transcription process. In PublicationIII the closed complex formation, open complex formation and abortive initiationwere included in the models to accurately depict the transcription initiationprocess.
2.2.2 Transcription and Translation Elongation
The transcription elongation phase initiates as the RNAp clears the promoterregion. In this phase, the transcription elongation complex (TEC) incorporatesnucleotides into the nascent RNA chain while advancing on the DNA template.In active translocation, the TEC has been shown to move up to 50 bp/s (Greiveand Von Hippel 2005; Proshkin et al. 2010). The movement of TEC occursin discontinuous manner as the TEC, also exhibits pausing or even backwarddiffusion on the template (Greive and Von Hippel 2005). As such, pausing cansignificantly reduce the overall transcription rate during elongation. The durationof pauses has been shown to vary from less than a second to minutes (Herbertet al. 2006; Herbert et al. 2010; Landick 2009). The pauses can be divided intotwo categories: short ’ubiquitous’ pauses and longer-lived pauses that often arestabilized by backtracking or formation of a hairpin structure in the nascentRNA (Landick 2006). Transcription factors and the DNA sequence have beenshown to affect the dynamics of pausing, e.g. the transcription factor NusG canincrease the overall transcription rate by both enhancing elongation rate anddecreasing the entry rate into long-lifetime, backtracked pause states (Herbertet al. 2010). Also, retained σ-factors have been shown to affect the recognition of aclass of transcriptional pause sequences while appearing similar in elongation rates(Harden et al. 2016). Aside pauses, transcription elongation has the alternativepathways of premature termination, pyrophosphorolysis, misincorporation orediting (Arndt and Chamberlin 1988; Greive and Von Hippel 2005; Erie et al.1993).
Translation elongation occurs in a discontinuous manner as series of transloca-tion–pause events takes place in the movement (Wen et al. 2008)(see Figure 2.4).The ribosome moves three bases (which corresponds to one codon) at a time,followed by a peptide-bond formation between amino-acids. The latter defines theoverall rate of translation and is also dependent on the secondary structure of themRNA. Additionally, longer pauses during elongation were observed and thesemay lead to translational frameshifting (Farabaugh 1996) and protein misfolding(Kimchi-Sarfaty et al. 2007). Ribosomes stalled on the mRNA can be rescued bytransfer-messenger RNA (tmRNA), which releases the ribosome by terminatingtranslation prematurely (Moore and Sauer 2005). Approximately 0.4 per cent ofall in vivo translations are prematurely terminated.
12 Chapter 2. Biological Background
& 1 ∀
& 1 ∀ & 1 ∀
& 1 ∀
& 1 ∀
& 1 ∀44
Υ3/∀
∀ΝϑΟΠΒ∆ϑΕ
Ν3/∀ ΒΒΥ3/∀ΕΦΜϑΩΦΣΖ
#ΜΤ∃ΒΝ1ΝΟ4ΘΣ
∃ΒΘ∋ςΤ)ΖΗ#/ΦΠ1ΒΣ4ΘΥ5ΙΤ7ϑΠ
∋ςΤ
/ΒΤ∆ΦΟΥΘΠΜΖΘΦΘΥϑΕΦ
3Φ∆Ζ∆ΜϑΟΗ
∗ΟϑΥϑΒΥϑΠΟ
1ΦΘΥϑΕΦΧΠΟΕΓΠΣΝΒΥϑΠΟ
5ΣΒΟΤΜΠ∆ΒΥϑΠΟ
5ΦΣΝϑΟΒΥϑΠΟ
&ΜΠΟΗΒΥϑΠΟ∆Ζ∆ΜΦ
/ΒΤ∆ΦΟΥ∆ΙΒϑΟΦΜΠΟΗΒΥϑΠΟ
∀ΩΟ&ΩΟ5ΙΤ
&ΣΖ4#5ΦΜ
#ΜΤ∃ΒΝ∃ΜΟ−Ο[1Μς1ΝΟ4∀4ΘΣ
4ΥΘ5ΦΥ5ϑΗ&ΕΦ,ΤΗ1∆Υ5ΙΧ & 1 ∀
&∋5ς(51
&∋((51
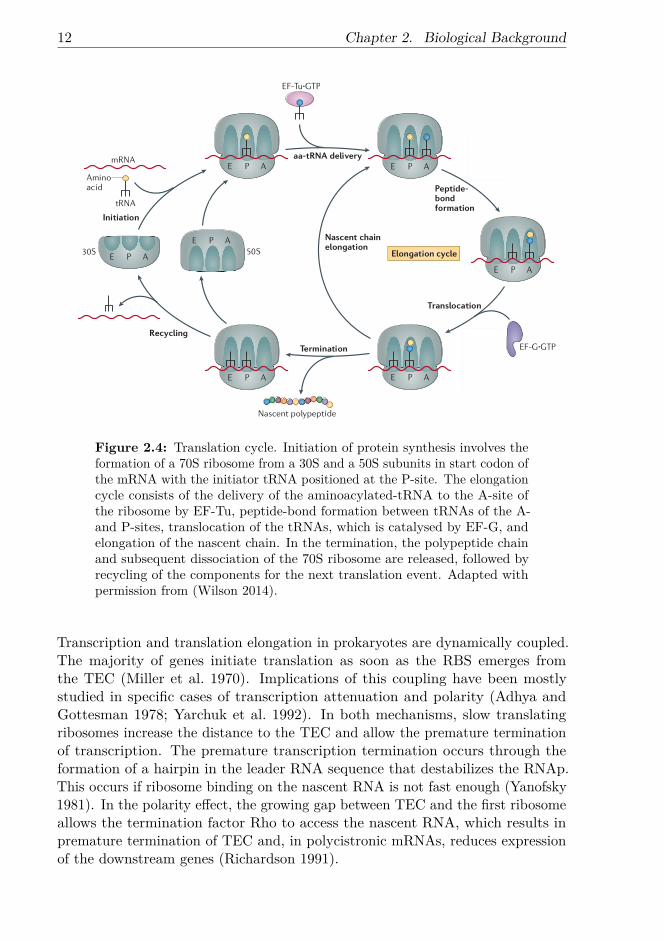
Figure 2.4: Translation cycle. Initiation of protein synthesis involves theformation of a 70S ribosome from a 30S and a 50S subunits in start codon ofthe mRNA with the initiator tRNA positioned at the P-site. The elongationcycle consists of the delivery of the aminoacylated-tRNA to the A-site ofthe ribosome by EF-Tu, peptide-bond formation between tRNAs of the A-and P-sites, translocation of the tRNAs, which is catalysed by EF-G, andelongation of the nascent chain. In the termination, the polypeptide chainand subsequent dissociation of the 70S ribosome are released, followed byrecycling of the components for the next translation event. Adapted withpermission from (Wilson 2014).
Transcription and translation elongation in prokaryotes are dynamically coupled.The majority of genes initiate translation as soon as the RBS emerges fromthe TEC (Miller et al. 1970). Implications of this coupling have been mostlystudied in specific cases of transcription attenuation and polarity (Adhya andGottesman 1978; Yarchuk et al. 1992). In both mechanisms, slow translatingribosomes increase the distance to the TEC and allow the premature terminationof transcription. The premature transcription termination occurs through theformation of a hairpin in the leader RNA sequence that destabilizes the RNAp.This occurs if ribosome binding on the nascent RNA is not fast enough (Yanofsky1981). In the polarity effect, the growing gap between TEC and the first ribosomeallows the termination factor Rho to access the nascent RNA, which results inpremature termination of TEC and, in polycistronic mRNAs, reduces expressionof the downstream genes (Richardson 1991).
2.2. Mechanisms of Transcription and Translation 13
The transcription elongation rate is strongly affected by the rate of translationelongation (Proshkin et al. 2010). Slowing down translation elongation usingantibiotics or slow-to-translate codons reduces the transcription elongation rateas well. The first ribosome in the nascent RNA has been proposed to assist TECduring elongation, by preventing backward translocation and pausing (Proshkin etal. 2010). This cooperative mechanism is believed to prevent discrepancy betweentranscription and translation efficiencies in different genes and environments.
Translation rates have been shown to be codon-specific (Sørensen et al. 1989;Sørensen and Pedersen 1991). The redundancy between codons (64) and aminoacids (20) allows an additional level of regulation for translation. E.g. synonymouscodons do not change the encoded protein but they can affect translation elonga-tion. Two synonymous codons, read by the same tRNA species, were translatedwith a threefold difference in rate, which implies that the difference in translationrates are not caused only due to differences in tRNA abundances (Pedersen 1984).The extent of slow translating codons promoting queue formation and causingcollisions between ribosomes was studied using stochastic models of translationwith different codon translation rates (Mitarai et al. 2008). The simulationssuggest that traffic and collisions frequently affect the efficiency of translation.
The average translation efficiency of a sequence, i.e. the protein yield, has beentraditionally analyzed with the Codon Adaptation Index (CAI) (Sharp and Li1987). To estimate the translation efficiency of a specific sequence, a given sequenceis compared to a reference set of highly expressed genes. Nevertheless, a studyutilizing a synthetic library of 154 synonymous sequences of GFP found no strongcorrelation with the CAI and gene expression levels (Kudla et al. 2009). This wasproposed to be due to the CAI increasing the elongation rate but the translationinitiation remaining the rate-limiting step in translation. The expression levels ofindividual genes were also proposed to be more affected by the mRNA secondarystructures. The CAI was proposed to have more influence on global translationefficiency and cellular fitness.
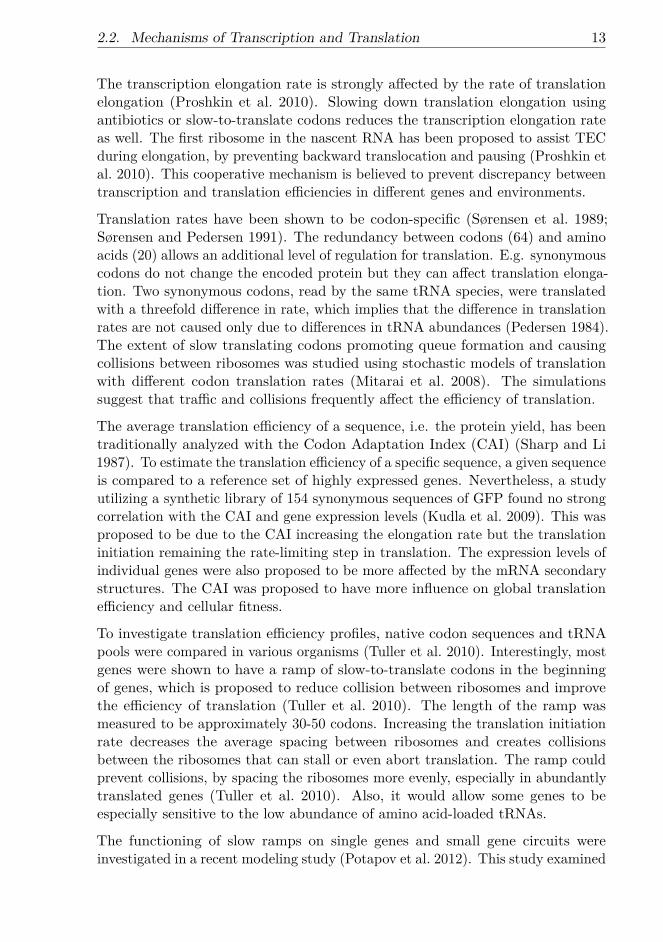
To investigate translation efficiency profiles, native codon sequences and tRNApools were compared in various organisms (Tuller et al. 2010). Interestingly, mostgenes were shown to have a ramp of slow-to-translate codons in the beginningof genes, which is proposed to reduce collision between ribosomes and improvethe efficiency of translation (Tuller et al. 2010). The length of the ramp wasmeasured to be approximately 30-50 codons. Increasing the translation initiationrate decreases the average spacing between ribosomes and creates collisionsbetween the ribosomes that can stall or even abort translation. The ramp couldprevent collisions, by spacing the ribosomes more evenly, especially in abundantlytranslated genes (Tuller et al. 2010). Also, it would allow some genes to beespecially sensitive to the low abundance of amino acid-loaded tRNAs.
The functioning of slow ramps on single genes and small gene circuits wereinvestigated in a recent modeling study (Potapov et al. 2012). This study examined
14 Chapter 2. Biological Background
the effects of codon sequences on the fluctuations of gene expression using stochasticmodels of coupled transcription and translation at the codon level (first publishedin Publication IV). The model supports the hypothesis of slow ramps reducingribosomal jams by reducing the rate of translation initiation. Also, the modelproposed that the mean and noise in the protein numbers can be separatelyregulated by the coding sequence.
Noise propagation from transcription initiation to protein expression was studiedin Publication IV. The stochastic model incorporates the transcription modelat the nucleotide level, that includes transcription initiation, pausing, prematuretermination, and accounts for the RNAp footprint in the DNA template (Ribeiro etal. 2009). The translation model at the codon level includes translation initiation,codon-specific translation rates, stalling, and accounts for the ribosome footprint(Mitarai et al. 2008). The model in Publication IV coupled the transcriptionand translation models to allow events to simultaneously affect both processes.
2.3 Regulation of TranscriptionTranscription in E. coli is a relatively rare event at the genome level (Taniguchiet al. 2010). Transcription is the main regulator of mRNA abundance, as mRNAdegradation rates cannot explain the observed abundance (Bernstein et al. 2002;Chen et al. 2015a). Degradation has been proposed to have an alternative roleas a regulator of abundance, e.g. in response to environmental perturbations.Additionally, at the ensemble level, the mean mRNA and respective protein levelswere found to be only moderately correlated (Taniguchi et al. 2010).
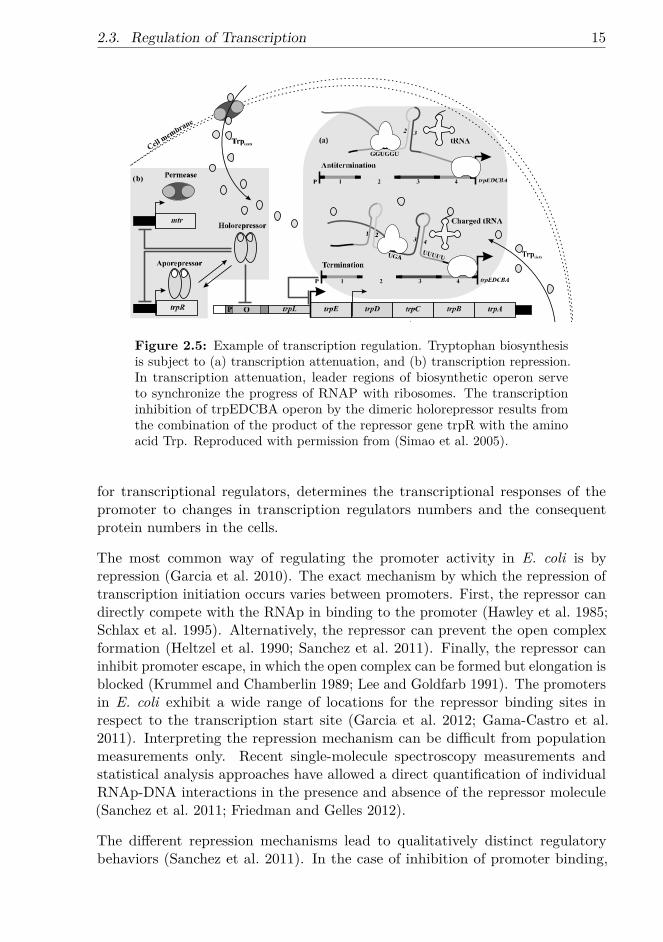
The regulation of transcription primarily occurs during the main steps of initiation:promoter binding, isomerization and promoter escape (Browning and Busby 2004).The most common mechanism by which regulation occurs is the binding of atranscription factor at the promoter region. Globally, the concentration andactivity of RNAp can be used to regulate transcription initiation (Bremer andDennis 1996; Klumpp et al. 2009). Transcription can also be regulated duringelongation in specific leader sequences that can terminate the elongation. E.g., intryptophan attenuation, if the concentration of charged tRNAtrp is high enough,transcription is terminated by a RNA hairpin structure (Simao et al. 2005). Anexample of transcription regulation is shown in Figure 2.5.
2.3.1 Transcription Factor Dynamics
The regulation of transcription initiation by transcription factors is traditionallydescribed by the operator occupancy model. The transcription factor’s state,bound or not bound, determines the state of a gene, which will be not expressingor expressing, depending on the mode of regulation. Namely, the associationand dissociation of the transcription factor will turn the gene off and on. Thearchitecture of the promoter, i.e. the location of binding sites and their affinities
2.3. Regulation of Transcription 15
Figure 2.5: Example of transcription regulation. Tryptophan biosynthesisis subject to (a) transcription attenuation, and (b) transcription repression.In transcription attenuation, leader regions of biosynthetic operon serveto synchronize the progress of RNAP with ribosomes. The transcriptioninhibition of trpEDCBA operon by the dimeric holorepressor results fromthe combination of the product of the repressor gene trpR with the aminoacid Trp. Reproduced with permission from (Simao et al. 2005).
for transcriptional regulators, determines the transcriptional responses of thepromoter to changes in transcription regulators numbers and the consequentprotein numbers in the cells.
The most common way of regulating the promoter activity in E. coli is byrepression (Garcia et al. 2010). The exact mechanism by which the repression oftranscription initiation occurs varies between promoters. First, the repressor candirectly compete with the RNAp in binding to the promoter (Hawley et al. 1985;Schlax et al. 1995). Alternatively, the repressor can prevent the open complexformation (Heltzel et al. 1990; Sanchez et al. 2011). Finally, the repressor caninhibit promoter escape, in which the open complex can be formed but elongation isblocked (Krummel and Chamberlin 1989; Lee and Goldfarb 1991). The promotersin E. coli exhibit a wide range of locations for the repressor binding sites inrespect to the transcription start site (Garcia et al. 2012; Gama-Castro et al.2011). Interpreting the repression mechanism can be difficult from populationmeasurements only. Recent single-molecule spectroscopy measurements andstatistical analysis approaches have allowed a direct quantification of individualRNAp-DNA interactions in the presence and absence of the repressor molecule(Sanchez et al. 2011; Friedman and Gelles 2012).
The different repression mechanisms lead to qualitatively distinct regulatorybehaviors (Sanchez et al. 2011). In the case of inhibition of promoter binding,
16 Chapter 2. Biological Background
the transcription initiation rate is proportional to the RNAp binding rate to thepromoter, which can be reduced simply by increasing the repressor numbers. Byinhibiting the subsequent steps of transcription initiation, the transcription rateis controlled by the dissociation rate of the repressor from the promoter, whichis independent of the repressor numbers in the cell. In this case, the promoterkinetics, including the rate-limiting steps in initiation, have a major contributionon the dynamics of the repression, which makes the equilibrium occupancy modelnot always valid.
This is also supported by a recent experiment that characterized repression, byhaving binding sites artificially placed either upstream or downstream from apromoter in E. coli (Garcia et al. 2012). The strength of repression could notbe explained by the occupancy of binding site alone. In another study, a directmeasurement of transcription factor association and dissociation in live E. coli cellsshowed also inconsistencies of the operator occupancy model of gene regulation(Hammar et al. 2014). These findings suggest that these inconsistencies aremost likely due to non-equilibrium mechanisms in transcription initiation i.e. itsmultiple rate-limiting steps. To accurately dissect the regulation of transcription,the effect of promoter dynamics must thus be taken into account, e.g the locationsof binding sites, rate-limiting steps in transcription initiation, etc. (McClure 1985;Friedman and Gelles 2012; Garcia et al. 2012).
To investigate this issue, in Publication III a single nucleotide level model ofthe promoter region incorporated a mechanism of repression of transcription tostudy transcription initiation. In the model, regulatory molecules reserved specificspace on the DNA template and thus, depending on the location of the bindingsite, they either inhibited binding, opening of the DNA template or promoterescape.
2.3.2 Transcription Induction
In fluctuating environments, a single phenotype or behavior of a cell cannotbe optimal. To cope with this, cells developed the ability to adapt to differentenvironments by changing phenotypic state. In many cases, these adaptations aretriggered directly by signals from environment. In other cases, the switching isstochastic, in that the choices between phenotypes are, for the most part, maderandomly (Süel et al. 2007). A common example is persistence in E. coli: whileantibiotics kill most cells, a small sub-population of genetically identical butpersister cells survives (Lewis 2007). The commitment to these phenotypes isusually transient, i.e if a cell is allowed to grow long enough, the mixture of allphenotypes will be restored.
Novick and Weiner studying the lac operon in E. coli, proposed that the cellsswitched from a non-producing to a producing state through a single randomevent (Novick and Weiner 1957). Later, this event was found to be related to thecrossing of a critical threshold in permease concentration (Choi et al. 2008). The
2.3. Regulation of Transcription 17
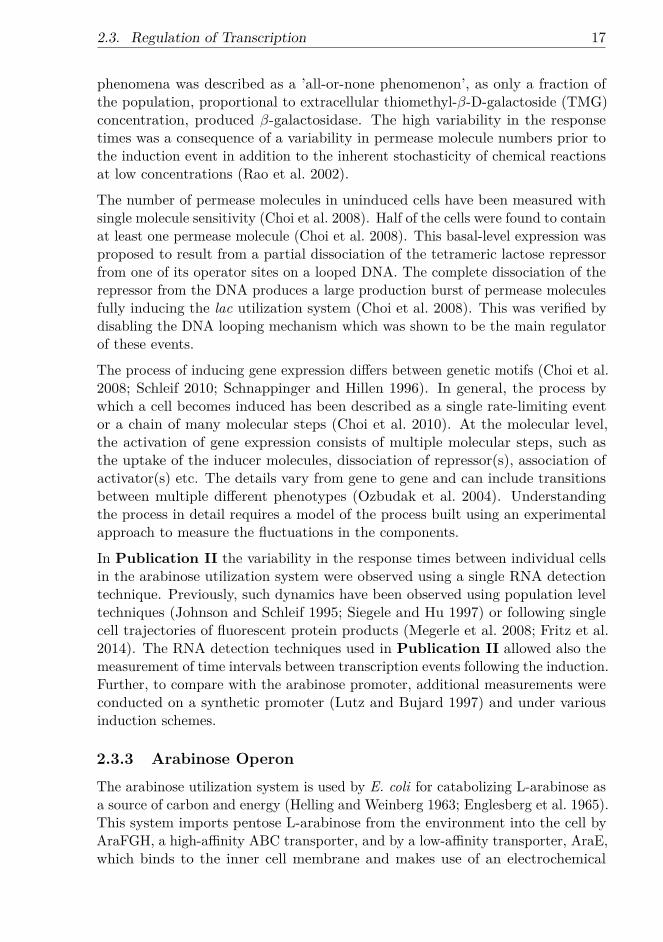
phenomena was described as a ’all-or-none phenomenon’, as only a fraction ofthe population, proportional to extracellular thiomethyl-β-D-galactoside (TMG)concentration, produced β-galactosidase. The high variability in the responsetimes was a consequence of a variability in permease molecule numbers prior tothe induction event in addition to the inherent stochasticity of chemical reactionsat low concentrations (Rao et al. 2002).
The number of permease molecules in uninduced cells have been measured withsingle molecule sensitivity (Choi et al. 2008). Half of the cells were found to containat least one permease molecule (Choi et al. 2008). This basal-level expression wasproposed to result from a partial dissociation of the tetrameric lactose repressorfrom one of its operator sites on a looped DNA. The complete dissociation of therepressor from the DNA produces a large production burst of permease moleculesfully inducing the lac utilization system (Choi et al. 2008). This was verified bydisabling the DNA looping mechanism which was shown to be the main regulatorof these events.
The process of inducing gene expression differs between genetic motifs (Choi et al.2008; Schleif 2010; Schnappinger and Hillen 1996). In general, the process bywhich a cell becomes induced has been described as a single rate-limiting eventor a chain of many molecular steps (Choi et al. 2010). At the molecular level,the activation of gene expression consists of multiple molecular steps, such asthe uptake of the inducer molecules, dissociation of repressor(s), association ofactivator(s) etc. The details vary from gene to gene and can include transitionsbetween multiple different phenotypes (Ozbudak et al. 2004). Understandingthe process in detail requires a model of the process built using an experimentalapproach to measure the fluctuations in the components.
In Publication II the variability in the response times between individual cellsin the arabinose utilization system were observed using a single RNA detectiontechnique. Previously, such dynamics have been observed using population leveltechniques (Johnson and Schleif 1995; Siegele and Hu 1997) or following singlecell trajectories of fluorescent protein products (Megerle et al. 2008; Fritz et al.2014). The RNA detection techniques used in Publication II allowed also themeasurement of time intervals between transcription events following the induction.Further, to compare with the arabinose promoter, additional measurements wereconducted on a synthetic promoter (Lutz and Bujard 1997) and under variousinduction schemes.
2.3.3 Arabinose Operon
The arabinose utilization system is used by E. coli for catabolizing L-arabinose asa source of carbon and energy (Helling and Weinberg 1963; Englesberg et al. 1965).This system imports pentose L-arabinose from the environment into the cell byAraFGH, a high-affinity ABC transporter, and by a low-affinity transporter, AraE,which binds to the inner cell membrane and makes use of an electrochemical
18 Chapter 2. Biological Background
potential to intake the arabinose (see Figure 2.6)(Hogg and Englesberg 1969;Schleif 2000; Lee et al. 1981). The AraJ protein of the utilization system is poorlycharacterized but it is thought to act as a transporter or an exporter of arabinosecontaining polymers (Schleif 2010). The dimeric AraC protein is the regulatoryprotein for all genes in the arabinose system with a copy-number of approximately20 molecules per cell (Schleif 2010).
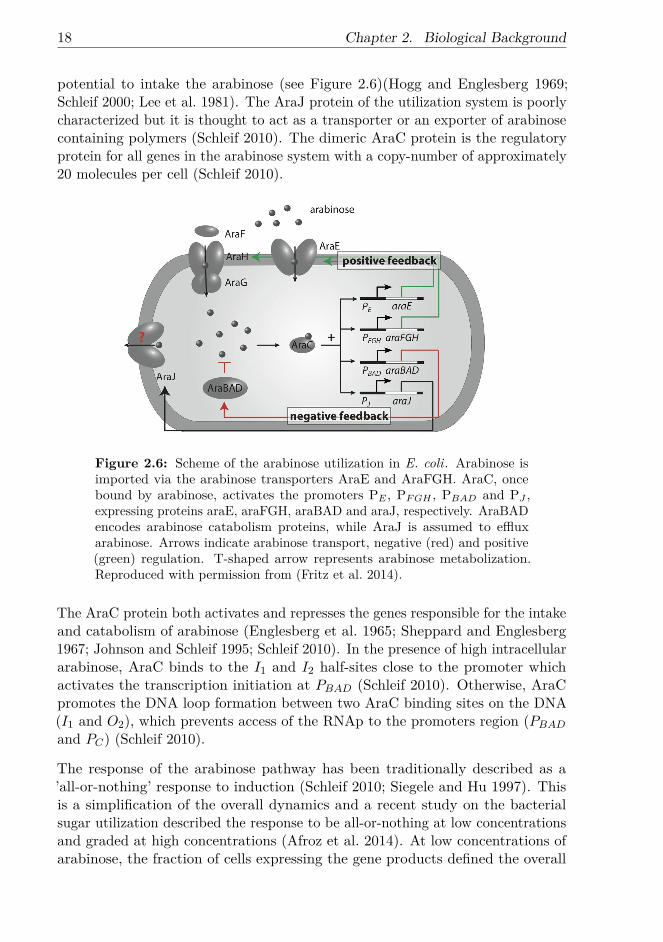
Figure 2.6: Scheme of the arabinose utilization in E. coli. Arabinose isimported via the arabinose transporters AraE and AraFGH. AraC, oncebound by arabinose, activates the promoters PE , PF GH , PBAD and PJ ,expressing proteins araE, araFGH, araBAD and araJ, respectively. AraBADencodes arabinose catabolism proteins, while AraJ is assumed to effluxarabinose. Arrows indicate arabinose transport, negative (red) and positive(green) regulation. T-shaped arrow represents arabinose metabolization.Reproduced with permission from (Fritz et al. 2014).
The AraC protein both activates and represses the genes responsible for the intakeand catabolism of arabinose (Englesberg et al. 1965; Sheppard and Englesberg1967; Johnson and Schleif 1995; Schleif 2010). In the presence of high intracellulararabinose, AraC binds to the I1 and I2 half-sites close to the promoter whichactivates the transcription initiation at PBAD (Schleif 2010). Otherwise, AraCpromotes the DNA loop formation between two AraC binding sites on the DNA(I1 and O2), which prevents access of the RNAp to the promoters region (PBADand PC) (Schleif 2010).
The response of the arabinose pathway has been traditionally described as a’all-or-nothing’ response to induction (Schleif 2010; Siegele and Hu 1997). Thisis a simplification of the overall dynamics and a recent study on the bacterialsugar utilization described the response to be all-or-nothing at low concentrationsand graded at high concentrations (Afroz et al. 2014). At low concentrations ofarabinose, the fraction of cells expressing the gene products defined the overall

2.4. Closely Spaced Promoters 19
expression. When exceeding the concentration when most cells are induced,further increases in the concentration lead to an increase in enzyme expression ina graded manner.
Recent studies have observed the activation dynamics of the arabinose utilizationsystem by following the gene expression trajectories in single cells (Megerle et al.2008; Fritz et al. 2014). The timing of activation and in the rates of accumulationof gene products have been shown to exhibit a wide cell-to-cell variability and thistiming variability has been shown to be dependent on the arabinose concentration.The variability in the importer molecules have been proposed to have a contributionto the diverse activation dynamics (Siegele and Hu 1997). Replacement of thepromoter responsible for the expression of AraE caused the population to producemore uniformly (Khlebnikov et al. 2001; Morgan-Kiss et al. 2002). Interestingly,the variability in timings of de-activation of gene expression upon removal ofarabinose was shown to be more homogeneous than the activation (Fritz et al.2014).
2.4 Closely Spaced Promoters
The genome of E. coli contains various configurations of promoters with closelyspaced transcription start sites (TSSs) (Gama-Castro et al. 2011). Approximately15 per cent of the promoters in E. coli are closely spaced (Gama-Castro et al.2011). Such arrangements have been commonly observed in bacterial genomesand in other organisms (Beck and Warren 1988; Häkkinen et al. 2011; Wang et al.2011).
The geometry of the promoters with closely spaced TSSs can be tandem (→→),divergent (←→), or convergent (→←) (McClure 1985; Beck and Warren 1988;Korbel et al. 2004). The closely spaced promoters can also be classified accordingto the function of the gene products (Beck and Warren 1988). In the first type,both transcripts code for structural proteins, e.g. bioA-bioBFCD (Nath and Guha1982). In the second type, one transcript codes for a regulatory molecule whilethe other codes for a structural protein, e.g. araC-araBAD (Schleif 2010). In thethird type, both transcripts code for regulatory molecules, e.g. cI-cro (Arkin et al.1998). In addition to differing in geometry, closely spaced promoters also differ inthe number of nucleotides between promoters and the location of the transcriptionfactor binding sites in respect to the TSSs (Gama-Castro et al. 2011).
A hypothesis for the existence of closely spaced promoters is that the proximityof the genes facilitates their transfer between species, especially for genes that arenon-essential (Lawrence and Roth 1996; Lawrence 2003). Also, the proximity ofessential genes could make them less likely to be disrupted by deletion or insertionof DNA (Fang et al. 2008). Nevertheless, the small distance between the promotersprovides unique opportunities for the regulation of the gene expression. RNApscan interact between each other directly or indirectly by affecting the binding of
20 Chapter 2. Biological Background
transcription factors (Shearwin et al. 2005). Such interactions are likely to affectthe transcription initiation kinetics in one or both promoters. Finally, it may allowthe same transcription factor to regulate the transcription of both promoters,especially in divergent promoters, where the transcription factor binding sites areoften centrally located (Beck and Warren 1988).
A
B
RNAp collision Roadblock
Sitting duck interference Occlusion
C
D
P1 P1
P1P1
P2
P2 P2
P2X
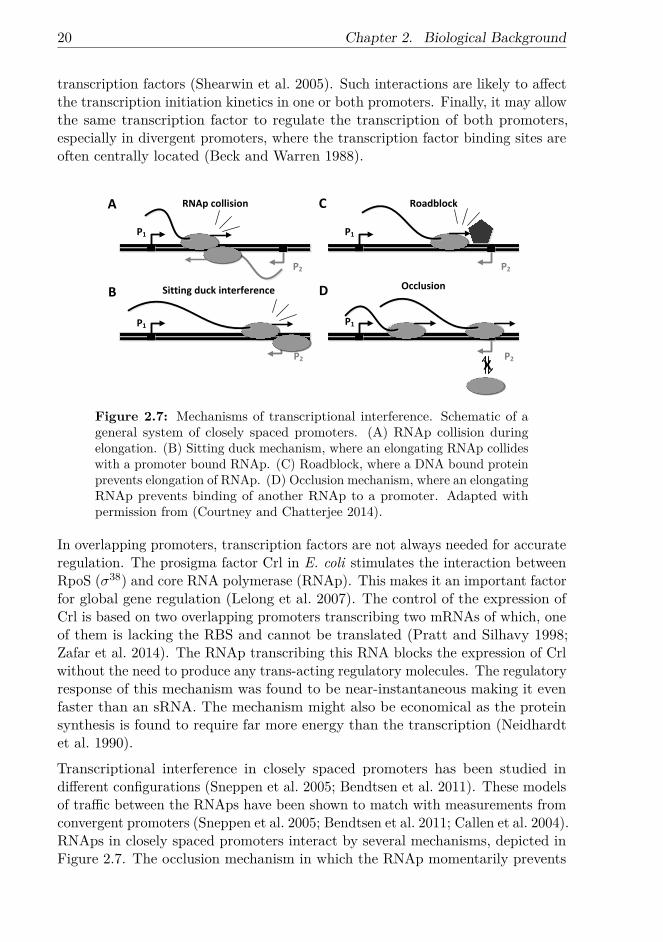
Figure 2.7: Mechanisms of transcriptional interference. Schematic of ageneral system of closely spaced promoters. (A) RNAp collision duringelongation. (B) Sitting duck mechanism, where an elongating RNAp collideswith a promoter bound RNAp. (C) Roadblock, where a DNA bound proteinprevents elongation of RNAp. (D) Occlusion mechanism, where an elongatingRNAp prevents binding of another RNAp to a promoter. Adapted withpermission from (Courtney and Chatterjee 2014).
In overlapping promoters, transcription factors are not always needed for accurateregulation. The prosigma factor Crl in E. coli stimulates the interaction betweenRpoS (σ38) and core RNA polymerase (RNAp). This makes it an important factorfor global gene regulation (Lelong et al. 2007). The control of the expression ofCrl is based on two overlapping promoters transcribing two mRNAs of which, oneof them is lacking the RBS and cannot be translated (Pratt and Silhavy 1998;Zafar et al. 2014). The RNAp transcribing this RNA blocks the expression of Crlwithout the need to produce any trans-acting regulatory molecules. The regulatoryresponse of this mechanism was found to be near-instantaneous making it evenfaster than an sRNA. The mechanism might also be economical as the proteinsynthesis is found to require far more energy than the transcription (Neidhardtet al. 1990).
Transcriptional interference in closely spaced promoters has been studied indifferent configurations (Sneppen et al. 2005; Bendtsen et al. 2011). These modelsof traffic between the RNAps have been shown to match with measurements fromconvergent promoters (Sneppen et al. 2005; Bendtsen et al. 2011; Callen et al. 2004).RNAps in closely spaced promoters interact by several mechanisms, depicted inFigure 2.7. The occlusion mechanism in which the RNAp momentarily prevents
2.5. Noise in Gene Expression 21
binding of an another RNAp to the promoter, was originally proposed to explainan upstream promoter inhibiting the activity of a downstream promoter (Adhyaand Gottesman 1982). This mechanism can cause a high level of interferencebetween convergent promoters and overlapping divergent promoters (Sneppenet al. 2005). The sitting duck mechanism describes the removal of promoter-bound complexes by the elongating RNAp from the opposing promoter (Sneppenet al. 2005; Callen et al. 2004). Finally, collisions between the RNAps elongatingin opposite directions causes termination of one or both RNAps (Ward andMurray 1979; Prescott and Proudfoot 2002; Sneppen et al. 2005). The amount ofinterference is also defined by the promoter-dependent kinetics of transcriptioninitiation.
The dynamics of gene expression from closely spaced promoters depends on manyfactors such as the transcription initiation kinetics, promoter orientation anddistances. Also, empirical data suggests that, in principle, any DNA bindingprotein can be used for both activation and repression of transcription, dependingon the promoter architecture (Bendtsen et al. 2011). Also, small changes in thelocation of the promoter sites and transcription factors can cause drastic changesin the behavior, suggesting that not only the sequence determining the locationof the binding sites but also the sequence between adjacent promoters may besubject to strong selective pressure (Garcia et al. 2012; Bendtsen et al. 2011).
In Publication III, stochastic single nucleotide models of closely spaced pro-moters were used to study the activity of the promoters as a function of thedistance between TSSs, geometry and locations of repressor binding sites. Also,coordination between the promoter sites and the favorable orientations wereinvestigated.
2.5 Noise in Gene Expression
Genetically identical cells in the same environment can exhibit significant amountof variation in molecular species and in the phenotype of the cell (Neubauerand Calef 1970; McAdams and Arkin 1997; Elowitz et al. 2002; Kaern et al.2005). This variability is often linked to stochasticity in gene expression causedby low copy number fluctuations. The regulation of transcription is mediated bymolecular events, such as binding of a molecule to a promoter, resulting fromrandom encounters between molecules that are inherently stochastic. Further,molecular fluctuations in one molecular species will act as a source of fluctuationsfor all other species it interacts with (Paulsson 2005; Elowitz et al. 2002). Thefluctuations in molecular species can be suppressed by some genetic motifs for morerobust functioning or amplified to enhance cell-to-cell heterogeneity (Paulssonand Ehrenberg 2001; Paulsson 2004).
To better understand the sources of variability that contribute to the overall cell-to-cell variability in gene expression, Elowitz and colleagues constructed strains
22 Chapter 2. Biological Background
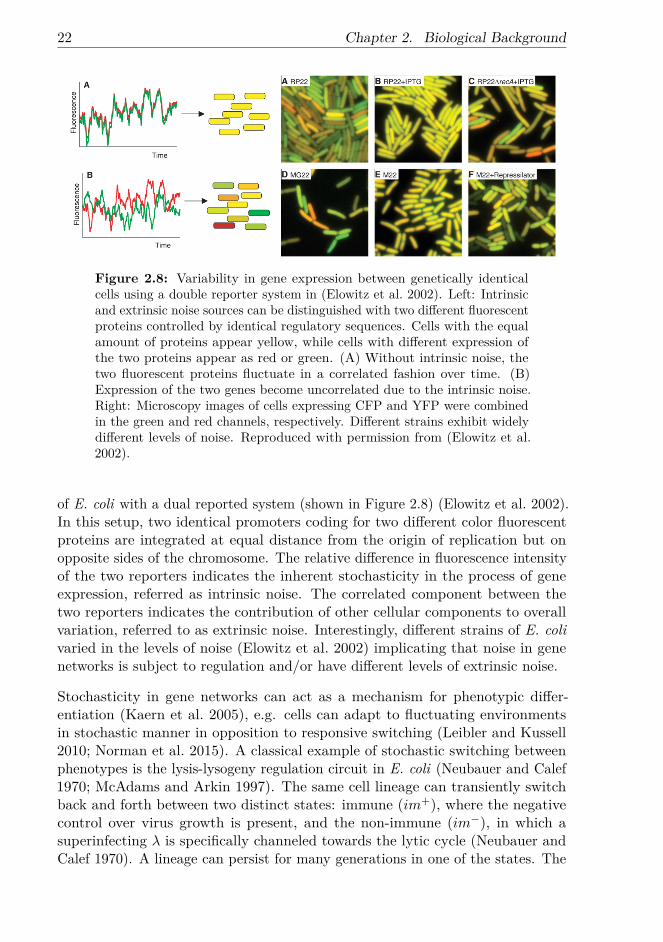
Figure 2.8: Variability in gene expression between genetically identicalcells using a double reporter system in (Elowitz et al. 2002). Left: Intrinsicand extrinsic noise sources can be distinguished with two different fluorescentproteins controlled by identical regulatory sequences. Cells with the equalamount of proteins appear yellow, while cells with different expression ofthe two proteins appear as red or green. (A) Without intrinsic noise, thetwo fluorescent proteins fluctuate in a correlated fashion over time. (B)Expression of the two genes become uncorrelated due to the intrinsic noise.Right: Microscopy images of cells expressing CFP and YFP were combinedin the green and red channels, respectively. Different strains exhibit widelydifferent levels of noise. Reproduced with permission from (Elowitz et al.2002).
of E. coli with a dual reported system (shown in Figure 2.8) (Elowitz et al. 2002).In this setup, two identical promoters coding for two different color fluorescentproteins are integrated at equal distance from the origin of replication but onopposite sides of the chromosome. The relative difference in fluorescence intensityof the two reporters indicates the inherent stochasticity in the process of geneexpression, referred as intrinsic noise. The correlated component between thetwo reporters indicates the contribution of other cellular components to overallvariation, referred to as extrinsic noise. Interestingly, different strains of E. colivaried in the levels of noise (Elowitz et al. 2002) implicating that noise in genenetworks is subject to regulation and/or have different levels of extrinsic noise.
Stochasticity in gene networks can act as a mechanism for phenotypic differ-entiation (Kaern et al. 2005), e.g. cells can adapt to fluctuating environmentsin stochastic manner in opposition to responsive switching (Leibler and Kussell2010; Norman et al. 2015). A classical example of stochastic switching betweenphenotypes is the lysis-lysogeny regulation circuit in E. coli (Neubauer and Calef1970; McAdams and Arkin 1997). The same cell lineage can transiently switchback and forth between two distinct states: immune (im+), where the negativecontrol over virus growth is present, and the non-immune (im−), in which asuperinfecting λ is specifically channeled towards the lytic cycle (Neubauer andCalef 1970). A lineage can persist for many generations in one of the states. The

2.5. Noise in Gene Expression 23
choice between the lysogenic or lytic pathways in individual cells have been shownto result from fluctuations in the protein numbers due to stochasticity in geneexpression (Arkin et al. 1998). This cell-to-cell variability in protein numbers ispresent even in cells that have not gone through the differentiation pathway.
Cell-to-cell variability in gene expression products, namely in mRNAs and pro-teins, have been intensively studied. The methodologies have improved to allowmeasurement of RNA and protein numbers with single molecule sensitivity insingle cells (Taniguchi et al. 2010; Golding et al. 2005; So et al. 2011; Jones et al.2014; Yu et al. 2006; Hensel et al. 2012). These measurements show that thestochasticity in the transcription and translation processes can only partiallyexplain the observed variability and part of the variability arises from extrinsicsources (Elowitz et al. 2002; Taniguchi et al. 2010). The exact contribution ofdifferent sources of fluctuations on the RNA and protein numbers is still unclear.Independent fluctuations from molecular species can contribute to the overallfluctuations by interacting with the transcription machinery. Also, fluctuationscan be propagated through molecular species, e.g. fluctuations in RNA numberscausing protein numbers to fluctuate (Paulsson 2005).
Transcription and translation are often assumed to follow Poisson processes wherethe production probabilities per time unit depend on the promoter occupancyand mRNA numbers, respectively (Paulsson 2005). However, transcription andtranslation are also known to be complex multi-step processes that exhibit widesequence-dependent dynamics (Saecker et al. 2011; Lutz et al. 2001; Jones et al.2014). Also, regulation of transcription has been shown to contribute to theobserved dynamics independently of TF occupancy (Garcia et al. 2012). Finally,steps in the transcription and translation elongation can fluctuate greatly (Herbertet al. 2006; Tuller et al. 2010). Unless a single elemental step in the overall processis rate-limiting, gene expression dynamics would exhibit non-exponential timeintervals between production events. Recent measurements of time intervalsbetween transcription events in live E. coli cells have reported non-Poissoniandynamics in various promoters (Kandhavelu et al. 2011; Kandhavelu et al. 2012b;Muthukrishnan et al. 2012). The shape of time interval distribution was shownto be less dispersed than Poisson process and depend on the promoter sequence,environmental conditions and induction conditions.
Additional diversity in RNA and proteins numbers have been proposed to arisefrom fluctuations in molecule species involved in gene expression such as σ-factors,transcription factors, ribosomes, and RNAps (Taniguchi et al. 2010; Bakshi et al.2012; Yang et al. 2014; Jones et al. 2014; Hensel et al. 2012). Other mechanismsnot directly related to gene expression such as DNA replication, negative DNAsupercoiling, DNA condensation by nucleoid proteins and asymmetries in proteinand mRNA partitioning during cell division have been also shown to contributeto the observed variability (Huh and Paulsson 2011; Sanchez and Golding 2013;So et al. 2011; Chong et al. 2014).
24 Chapter 2. Biological Background
Finally, cellular physiology strongly affects gene expression dynamics (Bremerand Dennis 1996; Klumpp et al. 2009). A recent study in E. coli reported thatfluctuations in gene expression of metabolic enzymes can perturb cell growth,which in turn can propagate back to gene expression, influence even genes unrelatedto metabolism (Kiviet et al. 2014). The interdependence between growth and geneexpression fluctuations was proposed to be important in coordinating metabolicactivities and growth homeostasis. It could also act as a generic source of cellularheterogeneity for the cell population (Balazsi et al. 2011).
3 Theoretical Background
This chapter is an overview of the theoretical concepts of simulation and modelingapproaches used in this thesis. It includes the basics about modeling biological sys-tems, a description of stochastic simulation methods and concepts of incorporatingcomplex biological processes involved in transcription and translation.
3.1 Chemical Master EquationMany biochemical processes involved in gene expression result from the interactionbetween chemical species that are present in very low copy numbers. E.g., DNA,RNA and regulatory proteins generally have only a few copies per cell (Taniguchiet al. 2010). Regarding the dynamics of interactions between such species, adescription of concentration alone is meaningless, and deterministic approaches arenot valid, which entails that discrete models are needed (Munsky and Khammash2008).
To accurately model the time evolution of a system of chemically reacting species,one would have to track each individual molecule through space, detect collisionsbetween the molecules and once a chemical reaction occurs change the populationsof the species. Chemical reactions are considered instantaneous and can bedivided into two categories: unimolecular reactions, which are internal processesof individual molecules, and bimolecular reactions, which result from the collisionand interaction between two molecules. In both cases, the exact timing of thereaction cannot be deduced (Gillespie 2007).
The dynamics of such systems cannot be described by a single trajectory of thesystem through the state space. Given the discrete nature and the stochastic timeevolution of the population, to accurately describe the dynamics of a such system,one must consider the probability distribution of states the system occupies at acertain time moment. For a discrete population of chemically reacting species,the time evolution of this probability distribution is described by the stochasticchemical kinetics (Gillespie 2007).
In the stochastic formulation, a system of molecules of N chemical species homo-geneously spread at a time t is represented by an N -dimensional vector x. Thesechemical species interact through M chemical reactions that can occur between
25

26 Chapter 3. Theoretical Background
the species and result in a change in the populations of the species. The system isassumed to have a constant volume and to be well-stirred, which allows the exacttrajectories of the particles and non-reactive collisions between them to be ignored(Gillespie 1977). As such, only molecular events that change the populations ofthe species need to be considered.
The change in the population of the species is a consequence of chemical reactionswhich are characterized by two quantities. One is the state-change vector vµthat defines the change in the population species x. The other is the propensityfunction aµ of reaction Rµ, which is defined as the following (Gillespie 2007):
aµ(x)dt = the probability that a particular combination of the moleculesthat are presently in the system will react via reaction Rµ inthe next infinitesimal time interval [t, t+ dt).
(3.1)
The rationale behind the propensity function depends on which of the two cate-gories the reaction belongs to. For unimolecular reactions, the underlying physics,which often can only be described in quantum mechanical terms, defines theexistence of a constant cµ that gives a probability that this particular moleculewill go through the reaction Rµ in the next infinitesimal time moment dt (Gillespie2007). Overall, the propensity function for X molecules of this species is:
aµ(x) = cµX (3.2)
For bimolecular reactions, the assumption of a well-stirred system and the kinetictheory define the existence of a constant cµ that is the probability that singlerandom pair of X1 and X2 molecules will react according to the reaction Rµ inthe next infinitesimal time window dt (Gillespie 2007). The propensity functionof this event is:
aµ(x) = cµX1X2 (3.3)
In the case of two molecules of the same species reacting together, the propensityfunction is (Gillespie 2007):
aµ(x) = cµX(X − 1)2 (3.4)
From 3.1 and the probability P (x, t|x0, t0) of having a given state vector x attime t after the initial conditions x = x0 at t = t0, the time-evolution equation forstochastic chemical kinetics can be derived according to the laws of probability
3.2. Stochastic Simulation Algorithm 27
(Gillespie 2007). The result is a partial differential equation for P called thechemical master equation (CME):
∂P (x, t|x0, t0)∂t
=M∑µ=1
[aµ(x− vµ)P (x− vµ, t|x0, t0)− aµ(x)P (x, t|x0, t0)] (3.5)
The CME determines the probability that each species will have a specifiedmolecular population at a given time in the future. The CME simultaneouslydescribes the probability of all possible trajectories as a set of coupled ODEs withone equation for every possible combination of the reactant species. Consequently,the CME can only be analytically solved for the probability density function ofX(t) for a few, very simple systems. To circumvent this problem, the MonteCarlo approach can be used. Namely, multiple numerical realizations of X(t)trajectories over t can be constructed, in order to sample the distribution of X(t).This approach was proposed by Gillespie to simulate chemical or biochemicalsystems of reactions (Gillespie 1976; Gillespie 1977).
3.2 Stochastic Simulation AlgorithmThe approach of simulating individual trajectories from X(t) is not based onP (x, t|x0, t0) but on a probability function p(τ, µ|x, t) (Gillespie 2007). Thisfunction defines the probability that given X(t) = x, the next reaction to occurin the system will be Rµ and it will occur in the next infinitesimal time interval[t, t+ dt).
This joint probability density function in a state x is a function of two randomvariables: the time to the next reaction (τ) and the index of the next reaction(µ). The exact formula for p(τ, µ|x, t) can be derived as before by applying thelaws of probability to the aforementioned premise 3.1 (Gillespie 1977):
p(τ, µ|x, t) = aµ(x)e−a0(x)τ (3.6)
where,
a0(x) =M∑µ=1
aµ(x) (3.7)
These equations (3.6 and 3.7) are the mathematical basis for the SSA. The timeto the next reaction τ is an exponential random variable with a mean of 1/a0(x)while the index of the next reaction µ is a statistically independent integer randomvariable with point probabilities aµ(x)/a0(x).
This formula is based on the fact that the distribution of the earliest next reactiontime is the distribution of the minimum of all next reaction times (see derivation of
28 Chapter 3. Theoretical Background
this method (Gillespie 1976)). The minimum of a set of independent exponentialdistributions with different rates is an exponential distribution with a rate equalto the sum of the individual exponentials’ rates (Gillespie 1976).
Several Monte Carlo procedures exist for generating samples of τ and µ accordingto these distributions. In the original formulation of the SSA two methods, thedirect method (DM) and the first reaction method (FRM) were proposed (Gillespie1976; Gillespie 1977). Since then, other sampling procedures such as the nextreaction method (NRM) (Gibson and Bruck 2000) and the logarithmic directmethod (LDM) (Li and Petzold 2006) have been proposed.
The original DM follows the standard inversion generating method of the MonteCarlo theory (Gillespie 1992): two random numbers r1 and r2 are generated fromthe uniform distribution. These two random numbers are used to generate τ andµ as follows:
τ = 1a0(x) ln( 1
r1) (3.8)
µ = the smallest integer satisfyingµ∑
µ′=1aµ′(x) > r2a0(x) (3.9)
With help of these formulas (or any other mentioned methods for generatingsamples of τ and µ), the exact distribution described by the CME can be sampled.The SSA can be used for constructing the exact numerical realization of theprocess X(t). Given a start time t0, a stop time tstop, and an initial vector ofspecies populations x0, the procedure of the SSA is given in Algorithm 1 (Gillespie1977).
Algorithm 1 : Stochastic Simulation Algorithm1: Set t← 0, and x← x0.2: With the system in state x at time t, evaluate all the aµ(x) and their suma0(x).
3: Using a suitable sampling procedure, generate a random pair (τ, µ) accordingto the joint probability distribution defined above by p(τ, µ|x, t).
4: Output the system state for each of the sampling points in the time interval[t, t+ τ).
5: If t+ τ ≥ tstop, terminate.6: Set t← t+ τ , and x← x + vµ.7: Go to step 2.
3.2.1 Delayed SSA
The SSA does not allow explicit delays to be simulated, as the time evolutionwould no longer be a pure Markov process. However, complex biological processes
3.2. Stochastic Simulation Algorithm 29
such as protein maturation take a non-negligible time to be completed (Cormacket al. 1996; Megerle et al. 2008). Also, transcription elongation, during whichthe RNAp transcribes thousands of nucleotides, can last up to several minutes(Greive and Von Hippel 2005). Importantly, delays in many cellular processeshave been shown to affect the dynamics of gene regulatory networks and, as such,they need to be considered in the simulations (Ribeiro et al. 2010).
The construction of explicit models for complex biological events might not evenbe possible, as all steps in the process might not be known even though theoverall duration of such events can be measured. Adding delays based on suchmeasurements or following arbitrary distributions allow to model these eventswithout knowing all details of the system. A version of the SSA was proposedthat allow introducing such events as ’delayed reactions’ (Gibson and Bruck 2000).In delayed reactions, the substrates are consumed instantaneously (i.e. removedfrom the system to avoid further reactions) but the products are released onlyafter a specific time lag. Using delays potentially allows removing many reactionsfrom the system without affecting its dynamics, which speeds up simulations(Gibson and Bruck 2000) without necessarily affecting the realism of the results. Alater implementation of the delayed SSA allows multiple delays for each reaction(Roussel and Zhu 2006).
To implement such simulations, reactions with delays can be stored in a waitlist L, which is sorted by the time of occurrence. The products of a reaction areplaced on the wait list L as a tuple (tr, i, n), where tr is the time at which then molecules of the species Si are to be released. A heap-based priority queuewith the same runtime boundaries can be implemented to run alongside the DMimplementation. The steps in this variant of the SSA execution (Roussel and Zhu2006) are shown in Algorithm 2. The NRM is also well befitted to run wait lists,as both reactions and a wait list can share the same priority queue (Gibson andBruck 2000).
Algorithm 2 : Delayed SSA1: Set t← 0, and x← x0. Create an empty wait list L for delayed reactions.2: Perform the normal SSA procedure to generate (τ, µ).3: If tmin < t+ τ , where tmin is the earliest entry in L then
Add the earliest molecule in L and add it to x.Set t← t+ tmin.
4: ElseSet t← t+ τ , and x← x + vµ.If reaction µ has delayed products then
Add them to L.5: Go to step 2.
30 Chapter 3. Theoretical Background
3.3 Modeling Gene ExpressionThe models built in the stochastic formulation, for simplicity, are represented hereas a set of chemical reactions. In general, reactions are presented as follows:
A + B k−→ C (3.10)
Here, one molecule of the species A and and one molecule of species B react toform a molecule of species C, with a stochastic rate constant cµ = k.
When modeling gene expression, only the most important steps affecting theoverall behavior are included (Ribeiro et al. 2006). For example, the binding ofan RNAp to a promoter, the transcription of an RNA followed by the translationof proteins can be modeled as a single, compact reaction, as follows:
Pro + RNAp kt−→ Pro + RNAp + nP (3.11)
Here, Pro represents the promoter of the gene, RNAp is an RNA polymeraseholoenzyme, P is the protein produced and n is the number of proteins producedfrom a single RNA molecule. Note that the promoter is always available as noregulation have been imposed on the gene making the gene produce in a constitutivemanner. Also note that this compaction results in an oversimplification of themodel, in that the number of proteins translated from a single RNA is a constant,when this is not true in real biosystems. Another oversimplification is that thismodel does not account for, e.g. noise in translation.
In reality, the transcription and translation processes are separate and conductedby different macromolecules. To account for this in the model, these processes needto described as separate reactions. This model is already capable of recreatingvariability in number of proteins produced per mRNA (Yu et al. 2006; Zhu et al.2007).
Pro + RNAp kt−→ Pro + RNAp + RBS (3.12)
RBS + Rib ktr−→ RBS + Rib + P (3.13)
In this model, RBS is the binding site for ribosomes in the mRNA, and Rib isthe ribosome. This model, while far more realistic than the former one, it stilllacks some features of gene expression, such as, e.g., effects of traffic in elongationribosomes and RNA polymerases.
To model the temporal RNA and protein number in cells, the degradation of thesespecies must accounted for. Both production and degradation processes affect themean and noise in the RNA and protein numbers (Paulsson 2005). Degradation ofRNAs and proteins is also an important factor in the dynamics of genetic circuits
3.3. Modeling Gene Expression 31
as it dictates the time to reach a steady-state. In prokaryotes, both mRNAs andproteins have been shown to exhibit exponential-like degradation (Taniguchi et al.2010; Bernstein et al. 2002; Chen et al. 2015a). In other species, this might notbe true (Pedraza and Paulsson 2008). Degradation of mRNAs and proteins arethus modeled as follows:
RBS krbsd−→ (3.14)
P kd−→ (3.15)
The stochastic mRNA production and decay, in which mRNA production eventsare uncorrelated and memoryless, is described by a Poisson distribution, for whichthe variance is equal to the mean. For proteins, the variance is usually higherthan the mean as they are produced in bursts from mRNA, i.e. each mRNA istranslated several times and these events are separated by much shorter intervalsthan the intervals between transcription events. Further, the propagation offluctuations from RNA to proteins is dependent on the lifetimes of both RNA andproteins (Paulsson 2005).
Previous models presented here assume transcription and translation to be instan-taneous. In reality, transcription initiation, elongation in both transcription andtranslation, and protein maturation involves series of chemical reactions whichtakes a considerable time and thus affect the numbers and fluctuations in mRNAand protein species (McClure 1985; Pedraza and Paulsson 2008; Cormack et al.1996). The dynamics of these events are gene specific and are known to affect thedynamics of genetic motifs (e.g. with feedback loops) (Bratsun et al. 2005; Ribeiroet al. 2006; Gaffney and Monk 2006). A complex process of transformation fromspecies A to species B can be described by n-step reaction:
A k1−→ S1k2−→ S2 . . . Sn−2
kn−1−→ Sn−1kn−→ B (3.16)
A k−→ B(τ) (3.17)
Multi-step reaction 3.16 can be shortened as reaction 3.17. Here, while thereacting molecule is immediately removed from the system, the produced moleculeB is not available to react until τ time has passed. The delays with specificdistributions allow to model complex dynamics without explicitly knowing thereactions underlying the dynamics, provided that the overall dynamics is known.Note that, during the delay, the product cannot interact with other species or gothrough unimolecular reactions such as degradation. In general, this approximationhas little effect on the dynamics of genetic motifs and can thus be made.
Gene expression with delayed products can be written as the follows:
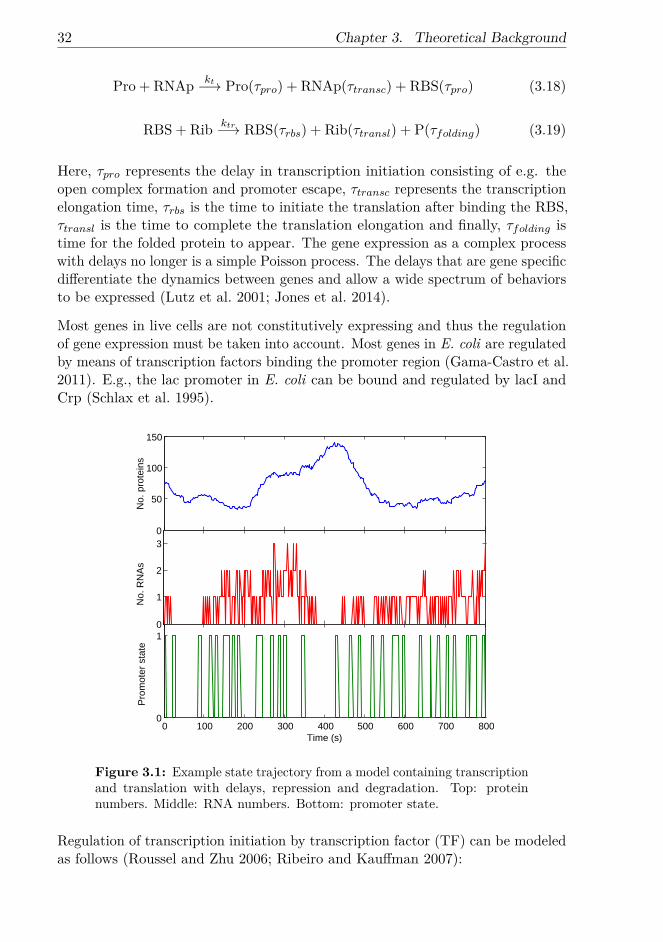
32 Chapter 3. Theoretical Background
Pro + RNAp kt−→ Pro(τpro) + RNAp(τtransc) + RBS(τpro) (3.18)
RBS + Rib ktr−→ RBS(τrbs) + Rib(τtransl) + P(τfolding) (3.19)
Here, τpro represents the delay in transcription initiation consisting of e.g. theopen complex formation and promoter escape, τtransc represents the transcriptionelongation time, τrbs is the time to initiate the translation after binding the RBS,τtransl is the time to complete the translation elongation and finally, τfolding istime for the folded protein to appear. The gene expression as a complex processwith delays no longer is a simple Poisson process. The delays that are gene specificdifferentiate the dynamics between genes and allow a wide spectrum of behaviorsto be expressed (Lutz et al. 2001; Jones et al. 2014).
Most genes in live cells are not constitutively expressing and thus the regulationof gene expression must be taken into account. Most genes in E. coli are regulatedby means of transcription factors binding the promoter region (Gama-Castro et al.2011). E.g., the lac promoter in E. coli can be bound and regulated by lacI andCrp (Schlax et al. 1995).
0
50
100
150
No.
pro
tein
s
0
1
2
3
No.
RN
As
0 100 200 300 400 500 600 700 8000
1
Time (s)
Pro
mot
er s
tate
Figure 3.1: Example state trajectory from a model containing transcriptionand translation with delays, repression and degradation. Top: proteinnumbers. Middle: RNA numbers. Bottom: promoter state.
Regulation of transcription initiation by transcription factor (TF) can be modeledas follows (Roussel and Zhu 2006; Ribeiro and Kauffman 2007):
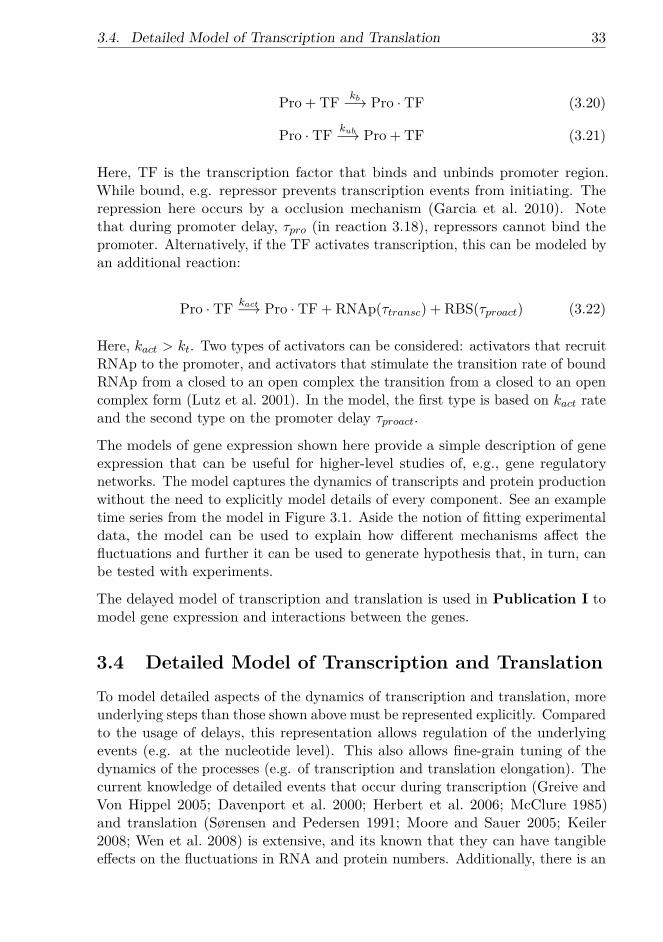
3.4. Detailed Model of Transcription and Translation 33
Pro + TF kb−→ Pro · TF (3.20)
Pro · TF kub−→ Pro + TF (3.21)
Here, TF is the transcription factor that binds and unbinds promoter region.While bound, e.g. repressor prevents transcription events from initiating. Therepression here occurs by a occlusion mechanism (Garcia et al. 2010). Notethat during promoter delay, τpro (in reaction 3.18), repressors cannot bind thepromoter. Alternatively, if the TF activates transcription, this can be modeled byan additional reaction:
Pro · TF kact−→ Pro · TF + RNAp(τtransc) + RBS(τproact) (3.22)
Here, kact > kt. Two types of activators can be considered: activators that recruitRNAp to the promoter, and activators that stimulate the transition rate of boundRNAp from a closed to an open complex the transition from a closed to an opencomplex form (Lutz et al. 2001). In the model, the first type is based on kact rateand the second type on the promoter delay τproact.
The models of gene expression shown here provide a simple description of geneexpression that can be useful for higher-level studies of, e.g., gene regulatorynetworks. The model captures the dynamics of transcripts and protein productionwithout the need to explicitly model details of every component. See an exampletime series from the model in Figure 3.1. Aside the notion of fitting experimentaldata, the model can be used to explain how different mechanisms affect thefluctuations and further it can be used to generate hypothesis that, in turn, canbe tested with experiments.
The delayed model of transcription and translation is used in Publication I tomodel gene expression and interactions between the genes.
3.4 Detailed Model of Transcription and Translation
To model detailed aspects of the dynamics of transcription and translation, moreunderlying steps than those shown above must be represented explicitly. Comparedto the usage of delays, this representation allows regulation of the underlyingevents (e.g. at the nucleotide level). This also allows fine-grain tuning of thedynamics of the processes (e.g. of transcription and translation elongation). Thecurrent knowledge of detailed events that occur during transcription (Greive andVon Hippel 2005; Davenport et al. 2000; Herbert et al. 2006; McClure 1985)and translation (Sørensen and Pedersen 1991; Moore and Sauer 2005; Keiler2008; Wen et al. 2008) is extensive, and its known that they can have tangibleeffects on the fluctuations in RNA and protein numbers. Additionally, there is an
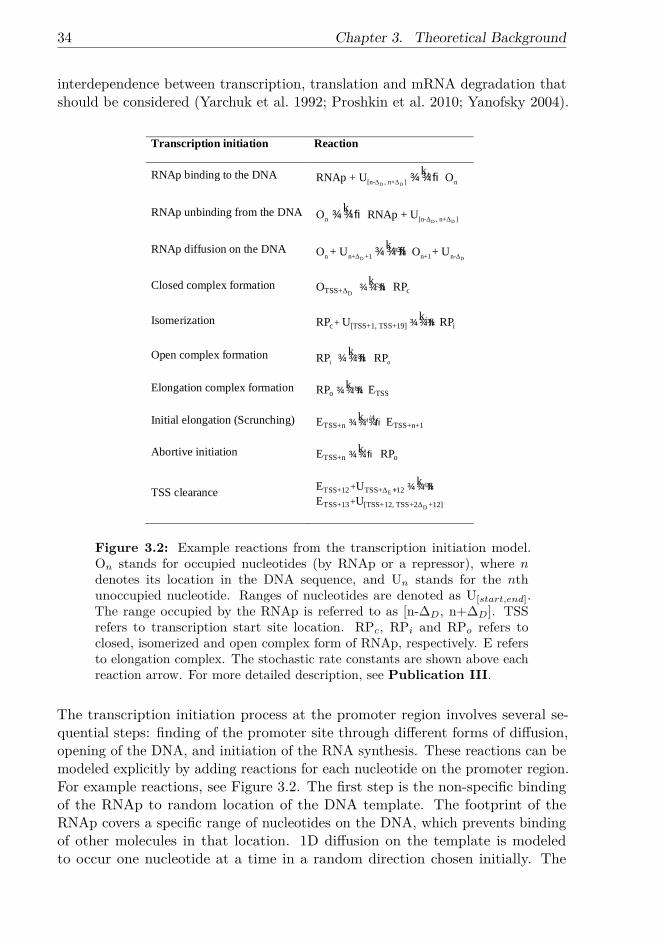
34 Chapter 3. Theoretical Background
interdependence between transcription, translation and mRNA degradation thatshould be considered (Yarchuk et al. 1992; Proshkin et al. 2010; Yanofsky 2004).
1
Transcription initiation Reaction
RNAp binding to the DNAD D
b[n-Δ , n+Δ ] n
kRNAp + U O¾¾®
RNAp unbinding from the DNAD D
fn [n-Δ , n+Δ ]
kO RNAp + U¾¾®
RNAp diffusion on the DNAD D
mn n+Δ +1 n+1 n-Δ
kO + U O + U¾¾¾®
Closed complex formationD
cTSS+Δ c
kO RP¾¾¾®
Isomerization ic [TSS+1, TSS+19] i+ kRP U RP¾¾¾®
Open complex formation oi o
kRP RP¾¾¾®
Elongation complex formation elo TSS
kRP E¾¾¾®
Initial elongation (Scrunching) el/4TSS+n TSS+n+1
kE E¾¾¾®
Abortive initiation aTSS+n o
kE RP¾¾®
TSS clearanceel
E
D
TSS+12 TSS+Δ 12
TSS+13 [TSS+12, TSS+2Δ +12]
++
kE UE U
+ ¾¾¾®
Figure 3.2: Example reactions from the transcription initiation model.On stands for occupied nucleotides (by RNAp or a repressor), where ndenotes its location in the DNA sequence, and Un stands for the nthunoccupied nucleotide. Ranges of nucleotides are denoted as U[start,end].The range occupied by the RNAp is referred to as [n-∆D, n+∆D]. TSSrefers to transcription start site location. RPc, RPi and RPo refers toclosed, isomerized and open complex form of RNAp, respectively. E refersto elongation complex. The stochastic rate constants are shown above eachreaction arrow. For more detailed description, see Publication III.
The transcription initiation process at the promoter region involves several se-quential steps: finding of the promoter site through different forms of diffusion,opening of the DNA, and initiation of the RNA synthesis. These reactions can bemodeled explicitly by adding reactions for each nucleotide on the promoter region.For example reactions, see Figure 3.2. The first step is the non-specific bindingof the RNAp to random location of the DNA template. The footprint of theRNAp covers a specific range of nucleotides on the DNA, which prevents bindingof other molecules in that location. 1D diffusion on the template is modeledto occur one nucleotide at a time in a random direction chosen initially. The

3.4. Detailed Model of Transcription and Translation 35
contribution of 1D diffusion to the finding of the start site might not be relevantwhen compared to 3D diffusion, depending on the reaction rates (Friedman et al.2013; Dangkulwanich et al. 2014). The diffusing RNAp can unbind randomlyfrom the template at any position. Multiple RNAps moving on the DNA templatecan cause collisions, e.g. in convergent promoters (Callen et al. 2004), and in thecollision events, the model assumes that one or both RNAps are removed fromthe template (Sneppen et al. 2005).
Binding of the RNAp to the transcription start site forms the closed complexbetween RNAp and the promoter. The dynamics of the subsequent, consecutiveinitiation reactions, including isomerization and open complex formation, followelemental steps with means extracted from in vitro measurements (Buc andMcClure 1985; Lutz et al. 2001; Saecker et al. 2011). The promoter escape occursthrough a step-wise abortive initiation process that has been shown to release fromsmall to very high amounts of abortive transcripts, depending on the promoter.The latter case reflects the instability of the initial elongation complex (Hsu 2002;Hsu et al. 2003). Following this, RNAp commences the production of nascentRNA.
The model also allows binding of repressor molecules on the specific sites in thepromoter region. Depending on the specific DNA region occupied by the repressor,different reactions can be prevented by steric occlusion. The repressor can preventRNAp binding, isomerization or promoter escape and each mode of repressionexhibits different dynamics (Sanchez et al. 2011). In Publication III stochasticnucleotide level model of the promoter region was used to study the dynamics oftranscription initiation in closely spaced promoters.
The elongation phase of transcription and translation proceeds in steps, eachof which involving the addition of a specific nucleotide or amino-acid. RNApmolecules have been shown to move at varying rates along the template strand(Herbert et al. 2006; Landick 2009). This is due to alternative reaction pathways,e.g. pausing, pyrophosphorolysis or editing, which compete with normal elonga-tion and can reduce the overall elongation rate (Greive and Von Hippel 2005).Additionally, reactions such as transcriptional pausing can generate traffic on thetemplate, as they force multiple trailing RNAps to stop at very close distancesand then proceeding jointly forward in elongation. Traffic slows down the overalltranscription rate to an extent, but its main effect is the induction of burstyproduction of RNAs. Stochastic transcription elongation models have been shownto be reproduce these results (Dobrzynski and Bruggeman 2009; Klumpp and Hwa2008; Rajala et al. 2010). The probability of RNAp entering alternative pathwaysnot only depends on the nucleotide sequence but also on transcription elongationfactors (Davenport et al. 2000; Herbert et al. 2006; Herbert et al. 2010).
To accurately model elongation, reactions for each pathway with specific ratesin each template position must be stated. In Figure 3.3 example reactions forcoupled transcription and translation elongation processes are shown. RNAps
36 Chapter 3. Theoretical Background
2
Transcription Reaction Translation Reaction
Elongation RNAp
RNAp RNAp
1
R1
A U
O U U
mkn n
n n n
+ D +
+ - D - D
+ ¾ ¾®
+ +Initiation _
Rib
R R R[1, 1] 1Rib U O Ribtrans initk
D ++ ¾¾¾® +
Activation O Aakn n¾¾® Stepwise
translocation
Rib Rib
Rib Rib
R R R3 [ 3, 1] 2
R R2 1
R R R1 [ 2, ]
A U O
O O
O O U
tm
tm
tm
kn n n n
kn n
kn n n n
- +D - +D - -
- -
- -D - -D
+ ¾¾®
¾¾®
¾¾® +
Pausingp1/
O Op
p
k
n nt¾¾¾®¬¾¾¾ Activation RR AO ,,
nk
nCBAtrans ¾¾¾ ®¾
Prematuretermination RNAp RNAp[ -Δ , +Δ ]O RNAp+Upre
n n nk¾¾¾® Back-
translocationRib Rib
Rib Rib
R R[ 2, ]
R R3 [ 3, 1]
O U
A U
btkn n n
n n n
-D - -D
- +D - +D -
+ ¾¾®
+
Pyrophos-phorolysis
RNAp RNAp
RNAp
R1 1
1 1
O U U
O U
pyrokn n n
n n
-D - -D -
- +D -
+ + ¾¾¾®
+Drop-off
Rib Rib
R R[ - , ]O Rib Udropk
n n nD +D¾¾¾® +
CompletionRNAp[ , - ]A RNAp Uf
last last last
kn n n D¾¾® + Completion _
Rib
R R[ , - ] premA Rib U Ptrans f
last last last
kn n n D¾¾¾® + +
Figure 3.3: Example reactions from the transcription and translationelongation model. In the transcription model, An, On and Un depict forthe nth nucleotide when activated, occupied, and unoccupied, respectively.Ranges of nucleotides are denoted such as U[start,end]. Each RNAp occupies(2∆RNAp+1) nucleotides. UR
n denotes transcribed ribonucleotides (denotedby the R superscript) which are free, i.e. not under the RNAp’s footprint.In the translation model, each ribosome occupies (2∆Rib+1) ribonucleotides.AR
n denotes that a ribosome has created peptide bond for the peptide codedby the codon at position [n−2, n], where n is a multiple of 3 (n = 3, 6, 9, . . .).The activation reaction has a codon-specific rate (Sørensen and Pedersen1991). The stochastic rate constants are shown above each reaction arrow.For more detailed description, see Publication IV.
(and ribosomes) occupy a specific range of nucleotides on the template. This ismodeled with occupied nucleotides that are occupied and released as the elongationensues. During elongation, ribonucleotides are released from each RNAp loci,allowing ribosomes to translate the sequence. Each reaction in elongation statesthe requirement of different molecular species for each pathway. The stochasticrates for each pathway can be defined for each template position separately,e.g. codons are translated with variable rates independent of the tRNA species(Sørensen and Pedersen 1991). The impact of slow-translating codons on ribosomecollisions and translation efficiency has been studied in different codon sequences(Mitarai et al. 2008). This study showed that neither deterministic nor stochasticmodels with uniform translation rates are able to reproduce the experimentalresults of translation elongation rates. For simulated movement of RNAps andribosomes on the DNA and mRNA, respectively, from the model in PublicationIV, see Figure 3.4.
In Publication IV the transcription and translation elongation models were
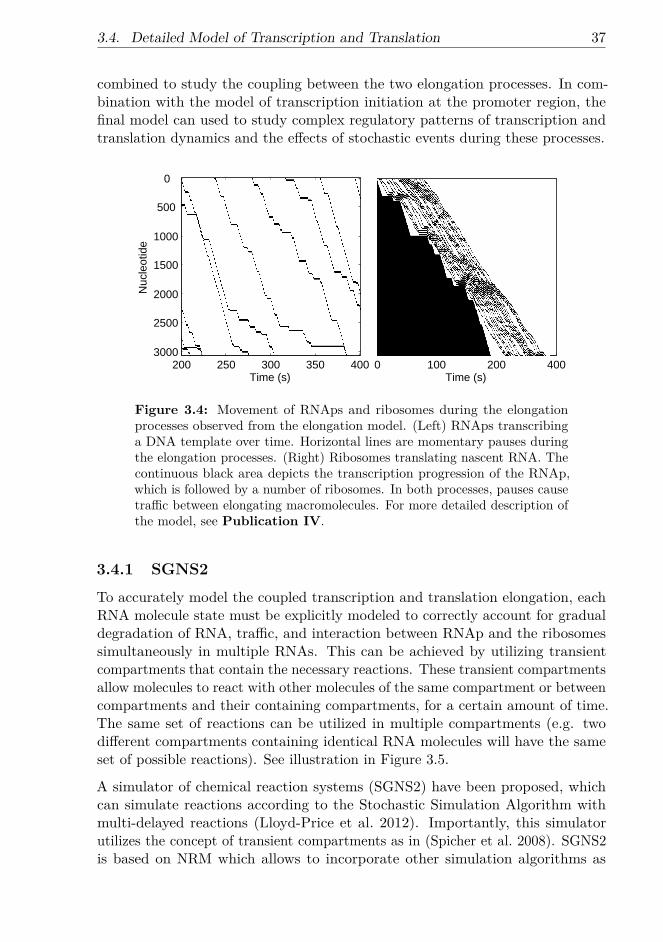
3.4. Detailed Model of Transcription and Translation 37
combined to study the coupling between the two elongation processes. In com-bination with the model of transcription initiation at the promoter region, thefinal model can used to study complex regulatory patterns of transcription andtranslation dynamics and the effects of stochastic events during these processes.
Time (s)
Nuc
leot
ide
200 250 300 350 400
0
500
1000
1500
2000
2500
30000 100 200 400
Time (s)
Figure 3.4: Movement of RNAps and ribosomes during the elongationprocesses observed from the elongation model. (Left) RNAps transcribinga DNA template over time. Horizontal lines are momentary pauses duringthe elongation processes. (Right) Ribosomes translating nascent RNA. Thecontinuous black area depicts the transcription progression of the RNAp,which is followed by a number of ribosomes. In both processes, pauses causetraffic between elongating macromolecules. For more detailed description ofthe model, see Publication IV.
3.4.1 SGNS2
To accurately model the coupled transcription and translation elongation, eachRNA molecule state must be explicitly modeled to correctly account for gradualdegradation of RNA, traffic, and interaction between RNAp and the ribosomessimultaneously in multiple RNAs. This can be achieved by utilizing transientcompartments that contain the necessary reactions. These transient compartmentsallow molecules to react with other molecules of the same compartment or betweencompartments and their containing compartments, for a certain amount of time.The same set of reactions can be utilized in multiple compartments (e.g. twodifferent compartments containing identical RNA molecules will have the sameset of possible reactions). See illustration in Figure 3.5.
A simulator of chemical reaction systems (SGNS2) have been proposed, whichcan simulate reactions according to the Stochastic Simulation Algorithm withmulti-delayed reactions (Lloyd-Price et al. 2012). Importantly, this simulatorutilizes the concept of transient compartments as in (Spicher et al. 2008). SGNS2is based on NRM which allows to incorporate other simulation algorithms as
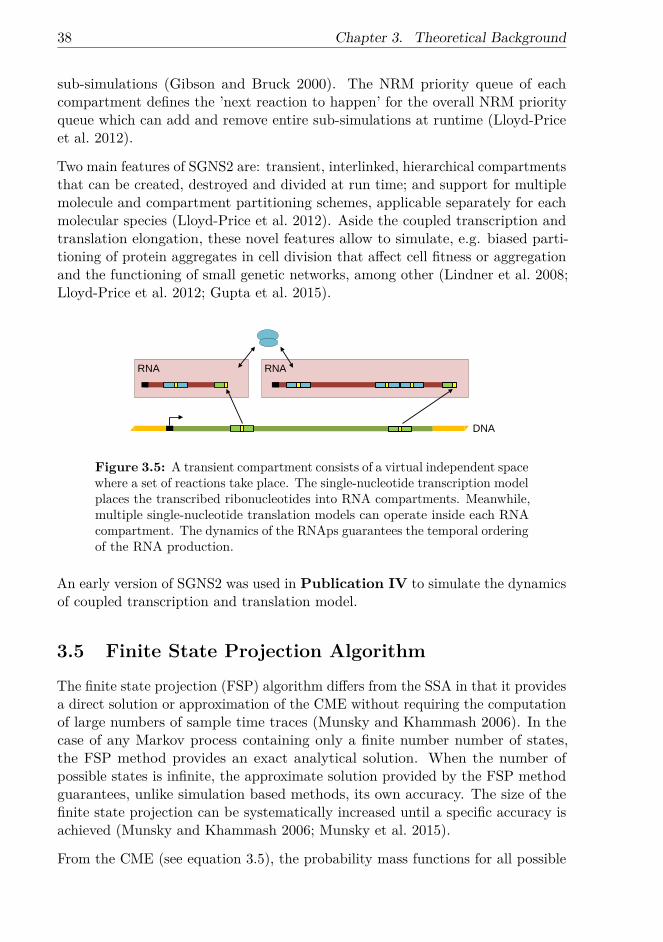
38 Chapter 3. Theoretical Background
sub-simulations (Gibson and Bruck 2000). The NRM priority queue of eachcompartment defines the ’next reaction to happen’ for the overall NRM priorityqueue which can add and remove entire sub-simulations at runtime (Lloyd-Priceet al. 2012).
Two main features of SGNS2 are: transient, interlinked, hierarchical compartmentsthat can be created, destroyed and divided at run time; and support for multiplemolecule and compartment partitioning schemes, applicable separately for eachmolecular species (Lloyd-Price et al. 2012). Aside the coupled transcription andtranslation elongation, these novel features allow to simulate, e.g. biased parti-tioning of protein aggregates in cell division that affect cell fitness or aggregationand the functioning of small genetic networks, among other (Lindner et al. 2008;Lloyd-Price et al. 2012; Gupta et al. 2015).
RNARNA
DNA
Figure 3.5: A transient compartment consists of a virtual independent spacewhere a set of reactions take place. The single-nucleotide transcription modelplaces the transcribed ribonucleotides into RNA compartments. Meanwhile,multiple single-nucleotide translation models can operate inside each RNAcompartment. The dynamics of the RNAps guarantees the temporal orderingof the RNA production.
An early version of SGNS2 was used in Publication IV to simulate the dynamicsof coupled transcription and translation model.
3.5 Finite State Projection Algorithm
The finite state projection (FSP) algorithm differs from the SSA in that it providesa direct solution or approximation of the CME without requiring the computationof large numbers of sample time traces (Munsky and Khammash 2006). In thecase of any Markov process containing only a finite number number of states,the FSP method provides an exact analytical solution. When the number ofpossible states is infinite, the approximate solution provided by the FSP methodguarantees, unlike simulation based methods, its own accuracy. The size of thefinite state projection can be systematically increased until a specific accuracy isachieved (Munsky and Khammash 2006; Munsky et al. 2015).
From the CME (see equation 3.5), the probability mass functions for all possible
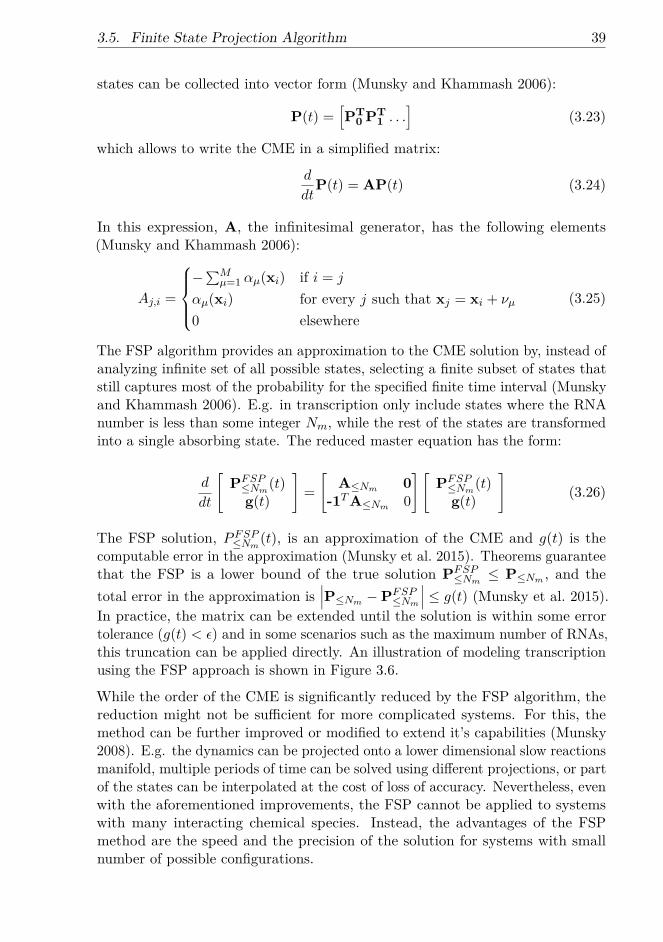
3.5. Finite State Projection Algorithm 39
states can be collected into vector form (Munsky and Khammash 2006):
P(t) =[PT
0 PT1 . . .
](3.23)
which allows to write the CME in a simplified matrix:
d
dtP(t) = AP(t) (3.24)
In this expression, A, the infinitesimal generator, has the following elements(Munsky and Khammash 2006):
Aj,i =
−∑Mµ=1 αµ(xi) if i = j
αµ(xi) for every j such that xj = xi + νµ
0 elsewhere(3.25)
The FSP algorithm provides an approximation to the CME solution by, instead ofanalyzing infinite set of all possible states, selecting a finite subset of states thatstill captures most of the probability for the specified finite time interval (Munskyand Khammash 2006). E.g. in transcription only include states where the RNAnumber is less than some integer Nm, while the rest of the states are transformedinto a single absorbing state. The reduced master equation has the form:
d
dt
[PFSP
≤Nm(t)
g(t)
]=[
A≤Nm 0-1TA≤Nm 0
] [PFSP
≤Nm(t)
g(t)
](3.26)
The FSP solution, PFSP≤Nm(t), is an approximation of the CME and g(t) is the
computable error in the approximation (Munsky et al. 2015). Theorems guaranteethat the FSP is a lower bound of the true solution PFSP
≤Nm≤ P≤Nm , and the
total error in the approximation is∣∣∣P≤Nm −PFSP
≤Nm
∣∣∣ ≤ g(t) (Munsky et al. 2015).In practice, the matrix can be extended until the solution is within some errortolerance (g(t) < ε) and in some scenarios such as the maximum number of RNAs,this truncation can be applied directly. An illustration of modeling transcriptionusing the FSP approach is shown in Figure 3.6.
While the order of the CME is significantly reduced by the FSP algorithm, thereduction might not be sufficient for more complicated systems. For this, themethod can be further improved or modified to extend it’s capabilities (Munsky2008). E.g. the dynamics can be projected onto a lower dimensional slow reactionsmanifold, multiple periods of time can be solved using different projections, or partof the states can be interpolated at the cost of loss of accuracy. Nevertheless, evenwith the aforementioned improvements, the FSP cannot be applied to systemswith many interacting chemical species. Instead, the advantages of the FSPmethod are the speed and the precision of the solution for systems with smallnumber of possible configurations.
40 Chapter 3. Theoretical Background
The FSP has been used along with single-cell experiments to study the dynamicsof various systems, such as in a recent study measured the osmotic stress responsepathway in Saccharomyces cerevisiae using the FISH method for RNA detection(Neuert et al. 2013). Models with varying complexity were generated with FSP andparameter estimation and cross-validation were used to select the most predictivemodel. Additionally, the method has been used to quantify e.g. the transcriptionalactivity of the proto-oncogene c-Fos at individual endogenous alleles (Senecal et al.2014).
In Publication II, the FSP approach was used to model the intake kinetics ofinducer and the production dynamics of RNAs.
Figure 3.6: Illustration of modeling transcription using the FSP approach.(A) Multiple states of a gene with different rates of transcription. Addingmore gene states in the model will increase the complexity of behaviors. (B)A lattice for all possible combinations of gene (x-axis) and number of RNAs(y-states) states. The lattice is infinite as the number of RNAs can, in theory,exceed any finite bound. (C) The FSP algorithm truncates the infinite statespace at N RNAs. Reactions exceeding the truncated value are absorbedinto a sink state with a probability g(t). (D) As a result, a finite state spaceis used so as to estimate the probability of the system to be in each statewithin that space. Consequently, the RNA distribution at each time momentcan be produced. Reproduced with permission from (Munsky et al. 2015).
4 Measurements and Analysis
This chapter is an overview of the fluorescence microscopy techniques and analysismethods employed in this thesis. These methods include single-RNA detec-tion methods, cell and spot segmentation, RNA quantification and change-pointdetection algorithms.
4.1 Fluorescent Proteins and Microscopy
Fluorescent proteins were discovered in the early 1960s (Shimomura et al. 1962) andwere successfully cloned in the 1990s (Prasher et al. 1992). Since then, fluorescentproteins have become one of the most used tools in biological sciences. This ismostly due to the simplicity of fusing fluorescent proteins with cellular targetproteins (Tsien 1998). The availability of fluorescent proteins has evolved to covermost of the visible spectrum of light (Shaner et al. 2004; Day and Davidson 2009).Also, development in the field have led to the appearance of novel propertiesof fluorescent probes, such as photoactivation and photoconversion (Day andDavidson 2009; Wu et al. 2011). These fluorescent proteins can be switchedon and off or be converted to a different emission wavelength by using specificwavelengths of excitation light. These properties are the foundation for manyadvanced imaging techniques in microscopy, e.g. super-resolution microscopy(Huang et al. 2009).
An optimal fluorescent protein for single cell microscopy has high quantum yieldand brightness, favorable photo-physical properties, and sufficient inertness so asnot to interfere with the functioning of the target molecule (Shaner et al. 2004).Drawbacks of many fluorescent proteins include blinking (intensity fluctuations)and limited photo-stability (Ha and Tinnefeld 2012). Organic fluorophores,compared to fluorescent proteins, have a smaller size, and superior stability andbrightness (Pitchiaya et al. 2014). Nevertheless, the possibility of expressingfluorescent proteins fused to desired cellular target proteins inside a cell makesfluorescent proteins convenient for many studies.
To accurately detect fluorescent proteins, the emitted fluorescence signal have tobe significantly above the cellular background fluorescence, referred as autofluo-rescence. To achieve this, first, the selection of a bright fluorophore that absorbs
41
42 Chapter 4. Measurements and Analysis
and emits light outside the spectrum of the autofluorescence is recommended (Haand Tinnefeld 2012). Second, media exhibiting a low autofluorescence shouldbe selected. Third, the choice of light source, optics, illumination scheme, anddetector contribute directly to the signal-to-noise ratio in microscopy experiments.
The most commonly used illumination scheme in fluorescence microscopy is awide-field epi-illumination. The epi-illumination excites the entire depth of thesample causing the out-of-focus fluorescent molecules also to contribute towardsthe background fluorescence. To avoid out-of-focus illumination, several methodshave been developed to restrict the illumination volume of the sample: confocalmicroscopy (Pawley 2006), total internal reflection fluorescence (TIRF) microscopy(Axelrod 1981), and highly inclined and laminated optical sheet (HILO) microscopy(Konopka and Bednarek 2008). Confocal microscopy is based on reducing thefocal volume and consequently the out-of-focus light with a pinhole (Pawley 2006).A drawback is that as the sample is illuminated only one volume at a time and hasto be scanned, making the imaging slower than in wide-field techniques. The scan-speed can be improved with setups, such as the spinning-disc confocal microscopy,which simultaneously illuminate multiple regions of the sample (Nakano 2002).
In TIRF microscopy, only a thin section at the sample surface is illuminated(Axelrod 1981). Light in total internal reflection creates a thin lamina of evanescentwave that penetrates the coverglass-sample surface and excites molecules withinapproximately 150 nm from the surface. The low penetration depth of the TIRFmicroscopy allows only to probe molecules close to the coverglass surface, e.g. inthe cell membrane. TIRF has been more commonly used to study processes invitro. To increase the penetration depth without significantly reducing the signal-to-noise ratio, the HILO microscopy was developed (Konopka and Bednarek 2008;Tokunaga et al. 2008). In the HILO microscopy, light is refracted into the sampleat high inclination angle (less than the critical angle in TIRF) only illuminatingan angled layer within the sample, resulting in lower out-of-focus fluorescence.
4.2 Single-Molecule Approaches for RNA Detection
One of the earliest implementations of a single molecule technique to studybiological processes was the observation of single β-galactosidase molecules trappedinto microscopic droplets by using fluorogenic substrate to measure the quantity(Rotman 1961). Another example is the measurement of the unidirectionalmovement of kinesin driving plastic beads along microtubules in vitro (Gelleset al. 1988). Also, enzymatic reactions of single cholesterol oxidase moleculeshave been observed using a real-time single-molecule approach (Lu et al. 1998).Among other findings, the analysis of single-molecule measurements have shownfluctuations in the rate of reactions.
In light microscopy, Abbe’s law defines the limit of ability to distinguish twofeatures located closer than half of the wavelength of the illuminating or the

4.2. Single-Molecule Approaches for RNA Detection 43
emitted light. This is directly related to the ability of detecting single fluorescentmolecules in biological samples. In order to accurately detect fluorescent moleculesin the observation area, the number of the target molecules must be low enoughto distinguish them. This is problematic as many molecules are present in highquantities, e.g. RNAps and ribosomes in E. coli.
Various strategies have been utilized to limit the number of molecules in theobservation area (Pitchiaya et al. 2014). For example, the expression of the targetcan be limited (Yu et al. 2006), the delivery of the probes can be controlled(Santangelo et al. 2009), or the visualization of the probes at any given time canbe limited to a subset of the probes (Huang et al. 2009). The latter strategy isused in super-resolution microscopy. These methods are based on turning only afew fluorescent proteins into a bright state simultaneously and cycling through thetotal population of fluorescent proteins in a stochastic manner. This is achievedby using photoactivatable or photoconvertible fluorephores (Day and Davidson2009). Stochastic optical reconstruction microscopy (STORM) or photoactivationlocalization microscopy (PALM) can achieve up to 10 nm spatial resolution, evenwith a high copy numbers of target molecules (Huang et al. 2009; Walter et al.2008).
Methods have been developed to probe RNA numbers in vivo with fluorescentprobes. Techniques of labeling RNAs generally use two different schemes, di-rect and indirect labeling. Indirect labeling involves sequence-complementaryoligonucleotides or fluorophore labeled RNA binding probes, which bind to aspecific RNA motif (Pitchiaya et al. 2014). Direct labeling uses chemically reactivefunctional groups or structural motifs in the RNA, which can be naturally presentor introduced by chemical synthesis and RNA modifying proteins, for fluorophoreattachment (Pitchiaya et al. 2014). Currently, indirect labeling methods aremore popular due to the possibility of probing endogenous RNAs, in addition toexogenous constructs (Raj and van Oudenaarden 2009).
One of the first methods to achieve single RNA sensitivity was the fluorescence insitu hybridization method (Raj and van Oudenaarden 2009). The method is basedon the fluorescently labeled oligonucleotide probes that specifically hybridize toits complementary sequence on the RNA. It can be used to probe the cell-to-cell variability in endogenous RNAs, which cannot normally be quantified withpopulation level measurements such as qPCR, microarrays, or deep-sequencing(Raj and van Oudenaarden 2009). Additionally, FISH can be used to measurethe spatial localization of RNAs inside the cell (Montero Llopis et al. 2010;Lecuyer et al. 2007). The protocol for FISH generally entails fixation of the cells,permeabilization of the cell membrane, hybridization of probes to their targetRNA sequences, extensive washing of the cells to remove non-bound probes, andimage acquisition (Gasnier et al. 2013).
The difficulties in the FISH methodology that affect the quantification of RNAnumbers are the following: the variability in fluorophores labeled to the oligonu-
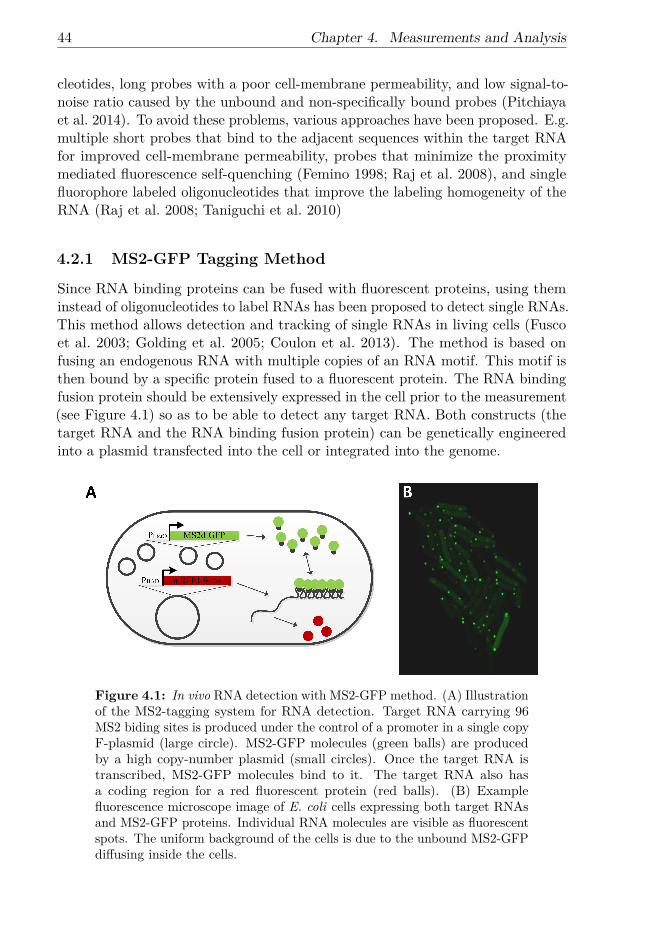
44 Chapter 4. Measurements and Analysis
cleotides, long probes with a poor cell-membrane permeability, and low signal-to-noise ratio caused by the unbound and non-specifically bound probes (Pitchiayaet al. 2014). To avoid these problems, various approaches have been proposed. E.g.multiple short probes that bind to the adjacent sequences within the target RNAfor improved cell-membrane permeability, probes that minimize the proximitymediated fluorescence self-quenching (Femino 1998; Raj et al. 2008), and singlefluorophore labeled oligonucleotides that improve the labeling homogeneity of theRNA (Raj et al. 2008; Taniguchi et al. 2010)
4.2.1 MS2-GFP Tagging Method
Since RNA binding proteins can be fused with fluorescent proteins, using theminstead of oligonucleotides to label RNAs has been proposed to detect single RNAs.This method allows detection and tracking of single RNAs in living cells (Fuscoet al. 2003; Golding et al. 2005; Coulon et al. 2013). The method is based onfusing an endogenous RNA with multiple copies of an RNA motif. This motif isthen bound by a specific protein fused to a fluorescent protein. The RNA bindingfusion protein should be extensively expressed in the cell prior to the measurement(see Figure 4.1) so as to be able to detect any target RNA. Both constructs (thetarget RNA and the RNA binding fusion protein) can be genetically engineeredinto a plasmid transfected into the cell or integrated into the genome.
Figure 4.1: In vivo RNA detection with MS2-GFP method. (A) Illustrationof the MS2-tagging system for RNA detection. Target RNA carrying 96MS2 biding sites is produced under the control of a promoter in a single copyF-plasmid (large circle). MS2-GFP molecules (green balls) are producedby a high copy-number plasmid (small circles). Once the target RNA istranscribed, MS2-GFP molecules bind to it. The target RNA also hasa coding region for a red fluorescent protein (red balls). (B) Examplefluorescence microscope image of E. coli cells expressing both target RNAsand MS2-GFP proteins. Individual RNA molecules are visible as fluorescentspots. The uniform background of the cells is due to the unbound MS2-GFPdiffusing inside the cells.
4.2. Single-Molecule Approaches for RNA Detection 45
The most common high-affinity RNA binding protein used in RNA detection isthe MS2 coat protein derived from the MS2 bacteriophage (Fusco et al. 2003).The protein binds to a 21 nt long RNA fragment that spontaneously forms astem-loop secondary structure (Keryer-Bibens et al. 2008). Other proteins usedfor the RNA binding are the PP7, derived from the PP7 bacteriophage (Larsonet al. 2011; Chao et al. 2008), and the λN peptide, derived from the lambdabacteriophage (Lange et al. 2008; Daigle and Ellenberg 2007). The binding sites ofthe tagging proteins are orthogonal between MS2, PP7 and λN , i.e. the MS2 doesnot bind the PP7 binding site and vice-versa (Lange et al. 2008; Chao et al. 2008).This allows to simultaneously imaging up to three independent RNA targets, orprobe three different regions of a single RNA, using a combination of MS2, PP7and λN systems (Hocine et al. 2013; Lange et al. 2008).
The binding of multiple tagging proteins (an RNA binding protein fused witha fluorescent protein) to the same target RNA renders it much brighter thanthe fluorescence from freely diffusing unbound tagging proteins and the cellularautofluorescence (Fusco et al. 2003; Golding et al. 2005; Xie et al. 2008). Further,the unbound tagging proteins normally diffuse much faster than the time resolutionof the image acquisition, blurring the fluorescence over a large area inside thecell. On the other hand, the target RNA bound by multiple tagging proteinsmoves slowly and can be detected as a distinct diffraction limited spot. However,the highly expressed, unbound tagging proteins contribute significantly to thebackground, creating need for a high number of binding sites in the target RNA.In the first implementation of the method, 24 binding sites of the tagging proteinwere used in the target RNA, resulting in the binding of 48 fluorescent proteins,as the MS2 protein binds as a dimer (Valegard et al. 1994). Versions with a lower(Haim et al. 2007; Fusco et al. 2003) or a higher number of binding sites have beenused (Golding and Cox 2004). As an alternative technique to improve the signal-to-noise ratio, recent studies have utilized split green fluorescent protein (GFP)fragments to reduce the background fluorescence (Kerppola 2006; Wu et al. 2014).
Certain drawbacks of the method hinder its usage as a probe for RNA dynamics.These are to be considered in the analysis of the microscopy experiment. First,an incomplete and heterogeneous binding of tagging proteins to target RNAaffect the quantification as the amount of fluorescence fluctuates between taggedRNAs (Fusco et al. 2003; Wu et al. 2012). Next, the binding of a large numberof the tagging proteins to the target RNA can affect the mobility, functioningor localization of target RNAs (Wu et al. 2012; Oliveira et al. 2016). Also, thetarget RNA becomes protected against natural degradation by the bound taggingproteins (Tran et al. 2015; Muthukrishnan et al. 2012). Lastly, this method canonly be used to probe genetically engineered RNAs due to the requirement of theRNA binding sites.
In Publication I and Publication II MS2-GFP tagging method was used tomeasure the production of target RNAs from a single promoter in live cells.
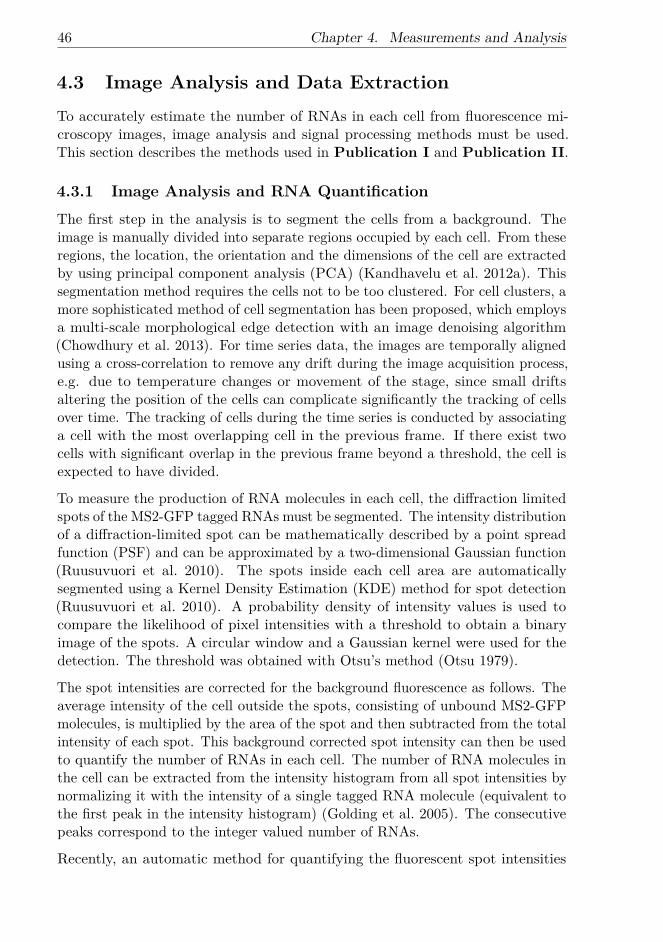
46 Chapter 4. Measurements and Analysis
4.3 Image Analysis and Data ExtractionTo accurately estimate the number of RNAs in each cell from fluorescence mi-croscopy images, image analysis and signal processing methods must be used.This section describes the methods used in Publication I and Publication II.
4.3.1 Image Analysis and RNA Quantification
The first step in the analysis is to segment the cells from a background. Theimage is manually divided into separate regions occupied by each cell. From theseregions, the location, the orientation and the dimensions of the cell are extractedby using principal component analysis (PCA) (Kandhavelu et al. 2012a). Thissegmentation method requires the cells not to be too clustered. For cell clusters, amore sophisticated method of cell segmentation has been proposed, which employsa multi-scale morphological edge detection with an image denoising algorithm(Chowdhury et al. 2013). For time series data, the images are temporally alignedusing a cross-correlation to remove any drift during the image acquisition process,e.g. due to temperature changes or movement of the stage, since small driftsaltering the position of the cells can complicate significantly the tracking of cellsover time. The tracking of cells during the time series is conducted by associatinga cell with the most overlapping cell in the previous frame. If there exist twocells with significant overlap in the previous frame beyond a threshold, the cell isexpected to have divided.
To measure the production of RNA molecules in each cell, the diffraction limitedspots of the MS2-GFP tagged RNAs must be segmented. The intensity distributionof a diffraction-limited spot can be mathematically described by a point spreadfunction (PSF) and can be approximated by a two-dimensional Gaussian function(Ruusuvuori et al. 2010). The spots inside each cell area are automaticallysegmented using a Kernel Density Estimation (KDE) method for spot detection(Ruusuvuori et al. 2010). A probability density of intensity values is used tocompare the likelihood of pixel intensities with a threshold to obtain a binaryimage of the spots. A circular window and a Gaussian kernel were used for thedetection. The threshold was obtained with Otsu’s method (Otsu 1979).
The spot intensities are corrected for the background fluorescence as follows. Theaverage intensity of the cell outside the spots, consisting of unbound MS2-GFPmolecules, is multiplied by the area of the spot and then subtracted from the totalintensity of each spot. This background corrected spot intensity can then be usedto quantify the number of RNAs in each cell. The number of RNA molecules inthe cell can be extracted from the intensity histogram from all spot intensities bynormalizing it with the intensity of a single tagged RNA molecule (equivalent tothe first peak in the intensity histogram) (Golding et al. 2005). The consecutivepeaks correspond to the integer valued number of RNAs.
Recently, an automatic method for quantifying the fluorescent spot intensities
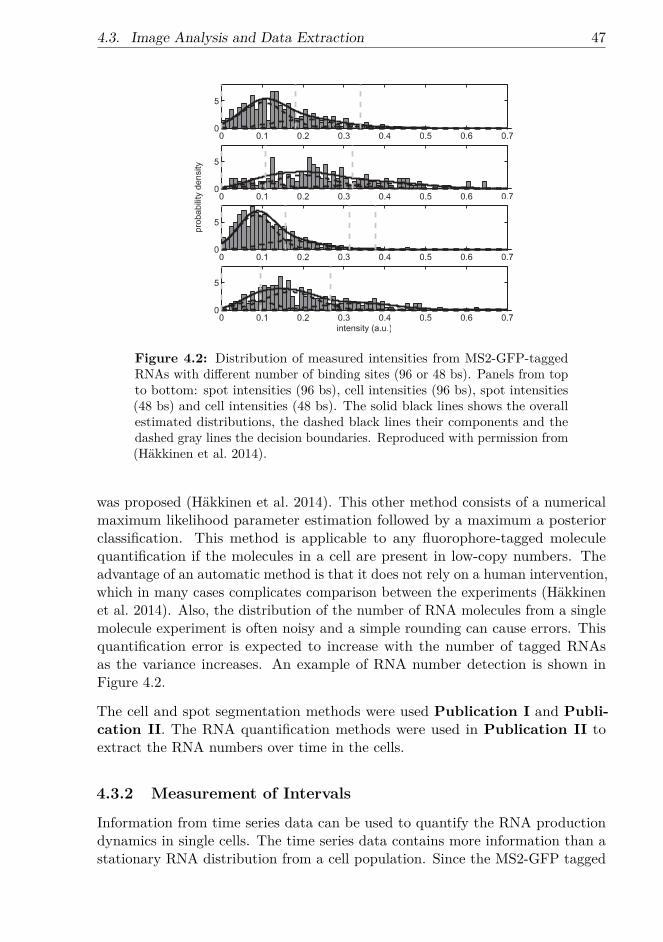
4.3. Image Analysis and Data Extraction 47
Figure 4.2: Distribution of measured intensities from MS2-GFP-taggedRNAs with different number of binding sites (96 or 48 bs). Panels from topto bottom: spot intensities (96 bs), cell intensities (96 bs), spot intensities(48 bs) and cell intensities (48 bs). The solid black lines shows the overallestimated distributions, the dashed black lines their components and thedashed gray lines the decision boundaries. Reproduced with permission from(Häkkinen et al. 2014).
was proposed (Häkkinen et al. 2014). This other method consists of a numericalmaximum likelihood parameter estimation followed by a maximum a posteriorclassification. This method is applicable to any fluorophore-tagged moleculequantification if the molecules in a cell are present in low-copy numbers. Theadvantage of an automatic method is that it does not rely on a human intervention,which in many cases complicates comparison between the experiments (Häkkinenet al. 2014). Also, the distribution of the number of RNA molecules from a singlemolecule experiment is often noisy and a simple rounding can cause errors. Thisquantification error is expected to increase with the number of tagged RNAsas the variance increases. An example of RNA number detection is shown inFigure 4.2.
The cell and spot segmentation methods were used Publication I and Publi-cation II. The RNA quantification methods were used in Publication II toextract the RNA numbers over time in the cells.
4.3.2 Measurement of Intervals
Information from time series data can be used to quantify the RNA productiondynamics in single cells. The time series data contains more information than astationary RNA distribution from a cell population. Since the MS2-GFP tagged

48 Chapter 4. Measurements and Analysis
Figure 4.3: Detection of RNA production events from temporal data.Upper panel: florescence microscope images at 1, 34 and 61 min after thestart of time series. Lower panel: example intensity series and fit curves usingthe least-deviations (LD) method and two other methods. RNA numbersestimated by the LD method are shown by the curves. Reproduced withpermission from (Häkkinen and Ribeiro 2015).
RNAs do not degrade in the time span of several hours (Golding et al. 2005;Muthukrishnan et al. 2012; Tran et al. 2015), the total spot intensity increasesover time as the production of RNAs ensues (Kandhavelu et al. 2012a). Thus, themoment of appearance of a novel RNA molecule in a cell results in a discrete jumpin the background corrected total spots intensity of the cell, given an accuratesampling.
These discrete jumps in the total spots intensity of the cell are used to measure thetime intervals between consecutive production events of novel RNAs. The methoddoes not provide the absolute number of RNAs if the production does not initiatefrom zero RNAs. From a time series of a cell population, this method can be usedto extract a distribution of time intervals in RNA production (Muthukrishnanet al. 2012; Kandhavelu et al. 2012b). The automatic method in (Kandhaveluet al. 2012a) fits the total spots intensity over time to a monotone piecewise-constant function by least squares (LSQ) fitting. The model order is selectedusing the F-test. Each jump has been shown to correspond to the production of asingle RNA molecule (Kandhavelu et al. 2012a). Recently, an improved methodfor countering outliers observed in the intensity time series, e.g. spots movingout-of-focus, proposes least-deviations (LD) cost for the detection (Häkkinen andRibeiro 2015). An example of the jump detection in RNA production is shown inFigure 4.3.
This method can be also used to quantify the time for the first RNA productionevent to occur following induction. This requires usage of microfluidics, as the cellshave to be induced under the microscope observation. The time series acquisition

4.4. Change Point Detection Methods 49
is initiated simultaneously to the induction of target promoter and the durationfor the first RNA production events to occur is counted from the start of induction.Examples of distributions of time intervals between transcription events and ofthe waiting times for the first transcription event following induction are shownin Figure 4.4
The methods of measurement of time intervals between RNA production eventsand the waiting time for the first production event were used in Publication IIto quantify these processes in different promoters and induction schemes.
t = 0 t = 120 min
ǻt1 ǻt2 t3t0
ǻt1 t2t0
ǻt1 t2t0
Figure 4.4: Distributions of time intervals. Top: Description of the waitingtime for the first RNA production (t0) and intervals between subsequenttranscription events (∆t). Bottom: Example kinetics of the intake andproduction. (A) Probability density distribution of waiting times for thefirst RNA to be produced in cells (B) Probability density distribution ofintervals between transcription events.
4.4 Change Point Detection MethodsAutomatic change point detection methods are often general and can be usedto detect changes in the dynamics of the system without explicitly knowing theexact nature of the change. These methodologies recognize candidates for themoment of changes in the dynamics. The earliest approaches were based on theBehrens–Fisher problem, a statistical hypothesis test of equal means (Belloniand Didier 2008; Fisher 1939). These approaches, e.g. the Welch’s t-test, assumenormal distributions which makes them sensitive for heavy-tailed distributionsthat many biological processes exhibit (Taniguchi et al. 2010). The detection

50 Chapter 4. Measurements and Analysis
in non-parametric cases is still, in general, an open problem. The differentapproaches are based on statistics, density estimation, theory of kernel machinesand classification (Kawahara and Sugiyama 2009; Harchaoui et al. 2009).
The problem of change point detection can be formulated as the following. Givena multidimensional time series x0,x1, . . . ,xN ∈ Rn, where the time moment Krepresents a change in the dynamics. Given the data samples in the M-pointbackward window XB = (xK−M , . . . ,xK−1) and the M-point forward windowXF = (xK+1, . . . ,xK+M ), the dissimilarity of the two windows can be posed as ahypothesis testing problem:
H0 : pXF(x) = pXB(x)H1 : pXF(x) 6= pXB(x)
(4.1)
where pXF(x) and pXB(x) denote the probability density functions of the forwardand backward windows, respectively.
Two recent change point detection methods, namely, the unconstrained least-squares importance fitting (uLSIF) (Kawahara and Sugiyama 2009) and kernelchange point analysis (KCpA) (Harchaoui et al. 2009) have been reported toexhibit good performance, when compared with alternative methods. The firstdetection method attempts to model the densities based on the data (Kawaharaand Sugiyama 2009). Instead of estimating both windows separately and measuringtheir similarity with e.g. the Kolmogorov-Smirnov test, this method considersthe likelihood of a change using the density ratios directly. For this, there areestimation methods, such as Kullback-Leibler importance estimation procedure(KLIEP) (Sugiyama et al. 2008) and uLSIF (Kanamori et al. 2009). The densityratio w(x) : Rn → R is the following:
w(x) = pXF(x)pXB(x) , (4.2)
where pXF(x) and pXB(x) are the probability densities of the forward and back-ward windows, respectively.
The second method, the KCpA method, as all kernel methods, is based on mappingthe data into a higher dimensional feature space, which allows the data in thebackward and forward windows to be modeled with linear models. The kernelmethods were originally developed for pattern recognition but they have sincebeen applied to the problem of change point detection (Harchaoui et al. 2009;Desobry et al. 2005; Schölkopf and Smola 2002). Harchaoui and colleagues used akernel-based binary classifier to separate the forward and backward windows basedon the dissimilarity of the two sets (Harchaoui et al. 2009). Their separabilitycan be directly measured by using the Kernel Fisher Discriminant, which definesthe ratio of the between-class-variance and the within-class-variance.

4.4. Change Point Detection Methods 51
Most parameters of change point detection algorithms can be inferred from thedata by cross-validation. However, the window length cannot be determined fromthe training data due to multiple time scales of the change and the algorithmcannot know which time scale is relevant. Thus, the time scale of the processesto be studied must be known beforehand. Provided a prior knowledge on thetime scale of the changes, automatic methods to detect changes in time seriesdata accurately and robustly are important for future analysis of gene regulatorynetworks.
In Publication I these methods were used to detect changes in simulationsof gene expression in small and large gene networks and in measurements oftranscription in live cells using the MS2-GFP tagging method.


5 Conclusions and Discussion
This thesis has studied the transcription process in Escherichia coli using stochas-tic modeling approaches and RNA measurements with single molecule sensitivity.The four publications contribute to this by, first, presenting a new tool for auto-matically detecting changes in time series data from simulations or measurements(Publication I). This was followed by a study that quantifies the dynamics ofinduction and subsequent transcription process (Publication II), a study oftranscription initiation in closely spaced promoters (Publication III), and astudy of coupled transcription and translation elongation (Publication IV).
In Publication I a new method for detecting non-spurious changes in simulateddata and time-lapse microscopy of gene expression was proposed. The methodfinds candidate moments when the the dynamics of the system changed from timeseries data. Two recent methods, the density ratio method (Harchaoui et al. 2009)and the kernel change point analysis (Kawahara and Sugiyama 2009), are basedon a non-parametric approach for the detection problems. These methods showgood performance compared to alternative methods, as expected, given that theypresently represent state-of-the-art approaches to the problem.
To assess the accuracy of these methods, the ground truth of the changes must beknown. Thus, the performance of the two methods was tested in detecting changesin the dynamics of delayed stochastic models of small genetic networks, includinga toggle-switch (Gardner et al. 2000), and a large genetic network (Chowdhuryet al. 2010). The changes that occur during the time series were implementedso as to mimic natural changes in the dynamics, e.g. different mean expressionlevels and noise levels, or the switching between producing and non-producingstates. These changes can occur for various reasons, such as gene copy numberschange as a results of DNA replication (Peterson et al. 2015), a change in thetranscription factor concentration (Ozbudak et al. 2004; Kandhavelu et al. 2012b),or a change in the environment (Young et al. 2013). In most tests, the kernelmethod outperforms the density method. This might be due to the nature of thechanges aimed to detect. Overall, the methods showed good accuracy in detectingthe moments when changes occurred.
Finally, the methods were used to detect novel transcription events from time-lapsemicroscopy where the RNAs in live E. coli cells were detected by the MS2-GFP
53
54 Chapter 5. Conclusions and Discussion
RNA tagging method (Golding et al. 2005). Both methods accurately detectedthe production moments of novel RNAs.
Most detection parameters can be inferred from the data by cross-validation, butthe window length for the detection was found to have a significant effect on theaccuracy of detection. Changes in the dynamics in gene networks usually havemultiple time scales in which they occur, e.g. gene expression levels are affected byevents that can range from a simple repressor unbinding to a complex cell divisionprocess. Consequently, some information on the time scales of the process and/orchanges must be known beforehand, in order to detect change points accurately.This is especially true for gene regulatory networks capable of exhibiting a widerange of dynamics.
In Publication II, the contributions of induction and the subsequent transcriptionprocess to the cell-to-cell diversity in RNA numbers were quantified for a fewpromoters and induction schemes. First, the waiting times for the productionof the first RNA following introduction of inducers to the environment and thesubsequent intervals between transcription events were measured using the MS2-GFP RNA tagging method (Golding et al. 2005) in live E. coli cells. Both processeswere found to exhibit broad distributions of intervals. The dynamics of intake isdetermined by the induction mechanism and the extra-cellular concentration ofinducers. Meanwhile, the transcription dynamics of active promoters is mostlydictated by the promoter sequence and the presence of transcription factors.
The induction kinetics showed a surprisingly broad distribution of waiting timesin all measured cases. This was shown to have a tangible effect on the diversity inRNA numbers of a cell population, increasing it much above than expected fromnoise in the transcription process alone. This effect is, however, transient in thatas the transcription is initiated, the RNA numbers in cells become defined moreand more by the kinetics of transcription and RNA degradation. To estimatethe duration of the transient caused by the non-negligible times of the intakeprocess, both the intake and transcription processes were studied using the FSPalgorithm (Munsky and Khammash 2006). Both processes were modeled as d-stepprocesses, each step with an exponentially distributed duration corresponding toan elementary step. The models were fitted with experimental data in differentexperimental conditions and compared with a model where transcription is fullyactive since the first time moment of the observation window.
The cell-to-cell variability in RNA numbers increased transiently due to the intakeprocess. Relevantly, this effect was found to last for a long period after the startof induction, in that a large fraction of the population was slowly induced. Also,different intake mechanisms exhibited different dynamics which had non-negligibleeffects on the RNA population statistics. The regulation of gene activation mightbe an important source of variability in the population, as it allows additionalcoordination of transcription dynamics that is gene independent.
In Publication III, the dynamics of transcription initiation in closely spaced
55
promoters were investigated using stochastic nucleotide level models. Comparedto an isolated promoter, dynamics from closely spaced promoters is affectedby RNAps interfering with each other during binding, transcription initiation,and elongation (Sneppen et al. 2005). The mechanisms of interference includeocclusion, RNAp collisions, road blocks and sitting duck interference (see section2.4), which are easily modeled with the nucleotide level model, where boundRNAps and transcription factors reserve a range of nucleotides on the DNA.
First, the binding rate of RNAps to the promoter region was found to be non-uniform due to rate-limiting steps in transcription initiation. Importantly, thelocalization of the promoters’ start sites and the promoter’s geometry were foundto affect the distributions of intervals between transcription initiations due tothe interferences between the promoters. Also, the interference causes transientcorrelations between consecutive transcription initiations of the dual promotersystem, in that, the spatial closeness causes a promoter to be more likely toexpress more times in a row than if spatially more separated. This correlation isdependent on the existence of a multiple rate-limiting steps transcription initiationprocess and affected by the orientation and distance between promoter sites.
Next, repression mechanisms of transcription initiation were studied. A change inthe location of the repressor binding site leads to qualitatively distinct regulatorybehaviors, as it causes the repressor to interact differently with the transcriptionalmachinery. E.g. inhibiting the promoter binding, the transcription initiationrate is proportional to RNAP binding rate and can be reduced by increasing therepressor concentration. Meanwhile, inhibition of the open complex formation orpromoter escape is partially independent of the repressor numbers, as the fractionof time that gene is expressed, is also controlled by the dissociation constant ofthe repressor and the rate-limiting steps in transcription initiation.
Finally, a single repressor binding site can simultaneously repress both closelyspaced promoter sites. The mechanism by which the repression occurs differsbetween promoters, causing differences in repression strength. Relevantly, usingshared repression sites allow coordinating the activity between the promoter sites.
In Publication IV, the coupled transcription and translation elongation wasstudied using stochastic models of transcription and translation at the nucleotideand codon level. During transcription and translation elongation, alternativereaction pathways, including pausing, premature termination, and backtracking,can occur in various DNA template positions, in accordance with experimentaldata (see section 2.2.2). Consequently, transcription of a gene consisting of afew thousand nucleotides can give rise to complex dynamics. For example, thestochastic events during elongation affect the distribution of distances betweenelongating RNAps (Dobrzynski and Bruggeman 2009) and between elongatingribosomes (Mitarai et al. 2008), which gives rise to bursts in RNA and peptidesproduction. Further, collisions between elongating macromolecules can attenuatebursts introduced by transcription initiation (Dobrzynski and Bruggeman 2009).

56 Chapter 5. Conclusions and Discussion
To study the propagation of fluctuations, transcription and translation initiationrates were varied, as these directly affect the average distance between elongatingmacromolecules. To maintain the mean mRNA and protein levels unaltered withchanging initiation rates, the degradation of mRNA and protein species weretuned accordingly. Fluctuations in the RNA numbers were found to decreasewith increasing transcription initiation. This was due to the existence of apromoter open complex formation step, that was shown to reduce collisions andbursting between consecutive RNA productions. In the absence of this eventor significant reduction of its duration, the distribution of time intervals wouldbecome exponential-like. In this case, increasing initiation rates would lead tomore collisions with RNAps.
The fluctuations in the transcription process were found to propagate to translation,due to these processes being dynamically coupled. Reduction of the translationinitiation rate led to a decrease in ribosome traffic on the RNA, which consequentlyreduced the fluctuations in the protein numbers. Reduction in the fluctuation wasalso partly caused by the de-coupling of transcription and translation. This wasshown by calculating the normalized maximum correlation between time-series ofprotein and mRNA numbers for each set of parameters. Finally, transcriptionalstalling e.g. due to transcriptional arrests (Davenport et al. 2000) was found tosimultaneously affect both transcription and translation elongation processes.
Recent measurements with single molecule sensitivity have shown the extentof heterogeneity in mRNA and protein numbers in E. coli cells in homogenousenvironments (So et al. 2011; Taniguchi et al. 2010; Jones et al. 2014). While theobservation of full distributions of molecule numbers is interesting per se, dynamicsin single cells is more informative about the underlying processes. In particular,the possibility of observing single cell trajectories following single cell events, whencomplemented with modeling approaches, can provide mechanistic understandingof the processes underlying the kinetics (Norman et al. 2013; Nachman et al. 2007).The methodology of measuring time intervals between events or waiting timesfrom a perturbation, utilized in this thesis, can be used to understand molecularevents involved in, e.g., gene activation, repairing of DNA, switching between cellstates etc. (Norman et al. 2013; Uphoff et al. 2013). The properties of fluctuationson the time intervals inform about the mechanisms involved in the process andhypothesized mechanisms can be tested with modeling approaches, e.g. how themodel responds to perturbations (Uphoff et al. 2016).
Current methods of tagging RNAs with fluorescent proteins in live cells allowsimultaneous measurement of up to three different RNAs or regions of RNA, inaddition to a wide spectrum of fluorescent proteins that can be fused with targetproteins (Hocine et al. 2013; Lange et al. 2008; Bakshi et al. 2013). Even withlimited number of probes, careful selection of molecular species to probe wouldallow detection of sequential events in transcription, such as TF binding, opencomplex formation, elongation of the nascent RNA, and degradation of RNA
57
(Larson et al. 2011). Conceivably, all sequential steps resulting in gene expressioncould be monitored in individual cells. Advanced microscopy techniques, such ascombinatorial probe labeling (Lubeck and Cai 2012; Chen et al. 2015b), couldprovide methods to visualize all intermediates of the process in a single cell.
Naturally, genes do not act as independent units inside the cell, neither arethey the sole controllers of RNA and protein numbers. Several studies haveproposed that a large portion of the observed variability in mRNA and proteinnumbers arises from other sources than the transcription and translation processesthemselves (So et al. 2011; Taniguchi et al. 2010; Sanchez and Golding 2013). Non-gene-specific factors involved in transcription and translation, such as σ-factors,transcription regulators, ribosomes and RNA polymerases, have been shown tofluctuate significantly (Taniguchi et al. 2010; Bakshi et al. 2012; Yang et al. 2014).Additional mechanisms, including DNA replication, negative DNA supercoiling,asymmetric protein and mRNA partitioning during cell division, and cellularaging, contribute also to the observed RNA and protein numbers (Peterson et al.2015; Chong et al. 2014; Huh and Paulsson 2011; Lindner et al. 2008). It will beinteresting to quantify the contributions of these sources of fluctuations on thedynamics of gene expression in the future. This would provide a more embeddedview of gene expression and its association with the functioning of the organismas a whole.
Overall, gene expression has been shown to exhibit a wide range of dynamics,likely due to the existence of multiple regulatory mechanisms. Further, thepossibility of attaining similar kinetics through different mechanisms complicatesthe characterizing of a particular process. These complications ought to be tackledwith a combination of advanced measurement techniques and novel modelingapproaches. As most cellular processes depend on gene expression, the moredetails we understand of it, the more understanding we will have of cellularbehaviors in general.


Bibliography
Acar, M., Becskei, A., and van Oudenaarden, A. “Enhancement of cellular memoryby reducing stochastic transitions”. Nature 435.7039 (2005), pp. 228–232.
Adhya, S. and Gottesman, M. “Control of Transcription Termination”. AnnualReview of Biochemistry 47 (1978), pp. 967–996.
Adhya, S. and Gottesman, M. “Promoter occlusion: transcription through apromoter may inhibit its activity”. Cell 29.3 (1982), pp. 939–944.
Afroz, T., Biliouris, K., Kaznessis, Y., and Beisel, C. L. “Bacterial sugar utilizationgives rise to distinct single-cell behaviours”. Molecular Microbiology 93.6 (2014),pp. 1093–1103.
Alberts, B, Johnson, A, Lewis, J, Raff, M, Roberts, K, and Walter, P. MolecularBiology of the Cell. Garland Science, USA, 2002.
Amit, R., Garcia, H. G., Phillips, R., and Fraser, S. E. “Building enhancers fromthe ground up: A synthetic biology approach”. Cell 146.1 (2011), pp. 105–118.
Arkin, A., Ross, J., and Mcadams, H. H. “Stochastic Kinetic Analysis of Develop-mental Pathway Bifurcation in”. Genetics 149 (1998), pp. 1633–48.
Arndt, K. M. and Chamberlin, M. J. “Transcription termination in Escherichia coli:Measurement of the rate of enzyme release from rho-independent terminators”.Journal of Molecular Biology 202.2 (1988), pp. 271–285.
Axelrod, D. “Cell-substrate contacts illuminated by total internal reflection fluo-rescence”. Journal of Cell Biology 89.1 (1981), pp. 141–145.
Bakshi, S., Dalrymple, R. M., Li, W., Choi, H., and Weisshaar, J. C. “Partitioningof RNA polymerase activity in live Escherichia coli from analysis of single-molecule diffusive trajectories”. Biophysical Journal 105.12 (2013), pp. 2676–2686.
Bakshi, S., Siryaporn, A., Goulian, M., and Weisshaar, J. C. “Superresolutionimaging of ribosomes and RNA polymerase in live Escherichia coli cells”.Molecular Microbiology 85.1 (2012), pp. 21–38.
Balaban, N. Q., Merrin, J., Chait, R., Kowalik, L., and Leibler, S. “BacterialPersistence as a Phenotypic Switch”. Science 305 (2004), pp. 1622–1625.
Balazsi, G., van Oudenaarden, A., and Collins, J. J. “Cellular decision making andbiological noise: From microbes to mammals”. Cell 144.6 (2011), pp. 910–925.
59

60 Bibliography
Bar-Nahum, G. and Nudler, E. “Isolation and characterization of σ70-retainingtranscription elongation complexes from Escherichia coli”. Cell 106.4 (2001),pp. 443–51.
Beck, C. F. and Warren, R. A. “Divergent promoters, a common form of geneorganization.” Microbiological Reviews 52.3 (1988), pp. 318–326.
Belloni, A. and Didier, G. “On the Behrens-Fisher Problem: A globally convergentalgorithm and a finite-sample study of the wald, LR and LM tests”. Annals ofStatistics 36.5 (2008), pp. 2377–2408.
Bendtsen, K. M., Erdssy, J., Csiszovszki, Z., Svenningsen, S. L., Sneppen, K.,Krishna, S., and Semsey, S. “Direct and indirect effects in the regulation ofoverlapping promoters”. Nucleic Acids Research 39.16 (2011), pp. 6879–6885.
Bernstein, J. A., Khodursky, A. B., Lin-Chao, S, and Cohen, S. N. “Globalanalysis of mRNA decay and abundance in Escherichia coli at single-generesolution using two-color fluorescent DNA microarrays”. Proceedings of theNational Academy of Sciences of the United States of America 99.15 (2002),pp. 9697–9702.
Bertrand-Burggraf, E., Lefèvre, J. F., and Daune, M. “A new experimentalapproach for studying the association between RNA polymerase and the tetpromoter of pBR322”. Nucleic Acids Research 12.3 (1984), pp. 1697–1706.
Blattner, F. R., Plunkett, G. I., Bloch, A. C., Perna, T. N., Burland, V., Riley, M.,Collado-Vides, J., Glasner, D. J., Rode, K. C., Mayhew, F. G., Gregor, J.,Davis, W. N., Kirkpatrick, A. H., Goeden, A. M., Rose, J. D., Mau, B., andShao, Y. “The Complete Genome Sequence of Escherichia coli K-12”. Science277.5331 (1997), pp. 1453–1462.
Bratsun, D., Volfson, D., Tsimring, L. S., and Hasty, J. “Delay-induced stochasticoscillations in gene regulation.” Proceedings of the National Academy of Sciencesof the United States of America 102.41 (2005), pp. 14593–14598.
Bremer, H and Dennis, P. “Modulation of chemical composition and other pa-rameters of the cell by growth rate”. Neidhardt, F. (ed.). Washington, DC:American Society for Microbiology Press 122 (1996), p. 1553.
Browning, D. F. and Busby, S. J. W. “The regulation of bacterial transcriptioninitiation”. Nature Reviews Microbiology 2.1 (2004), pp. 57–65.
Buc, H and McClure, W. R. “Kinetics of open complex formation betweenEscherichia coli RNA polymerase and the lacUV5 promoter. Evidence fora sequential mechanism involving three steps.” Biochemistry 24.11 (1985),pp. 2712–2723.
Callen, B. P., Shearwin, K. E., and Egan, J. B. “Transcriptional interference be-tween convergent promoters caused by elongation over the promoter”. MolecularCell 14.5 (2004), pp. 647–656.
Chamberlin, M. “The selectivity of transcription”. Ann. Rev. Biochem. 43.3 (1974),pp. 721–775.
Chao, J. A., Patskovsky, Y., Almo, S. C., and Singer, R. H. “Structural basisfor the coevolution of a viral RNA-protein complex”. Nature Structural andMolecular Biology 15.1 (2008), pp. 103–105.
Bibliography 61
Chen, H., Shiroguchi, K., Ge, H., and Xie, X. S. “Genome-wide study of mRNAdegradation and transcript elongation in Escherichia coli”. Molecular SystemsBiology 11.781 (2015), pp. 1–11.
Chen, K. H., Boettiger, A. N., Moffitt, J. R., Wang, S., and Zhuang, X. “Spatiallyresolved, highly multiplexed RNA profiling in single cells.” Science 348.6233(2015), aaa6090.
Cho, B.-K., Zengler, K, Qiu, Y, Park, Y. S., Knight, E. M., Barrett, C. L., andB, P. “The transcription unit architecture of the Escherichia coli genome”.Nature Biotechnology 27 (2009), pp. 1043–1049.
Choi, P. J., Xie, X. S., and Shakhnovich, E. I. “Stochastic Switching in GeneNetworks Can Occur by a Single-Molecule Event or Many Molecular Steps”.Journal of Molecular Biology 396.1 (2010), pp. 230–244.
Choi, P., Cai, L., Frieda, K, and Xie, X. “A stochastic single-molecule eventtriggers phenotype switching of a bacterial cell”. Science 322 (2008), pp. 442–446.
Chong, S., Chen, C., Ge, H., and Xie, X. S. “Mechanism of TranscriptionalBursting in Bacteria”. Cell 158.2 (2014), pp. 314–326.
Chowdhury, S., Kandhavelu, M., Yli-Harja, O., and Ribeiro, A. S. “Cell seg-mentation by multi-resolution analysis and maximum likelihood estimation(MAMLE).” BMC Bioinformatics 14 Suppl 1.10 (2013), S8.
Chowdhury, S., Lloyd-Price, J., Smolander, O.-P., Baici, W. C. V., Hughes, T. R.,Yli-Harja, O., Chua, G., and Ribeiro, A. S. “Information propagation withinthe Genetic Network of Saccharomyces cerevisiae.” BMC systems biology 4.1(2010), p. 143.
Cormack, B. P., Valdivia, R. H., and Falkow, S. “FACS-optimized mutants of thegreen fluorescent protein (GFP).” Gene 173.1 (1996), pp. 33–38.
Coulon, A., Chow, C. C., Singer, R. H., and Larson, D. R. “Eukaryotic transcrip-tional dynamics: from single molecules to cell populations.” Nature reviews.Genetics 14.8 (2013), pp. 572–584.
Courtney, C. M. and Chatterjee, A. “cis-Antisense RNA and TranscriptionalInterference: Coupled Layers of Gene Regulation”. Journal of Gene Therapy2.1 (2014), p. 9.
Crick, F. “Central Dogma of Molecular Biology”. Nature 227 (1970), pp. 561–563.Daigle, N. and Ellenberg, J. “λN-GFP: an RNA reporter system for live-cellimaging”. Nature Methods 4 (2007), pp. 633–636.
Dangkulwanich, M., Ishibashi, T., Bintu, L., and Bustamante, C. “Molecularmechanisms of transcription through single-molecule experiments”. ChemicalReviews 114.6 (2014), pp. 3203–3223.
Davenport, R. J., Wuite, Gijs, J. L., Landick, R., and Bustamante, C. “Single-Molecule Study of Transcriptional Pausing and Arrest by E. coli RNA Poly-merase”. Science 287 (2000), p. 2497.
Davis, C. A., Bingman, C. A., Landick, R., Record, M. T., and Saecker, R. M.“Real-time footprinting of DNA in the first kinetically significant intermediatein open complex formation by Escherichia coli RNA polymerase.” Proceedings

62 Bibliography
of the National Academy of Sciences of the United States of America 104.19(2007), pp. 7833–7838.
Day, R. N. and Davidson, M. W. “The fluorescent protein palette: tools for cellularimaging”. Chem Soc Rev 38.10 (2009), pp. 2887–2921.
Desobry, F, Doncarli, M. D. C., Davy, M., and Doncarli, C. “An online KernelChange Detection Algorithm”. IEEE Transactions on Signal Processing 53.8(2005), pp. 2961–2974.
Dobrzynski, M. and Bruggeman, F. J. “Elongation dynamics shape bursty tran-scription and translation.” Proceedings of the National Academy of Sciences ofthe United States of America 106.8 (2009), pp. 2583–2588.
Eliasson, A, Bernander, R, Dasgupta, S, and Nordström, K. “Direct visualizationof plasmid DNA in bacterial cells.” Molecular Microbiology 6.2 (1992), pp. 165–170.
Elowitz, M. B., Levine, A. J., Siggia, E. D., and Swain, P. S. “Stochastic geneexpression in a single cell.” Science 297.5584 (2002), pp. 1183–1186.
Englesberg, E., Irr, J., Power, J., and Lee, N. “Positive Control of EnzymeSynthesis by Gene C in the Positive Control of Enzyme Synthesis by Gene C inthe L-Arabinose System”. Journal of Bacteriology 90.4 (1965), pp. 946–957.
Erie, D., Hajiseyedjavadi, O, Young, M., and Hippel, P. von. “Multiple RNApolymerase conformations and GreA: control of the fidelity of transcription”.Science 262.5135 (1993), pp. 867–873.
Errington, J. “Regulation of endospore formation in Bacillus subtilis”. NatureReviews Microbiology 1.2 (2003), pp. 117–126.
Fang, G., Rocha, E. P. C., and Danchin, A. “Persistence drives gene clustering inbacterial genomes”. BMC Genomics 9 (2008), p. 4.
Farabaugh, P. J. “Programmed translational frameshifting.” Annual Review ofGenetics 30.1 (1996), pp. 507–528.
Femino, A. M. “Visualization of Single RNA Transcripts in Situ”. Science 280.5363(1998), pp. 585–590.
Fisher, R. “The comparison of samples with possibly unequal variances”. Ann.Eugenics 9 (1939), pp. 174–180.
Friedman, L. J. and Gelles, J. “Mechanism of transcription initiation at anactivator-dependent promoter defined by single-molecule observation”. Cell148.4 (2012), pp. 679–689.
Friedman, L. J., Mumm, J. P., and Gelles, J. “RNA polymerase approaches itspromoter without long-range sliding along DNA.” Proceedings of the NationalAcademy of Sciences of the United States of America 110.24 (2013), pp. 9740–5.
Fritz, G., Megerle, J. A., Westermayer, S. A., Brick, D., Heermann, R., Jung, K.,Rädler, J. O., and Gerland, U. “Single cell kinetics of phenotypic switching inthe arabinose utilization system of E. coli”. PLoS ONE 9.2 (2014).
Fusco, D., Accornero, N., Lavoie, B., Shenoy, S. M., Blanchard, J. M., Singer, R. H.,and Bertrand, E. “Single mRNA molecules demonstrate probabilistic movementin living mammalian cells”. Current Biology 13.2 (2003), pp. 161–167.
Bibliography 63
Gaffney, E. A. and Monk, N. A. M. “Gene Expression Time Delays and TuringPattern Formation Systems Gene Expression Time Delays and Turing PatternFormation Systems”. Bulletin of Mathematical Biology 68 (2006), pp. 99–130.
Gama-Castro, S., Salgado, H., Peralta-Gil, M., Santos-Zavaleta, A., Muniz-Rascado, L., Solano-Lira, H., Jimenez-Jacinto, V., Weiss, V., García-Sotelo,J. S., López-Fuentes, A., Porrón-Sotelo, L., Alquicira-Hernández, S., Medina-Rivera, A., Martínez-Flores, I., Alquicira-Hernández, K., Martínez-Adame, R.,Bonavides-Martínez, C., Miranda-Ríos, J., Huerta, A. M., Mendoza-Vargas,A., Collado-Torres, L., Taboada, B., Vega-Alvarado, L., Olvera, M., Olvera,L., Grande, R., Morett, E., and Collado-Vides, J. “RegulonDB version 7.0:Transcriptional regulation of Escherichia coli K-12 integrated within geneticsensory response units (Gensor Units)”. Nucleic Acids Research 39.SUPPL. 1(2011), pp. 98–105.
Garcia, H. G., Sanchez, A., Boedicker, J. Q., Osborne, M., Gelles, J., Kondev, J.,and Phillips, R. “Operator sequence alters gene expression independently oftranscription factor occupancy in bacteria”. Cell Reports 2.1 (2012), pp. 150–161.
Garcia, H. G., Sanchez, A., Kuhlman, T., Kondev, J., and Phillips, R. “Tran-scription by the numbers redux: Experiments and calculations that surprise”.Trends in Cell Biology 20.12 (2010), pp. 723–733.
Gardner, T. S., Cantor, C. R., and Collins, J. J. “Construction of a genetic toggleswitch in Escherichia coli”. Nature 403.6767 (2000), pp. 339–342.
Gasnier, M., Dennis, C., Vaurs-Barrière, C., and Chazaud, C. “Fluorescent mRNAlabeling through cytoplasmic FISH.” Nature protocols 8.12 (2013), pp. 2538–47.
Gelles, J., Schnapp, B. J., and Sheetz, M. P. “Tracking kinesin-driven movementswith nanometre-scale precision”. Nature 331 (1988), pp. 450–453.
Gibson, M. A. and Bruck, J. “Efficient Exact Stochastic Simulation of ChemicalSystems with Many Species and Many Channels”. The Journal of PhysicalChemistry A 104.9 (2000), pp. 1876–1889.
Gillespie, D. T. “A general method for numerically simulating the stochastic timeevolution of coupled chemical reactions”. Journal of Computational Physics22.4 (1976), pp. 403–434.
Gillespie, D. T. “A rigorous derivation of the chemical master equation”. PhysicaA: Statistical Mechanics and its Applications 188.1-3 (1992), pp. 404–425.
Gillespie, D. T. “Exact Stochastic Simulation of Coupled Chemical Reactions”.The Journal of Physical Chemistry 81.25 (1977), pp. 2340–2361.
Gillespie, D. T. “Stochastic simulation of chemical kinetics.” Annual Review ofPhysical Chemistry 58 (2007), pp. 35–55.
Golding, I. and Cox, E. C. “RNA dynamics in live Escherichia coli cells.” Pro-ceedings of the National Academy of Sciences of the United States of America101.31 (2004), pp. 11310–11315.
Golding, I., Paulsson, J., Zawilski, S. M., and Cox, E. C. “Real-time kinetics ofgene activity in individual bacteria.” Cell 123.6 (2005), pp. 1025–1036.
64 Bibliography
Goldman, S. R., Ebright, R. H., and Nickels, B. E. “Direct detection of abortiveRNA transcripts in vivo.” Science 324.5929 (2009), pp. 927–8.
Greive, S. J. and Von Hippel, P. H. “Thinking quantitatively about transcriptionalregulation.” Nature Reviews Molecular Cell Biology 6.3 (2005), pp. 221–232.
Gupta, A., Lloyd-Price, J., and Ribeiro, A. S. “In silico analysis of division timesof Escherichia coli populations as a function of the partitioning scheme ofnon-functional proteins”. In Silico Biology 12.1-2 (2015), pp. 9–21.
Ha, T. and Tinnefeld, P. “Photophysics of Fluorescence Probes for Single MoleculeBiophysics and Super-Resolution Imaging”. Annu Rev Phys Chem 63.2 (2012),pp. 595–617.
Haim, L., Zipor, G., Aronov, S., and Gerst, J. E. “A genomic integration methodto visualize localization of endogenous mRNAs in living yeast”. Nature Methods4 (2007), pp. 409–412.
Häkkinen, A. and Ribeiro, A. S. “Estimation of GFP-tagged RNA numbers fromtemporal fluorescence intensity data”. Bioinformatics 31.1 (2015), pp. 69–75.
Häkkinen, A., Kandhavelu, M., Garasto, S., and Ribeiro, A. S. “Estimation offluorescence-tagged RNA numbers from spot intensities”. Bioinformatics 30.8(2014), pp. 1146–1153.
Häkkinen, A., Healy, S., Jacobs, H. T., and Ribeiro, A. S. “Genome wide studyof NF-Y type CCAAT boxes in unidirectional and bidirectional promoters inhuman and mouse”. Journal of Theoretical Biology 281.1 (2011), pp. 74–83.
Hammar, P., Leroy, P., Mahmutovic, a., Marklund, E. G., Berg, O. G., and Elf,J. “The lac Repressor Displays Facilitated Diffusion in Living Cells”. Science336.6088 (2012), pp. 1595–1598.
Hammar, P., Walldén, M., Fange, D., Persson, F., Baltekin, O., Ullman, G., Leroy,P., and Elf, J. “Direct measurement of transcription factor dissociation excludesa simple operator occupancy model for gene regulation.” Nature Genetics 46.4(2014), pp. 405–8.
Harchaoui, Z, Bach, F, and Moulines, E. “Kernel Change-point Analysis”. Advancesin Neural Information Processing Systems (NIPS) 21 (2009), pp. 609–616.
Harden, T. T., Wells, C. D., Friedman, L. J., Landick, R., Hochschild, A., Kon-dev, J., and Gelles, J. “Bacterial RNA polymerase can retain σ70 throughouttranscription”. Proceedings of the National Academy of Sciences of the UnitedStates of America 113.3 (2016), pp. 602–607.
Harley, C. B. and Reynolds, R. P. “Analysis of E. coli promoter sequences.”Nucleic Acids Research 15.5 (1987), pp. 2343–2361.
Hawley, D. K., Johnson, A. D., and McClure, W. R. “Functional and physicalcharacterisation of transcription initiation complexes in the bacteriophagelambda O R region”. J.Biol.Chem. 260.14 (1985), pp. 8618–8626.
Helling, R and Weinberg, R. “Complementation studies of arabinose genes inEscherichia coli”. Genetics 48 (1963), pp. 1397–1410.
Heltzel, A, Lee, I., Totis, P., and Summers, A. “Activator-dependent preinductionbinding of sigma-70 RNA polymerase at the metal-regulated mer promoter”.Biochemistry 29 (1990), pp. 9572–9584.
Bibliography 65
Hensel, Z., Feng, H., Han, B., Hatem, C., Wang, J., and Xiao, J. “Stochasticexpression dynamics of a transcription factor revealed by single-molecule noiseanalysis”. Nature Structural and Molecular Biology 19.8 (2012), pp. 797–802.
Herbert, K. M., Zhou, J., Mooney, R. A., Porta, A. L., Landick, R., and Block, S.M. “E. coli NusG inhibits backtracking and accelerates pause-free transcriptionby promoting forward translocation of RNA polymerase”. Journal of MolecularBiology 399.1 (2010), pp. 17–30.
Herbert, K. M., La Porta, A., Wong, B. J., Mooney, R. A., Neuman, K. C.,Landick, R., and Block, S. M. “Sequence-Resolved Detection of Pausing bySingle RNA Polymerase Molecules”. Cell 125.6 (2006), pp. 1083–1094.
Hippel, P. H. von, Bear, D. G., Morgan, W. D., and McSwiggen, J. A. “Protein-Nucleic Acid Interactions in Transcription: A Molecular Analysis”. AnnualReview of Biochemistry 53 (1984), pp. 389–446.
Hocine, S., Raymond, P., Zenklusen, D., Chao, J. a., and Singer, R. H. “Single-molecule analysis of gene expression using two-color RNA labeling in live yeast.”Nature Methods 10.2 (2013), pp. 119–21.
Hogg, R. W. and Englesberg, E. “L-arabinose binding protein from Escherichiacoli B/r.” Journal Of Bacteriology 100.1 (1969), pp. 423–432.
Hsu, L. M. “Promoter clearance and escape in prokaryotes.” Biochimica et Bio-physica Acta 1577.2 (2002), pp. 191–207.
Hsu, L. M., Vo, N. V., Kane, C. M., and Chamberlin, M. J. “In vitro studiesof transcript initiation by Escherichia coli RNA polymerase. 1. RNA chaininitiation, abortive initiation, and promoter escape at three bacteriophagepromoters”. Biochemistry 42.13 (2003), pp. 3777–3786.
Huang, B., Bates, M., and Zhuang, X. “Super resolution fluorescence microscopy”.Annual Review of Biochemistry 78 (2009), pp. 993–1016.
Huh, D. and Paulsson, J. “Non-genetic heterogeneity from stochastic partitioningat cell division.” Nature Genetics 43.2 (2011), pp. 95–100.
Huo, Y. X., Tian, Z. X., Rappas, M., Wen, J., Chen, Y. C., You, C. H., Zhang, X.,Buck, M., Wang, Y. P., and Kolb, A. “Protein-induced DNA bending clarifiesthe architectural organization of the sigma-54-dependent glnAp2 promoter”.Molecular Microbiology 59.1 (2006), pp. 168–180.
Jacob, F., Perrin, D., Sánchez, C., and Monod, J. “The Operon: A Group of GenesWhose Expression is Coordinated by an Operator”. C R Hebd Seances AcadSci. 250 (1960), pp. 1727–1729.
Johnson, C. M. and Schleif, R. F. “In vivo induction kinetics of the arabinosepromoters in Escherichia coli.” Journal Of Bacteriology 177.12 (1995), pp. 3438–3442.
Jones, D. L., Brewster, R. C., and Phillips, R. “Promoter architecture dictatescell-to-cell variability in gene expression”. Science 346.6216 (2014), pp. 1533–1537.
Kaern, M., Elston, T. C., Blake, W. J., and Collins, J. J. “Stochasticity in geneexpression: from theories to phenotypes.” Nature Reviews Genetics 6.6 (2005),pp. 451–64.
66 Bibliography
Kanamori, T., Hido, S., and Sugiyama, M. “A Least-squares Approach to DirectImportance Estimation”. Journal of Machine Learning Research 10 (2009),pp. 1391–1445.
Kandhavelu, M, Häkkinen, A, Yli-Harja, O., and Ribeiro, A. S. “Single-moleculedynamics of transcription of the lar promoter”. Physical Biology 9 (2012),p. 026004.
Kandhavelu, M., Mannerström, H., Gupta, A., Häkkinen, A., Lloyd-Price, J.,Yli-Harja, O., and Ribeiro, A. S. “In vivo kinetics of transcription initiation ofthe lar promoter in Escherichia coli. Evidence for a sequential mechanism withtwo rate-limiting steps.” BMC Systems Biology 5.1 (2011), p. 149.
Kandhavelu, M., Lloyd-Price, J., Gupta, A., Muthukrishnan, A.-B., Yli-Harja, O.,and Ribeiro, A. S. “Regulation of mean and noise of the in vivo kinetics oftranscription under the control of the lac/ara-1 promoter.” FEBS letters 586.21(2012), pp. 3870–3875.
Kapanidis, A. N., Margeat, E., Ho, S. O., Kortkhonjia, E., Weiss, S., and Ebright,R. H. “Initial transcription by RNA polymerase proceeds through a DNA-scrunching mechanism.” Science 314.5802 (2006), pp. 1144–1147.
Kapanidis, A. N., Margeat, E., Laurence, T. A., Doose, S., Ho, S. O., Mukhopad-hyay, J., Kortkhonjia, E., Mekler, V., Ebright, R. H., and Weiss, S. “Retentionof transcription initiation factor σ70 in transcription elongation: Single-moleculeanalysis”. Molecular Cell 20.3 (2005), pp. 347–356.
Kawahara, Y and Sugiyama, M. “Change-Point Detection in Time-Series Databy Relative Density-Ratio Estimation”. Proc of 9th SIAM Int Conf on DataMining 1 (2009), pp. 385–396.
Kearns, D. B. and Losick, R. “Cell population heterogeneity during growth ofBacillus subtilis”. Genes Dev 19.24 (2005), pp. 3083–3094.
Keiler, K. C. “Biology of trans-Translation”. Annual Review of Microbiology 62.1(2008), pp. 133–151.
Kerppola, T. K. “Visualization of molecular interactions by fluorescence com-plementation”. Nature Reviews Molecular Cell Biology 7.6 (2006), pp. 449–456.
Keryer-Bibens, C., Barreau, C., and Osborne, H. B. “Tethering of proteins toRNAs by bacteriophage proteins.” Biology of the Cell 100.2 (2008), pp. 125–138.
Khlebnikov, A, Datsenko, K. A., Skaug, T, Wanner, B. L., and Keasling, J.D. “Homogeneous expression of the P-BAD promoter in Escherichia coli byconstitutive expression of the low-affinity high-capacity AraE transporter.”Microbiology 147.Pt 12 (2001), pp. 3241–3247.
Kimchi-Sarfaty, C, Oh, J., Kim, I., Sauna, Z., Calcagno, A., Ambudkar, S., andGottesman, M. “A "silent" polymorphism in the MDR1 gene changes substratespecificity”. Science 315.5811 (2007), pp. 525–528.
Kiviet, D. J., Nghe, P., Walker, N., Boulineau, S., Sunderlikova, V., and Tans,S. J. “Stochasticity of metabolism and growth at the single-cell level”. Nature514.7522 (2014), pp. 376–379.
Bibliography 67
Klumpp, S. and Hwa, T. “Stochasticity and traffic jams in the transcription ofribosomal RNA: Intriguing role of termination and antitermination.” Proceedingsof the National Academy of Sciences of the United States of America 105.47(2008), pp. 18159–18164. arXiv: 0811.3163.
Klumpp, S., Zhang, Z., and Hwa, T. “Growth Rate-Dependent Global Effects onGene Expression in Bacteria”. Cell 139.7 (2009), pp. 1366–1375.
Konopka, C. A. and Bednarek, S. Y. “Variable-angle epifluorescence microscopy:A new way to look at protein dynamics in the plant cell cortex”. Plant Journal53.1 (2008), pp. 186–196.
Korbel, J. O., Jensen, L. J., Von Mering, C., and Bork, P. “Analysis of genomiccontext: prediction of functional associations from conserved bidirectionallytranscribed gene pairs”. Nature Biotechnology 22.7 (2004), pp. 911–917.
Krummel, B. and Chamberlin, M. J. “RNA Chain Initiation by Escherichiacoli RNA polymerase. Structural Transitions of the Enzyme in Early TernaryComplexes”. Biochemistry 28 (1989), pp. 7829–7842.
Kudla, G, Murray, A., Tollervey, D, and Plotkin, J. “Coding-Sequence Determi-nants of Gene Expression in Escherichia coli”. Science 324 (2009), pp. 255–258.
Landick, R. “The regulatory roles and mechanism of transcriptional pausing.”Biochemical Society transactions 34.Pt 6 (2006), pp. 1062–1066.
Landick, R. “Transcriptional pausing without backtracking.” Proceedings of theNational Academy of Sciences of the United States of America 106.22 (2009),pp. 8797–8798.
Lange, S., Katayama, Y., Schmid, M., Burkacky, O., Brauchle, C., Lamb D.C.,D. C., and Jansen, R. P. “Simultaneous transport of different localized mRNAspecies revealed by live-cell imaging”. Traffic 9.8 (2008), pp. 1256–1267.
Larson, D. R., Zenklusen, D., Wu, B., Chao, J. A., and Singer, R. H. “Real-timeobservation of transcription initiation and elongation on an endogenous yeastgene.” Science 332.6028 (2011), pp. 475–478.
Lawrence, J. G. and Roth, J. R. “Selfish operons: Horizontal transfer may drivethe evolution of gene clusters”. Genetics 143.4 (1996), pp. 1843–1860.
Lawrence, J. “Gene organization: Selection, selfishness, and serendipity”. AnnualReview of Microbiology 57 (2003), pp. 419–440.
Lecuyer, E., Yoshida, H., Parthasarathy, N., Alm, C., Babak, T., Cerovina, T.,Hughes, T. R., Tomancak, P., and Krause, H. M. “Global Analysis of mRNALocalization Reveals a Prominent Role in Organizing Cellular Architecture andFunction”. Cell 131.1 (2007), pp. 174–187.
Lee, J. H., Al-Zarban, S., and Wilcox, G. “Genetic characterization of the araEgene in Salmonella typhimurium LT2”. Journal of Bacteriology 146.1 (1981),pp. 298–304.
Lee, J. and Goldfarb, A. “Lac repressor acts by modifying the initial transcribingcomplex so that it cannot leave the promoter”. Cell 66.4 (1991), pp. 793–798.

68 Bibliography
Lee, P. S. and Lee, K. H. “Escherichia coli - A Model System That Benefitsfrom and Contributes to the Evolution of Proteomics”. Biotechnology andBioengineering 84.7 (2003), pp. 801–814.
Leibler, S. and Kussell, E. “Individual histories and selection in heterogeneouspopulations.” Proceedings of the National Academy of Sciences of the UnitedStates of America 107.29 (2010), pp. 13183–13188.
Lelong, C., Aguiluz, K., Luche, S., Kuhn, L., Garin, J., Rabilloud, T., andGeiselmann, J. “The Crl-RpoS regulon of Escherichia coli.” Molecular andCellular Proteomics 6.4 (2007), pp. 648–659.
Lewis, K. “Persister cells, dormancy and infectious disease”. Nature ReviewsMicrobiology 5.1 (2007), pp. 48–56.
Li, H. and Petzold, L. R. “Logarithmic Direct Method for Discrete StochasticSimulation of Chemically Reacting Systems”. Technical Report (2006), pp. 1–11.
Lindner, A. B., Madden, R., Demarez, A., Stewart, E. J., and Taddei, F. “Asym-metric segregation of protein aggregates is associated with cellular aging andrejuvenation.” Proceedings of the National Academy of Sciences of the UnitedStates of America 105.8 (2008), pp. 3076–81.
Lloyd-Price, J., Gupta, A., and Ribeiro, A. S. “SGNS2: A CompartmentalizedStochastic Chemical Kinetics Simulator for Dynamic Cell Populations”. Bioin-formatics 28.22 (2012), pp. 3004–3005.
Lu, H. P., Xun, L, and Xie, X. S. “Single-molecule enzymatic dynamics.” Science282 (1998), pp. 1877–1882.
Lubeck, E. and Cai, L. “Single-cell systems biology by super-resolution imagingand combinatorial labeling”. Nature Methods 9 (2012), pp. 743–748.
Lutz, R. and Bujard, H. “Independent and tight regulation of transcriptional unitsin Escherichia coli via the LacR/O, the TetR/O and AraC/I1-I 2 regulatoryelements”. Nucleic Acids Research 25.6 (1997), pp. 1203–1210.
Lutz, R., Lozinski, T., Ellinger, T., and Bujard, H. “Dissecting the functionalprogram of Escherichia coli promoters: the combined mode of action of Lacrepressor and AraC activator”. Nucleic Acids Research 29.18 (2001), pp. 3873–3881.
McAdams, H. H. and Arkin, A. “Stochastic mechanisms in gene expression.”Proceedings of the National Academy of Sciences of the United States of America94.3 (1997), pp. 814–9.
McClure, W. R. “Mechanism and control of transcription initiation in prokaryotes.”Annual Review of Biochemistry 54 (1985), pp. 171–204.
McClure, W. R. “Rate-limiting steps in RNA chain initiation.” Proceedings of theNational Academy of Sciences of the United States of America 77.10 (1980),pp. 5634–5638.
McClure, W. R., Cech, C. L., and Johnston, D. E. “A steady state assay forthe RNA polymerase initiation reaction.” The Journal of Biological Chemistry253.24 (1978), pp. 8941–8.
Bibliography 69
Megerle, J. A., Fritz, G., Gerland, U., Jung, K., and Rädler, J. O. “Timing anddynamics of single cell gene expression in the arabinose utilization system”.Biophysical Journal 95.4 (2008), pp. 2103–2115.
Miller, O. L., Hamkalo, B. A., and Thomas, C. A. “Visualization of bacterialgenes in action.” Science 169.943 (1970), pp. 392–395.
Mitarai, N., Sneppen, K., and Pedersen, S. “Ribosome Collisions and TranslationEfficiency: Optimization by Codon Usage and mRNA Destabilization”. Journalof Molecular Biology 382.1 (2008), pp. 236–245.
Montero Llopis, P., Jackson, A. F., Sliusarenko, O., Surovtsev, I., Heinritz, J.,Emonet, T., and Jacobs-Wagner, C. “Spatial organization of the flow of geneticinformation in bacteria.” Nature 466.7302 (2010), pp. 77–81.
Moore, S. D. and Sauer, R. T. “Ribosome rescue: tmRNA tagging activity andcapacity in Escherichia coli”. Molecular Microbiology 58.2 (2005), pp. 456–466.
Morgan-Kiss, R. M., Wadler, C., and Cronan, J. E. “Long-term and homogeneousregulation of the Escherichia coli araBAD promoter by use of a lactose trans-porter of relaxed specificity”. Proceedings of the National Academy of Sciencesof the United States of America 99.11 (2002), pp. 7373–7377.
Munsky, B. E. “The Finite State Projection Approach for the Solution of theMaster Equation and its Applications to Stochastic Gene Regulatory Networks”.PhD thesis. University of California, 2008.
Munsky, B. and Khammash, M. “The finite state projection algorithm for thesolution of the chemical master equation.” Journal of Chemical Physics 124.4(2006), p. 044104.
Munsky, B. and Khammash, M. “The finite state projection approach for theanalysis of stochastic noise in gene networks”. IEEE Transactions on AutomaticControl 53 (2008), pp. 201–214.
Munsky, B., Fox, Z., and Neuert, G. “Integrating single-molecule experimentsand discrete stochastic models to understand heterogeneous gene transcriptiondynamics”. Methods 85 (2015), pp. 12–21.
Murakami, K. S., Masuda, S., Campbell, E. A., Muzzin, O., and Darst, S. A.“Structural basis of transcription initiation: an RNA polymerase holoenzyme-DNA complex.” Science 296.5571 (2002), pp. 1285–1290.
Muthukrishnan, A.-B., Kandhavelu, M., Lloyd-Price, J., Kudasov, F., Chowdhury,S., Yli-Harja, O., and Ribeiro, A. S. “Dynamics of transcription driven by thetetA promoter, one event at a time, in live Escherichia coli cells.” Nucleic AcidsResearch 40.17 (2012), pp. 8472–8483.
Nachman, I., Regev, A., and Ramanathan, S. “Dissecting Timing Variability inYeast Meiosis”. Cell 131.3 (2007), pp. 544–556.
Nakano, A. “Spinning-disk confocal microscopy – a cutting-edge tool for imagingof membrane traffic.” Cell Structure and Function 27.5 (2002), pp. 349–355.
Nath, S. and Guha, A. “Abortive termination of bioBFCD RNA synthesized invitro from the bioABFCD operon of Escherichia coli K-12”. Proceedings ofthe National Academy of Sciences of the United States of America 79.6 (1982),pp. 1786–1790.
70 Bibliography
Neidhardt, F, Ingraham, J, and Schaechter, M. Physiology of the Bacterial Cell:A Molecular Approach. Sunauer Associates, Sunderland, MA., 1990.
Neubauer, Z. and Calef, E. “Immunity phase-shift in defective lysogens: Non-mutational hereditary change of early regulation of prophage”. Journal ofMolecular Biology 51.1 (1970), pp. 1–13.
Neuert, G., Munsky, B., Tan, R. Z., Teytelman, L., Khammash, M., and vanOudenaarden, A. “Systematic Identification of Signal-Activated Stochastic GeneRegulation”. Science 339.6119 (2013), pp. 584–587.
Norman, T. M., Lord, N. D., Paulsson, J., and Losick, R. “Memory and modularityin cell-fate decision making.” Nature 503.7477 (2013), pp. 481–6.
Norman, T. M., Lord, N. D., Paulsson, J., and Losick, R. “Stochastic Switching ofCell Fate in Microbes.” Annual Review of Microbiology 69 (2015), pp. 381–403.
Novick, A. and Weiner, M. “Enzyme induction as and all-or-nothing phenomenon”.Proc Natl Acad Sci U S A 43.7 (1957), pp. 553–566.
Oliveira, S. M. D., Neeli-Venkata, R., Goncalves, N. S. M., Santinha, J. A., Martins,L., Tran, H., Mäkelä, J., Gupta, A., Barandas, M., Häkkinen, A., Lloyd-Price,J., Fonseca, J. M., and Ribeiro, A. S. “Increased cytoplasm viscosity hampersaggregate polar segregation in Escherichia coli”. Molecular Microbiology 99.4(2016), pp. 686–699.
Osbourn, A. E. and Field, B. “Operons”. Cellular and Molecular Life Sciences66.23 (2009), pp. 3755–3775.
Otsu, N. “A threshold selection method from gray-level histograms”. IEEE Trans.Sys. Man. Cyber. 9.1 (1979), pp. 62–66.
Ozbudak, E. M., Thattai, M., Lim, H. N., Shraiman, B. I., and van Oudenaarden,A. “Multistability in the lactose utilization network of Escherichia coli.” Nature427.6976 (2004), pp. 737–740.
Patrick, M., Dennis, P. P., Ehrenberg, M., and Bremer, H. “Free RNA polymerasein E. coli”. Biochimie 119 (2015), pp. 80–91.
Paulsson, J and Ehrenberg, M. “Noise in a minimal regulatory network: plasmidcopy number control.” Quarterly reviews of biophysics 34.1 (2001), pp. 1–59.
Paulsson, J. “Models of stochastic gene expression”. Physics of Life Reviews 2.2(2005), pp. 157–175.
Paulsson, J. “Summing up the noise in gene networks.” Nature 427.6973 (2004),pp. 415–8.
Pawley, J. E. Handbook of Biological Confocal Microscopy (3rd ed.) Berlin: Springer,2006.
Pedersen, S. “Escherichia coli ribosomes translate in vivo with variable rate.” TheEMBO journal 3.12 (1984), pp. 2895–2898.
Pedraza, J. M. and Paulsson, J. “Effects of molecular memory and bursting onfluctuations in gene expression.” Science 319.5861 (2008), pp. 339–343.
Peterson, J. R., Cole, J. A., Fei, J., Ha, T., and Luthey-Schulten, Z. A. “Effectsof DNA replication on mRNA noise”. Proceedings of the National Academy ofSciences of the United States of America 112.52 (2015), pp. 15886–15891.
Bibliography 71
Pitchiaya, S., Heinicke, L. a., Custer, T. C., and Walter, N. G. “Single moleculefluorescence approaches shed light on intracellular RNAs”. Chemical Reviews114.6 (2014), pp. 3224–3265.
Potapov, I., Mäkelä, J., Yli-Harja, O., and Ribeiro, A. S. “Effects of codon sequenceon the dynamics of genetic networks.” Journal of Theoretical Biology 315 (2012),pp. 17–25.
Prasher, D. C., Eckenrode, V. K., Ward, W. W., Prendergast, F. G., and Cormier,M. J. “Primary structure of the Aequorea victoria green-fluorescent protein”.Gene 111.2 (1992), pp. 229–233.
Pratt, L. and Silhavy, T. “Crl stimulates RpoS activity during stationary phase”.Molecular Microbiology 29.5 (1998), pp. 1225–1236.
Prescott, E. M. and Proudfoot, N. J. “Transcriptional collision between convergentgenes in budding yeast.” Proceedings of the National Academy of Sciences ofthe United States of America 99.13 (2002), pp. 8796–801.
Proshkin, S., Rahmouni, A. R., Mironov, A., and Nudler, E. “Cooperation betweentranslating ribosomes and RNA polymerase in transcription elongation.” Science328.5977 (2010), pp. 504–8.
Raffaelle, M., Kanin, E. I., Vogt, J., Burgess, R. R., and Ansari, A. Z. “Holoenzymeswitching and stochastic release of sigma factors from RNA polymerase in vivo”.Molecular Cell 20.3 (2005), pp. 357–366.
Raj, A., Bogaard, P. van den, Rifkin, S. A., van Oudenaarden, A., and Tyagi, S.“Imaging individual mRNA molecules using multiple singly labeled probes”.Nature Methods 5.1 (2008), pp. 877–879.
Raj, A. and van Oudenaarden, A. “Single-molecule approaches to stochastic geneexpression.” Annual Review of Biophysics 38 (2009), pp. 255–270.
Raj, A., Rifkin, S. A., Andersen, E., and van Oudenaarden, A. “Variability in geneexpression underlies incomplete penetrance.” Nature 463.7283 (2010), pp. 913–918.
Rajala, T., Häkkinen, A., Healy, S., Yli-Harja, O., and Ribeiro, A. S. “Effects oftranscriptional pausing on gene expression dynamics”. PLoS ComputationalBiology 6.3 (2010), pp. 29–30.
Ramakrishnan, V. “Ribosome structure and the mechanism of translation”. Cell108.4 (2002), pp. 557–572.
Rao, C. V., Wolf, D. M., and Arkin, A. P. “Control, exploitation and tolerance ofintracellular noise.” Nature 420.6912 (2002), pp. 231–237.
Revyakin, A, Liu, C, Ebright, R. H., and Strick, T. R. “Abortive initiation andproductive initiation by RNA polymerase involve DNA scrunching”. Science314.5802 (2006), pp. 1139–1143.
Ribeiro, A. S. and Kauffman, S. A. “Noisy attractors and ergodic sets in models ofgene regulatory networks”. Journal of Theoretical Biology 247 (2007), pp. 743–755.
Ribeiro, A. S., Zhu, R., and Kauffman, S. A. “A General Modeling Strategy forGene Regulatory Networks with Stochastic Dynamics”. Journal of Computa-tional Biology 13.9 (2006), pp. 1630–1639.

72 Bibliography
Ribeiro, A. S., Smolander, O.-P., Rajala, T., Häkkinen, A., and Yli-Harja, O.“Delayed stochastic model of transcription at the single nucleotide level”. Journalof Computational Biology 16.4 (2009), pp. 539–553.
Ribeiro, A. S., Häkkinen, A., Mannerström, H., Lloyd-Price, J., and Yli-Harja, O.“Effects of the promoter open complex formation on gene expression dynamics”.Physical Review E 81.1 (2010), p. 011912.
Ribeiro, A. S., Lloyd-Price, J., Kesseli, J., Häkkinen, A., and Yli-harja, O. “Quanti-fying local structure effects in network dynamics”. Physical Review E 78 (2008),p. 056108.
Richardson, J. P. “Preventing the synthesis of unused transcripts by rho factor”.Cell 64.6 (1991), pp. 1047–1049.
Riggs, A., Bourgeois, S, and Cohn, M. “The lac repressor-operator interaction. 3.Kinetic studies”. Journal of Molecular Biology 53.3 (1970), pp. 401–417.
Robert, L., Paul, G., Chen, Y., Taddei, F., Baigl, D., and Lindner, A. B. “Pre-dispositions and epigenetic inheritance in the Escherichia coli lactose operonbistable switch.” Molecular Systems Biology 6.357 (2010), p. 357.
Robinson, A. and Oijen, A. M. van. “Bacterial replication, transcription andtranslation: mechanistic insights from single-molecule biochemical studies”.Nature Reviews Microbiology 11 (2013), pp. 303–315.
Rotman, B. “Measurement of activity of single molecules of beta-D-galactosidase.”Proceedings of the National Academy of Sciences of the United States of America47 (1961), pp. 1981–1991.
Roussel, M. R. and Zhu, R. “Validation of an algorithm for delay stochasticsimulation of transcription and translation in prokaryotic gene expression.”Physical Biology 3.4 (2006), pp. 274–284.
Ruusuvuori, P., Äijö, T., Chowdhury, S., Garmendia-Torres, C., Selinummi, J.,Birbaumer, M., Dudley, A. M., Pelkmans, L., and Yli-Harja, O. “Evaluation ofmethods for detection of fluorescence labeled subcellular objects in microscopeimages.” BMC Bioinformatics 11 (2010), p. 248.
Saecker, R. M., Record, M. T., and DeHaseth, P. L. “Mechanism of BacterialTranscription Initiation: RNA Polymerase - Promoter Binding, Isomerizationto Initiation-Competent Open Complexes, and Initiation of RNA Synthesis”.Journal of Molecular Biology 412.5 (2011), pp. 754–771.
Sanchez, A. and Golding, I. “Genetic determinants and cellular constraints innoisy gene expression.” Science 342.6163 (2013), pp. 1188–93.
Sanchez, A., Osborne, M. L., Friedman, L. J., Kondev, J., and Gelles, J. “Mecha-nism of transcriptional repression at a bacterial promoter by analysis of singlemolecules”. The EMBO Journal 30.19 (2011), pp. 3940–3946.
Santangelo, P., Lifland, A., Curt, P, Sasaki, Y, Bassell, G., Lindquist, M., andCrowe, J. J. “Single molecule-sensitive probes for imaging RNA in live cells”.Nature Methods 6.5 (2009), pp. 347–349.
Schlax, P. J., Capp, M. W., and Record, M. T. “Inhibition of transcription initiationby lac repressor.” Journal of Molecular Biology 245.4 (1995), pp. 331–350.
Bibliography 73
Schleif, R. “AraC protein, regulation of the l-arabinose operon in Escherichia coli,and the light switch mechanism of AraC action.” FEMS Microbiology Reviews34.5 (2010), pp. 779–796.
Schleif, R. “Regulation of the L-arabinose operon of Escherichia coli”. Trends inGenetics 16.12 (2000), pp. 559–565.
Schnappinger, D and Hillen, W. “Tetracyclines: antibiotic action, uptake, andresistance mechanisms.” Archives of microbiology 165.6 (1996), pp. 359–369.
Schölkopf, B. and Smola, A. Learning with Kernels: Support Vector Machines,Regularization, Optimization, and Beyond. MIT Press, 2002.
Sclavi, B., Zaychikov, E., Rogozina, A., Walther, F., Buckle, M., and Heumann, H.“Real-time characterization of intermediates in the pathway to open complexformation by Escherichia coli RNA polymerase at the T7A1 promoter.” Pro-ceedings of the National Academy of Sciences of the United States of America102.13 (2005), pp. 4706–4711.
Senecal, A., Munsky, B., Proux, F., Ly, N., Braye, F. E., Zimmer, C., Mueller, F.,and Darzacq, X. “Transcription factors modulate c-Fos transcriptional bursts”.Cell Reports 8.1 (2014), pp. 75–83.
Shaner, N. C., Campbell, R. E., Steinbach, P. A., Giepmans, B. N. G., Palmer,A. E., and Tsien, R. Y. “Improved monomeric red, orange and yellow fluo-rescent proteins derived from Discosoma sp. red fluorescent protein.” NatureBiotechnology 22.12 (2004), pp. 1567–1572.
Sharp, P. M. and Li, W.-h. “The Codon Adaptation Index–a measure of directionalsynonymous codon usage bias, and its potential applications”. Nucleic AcidsResearch 15.3 (1987), pp. 1281–1295.
Shearwin, K. E., Callen, B. P., and Egan, J. B. “Transcriptional interference - Acrash course”. Trends in Genetics 21.6 (2005), pp. 339–345.
Sheppard, D and Englesberg, E. “Further evidence for positive control of theL-arabinose system by gene araC”. Journal of Molecular Biology 25 (1967),pp. 443–454.
Shimomura, O, Johnson, F. H., and Saiga, Y. J. “Extraction, purification and prop-erties of aequorin, a bioluminescent protein from the luminous hydromedusan,Aequorea.” J Cell Comp Physiol 59 (1962), pp. 223–239.
Siegele, D. A. and Hu, J. C. “Gene expression from plasmids containing thearaBAD promoter at subsaturating inducer concentrations represents mixedpopulations”. Proceedings of the National Academy of Sciences of the UnitedStates of America 94.15 (1997), pp. 8168–8172.
Simao, E., Remy, E., Thieffry, D., and Chaouiya, C. “Qualitative modelling ofregulated metabolic pathways: Application to the tryptophan biosynthesis in E.Coli”. Bioinformatics 21.SUPPL. 2 (2005), pp. 190–196.
Sneppen, K., Dodd, I. B., Shearwin, K. E., Palmer, A. C., Schubert, R. A., Callen,B. P., and Egan, J. B. “A mathematical model for transcriptional interferenceby RNA polymerase traffic in Escherichia coli”. Journal of Molecular Biology346.2 (2005), pp. 399–409.

74 Bibliography
So, L.-H., Ghosh, A., Zong, C., Sepúlveda, L. A., Segev, R., and Golding, I.“General properties of transcriptional time series in Escherichia coli.” Naturegenetics 43.6 (2011), pp. 554–560.
Sørensen, M. A. and Pedersen, S. “Absolute in vivo translation rates of individualcodons in Escherichia coli: The two glutamic acid codons GAA and GAG aretranslated with a threefold difference in rate”. Journal of Molecular Biology222.2 (1991), pp. 265–280.
Sørensen, M. A., Kurland, C. G., and Pedersen, S. “Codon usage determinestranslation rate in Escherichia coli”. Journal of Molecular Biology 207.2 (1989),pp. 365–377.
Spicher, A., Michel, O., Cieslak, M., Giavitto, J. L., and Prusinkiewicz, P. “Stochas-tic P systems and the simulation of biochemical processes with dynamic com-partments”. BioSystems 91.3 (2008), pp. 458–472.
St-Pierre, F. and Endy, D. “Determination of cell fate selection during phagelambda infection.” Proceedings of the National Academy of Sciences of theUnited States of America 105.52 (2008), pp. 20705–20710.
Süel, G. M., Garcia-Ojalvo, J., Liberman, L. M., and Elowitz, M. B. “An ex-citable gene regulatory circuit induces transient cellular differentiation.” Nature440.7083 (2006), pp. 545–550.
Süel, G. M., Kulkarni, R. P., Dworkin, J., Garcia-Ojalvo, J., and Elowitz, M. B.“Tunability and noise dependence in differentiation dynamics.” Science 315.5819(2007), pp. 1716–1719.
Sugiyama, M., Suzuki, T., Nakajima, S., Kashima, H., Von Bunau, P., andKawanabe, M. “Direct importance estimation for covariate shift adaptation”.Annals of the Institute of Statistical Mathematics 60.4 (2008), pp. 699–746.
Takahashi, K. and Yamanaka, S. “Induction of Pluripotent Stem Cells fromMouse Embryonic and Adult Fibroblast Cultures by Defined Factors”. Cell126.4 (2006), pp. 663–676.
Taniguchi, Y., Choi, P. J., Li, G.-W., Chen, H., Babu, M., Hearn, J., Emili, A., andXie, X. S. “Quantifying E. coli proteome and transcriptome with single-moleculesensitivity in single cells”. Science 329.5991 (2010), pp. 533–538.
Tokunaga, M., Imamoto, N., and Sakata-Sogawa, K. “Highly inclined thin illu-mination enables clear single-molecule imaging in cells”. Nature Methods 5.5(2008), p. 455.
Tran, H., Oliveira, S. M. D., Goncalves, N., and Ribeiro, A. S. “Kinetics of thecellular intake of a gene expression inducer at high concentrations”. MolecularBiosystems 11.9 (2015), pp. 2579–2587.
Tsien, R. Y. “The green fluorescent protein”. Annual Review of Biochemistry 67(1998), pp. 509–544.
Tuller, T., Carmi, A., Vestsigian, K., Navon, S., Dorfan, Y., Zaborske, J., Pan, T.,Dahan, O., Furman, I., and Pilpel, Y. “An evolutionarily conserved mechanismfor controlling the efficiency of protein translation”. Cell 141.2 (2010), pp. 344–354.
Bibliography 75
Uphoff, S., Reyes-Lamothe, R., Garza de Leon, F., Sherratt, D. J., and Kapanidis,A. N. “Single-molecule DNA repair in live bacteria”. Proceedings of the NationalAcademy of Sciences of the United States of America 110.20 (2013), pp. 8063–8068.
Uphoff, S., Lord, N. D., Okumus, B., Potvin-trottier, L., Sherratt, D. J., andPaulsson, J. “Mutation Rate Variation”. Science 351.6277 (2016), pp. 1094–1098.
Valegard, K., Murray, J., Stockley, P., Stonehouse, N., and Liljas, L. “Crystalstructure of an RNA bacteriophage coat protein-operator complex”. Nature 371(1994), pp. 623–626.
Wade, J. T. and Grainger, D. C. “Pervasive transcription: illuminating the darkmatter of bacterial transcriptomes”. Nature Reviews Microbiology 12 (2014),pp. 647–653.
Walter, G, Zillig, W, Palm, P, and Fuchs, E. “Initiation of DNA-Dependent RNAsynthesis and the effect of heparin on RNA polymerase”. Eur. J. Biochem. 3(1967), pp. 194–201.
Walter, N. G., Huang, C. Y., Manzo, A. J., and Sobhy, M. A. “Do-it-yourselfguide: how to use the modern single-molecule toolkit”. Nature Methods 5 (2008),pp. 475–489.
Wang, F, Redding, S, Finkelstein, I. J., Gorman, J, Reichman, D. R., and Greene,E. C. “The promoter search mechanism of E. coli RNA polymerase is dominatedby three–dimensional diffusion”. Nature Structural and Molecular Biology 20.2(2013), pp. 174–181.
Wang, G. Z., Lercher, M. J., and Hurst, L. D. “Transcriptional coupling ofneighboring genes and gene expression noise: Evidence that gene orientationand noncoding transcripts are modulators of noise”. Genome Biology andEvolution 3.1 (2011), pp. 320–331.
Ward, D. F. and Murray, N. E. “Convergent transcription in bacteriophage lambda:interference with gene expression”. Journal of Molecular Biology 133 (1979),pp. 249–266.
Wen, J.-D., Lancaster, L., Hodges, C., Zeri, A.-C., Yoshimura, S. H., Noller, H. F.,Bustamante, C., and Tinoco, I. “Following translation by single ribosomes onecodon at a time.” Nature 452.7187 (2008), pp. 598–603.
Wilson, D. N. “Ribosome-targeting antibiotics and mechanisms of bacterial resis-tance.” Nature Reviews Microbiology 12.1 (2014), pp. 35–48.
Wu, B., Chen, J., and Singer, R. H. “Background free imaging of single mRNAs inlive cells using split fluorescent proteins.” Scientific Reports 4 (2014), p. 3615.
Wu, B., Chao, J. A., and Singer, R. H. “Fluorescence fluctuation spectroscopyenables quantitative imaging of single mRNAs in living cells”. BiophysicalJournal 102.12 (2012), pp. 2936–2944.
Wu, B., Piatkevich, K. D., Lionnet, T., Singer, R. H., and Verkhusha, V. V.“Modern fluorescent proteins and imaging technologies to study gene expression,nuclear localization, and dynamics”. Current Opinion in Cell Biology 23.3(2011), pp. 310–317.
76 Bibliography
Xie, X. S., Choi, P. J., Li, G.-W., Lee, N. K., and Lia, G. “Single-molecule approachto molecular biology in living bacterial cells.” Annual Review of Biophysics 37(2008), pp. 417–444.
Yang, S., Kim, S., Lim, Y. R., Kim, C., An, H. J., Kim, J.-h., Sung, J., andLee, N. K. “Contribution of RNA polymerase concentration variation to proteinexpression noise”. Nature Communications 5 (2014), pp. 1–9.
Yanofsky, C. “Attenuation in the control of expression of bacterial operons”.Nature 289 (1981), pp. 751–758.
Yanofsky, C. “The different roles of tryptophan transfer RNA in regulating trpoperon expression in E. coli versus B. subtilis”. Trends in Genetics 20.8 (2004),pp. 367–374.
Yarchuk, O., Guillerez, J., and Dreyfus, M. “Interdependence of Translation,Transcription and mRNA Degradation in the lacZ Gene”. Journal of MolecularBiology 226 (1992), pp. 581–596.
Young, B. A., Gruber, T. M., Gross, C. A., and Francisco, S. “Views of Transcrip-tion Initiation”. Cell 109 (2002), pp. 417–420.
Young, J. W., Locke, J. C. W., and Elowitz, M. B. “Rate of environmental changedetermines stress response specificity.” Proceedings of the National Academy ofSciences of the United States of America 110.10 (2013), pp. 4140–5.
Yu, J., Xiao, J., Ren, X., Lao, K., and Xie, X. S. “Probing gene expression in livecells, one protein molecule at a time.” Science 311.5767 (2006), pp. 1600–1603.
Zafar, M. A., Carabetta, V. J., Mandel, M. J., and Silhavy, T. J. “Transcrip-tional occlusion caused by overlapping promoters.” Proceedings of the NationalAcademy of Sciences 111.4 (2014), pp. 1557–1561.
Zeng, L., Skinner, S. O., Zong, C., Sippy, J., Feiss, M., and Golding, I. “DecisionMaking at a Subcellular Level Determines the Outcome of BacteriophageInfection”. Cell 141.4 (2010), pp. 682–691.
Zhu, R., Ribeiro, A. S., Salahub, D., and Kauffman, S. A. “Studying geneticregulatory networks at the molecular level: Delayed reaction stochastic models”.Journal of Theoretical Biology 246.4 (2007), pp. 725–745.

Publications

Publication I
J. Mäkelä, H. Huttunen, M. Kandhavelu, O. Yli-Harja, and A.S. Ribeiro, “Auto-matic detection of changes in the dynamics of delayed stochastic gene networksand in vivo production of RNA molecules in Escherichia coli”, Bioinformatics,27(19):2714-2720, 2011.

[14:52 5/9/2011 Bioinformatics-btr471.tex] Page: 2714 2714–2720
BIOINFORMATICS ORIGINAL PAPER Vol. 27 no. 19 2011, pages 2714–2720doi:10.1093/bioinformatics/btr471
Systems biology Advance Access publication August 10, 2011
Automatic detection of changes in the dynamics of delayedstochastic gene networks and in vivo production of RNAmolecules in Escherichia coliJarno Mäkelä1, Heikki Huttunen1, Meenakshisundaram Kandhavelu1, Olli Yli-Harja1,2 andAndre S. Ribeiro1,∗1Computational Systems Biology Research Group, Department of Signal Processing, Tampere University ofTechnology, FI-33101 Tampere, Finland and 2Institute for Systems Biology, Seattle, WA 98103-8904, USAAssociate Editor: Ivo Hofacker
ABSTRACT
Motivation: Production and degradation of RNA and proteins arestochastic processes, difficulting the distinction between spuriousfluctuations in their numbers and changes in the dynamics of agenetic circuit. An accurate method of change detection is key toanalyze plasticity and robustness of stochastic genetic circuits.Results: We use automatic change point detection methods todetect non-spurious changes in the dynamics of delayed stochasticmodels of gene networks at run time. We test the methods indetecting changes in mean and noise of protein numbers, andin the switching frequency of a genetic switch. We also detectchanges, following genes’ silencing, in the dynamics of a model ofthe core gene regulatory network of Saccharomyces cerevisiae with328 genes. Finally, from images, we determine when RNA moleculestagged with fluorescent proteins are first produced in Escherichiacoli. Provided prior knowledge on the time scale of the changes, themethods detect them accurately and are robust to fluctuations inprotein and RNA levels.Availability: Simulator: www.cs.tut.fi/∼sanchesr/SGN/SGNSim.htmlContact: [email protected] information: Supplementary data are available atBioinformatics online.
Received on May 27, 2011; revised on August 3, 2011; accepted onAugust 5, 2011
1 INTRODUCTIONGene regulatory networks (GRNs) are stochastic. However, theirbehavior is, to some extent, robust, e.g. when responding toenvironmental changes. The behavior is determined by the structureof the genetic circuits. Thus, when structural changes occur, in manycases there are changes in the dynamics of RNA and protein numbersof some genes. Some such structural changes (e.g. a mutation) can berare, occurring once in a cell’s lifetime. It is thus important to developrobust methods for detecting permanent changes in the dynamics ofgenetic circuits, and distinguish these from spurious fluctuations inRNA and protein numbers.
∗To whom correspondence should be addressed.
We apply automatic change detection methods to simulated andreal gene expression data, to recognize candidate change points inRNAand protein numbers’dynamics.Automatic detection of changepoints is the discovering of points in time where the properties of thetime series change. Earliest approaches were based on the Behrens–Fisher problem, a statistical hypothesis test of equal means (Belloniand Didier, 2008; Fisher, 1939). A widely used approximation tosolve this problem is the Welch’s t-test. However, these approachesassume normal distributions, typically causing them to be toosensitive for heavy-tailed distributions. The dynamics of RNA andprotein production are usually not normal like, especially if astructural change occurs in the GRN during the observations.
We use two recent change point detection methods, namely, thedensity ratio method and the kernel change point analysis (Harchaouiet al., 2009; Kawahara and Sugiyama, 2009). Our choice is based ontheir reported good performance compared with alternative methods.These methods use different approaches: the density ratio methodhas its roots in statistics and density estimation, while the kernelchange point analysis is based on the theory of kernel machines andclassification. In our understanding, they represent state-of-the-artapproaches to the problem.
To assess the accuracy of the methods, knowing the ground truthsignal is needed. For this, we require realistic simulations of RNAand protein expression dynamics. The dynamics of the models oughtto be as realistic as possible so as to mimic accurately the temporaldynamics of RNA and protein numbers in real cells.
Recently, a delayed stochastic modeling strategy of geneexpression and GRNs was proposed (Ribeiro et al., 2006). Itis based on the delayed stochastic simulation algorithm (delayedSSA) (Zhu et al., 2007), and thus it accounts for the key dynamicalfeatures of real GRNs, namely, the stochasticity of the chemicalkinetics (Arkin et al., 1998), and the duration of events such asthe promoter complex formation (McClure, 1980) and transcriptionelongation (Zhu et al., 2007). This modeling strategy was shownto match the dynamics of RNA and protein production at the singlemolecule level (Yu et al., 2006; Zhu et al., 2007). Delayed stochasticmodels of GRNs can be simulated by SGNSim (Ribeiro and Lloyd-Price, 2007), which also allows introducing changes in the structureof the GRN at run time, needed to test the change point detectionmethods.
We apply and test the accuracy of the automatic detection ofchange points methods to model GRNs subject to a permanent
2714 © The Author 2011. Published by Oxford University Press. All rights reserved. For Permissions, please email: [email protected]

[14:52 5/9/2011 Bioinformatics-btr471.tex] Page: 2715 2714–2720
Change point detection
change at run time in mean level of a protein, noise strength ofa protein’s time series and in the frequency of switching of a geneticswitch. Further, to verify the applicability of the methods to large-scale clusters of interconnected genes, we test the ability to detecta change in the dynamics of a model GRN with 328 genes, subjectto the silencing of a randomly selected gene at run time. Finally,we apply the methods to determine when new RNA molecules areproduced, from our temporal measurements by confocal microscopyof RNA tagged with MS2d-GFP in Escherichia coli.
2 METHODS
2.1 In vivo detection of RNA molecules in E.coliRNA detection and quantification in vivo in E. coli cells DH5α-PRO uses theability of the coat protein of bacteriophage MS2 to tightly bind specific RNAsequences (Peabody and Lim, 1996). High-resolution detection of singleRNA transcripts with 96 tandem repeats of MS2 binding sites in E.coli ispossible by using dimeric MS2 fused to GFP (MS2d-GFP fusion protein) as adetection tag (Golding et al., 2005). The method uses two genetic constructs.The first is a medium-copy vector expressing the MS2d-GFP fusion protein,whose promoter (PtetO) is regulated by tetracycline repressor. The second isa single copy F-based vector, with a Plac/ara promoter controlling productionof the transcript target, specifically mRFP1 followed by a 96 MS2 bindingsite array. Constructs were generously provided by I. Golding (University ofIllinois). Experimental procedures of induction of the target RNA, confocalmicroscopy and cell and RNA spots segmentation from images are describedin Supplementary Material.
2.2 Models of GRNsWe follow the modeling strategy of delayed stochastic GRNs proposed inRibeiro et al. (2006). The models are implemented in the simulator SGNSim(Ribeiro and Lloyd-Price, 2007), and the dynamics is based on the delayedSSA (Zhu et al., 2007), that unlike the SSA (Gillespie, 1977), uses a waitinglist to store delayed output events. The algorithm of delayed SSA is presentedin Supplementary Material. Delayed reactions are represented as: A → B +C(τ1) + D(τ2). In this reaction, B is instantaneously produced, while C andD are placed on the waitlist until they are released, after τ1 and τ2 seconds,respectively. This strategy accounts for the stochastic nature of chemicalreactions and for the fact that transcription and translation are multistepprocesses that take non-negligible time to be completed once initiated.The strategy was validated in Zhu et al. (2007) by matching temporalmeasurements of expression of individual proteins (Yu et al., 2006).
We implement four model GRNs, named models 1, 2, 3 and 4. Models 1and 2 are identical, and consist of a two-gene network, where Gene 1represses Gene 2. These models differ in the change at run time. In Model 1,mean protein levels change at run time, while in Model 2 it is the strengthof fluctuations in protein levels that changes. Model 3 is a genetic switchwhose switching frequency is changed at run time.
We also test if changes in the dynamics of larger GRNs can be detected.Gene networks consist of hundreds to thousands of genes, usually organizedin clusters of dozens to hundreds, that are involved in specific tasks indevelopment, metabolism, etc. Changes known to occur in the dynamicsof these networks may be caused by mutations, deletions or duplications, oras a response to external signals or stress. Usually, such events cause one toa few genes, along with several of its neighbor genes, to alter the expressionlevel (e.g. from high to low). The models and how the changes at run timeare implemented are described in Supplementary Material.
To test if the algorithms of change point detection are successful for largegenetic circuits, we apply them to a model of the core gene network ofSaccharomyces cerevisiae inferred from microarray measurements followinggene deletions and overexpressions (Chowdhury et al., 2010). This networkcontains 328 genes. Inferred connections were verified by gene enrichment.
The perturbations consist of selecting genes randomly (see SupplementaryMaterial) and subject them to silencing at run time, one per simulation.
2.3 Methods of change point detectionFormally, the problem of change point detection can be stated as follows.Given a multidimensional time series x0, x1, … , xN ∈ Rn, which time pointsK represent change in some sense, given the data samples in the M-pointbackward window XB = (xK−M , … , xK−1) and the M-point forward windowXF = (xK+1, … , xK+M ). To define the dissimilarity of the two windows onecan pose the question as a hypothesis testing problem:
H0 :pXF (x)=pXB (x)H1 :pXF (x) =pXB (x)
(1)
where pXF (x) and pXB (x) denote the probability density functions of theforward and backward windows, respectively.
Detection in non-parametric cases is still, in general, an open problem.We apply two recent change point detection methods proposed for thenon-parametric case. Namely, we apply a direct density ratio test (uLSIF)(Kawahara and Sugiyama, 2009) and a kernel change point analysis method(KCpA) (Harchaoui et al., 2009), described in Supplementary Material.
3 RESULTS AND DISCUSSION
3.1 Selecting a proper window sizeMost parameters of change point detection algorithms can beinferred from the data by cross-validation. However, the detectionwindow length cannot be determined from training data, sincechanges appear at multiple scales. Thus, the algorithm cannotdecide which time scale is biologically relevant. Below, we choosethe window size from knowledge of the scale of the biologicalphenomena studied. Before, we study the performance of thedetectors for a wide range of window sizes to search for differencesin robustness and to compare performances with larger number oftest cases.
We first apply KCpA and uLSIF algorithms to three models. Wechange at run time mean protein levels in Model 1, noise in proteinnumbers in Model 2 and frequency of switching between noisyattractors in Model 3 (Section 2.2). Examples of the time series ofprotein numbers in these models, prior and after a change are shownin Supplementary Material. The performance is assessed by the areaunder the receiver operating characteristics (ROC) curve or the AUCcriterion (Kay, 1998). The ROC curve and the corresponding AUCvalue were based on the specificity–sensitivity coordinates obtainedby varying the detection threshold.
To improve the detection performance, the data are appended byauxiliary variables. This attempts to cast the change in, e.g. varianceinto a change in the mean of the auxiliary variable. For example, inModel 2, the change is in the degree of the fluctuations in proteinnumbers. One can convert this into a change in ‘local variance’(that is, variance within a small time interval). Appending the localvariance estimates for both proteins to mean levels significantlyimproves the detection of changes in noise in protein numbers.
We also include auxiliary variables in Model 3. The added featureis the average absolute difference of consecutive samples. Thisimproves performance because of the nature of the change (inswitching frequency) and because the levels of the two protein aredynamically coupled. The change in switching frequency from lowto high is reflected in the difference between consecutive samplesof |P1 −P2| (similarly one could have used the sum of P1 and P2).
2715
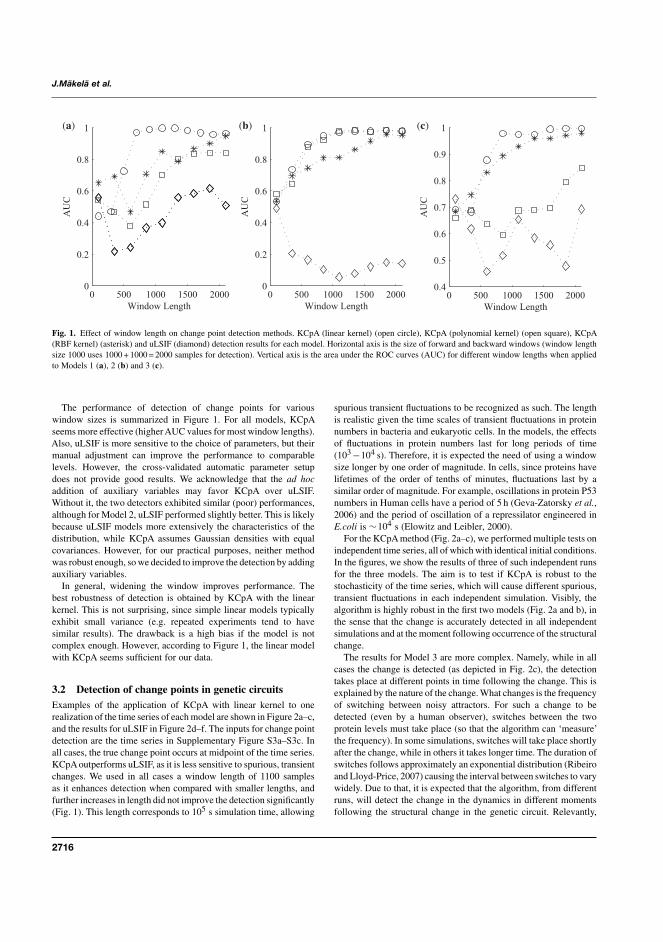
[14:52 5/9/2011 Bioinformatics-btr471.tex] Page: 2716 2714–2720
J.Mäkelä et al.
(a) (b) (c)
Fig. 1. Effect of window length on change point detection methods. KCpA (linear kernel) (open circle), KCpA (polynomial kernel) (open square), KCpA(RBF kernel) (asterisk) and uLSIF (diamond) detection results for each model. Horizontal axis is the size of forward and backward windows (window lengthsize 1000 uses 1000 + 1000 = 2000 samples for detection). Vertical axis is the area under the ROC curves (AUC) for different window lengths when appliedto Models 1 (a), 2 (b) and 3 (c).
The performance of detection of change points for variouswindow sizes is summarized in Figure 1. For all models, KCpAseems more effective (higher AUC values for most window lengths).Also, uLSIF is more sensitive to the choice of parameters, but theirmanual adjustment can improve the performance to comparablelevels. However, the cross-validated automatic parameter setupdoes not provide good results. We acknowledge that the ad hocaddition of auxiliary variables may favor KCpA over uLSIF.Without it, the two detectors exhibited similar (poor) performances,although for Model 2, uLSIF performed slightly better. This is likelybecause uLSIF models more extensively the characteristics of thedistribution, while KCpA assumes Gaussian densities with equalcovariances. However, for our practical purposes, neither methodwas robust enough, so we decided to improve the detection by addingauxiliary variables.
In general, widening the window improves performance. Thebest robustness of detection is obtained by KCpA with the linearkernel. This is not surprising, since simple linear models typicallyexhibit small variance (e.g. repeated experiments tend to havesimilar results). The drawback is a high bias if the model is notcomplex enough. However, according to Figure 1, the linear modelwith KCpA seems sufficient for our data.
3.2 Detection of change points in genetic circuitsExamples of the application of KCpA with linear kernel to onerealization of the time series of each model are shown in Figure 2a–c,and the results for uLSIF in Figure 2d–f. The inputs for change pointdetection are the time series in Supplementary Figure S3a–S3c. Inall cases, the true change point occurs at midpoint of the time series.KCpA outperforms uLSIF, as it is less sensitive to spurious, transientchanges. We used in all cases a window length of 1100 samplesas it enhances detection when compared with smaller lengths, andfurther increases in length did not improve the detection significantly(Fig. 1). This length corresponds to 105 s simulation time, allowing
spurious transient fluctuations to be recognized as such. The lengthis realistic given the time scales of transient fluctuations in proteinnumbers in bacteria and eukaryotic cells. In the models, the effectsof fluctuations in protein numbers last for long periods of time(103 −104 s). Therefore, it is expected the need of using a windowsize longer by one order of magnitude. In cells, since proteins havelifetimes of the order of tenths of minutes, fluctuations last by asimilar order of magnitude. For example, oscillations in protein P53numbers in Human cells have a period of 5 h (Geva-Zatorsky et al.,2006) and the period of oscillation of a repressilator engineered inE.coli is ∼104 s (Elowitz and Leibler, 2000).
For the KCpA method (Fig. 2a–c), we performed multiple tests onindependent time series, all of which with identical initial conditions.In the figures, we show the results of three of such independent runsfor the three models. The aim is to test if KCpA is robust to thestochasticity of the time series, which will cause different spurious,transient fluctuations in each independent simulation. Visibly, thealgorithm is highly robust in the first two models (Fig. 2a and b), inthe sense that the change is accurately detected in all independentsimulations and at the moment following occurrence of the structuralchange.
The results for Model 3 are more complex. Namely, while in allcases the change is detected (as depicted in Fig. 2c), the detectiontakes place at different points in time following the change. This isexplained by the nature of the change. What changes is the frequencyof switching between noisy attractors. For such a change to bedetected (even by a human observer), switches between the twoprotein levels must take place (so that the algorithm can ‘measure’the frequency). In some simulations, switches will take place shortlyafter the change, while in others it takes longer time. The duration ofswitches follows approximately an exponential distribution (Ribeiroand Lloyd-Price, 2007) causing the interval between switches to varywidely. Due to that, it is expected that the algorithm, from differentruns, will detect the change in the dynamics in different momentsfollowing the structural change in the genetic circuit. Relevantly,
2716

[14:52 5/9/2011 Bioinformatics-btr471.tex] Page: 2717 2714–2720
Change point detection
2 4 6 8
x 105
0.4
0.6
0.8
1
1.2
1.4
Time (s)2 4 6 8
x 105
0
1
2
3
4
Time (s)2 4 6 8
x 106
0
2
4
6
8
10
Time (s)
2 4 6 8
x 105
−2
−1.5
−1
−0.5x 10
5
Time (s)2 4 6 8
x 105
−2.5
−2
−1.5
−1
−0.5x 10
5
Time (s)2 4 6 8
x 106
−5000
0
5000
10000
Time (s)
(a) (c)(b)
(d) (e) (f)
Fig. 2. Results of change point detection for KCpA (linear kernel) in models 1 (a), 2 (b) and 3 (c) and uLSIF in models 1 (d), 2 (e) and 3 (f ). Vertical axisare the KCpA and uLSIF indicator outputs. In all cases, the window length is 1100 samples. Ground truth (in gray) used to compute the ROC curves. uLSIFparameters were selected by 10-fold cross-validation. In (a), (b) and (c) the results of applying KCpA to the time series from three independent runs are shownfor assessing robustness to the stochastic fluctuations in protein numbers.
even for this case, in all runs KCpA detected the change, while atdifferent moments.
We now compare the results of KCpA and uLSIF in each model.Figure 2a and d illustrate the change point detection results forModel 1. KCpA largely outperforms uLSIF. As mentioned, KCpAdetermines accurately the exact moment when the protein levels startchanging for this model. After, the two protein levels only fluctuatearound a mean level, and KCpA does not detect any significantchanges. We conclude that KCpA is appropriate to detect changesin mean expression levels in highly stochastic time series, sincefluctuations due to noise in the chemical kinetics are not confusedwith the change in mean expression levels.
Next, we test the ability of detecting changes in the degree offluctuations in a protein’s level (Model 2). In our example, the noisestrength in protein numbers changes from 0.63 to 0.73, as measuredby the square of the coefficient of variation (SD over the mean).The results of the detection are shown in Figure 2b and e. AgainKCpA outperforms uLSIF, indicating the true change shortly afterthe midpoint of the time series. In comparison to the first case, theresults are not as clear as there are a few false matches after thetrue change point. Nevertheless, the moment at which the structurechanged was correctly identified. In addition, the highest peak occursat the true change point. Thus, we conclude that KCpA detectschanges in the noise strength of temporal expression levels evenfrom time series of protein numbers that are highly stochastic bothbefore and after the change.
We now compare KCpA and uLSIF in detecting a changein the frequency of switching of a genetic switch (Model 3).
The decrease in switching frequency is due to weaker fluctuations inthe protein numbers and leads to a slight increase in mean numberof proteins since the decrease in fluctuations is not symmetric inrelation to the mean protein level (see Supplementary Material).Thus, there are two changes, in mean and in fluctuations, whichalso have different time scales to be completed once initiated. Theresults of the detection are shown in Figure 2c and f. In this case,both the uLSIF and the KCpA have a poor performance. The KCpAdoes detect the true change point from one of the realizations of thedata, but this might only be a coincidence. However, both methodsare able to detect the strong changes in the mean levels (due tothe switching dynamics) that occur at time 6×10⁶ and 7.5×10⁶ s(see Supplementary Fig. S1c). Thus, we conclude that for networkswith switching dynamics, the detection of change of frequencyrequires complex analysis of the results, namely, there actually wasa detection of a change point (but not of the frequency of switching),from which one can infer that the structure of the switch changed atrun time. From this point of view, the uLSIF detector outperformsKCpA in this case.
3.3 Detecting change points in a complex genetic circuitWe simulate the dynamics of models from a core genetic networkmodel of S.cerevisiae with 328 genes (Chowdhury et al., 2010). Bothtopology as well as genes’ transfer functions were inferred frommicroarray measurements following deletions and overexpressionsof a gene, in optimal environmental conditions. Perhaps due to this,it was observed that unless the inferred model network is perturbed,
2717
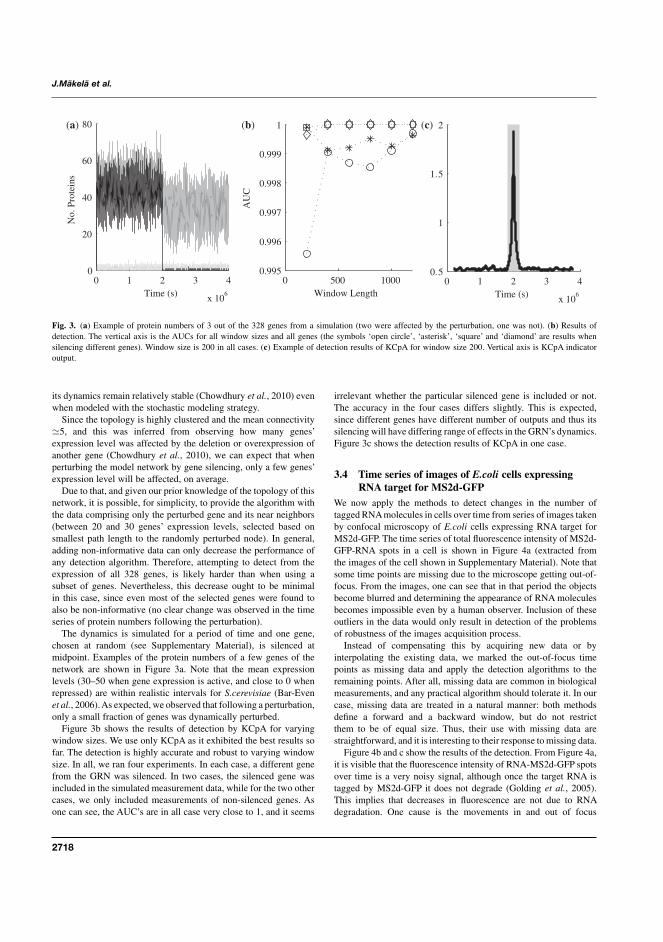
[14:52 5/9/2011 Bioinformatics-btr471.tex] Page: 2718 2714–2720
J.Mäkelä et al.
0 1 2 3 4
x 106
0
20
40
60
80
Time (s)
No.
Pro
tein
s
0 500 10000.995
0.996
0.997
0.998
0.999
1
Window Length
AU
C
0 1 2 3 4
x 106
0.5
1
1.5
2
Time (s)
(a) (b) (c)
Fig. 3. (a) Example of protein numbers of 3 out of the 328 genes from a simulation (two were affected by the perturbation, one was not). (b) Results ofdetection. The vertical axis is the AUCs for all window sizes and all genes (the symbols ‘open circle’, ‘asterisk’, ‘square’ and ‘diamond’ are results whensilencing different genes). Window size is 200 in all cases. (c) Example of detection results of KCpA for window size 200. Vertical axis is KCpA indicatoroutput.
its dynamics remain relatively stable (Chowdhury et al., 2010) evenwhen modeled with the stochastic modeling strategy.
Since the topology is highly clustered and the mean connectivity5, and this was inferred from observing how many genes’expression level was affected by the deletion or overexpression ofanother gene (Chowdhury et al., 2010), we can expect that whenperturbing the model network by gene silencing, only a few genes’expression level will be affected, on average.
Due to that, and given our prior knowledge of the topology of thisnetwork, it is possible, for simplicity, to provide the algorithm withthe data comprising only the perturbed gene and its near neighbors(between 20 and 30 genes’ expression levels, selected based onsmallest path length to the randomly perturbed node). In general,adding non-informative data can only decrease the performance ofany detection algorithm. Therefore, attempting to detect from theexpression of all 328 genes, is likely harder than when using asubset of genes. Nevertheless, this decrease ought to be minimalin this case, since even most of the selected genes were found toalso be non-informative (no clear change was observed in the timeseries of protein numbers following the perturbation).
The dynamics is simulated for a period of time and one gene,chosen at random (see Supplementary Material), is silenced atmidpoint. Examples of the protein numbers of a few genes of thenetwork are shown in Figure 3a. Note that the mean expressionlevels (30–50 when gene expression is active, and close to 0 whenrepressed) are within realistic intervals for S.cerevisiae (Bar-Evenet al., 2006). As expected, we observed that following a perturbation,only a small fraction of genes was dynamically perturbed.
Figure 3b shows the results of detection by KCpA for varyingwindow sizes. We use only KCpA as it exhibited the best results sofar. The detection is highly accurate and robust to varying windowsize. In all, we ran four experiments. In each case, a different genefrom the GRN was silenced. In two cases, the silenced gene wasincluded in the simulated measurement data, while for the two othercases, we only included measurements of non-silenced genes. Asone can see, the AUC’s are in all case very close to 1, and it seems
irrelevant whether the particular silenced gene is included or not.The accuracy in the four cases differs slightly. This is expected,since different genes have different number of outputs and thus itssilencing will have differing range of effects in the GRN’s dynamics.Figure 3c shows the detection results of KCpA in one case.
3.4 Time series of images of E.coli cells expressingRNA target for MS2d-GFP
We now apply the methods to detect changes in the number oftagged RNA molecules in cells over time from series of images takenby confocal microscopy of E.coli cells expressing RNA target forMS2d-GFP. The time series of total fluorescence intensity of MS2d-GFP-RNA spots in a cell is shown in Figure 4a (extracted fromthe images of the cell shown in Supplementary Material). Note thatsome time points are missing due to the microscope getting out-of-focus. From the images, one can see that in that period the objectsbecome blurred and determining the appearance of RNA moleculesbecomes impossible even by a human observer. Inclusion of theseoutliers in the data would only result in detection of the problemsof robustness of the images acquisition process.
Instead of compensating this by acquiring new data or byinterpolating the existing data, we marked the out-of-focus timepoints as missing data and apply the detection algorithms to theremaining points. After all, missing data are common in biologicalmeasurements, and any practical algorithm should tolerate it. In ourcase, missing data are treated in a natural manner: both methodsdefine a forward and a backward window, but do not restrictthem to be of equal size. Thus, their use with missing data arestraightforward, and it is interesting to their response to missing data.
Figure 4b and c show the results of the detection. From Figure 4a,it is visible that the fluorescence intensity of RNA-MS2d-GFP spotsover time is a very noisy signal, although once the target RNA istagged by MS2d-GFP it does not degrade (Golding et al., 2005).This implies that decreases in fluorescence are not due to RNAdegradation. One cause is the movements in and out of focus
2718
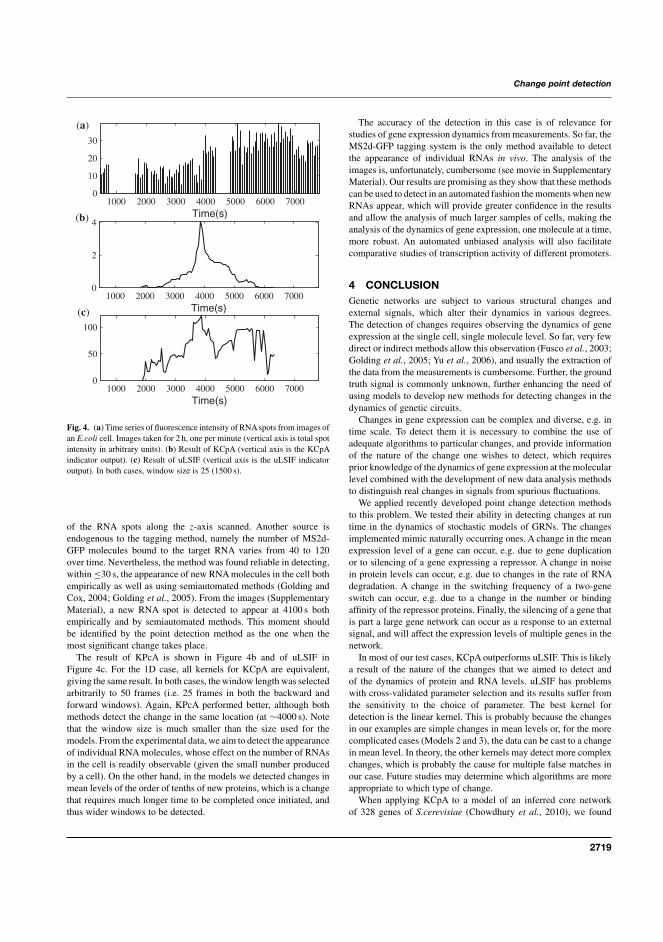
[14:52 5/9/2011 Bioinformatics-btr471.tex] Page: 2719 2714–2720
Change point detection
1000 2000 3000 4000 5000 6000 70000
10
20
30
Time(s)
1000 2000 3000 4000 5000 6000 70000
2
4
Time(s)
1000 2000 3000 4000 5000 6000 70000
50
100
Time(s)
(a)
(b)
(c)
Fig. 4. (a) Time series of fluorescence intensity of RNAspots from images ofan E.coli cell. Images taken for 2 h, one per minute (vertical axis is total spotintensity in arbitrary units). (b) Result of KCpA (vertical axis is the KCpAindicator output). (c) Result of uLSIF (vertical axis is the uLSIF indicatoroutput). In both cases, window size is 25 (1500 s).
of the RNA spots along the z-axis scanned. Another source isendogenous to the tagging method, namely the number of MS2d-GFP molecules bound to the target RNA varies from 40 to 120over time. Nevertheless, the method was found reliable in detecting,within ≤30 s, the appearance of new RNA molecules in the cell bothempirically as well as using semiautomated methods (Golding andCox, 2004; Golding et al., 2005). From the images (SupplementaryMaterial), a new RNA spot is detected to appear at 4100 s bothempirically and by semiautomated methods. This moment shouldbe identified by the point detection method as the one when themost significant change takes place.
The result of KPcA is shown in Figure 4b and of uLSIF inFigure 4c. For the 1D case, all kernels for KCpA are equivalent,giving the same result. In both cases, the window length was selectedarbitrarily to 50 frames (i.e. 25 frames in both the backward andforward windows). Again, KPcA performed better, although bothmethods detect the change in the same location (at ∼4000 s). Notethat the window size is much smaller than the size used for themodels. From the experimental data, we aim to detect the appearanceof individual RNA molecules, whose effect on the number of RNAsin the cell is readily observable (given the small number producedby a cell). On the other hand, in the models we detected changes inmean levels of the order of tenths of new proteins, which is a changethat requires much longer time to be completed once initiated, andthus wider windows to be detected.
The accuracy of the detection in this case is of relevance forstudies of gene expression dynamics from measurements. So far, theMS2d-GFP tagging system is the only method available to detectthe appearance of individual RNAs in vivo. The analysis of theimages is, unfortunately, cumbersome (see movie in SupplementaryMaterial). Our results are promising as they show that these methodscan be used to detect in an automated fashion the moments when newRNAs appear, which will provide greater confidence in the resultsand allow the analysis of much larger samples of cells, making theanalysis of the dynamics of gene expression, one molecule at a time,more robust. An automated unbiased analysis will also facilitatecomparative studies of transcription activity of different promoters.
4 CONCLUSIONGenetic networks are subject to various structural changes andexternal signals, which alter their dynamics in various degrees.The detection of changes requires observing the dynamics of geneexpression at the single cell, single molecule level. So far, very fewdirect or indirect methods allow this observation (Fusco et al., 2003;Golding et al., 2005; Yu et al., 2006), and usually the extraction ofthe data from the measurements is cumbersome. Further, the groundtruth signal is commonly unknown, further enhancing the need ofusing models to develop new methods for detecting changes in thedynamics of genetic circuits.
Changes in gene expression can be complex and diverse, e.g. intime scale. To detect them it is necessary to combine the use ofadequate algorithms to particular changes, and provide informationof the nature of the change one wishes to detect, which requiresprior knowledge of the dynamics of gene expression at the molecularlevel combined with the development of new data analysis methodsto distinguish real changes in signals from spurious fluctuations.
We applied recently developed point change detection methodsto this problem. We tested their ability in detecting changes at runtime in the dynamics of stochastic models of GRNs. The changesimplemented mimic naturally occurring ones. A change in the meanexpression level of a gene can occur, e.g. due to gene duplicationor to silencing of a gene expressing a repressor. A change in noisein protein levels can occur, e.g. due to changes in the rate of RNAdegradation. A change in the switching frequency of a two-geneswitch can occur, e.g. due to a change in the number or bindingaffinity of the repressor proteins. Finally, the silencing of a gene thatis part a large gene network can occur as a response to an externalsignal, and will affect the expression levels of multiple genes in thenetwork.
In most of our test cases, KCpA outperforms uLSIF. This is likelya result of the nature of the changes that we aimed to detect andof the dynamics of protein and RNA levels. uLSIF has problemswith cross-validated parameter selection and its results suffer fromthe sensitivity to the choice of parameter. The best kernel fordetection is the linear kernel. This is probably because the changesin our examples are simple changes in mean levels or, for the morecomplicated cases (Models 2 and 3), the data can be cast to a changein mean level. In theory, the other kernels may detect more complexchanges, which is probably the cause for multiple false matches inour case. Future studies may determine which algorithms are moreappropriate to which type of change.
When applying KCpA to a model of an inferred core networkof 328 genes of S.cerevisiae (Chowdhury et al., 2010), we found
2719
[14:52 5/9/2011 Bioinformatics-btr471.tex] Page: 2720 2714–2720
J.Mäkelä et al.
it to be very accurate in detecting changes in the overall geneexpression dynamics of the network, following the silencing ofrandomly selected genes. The size of the network did not seem tobe problematic. This example is of relevance in that it shows thatthe method can be applied to the analysis of time series of complexgene networks, when affected by a change in either the network’sstructure or by an external signal or perturbation.
Finally, we applied the methods to detect, from time seriesof fluorescence intensity of RNA tagged with MS2d-GFP, singletranscription events in live cells. Tagging RNA with MS2d-GFPproteins is, so far, the only method for detecting in vivo individualRNA molecules, thus, the correct extraction of information fromthe measurements, such as when new RNA molecules appear, is ofrelevance. Also in this case, the best detector appears to be KCpA,which produces a distinctive peak at the true change point.
We note that, to detect changes in the expression level of stronglyexpressing genes, it may be possible to assume ergodicity of theexpression dynamics (similar temporal and ensemble averages),as several strongly expressing genes in, e.g. bacteria and yeast,usually exhibit fast temporal fluctuations. Provided this assumption,the changes can be detected from measurements at several timemoments of expression levels across an isogenic cell population,rather than using our method since, while it is also valid, it wouldbe more fastidious. However, generally, this assumption may not bevalid. For example, studies in vivo and in vitro in E.coli show thatmost genes are rarely expressed (Bernstein et al., 2002; Taniguchiet al., 2010). Our measurements in Figure 4a are in agreement, sincethe promoter has a very slow dynamics, expressing on average onlyonce every 700 s.
We believe that the results are promising. While the signalsanalyzed were poised with noise from multiple sources, theinformation of dynamical changes was, to a great extent,successfully extracted, both when detecting changes in the dynamicsof model GRNs as well as when detecting when RNA moleculeswere produced in E.coli. Information on the nature of the changesthat one wants to detect needs to be provided, to some extent.Particularly, prior knowledge is needed on the expected time lengththat a change takes to provoke a tangible change in the proteinnumbers. This is likely to be necessary regardless of the methodused, as the dynamics of GRNs is extremely ‘rich’ in that a varietyof mechanisms can affect the system in different ways, and thechange may take different time lengths to be completed. In thefuture, we aim to further develop these methods and use them toanalyze fluorescence measurements of expression of genes withingenetic circuits in live cells.
Funding: Academy of Finland and Finnish Funding Agency forTechnology and Innovation.
Conflict of Interest: none declared.
REFERENCESArkin,A. et al. (1998) Stochastic kinetic analysis of developmental pathway bifurcation
in phage λ-infected Escherichia coli cells. Genetics, 149, 1633–1648.Bar-Even,A. et al. (2006) Noise in protein expression scales with natural protein
abundance. Nat. Genet., 38, 636–643.Belloni,A. and Didier,G. (2008) On the Behrens-Fisher problem: a globally convergent
algorithm and a finite-sample study of the Wald, LR and LM tests. Ann. Stat., 36,2377–2408.
Bernstein,J.A. et al. (2002) Global analysis of mRNA decay and abundancein Escherichia coli at single-gene resolution using two-color fluorescent dnamicroarrays. Proc. Natl Acad. Sci. USA, 99, 9697–9702.
Chowdhury,S. et al. (2010) Information propagation within the genetic network ofSaccharomyces cerevisiae. BMC Syst. Biol., 4, 143.
Elowitz,M.B. and Leibler,S. (2000) A synthetic oscillatory network of transcriptionalregulators. Nature, 403, 335–338.
Fisher,R. (1939) The comparison of samples with possibly unequal variances.Ann. Eugenics, 9, 174–180.
Fusco,D. et al. (2003) Single mRNA molecules demonstrate probabilistic movement inliving mammalian cells. Curr. Biol., 13, 161–167.
Geva-Zatorsky,N. et al. (2006) Oscillations and variability in the p53 system. Mol. Syst.Biol., 2, 2006.0033.
Gillespie,D.T. (1977) Exact stochastic simulation of coupled chemical reactions.J. Phys. Chem., 81, 2340–2361.
Golding,I. and Cox,E.C. (2004) RNA dynamics in live Escherichia coli cells. Proc. NatlAcad. Sci. USA, 101, 11310–11315.
Golding,I. et al. (2005) Real-time kinetics of gene activity in individual bacteria. Cell,123, 1025–1036.
Harchaoui,Z. et al. (2009) Kernel change-point analysis. Adv. Neural Inform. Proc. Syst.Kawahara,Y. and Sugiyama,M. (2009) Change-point detection in time-series data
by direct density-ratio estimation. In Proceedings of 9th SIAM InternationalConference on Data Mining, Vol. 1, SIAM, Nevada, USA, pp. 389–400.
Kay,S. (1998) Fundamentals of Statistical Signal Processing, Volume 2: DetectionTheory. Prentice Hall, PTR, New Jersey, USA.
McClure,W.R. (1980) Rate-limiting steps in rna chain initiation. Proc. Natl Acad. Sci.USA, 77, 5634–5638.
Peabody,D.S. and Lim,F. (1996) Complementation of rna binding site mutations in ms2coat protein heterodimers. Nucleic Acids Res., 24, 2352–2359.
Ribeiro,A. et al. (2006) A general modeling strategy for gene regulatory networks withstochastic dynamics. J. Comput. Biol., 13, 1630–1639.
Ribeiro,A.S. and Lloyd-Price,J. (2007) SGN sim, a stochastic genetic networkssimulator. Bioinformatics, 23, 777–779.
Taniguchi,Y. et al. (2010) Quantifying E. coli proteome and transcriptome with single-molecule sensitivity in single cells. Science, 329, 533–538.
Yu,J. et al. (2006) Probing gene expression in live cells, one protein molecule at a time.Science, 311, 1600–1603.
Zhu,R. et al. (2007) Studying genetic regulatory networks at the molecular level: delayedreaction stochastic models. J. Theor. Biol., 246, 725–745.
2720
Supplementary material for:
Automatic detection of changes in the dynamics of delayedstochastic gene networks and in vivo production of RNA
molecules in Escherichia coli
Jarno Mäkelä 1, Heikki Huttunen 1, Meenakshisundaram Kandhavelu 1, Olli Yli-Harja 1,2
and Andre S. Ribeiro 1,∗1Computational Systems Biology Research Group, Department of Signal Processing,
Tampere University of Technology, FI-33101 Tampere, Finland2Institute for Systems Biology, 1441N 34th St, Seattle, WA, 98103-8904, USA
August 3, 2011
1 IntroductionIn this supplement we describe the method of induction of the expression of the RNA targets for MS2d-GFP as well as the details regarding microscopy and cell segmentation (Section 2). The details of theimage analysis for in vivo detection of RNA molecules are described in Section 3. After that, the delayedstochastic simulation algorithm used to simulate models of gene expression is described (Section 4).Also, the parameters for small (Section 5) and large (Section 6) genetic circuits are described. Finally, wereview the two change point detection methods used, namely the Direct Density Ratio Estimation (Section7) and the Kernel Change Point Analysis (Section 8).
2 Inducing expression of the RNA target for MS2d-GFP, microscopyand cells segmentation
Cells with both MS2d-GFP and transcript target plasmids were grown overnight at 37oC in LB sup-plemented by the appropriate antibiotics. The following day, cells were diluted in fresh medium plusantibiotics. To induce production of MS2d-GFP, 100 ng/mL of anhydrotetracycline (IBA GmbH, Göttin-gen, Germany) was added to the diluted bacterial culture. Expression of the RNA target is induced byadding IPTG (1 mM, Fermentas, Finland) and L-arabinose (6.7 mM, Sigma-Aldrich, Schnelldorf, Ger-many). Cells are subsequently incubated with the inducers at 37oC for 1 hour with shaking to a finaloptical density (600 nm) of 0.4.
Following induction, cells are placed on a microscopic slide between a cover slip and 0.8% LB-agarose gel pad set. Cells are visualized by fluorescence microscopy, using a Nikon Eclipse (TE2000-U,Nikon, Tokyo, Japan) inverted C1 confocal laser-scanning system with a 100x Apo TIRF (1.49 NA, oil)objective. GFP fluorescence is measured using a 488 nm laser (Melles-Griot) and a 515/30 nm detectionfilter. Images of cells are taken from each slide using C1 with Nikon software EZ-C1, approximately7 min after induction, one per minute, for approximately 2 hours. Measurements under the microscopewere made in room temperature (∼ 24oC).
We detect cells from raw images according to the method in [Wang et al., 2010], that divides a gray-scale image in three classes: background, cell border and cell region (Fig. S1). An iterative cell segmenta-tion process identifies and segments clumped cells based on size and edge information. The performanceof detection of cells degrades in regions where several cells are clumped together. This can be avoided byapplying a threshold based on cell size and discarding the cells whose size goes beyond the threshold.
1
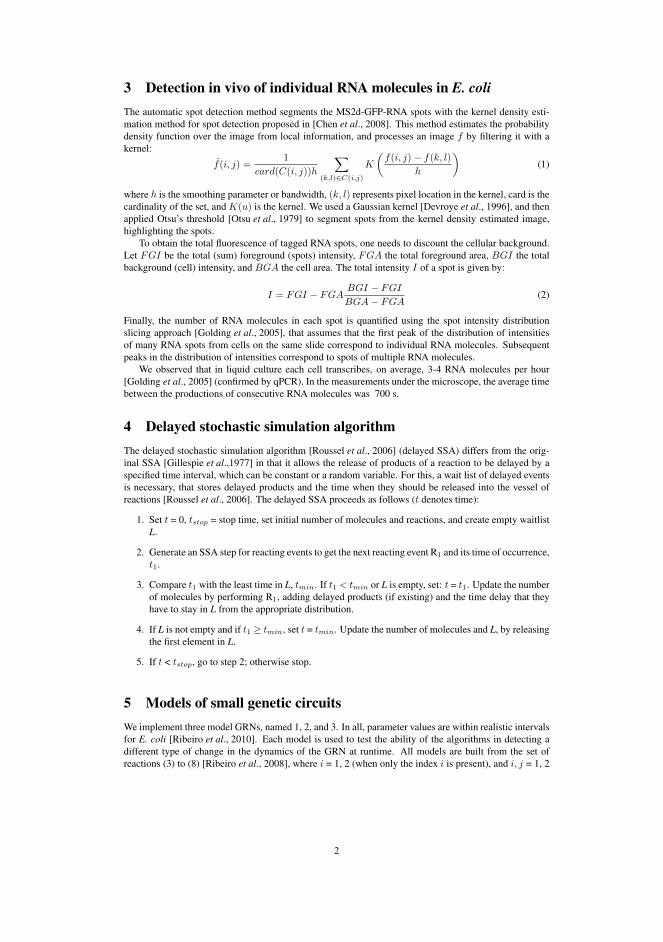
3 Detection in vivo of individual RNA molecules in E. coliThe automatic spot detection method segments the MS2d-GFP-RNA spots with the kernel density esti-mation method for spot detection proposed in [Chen et al., 2008]. This method estimates the probabilitydensity function over the image from local information, and processes an image f by filtering it with akernel:
f(i, j) =1
card(C(i, j))h
∑
(k,l)∈C(i,j)
K
(f(i, j) − f(k, l)
h
)(1)
where h is the smoothing parameter or bandwidth, (k, l) represents pixel location in the kernel, card is thecardinality of the set, and K(u) is the kernel. We used a Gaussian kernel [Devroye et al., 1996], and thenapplied Otsu’s threshold [Otsu et al., 1979] to segment spots from the kernel density estimated image,highlighting the spots.
To obtain the total fluorescence of tagged RNA spots, one needs to discount the cellular background.Let FGI be the total (sum) foreground (spots) intensity, FGA the total foreground area, BGI the totalbackground (cell) intensity, and BGA the cell area. The total intensity I of a spot is given by:
I = FGI − FGABGI − FGI
BGA − FGA(2)
Finally, the number of RNA molecules in each spot is quantified using the spot intensity distributionslicing approach [Golding et al., 2005], that assumes that the first peak of the distribution of intensitiesof many RNA spots from cells on the same slide correspond to individual RNA molecules. Subsequentpeaks in the distribution of intensities correspond to spots of multiple RNA molecules.
We observed that in liquid culture each cell transcribes, on average, 3-4 RNA molecules per hour[Golding et al., 2005] (confirmed by qPCR). In the measurements under the microscope, the average timebetween the productions of consecutive RNA molecules was 700 s.
4 Delayed stochastic simulation algorithmThe delayed stochastic simulation algorithm [Roussel et al., 2006] (delayed SSA) differs from the orig-inal SSA [Gillespie et al.,1977] in that it allows the release of products of a reaction to be delayed by aspecified time interval, which can be constant or a random variable. For this, a wait list of delayed eventsis necessary, that stores delayed products and the time when they should be released into the vessel ofreactions [Roussel et al., 2006]. The delayed SSA proceeds as follows (t denotes time):
1. Set t = 0, tstop = stop time, set initial number of molecules and reactions, and create empty waitlistL.
2. Generate an SSA step for reacting events to get the next reacting event R1 and its time of occurrence,t1.
3. Compare t1 with the least time in L, tmin. If t1 < tmin or L is empty, set: t = t1. Update the numberof molecules by performing R1, adding delayed products (if existing) and the time delay that theyhave to stay in L from the appropriate distribution.
4. If L is not empty and if t1 ≥ tmin, set t = tmin. Update the number of molecules and L, by releasingthe first element in L.
5. If t < tstop, go to step 2; otherwise stop.
5 Models of small genetic circuitsWe implement three model GRNs, named 1, 2, and 3. In all, parameter values are within realistic intervalsfor E. coli [Ribeiro et al., 2010]. Each model is used to test the ability of the algorithms in detecting adifferent type of change in the dynamics of the GRN at runtime. All models are built from the set ofreactions (3) to (8) [Ribeiro et al., 2008], where i = 1, 2 (when only the index i is present), and i, j = 1, 2
2

Supplementary Figure S1: Unprocessed image of MS2d-GFP-tagged RNA molecules in E. coli cells (left)and the corresponding segmented image showing the detected cells (grey) and the spots (white) within(right).
Supplementary Figure S2: The small genetic network used in models 1 and 2 (Left). The small geneticnetwork used in model 3 (Right). The line ending with a dot represents repression of a gene by the othergene.
with i = j (when both indices are present):
Proi + Rpkt−→ Proi(τ1) + Rp(τ2) + Ri(τ1) (3)
Ri + Ribktr−→ Ri(τ3) + Rib(τ4) + Pi(τ5, τ5std) (4)
Ri
rbsd−→ ∅ (5)
Pi
kd−→ ∅ (6)
Proi + Pj
krep−−kunrep
ProiPj (7)
ProiPj
kd−→ Proi (8)
Gene expression is modeled by the multiple time-delayed reactions for transcription (3) and translation(4), where Proi is the promoter of gene i, Rp is an RNA polymerase, Rib is a ribosome, and Ri is theribosome binding site of each RNA. The delays (τ1 to τ5) account for the duration of the processes intranscription and translation. When a product X has a delay τ , represented by X(τ ), it implies that whenthe reaction occurs, it takes τ seconds after that for X to appear in the system.
Reaction (4) for translation accounts for the variability of the time to complete a functional protein(translation, folding, activation, etc.), given that the delay of Pi follows a normal distribution, with a meanof τ5 and a standard deviation of τ5,std [Zhu et al., 2007]. Reactions (8) model the binding and unbindingof a repressor protein to a gene’s transcription factor binding site. Reaction (5) models the degradationof RNAs, while reactions (6) and (8) model the degradation of proteins, when free and when bound to apromoter region, respectively.
Unless stated otherwise, the rates (in s−1) of these reactions are kt = 0.01, ktr = 0.00042, drbs = 0.01,krep = 0.1, kunrep = 0.1, and kd = 0.0012. Time delays (in seconds) are τ1 = 40, τ2 = 90, τ3 = 2, τ4 =58, τ5 = 420, and τ5std = 140. Each ‘cell’ is initialized with Pi = 0 and Ri = 0, for all i, and with onepromoter of each gene (Pro1 = 1, Pro2 = 1), 40 RNA polymerases (Rp = 40), and 100 ribosomes (Rib= 100).
Model 1 is a 2-gene network, where the protein expressed by gene 1 represses the expression of gene2. It is used to model a change in the mean level of proteins at runtime. For that, at moment t = 5x10⁵ sof a simulation, the repression on gene 2 is increased by increasing the expression of P1. This decreases
3
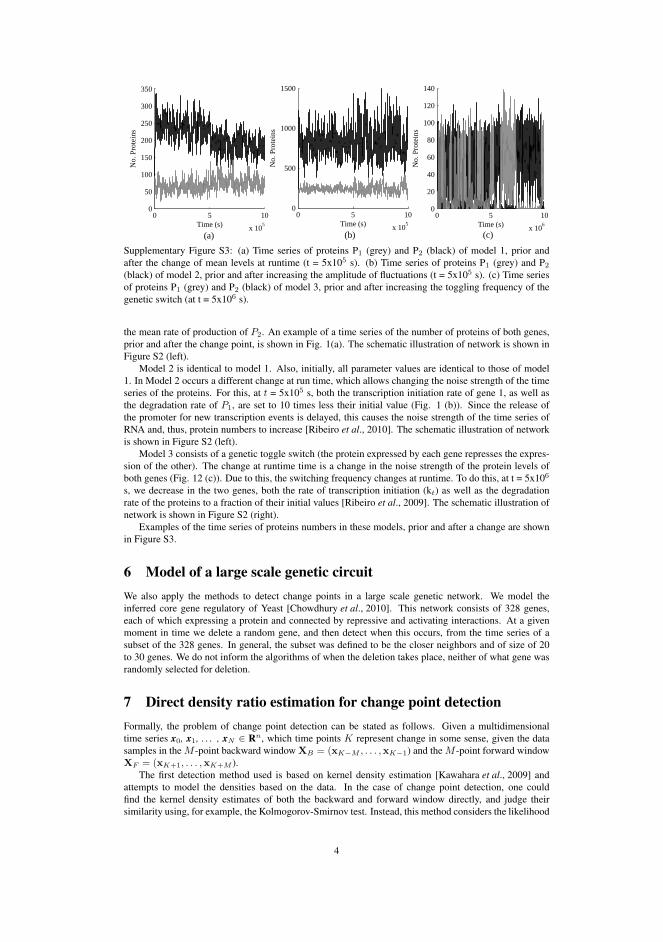
0 5 10
x 105
0
50
100
150
200
250
300
350
Time (s)
No.
Pro
tein
s
0 5 10
x 105
0
500
1000
1500
Time (s)
No.
Pro
tein
s
0 5 10
x 106
0
20
40
60
80
100
120
140
Time (s)
No.
Pro
tein
s
(a) (b) (c)
Supplementary Figure S3: (a) Time series of proteins P1 (grey) and P2 (black) of model 1, prior andafter the change of mean levels at runtime (t = 5x10⁵ s). (b) Time series of proteins P1 (grey) and P2
(black) of model 2, prior and after increasing the amplitude of fluctuations (t = 5x10⁵ s). (c) Time seriesof proteins P1 (grey) and P2 (black) of model 3, prior and after increasing the toggling frequency of thegenetic switch (at t = 5x10⁶ s).
the mean rate of production of P2. An example of a time series of the number of proteins of both genes,prior and after the change point, is shown in Fig. 1(a). The schematic illustration of network is shown inFigure S2 (left).
Model 2 is identical to model 1. Also, initially, all parameter values are identical to those of model1. In Model 2 occurs a different change at run time, which allows changing the noise strength of the timeseries of the proteins. For this, at t = 5x10⁵ s, both the transcription initiation rate of gene 1, as well asthe degradation rate of P1, are set to 10 times less their initial value (Fig. 1 (b)). Since the release ofthe promoter for new transcription events is delayed, this causes the noise strength of the time series ofRNA and, thus, protein numbers to increase [Ribeiro et al., 2010]. The schematic illustration of networkis shown in Figure S2 (left).
Model 3 consists of a genetic toggle switch (the protein expressed by each gene represses the expres-sion of the other). The change at runtime time is a change in the noise strength of the protein levels ofboth genes (Fig. 12 (c)). Due to this, the switching frequency changes at runtime. To do this, at t = 5x10⁶
s, we decrease in the two genes, both the rate of transcription initiation (kt) as well as the degradationrate of the proteins to a fraction of their initial values [Ribeiro et al., 2009]. The schematic illustration ofnetwork is shown in Figure S2 (right).
Examples of the time series of proteins numbers in these models, prior and after a change are shownin Figure S3.
6 Model of a large scale genetic circuitWe also apply the methods to detect change points in a large scale genetic network. We model theinferred core gene regulatory of Yeast [Chowdhury et al., 2010]. This network consists of 328 genes,each of which expressing a protein and connected by repressive and activating interactions. At a givenmoment in time we delete a random gene, and then detect when this occurs, from the time series of asubset of the 328 genes. In general, the subset was defined to be the closer neighbors and of size of 20to 30 genes. We do not inform the algorithms of when the deletion takes place, neither of what gene wasrandomly selected for deletion.
7 Direct density ratio estimation for change point detectionFormally, the problem of change point detection can be stated as follows. Given a multidimensionaltime series x0, x1, . . . , xN ∈ Rn, which time points K represent change in some sense, given the datasamples in the M -point backward window XB = (xK−M , . . . ,xK−1) and the M -point forward windowXF = (xK+1, . . . ,xK+M ).
The first detection method used is based on kernel density estimation [Kawahara et al., 2009] andattempts to model the densities based on the data. In the case of change point detection, one couldfind the kernel density estimates of both the backward and forward window directly, and judge theirsimilarity using, for example, the Kolmogorov-Smirnov test. Instead, this method considers the likelihood
4
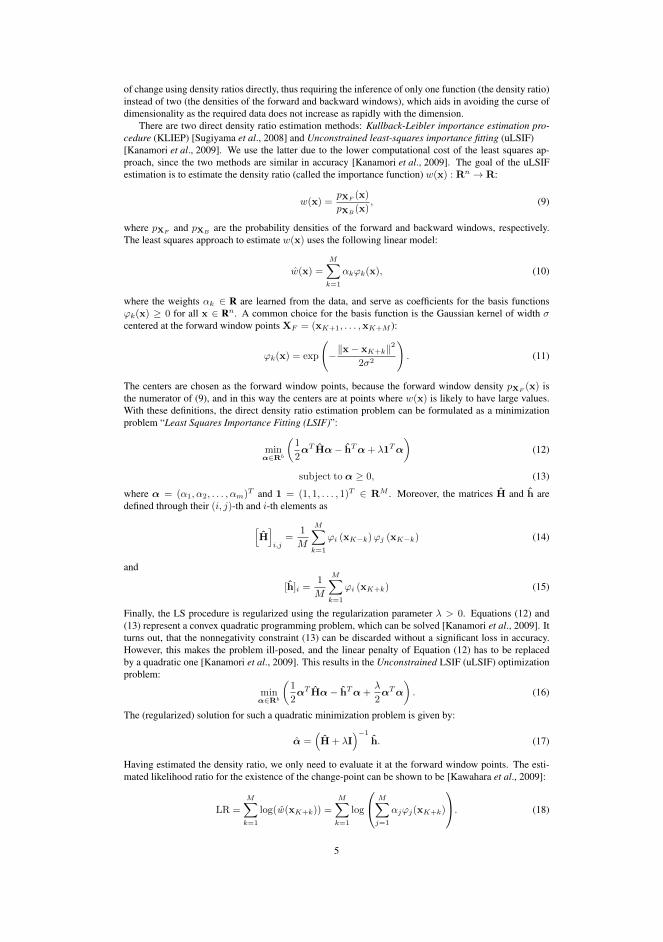
of change using density ratios directly, thus requiring the inference of only one function (the density ratio)instead of two (the densities of the forward and backward windows), which aids in avoiding the curse ofdimensionality as the required data does not increase as rapidly with the dimension.
There are two direct density ratio estimation methods: Kullback-Leibler importance estimation pro-cedure (KLIEP) [Sugiyama et al., 2008] and Unconstrained least-squares importance fitting (uLSIF)[Kanamori et al., 2009]. We use the latter due to the lower computational cost of the least squares ap-proach, since the two methods are similar in accuracy [Kanamori et al., 2009]. The goal of the uLSIFestimation is to estimate the density ratio (called the importance function) w(x) : Rn → R:
w(x) =pXF (x)
pXB(x)
, (9)
where pXF and pXB are the probability densities of the forward and backward windows, respectively.The least squares approach to estimate w(x) uses the following linear model:
w(x) =
M∑
k=1
αkφk(x), (10)
where the weights αk ∈ R are learned from the data, and serve as coefficients for the basis functionsφk(x) ≥ 0 for all x ∈ Rn. A common choice for the basis function is the Gaussian kernel of width σcentered at the forward window points XF = (xK+1, . . . ,xK+M ):
φk(x) = exp
(−∥x − xK+k∥2
2σ2
). (11)
The centers are chosen as the forward window points, because the forward window density pXF (x) isthe numerator of (9), and in this way the centers are at points where w(x) is likely to have large values.With these definitions, the direct density ratio estimation problem can be formulated as a minimizationproblem “Least Squares Importance Fitting (LSIF)”:
minα∈Rb
(1
2αT Hα − hT α + λ1T α
)(12)
subject to α ≥ 0, (13)
where α = (α1, α2, . . . , αm)T and 1 = (1, 1, . . . , 1)T ∈ RM . Moreover, the matrices H and h aredefined through their (i, j)-th and i-th elements as
[H]
i,j=
1
M
M∑
k=1
φi (xK−k) φj (xK−k) (14)
and
[h]i =1
M
M∑
k=1
φi (xK+k) (15)
Finally, the LS procedure is regularized using the regularization parameter λ > 0. Equations (12) and(13) represent a convex quadratic programming problem, which can be solved [Kanamori et al., 2009]. Itturns out, that the nonnegativity constraint (13) can be discarded without a significant loss in accuracy.However, this makes the problem ill-posed, and the linear penalty of Equation (12) has to be replacedby a quadratic one [Kanamori et al., 2009]. This results in the Unconstrained LSIF (uLSIF) optimizationproblem:
minα∈Rb
(1
2αT Hα − hT α +
λ
2αT α
). (16)
The (regularized) solution for such a quadratic minimization problem is given by:
α =(H + λI
)−1
h. (17)
Having estimated the density ratio, we only need to evaluate it at the forward window points. The esti-mated likelihood ratio for the existence of the change-point can be shown to be [Kawahara et al., 2009]:
LR =
M∑
k=1
log(w(xK+k)) =
M∑
k=1
log
M∑
j=1
αjφj(xK+k)
. (18)
5
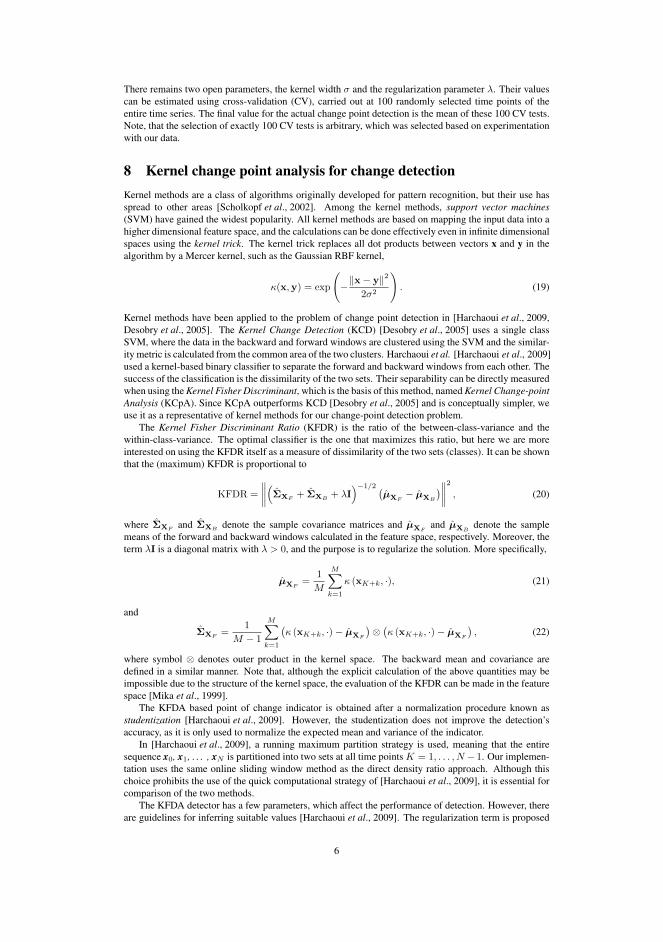
There remains two open parameters, the kernel width σ and the regularization parameter λ. Their valuescan be estimated using cross-validation (CV), carried out at 100 randomly selected time points of theentire time series. The final value for the actual change point detection is the mean of these 100 CV tests.Note, that the selection of exactly 100 CV tests is arbitrary, which was selected based on experimentationwith our data.
8 Kernel change point analysis for change detectionKernel methods are a class of algorithms originally developed for pattern recognition, but their use hasspread to other areas [Scholkopf et al., 2002]. Among the kernel methods, support vector machines(SVM) have gained the widest popularity. All kernel methods are based on mapping the input data into ahigher dimensional feature space, and the calculations can be done effectively even in infinite dimensionalspaces using the kernel trick. The kernel trick replaces all dot products between vectors x and y in thealgorithm by a Mercer kernel, such as the Gaussian RBF kernel,
κ(x,y) = exp
(−∥x − y∥2
2σ2
). (19)
Kernel methods have been applied to the problem of change point detection in [Harchaoui et al., 2009,Desobry et al., 2005]. The Kernel Change Detection (KCD) [Desobry et al., 2005] uses a single classSVM, where the data in the backward and forward windows are clustered using the SVM and the similar-ity metric is calculated from the common area of the two clusters. Harchaoui et al. [Harchaoui et al., 2009]used a kernel-based binary classifier to separate the forward and backward windows from each other. Thesuccess of the classification is the dissimilarity of the two sets. Their separability can be directly measuredwhen using the Kernel Fisher Discriminant, which is the basis of this method, named Kernel Change-pointAnalysis (KCpA). Since KCpA outperforms KCD [Desobry et al., 2005] and is conceptually simpler, weuse it as a representative of kernel methods for our change-point detection problem.
The Kernel Fisher Discriminant Ratio (KFDR) is the ratio of the between-class-variance and thewithin-class-variance. The optimal classifier is the one that maximizes this ratio, but here we are moreinterested on using the KFDR itself as a measure of dissimilarity of the two sets (classes). It can be shownthat the (maximum) KFDR is proportional to
KFDR =
∥∥∥∥(ΣXF + ΣXB + λI
)−1/2 (µXF
− µXB
)∥∥∥∥2
, (20)
where ΣXF and ΣXB denote the sample covariance matrices and µXFand µXB
denote the samplemeans of the forward and backward windows calculated in the feature space, respectively. Moreover, theterm λI is a diagonal matrix with λ > 0, and the purpose is to regularize the solution. More specifically,
µXF=
1
M
M∑
k=1
κ (xK+k, ·), (21)
and
ΣXF=
1
M − 1
M∑
k=1
(κ (xK+k, ·) − µXF
)⊗(κ (xK+k, ·) − µXF
), (22)
where symbol ⊗ denotes outer product in the kernel space. The backward mean and covariance aredefined in a similar manner. Note that, although the explicit calculation of the above quantities may beimpossible due to the structure of the kernel space, the evaluation of the KFDR can be made in the featurespace [Mika et al., 1999].
The KFDA based point of change indicator is obtained after a normalization procedure known asstudentization [Harchaoui et al., 2009]. However, the studentization does not improve the detection’saccuracy, as it is only used to normalize the expected mean and variance of the indicator.
In [Harchaoui et al., 2009], a running maximum partition strategy is used, meaning that the entiresequence x0, x1, . . . , xN is partitioned into two sets at all time points K = 1, . . . , N − 1. Our implemen-tation uses the same online sliding window method as the direct density ratio approach. Although thischoice prohibits the use of the quick computational strategy of [Harchaoui et al., 2009], it is essential forcomparison of the two methods.
The KFDA detector has a few parameters, which affect the performance of detection. However, thereare guidelines for inferring suitable values [Harchaoui et al., 2009]. The regularization term is proposed
6

to have a fixed value of λ = 10−5, which we use. Another significant parameter when using the RBFkernel of Equation (19) is the kernel bandwidth σ. Harchaoui et al. propose using the Silverman’s Rule ofThumb (ROT) for inferring a suitable bandwidth from the data, which we follow. The Silverman’s ROTis used in kernel density estimation and is defined by σROT = 1.06σxN−1/5, where σx is the variance ofthe data and N is the number of samples [Silverman et al., 1986].
References[Chen et al., 2008] Chen, T., Lu, H. H., Lee, Y. and Lan, H. (2008) Segmentation of cDNA microarray
images by kernel density estimation, Physical Biology, 41(6),1021-1027
[Chowdhury et al., 2010] Chowdhury, S., Lloyd-Price, J., Smolander, O.-P., Baici, W., Hughes, T., Yli-Harja, O., Chua, G., and Ribeiro, A. (2010). Information propagation within the genetic network ofsaccharomyces cerevisiae. BMC Systems Biology, 2010, 4.
[Desobry et al., 2005] Desobry, F., Davy, M. and Doncarli, C. (2005) An online Kernel change detectionalgorithm, IEEE Transactions on Signal Processing, 53(8), 2961-2974
[Devroye et al., 1996] Devroye, L. and Györfi, L. (1996) A Probabilistic Theory of Pattern Recognition,1st edition, Springer-Verlag, New York
[Gillespie et al.,1977] Gillespie, D. T. (1977) Exact stochastic simulation of coupled chemical reactions,Journal of Physical Chemistry, 81(25),2340-2361
[Golding et al., 2005] Golding, I. and Paulsson, J. and Zawilski, S. M. and Cox, E. C. (2005) Real-timekinetics of gene activity in individual bacteria, Cell, 123(6),1025-1036
[Harchaoui et al., 2009] Harchaoui, Z., Bach, F. and Moulines, E. (2009) Kernel Change-point Analysis,Advances in Neural Information Processing Systems (NIPS)
[Kanamori et al., 2009] Kanamori, T., Hido,S. and Sugiyama, M. (2009) A least-squares approach todirect importance estimation, Journal of Machine Learning Research, 10,1391-1445
[Kawahara et al., 2009] Kawahara, Y. and Sugiyama, M. (2009) Change-point detection in time-seriesdata by direct density-ratio estimation, Proc of 9th SIAM Int Conf on Data Mining, 1, 385-396
[Mika et al., 1999] Mika, S., Ratsch, G., Weston, J., Scholkopf, B., Muller, K - R. (1999) Fisher discrim-inant analysis with kernels, Neural Networks for Signal Processing, 1999, 41-48
[Otsu et al., 1979] Otsu, N. (1979) Threshold Selection Method from Gray-level Histograms, IEEE TransSyst Man Cybern, SMC-9(1),62-66
[Ribeiro et al., 2008] Ribeiro, A. S. (2008) Dynamics and evolution of stochastic bistable gene networkswith sensing in fluctuating environments, Phys Rev E, 78(6), 061902
[Ribeiro et al., 2009] Ribeiro, A. S., Dai, X. and Yli-Harja, O. (2009) Variability of the distribution ofdifferentiation pathway choices regulated by a multipotent delayed stochastic switch, J of Theor Bio,260(1), 66-76
[Ribeiro et al., 2010] Ribeiro, A. S. (2010) Stochastic and delayed stochastic models of gene expressionand regulation, Math. Biosciences, 223(1), 1-11
[Roussel et al., 2006] Roussel, M. R. and Zhu, R. (2006) Validation of an algorithm for delay stochasticsimulation of transcription and translation in prokaryotic gene expression, Physical Biology, 3(4), 274-284
[Scholkopf et al., 2002] Schölkopf, B. and Smola, A. (2002) Learning with Kernels: Support VectorMachines, Regularization, Optimization, and Beyond, MIT Press, 2002
[Silverman et al., 1986] Silverman, B. (1986) Density Estimation for Statistics and Data Analysis,Chapman-Hall, 1986
[Sugiyama et al., 2008] Sugiyama, M., Suzuki, T., Nakajima, S., Kashima, H., Von Bünau, P. andKawanabe, M. (2008) Direct importance estimation for covariate shift adaptation, Ann. of the Inst.of Stat. Math., 60(4), 699-746
7
[Wang et al., 2010] Wang, Q., Niemi, J., Tan, C., You, L. and West, M. (2010) Image segmentation anddynamic lineage analysis in single-cell fluorescence microscopy, Cytometry Part A, 77(1), 101-110
[Zhu et al., 2007] Zhu, R., Ribeiro, A. S., Salahub, D. and Kauffman, S. A. (2007) Studying geneticregulatory networks at the molecular level: Delayed reaction stochastic models, J. of Theor. Bio.,246(4), 725-745
8


Publication II
J. Mäkelä, M. Kandhavelu, S.M.D. Oliveira, J.G. Chandraseelan, J. Lloyd-Price,J. Peltonen, O. Yli-Harja, and A.S. Ribeiro, “In vivo single-molecule kineticsof activation and subsequent activity of the arabinose promoter”, Nucleic AcidsResearch, 41(13):6544-6552, 2013.

In vivo single-molecule kinetics of activation andsubsequent activity of the arabinose promoterJarno Makela1, Meenakshisundaram Kandhavelu1, Samuel M. D. Oliveira1,
Jerome G. Chandraseelan1, Jason Lloyd-Price1, Juha Peltonen1, Olli Yli-Harja1,2 and
Andre S. Ribeiro1,*
1Laboratory of Biosystem Dynamics, Computational Systems Biology Research Group, Department of SignalProcessing, Tampere University of Technology, FI-33101 Tampere, Finland and 2Institute for Systems Biology,1441N 34th Street, Seattle, WA 98103-8904, USA
Received March 21, 2013; Revised April 11, 2013; Accepted April 13, 2013
ABSTRACT
Using a single-RNA detection technique in liveEscherichia coli cells, we measure, for each cell,the waiting time for the production of the first RNAunder the control of PBAD promoter after induction byarabinose, and subsequent intervals between tran-scription events. We find that the kinetics of the ara-binose intake system affect mean and diversity inRNA numbers, long after induction. We observedthe same effect on Plac/ara-1 promoter, which isinducible by arabinose or by IPTG. Importantly, thedistribution of waiting times of Plac/ara-1 is indistin-guishable from that of PBAD, if and only if inducedby arabinose alone. Finally, RNA production underthe control of PBAD is found to be a sub-Poissonianprocess. We conclude that inducer-dependentwaiting times affect mean and cell-to-cell diversityin RNA numbers long after induction, suggestingthat intake mechanisms have non-negligible effectson the phenotypic diversity of cell populations innatural, fluctuating environments.
INTRODUCTION
Transcription in E. coli is, at a genome-wide scale, a rela-tively rare stochastic event (1–3). Further, many genesonly become active in response to external stimuli (4–7),via processes that are also stochastic (7). Although muchis known on the noise in gene expression at the single-celllevel (1–3,7–10), most of our present knowledge concern-ing the kinetics of response, in terms of gene activity, toexternal signals concerns the average behaviour of cellpopulations alone (11). However, to characterize thedynamics and the underlying steps of intake processes, itis necessary to observe their effects in individual live cells(12). This observation should inform also on the
robustness of cellular response mechanisms by informingon the degree of change in the responses of a single cell tomultiple occurrences of the same stimulus, as well as thedifference in responses to different stimuli.
One of the most well-known gene activation mechan-isms is the arabinose utilization system of E. coli.This system imports arabinose into the cell by AraFGH,an arabinose-specific high-affinity ABC transporter(11,13–15), and by a low-affinity transporter, AraE,which binds to the inner membrane and makes use ofelectrochemical potential to intake the arabinose(11,16,17). This system exhibits wide variability in thetiming of activation and in the rates of accumulation ofinducer molecules (18). It has been hypothesized that thisis due to the cell-to-cell variability in the numbers ofproteins responsible for the intake of arabinose (18).Interestingly, if the intake gene araE is placed under thecontrol of a constitutive promoter the intake rates becomemore homogenous (19–21), suggesting that the diversity inthe number of intake proteins is a non-negligible source ofcell-to-cell variability in the kinetics of the arabinose util-ization system (12).
Evidence suggests that when the intracellular concentra-tion of arabinose exceeds a threshold, the dimeric AraCprotein activates the genes that code for the proteins re-sponsible for the intake (AraE and AraFGH) and for thecatabolism of arabinose (araBAD) (11,22). In the absenceof arabinose, AraC binds two half-sites on the DNA(I1 and O2) and promotes the formation of a DNA loopthat prevents access of RNA polymerases to the pro-moters in that region (PC and PBAD). When bound byarabinose, AraC binds instead to the adjacent I1 and I2half-sites. The resulting configuration promotes transcrip-tion initiation at PBAD (11).
Transcription initiation is a complex, multi-steppedprocess (23,24). In vitro measurements suggest that thisprocess has at least two to three rate limiting steps(25,26). It starts when the RNA polymerase binds to the
*To whom correspondence should be addressed. Tel: +358408490736; Fax: +358331154989; Email: [email protected]
6544–6552 Nucleic Acids Research, 2013, Vol. 41, No. 13 Published online 3 May 2013doi:10.1093/nar/gkt350
The Author(s) 2013. Published by Oxford University Press.This is an Open Access article distributed under the terms of the Creative Commons Attribution License (http://creativecommons.org/licenses/by/3.0/), whichpermits unrestricted reuse, distribution, and reproduction in any medium, provided the original work is properly cited.
at Tam
pere University of T
echnology Library on July 28, 2016
http://nar.oxfordjournals.org/D
ownloaded from
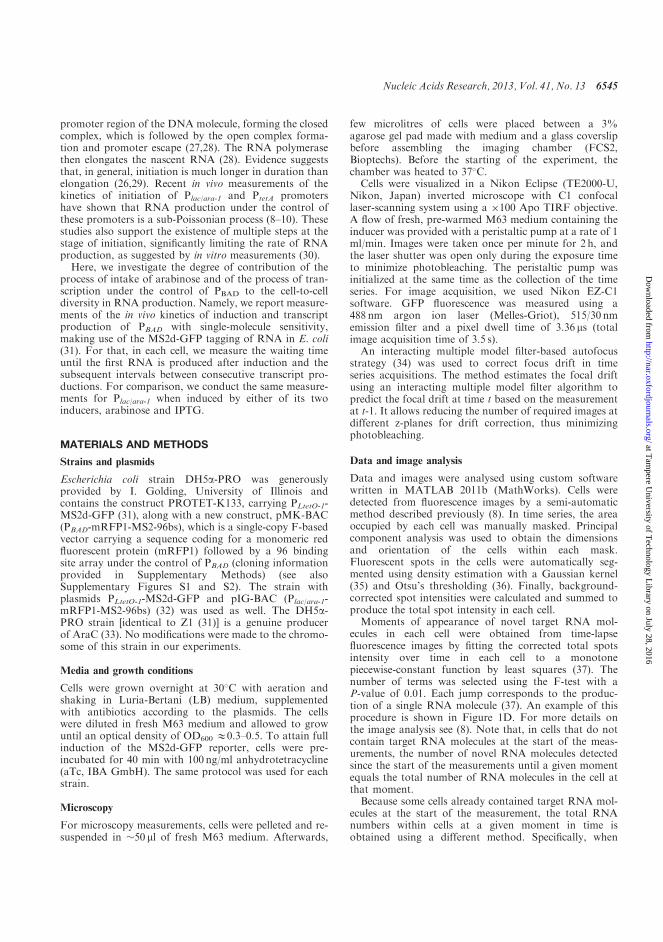
promoter region of the DNA molecule, forming the closedcomplex, which is followed by the open complex forma-tion and promoter escape (27,28). The RNA polymerasethen elongates the nascent RNA (28). Evidence suggeststhat, in general, initiation is much longer in duration thanelongation (26,29). Recent in vivo measurements of thekinetics of initiation of Plac/ara-1 and PtetA promotershave shown that RNA production under the control ofthese promoters is a sub-Poissonian process (8–10). Thesestudies also support the existence of multiple steps at thestage of initiation, significantly limiting the rate of RNAproduction, as suggested by in vitro measurements (30).
Here, we investigate the degree of contribution of theprocess of intake of arabinose and of the process of tran-scription under the control of PBAD to the cell-to-celldiversity in RNA production. Namely, we report measure-ments of the in vivo kinetics of induction and transcriptproduction of PBAD with single-molecule sensitivity,making use of the MS2d-GFP tagging of RNA in E. coli(31). For that, in each cell, we measure the waiting timeuntil the first RNA is produced after induction and thesubsequent intervals between consecutive transcript pro-ductions. For comparison, we conduct the same measure-ments for Plac/ara-1 when induced by either of its twoinducers, arabinose and IPTG.
MATERIALS AND METHODS
Strains and plasmids
Escherichia coli strain DH5a-PRO was generouslyprovided by I. Golding, University of Illinois andcontains the construct PROTET-K133, carrying PLtetO-1-MS2d-GFP (31), along with a new construct, pMK-BAC(PBAD-mRFP1-MS2-96bs), which is a single-copy F-basedvector carrying a sequence coding for a monomeric redfluorescent protein (mRFP1) followed by a 96 bindingsite array under the control of PBAD (cloning informationprovided in Supplementary Methods) (see alsoSupplementary Figures S1 and S2). The strain withplasmids PLtetO-1-MS2d-GFP and pIG-BAC (Plac/ara-1-mRFP1-MS2-96bs) (32) was used as well. The DH5a-PRO strain [identical to Z1 (31)] is a genuine producerof AraC (33). No modifications were made to the chromo-some of this strain in our experiments.
Media and growth conditions
Cells were grown overnight at 30C with aeration andshaking in Luria-Bertani (LB) medium, supplementedwith antibiotics according to the plasmids. The cellswere diluted in fresh M63 medium and allowed to growuntil an optical density of OD600 &0.3–0.5. To attain fullinduction of the MS2d-GFP reporter, cells were pre-incubated for 40 min with 100 ng/ml anhydrotetracycline(aTc, IBA GmbH). The same protocol was used for eachstrain.
Microscopy
For microscopy measurements, cells were pelleted and re-suspended in 50 ml of fresh M63 medium. Afterwards,
few microlitres of cells were placed between a 3%agarose gel pad made with medium and a glass coverslipbefore assembling the imaging chamber (FCS2,Bioptechs). Before the starting of the experiment, thechamber was heated to 37C.Cells were visualized in a Nikon Eclipse (TE2000-U,
Nikon, Japan) inverted microscope with C1 confocallaser-scanning system using a 100 Apo TIRF objective.A flow of fresh, pre-warmed M63 medium containing theinducer was provided with a peristaltic pump at a rate of 1ml/min. Images were taken once per minute for 2 h, andthe laser shutter was open only during the exposure timeto minimize photobleaching. The peristaltic pump wasinitialized at the same time as the collection of the timeseries. For image acquisition, we used Nikon EZ-C1software. GFP fluorescence was measured using a488 nm argon ion laser (Melles-Griot), 515/30 nmemission filter and a pixel dwell time of 3.36 ms (totalimage acquisition time of 3.5 s).An interacting multiple model filter-based autofocus
strategy (34) was used to correct focus drift in timeseries acquisitions. The method estimates the focal driftusing an interacting multiple model filter algorithm topredict the focal drift at time t based on the measurementat t-1. It allows reducing the number of required images atdifferent z-planes for drift correction, thus minimizingphotobleaching.
Data and image analysis
Data and images were analysed using custom softwarewritten in MATLAB 2011b (MathWorks). Cells weredetected from fluorescence images by a semi-automaticmethod described previously (8). In time series, the areaoccupied by each cell was manually masked. Principalcomponent analysis was used to obtain the dimensionsand orientation of the cells within each mask.Fluorescent spots in the cells were automatically seg-mented using density estimation with a Gaussian kernel(35) and Otsu’s thresholding (36). Finally, background-corrected spot intensities were calculated and summed toproduce the total spot intensity in each cell.Moments of appearance of novel target RNA mol-
ecules in each cell were obtained from time-lapsefluorescence images by fitting the corrected total spotsintensity over time in each cell to a monotonepiecewise-constant function by least squares (37). Thenumber of terms was selected using the F-test with aP-value of 0.01. Each jump corresponds to the produc-tion of a single RNA molecule (37). An example of thisprocedure is shown in Figure 1D. For more details onthe image analysis see (8). Note that, in cells that do notcontain target RNA molecules at the start of the meas-urements, the number of novel RNA molecules detectedsince the start of the measurements until a given momentequals the total number of RNA molecules in the cell atthat moment.Because some cells already contained target RNA mol-
ecules at the start of the measurement, the total RNAnumbers within cells at a given moment in time isobtained using a different method. Specifically, when
Nucleic Acids Research, 2013, Vol. 41, No. 13 6545
at Tam
pere University of T
echnology Library on July 28, 2016
http://nar.oxfordjournals.org/D
ownloaded from

comparing measurements using MS2d-GFP tagging andusing plate reader (Supplementary Figure S4), the totalnumber of MS2d-GFP–tagged RNA molecules was ex-tracted from the total spot intensity distribution,obtained from all cells in an image obtained at a givenmoment after induction. For this, the first peak of theobtained distribution is set to correspond to the intensityof a single-RNA molecule. The number of tagged RNAsin each spot can be estimated by dividing its intensity bythat of the first peak (32).
RESULTS
Experimental design
To study the kinetics of expression of PBAD, we detectindividual RNA molecules, as these are produced in livecells and register when these events occur. For this, weplaced the PBAD promoter on a single-copy F-plasmid,followed by a coding region for mRFP1 and an array of96 binding sites for MS2d-GFP–tagging proteins (32)(Figure 1A). The expression of MS2d-GFP is controlledby PTetO, which is activated before the gene of interestso that sufficient MS2d-GFP proteins are presentwhen target RNA molecules appear. Induction of PBAD
and image acquisitions is initialized simultaneously(Figure 1B). For this, we use a temperature-controlledimaging chamber and a peristaltic pump for introducing
inducers and fresh media. From the fluorescence images,using semi-automated cell segmentation and tracking(Figure 1C) (8), we measure in each cell the time for thefirst RNA to appear (named ‘waiting time’, t0), as well asthe subsequent intervals between consecutive RNA pro-ductions, t, until cell division occurs or until the end ofthe measurement period (Figure 1D).
Given that values of t0 can only be obtained from cellsof the first generation (i.e. cells already on the slide whenthe measurement begins), and as cells that do not divide inthe first 2 h will not, in general, divide afterwards, welimited the measurement period to 2 h for simplicity.This was possible, as this period also proved to be suffi-cient to acquire enough samples of t.
From cells born during the measurement period, weonly extract intervals between consecutive RNA produc-tions, not waiting times, as these contain inducers byinheritance. We detected no difference in the distributionsof intervals obtained from such cells and cells alreadypresent when induction is initiated. Finally, we observed0.2 RNA molecules per cell, at the moment precedinginduction, because of spurious transcription events. Cellswhere a target RNA was already present at the start of themeasurement were also not used to obtain values of t0.
First, we compared by quantitative polymerase chainreaction the RNA production from the F-plasmid andfrom the native gene under the control of PBAD
(Supplementary Methods). Using 16S rRNA as reference
Figure 1. Measurement system. (A) Components of the detection system. The expression of the tagging protein, MS2d-GFP, is controlled by PLtetO
(33) and is inducible by anhydrotetracycline (aTc). The target RNA contains an mRFP1 coding region, followed by an array of 96 MS2d-bindingsites. Expression of the target RNA is controlled by PBAD whose activity is regulated by AraC and the inducer L-arabinose. The target construct is ona single-copy F-plasmid. The tagging construct is on a medium-copy vector. (B) Figurative description of the waiting time for the first RNAproduction (t0) and intervals between subsequent productions (t). Images are taken once per minute for 2 h. (C) Example of E. coli cells expressingMS2d-GFP and target RNA. GFP-tagged RNA molecules are marked by circles. (D) Time course of total intensity of spots in a cell (circles) andmonotone piecewise-constant fit (line).
6546 Nucleic Acids Research, 2013, Vol. 41, No. 13
at Tam
pere University of T
echnology Library on July 28, 2016
http://nar.oxfordjournals.org/D
ownloaded from
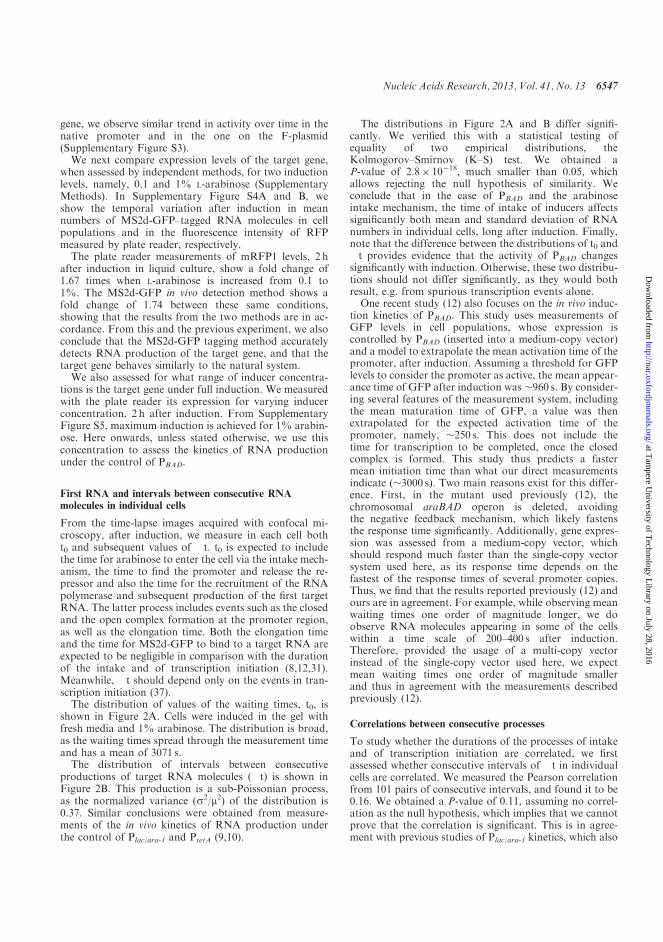
gene, we observe similar trend in activity over time in thenative promoter and in the one on the F-plasmid(Supplementary Figure S3).
We next compare expression levels of the target gene,when assessed by independent methods, for two inductionlevels, namely, 0.1 and 1% L-arabinose (SupplementaryMethods). In Supplementary Figure S4A and B, weshow the temporal variation after induction in meannumbers of MS2d-GFP–tagged RNA molecules in cellpopulations and in the fluorescence intensity of RFPmeasured by plate reader, respectively.
The plate reader measurements of mRFP1 levels, 2 hafter induction in liquid culture, show a fold change of1.67 times when L-arabinose is increased from 0.1 to1%. The MS2d-GFP in vivo detection method shows afold change of 1.74 between these same conditions,showing that the results from the two methods are in ac-cordance. From this and the previous experiment, we alsoconclude that the MS2d-GFP tagging method accuratelydetects RNA production of the target gene, and that thetarget gene behaves similarly to the natural system.
We also assessed for what range of inducer concentra-tions is the target gene under full induction. We measuredwith the plate reader its expression for varying inducerconcentration, 2 h after induction. From SupplementaryFigure S5, maximum induction is achieved for 1% arabin-ose. Here onwards, unless stated otherwise, we use thisconcentration to assess the kinetics of RNA productionunder the control of PBAD.
First RNA and intervals between consecutive RNAmolecules in individual cells
From the time-lapse images acquired with confocal mi-croscopy, after induction, we measure in each cell botht0 and subsequent values of t. t0 is expected to includethe time for arabinose to enter the cell via the intake mech-anism, the time to find the promoter and release the re-pressor and also the time for the recruitment of the RNApolymerase and subsequent production of the first targetRNA. The latter process includes events such as the closedand the open complex formation at the promoter region,as well as the elongation time. Both the elongation timeand the time for MS2d-GFP to bind to a target RNA areexpected to be negligible in comparison with the durationof the intake and of transcription initiation (8,12,31).Meanwhile, t should depend only on the events in tran-scription initiation (37).
The distribution of values of the waiting times, t0, isshown in Figure 2A. Cells were induced in the gel withfresh media and 1% arabinose. The distribution is broad,as the waiting times spread through the measurement timeand has a mean of 3071 s.
The distribution of intervals between consecutiveproductions of target RNA molecules (t) is shown inFigure 2B. This production is a sub-Poissonian process,as the normalized variance (s2/m2) of the distribution is0.37. Similar conclusions were obtained from measure-ments of the in vivo kinetics of RNA production underthe control of Plac/ara-1 and PtetA (9,10).
The distributions in Figure 2A and B differ signifi-cantly. We verified this with a statistical testing ofequality of two empirical distributions, theKolmogorov–Smirnov (K–S) test. We obtained aP-value of 2.8 1018, much smaller than 0.05, whichallows rejecting the null hypothesis of similarity. Weconclude that in the case of PBAD and the arabinoseintake mechanism, the time of intake of inducers affectssignificantly both mean and standard deviation of RNAnumbers in individual cells, long after induction. Finally,note that the difference between the distributions of t0 andt provides evidence that the activity of PBAD changessignificantly with induction. Otherwise, these two distribu-tions should not differ significantly, as they would bothresult, e.g. from spurious transcription events alone.One recent study (12) also focuses on the in vivo induc-
tion kinetics of PBAD. This study uses measurements ofGFP levels in cell populations, whose expression iscontrolled by PBAD (inserted into a medium-copy vector)and a model to extrapolate the mean activation time of thepromoter, after induction. Assuming a threshold for GFPlevels to consider the promoter as active, the mean appear-ance time of GFP after induction was 960 s. By consider-ing several features of the measurement system, includingthe mean maturation time of GFP, a value was thenextrapolated for the expected activation time of thepromoter, namely, 250 s. This does not include thetime for transcription to be completed, once the closedcomplex is formed. This study thus predicts a fastermean initiation time than what our direct measurementsindicate (3000 s). Two main reasons exist for this differ-ence. First, in the mutant used previously (12), thechromosomal araBAD operon is deleted, avoidingthe negative feedback mechanism, which likely fastensthe response time significantly. Additionally, gene expres-sion was assessed from a medium-copy vector, whichshould respond much faster than the single-copy vectorsystem used here, as its response time depends on thefastest of the response times of several promoter copies.Thus, we find that the results reported previously (12) andours are in agreement. For example, while observing meanwaiting times one order of magnitude longer, we doobserve RNA molecules appearing in some of the cellswithin a time scale of 200–400 s after induction.Therefore, provided the usage of a multi-copy vectorinstead of the single-copy vector used here, we expectmean waiting times one order of magnitude smallerand thus in agreement with the measurements describedpreviously (12).
Correlations between consecutive processes
To study whether the durations of the processes of intakeand of transcription initiation are correlated, we firstassessed whether consecutive intervals of t in individualcells are correlated. We measured the Pearson correlationfrom 101 pairs of consecutive intervals, and found it to be0.16. We obtained a P-value of 0.11, assuming no correl-ation as the null hypothesis, which implies that we cannotprove that the correlation is significant. This is in agree-ment with previous studies of Plac/ara-1 kinetics, which also
Nucleic Acids Research, 2013, Vol. 41, No. 13 6547
at Tam
pere University of T
echnology Library on July 28, 2016
http://nar.oxfordjournals.org/D
ownloaded from

indicate inexistence of correlation between durations ofconsecutive intervals between RNA productions (8).We next assessed whether the distributions of t0 and
values of t (Figure 2A and B) are correlated. Note thatt0 and the t are of similar order of magnitude as themeasurement period. This introduces artificial correlationsbetween t0 and t of individual cells, as, e.g. a cell with alarge t0 is expected to exhibit smaller than average tvalues, as larger intervals would not be detected duringthe measurement period as likely as in cells with smallervalues of t0. To remove these artificial correlationsbetween t0 and t of individual cells, in this assessment,we only considered RNA productions for a certainwindow size (Supplementary Methods and SupplementaryFigure S6). This window is set so as to maximize thenumber of data points that can be extracted from themeasurements.From the windowed data, we calculated the Pearson
correlation between t0 and t values in individual cellsto be 0.15. We calculated a P-value of 0.18 assumingno correlation as the null hypothesis, which implies thatwe cannot prove that the correlation is significant. Thisresult is in line with (12), which reports a lack of correl-ation between initiation of protein expression and subse-quent rate of protein synthesis in individual cells.
Dynamics of induction and of transcription initiationunder different induction schemes
The distinctiveness of the distributions of t0 and t ofPBAD, as assessed by the K–S test, suggests that theyare, partially, the result of different processes. Althought0 ought to depend on the kinetics of intake of arabinoseand on the first transcription initiation event, t valuesought to depend mostly on the kinetics of transcriptioninitiation events alone.These assumptions arise from the following. First,
in vitro and in vivomeasurements (26,38) suggest that tran-scription initiation (including closed and open complexformation) is a long-duration, multi-step process, usuallytaking 102–103 s in bacterial promoters (10,25,26,37,38).Other events that need to occur before the appearance
of a target RNA because of the tagging of the MS2d-GFP are not expected to affect t significantly. Theseare transcription elongation and the tagging by multipleMS2d-GFP. Elongation of the target RNA was measuredto take only tens of seconds (31). Also, the tagging occursat a rate that makes the RNA visible during elongation orshortly after (31).
To test the two assumptions, we measured the distribu-tions of t0 and t for another promoter, Plac/ara-1, in twoconditions. Plac/ara-1 can be induced either by IPTG or byarabinose (as PBAD), or by both inducers simultaneously(9). According to our assumption, the distribution of t0 ofPBAD is expected to be similar to that of Plac/ara-1 when thelatter is induced by arabinose, because of depending onthe same intake mechanism, whereas it should differ sig-nificantly when Plac/ara-1 is induced by IPTG, given thedifferent intake mechanisms of IPTG.
We measured the distributions of t0 and t for Plac/ara-1
when induced by IPTG alone and when induced byarabinose alone (Table 1). We used the same concentra-tion of arabinose as when inducing PBAD. The IPTG con-centration used is the one required for maximuminduction of Plac/ara-1 (33). Results in Table 1 follow thewindowing procedure described earlier in the text. Thetable shows mean, standard deviation and square of thecoefficient of variation (m2/s2) of t0 and of t for the twopromoters, each of which in two induction schemes.
We first assessed the distinctiveness of the distributionsof t0 and t by the K–S test, for each promoter in eachcondition (Table 2). In all cases, these two distributionsdiffer in a statistical sense. This is in agreement with theassumption that although both t and t0 depend on thekinetics of initiation at the promoter, only t0 depends onthe kinetics of intake of inducers.
We next performed statistical tests to assess the distinct-iveness between the induction kinetics (t0) of the two pro-moters (Table 3), when subject to the same inducer andwhen subject to different inducers. Also, we compared theeffects of a different inducer concentration in the case ofPBAD. From Table 3, when PBAD and Plac/ara-1 are inducedwith 1% arabinose, they exhibit distributions of t0 thatcannot be distinguished. However, when Plac/ara-1 is
0 2000 4000 60000
1
2
3
4x 10
−4
Time (s)
Pro
babi
lity
dens
ity
0 2000 4000 60000
1
2
3
4
5
x 10−4
Time (s)
Pro
babi
lity
dens
ity
BA
Figure 2. Kinetics of the intake and production. (A) Probability density distribution of waiting times (m=3071 s, s=1711 s) for the first RNA to beproduced in cells induced by 1% L-arabinose (354 data points). (B) Probability density distribution of intervals between transcription events for PBAD
when induced by 1% L-arabinose (m=1672 s, s=1012 s) (347 data points).
6548 Nucleic Acids Research, 2013, Vol. 41, No. 13
at Tam
pere University of T
echnology Library on July 28, 2016
http://nar.oxfordjournals.org/D
ownloaded from

induced with IPTG, the resulting t0 distribution is statis-tically distinguishable from that of PBAD, when induced byeither 0.1 or 1% arabinose. It is also distinct from its ownt0 distribution when induced by 1% arabinose. This stat-istically significant difference supports the hypothesis thatthe distributions of t0 are dependent on the kinetics of theintake system of the inducers, and that these differ forIPTG and arabinose.
Finally, we observed that the distributions of t0 of PBAD,when induced by 0.1% and by 1% arabinose, are distinct.This is expected as the time for inducers to ‘first reach thepromoter’ ought to depend on the inducer’sconcentration.
Kinetics of the intake process
The intake time of an inducer, here named ‘tdiff’, differsfrom t0 in that it does not include the time for the firsttranscription initiation event to occur. Because of this, tdiffcannot be measured directly with the MS2-GFP–taggingmethod. We thus estimate the mean and variance of thedistribution of values of tdiff by subtracting the means andvariances of the t distribution from the t0 distribution.This method is based on the fact that we were unable to
establish the existence of a correlation between the valuesof t0 and t. Given this, and as they are, at most, weaklycorrelated (Pearson correlation of 0.15), we assume thatthey are independent so as to be able to estimate thestandard deviation of the duration of the intake processalone (note that the mean of this quantity can be estimatedas described later in the text, regardless of the existence ofdependence).The estimated mean and a standard deviation of tdiff are
similar for PBAD and for Plac/ara-1, when induced with 1%arabinose. Namely, in both cases, we obtained a mean of1400 s and a standard deviation of 1100 s. This isexpected, given the usage of the same intake mechanismand inducer concentration. Importantly, when Plac/ara-1 isinduced by IPTG, the standard deviation of tdiff is muchsmaller (700 s), whereas the mean is similar to wheninduced by arabinose (1400 s). This suggests that theintake of arabinose is a noisier process (concerning theuncertainty of the intake time) than the intake of IPTG.Finally, we find that in the case of PBAD, the concentrationof arabinose affects the mean of tdiff significantly, as itequals 2000 s for 0.1% arabinose.
Effect of the intake process on the temporal cell-to-celldiversity in RNA numbers
Because of being stochastic and thus variable in durationfrom one event to the next (i.e. it differs from one cell tothe next), the intake process impacts on the diversity inRNA numbers of a cell population. This impact shoulddecrease with time, after induction. We estimated the timeduring which the effect is tangible for each measurementcondition. For this, we assume that values of t0 dependmostly on the intake of arabinose and on the first tran-scription initiation event at the start site of PBAD.Meanwhile, the distribution of intervals between consecu-tive RNAs is assumed to depend solely on the kinetics oftranscription initiation (8,10,37).The events determining t as well as t0 are modelled as
d-step processes, each step with an exponentiallydistributed duration (Supplementary Methods) (37).From this assumption, it is possible, for a given numberof steps, to find the duration of each step that best fits themeasurements. We assume transcription initiation to be athree-step process, namely, the closed complex formation,the open complex formation and promoter escape (27,38),as evidence suggests that these are the most rate-limitingsteps in normal conditions, i.e. the ones most contributingto the intervals between production of consecutive RNAmolecules (26). This assumption also relies on recent
Table 1. Measurements of t0 and t
Promoter Inducer No. of samples (t) mt (s) st (s) s2/m2 No. samples (t0) mt0 (s) st0 (s) s2/m2
PBAD 1% arabinose 102 1440.6 532.8 0.14 84 2885.0 1159.8 0.16PBAD 0.1% arabinose 78 1475.4 481.2 0.11 70 3519.4 1236.2 0.12Plac/ara-1 1% arabinose 149 1516.5 516.0 0.12 125 2832.5 1184.6 0.17Plac/ara-1 1mM IPTG 485 1314.4 576.0 0.19 286 2697.0 913.6 0.11
The table shows the mean (m), the standard deviation (s) and the normalized variance (s2/m2) of the measured distributions of t0 and t.
Table 3. P-values of the Kolmogorov–Smirnov test between t0distributions for each promoter and induction condition
PBAD
1% arabPBAD
0.1% arabPlac/ara-1
1% arabPlac/ara-1
IPTG
PBAD 1% arab 1PBAD 0.1% arab 5.93 104 1Plac/ara-1 1% arab 0.8533 1.10 104 1Plac/ara-1 IPTG 0.0126 4.49 10–12 0.0049 1
For P< 0.05, it is generally accepted that the hypothesis that the twodistributions are the same should be rejected.
Table 2. P-values of the Kolmogorov–Smirnov test between t0 and
t distributions for each promoter and induction condition
Promoter Inducer P-value
PBAD 1% arabinose 2.83 1018
PBAD 0.1% arabinose 4.06 1021
Plac/ara-1 1% arabinose 2.48 1026
Plac/ara-1 1mM IPTG 3.32 1072
For P< 0.05, it is generally accepted that the hypothesis that the twodistributions are the same should be rejected.
Nucleic Acids Research, 2013, Vol. 41, No. 13 6549
at Tam
pere University of T
echnology Library on July 28, 2016
http://nar.oxfordjournals.org/D
ownloaded from

studies (37) that indicate that assuming this number ofsteps suffices to generate distributions that cannot be dis-tinguished, in a statistical sense, from measurements withaccuracy and quantity of data similar to the measurementsreported here. Finally, we assume the intake to be atwo-step process, namely, the binding of extracellulararabinose to an uptake protein and, once bound, its trans-location to the cytoplasm (12). The combination of thetwo processes (intake followed by transcription initiation)is, consequently, assumed to be a five-step process.Assuming these numbers of steps and stable conditions
(e.g. induction level), we searched for models that fit thedistributions accurately enough so that the K–S test doesnot find differences between model and measurements.The P-values of these tests are shown in SupplementaryTable S1 and show that in all but one case, it is possible tofind a model that cannot be distinguished from the empir-ical distribution, in a statistical sense.The case for which we could not find a model that fits
the measurements is that of PBAD at 0.1% arabinose in-duction. This may be due to lack of sufficient data orbecause the model is unsuitable. Future studies arerequired to assert this. One explanation may be that, inthis case, the distribution of intake times results from twodistinct kinetics, one being the productions under induc-tion and the other being spurious productions by pro-moters in the ‘non-induced’ state.Given the models aforementioned and provided a rate
of RNA degradation, it is possible to estimate the time ittakes for the mean RNA numbers of a model cell popu-lation to reach equilibrium, as this time depends solely onthe rate of degradation of RNAs and t0. We do not havemeasurements of the degradation rate of the target RNA,as the tagging with MS2d-GFP ‘immortalizes’ it for theduration of the measurements (32). Instead, the models inFigure 3 assume an RNA degradation rate of 5min1,which is within realistic intervals for E. coli (1).From all of the aforementioned data, we estimated the
mean times for RNA numbers to reach near-equilibrium,
as well as the Fano factor of this quantity since the start ofthe simulations. Results are shown in Figure 3, asestimated for each of the models. Also shown is an esti-mation that assumes the model of transcription initiationof PBAD when induced by 1% arabinose, coupled with aninfinitely fast intake.
In all cases, reaching equilibrium in mean RNAnumbers takes >1 h, except when assuming infinitely fastintake, in which case the time to reach equilibrium is <0.5h. Thus, for a time length as long as 1–2 h, the intakeprocess has a non-negligible contribution on the meanand the on the cell-to-cell diversity in RNA numbers ofthe cell populations. From Figure 3A, one also observesdifferent shapes in the curves of Plac/ara-1 when induced byIPTG (dashed line) and when induced by arabinose(dotted line), because of differing intake kinetics.
From Figure 3B, the contribution of the intake kineticson the cell-to-cell variability in RNA numbers is also sig-nificant. For example, the kinetics of intake causes anincrease in the Fano factor in the initial moments not ob-servable in the case of infinitely fast intake.
We also tested models of PBAD induced by 1% arabin-ose (normal and infinitely fast intake) with other RNAdegradation rates (Supplementary Figure S7), within real-istic intervals (1). Aside from assessing the degree ofdependency on the intake time and degradation rate,one also observes from the figure that although thelatter determines the rate at which the system reaches equi-librium, the former acts as a delay towards reaching thenumbers at equilibrium. Further, one can see thatthe intake step adds diversity to the RNA numbers inthe cells, during the transient to reach equilibrium.
DISCUSSION
We measured, at the single-cell level, how long it takes forthe first RNA under the control of PBAD to be produced,followed the introduction of the inducer in the media.Also, we measured the subsequent intervals between
0 2000 4000 60000
0.05
0.1
0.15
0.2
Time (s)
Mea
n R
NA
0 2000 4000 6000
0.85
0.9
0.95
1
Time (s)
Fan
o fa
ctor
BA
Figure 3. Mean and Fano factor of transient times for different models of intake and subsequent RNA production kinetics. Mean (A) and Fanofactor (B) of RNA numbers as obtained by CME models of activation and expression. The models shown are that of Plac/ara-1 with 1mM IPTG(dashed line), Plac/ara-1 with 1% arabinose (dotted line), PBAD with 1% arabinose (dash-dotted line) and PBAD with 1% arabinose and infinitely fastintake (solid line).
6550 Nucleic Acids Research, 2013, Vol. 41, No. 13
at Tam
pere University of T
echnology Library on July 28, 2016
http://nar.oxfordjournals.org/D
ownloaded from
consecutive RNA productions. From the intervalsbetween transcription events, we determined that RNAproduction under the control of PBAD is a sub-Poissonian process. Two recent studies reached similarconclusions for Plac/ara-1 and PtetA, for all induction con-ditions tested (9,10). We hypothesize that this may be acommon phenomenon because of the kinetic properties ofthe process of transcription initiation in bacteria, in par-ticular, because of its multi-stepped nature.
From the distributions of the time, it takes for theappearance of the first RNA in each cell when underthe control of PBAD and of Plac/ara-1, for different induc-tion conditions, we assessed the effect of the kinetics ofthe intake process on the mean and cell-to-cell diversityin RNA numbers of cell populations. Relevantly, thiseffect was found to be tangible for a long period afterinduction. Also, we verified that different intake mech-anisms differ significantly not only in mean but alsoin the degree of variability of the intake time, andthat this has a non-negligible effect on RNA populationstatistics.
Given the aforementioned data, and considering thatnatural environments are fluctuating, we expect thekinetics of cellular intake mechanisms to have a significanteffect on the degree of phenotypic diversity of cell popu-lations. Finally, we expect the methodology used here toassess the in vivo kinetics of intake of arabinose and ofIPTG to be applicable to any gene of interest. Such studiesshould provide valuable insight into the adaptability ofprokaryotic organisms to environmental changes andstress. They should also provide a better understandingof the observed cell-to-cell phenotypic diversity in E. coliwhen in fluctuating environments.
SUPPLEMENTARY DATA
Supplementary Data are available at NAROnline: Supplementary Table 1, Supplementary Figures1–7, Supplementary Methods and SupplementaryReferences [39–43].
FUNDING
The Academy of Finland [257603 to A.S.R.]; the FinnishFunding Agency for Technology and Innovation [40226/12 to O.Y.-H.]; the Foundation for Science andTechnology, Portugal [PTDC/BBB-MET/1084/2012 toA.S.R.]. Funding for open access charge: Academy ofFinland [257603, 2012 to A.S.R.].
Conflict of interest statement. The funders had no role instudy design, data collection and analysis, decision topublish, or preparation of the manuscript.
REFERENCES
1. Bernstein,J.A., Khodursky,A.B., Lin-Chao,S. and Cohen,S.N.(2002) Global analysis of mRNA decay and abundance inEscherichia coli at single-gene resolution using two-colorfluorescent DNA microarrays. Proc. Natl Acad. Sci. USA, 99,9697–9702.
2. Yu,J., Xiao,J., Ren,X., Lao,K. and Xie,X.S. (2006) Probing geneexpression in live cells, one protein molecule at a time. Science,311, 1600–1603.
3. Taniguchi,Y., Choi,P.J., Li,G.-W., Chen,H., Babu,M., Hearn,J.,Emili,A. and Xie,X.S. (2010) Quantifying E. coli proteome andtranscriptome with single-molecule sensitivity in single cells.Science, 329, 533–538.
4. Weickert,M.J. and Adhya,S. (1993) The galactose regulon ofEscherichia coli. Mol. Microbiol., 10, 245–251.
5. Skerra,A. (1994) Use of the tetracycline promoter for the tightlyregulated production of a murine antibody fragment inEscherichia coli. Gene, 151, 131–135.
6. Schleif,R. (2000) Regulation of the L-arabinose operon ofEscherichia coli. Trends. Genet., 16, 559–565.
7. Choi,P., Cai,L., Frieda,K. and Xie,X. (2008) A stochastic single-molecule event triggers phenotype switching of a bacterial cell.Science, 322, 442–446.
8. Kandhavelu,M. and Hakkinen,A. (2012) Single-molecule dynamicsof transcription of the lar promoter. Phys. Biol., 9, 026004.
9. Kandhavelu,M., Lloyd-Price,J., Gupta,A., Muthukrishnan,A.B.,Yli-Harja,O. and Ribeiro,A.S. (2012) Regulation of mean andnoise of the in vivo kinetics of transcription under the control ofthe lac/ara-1 promoter. FEBS Lett., 586, 3870–3875.
10. Muthukrishnan,A.B., Kandhavelu,M., Lloyd-Price,J., Kudasov,F.,Chowdhury,S., Yli-Harja,O. and Ribeiro,A.S. (2012) Dynamics oftranscription driven by the tetA promoter, one event at a time, inlive Escherichia coli cells. Nucleic Acids Res., 40, 8472–8483.
11. Schleif,R. (2010) AraC protein, regulation of the l-arabinoseoperon in Escherichia coli, and the light switch mechanism ofAraC action. FEMS Microbiol. Rev., 34, 779–796.
12. Megerle,J.A., Fritz,G., Gerland,U., Jung,K. and Radler,J.O.(2008) Timing and dynamics of single cell Gene expression in thearabinose utilization system. Biophys. J., 95, 2103–2115.
13. Hogg,R.W. and Englesberg,E. (1969) L-arabinose binding proteinfrom Escherichia coli B/r. J. Bacteriol., 100, 423–432.
14. Schleif,R. (1969) An l-arabinose binding protein and arabinosepermeation in Escherichia coli. J. Mol. Biol., 46, 185–196.
15. Horazdovsky,B.F. and Hogg,R.W. (1989) Genetic reconstitutionof the high-affinity L-arabinose transport system. J. Bacteriol.,171, 3053–3059.
16. Lee,J.H., Al-Zarban,S. and Wilcox,G. (1981) Geneticcharacterization of the araE gene in Salmonella typhimuriumLT2. J. Bacteriol., 146, 298–304.
17. Stoner,C. and Schleif,R. (1983) The araE low affinity L-arabinosetransport promoter. Cloning, sequence, transcription start site andDNA binding sites of regulatory proteins. J. Mol. Biol., 171,369–381.
18. Siegele,D.A. and Hu,J.C. (1997) Gene expression from plasmidscontaining the araBAD promoter at subsaturating inducerconcentrations represents mixed populations. Proc. Natl Acad.Sci. USA, 94, 8168–8172.
19. Khlebnikov,A., Risa,O., Skaug,T., Carrier,T.A. and Keasling,J.D.(2000) Regulatable arabinose-inducible gene expression systemwith consistent control in all cells of a culture. J. Bacteriol., 182,7029–7034.
20. Khlebnikov,A., Datsenko,K.A., Skaug,T., Wanner,B.L. andKeasling,J.D. (2001) Homogeneous expression of the P-BADpromoter in Escherichia coli by constitutive expression of the low-affinity high-capacity AraE transporter. Microbiology, 147,3241–3247.
21. Morgan-Kiss,R.M., Wadler,C. and Cronan,J.E. (2002) Long-termand homogeneous regulation of the Escherichia coli araBADpromoter by use of a lactose transporter of relaxed specificity.Proc. Natl Acad. Sci. USA, 99, 7373–7377.
22. Johnson,C.M. and Schleif,R.F. (1995) In vivo induction kineticsof the arabinose promoters in Escherichia coli. J. Bacteriol., 177,3438–3442.
23. Walter,G., Zillig,W., Palm,P. and Fuchs,E. (1967) Initiation ofDNA-Dependent RNA synthesis and the effect of heparin onRNA polymerase. Eur. J. Biochem., 3, 194–201.
24. Chamberlin,M.J. (1974) The selectivity of transcription. Annu.Rev. Biochem., 43, 721–775.
25. Buc,H. and McClure,W.R. (1985) Kinetics of open complexformation between Escherichia coli RNA polymerase and the lac
Nucleic Acids Research, 2013, Vol. 41, No. 13 6551
at Tam
pere University of T
echnology Library on July 28, 2016
http://nar.oxfordjournals.org/D
ownloaded from
UV5 promoter. Evidence for a sequential mechanism involvingthree steps. Biochemistry, 24, 2712–2723.
26. Lutz,R., Lozinski,T., Ellinger,T. and Bujard,H. (2001) Dissectingthe functional program of Escherichia coli promoters: the
combined mode of action of Lac repressor and AraC activator.
Nucleic Acids Res., 29, 3873–3881.27. Hsu,L.M. (2002) Promoter clearance and escape in prokaryotes.
Biochim. Biophys. Acta, 1577, 191–207.28. DeHaseth,P.L., Zupancic,M.L. and Record,M.T. (1998) RNA
polymerase-promoter interactions: the comings and goings ofRNA polymerase. J. Bacteriol., 180, 3019–3025.
29. Greive,S.J. and Von Hippel,P.H. (2005) Thinking quantitativelyabout transcriptional regulation. Nat. Rev. Mol. Cell Biol., 6,221–232.
30. McClure,W.R. (1985) Mechanism and control of transcriptioninitiation in prokaryotes. Annu. Rev. Biochem., 54, 171–204.
31. Golding,I. and Cox,E.C. (2004) RNA dynamics in live Escherichiacoli cells. Proc. Natl Acad. Sci. USA, 101, 11310–11315.
32. Golding,I., Paulsson,J., Zawilski,S.M. and Cox,E.C. (2005) Real-time kinetics of gene activity in individual bacteria. Cell, 123,1025–1036.
33. Lutz,R. and Bujard,H. (1997) Independent and tight regulation oftranscriptional units in Escherichia coli via the LacR/O, the TetR/O and AraC/I1-I2 regulatory elements. Nucleic Acids Res., 25,1203–1210.
34. Chowdhury,S., Kandhavelu,M., Yli-Harja,O. and Ribeiro,A.S.(2012) An interacting multiple model filter-based autofocusstrategy for confocal time-lapse microscopy. J. Microscopy, 245,265–275.
35. Chen,T.B., Lu,H.H., Lee,Y.S. and Lan,H.J. (2008) Segmentationof cDNA microarray images by kernel density estimation.J. Biomed. Inform., 41, 1021–1027.
36. Otsu,N. (1979) A threshold selection method from gray-levelhistograms. IEEE Trans. Sys. Man Cybern., 9, 62–66.
37. Kandhavelu,M., Mannerstrom,H., Gupta,A., Hakkinen,A., Lloyd-Price,J., Yli-Harja,O. and Ribeiro,A.S. (2011) In vivo kinetics oftranscription initiation of the lar promoter in Escherichia coli.Evidence for a sequential mechanism with two rate-limiting steps.BMC Syst. Biol., 5, 149.
38. McClure,W.R. (1980) Rate-limiting steps in RNA chain initiation.Proc. Natl Acad. Sci. USA, 77, 5634–5638.
39. Skaletsky,H.J. (2000) Primer3 on the WWW for general users andfor biologist programmers. In: Krawetz,S. and Misener,S. (eds),Bioinformatics Methods and Protocols: Methods in MolecularBiology. Humana Press, Totowa, NJ, pp. 365–386.
40. Livak,K.J. and Schmittgen,T.D. (2001) Analysis of relative geneexpression data using real-time quantitative PCR and the 2(-DeltaDelta C(T)) method. Methods, 25, 402–408.
41. Daruwalla,K.R., Paxton,A.T. and Henderson,P.J.F. (1981)Energization of the transport systems for arabinose andcomparison with galactose transport in Escherichia coli. Biochem.J., 200, 611–627.
42. Gillespie,D.T. (1976) A general method for numerically simulatingthe stochastic time evolution of coupled chemical reactions.J. Comput. Phys., 22, 403–434.
43. Munsky,B. and Khammash,M. (2006) The finite state projectionalgorithm for the solution of the chemical master equation.J. Chem. Phys., 124, 044104.
6552 Nucleic Acids Research, 2013, Vol. 41, No. 13
at Tam
pere University of T
echnology Library on July 28, 2016
http://nar.oxfordjournals.org/D
ownloaded from
Supplementary Information
In vivo single-molecule kinetics of activation and subsequent activity of thearabinose promoter
Jarno Mäkelä1, Meenakshisundaram Kandhavelu1, Samuel M.D. Oliveira1, Jerome G. Chandraseelan1,Jason Lloyd-Price1, Juha Peltonen1, Olli Yli-Harja1,2 and Andre S. Ribeiro1,*
1 Laboratory of Biosystem Dynamics, Department of Signal Processing, Tampere University ofTechnology, P.O. Box 553, 33101 Tampere, Finland.2 Institute for Systems Biology, 1441N 34th St, Seattle, WA, 98103-8904, USA
* Corresponding author: [email protected] (Andre S. Ribeiro)
Supplementary Methods
Chemicals
Bacterial cell cultures were grown in two media, namely Luria-Bertani (LB) and M63. The chemicalcomponents of LB broth (Tryptone, Yeast extract and NaCl) were purchased from LabM (UK). ForM63 media, the following components were used: 2 mM MgSO4.7H20 (Sigma-Aldrich, USA), 7.6 mM(NH4)2SO4 (Sigma Life Science, USA), 30µM FeSO4.7H2O (Sigma Life Science, USA), 1 mM EDTA(Sigma Life Science, USA), 60 mM KH2PO4 (Sigma Life Science, USA), Glycerol 0.5 % (Sigma LifeScience, USA), and Casaminoacids 0.1 % (Fluka Analytical, USA). Isopropyl -D-1-thiogalactopyranoside (IPTG), L-(+)-Arabinose and anhydrotetracycline (aTc) used for induction of thecells and the antibiotics (100 mg/ml kanamycin and 35 mg/ml chloramphenicol) were purchased fromSigma-Aldrich (USA). Agarose (Sigma Life Science, USA) was used for the microscopic slide gelpreparation.
Bacterial Strain
Cloning and expression experiments were performed in E. coli DH5 -PRO strain (Clontech; identicalto DH5 -Z1 (31). The strain information is: deoR, endA1, gyrA96, hsdR17(rk-mk+), recA1, relA1,supE44, thi-1, (lacZYA-argF)U169, 80 lacZ M15, F-, -, PN25/tetR, PlacIq/lacI, and SpR. Frag1A:F-, rha-, thi, gal, lacZam, acrAB::kanR, PN25/tetR, PlacIq/lacI, and SpR. Frag1B: F-, rha-, thi, gal, lacZam,PN25/tetR, Placiq/lacI, and SpR. The PN25/tetR, Placiq/lacI, SpR cassette was transferred from DH5 PRO toFrag1 to generate Frag1B by P1 transduction. The acrAB:kanR cassette was transferred fromKZM120 to Frag1B, so as to generate Frag1A.

Construction of the pMK-BAC vector
To construct the pMK-BAC (PBAD-mRFP1-96 binding site (96 BS) array, the following plasmids wereused: a plasmid with mRFP1 plus 96bs array region in the BAC vector, originally designed andgenerously provided by Prof. Ido Golding (Plac/ara-1- mRFP1-96 bs) (32). To amplify the constructcontaining the AraC and pBAD promoter region from the pGLO vector (Biorad), a primer set wasdesigned as follows:
Ara_AatII-Fw-5´CCTAAGACGTCATCGATGCATAATGTGCC 3´Ara_AatII-Rv-5´CCTTGATGACGTCATGTATATCTCCTTCTTAAAGTTA3´
The target BAD promoter region along with AraC coding region from the pGLO vector was amplifiedand inserted into the pIG-BAC vector by standard molecular biology techniques. The construct wasverified by sequencing with the appropriate primers and transformed into the E. coli DH5 -PRO straincarrying the bacterial expression vector pPROTET.E (Clontech) coding for MS2d–GFP. For moredetails see Supplementary Figures 1 and 2.
Plate reader experiment
The mean uorescence of RFP under the control of PBAD was measured with a microplate fluorometer(Fluoroskan Ascent, Thermo Scienti c). 200 ml of cells at OD600 0.5 were induced with 0.1 % or 1% L-arabinose and placed on 96 well microplate. From this, cells were measured for 2 hours forrelative uorescence levels of mRFP1 protein (excitation and emission wavelengths were 584 nm and607 nm, respectively). The cell density was kept identical in all wells of the plate for all conditions.
Quantitative PCR for mean mRNA quantification
The change in the rate of transcription of genes araB and mRFP was studied using qPCR. E. coliDH5 -PRO cells containing the constructs were grown as described in the section describing themicroscopy measurements. Cells were grown overnight at 30°C with aeration, diluted into freshmedium and allowed to grow at the appropriate temperature of the experiment until an optical densityof OD600 0.3-0.5 was reached. For the experiment, 5 ml of cells were pre-incubated with 100 ng/mlof aTc to induce the expression of MS2d-GFP. 1 % L-arabinose was used for induction of the BADpromoter, 30 minutes after induction, the first sample was taken. From then onwards, samples weretaken at an interval of 60 minutes. Rifampicin was added to the samples immediately, so as to preventfurther transcription and the cells were fixed with RNA protect reagent immediately followed byenzymatic lysis using Tris-EDTA lysozyme buffer (pH 8.3). RNA was purified from each sample byRNeasy mini-kit (Qiagen). The total RNA was separated by electrophoresis through a 1 % agarose geland stained with SYBR Safe DNA Gel Stain. The RNA was found intact with discreet bands for 16 Sand 23 S ribosomal RNAs. To ensure purity of the RNA samples, they were subject to treatment withDNase free of RNase, to remove residual DNA. The yield of RNA obtained was 0.4 – 0.6 mg/ml.Approximately 40 ng of RNA was used for cDNA synthesis using iSCRIPT reverse transcription supermix (Biorad) according to the manufacturer’s instructions.
Quantification of cDNA was performed by real-time PCR using SYBR-green supermix with primersfor the amplification of target and reference genes at a concentration of 200nM. Primers specific toAraB (Forward: 5' GGTACTTCCACCTGCGACAT 3', Reverse: 5' CAACCTGACCGCAAATACCT3') and mRFP genes (Forward: 5' TACGAC GCCGAGGTCAAG 3' and Reverse: 5'TTGTGGGAGGTGATGTCCA 3') were designed using PRIMER3 (39), the length of the ampliconfor the target and reference were maintained at 90bp. The sequence of the primers for the referencegene 16S rRNA (EcoCyc Accession Number: EG30090) (Forward: 5' CGTCAGCTCGTGTTGTGAA3' and Reverse: 5' GGACCGCTGGCAACAAAG 3') and the primers were obtained from ThermoScientific. The level of 16s rRNA was used to normalize the expression data of each target gene. 10 ngof cDNA was used as a template. The cycling protocol used was 94 °C for 15 s, 51 °C for 30 s, and 72°C for 30 s, up to 39 cycles. The amplification was monitored in real time by measuring thefluorescence intensities at the end of each cycle. The experiment was performed in triplicates alongwith the No-RT and no template controls. The volume used for each reaction was 25 µl in low-profiletube strips in a MiniOpticon Real time PCR system (Biorad). The Cq values were obtained from theCFX ManagerTM Software and the fold change of expression of the target gene was analysed bynormalizing against the reference gene according to the Livak method (40). See Supplementary Figure3 for the results.
Normalization between samples of the distributions of time intervals
The observation time for the production of RNAs is two hours. In some cells, the intervals betweentranscription events ( t) are of this order of magnitude. This causes shorter intervals to be ‘favored’.This is more likely to occur in cells where the waiting time for the first RNA to be produced (t0) islonger, since the remaining observation time is shorter. This introduces an artificial anti-correlationbetween t0 and t in individual cells. Similar correlations are introduced by different division times aswell, i.e., shorter division times hamper the collection of longer t samples.
Thus, prior to determine if any real correlation exists between t0 and t in individual cells, it isnecessary to remove these artificial sources of anti-correlation due to the limits in the measurementperiod. For this, in all cells, all intervals between consecutive RNAs were collected only for a timewindow of size tc after the previous production. The value of tc is identical in all cells. This causes theprobability of appearance of the next RNA molecule during that period to be uniform for all cells, ifthe underlying process is in fact identical in all cells.
This restriction in the collection of values of t is made when assessing correlations between t0 and tand when comparing these two distributions between conditions. When imposing the restriction, wethus consider only cells that produce at least 2 RNA molecules during their life time and measurementperiod. The value of tc was selected so as to maximize the number of data points collectable from thedata sets. Here, tc was set to 39 minutes (see Supplementary Figure S6).

Fitting the empirical distributions to a sum of d-exponential variates
The arabinose intake mechanism can be described by a single Michaelis-Menten function (41). Sincethe backward reaction of the intake process is slower than the forward reaction (12), the intake processis modeled, roughly, by a sequence of non-reversible reactions. Interestingly, we found from themeasurements and the inference procedure, evidence of two steps at this stage (exponential induration), which is in agreement with the number of forward steps assumed in other studies for thisprocess (12). Finally, transcription initiation, which follows the intake process, can also be modeled bya 3-step exponential model according recent in vivo measurements (9, 10). Thus, we fit the measureddistributions of t0 to a 5-step exponential model.
To fit the empirical distribution with a sum of d-exponential variates (of possibly unequal rates), weselect the exponential rate parameters , … , such that the Kolmogorov-Smirnov (K-S) statistic isminimized. That is, parameters are selected as = arg max ,…, sup |F (x) G(x)|, where F (x)is the cumulative distribution function (CDF) of a sum of d exponentials with parameters =
, … , ), and G(x) is the CDF of the empirical distribution.
F ,…, (X) = ((1 e )L
L L
The parameter values are found using a nonlinear numerical optimizer. This method is convenient,since if the K-S test was rejected for the parameters , such a test would also be rejected for any otherset of parameters in this family of fitted distributions, indicating that these distributions areinappropriate models of the data. The results of the fitting are shown in Table S1.
As a final note, the model assumed above can be considered as the simplest possible, i.e., each step is
an elementary reaction of the formcA B , with a constant probability of occurring per unit time.
This entails that the distributions of intervals between steps are exponential (42). Notably, the inferreddistributions and the experimental data are statistically indistinguishable by the K-S test, which impliesthat there is no evidence to assume that the model is wrong (see Table S1).
CME solution
To estimate the effect of the intake on the cell-to-cell diversity in RNA numbers we made use of directintegration of the Chemical Master Equation (CME) of the model described in the previous section,using the Finite State Projection algorithm (43). This method truncates the infinite state space of theCME such that the amount of probability outside the truncated region is negligible. In all cases, wetruncated the state space at 20 RNA molecules. This number sufficed for this space to contain virtuallyall of the total probability in the system. The probability mass vector at each time moment is thensolved by numerically integrating the truncated CME. From this distribution over time, we calculatemean, variance, and Fano factor of RNA molecules of a model at each moment.
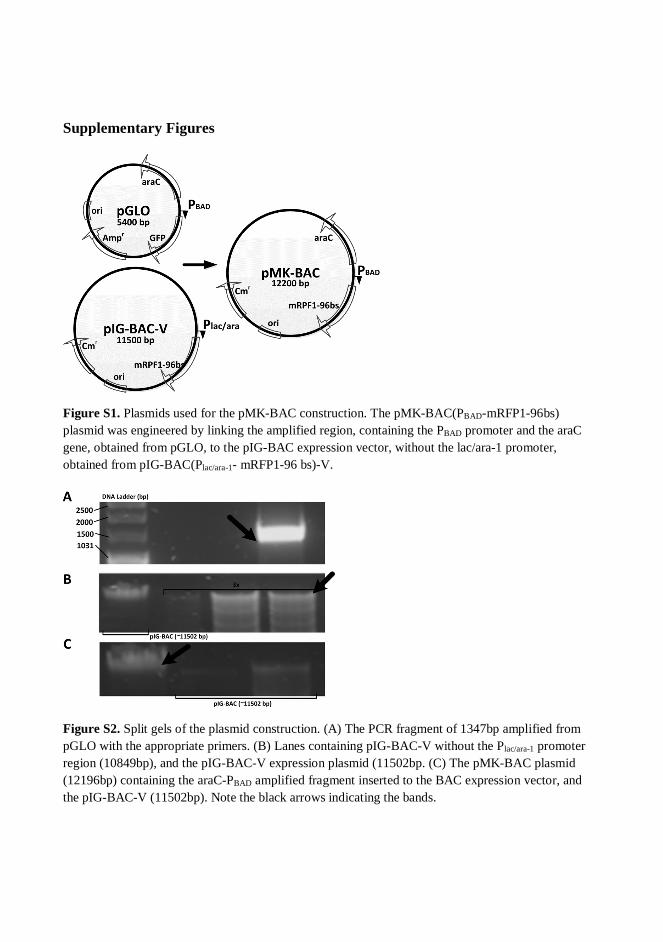
Supplementary Figures
Figure S1. Plasmids used for the pMK-BAC construction. The pMK-BAC(PBAD-mRFP1-96bs)plasmid was engineered by linking the amplified region, containing the PBAD promoter and the araCgene, obtained from pGLO, to the pIG-BAC expression vector, without the lac/ara-1 promoter,obtained from pIG-BAC(Plac/ara-1- mRFP1-96 bs)-V.
Figure S2. Split gels of the plasmid construction. (A) The PCR fragment of 1347bp amplified frompGLO with the appropriate primers. (B) Lanes containing pIG-BAC-V without the Plac/ara-1 promoterregion (10849bp), and the pIG-BAC-V expression plasmid (11502bp. (C) The pMK-BAC plasmid(12196bp) containing the araC-PBAD amplified fragment inserted to the BAC expression vector, andthe pIG-BAC-V (11502bp). Note the black arrows indicating the bands.
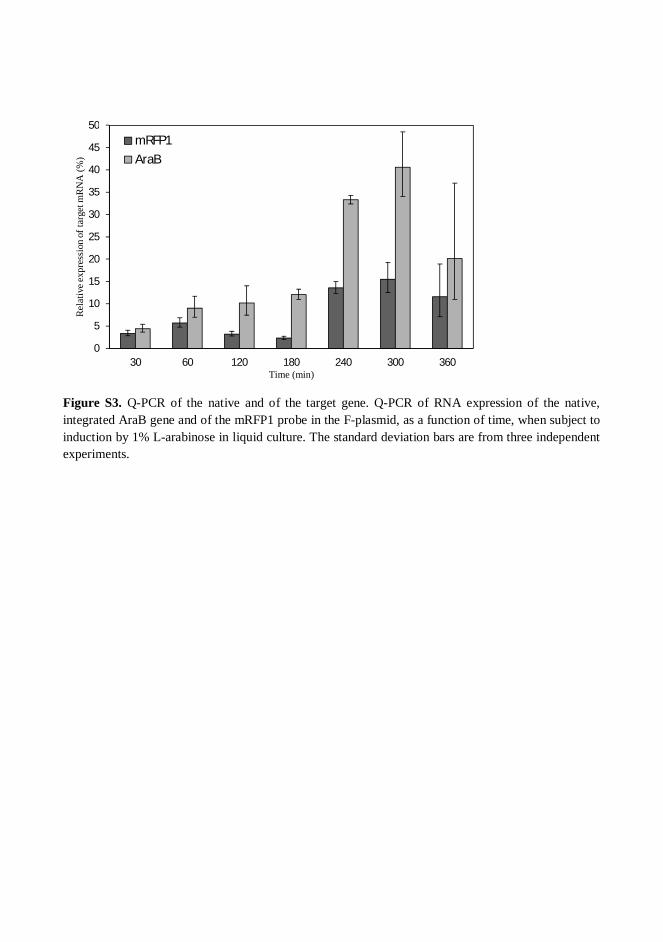
Figure S3. Q-PCR of the native and of the target gene. Q-PCR of RNA expression of the native,integrated AraB gene and of the mRFP1 probe in the F-plasmid, as a function of time, when subject toinduction by 1% L-arabinose in liquid culture. The standard deviation bars are from three independentexperiments.
0
5
10
15
20
25
30
35
40
45
50
30 60 120 180 240 300 360
Rel
ativ
eexp
ress
ion
ofta
rget
mR
NA
(%)
Time (min)
mRFP1AraB
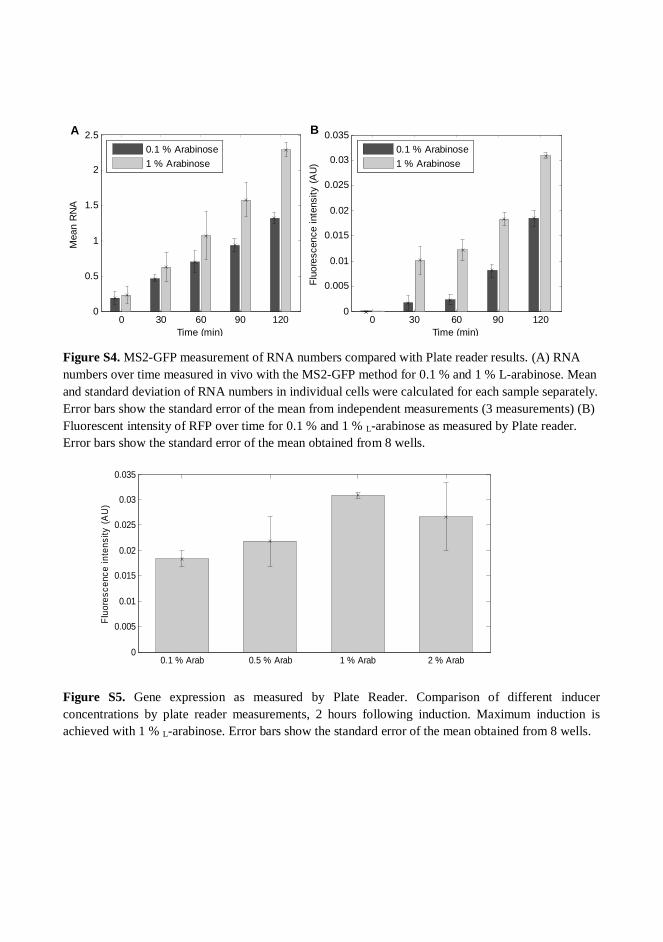
Figure S4. MS2-GFP measurement of RNA numbers compared with Plate reader results. (A) RNAnumbers over time measured in vivo with the MS2-GFP method for 0.1 % and 1 % L-arabinose. Meanand standard deviation of RNA numbers in individual cells were calculated for each sample separately.Error bars show the standard error of the mean from independent measurements (3 measurements) (B)Fluorescent intensity of RFP over time for 0.1 % and 1 % L-arabinose as measured by Plate reader.Error bars show the standard error of the mean obtained from 8 wells.
Figure S5. Gene expression as measured by Plate Reader. Comparison of different inducerconcentrations by plate reader measurements, 2 hours following induction. Maximum induction isachieved with 1 % L-arabinose. Error bars show the standard error of the mean obtained from 8 wells.
0 30 60 90 1200
0.5
1
1.5
2
2.5
Time (min)
Mea
nR
NA
0.1 % Arabinose1 % Arabinose
0 30 60 90 1200
0.005
0.01
0.015
0.02
0.025
0.03
0.035
Time (min)
Fluo
resc
ence
inte
nsity
(AU
)
0.1 % Arabinose1 % Arabinose
BA
0.1 % Arab 0.5 % Arab 1 % Arab 2 % Arab0
0.005
0.01
0.015
0.02
0.025
0.03
0.035
Fluo
resc
ence
inte
nsity
(AU
)
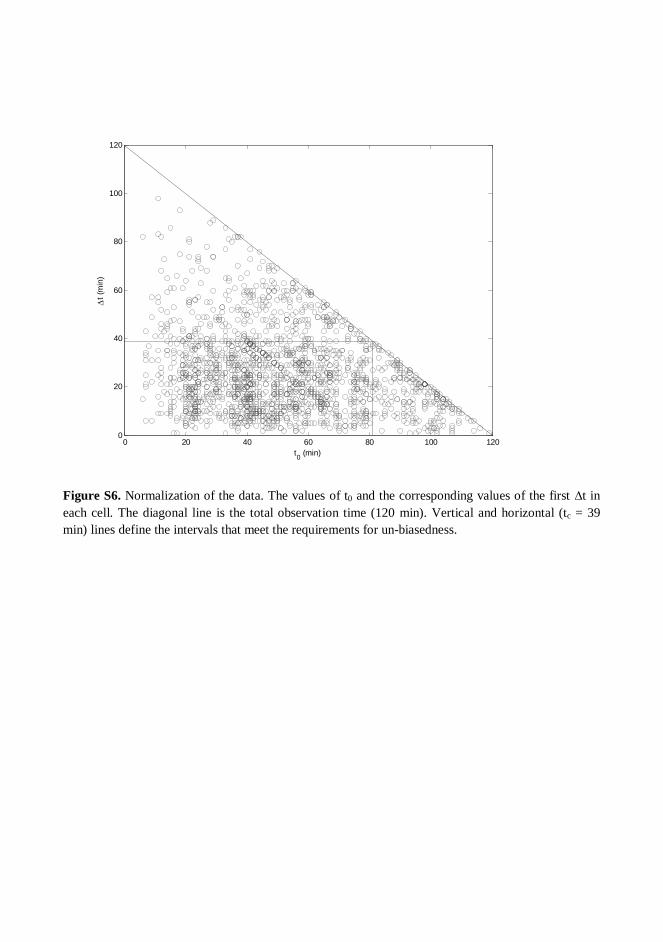
Figure S6. Normalization of the data. The values of t0 and the corresponding values of the first t ineach cell. The diagonal line is the total observation time (120 min). Vertical and horizontal (tc = 39min) lines define the intervals that meet the requirements for un-biasedness.
0 20 40 60 80 100 1200
20
40
60
80
100
120
t0 (min)
t(m
in)
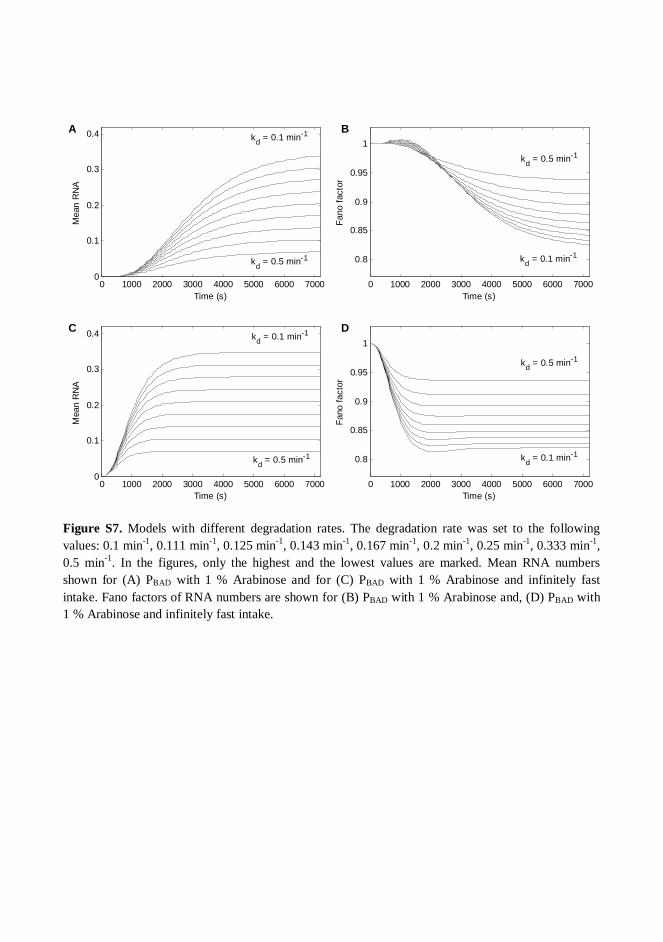
Figure S7. Models with different degradation rates. The degradation rate was set to the followingvalues: 0.1 min-1, 0.111 min-1, 0.125 min-1, 0.143 min-1, 0.167 min-1, 0.2 min-1, 0.25 min-1, 0.333 min-1,0.5 min-1. In the figures, only the highest and the lowest values are marked. Mean RNA numbersshown for (A) PBAD with 1 % Arabinose and for (C) PBAD with 1 % Arabinose and infinitely fastintake. Fano factors of RNA numbers are shown for (B) PBAD with 1 % Arabinose and, (D) PBAD with1 % Arabinose and infinitely fast intake.
0 1000 2000 3000 4000 5000 6000 7000
0.8
0.85
0.9
0.95
1
Time (s)
Fano
fact
or
0 1000 2000 3000 4000 5000 6000 70000
0.1
0.2
0.3
0.4
Time (s)
Mea
nR
NA
0 1000 2000 3000 4000 5000 6000 70000
0.1
0.2
0.3
0.4
Time (s)
Mea
nR
NA
0 1000 2000 3000 4000 5000 6000 7000
0.8
0.85
0.9
0.95
1
Time (s)
Fano
fact
or
kd = 0.1 min-1
kd = 0.1 min-1
kd = 0.1 min-1
kd = 0.1 min-1kd = 0.5 min-1
kd = 0.5 min-1
kd = 0.5 min-1
kd = 0.5 min-1
A
C
B
D
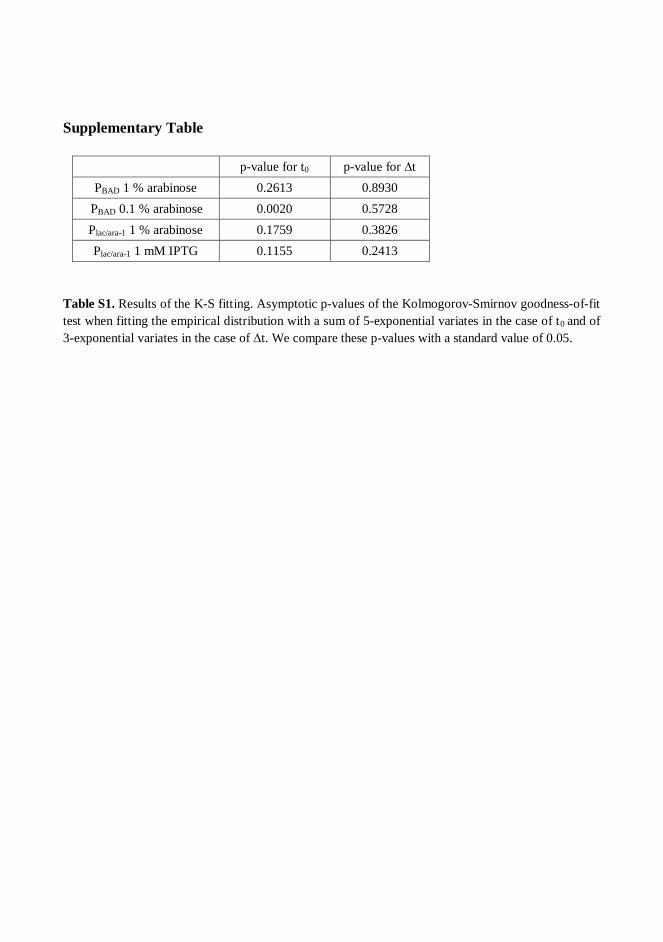
Supplementary Table
p-value for t0 p-value for tPBAD 1 % arabinose 0.2613 0.8930
PBAD 0.1 % arabinose 0.0020 0.5728Plac/ara-1 1 % arabinose 0.1759 0.3826Plac/ara-1 1 mM IPTG 0.1155 0.2413
Table S1. Results of the K-S fitting. Asymptotic p-values of the Kolmogorov-Smirnov goodness-of-fittest when fitting the empirical distribution with a sum of 5-exponential variates in the case of t0 and of3-exponential variates in the case of t. We compare these p-values with a standard value of 0.05.

Publication III
L. Martins*, J. Mäkelä*, A. Häkkinen, M. Kandhavelu, O. Yli Harja, J.M. Fonsecaand A.S. Ribeiro, “Dynamics of transcription of closely spaced promoters inEscherichia coli, one event at a time”, Journal of Theoretical Biology, 301:83–94,2012. (*equal contribution)

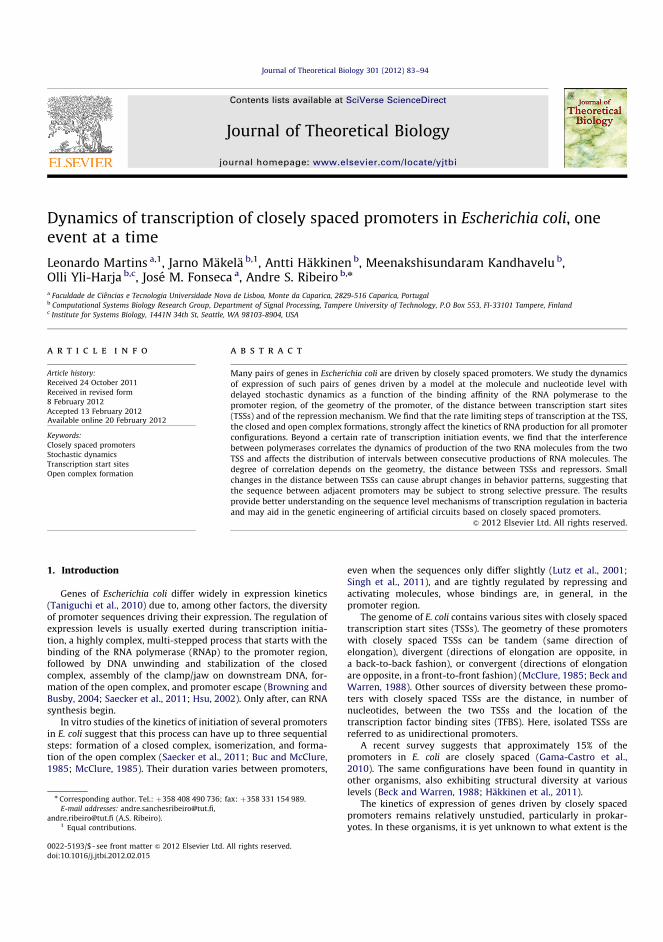
Dynamics of transcription of closely spaced promoters in Escherichia coli, oneevent at a time
Leonardo Martins a,1, Jarno Makela b,1, Antti Hakkinen b, Meenakshisundaram Kandhavelu b,Olli Yli-Harja b,c, Jose M. Fonseca a, Andre S. Ribeiro b,n
a Faculdade de Ciencias e Tecnologia Universidade Nova de Lisboa, Monte da Caparica, 2829-516 Caparica, Portugalb Computational Systems Biology Research Group, Department of Signal Processing, Tampere University of Technology, P.O Box 553, FI-33101 Tampere, Finlandc Institute for Systems Biology, 1441N 34th St, Seattle, WA 98103-8904, USA
a r t i c l e i n f o
Article history:
Received 24 October 2011
Received in revised form
8 February 2012
Accepted 13 February 2012Available online 20 February 2012
Keywords:
Closely spaced promoters
Stochastic dynamics
Transcription start sites
Open complex formation
a b s t r a c t
Many pairs of genes in Escherichia coli are driven by closely spaced promoters. We study the dynamics
of expression of such pairs of genes driven by a model at the molecule and nucleotide level with
delayed stochastic dynamics as a function of the binding affinity of the RNA polymerase to the
promoter region, of the geometry of the promoter, of the distance between transcription start sites
(TSSs) and of the repression mechanism. We find that the rate limiting steps of transcription at the TSS,
the closed and open complex formations, strongly affect the kinetics of RNA production for all promoter
configurations. Beyond a certain rate of transcription initiation events, we find that the interference
between polymerases correlates the dynamics of production of the two RNA molecules from the two
TSS and affects the distribution of intervals between consecutive productions of RNA molecules. The
degree of correlation depends on the geometry, the distance between TSSs and repressors. Small
changes in the distance between TSSs can cause abrupt changes in behavior patterns, suggesting that
the sequence between adjacent promoters may be subject to strong selective pressure. The results
provide better understanding on the sequence level mechanisms of transcription regulation in bacteria
and may aid in the genetic engineering of artificial circuits based on closely spaced promoters.
& 2012 Elsevier Ltd. All rights reserved.
1. Introduction
Genes of Escherichia coli differ widely in expression kinetics(Taniguchi et al., 2010) due to, among other factors, the diversityof promoter sequences driving their expression. The regulation ofexpression levels is usually exerted during transcription initia-tion, a highly complex, multi-stepped process that starts with thebinding of the RNA polymerase (RNAp) to the promoter region,followed by DNA unwinding and stabilization of the closedcomplex, assembly of the clamp/jaw on downstream DNA, for-mation of the open complex, and promoter escape (Browning andBusby, 2004; Saecker et al., 2011; Hsu, 2002). Only after, can RNAsynthesis begin.
In vitro studies of the kinetics of initiation of several promotersin E. coli suggest that this process can have up to three sequentialsteps: formation of a closed complex, isomerization, and forma-tion of the open complex (Saecker et al., 2011; Buc and McClure,1985; McClure, 1985). Their duration varies between promoters,
even when the sequences only differ slightly (Lutz et al., 2001;Singh et al., 2011), and are tightly regulated by repressing andactivating molecules, whose bindings are, in general, in thepromoter region.
The genome of E. coli contains various sites with closely spacedtranscription start sites (TSSs). The geometry of these promoterswith closely spaced TSSs can be tandem (same direction ofelongation), divergent (directions of elongation are opposite, ina back-to-back fashion), or convergent (directions of elongationare opposite, in a front-to-front fashion) (McClure, 1985; Beck andWarren, 1988). Other sources of diversity between these promo-ters with closely spaced TSSs are the distance, in number ofnucleotides, between the two TSSs and the location of thetranscription factor binding sites (TFBS). Here, isolated TSSs arereferred to as unidirectional promoters.
A recent survey suggests that approximately 15% of thepromoters in E. coli are closely spaced (Gama-Castro et al.,2010). The same configurations have been found in quantity inother organisms, also exhibiting structural diversity at variouslevels (Beck and Warren, 1988; Hakkinen et al., 2011).
The kinetics of expression of genes driven by closely spacedpromoters remains relatively unstudied, particularly in prokar-yotes. In these organisms, it is yet unknown to what extent is the
Contents lists available at SciVerse ScienceDirect
journal homepage: www.elsevier.com/locate/yjtbi
Journal of Theoretical Biology
0022-5193/$ - see front matter & 2012 Elsevier Ltd. All rights reserved.
doi:10.1016/j.jtbi.2012.02.015
n Corresponding author. Tel.: þ358 408 490 736; fax: þ358 331 154 989.
E-mail addresses: [email protected],
[email protected] (A.S. Ribeiro).1 Equal contributions.
Journal of Theoretical Biology 301 (2012) 83–94
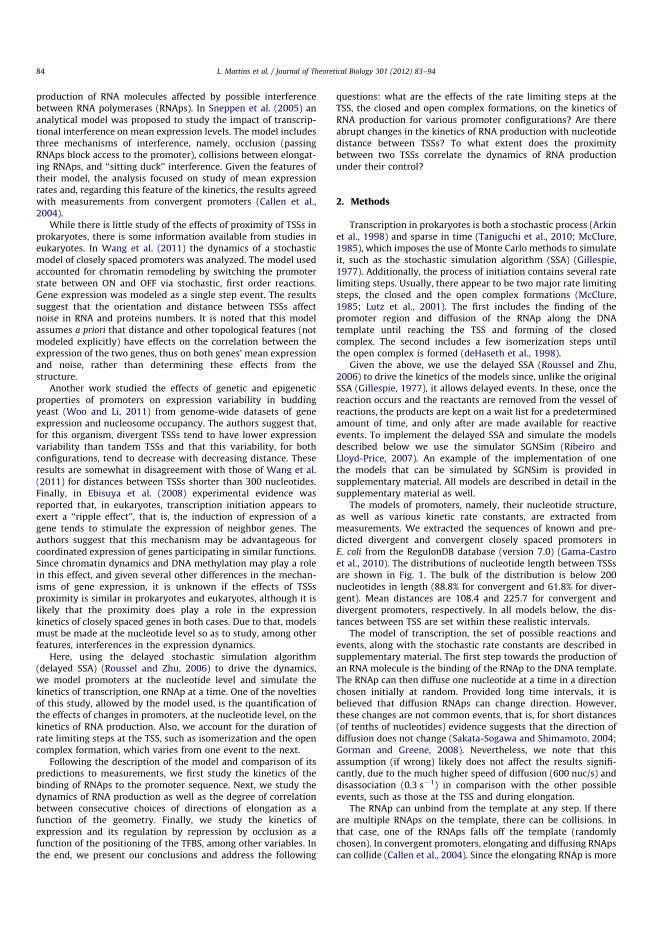
production of RNA molecules affected by possible interferencebetween RNA polymerases (RNAps). In Sneppen et al. (2005) ananalytical model was proposed to study the impact of transcrip-tional interference on mean expression levels. The model includesthree mechanisms of interference, namely, occlusion (passingRNAps block access to the promoter), collisions between elongat-ing RNAps, and ‘‘sitting duck’’ interference. Given the features oftheir model, the analysis focused on study of mean expressionrates and, regarding this feature of the kinetics, the results agreedwith measurements from convergent promoters (Callen et al.,2004).
While there is little study of the effects of proximity of TSSs inprokaryotes, there is some information available from studies ineukaryotes. In Wang et al. (2011) the dynamics of a stochasticmodel of closely spaced promoters was analyzed. The model usedaccounted for chromatin remodeling by switching the promoterstate between ON and OFF via stochastic, first order reactions.Gene expression was modeled as a single step event. The resultssuggest that the orientation and distance between TSSs affectnoise in RNA and proteins numbers. It is noted that this modelassumes a priori that distance and other topological features (notmodeled explicitly) have effects on the correlation between theexpression of the two genes, thus on both genes’ mean expressionand noise, rather than determining these effects from thestructure.
Another work studied the effects of genetic and epigeneticproperties of promoters on expression variability in buddingyeast (Woo and Li, 2011) from genome-wide datasets of geneexpression and nucleosome occupancy. The authors suggest that,for this organism, divergent TSSs tend to have lower expressionvariability than tandem TSSs and that this variability, for bothconfigurations, tend to decrease with decreasing distance. Theseresults are somewhat in disagreement with those of Wang et al.(2011) for distances between TSSs shorter than 300 nucleotides.Finally, in Ebisuya et al. (2008) experimental evidence wasreported that, in eukaryotes, transcription initiation appears toexert a ‘‘ripple effect’’, that is, the induction of expression of agene tends to stimulate the expression of neighbor genes. Theauthors suggest that this mechanism may be advantageous forcoordinated expression of genes participating in similar functions.Since chromatin dynamics and DNA methylation may play a rolein this effect, and given several other differences in the mechan-isms of gene expression, it is unknown if the effects of TSSsproximity is similar in prokaryotes and eukaryotes, although it islikely that the proximity does play a role in the expressionkinetics of closely spaced genes in both cases. Due to that, modelsmust be made at the nucleotide level so as to study, among otherfeatures, interferences in the expression dynamics.
Here, using the delayed stochastic simulation algorithm(delayed SSA) (Roussel and Zhu, 2006) to drive the dynamics,we model promoters at the nucleotide level and simulate thekinetics of transcription, one RNAp at a time. One of the noveltiesof this study, allowed by the model used, is the quantification ofthe effects of changes in promoters, at the nucleotide level, on thekinetics of RNA production. Also, we account for the duration ofrate limiting steps at the TSS, such as isomerization and the opencomplex formation, which varies from one event to the next.
Following the description of the model and comparison of itspredictions to measurements, we first study the kinetics of thebinding of RNAps to the promoter sequence. Next, we study thedynamics of RNA production as well as the degree of correlationbetween consecutive choices of directions of elongation as afunction of the geometry. Finally, we study the kinetics ofexpression and its regulation by repression by occlusion as afunction of the positioning of the TFBS, among other variables. Inthe end, we present our conclusions and address the following
questions: what are the effects of the rate limiting steps at theTSS, the closed and open complex formations, on the kinetics ofRNA production for various promoter configurations? Are thereabrupt changes in the kinetics of RNA production with nucleotidedistance between TSSs? To what extent does the proximitybetween two TSSs correlate the dynamics of RNA productionunder their control?
2. Methods
Transcription in prokaryotes is both a stochastic process (Arkinet al., 1998) and sparse in time (Taniguchi et al., 2010; McClure,1985), which imposes the use of Monte Carlo methods to simulateit, such as the stochastic simulation algorithm (SSA) (Gillespie,1977). Additionally, the process of initiation contains several ratelimiting steps. Usually, there appear to be two major rate limitingsteps, the closed and the open complex formations (McClure,1985; Lutz et al., 2001). The first includes the finding of thepromoter region and diffusion of the RNAp along the DNAtemplate until reaching the TSS and forming of the closedcomplex. The second includes a few isomerization steps untilthe open complex is formed (deHaseth et al., 1998).
Given the above, we use the delayed SSA (Roussel and Zhu,2006) to drive the kinetics of the models since, unlike the originalSSA (Gillespie, 1977), it allows delayed events. In these, once thereaction occurs and the reactants are removed from the vessel ofreactions, the products are kept on a wait list for a predeterminedamount of time, and only after are made available for reactiveevents. To implement the delayed SSA and simulate the modelsdescribed below we use the simulator SGNSim (Ribeiro andLloyd-Price, 2007). An example of the implementation of onethe models that can be simulated by SGNSim is provided insupplementary material. All models are described in detail in thesupplementary material as well.
The models of promoters, namely, their nucleotide structure,as well as various kinetic rate constants, are extracted frommeasurements. We extracted the sequences of known and pre-dicted divergent and convergent closely spaced promoters inE. coli from the RegulonDB database (version 7.0) (Gama-Castroet al., 2010). The distributions of nucleotide length between TSSsare shown in Fig. 1. The bulk of the distribution is below 200nucleotides in length (88.8% for convergent and 61.8% for diver-gent). Mean distances are 108.4 and 225.7 for convergent anddivergent promoters, respectively. In all models below, the dis-tances between TSS are set within these realistic intervals.
The model of transcription, the set of possible reactions andevents, along with the stochastic rate constants are described insupplementary material. The first step towards the production ofan RNA molecule is the binding of the RNAp to the DNA template.The RNAp can then diffuse one nucleotide at a time in a directionchosen initially at random. Provided long time intervals, it isbelieved that diffusion RNAps can change direction. However,these changes are not common events, that is, for short distances(of tenths of nucleotides) evidence suggests that the direction ofdiffusion does not change (Sakata-Sogawa and Shimamoto, 2004;Gorman and Greene, 2008). Nevertheless, we note that thisassumption (if wrong) likely does not affect the results signifi-cantly, due to the much higher speed of diffusion (600 nuc/s) anddisassociation (0.3 s1) in comparison with the other possibleevents, such as those at the TSS and during elongation.
The RNAp can unbind from the template at any step. If thereare multiple RNAps on the template, there can be collisions. Inthat case, one of the RNAps falls off the template (randomlychosen). In convergent promoters, elongating and diffusing RNApscan collide (Callen et al., 2004). Since the elongating RNAp is more
L. Martins et al. / Journal of Theoretical Biology 301 (2012) 83–9484
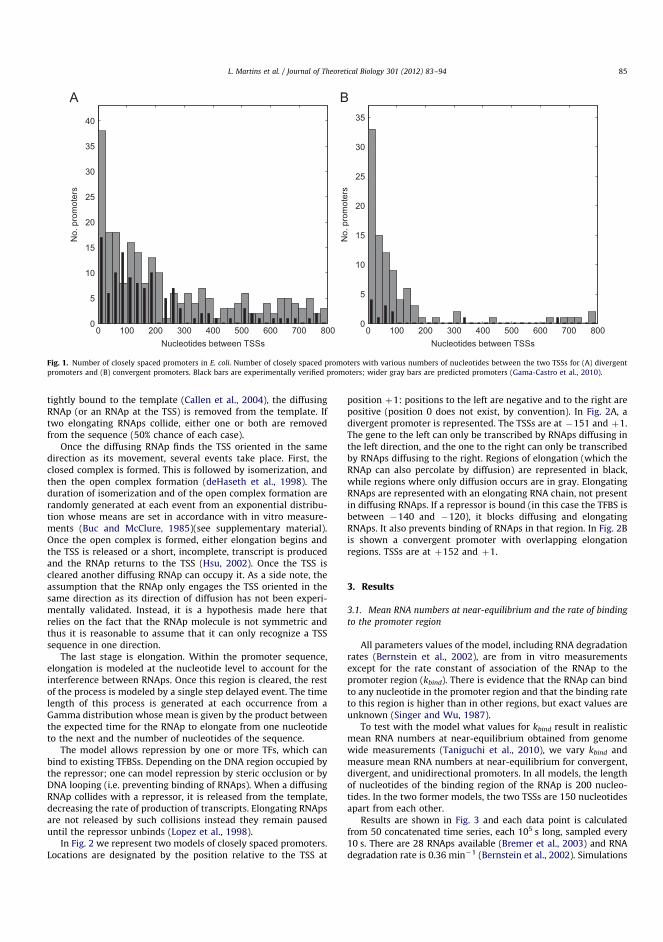
tightly bound to the template (Callen et al., 2004), the diffusingRNAp (or an RNAp at the TSS) is removed from the template. Iftwo elongating RNAps collide, either one or both are removedfrom the sequence (50% chance of each case).
Once the diffusing RNAp finds the TSS oriented in the samedirection as its movement, several events take place. First, theclosed complex is formed. This is followed by isomerization, andthen the open complex formation (deHaseth et al., 1998). Theduration of isomerization and of the open complex formation arerandomly generated at each event from an exponential distribu-tion whose means are set in accordance with in vitro measure-ments (Buc and McClure, 1985)(see supplementary material).Once the open complex is formed, either elongation begins andthe TSS is released or a short, incomplete, transcript is producedand the RNAp returns to the TSS (Hsu, 2002). Once the TSS iscleared another diffusing RNAp can occupy it. As a side note, theassumption that the RNAp only engages the TSS oriented in thesame direction as its direction of diffusion has not been experi-mentally validated. Instead, it is a hypothesis made here thatrelies on the fact that the RNAp molecule is not symmetric andthus it is reasonable to assume that it can only recognize a TSSsequence in one direction.
The last stage is elongation. Within the promoter sequence,elongation is modeled at the nucleotide level to account for theinterference between RNAps. Once this region is cleared, the restof the process is modeled by a single step delayed event. The timelength of this process is generated at each occurrence from aGamma distribution whose mean is given by the product betweenthe expected time for the RNAp to elongate from one nucleotideto the next and the number of nucleotides of the sequence.
The model allows repression by one or more TFs, which canbind to existing TFBSs. Depending on the DNA region occupied bythe repressor; one can model repression by steric occlusion or byDNA looping (i.e. preventing binding of RNAps). When a diffusingRNAp collides with a repressor, it is released from the template,decreasing the rate of production of transcripts. Elongating RNApsare not released by such collisions instead they remain pauseduntil the repressor unbinds (Lopez et al., 1998).
In Fig. 2 we represent two models of closely spaced promoters.Locations are designated by the position relative to the TSS at
position þ1: positions to the left are negative and to the right arepositive (position 0 does not exist, by convention). In Fig. 2A, adivergent promoter is represented. The TSSs are at 151 and þ1.The gene to the left can only be transcribed by RNAps diffusing inthe left direction, and the one to the right can only be transcribedby RNAps diffusing to the right. Regions of elongation (which theRNAp can also percolate by diffusion) are represented in black,while regions where only diffusion occurs are in gray. ElongatingRNAps are represented with an elongating RNA chain, not presentin diffusing RNAps. If a repressor is bound (in this case the TFBS isbetween 140 and 120), it blocks diffusing and elongatingRNAps. It also prevents binding of RNAps in that region. In Fig. 2Bis shown a convergent promoter with overlapping elongationregions. TSSs are at þ152 and þ1.
3. Results
3.1. Mean RNA numbers at near-equilibrium and the rate of binding
to the promoter region
All parameters values of the model, including RNA degradationrates (Bernstein et al., 2002), are from in vitro measurementsexcept for the rate constant of association of the RNAp to thepromoter region (kbind). There is evidence that the RNAp can bindto any nucleotide in the promoter region and that the binding rateto this region is higher than in other regions, but exact values areunknown (Singer and Wu, 1987).
To test with the model what values for kbind result in realisticmean RNA numbers at near-equilibrium obtained from genomewide measurements (Taniguchi et al., 2010), we vary kbind andmeasure mean RNA numbers at near-equilibrium for convergent,divergent, and unidirectional promoters. In all models, the lengthof nucleotides of the binding region of the RNAp is 200 nucleo-tides. In the two former models, the two TSSs are 150 nucleotidesapart from each other.
Results are shown in Fig. 3 and each data point is calculatedfrom 50 concatenated time series, each 105 s long, sampled every10 s. There are 28 RNAps available (Bremer et al., 2003) and RNAdegradation rate is 0.36 min1 (Bernstein et al., 2002). Simulations
0 100 200 300 400 500 600 700 8000
5
10
15
20
25
30
35
40
Nucleotides between TSSs
No.
pro
mot
ers
0 100 200 300 400 500 600 700 8000
5
10
15
20
25
30
35
Nucleotides between TSSsN
o. p
rom
oter
s
Fig. 1. Number of closely spaced promoters in E. coli. Number of closely spaced promoters with various numbers of nucleotides between the two TSSs for (A) divergent
promoters and (B) convergent promoters. Black bars are experimentally verified promoters; wider gray bars are predicted promoters (Gama-Castro et al., 2010).
L. Martins et al. / Journal of Theoretical Biology 301 (2012) 83–94 85
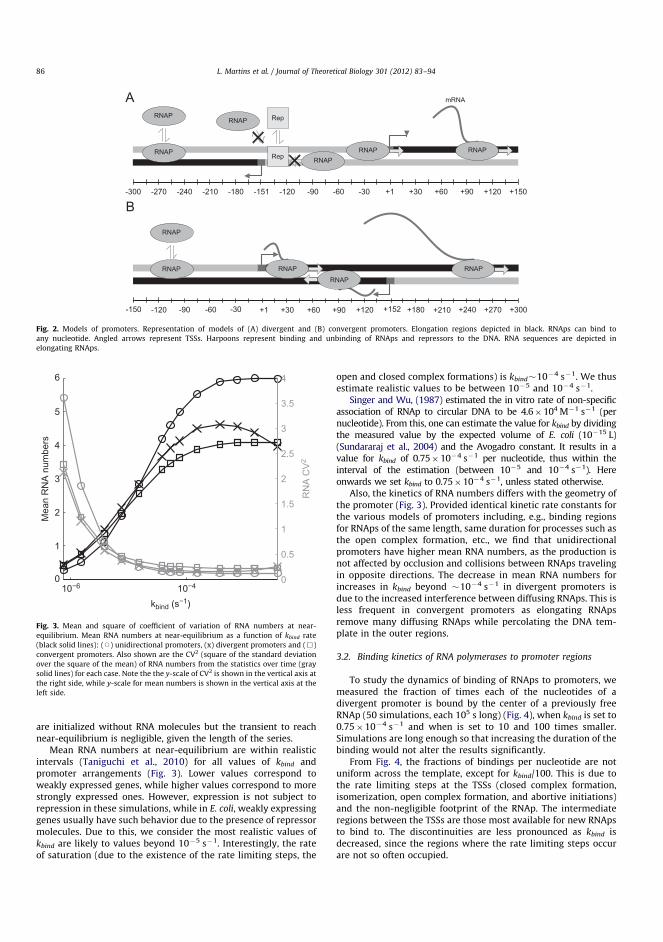
are initialized without RNA molecules but the transient to reachnear-equilibrium is negligible, given the length of the series.
Mean RNA numbers at near-equilibrium are within realisticintervals (Taniguchi et al., 2010) for all values of kbind andpromoter arrangements (Fig. 3). Lower values correspond toweakly expressed genes, while higher values correspond to morestrongly expressed ones. However, expression is not subject torepression in these simulations, while in E. coli, weakly expressinggenes usually have such behavior due to the presence of repressormolecules. Due to this, we consider the most realistic values ofkbind are likely to values beyond 105 s1. Interestingly, the rateof saturation (due to the existence of the rate limiting steps, the
open and closed complex formations) is kbind104 s1. We thusestimate realistic values to be between 105 and 104 s1.
Singer and Wu, (1987) estimated the in vitro rate of non-specificassociation of RNAp to circular DNA to be 4.6104 M1 s1 (pernucleotide). From this, one can estimate the value for kbind by dividingthe measured value by the expected volume of E. coli (1015 L)(Sundararaj et al., 2004) and the Avogadro constant. It results in avalue for kbind of 0.75104 s1 per nucleotide, thus within theinterval of the estimation (between 105 and 104 s1). Hereonwards we set kbind to 0.75104 s1, unless stated otherwise.
Also, the kinetics of RNA numbers differs with the geometry ofthe promoter (Fig. 3). Provided identical kinetic rate constants forthe various models of promoters including, e.g., binding regionsfor RNAps of the same length, same duration for processes such asthe open complex formation, etc., we find that unidirectionalpromoters have higher mean RNA numbers, as the production isnot affected by occlusion and collisions between RNAps travelingin opposite directions. The decrease in mean RNA numbers forincreases in kbind beyond 104 s1 in divergent promoters isdue to the increased interference between diffusing RNAps. This isless frequent in convergent promoters as elongating RNApsremove many diffusing RNAps while percolating the DNA tem-plate in the outer regions.
3.2. Binding kinetics of RNA polymerases to promoter regions
To study the dynamics of binding of RNAps to promoters, wemeasured the fraction of times each of the nucleotides of adivergent promoter is bound by the center of a previously freeRNAp (50 simulations, each 105 s long) (Fig. 4), when kbind is set to0.75104 s1 and when is set to 10 and 100 times smaller.Simulations are long enough so that increasing the duration of thebinding would not alter the results significantly.
From Fig. 4, the fractions of bindings per nucleotide are notuniform across the template, except for kbind/100. This is due tothe rate limiting steps at the TSSs (closed complex formation,isomerization, open complex formation, and abortive initiations)and the non-negligible footprint of the RNAp. The intermediateregions between the TSSs are those most available for new RNApsto bind to. The discontinuities are less pronounced as kbind isdecreased, since the regions where the rate limiting steps occurare not so often occupied.
10−6 10−40
1
2
3
4
5
6
kbind (s−1)
Mea
n R
NA
num
bers
0
0.5
1
1.5
2
2.5
3
3.5
4
RN
A C
V2
Fig. 3. Mean and square of coefficient of variation of RNA numbers at near-
equilibrium. Mean RNA numbers at near-equilibrium as a function of kbind rate
(black solid lines): (J) unidirectional promoters, (x) divergent promoters and (&)
convergent promoters. Also shown are the CV2 (square of the standard deviation
over the square of the mean) of RNA numbers from the statistics over time (gray
solid lines) for each case. Note the the y-scale of CV2 is shown in the vertical axis at
the right side, while y-scale for mean numbers is shown in the vertical axis at the
left side.
-300 -270 -240 -210 -180 -151 -120 -90 -60 -30 +1 +30 +60 +90 +120 +150
+300+270+240+210+180+152+120+90+60+30+1-30-60-90-120-150
RNAP
RNAP
RNAPRNAP RNAP
RNAP
mRNA
RNAPRNAPRep
RepRNAPRNAP
RNAP
Fig. 2. Models of promoters. Representation of models of (A) divergent and (B) convergent promoters. Elongation regions depicted in black. RNAps can bind to
any nucleotide. Angled arrows represent TSSs. Harpoons represent binding and unbinding of RNAps and repressors to the DNA. RNA sequences are depicted in
elongating RNAps.
L. Martins et al. / Journal of Theoretical Biology 301 (2012) 83–9486
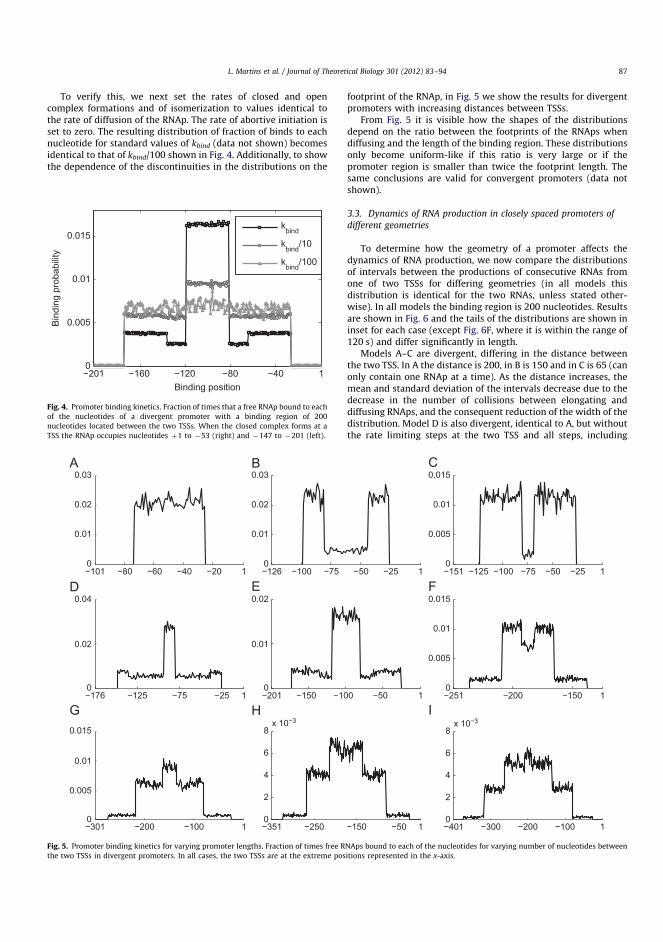
To verify this, we next set the rates of closed and opencomplex formations and of isomerization to values identical tothe rate of diffusion of the RNAp. The rate of abortive initiation isset to zero. The resulting distribution of fraction of binds to eachnucleotide for standard values of kbind (data not shown) becomesidentical to that of kbind/100 shown in Fig. 4. Additionally, to showthe dependence of the discontinuities in the distributions on the
footprint of the RNAp, in Fig. 5 we show the results for divergentpromoters with increasing distances between TSSs.
From Fig. 5 it is visible how the shapes of the distributionsdepend on the ratio between the footprints of the RNAps whendiffusing and the length of the binding region. These distributionsonly become uniform-like if this ratio is very large or if thepromoter region is smaller than twice the footprint length. Thesame conclusions are valid for convergent promoters (data notshown).
3.3. Dynamics of RNA production in closely spaced promoters of
different geometries
To determine how the geometry of a promoter affects thedynamics of RNA production, we now compare the distributionsof intervals between the productions of consecutive RNAs fromone of two TSSs for differing geometries (in all models thisdistribution is identical for the two RNAs, unless stated other-wise). In all models the binding region is 200 nucleotides. Resultsare shown in Fig. 6 and the tails of the distributions are shown ininset for each case (except Fig. 6F, where it is within the range of120 s) and differ significantly in length.
Models A–C are divergent, differing in the distance betweenthe two TSS. In A the distance is 200, in B is 150 and in C is 65 (canonly contain one RNAp at a time). As the distance increases, themean and standard deviation of the intervals decrease due to thedecrease in the number of collisions between elongating anddiffusing RNAps, and the consequent reduction of the width of thedistribution. Model D is also divergent, identical to A, but withoutthe rate limiting steps at the two TSS and all steps, including
−101 −80 −60 −40 −20 10
0.01
0.02
0.03
−126 −100 −75 −50 −25 10
0.01
0.02
0.03
−151 −125 −100 −75 −50 −25 10
0.005
0.01
0.015
−176 −125 −75 −25 10
0.02
0.04
−201 −150 −100 −50 10
0.01
0.02
−251 −200 −150 10
0.005
0.01
0.015
−301 −200 −100 10
0.005
0.01
0.015
−351 −250 −150 −50 10
2
4
6
8x 10⁻³
−401 −300 −200 −100 10
2
4
6
8x 10⁻³
Fig. 5. Promoter binding kinetics for varying promoter lengths. Fraction of times free RNAps bound to each of the nucleotides for varying number of nucleotides between
the two TSSs in divergent promoters. In all cases, the two TSSs are at the extreme positions represented in the x-axis.
−201 −160 −120 −80 −40 10
0.005
0.01
0.015
Binding position
Bin
ding
pro
babi
lity
kbind
kbind
/10
kbind
/100
Fig. 4. Promoter binding kinetics. Fraction of times that a free RNAp bound to each
of the nucleotides of a divergent promoter with a binding region of 200
nucleotides located between the two TSSs. When the closed complex forms at a
TSS the RNAp occupies nucleotides þ1 to 53 (right) and 147 to 201 (left).
L. Martins et al. / Journal of Theoretical Biology 301 (2012) 83–94 87

elongation, closed and open complex formation and isomeriza-tion, occur at the same speed as diffusion (abortive initiation isnot modeled). In comparison to A, the mean of the intervals ismuch smaller as the distribution becomes exponential-like, dueto the absence of the rate limiting steps, as predicted in Ribeiroet al. (2010).
Model E is a convergent promoter with 100 nucleotidesbetween the two TSSs. In comparison to A, RNA production isreduced and noisier. The distribution of intervals increases inmean and standard deviation due to the interference betweenelongating RNAps traveling in opposite directions. Finally, modelF, unidirectional, behaves as a divergent promoter with a config-uration such that there are no collisions between elongating anddiffusing RNAps (i.e. model A).
In general, the kinetics of transcript production is similar in allclosely spaced promoters. The steps that most shape the distribu-tions are the rate limiting steps at the two TSS. However, themean and standard deviation of the distributions of intervalsbetween productions of RNAs depends, to some extent, on therelative positions of the two TSSs and the promoter’s geometry.
In closely spaced promoters the dynamics of transcriptsproduction from the two TSSs are dynamically correlated byinterferences between diffusing and elongating RNAps (i.e. colli-sions). This can be verified by calculating the autocorrelation ofthe time series of RNAs’ production, although collisions may notbe the only source of correlations. If the autocorrelation is null,there is no effect of the interferences between RNAps on theproduction of transcripts. If the autocorrelation is positive, itimplies that once one of the two types RNAs is produced, thepromoter is biased by the interferences to produce the same type
of RNA in the next event. If the autocorrelation is negative, theopposite is more likely. The autocorrelations were calculated formodels A–F, and for an additional model of two, non-interacting,unidirectional promoters. The calculations are done for severallags (lag 1 corresponds to correlations between the present choiceof RNA produced and the next one) and confirm the abovehypothesis (Fig. 7).
First, from Fig. 7A, there is a negative correlation betweenconsecutive production events, but this correlation is not propa-gated for longer lags. The correlation depends on the existence ofrate limiting steps, as seen by comparing with Fig. 7D (modelwithout rate limiting steps). When a TSS is occupied by an RNAp,it remains occupied until the RNAp begins a successful elongationevent. Due to that, it is more likely that the next RNA to beproduced will be from the other TSS (since this TSS may or not beoccupied at the same time, the negative autocorrelation is not‘‘perfect’’, i.e. equal to 1). The same reason explains the smallpositive correlation between choices for lag of 2. On the otherhand, if there are no rate-limiting steps (model D), there are nocorrelations between consecutive choices of which RNA to pro-duce, since the system is virtually memoryless.
If the distance between TSSs is decreased (Fig. 7B) both theautocorrelations at lag 1 and at lag 2 decrease, since the numberof RNAps that can be bound to it at any moment is smaller, thusdecreasing the probability that one successful transcription eventat a TSS will be followed by another event at the other TSS.
As the distance between the two TSSs is even further decreased sothat only one RNAp can be between the two TSS at any moment,there is an abrupt change in the kinetics of transcription (Fig. 7C). Inthis configuration, if one of the two TSS loaded with RNAp, going
0 20 40 60 80 100 1200
0.02
0.04
0.06
0.08
0 20 40 60 80 100 1200
0.05
0.1
0 20 40 60 80 100 1200
0.02
0.04
0.06
0 20 40 60 80 100 1200
0.02
0.04
0.06
0.08
0 20 40 60 80 100 1200
0.02
0.04
0.06
0.08
120 320 520 6500
5x 10⁻³
120 1620 30000
2
4x 10⁻³
120 200 2750
5x 10⁻⁴
120 180 22501
2x 10⁻³
120 185 2250123
x 10−3
0 10 20 300
0.1
0.2
0.3
0.4
μ = 34.3σ = 20.11
μ = 41.06σ = 25.17
µ = 88.75σ = 176.84
μ = 5.12σ = 4.58
μ = 46.70σ = 42.82
μ = 34.5σ = 19.97
Fig. 6. Distributions of intervals between the productions of consecutive RNAs from one TSS. In all cases the bins size is 3 s: (A) divergent promoter with 200 nucleotides
between TSSs, (B) divergent promoter with 150 nucleotides between TSSs, (C) divergent promoter with 65 nucleotides between TSSs, (D) same as (A) but no rate limiting
steps at the TSSs, (E) convergent promoter with 100 nucleotides between the two TSSs and (F) unidirectional promoter with a binding region of 200 nucleotides. The tails
of the distributions are shown in inset. Each figure also shows the mean (m) and standard deviation (s) of each distribution.
L. Martins et al. / Journal of Theoretical Biology 301 (2012) 83–9488
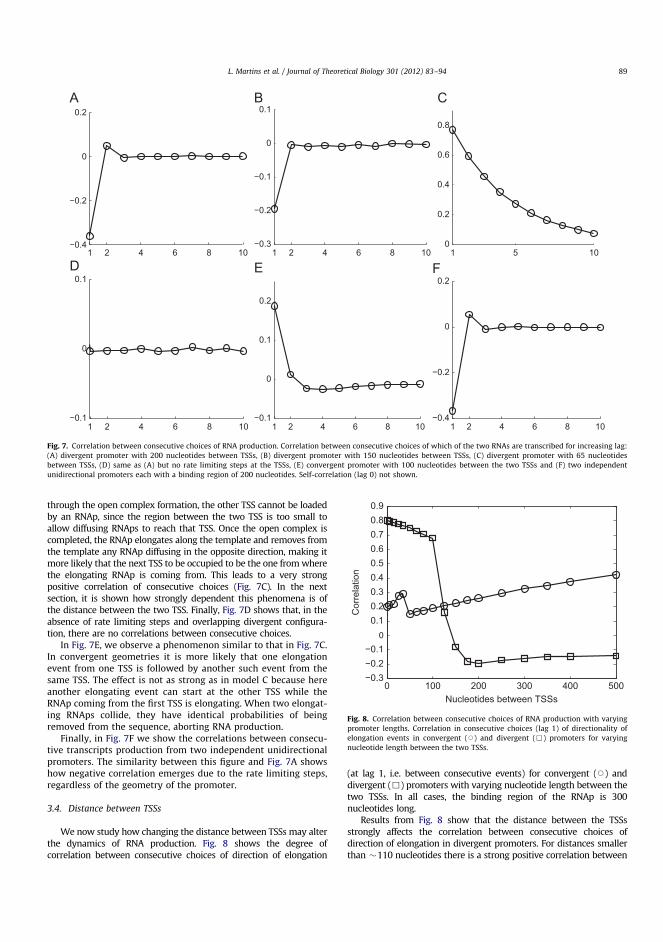
through the open complex formation, the other TSS cannot be loadedby an RNAp, since the region between the two TSS is too small toallow diffusing RNAps to reach that TSS. Once the open complex iscompleted, the RNAp elongates along the template and removes fromthe template any RNAp diffusing in the opposite direction, making itmore likely that the next TSS to be occupied to be the one from wherethe elongating RNAp is coming from. This leads to a very strongpositive correlation of consecutive choices (Fig. 7C). In the nextsection, it is shown how strongly dependent this phenomena is ofthe distance between the two TSS. Finally, Fig. 7D shows that, in theabsence of rate limiting steps and overlapping divergent configura-tion, there are no correlations between consecutive choices.
In Fig. 7E, we observe a phenomenon similar to that in Fig. 7C.In convergent geometries it is more likely that one elongationevent from one TSS is followed by another such event from thesame TSS. The effect is not as strong as in model C because hereanother elongating event can start at the other TSS while theRNAp coming from the first TSS is elongating. When two elongat-ing RNAps collide, they have identical probabilities of beingremoved from the sequence, aborting RNA production.
Finally, in Fig. 7F we show the correlations between consecu-tive transcripts production from two independent unidirectionalpromoters. The similarity between this figure and Fig. 7A showshow negative correlation emerges due to the rate limiting steps,regardless of the geometry of the promoter.
3.4. Distance between TSSs
We now study how changing the distance between TSSs may alterthe dynamics of RNA production. Fig. 8 shows the degree ofcorrelation between consecutive choices of direction of elongation
(at lag 1, i.e. between consecutive events) for convergent (J) anddivergent (&) promoters with varying nucleotide length between thetwo TSSs. In all cases, the binding region of the RNAp is 300nucleotides long.
Results from Fig. 8 show that the distance between the TSSsstrongly affects the correlation between consecutive choices ofdirection of elongation in divergent promoters. For distances smallerthan 110 nucleotides there is a strong positive correlation between
1 2 4 6 8 10−0.4
−0.2
0
0.2
1 2 4 6 8 10−0.4
−0.2
0
0.2
1 2 4 6 8 10−0.3
−0.2
−0.1
0
0.1
1 2 4 6 8 10−0.1
0
0.1
0.2
1 5 100
0.2
0.4
0.6
0.8
1 2 4 6 8 10−0.1
0
0.1
Fig. 7. Correlation between consecutive choices of RNA production. Correlation between consecutive choices of which of the two RNAs are transcribed for increasing lag:
(A) divergent promoter with 200 nucleotides between TSSs, (B) divergent promoter with 150 nucleotides between TSSs, (C) divergent promoter with 65 nucleotides
between TSSs, (D) same as (A) but no rate limiting steps at the TSSs, (E) convergent promoter with 100 nucleotides between the two TSSs and (F) two independent
unidirectional promoters each with a binding region of 200 nucleotides. Self-correlation (lag 0) not shown.
0 100 200 300 400 500−0.3−0.2−0.1
0
0.10.20.30.40.50.60.70.80.9
Nucleotides between TSSs
Cor
rela
tion
Fig. 8. Correlation between consecutive choices of RNA production with varying
promoter lengths. Correlation in consecutive choices (lag 1) of directionality of
elongation events in convergent (J) and divergent (&) promoters for varying
nucleotide length between the two TSSs.
L. Martins et al. / Journal of Theoretical Biology 301 (2012) 83–94 89
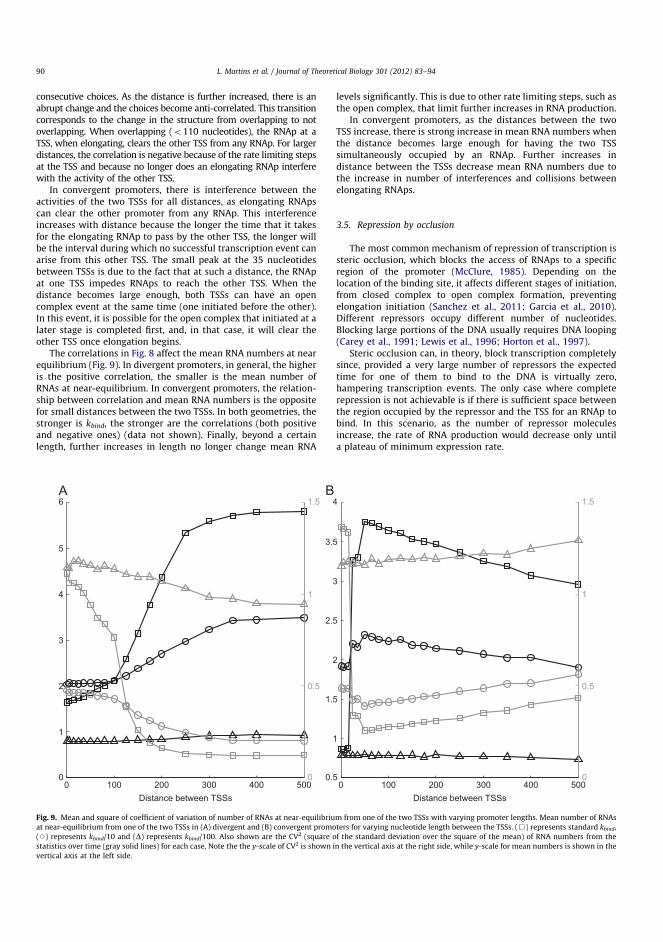
consecutive choices. As the distance is further increased, there is anabrupt change and the choices become anti-correlated. This transitioncorresponds to the change in the structure from overlapping to notoverlapping. When overlapping (o110 nucleotides), the RNAp at aTSS, when elongating, clears the other TSS from any RNAp. For largerdistances, the correlation is negative because of the rate limiting stepsat the TSS and because no longer does an elongating RNAp interferewith the activity of the other TSS.
In convergent promoters, there is interference between theactivities of the two TSSs for all distances, as elongating RNApscan clear the other promoter from any RNAp. This interferenceincreases with distance because the longer the time that it takesfor the elongating RNAp to pass by the other TSS, the longer willbe the interval during which no successful transcription event canarise from this other TSS. The small peak at the 35 nucleotidesbetween TSSs is due to the fact that at such a distance, the RNApat one TSS impedes RNAps to reach the other TSS. When thedistance becomes large enough, both TSSs can have an opencomplex event at the same time (one initiated before the other).In this event, it is possible for the open complex that initiated at alater stage is completed first, and, in that case, it will clear theother TSS once elongation begins.
The correlations in Fig. 8 affect the mean RNA numbers at nearequilibrium (Fig. 9). In divergent promoters, in general, the higheris the positive correlation, the smaller is the mean number ofRNAs at near-equilibrium. In convergent promoters, the relation-ship between correlation and mean RNA numbers is the oppositefor small distances between the two TSSs. In both geometries, thestronger is kbind, the stronger are the correlations (both positiveand negative ones) (data not shown). Finally, beyond a certainlength, further increases in length no longer change mean RNA
levels significantly. This is due to other rate limiting steps, such asthe open complex, that limit further increases in RNA production.
In convergent promoters, as the distances between the twoTSS increase, there is strong increase in mean RNA numbers whenthe distance becomes large enough for having the two TSSsimultaneously occupied by an RNAp. Further increases indistance between the TSSs decrease mean RNA numbers due tothe increase in number of interferences and collisions betweenelongating RNAps.
3.5. Repression by occlusion
The most common mechanism of repression of transcription issteric occlusion, which blocks the access of RNAps to a specificregion of the promoter (McClure, 1985). Depending on thelocation of the binding site, it affects different stages of initiation,from closed complex to open complex formation, preventingelongation initiation (Sanchez et al., 2011; Garcia et al., 2010).Different repressors occupy different number of nucleotides.Blocking large portions of the DNA usually requires DNA looping(Carey et al., 1991; Lewis et al., 1996; Horton et al., 1997).
Steric occlusion can, in theory, block transcription completelysince, provided a very large number of repressors the expectedtime for one of them to bind to the DNA is virtually zero,hampering transcription events. The only case where completerepression is not achievable is if there is sufficient space betweenthe region occupied by the repressor and the TSS for an RNAp tobind. In this scenario, as the number of repressor moleculesincrease, the rate of RNA production would decrease only untila plateau of minimum expression rate.
0 100 200 300 400 5000
1
2
3
4
5
6
Distance between TSSs0 100 200 300 400 500
0.5
1
1.5
2
2.5
3
3.5
4
Distance between TSSs
0
0.5
1
1.5
0
0.5
1
1.5
Fig. 9. Mean and square of coefficient of variation of number of RNAs at near-equilibrium from one of the two TSSs with varying promoter lengths. Mean number of RNAs
at near-equilibrium from one of the two TSSs in (A) divergent and (B) convergent promoters for varying nucleotide length between the TSSs. (&) represents standard kbind,
(J) represents kbind/10 and (D) represents kbind/100. Also shown are the CV2 (square of the standard deviation over the square of the mean) of RNA numbers from the
statistics over time (gray solid lines) for each case. Note the the y-scale of CV2 is shown in the vertical axis at the right side, while y-scale for mean numbers is shown in the
vertical axis at the left side.
L. Martins et al. / Journal of Theoretical Biology 301 (2012) 83–9490
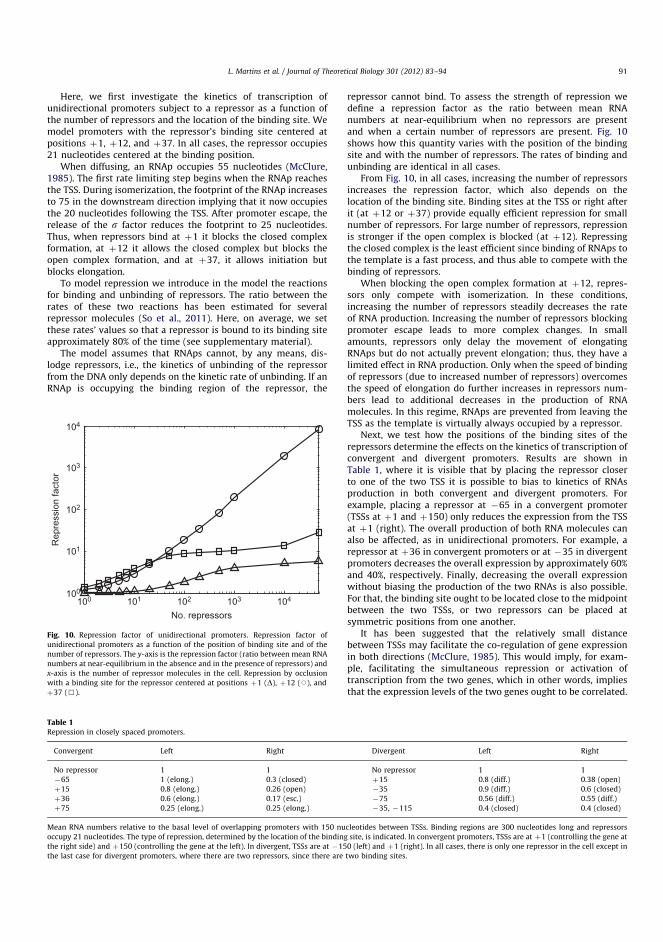
Here, we first investigate the kinetics of transcription ofunidirectional promoters subject to a repressor as a function ofthe number of repressors and the location of the binding site. Wemodel promoters with the repressor’s binding site centered atpositions þ1, þ12, and þ37. In all cases, the repressor occupies21 nucleotides centered at the binding position.
When diffusing, an RNAp occupies 55 nucleotides (McClure,1985). The first rate limiting step begins when the RNAp reachesthe TSS. During isomerization, the footprint of the RNAp increasesto 75 in the downstream direction implying that it now occupiesthe 20 nucleotides following the TSS. After promoter escape, therelease of the s factor reduces the footprint to 25 nucleotides.Thus, when repressors bind at þ1 it blocks the closed complexformation, at þ12 it allows the closed complex but blocks theopen complex formation, and at þ37, it allows initiation butblocks elongation.
To model repression we introduce in the model the reactionsfor binding and unbinding of repressors. The ratio between therates of these two reactions has been estimated for severalrepressor molecules (So et al., 2011). Here, on average, we setthese rates’ values so that a repressor is bound to its binding siteapproximately 80% of the time (see supplementary material).
The model assumes that RNAps cannot, by any means, dis-lodge repressors, i.e., the kinetics of unbinding of the repressorfrom the DNA only depends on the kinetic rate of unbinding. If anRNAp is occupying the binding region of the repressor, the
repressor cannot bind. To assess the strength of repression wedefine a repression factor as the ratio between mean RNAnumbers at near-equilibrium when no repressors are presentand when a certain number of repressors are present. Fig. 10shows how this quantity varies with the position of the bindingsite and with the number of repressors. The rates of binding andunbinding are identical in all cases.
From Fig. 10, in all cases, increasing the number of repressorsincreases the repression factor, which also depends on thelocation of the binding site. Binding sites at the TSS or right afterit (at þ12 or þ37) provide equally efficient repression for smallnumber of repressors. For large number of repressors, repressionis stronger if the open complex is blocked (at þ12). Repressingthe closed complex is the least efficient since binding of RNAps tothe template is a fast process, and thus able to compete with thebinding of repressors.
When blocking the open complex formation at þ12, repres-sors only compete with isomerization. In these conditions,increasing the number of repressors steadily decreases the rateof RNA production. Increasing the number of repressors blockingpromoter escape leads to more complex changes. In smallamounts, repressors only delay the movement of elongatingRNAps but do not actually prevent elongation; thus, they have alimited effect in RNA production. Only when the speed of bindingof repressors (due to increased number of repressors) overcomesthe speed of elongation do further increases in repressors num-bers lead to additional decreases in the production of RNAmolecules. In this regime, RNAps are prevented from leaving theTSS as the template is virtually always occupied by a repressor.
Next, we test how the positions of the binding sites of therepressors determine the effects on the kinetics of transcription ofconvergent and divergent promoters. Results are shown inTable 1, where it is visible that by placing the repressor closerto one of the two TSS it is possible to bias to kinetics of RNAsproduction in both convergent and divergent promoters. Forexample, placing a repressor at 65 in a convergent promoter(TSSs at þ1 and þ150) only reduces the expression from the TSSat þ1 (right). The overall production of both RNA molecules canalso be affected, as in unidirectional promoters. For example, arepressor at þ36 in convergent promoters or at 35 in divergentpromoters decreases the overall expression by approximately 60%and 40%, respectively. Finally, decreasing the overall expressionwithout biasing the production of the two RNAs is also possible.For that, the binding site ought to be located close to the midpointbetween the two TSSs, or two repressors can be placed atsymmetric positions from one another.
It has been suggested that the relatively small distancebetween TSSs may facilitate the co-regulation of gene expressionin both directions (McClure, 1985). This would imply, for exam-ple, facilitating the simultaneous repression or activation oftranscription from the two genes, which in other words, impliesthat the expression levels of the two genes ought to be correlated.
100 101 102 103 104100
101
102
103
104
No. repressors
Rep
ress
ion
fact
or
Fig. 10. Repression factor of unidirectional promoters. Repression factor of
unidirectional promoters as a function of the position of binding site and of the
number of repressors. The y-axis is the repression factor (ratio between mean RNA
numbers at near-equilibrium in the absence and in the presence of repressors) and
x-axis is the number of repressor molecules in the cell. Repression by occlusion
with a binding site for the repressor centered at positions þ1 (D), þ12 (J), and
þ37 (&).
Table 1Repression in closely spaced promoters.
Convergent Left Right Divergent Left Right
No repressor 1 1 No repressor 1 1
65 1 (elong.) 0.3 (closed) þ15 0.8 (diff.) 0.38 (open)
þ15 0.8 (elong.) 0.26 (open) 35 0.9 (diff.) 0.6 (closed)
þ36 0.6 (elong.) 0.17 (esc.) 75 0.56 (diff.) 0.55 (diff.)
þ75 0.25 (elong.) 0.25 (elong.) 35, 115 0.4 (closed) 0.4 (closed)
Mean RNA numbers relative to the basal level of overlapping promoters with 150 nucleotides between TSSs. Binding regions are 300 nucleotides long and repressors
occupy 21 nucleotides. The type of repression, determined by the location of the binding site, is indicated. In convergent promoters, TSSs are at þ1 (controlling the gene at
the right side) and þ150 (controlling the gene at the left). In divergent, TSSs are at 150 (left) and þ1 (right). In all cases, there is only one repressor in the cell except in
the last case for divergent promoters, where there are two repressors, since there are two binding sites.
L. Martins et al. / Journal of Theoretical Biology 301 (2012) 83–94 91
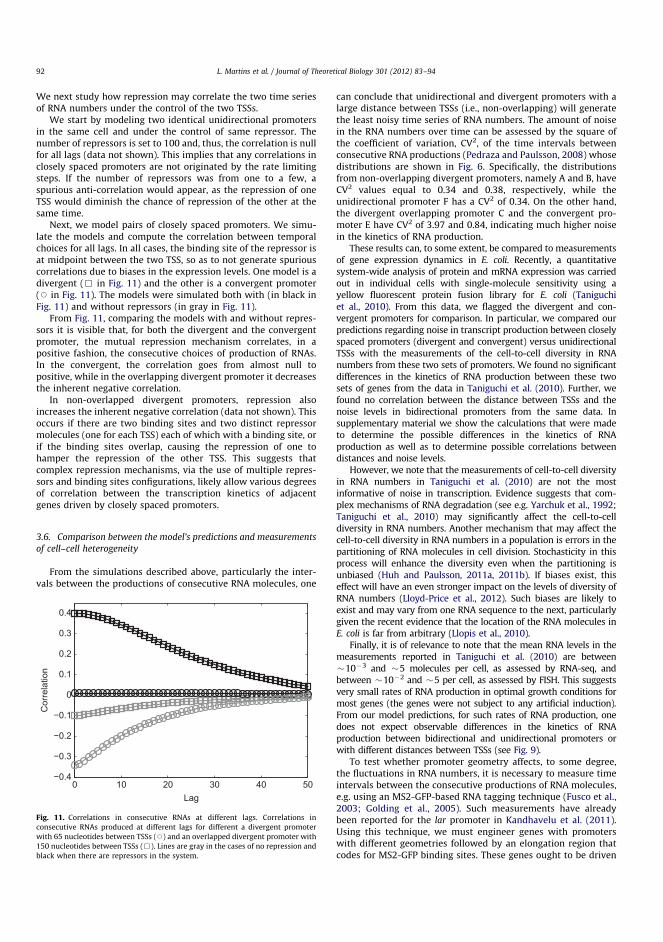
We next study how repression may correlate the two time seriesof RNA numbers under the control of the two TSSs.
We start by modeling two identical unidirectional promotersin the same cell and under the control of same repressor. Thenumber of repressors is set to 100 and, thus, the correlation is nullfor all lags (data not shown). This implies that any correlations inclosely spaced promoters are not originated by the rate limitingsteps. If the number of repressors was from one to a few, aspurious anti-correlation would appear, as the repression of oneTSS would diminish the chance of repression of the other at thesame time.
Next, we model pairs of closely spaced promoters. We simu-late the models and compute the correlation between temporalchoices for all lags. In all cases, the binding site of the repressor isat midpoint between the two TSS, so as to not generate spuriouscorrelations due to biases in the expression levels. One model is adivergent (& in Fig. 11) and the other is a convergent promoter(J in Fig. 11). The models were simulated both with (in black inFig. 11) and without repressors (in gray in Fig. 11).
From Fig. 11, comparing the models with and without repres-sors it is visible that, for both the divergent and the convergentpromoter, the mutual repression mechanism correlates, in apositive fashion, the consecutive choices of production of RNAs.In the convergent, the correlation goes from almost null topositive, while in the overlapping divergent promoter it decreasesthe inherent negative correlation.
In non-overlapped divergent promoters, repression alsoincreases the inherent negative correlation (data not shown). Thisoccurs if there are two binding sites and two distinct repressormolecules (one for each TSS) each of which with a binding site, orif the binding sites overlap, causing the repression of one tohamper the repression of the other TSS. This suggests thatcomplex repression mechanisms, via the use of multiple repres-sors and binding sites configurations, likely allow various degreesof correlation between the transcription kinetics of adjacentgenes driven by closely spaced promoters.
3.6. Comparison between the model’s predictions and measurements
of cell–cell heterogeneity
From the simulations described above, particularly the inter-vals between the productions of consecutive RNA molecules, one
can conclude that unidirectional and divergent promoters with alarge distance between TSSs (i.e., non-overlapping) will generatethe least noisy time series of RNA numbers. The amount of noisein the RNA numbers over time can be assessed by the square ofthe coefficient of variation, CV2, of the time intervals betweenconsecutive RNA productions (Pedraza and Paulsson, 2008) whosedistributions are shown in Fig. 6. Specifically, the distributionsfrom non-overlapping divergent promoters, namely A and B, haveCV2 values equal to 0.34 and 0.38, respectively, while theunidirectional promoter F has a CV2 of 0.34. On the other hand,the divergent overlapping promoter C and the convergent pro-moter E have CV2 of 3.97 and 0.84, indicating much higher noisein the kinetics of RNA production.
These results can, to some extent, be compared to measurementsof gene expression dynamics in E. coli. Recently, a quantitativesystem-wide analysis of protein and mRNA expression was carriedout in individual cells with single-molecule sensitivity using ayellow fluorescent protein fusion library for E. coli (Taniguchiet al., 2010). From this data, we flagged the divergent and con-vergent promoters for comparison. In particular, we compared ourpredictions regarding noise in transcript production between closelyspaced promoters (divergent and convergent) versus unidirectionalTSSs with the measurements of the cell-to-cell diversity in RNAnumbers from these two sets of promoters. We found no significantdifferences in the kinetics of RNA production between these twosets of genes from the data in Taniguchi et al. (2010). Further, wefound no correlation between the distance between TSSs and thenoise levels in bidirectional promoters from the same data. Insupplementary material we show the calculations that were madeto determine the possible differences in the kinetics of RNAproduction as well as to determine possible correlations betweendistances and noise levels.
However, we note that the measurements of cell-to-cell diversityin RNA numbers in Taniguchi et al. (2010) are not the mostinformative of noise in transcription. Evidence suggests that com-plex mechanisms of RNA degradation (see e.g. Yarchuk et al., 1992;Taniguchi et al., 2010) may significantly affect the cell-to-celldiversity in RNA numbers. Another mechanism that may affect thecell-to-cell diversity in RNA numbers in a population is errors in thepartitioning of RNA molecules in cell division. Stochasticity in thisprocess will enhance the diversity even when the partitioning isunbiased (Huh and Paulsson, 2011a, 2011b). If biases exist, thiseffect will have an even stronger impact on the levels of diversity ofRNA numbers (Lloyd-Price et al., 2012). Such biases are likely toexist and may vary from one RNA sequence to the next, particularlygiven the recent evidence that the location of the RNA molecules inE. coli is far from arbitrary (Llopis et al., 2010).
Finally, it is of relevance to note that the mean RNA levels in themeasurements reported in Taniguchi et al. (2010) are between103 and 5 molecules per cell, as assessed by RNA-seq, andbetween 102 and 5 per cell, as assessed by FISH. This suggestsvery small rates of RNA production in optimal growth conditions formost genes (the genes were not subject to any artificial induction).From our model predictions, for such rates of RNA production, onedoes not expect observable differences in the kinetics of RNAproduction between bidirectional and unidirectional promoters orwith different distances between TSSs (see Fig. 9).
To test whether promoter geometry affects, to some degree,the fluctuations in RNA numbers, it is necessary to measure timeintervals between the consecutive productions of RNA molecules,e.g. using an MS2-GFP-based RNA tagging technique (Fusco et al.,2003; Golding et al., 2005). Such measurements have alreadybeen reported for the lar promoter in Kandhavelu et al. (2011).Using this technique, we must engineer genes with promoterswith different geometries followed by an elongation region thatcodes for MS2-GFP binding sites. These genes ought to be driven
0 10 20 30 40 50−0.4
−0.3
−0.2
−0.1
0
0.1
0.2
0.3
0.4
Lag
Cor
rela
tion
Fig. 11. Correlations in consecutive RNAs at different lags. Correlations in
consecutive RNAs produced at different lags for different a divergent promoter
with 65 nucleotides between TSSs (J) and an overlapped divergent promoter with
150 nucleotides between TSSs (&). Lines are gray in the cases of no repression and
black when there are repressors in the system.
L. Martins et al. / Journal of Theoretical Biology 301 (2012) 83–9492

by promoters strong enough, when induced, so that the produc-tion rates are sufficient to allow detection of differences in thestochasticity of the production mechanism. Note that, with thismethod, one can detect RNA molecules as soon as they areproduced (Golding and Cox, 2004), implying that production ratesof the order of 4–10 RNAs per hour may suffice to detectdifferences in the kinetics of production of RNAs under the controlof promoters with different geometries.
4. Conclusions
We studied the dynamics of expression of pairs of genes drivenby closely spaced promoters within realistic intervals of para-meter values for E. coli. For that, we used a delayed stochasticmodel that mimics transcription initiation in E. coli, one RNAp andone nucleotide at a time. From the simulations, in general, we findthat changing the sequence between the two TSS and the kineticsof the closed and open complex formation at each TSS allowspairs of genes with overlapping promoters to have widely diversekinetics of RNA production, and complex dynamics of RNAproduction not easily achievable by sets of genes that interactvia transcription factors alone.
In general, the rate limiting steps at the two TSSs areresponsible for a degree of anti-correlation between consecutivechoices of which of the two RNAs are transcribed next. Theblocking of a TSS by an RNAp during the rate limiting steps(isomerization and open complex formation) makes more likelythe choice of the other RNA to be produced next. However, if thedistance between the two TSS is below a certain number ofnucleotides, the opposite occurs.
The simulations showed that the sequence of the promoter(nucleotide length, kinetics of rate limiting steps, etc.) signifi-cantly affects the dynamics of RNA production. In that sense, thisdynamics is sequence dependent and thus subject to selection. Ifthe kinetics of RNA production is subject to selection, thearrangement of closely spaced promoters is also subject toselection, since promoters with different geometries were shownto have widely diverse kinetics of RNA production. Further, giventhe observed ranges of variability in the distributions of intervalsbetween the productions of consecutive RNA molecules as afunction of the configuration of the promoter, it is expected,provided first order degradation rates of RNA molecules, that cell-to-cell diversity in RNA numbers may range from sub- to supra-poissonian as a function of the kinetics of transcription initiation.We verified this (data not shown) by calculating the Fano factor inRNA numbers in different cells at near equilibrium.
One interesting outcome of the results is that they provide ameans to, from the behavior analysis, define the meaning of‘closely spaced promoter’ which, at the moment, still has a ratherloose definition. From Figs. 8 and 9, regarding divergent promo-ters, we observe a sharp behavioral change (in mean and correla-tion) when the distance between TSSs increases from 100 to 200nucleotides. Provided future experimental validation of thisresult, this may allow define as ‘closely spaced’ promoters, forthis geometry, those that are separated by less than 100 nucleo-tides. In the case of convergent promoters there is a strong changein the mean RNA levels (Fig. 9) when the nucleotides distanceincreases beyond 25 nucleotides and thus this distance could beused as a means to define closely spaced convergent promoters.
As a side note, the discrete nature of the probabilities ofbinding of the RNAp to the nucleotides close to the two TSSmay be of significance. It suggests that the location of bindingsites for repressors and activators relative to the TSSs is likely tobe far from random, as the location will determine the overallprobabilities of freely diffusing RNAps to reach either TSS.
The study of the effects of repressors showed that these can bea means to achieve complex patterns of behaviors, not possibleotherwise. Their effect depends on the geometry of the promoterand on the length of the sequences between the two TSS. Further,it depends on the location of the binding sites. For example,placing the binding site between the two TSSs, but closer to one ofthem, biases the mean expression levels of the genes. Finally,depending on these parameters, repression by occlusion cancorrelate or anti-correlate the two RNAs levels.
Our results show that repression at different stages of tran-scription can lead to similar as well as distinct kinetics of RNAnumbers, depending on several factors such as the number ofrepressor molecules in the cell. In general, for the same number ofrepressors and binding affinity, the effects on RNA productiondiffer with the stage of transcription that is repressed. Recentobservations are in agreement. When Schlax et al. (1995) studiedthe repression kinetics they concluded that the most probabledown-regulation mechanism is the inhibition of closed complexformation. However, the diversity of regulatory mechanisms andbroad distribution of locations of binding sites of repressorsrelative to the TSSs (Garcia et al., 2010) suggests that, repressionoccurs at different stages in different genes, including during thepromoter escape.
It is of interest to compare our results regarding repressionwith those of Wang et al. (2011) from a single step stochasticmodel of eukaryotic gene expression. In this work, the authorspostulate that, in divergent promoters, the expression of one genefacilitates the expression of the other by preventing chromatincompaction. In our case, a similar effect takes place, in that theexpression of one of the genes tends to prevent the binding of therepressor between the TSSs, provided close proximity betweenthe TSS and the repressor binding site.
Much effort has been given to the engineering of artificialgenetic circuits (Elowitz and Leibler, 2000; Gardner et al., 2000).E. coli is one of the model organisms used in these studies. Mostcircuits engineered so far rely on commonly used promoters, suchas lac, tet, and ara (McClure, 1985). These are used because theirsequences are well characterized and the regulatory moleculesare known (Lutz et al., 2001). So far, little attention has been givento the panoply of native promoters in E. coli and other organisms.A genome-wide characterization of the kinetics of the endogen-ous promoters in E. coli is likely to show that there is a muchwider range of dynamical behaviors than those observed so far.A more complete survey of the state space of dynamical behaviorsat the promoter level will aid the engineering of novel circuitsthat will be able to perform far more complex dynamicalbehaviors than what is presently possible. The applicability ofthese circuits will thus be much enhanced. Additionally, if thesecircuits can be engineered so as to be more tightly coupled withthe native genetic networks, they can make use of the nativeregulatory mechanisms of the dynamics of expression in the hostcells. Our study aimed to aid in this effort by assessing the rangeof dynamical behaviors possible by varying the geometry andstructure of closely spaced promoters. Finally, we hypothesizethat the multitude of regulatory steps of the dynamics of RNAproduction not only partially explains the observed diversity ofkinetic behavior of genes in E. coli, but it also suggests thatdifferent mechanisms can be used to attain similar kinetics ofRNA production, thereby allowing for the emergence of neutralevolutionary pathways.
Author contributions
A.S.R. conceived the study and supervised the interpretation ofdata. O.Y.H., J.M.F., and M.K. aided in the conception of the study
L. Martins et al. / Journal of Theoretical Biology 301 (2012) 83–94 93

and interpretation of the data. J.M. and A.S.R. conceived themodel. L.M. and AH implemented the model. L.M. and J.M. didmost simulations and data acquisition. All authors performedresearch. A.S.R. and J.M. drafted the manuscript that was revisedby all authors.
Acknowledgments
Work supported by the Academy of Finland (A.S.R., A.H., M.K.),and the FiDiPro program of Finnish Funding Agency for Technol-ogy and Innovation (J.M., A.S.R., A.H., O.Y.-H.). The funders had norole in study design, data collection and analysis, decision topublish, or preparation of the manuscript. The authors would liketo thank Jason Lloyd-Price for valuable advice and discussions.
Appendix A. supplementary material
Supplementary data associated with this article can be foundin the online version at doi:10.1016/j.jtbi.2012.02.015.
References
Arkin, A., Ross, J., McAdams, H.H., 1998. Stochastic kinetic analysis of develop-mental pathway bifurcation in phage lambda-infected Escherichia coli cells.Genetics 149 (4), 1633–1648.
Beck, C.F., Warren, R.A., 1988. Divergent promoters, a common form of geneorganization. Microbiol. Rev. 52 (3), 318–326.
Bernstein, J.A., Khodursky, A.B., Lin, P., Lin-Chao, S., Cohen, S.N., 2002. Globalanalysis of mRNA decay and abundance in Escherichia coli at single-generesolution using two-color fluorescent DNA microarrays. Proc. Natl. Acad. Sci.USA 99 (15), 9697–9702.
Bremer, H., Dennis, P., Ehrenberg, M., 2003. Free RNA polymerase and modelingglobal transcription in Escherichia coli. Biochimie 85, 597–609.
Browning, D.F., Busby, S.J.W., 2004. The regulation of bacterial transcriptioninitiation. Nat. Rev. Microbiol. 2, 57–65.
Buc, H., McClure, W.R., 1985. Kinetics of open complex formation betweenEscherichia coli RNA polymerase and the lac UV5 promoter. Evidence for asequential mechanism involving three steps. Biochemistry 24 (11),2712–2723.
Callen, B.P., Shearwin, K.E., Egan, J.B., 2004. Transcriptional interference betweenconvergent promoters caused by elongation over the promoter. Mol. Cell 14,647–656.
Carey, J., Lewis, D.E., Lavoie, T.A., Yang, J., 1991. How does trp repressor bind to itsoperator? J. Biol. Chem. 266 (36), 24509–24513.
deHaseth, P.L., Zupancic, M.L., Record Jr, M.T., 1998. RNA polymerase–promoterinteractions: the comings and goings of RNA polymerase. J. Bacteriol. 180 (12),3019–3025.
Ebisuya, M., Yamamoto, T., Nakajima, M., Nishida, E., 2008. Ripples from neigh-bouring transcription. Nat. Cell Biol. 10, 1106–1113.
Elowitz, M.B., Leibler, S., 2000. A synthetic oscillatory network of transcriptionalregulators. Nature 403, 335–338.
Fusco, D., Accornero, N., Lavoie, B., Shenoy, S.M., Blanchard, J.-M., Singer, R.H.,Bertrand, E., 2003. Single mrna molecules demonstrate probabilistic move-ment in living mammalian cells. Curr. Biol. 13 (2), 161–167.
Gama-Castro, S., Salgado, H., Peralta-Gil, M., Santos-Zavaleta, A., Muniz-Rascado,L., Solano-Lira, H., Jimenez-Jacinto, V., Weiss, V., Garcıa-Sotelo, J.S., Lopez-Fuentes, A., Porron-Sotelo, L., Alquicira-Hernandez, S., Medina-Rivera, A.,Martınez-Flores, I., Alquicira-Hernandez, K., Martınez-Adame, R., Bonavides-Martınez, C., Miranda-Rıos, J., Huerta, A.M., Mendoza-Vargas, A., Collado-Torres, L., Taboada, B., Vega-Alvarado, L., Olvera, M., Olvera, L., Grande, R.,Morett, E., Collado-Vides, J., 2010. RegulonDB version 7.0: transcriptionalregulation of Escherichia coli K-12 integrated within genetic sensory responseunits (Gensor Units). Nucleic Acids Res. 39, 98–105.
Gardner, T.S., Cantor, C.R., Collins, J.J., 2000. Construction of a genetic toggle switchin Escherichia coli. Nature 403, 339–342.
Garcia, H.G., Sanchez, A., Kuhlman, T., Kondev, J., Phillips, R., 2010. Transcription bythe numbers redux: experiments and calculations that surprise. Trends CellBiol. 20 (12), 723–733.
Gillespie, D.T., 1977. Exact stochastic simulation of coupled chemical reactions. J.Phys. Chem. 81 (25), 2340–2361.
Golding, I., Paulsson, J., Zawilski, S.M., Cox, E.C., 2005. Real-time kinetics of geneactivity in individual bacteria. Cell 123 (6), 1025–1036.
Golding, I., Cox, E.C., 2004. Rna dynamics in live Escherichia coli cells. Proc. Natl.Acad. Sci. USA 101 (31), 11310–11315.
Gorman, J., Greene, E.C., 2008. Visualizing one-dimensional diffusion of proteinsalong DNA. Nat. Struct. Mol. Biol. 15 (8), 768–774.
Hakkinen, A., Healy, S., Jacobs, H.T., Ribeiro, A.S., 2011. Genome wide study of NF-Ytype CCAAT boxes in unidirectional and bidirectional promoters in human andmouse. J. Theor. Biol. 281 (1), 74–83.
Horton, N., Lewis, M., Lu, P., 1997. Escherichia coli lac repressor-lac operatorinteraction and the influence of allosteric effectors. J. Mol. Biol. 265 (1), 1–7.
Hsu, L.M., 2002. Promoter clearance and escape in prokaryotes. Biochim. Biophys.Acta 1577, 191–207.
Huh, D., Paulsson, J., 2011a. Random partitioning of molecules at cell division.Proc. Acad. Natl. Sci. USA 108 (36), 15004–15009.
Huh, D., Paulsson, J., 2011b. Non-genetic heterogeneity from stochastic partition-ing at cell division. Nat. Genet. 43 (2), 95–100.
Kandhavelu, M., Mannerstrom, H., Yli-Harja, O., Ribeiro, A.S., 2011. In vivo kineticsof transcription initiation of the lar promoter in Escherichia coli. Evidence for asequential mechanism with two rate limiting steps. BMC Syst. Biol. 5, 149.
Lewis, M., Chang, G., Horton, N.C., Kercher, M.A., Pace, H.C., Schumacher, M.A.,Brennan, R.G., Lu, P., 1996. Crystal structure of the lactose operon repressorand its complexes with DNA and inducer. Science 271 (5253), 1247–1254.
Lopez, P.J., Guillerez, J., Sousa, R., Dreyfus, M., 1998. On the mechanism ofinhibition of phage T7 RNA polymerase by lac repressor. J. Mol. Biol. 276 (5),861–875.
Llopis, P.M., Jackson, A., Sliusarenko, O., Surovtsev, I., Heinritz, J., Emonet, T.,Jacobs-Wagner, C., 2010. Spatial organization of the flow of genetic informa-tion in bacteria. Nature 466, 77–81.
Lloyd-Price, J., Lehtivaara, M., Kandhavelu, M., Chowdhury, S., Muthukrishnan, A.-B., Yli-Harja, O., Ribeiro, A.S., 2012. Probabilistic RNA partitioning generatestransient increases in the normalized variance of RNA numbers in synchro-nized populations of Escherichia coli. Mol. BioSyst. 8 (2), 565–571.
Lutz, R., Lozinski, T., Ellinger, T., Bujard, H., 2001. Dissecting the functionalprogram of Escherichia coli promoters: the combined mode of action of Lacrepressor and AraC activator. Nucleic Acids Res. 29, 3873–3881.
McClure, W.R., 1985. Mechanism and control of transcription initiation inprokaryotes. Annu. Rev. Biochem. 54, 171–204.
Pedraza, J.M., Paulsson, J., 2008. Effects of molecular memory and bursting onfluctuations in gene expression. Science 319, 339–343.
Ribeiro, A.S., Lloyd-Price, J., 2007. SGN Sim, a stochastic genetic networkssimulator. Bioinformatics 23 (6), 777–779.
Ribeiro, A.S., Hakkinen, A., Mannerstrom, H., Lloyd-Price, J., Yli-Harja, O., 2010.Effects of the promoter open complex formation on gene expression dynamics.Phys. Rev. E Stat. Nonlinear Soft Matter Phys. 81 (1 Part 1), 011912.
Roussel, M.R., Zhu, R., 2006. Validation of an algorithm for delay stochasticsimulation of transcription and translation in prokaryotic gene expression.Phys. Biol. 3, 274–284.
Saecker, R.M., Record Jr, M.T., deHaseth, P.L., 2011. Mechanism of bacterialtranscription initiation: RNA polymerase–promoter binding, isomerization toinitiation-competent open complexes, and initiation of RNA synthesis. J. Mol.Biol. 412 (5), 754–771.
Sakata-Sogawa, K., Shimamoto, N., 2004. RNA polymerase can track a DNA grooveduring promoter search. Proc. Natl. Acad. Sci. USA 101 (41), 14731–14735.
Sanchez, A., Osborne, M.L., Friedman, L.J., Kondev, J., Gelles, J., 2011. Mechanism oftranscriptional repression at a bacterial promoter by analysis of singlemolecules. EMBO J. 30, 3940–3946.
Schlax, P.J., Capp, M.W., Record Jr, M.T., 1995. Inhibition of transcription initiationby lac repressor. J. Mol. Biol. 245 (4), 331–350.
Singer, P., Wu, C.-H., 1987. Promoter search by Escherichia coli RNA polymerase ona circular DNA template. J. Biol. Chem. 262 (29), 14178–14189.
Singh, S.S., Typas, A., Hengge, R., Grainger, D.C., 2011. Escherichia coli s70 sensessequence and conformation of the promoter spacer region. Nucleic Acids Res.39 (12), 5109–5118.
Sneppen, K., Dodd, I.B., Shearwin, K.E., Palmer, A.C., Schubert, R.A., Callen, B.P.,Egan, J.B., 2005. A mathematical model for transcriptional interference by RNApolymerase traffic in Escherichia coli. J. Mol. Biol. 346, 399–409.
So, L.H., Ghosh, A., Zong, C., Sepulveda, L.A., Segev, R., Golding, I., 2011. Generalproperties of transcriptional time series in Escherichia coli. Nat. Genet. 43 (6),554–560.
Sundararaj, S., Guo, A., Habibi-Nazhad, B., Rouani, M., Stothard, P., Ellison, M.,Wishart, D.S., 2004. The CyberCell Database (CCDB): a comprehensive, self-updating, relational database to coordinate and facilitate in silico modeling ofEscherichia coli. Nucleic Acids Res. 32 (D293), D295.
Taniguchi, Y., Choi, P.J., Li, G.-W., Chen, H., Babu, M., Hearn, J., Emili, A., Xie, X.S.,2010. Quantifying E. coli proteome and transcriptome with single-moleculesensitivity in single cells. Science 329, 533–538.
Wang, G.-Z., Lercher, M.J., Hurst, L.D., 2011. Transcriptional coupling of neighbor-ing genes and gene expression noise: evidence that gene orientation andnoncoding transcripts are modulators of noise. Genome Biol. Evol. 3, 320–331.
Woo, Y.H., Li, W.-H., 2011. Gene clustering pattern, promoter architecture, andgene expression stability in eukaryotic genomes. Proc. Natl. Acad. Sci. USA 108(8), 3306–3311.
Yarchuk, O., Jacques, N., Guillerez, J., Dreyfus, M., 1992. Interdependence oftranslation, transcription and mRNA degradation in the IacZ Gene. J. Mol. Biol.266, 581–596.
L. Martins et al. / Journal of Theoretical Biology 301 (2012) 83–9494

1
Supplementary Material for “Dynamics of transcription of closely spaced promoters
in Escherichia coli, one event at a time”.
Leonardo Martins, Jarno Mäkelä, Antti Häkkinen, Meenakshisundaram Kandhavelu, Olli
Yli-Harja, José M. Fonseca and Andre S. Ribeiro
1. Stochastic Model of Closely Spaced Promoters at the Nucleotide Level
The delayed stochastic model of transcription initiation at the nucleotide level includes
the non-specific binding of RNA polymerase (RNAp) to the DNA, search by diffusion
for transcription start sites (TSSs), rate limiting steps leading to the open complex
formation at the TSS, abortive initiations and productive elongation. In addition, it
accounts for changes in the footprint of the RNAp while diffusing, at the TSS and when
elongating [1-3]. When referring to closed complex formation, we mean the steps that
occur after the finding of the TSS, but prior to the start of the open complex formation
[1,4].
Most reactions in the model are instantaneous, i.e. once the two reacting molecules meet
and react, the product is released instantaneously. Instantaneous reactions are represented
as: kA+B C . In this reaction, when A and B meet according to the rules of the
stochastic simulation algorithm (SSA) [5], molecule C is produced instantaneously. The
expected time for A and B to meet is determined by the propensity of this reaction at each
moment, given by the product of k, the number of A molecules and the number of B
molecules [5].
Some reactions need to account for the time the process takes to occur, once initiated.
Such delays in the release of products are represented as follows: kA+B C
.
When this reaction occurs, C is placed on a waitlist and only made available for further
reactions after seconds have elapsed. can be generated randomly from any desired
distribution each time the reaction is chosen to occur. Such delayed events are only
introduced when the time that the process takes to occur is sufficiently long to affect the
kinetics of the system. Finally, note that in some reactions, not all necessary reactants for
the occurrence are consumed by the reaction. Substrates that are not consumed are
indicated by an (*).
The model of transcription has four main components: RNAps, repressor molecules when
existing, and DNA and RNA sequences, modeled at the nucleotide level. The promoter
sequence contains TSSs and binding sites (BS) for repressors. This model can be coupled
to the model of transcription and translation elongations at the nucleotide and codon level
proposed in [6]. For simplicity, here we only present the model of initiation. The
reactions, stochastic rate constants and time delays, are shown in Table S1. Variables
used in reactions are shown in Table S2.
2
RNAps freely diffusing in the cell are allowed to bind to any nucleotide of the promoter
region, provided that it is free. This occurs via reaction (1). The strand to which it binds
determines the direction of diffusion, which does not change until the RNAp unbinds the
DNA template. The RNAp can unbind via reaction (2) at any stage of difusion.
The model accounts for the footprint of the RNAp at each stage. Ranges of nucleotides
are denoted in square brackets, e.g. U[start,end]. Footprint studies [3,7,8] indicate that a
bound RNAp, while diffusing, occupies ~55 nucleotides. Such occupied nucleotides are
named On, where n denotes its number, while Un stands for the nth
unoccupied nucleotide.
To refer to a position of an RNAp we use the nucleotide where its active center is at,
while the range occupied by the RNAp is referred to as [n-ΔD, n+ ΔD], where ΔD = 27.
Once an RNAp binds to the DNA, it diffuses on the template one nucleotide at a time,
provided that the nucleotides are available (3). If the path is blocked by another RNAp or
a repressor, it will eventually dissociate from the DNA strand via (2) [4].
When the RNAp finds the specific TSS, a chain of events takes place such as the closed
complex formation (4) and isomerization (5) [1,2]. At this stage, the RNAp structure
changes and occupies more nucleotides (~75) [8,9]. Next, the open complex formation
occurs (6) [10].
The model accounts for collisions between elongating complexes (EC) and diffusing
RNAps (8) and between two ECs (9). The former causes diffusing RNAps to disassociate
from the DNA and the latter disassociates one or both ECs from the DNA. In collisions
between ECs and diffusing RNAps (8), the EC remains in the template and the diffusing
RNAp dissociates from the template. A similar reaction models collisions between
diffusing RNAps (7), where one or both RNAps dissociate from the template. Finally, we
model the “sitting duck” mechanism (10) [11]. When an EC collides with a promoter
complex (e.g. open complex), since the EC is tightly bound to the DNA, the complex is
removed.
Reaction (11) models the formation of elongating complexes, while (12) models the
initial steps in elongation, during which the RNAp “scrunches” the DNA [12,13] until
enough energy is accumulated for the RNAp to escape the promoter (14). Prior to this,
abortive initiation events (13) can occur, which causes the RNAp to return to the open
complex state. We set the rate of abortive initiations to 4.2 s-1
to be within the ranges
reported in [14].
For simplicity we only allow escape after the scrunching of the 12th nucleotide, although
this differs from gene to gene, and from one event to the next [15]. As soon as the RNAp
escapes the promoter (14), productive elongation events can occur (15). Also, the TSS
becomes available for other RNAps.
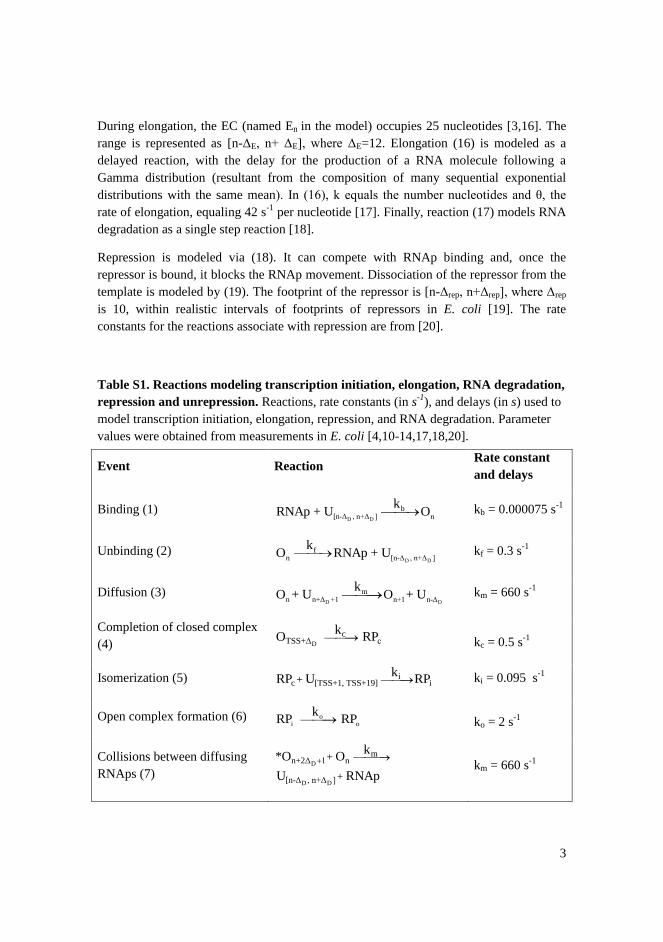
3
During elongation, the EC (named En in the model) occupies 25 nucleotides [3,16]. The
range is represented as [n-ΔE, n+ ΔE], where ΔE=12. Elongation (16) is modeled as a
delayed reaction, with the delay for the production of a RNA molecule following a
Gamma distribution (resultant from the composition of many sequential exponential
distributions with the same mean). In (16), k equals the number nucleotides and θ, the
rate of elongation, equaling 42 s-1
per nucleotide [17]. Finally, reaction (17) models RNA
degradation as a single step reaction [18].
Repression is modeled via (18). It can compete with RNAp binding and, once the
repressor is bound, it blocks the RNAp movement. Dissociation of the repressor from the
template is modeled by (19). The footprint of the repressor is [n-Δrep, n+Δrep], where Δrep
is 10, within realistic intervals of footprints of repressors in E. coli [19]. The rate
constants for the reactions associate with repression are from [20].
Table S1. Reactions modeling transcription initiation, elongation, RNA degradation,
repression and unrepression. Reactions, rate constants (in s-1
), and delays (in s) used to
model transcription initiation, elongation, repression, and RNA degradation. Parameter
values were obtained from measurements in E. coli [4,10-14,17,18,20].
Event Reaction Rate constant
and delays
Binding (1) D D
b[n-Δ , n+Δ ] n
kRNAp + U O kb = 0.000075 s
-1
Unbinding (2) D D
fn [n-Δ , n+Δ ]
kO RNAp + U kf = 0.3 s
-1
Diffusion (3) D D
mn n+Δ +1 n+1 n-Δ
kO + U O + U km = 660 s
-1
Completion of closed complex
(4) D
cTSS+Δ c
kO RP kc = 0.5 s
-1
Isomerization (5) ic [TSS+1, TSS+19] i+
kRP U RP ki = 0.095 s
-1
Open complex formation (6) oi o
kRP RP ko = 2 s
-1
Collisions between diffusing
RNAps (7) D
D D
mn+2Δ 1 n
[n-Δ , n+Δ ]
+
+
k*O O
U RNAp
km = 660 s
-1
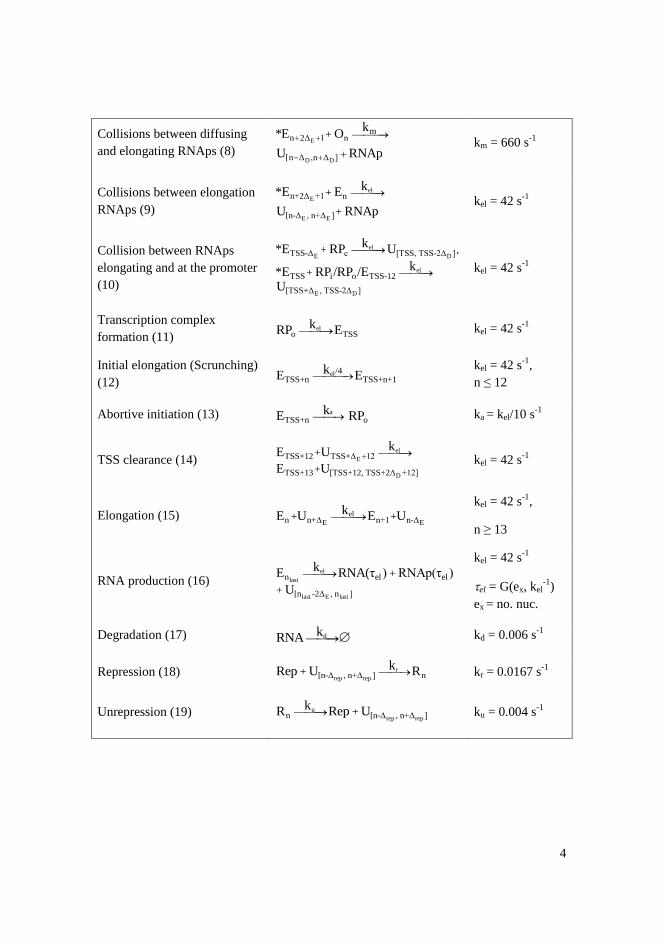
4
Collisions between diffusing
and elongating RNAps (8) E
D D
mn 2Δ 1 n
[n Δ ,n Δ ]
+ k
*E O
U RNAp
km = 660 s-1
Collisions between elongation
RNAps (9)
el
E
E E
n+2Δ +1 n
[n-Δ , n+Δ ]
+
+
k*E E
U RNAp
kel = 42 s
-1
Collision between RNAps
elongating and at the promoter
(10)
el
E D
el
E D
TSS-Δ c [TSS, TSS-2Δ ]
TSS i o TSS-12
[TSS+Δ , TSS-2Δ ]
+ ,
+
k*E RP U
k*E RP /RP /EU
kel = 42 s-1
Transcription complex
formation (11) el
o TSSkRP E kel = 42 s
-1
Initial elongation (Scrunching)
(12) el/4
TSS+n TSS+n+1kE E
kel = 42 s-1
,
n ≤ 12
Abortive initiation (13) a
TSS+n o kE RP ka = kel/10 s
-1
TSS clearance (14) el
E
D
TSS+12 TSS+Δ 12
TSS+13 [TSS+12, TSS+2Δ +12]
+
+
kE U
E U kel = 42 s
-1
Elongation (15) el
E En n+Δ n+1 n-Δ+ +kE U E U
kel = 42 s-1
,
n ≥ 13
RNA production (16) el
last
last E last
n el el
[n -2Δ , n ]
+
+
kE RNA(τ ) RNAp(τ )
U
kel = 42 s-1
el = G(ex, kel-1
)
ex = no. nuc.
Degradation (17) dkRNA kd = 0.006 s-1
Repression (18) r
rep rep[n-Δ , n+Δ ] n + kRep U R kr = 0.0167 s
-1
Unrepression (19) u
rep repn [n-Δ , n+Δ ] + kR Rep U ku = 0.004 s
-1
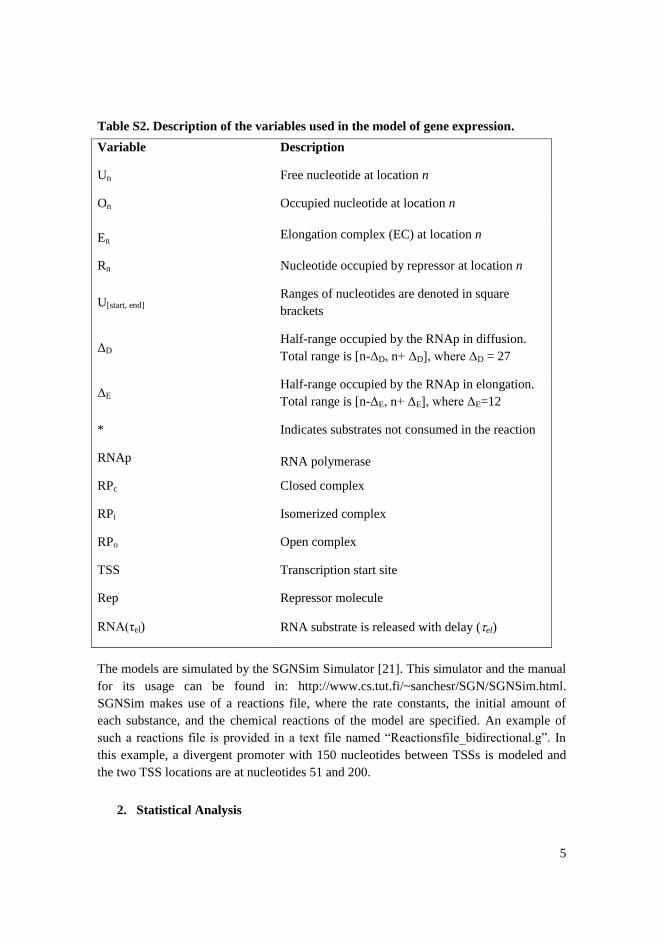
5
Table S2. Description of the variables used in the model of gene expression.
Variable Description
Un
Free nucleotide at location n
On
Occupied nucleotide at location n
En
Elongation complex (EC) at location n
Rn Nucleotide occupied by repressor at location n
U[start, end]
Ranges of nucleotides are denoted in square
brackets
ΔD
Half-range occupied by the RNAp in diffusion.
Total range is [n-ΔD, n+ ΔD], where ΔD = 27
ΔE
Half-range occupied by the RNAp in elongation.
Total range is [n-ΔE, n+ ΔE], where ΔE=12
*
Indicates substrates not consumed in the reaction
RNAp RNA polymerase
RPc
Closed complex
RPi
Isomerized complex
RPo Open complex
TSS
Transcription start site
Rep Repressor molecule
RNA(τel)
RNA substrate is released with delay (el)
The models are simulated by the SGNSim Simulator [21]. This simulator and the manual
for its usage can be found in: http://www.cs.tut.fi/~sanchesr/SGN/SGNSim.html.
SGNSim makes use of a reactions file, where the rate constants, the initial amount of
each substance, and the chemical reactions of the model are specified. An example of
such a reactions file is provided in a text file named “Reactionsfile_bidirectional.g”. In
this example, a divergent promoter with 150 nucleotides between TSSs is modeled and
the two TSS locations are at nucleotides 51 and 200.
2. Statistical Analysis

6
It is possible to compare our predictions regarding noise in transcript production between
closely spaced promoters (divergent and convergent) and unidirectional TSSs with
measurements of the cell-to-cell diversity in RNA numbers from these two sets of
promoters. Namely, we assessed from the data in (Taniguchi et al, 2010) whether the
noise levels in RNA numbers, as measured by the square of the coefficient of variation
(CV2), differed between closely spaced promoters and the others. By closely spaced
promoters we refer to pairs of promoters that are less than 500 nucleotides apart.
We thus assessed the null hypothesis (that the sets originate from the same distribution)
by the two-sample Kolmogorov-Smirnov (K-S) test (Matlab 2007a). The samples sizes
are 38 for closely spaced promoters and 99 for unidirectional promoters. Setting to
0.01, the K-S test confirms the goodness of fit between the two sample distributions (p-
value equal to 0.67). Thus, we conclude that there are no significant differences in the
kinetics of RNA production between these two sets of genes from the data in (Taniguchi
et al, 2010).
Next, we assessed whether there is any correlation between the distance between the two
TSSs and the observed noise in RNA numbers, as measured by the CV2 of the RNA
numbers in individual cells. For this, we selected all pairs of promoters’ separated by less
than 500 nucleotides and calculated the Pearson correlation between the length and the
CV2 values. The Pearson correlation coefficient of -0.1004 is indicative that these
measurements do not detect a strong correlation between the distance between TSSs and
the CV2.
References
1. Bai L, Santangelo TJ, Wang MD (2006) Single-molecule analysis of RNA
polymerase transcription. Annu Rev Biophys Biomol Struct 35: 343–360.
2. McClure WR (1985) Mechanism and control of transcription initiation in
prokaryotes. Ann Rev Biochem 54: 171-204.
3. Metzger W, Schickor P, Heumann HA (1989) Cinematographic view of
Escherichia coli RNA polymerase translocation. The EMBO Journal 8(9): 2745-
2754.
4. Singer P, Wu C-H (1987) Promoter Search by Escherichia coli RNA polymerase
on a Circular DNA Template. The Journal of Biological Chemistry 262(29):
14178-14189.
5. Gillespie DT (1977) Exact stochastic simulation of coupled chemical reactions. J
Phys Chem 81(25): 2340-2361.

7
6. Mäkelä J, Lloyd-Price J, Yli-Harja O, Ribeiro AS (2011) Stochastic sequence-
level model of coupled transcription and translation in prokaryotes. BMC
Bioinformatics 12: 121.
7. Carpousis AJ, Gralla JD (1985) Interaction of RNA polymerase with lacUV5
promoter DNA during mRNA initiation and elongation. Footprinting,
methylation, and rifampicin-sensitivity changes accompanying transcription
initiation. J Mol Biol 183(2): 165–177.
8. Record MT Jr, Reznikoff WS, Craig ML, McQuade KL and Schlax PJ (1996)
Escherichia coli RNA Polymerase (Eσ70), Promoters, and the Kinetics of the
Steps of Transcription Initiation. Second Edition of Escherichia coli and
Salmonella typhimurium. Cellular and Molecular Biology 2: 792-821.
9. Hsu LM (2002) Promoter clearance and escape in prokaryotes. Biochimica et
Biophysica Acta 1577: 191– 207.
10. Buc H, McClure WR (1985) Kinetics of Open Complex Formation between
Escherichia coli R N A Polymerase and the lac UV5 Promoter. Evidence for a
Sequential Mechanism Involving Three Steps. Biochemistry 24(11): 2712-2723.
11. Callen BP, Shearwin KE, Egan JB (2004) Transcriptional Interference between
Convergent Promoters Caused by Elongation over the Promoter. Molecular Cell
14: 647–656.
12. Kapanidis AN, Margeat E, Ho SO, Kortkhonjia E, Weiss S, Ebright RH (2006)
Initial transcription by RNA polymerase proceeds through a DNA-scrunching
mechanism. Science 314(5802): 1144-1147.
13. Revyakin A, Liu C, Ebright RH, Strick TR (2006) Abortive Initiation and
Productive Initiation by RNA polymerase Involve DNA Scrunching. Science 17
314(5802): 1139-1143.
14. Hsu LM, Cobb IM, Ozmore JR, Khoo M, Nahm G, et al. (2006) Initial transcribed
sequence mutations specifically affect promoter escape properties. Biochemistry
45(29): 8841-8854.
15. Xue X, Liu F and Ou-Yang Z (2008) A Kinetic Model of Transcription Initiation
by RNA Polymerase. J Mol Biol 378: 520–529.
16. Greive SJ, von Hippel PH (2005) Thinking quantitatively about transcriptional
regulation. Nature Reviews Molecular Cell Biology 6: 221-232.
17. Phroskin S, Rachid Rahmouni A, Mironov A, and Nudler E (2010) Cooperation
between translating ribosomes and RNA polymerase in transcription elongation.
Science 328(5977): 504-508.
18. Bernstein JA, Khodursky AB, Lin P, Lin-Chao S, Cohen SN (2002) Global
analysis of mRNA decay and abundance in Escherichia coli at single-gene
resolution using two-color fluorescent DNA microarrays. Proc Natl Acad Sci
USA 99(15): 9697-9702.
19. Carey J, Lewis DE, Lavoie TA, Yang J (1991) How does trp repressor bind to its

8
operator? J Biol Chem 266(36): 24509-24513.
20. So LH, Ghosh A, Zong C, Sepúlveda LA, Segev R, Golding I (2011) General
properties of transcriptional time series in Escherichia coli. Nat Genet 43(6): 554-
560.
21. Ribeiro AS and Lloyd-Price J (2007) SGN Sim, a Stochastic Genetic Networks
Simulator. Bioinformatics 23(6): 777-779.
Publication IV
J. Mäkelä, J. Lloyd-Price, O. Yli-Harja, and A.S. Ribeiro, “Stochastic sequence-level model of coupled transcription and translation in prokaryotes”, BMC Bioin-formatics 12:121, 2011.

RESEARCH ARTICLE Open Access
Stochastic sequence-level model of coupledtranscription and translation in prokaryotesJarno Mäkelä1, Jason Lloyd-Price1, Olli Yli-Harja1,2 and Andre S Ribeiro1*
Abstract
Background: In prokaryotes, transcription and translation are dynamically coupled, as the latter starts before theformer is complete. Also, from one transcript, several translation events occur in parallel. To study how events intranscription elongation affect translation elongation and fluctuations in protein levels, we propose a delayedstochastic model of prokaryotic transcription and translation at the nucleotide and codon level that includes thepromoter open complex formation and alternative pathways to elongation, namely pausing, arrests, editing,pyrophosphorolysis, RNA polymerase traffic, and premature termination. Stepwise translation can start after theribosome binding site is formed and accounts for variable codon translation rates, ribosome traffic, back-translocation, drop-off, and trans-translation.
Results: First, we show that the model accurately matches measurements of sequence-dependent translationelongation dynamics. Next, we characterize the degree of coupling between fluctuations in RNA and protein levels,and its dependence on the rates of transcription and translation initiation. Finally, modeling sequence-specifictranscriptional pauses, we find that these affect protein noise levels.
Conclusions: For parameter values within realistic intervals, transcription and translation are found to be tightlycoupled in Escherichia coli, as the noise in protein levels is mostly determined by the underlying noise in RNAlevels. Sequence-dependent events in transcription elongation, e.g. pauses, are found to cause tangible effects inthe degree of fluctuations in protein levels.
BackgroundIn prokaryotes, both transcription and translation arestochastic, multi-stepped processes that involve manycomponents and chemical interactions. Several events intranscription and in translation [1-8] are probabilistic innature, and their kinetics are sequence dependent. Oneexample is sequence-dependent transcriptional pausing[1]. When they occur, these events can affect the degreeof fluctuations of RNA and protein levels. Since noise ingene expression affects cellular phenotype, sequencedependent noise sources are subject to selection [9,10]and are thus evolvable [7]. Recent evidence suggests thatthese noise sources may be key for bacterial adaptabilityin unpredictable or fluctuating environmental conditions[11,12].
To better understand the evolvability of bacteria, it isimportant to understand how fluctuations in RNA levelspropagate to protein levels. Transcription and transla-tion are coupled in prokaryotes, in that translation caninitiate after the formation of the ribosome binding siteregion of the RNA, which occurs during the initialstages of transcription elongation. The extent to whichsequence-dependent events in transcription elongationaffect the noise in RNA, and consequently protein levelsis largely unknown. Due to this, it is also not yet wellunderstood how phenotypic diversity is regulated inmonoclonal bacterial populations.Two recent experiments have given a preliminary
glimpse at the dynamics of production of individual pro-teins [13] and RNA molecules [14] in vivo in bacteria.However, as of yet, there is no experimental setting tosimultaneously observe the production of both RNA andproteins at the molecular level. Further, in the afore-mentioned experiments [13,14], the rate of gene expres-sion was kept very weak, as otherwise the number of
* Correspondence: [email protected] Systems Biology Research Group, Department of SignalProcessing, Tampere University of Technology, FI-33101 Tampere, FinlandFull list of author information is available at the end of the article
Mäkelä et al. BMC Bioinformatics 2011, 12:121http://www.biomedcentral.com/1471-2105/12/121
© 2011 Mäkelä et al; licensee BioMed Central Ltd. This is an Open Access article distributed under the terms of the Creative CommonsAttribution License (http://creativecommons.org/licenses/by/2.0), which permits unrestricted use, distribution, and reproduction inany medium, provided the original work is properly cited.

molecules would not be easily quantifiable. This impliesthat they cannot be used to study the effects of eventssuch as the promoter open complex formation [15]. Thepresent shortcomings of these techniques enhance theneed for realistic models of gene expression inprokaryotes.Several measurements have shed light on the
dynamics of transcription and translation elongation[16,17], and revealed the occurrence of several stochasticevents during these processes, such as transcriptionalpauses [2,4]. The kinetics of RNA and protein degrada-tion are also better known [18]. These measurementsallowed the recent development of realistic kinetic mod-els of transcription at the nucleotide level [5,19] andtranslation at the codon level [20]. These models wereshown to match the measurements of RNA productionat the molecule level [6,21] and of translation elongationdynamics at the codon level [20]. In this regard, it wasshown that measurements of sequence dependent trans-lation rates of synonymous codons could be modeledwith neither deterministic nor uniform stochasticmodels [20], thus the need for models with explicittranslation elongation. Similarly, transcription elongationalso needs to be modeled explicitly to accurately capturethe fluctuations in RNA levels for fast transcriptioninitiation rates [5,19,22].Here, we propose a model of transcription and trans-
lation at the nucleotide and codon level for Escherichiacoli. The model of transcription is the same as in [5],and includes the promoter occupancy time, transcrip-tional pausing, arrests, editing, premature termination,pyrophosphorolysis, and accounts for the RNApfootprint in the DNA template. The model of translationat the codon level proposed here is based on the codon-dependent translation model proposed in [20], whichincludes translation initiation, codon-specific translationrates and the stepwise translation elongation and activa-tion. The model also accounts for the ribosome’s foot-print in the RNA template as well as the occupancytime of the ribosome binding site. Here, beside thesefeatures, we further include the processes of back-trans-location, drop-off, and trans-translation. Finally, weinclude protein folding and activation, as well as degra-dation, modeled as first-order processes, so as to studyfluctuations in the protein levels.The dynamics of the model follow the Delayed
Stochastic Simulation Algorithm [19,23] and is simu-lated by a modified version of SGNSim [24]. While themost relevant innovation is the coupling between realis-tic stochastic models of transcription and translation atthe nucleotide and codon levels, which allows the studyof previously unaddressed aspects of the dynamics ofgene expression in prokaryotes, this introduces a level ofcomplexity that required simulation capabilities that
SGNSim did not possess. Namely, the simulator isrequired to create and destroy compartments at runtime within the reaction vessel, where a separate set ofreactions can occur.We start by validating the dynamics of translation
elongation in the model. Next, using realistic parametervalues extracted from measurements, we address thefollowing questions: how different are the distributionsof time intervals between translation initiation eventsand between translation completion events, i.e., howstochastic is translation elongation? To what extent dofluctuations in temporal RNA levels propagate to tem-poral protein levels, and what physical parameters con-trol this propagation of noise between the two? Finally,we investigate whether transcriptional pauses have a sig-nificant effect on the dynamics of protein levels.
Results and discussionDynamics of transcript productionGiven the number of chemical reactions per nucleotidein the model and that one gene can have thousands ofnucleotides, the dynamics are considerably complex. Toillustrate this, we show examples of the kinetics ofmultiple RNAps on a DNA strand within a short timeinterval, and the dynamics of multiple ribosomes on oneof the RNA strands as it is transcribed. Parameter valueswere obtained from measurements in E. coli for LacZ(see methods section), since the dynamics of transcrip-tion and translation have been extensively studied forthis gene. LacZ has 3072 nucleotides and its transcrip-tion is controlled by the lac operon.In this simulation, transcription is not repressed.
Thus, provided that the promoter is available for tran-scription, the expected time for a transcription event tostart is approximately 2.5 s, given the value of the rateconstant of reaction (1) in Table 1 and that there are 28RNAp molecules available in the system [15]. Thepromoter open complex formation step, with a meanduration of 40 s [25] and a standard deviation of 4 s[21] is the major limiting factor of transcription eventsin these conditions.Figure 1A shows, for a time window of 400 seconds,
the positions (y-axis) over time (x-axis) of several RNApmolecules on the DNA template. In real time, this simu-lation takes ~30 s, on an Intel Core 2 Duo processor.Transcription elongation is visibly stochastic, withevents such as arrests (e.g. at t = ~450 s), ubiquitouspauses and pyrophosphorolysis. Several collisionsbetween RNAp molecules are also visible, caused in partby these events. Note that one RNAp never overtakesanother on the template.Figure 1B shows the distribution of the time intervals
between transcription initiation events, which is Gaus-sian-like, due to the open complex formation step. The
Mäkelä et al. BMC Bioinformatics 2011, 12:121http://www.biomedcentral.com/1471-2105/12/121
Page 2 of 13
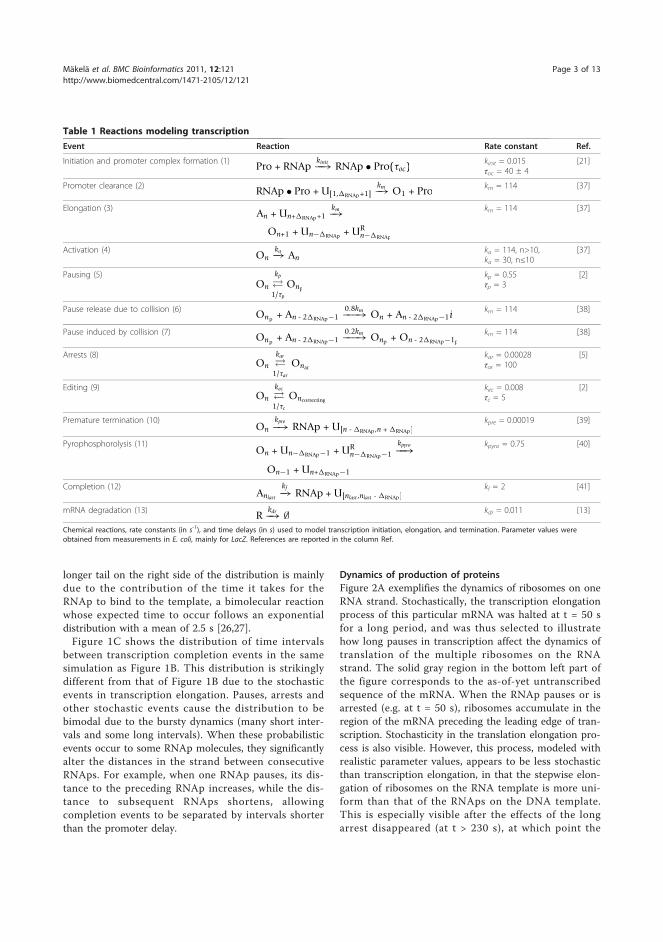
longer tail on the right side of the distribution is mainlydue to the contribution of the time it takes for theRNAp to bind to the template, a bimolecular reactionwhose expected time to occur follows an exponentialdistribution with a mean of 2.5 s [26,27].Figure 1C shows the distribution of time intervals
between transcription completion events in the samesimulation as Figure 1B. This distribution is strikinglydifferent from that of Figure 1B due to the stochasticevents in transcription elongation. Pauses, arrests andother stochastic events cause the distribution to bebimodal due to the bursty dynamics (many short inter-vals and some long intervals). When these probabilisticevents occur to some RNAp molecules, they significantlyalter the distances in the strand between consecutiveRNAps. For example, when one RNAp pauses, its dis-tance to the preceding RNAp increases, while the dis-tance to subsequent RNAps shortens, allowingcompletion events to be separated by intervals shorterthan the promoter delay.
Dynamics of production of proteinsFigure 2A exemplifies the dynamics of ribosomes on oneRNA strand. Stochastically, the transcription elongationprocess of this particular mRNA was halted at t = 50 sfor a long period, and was thus selected to illustratehow long pauses in transcription affect the dynamics oftranslation of the multiple ribosomes on the RNAstrand. The solid gray region in the bottom left part ofthe figure corresponds to the as-of-yet untranscribedsequence of the mRNA. When the RNAp pauses or isarrested (e.g. at t = 50 s), ribosomes accumulate in theregion of the mRNA preceding the leading edge of tran-scription. Stochasticity in the translation elongation pro-cess is also visible. However, this process, modeled withrealistic parameter values, appears to be less stochasticthan transcription elongation, in that the stepwise elon-gation of ribosomes on the RNA template is more uni-form than that of the RNAps on the DNA template.This is especially visible after the effects of the longarrest disappeared (at t > 230 s), at which point the
Table 1 Reactions modeling transcription
Event Reaction Rate constant Ref.
Initiation and promoter complex formation (1) Pro + RNApkinit−−→ RNAp • Pro(τoc)
kinit = 0.015τoc = 40 ± 4
[21]
Promoter clearance (2) RNAp • Pro + U[1,RNAp+1]km−→ O1 + Pro km = 114 [37]
Elongation (3) An + Un+RNAp+1km−→
On+1 + Un−RNAp + URn−RNAp
km = 114 [37]
Activation (4) Onka−→ An
ka = 114, n>10,ka = 30, n≤10
[37]
Pausing (5)On
kp
1/τp
Onp
kp = 0.55τp = 3
[2]
Pause release due to collision (6) Onp+ An - 2RNAp−1
0.8km−−−→ On + An - 2RNAp−1i km = 114 [38]
Pause induced by collision (7) Onp+ An - 2RNAp−1
0.2km−−−→ Onp + On - 2RNAp−1p
km = 114 [38]
Arrests (8)On
kar
1/τar
Onar
kar = 0.00028τar = 100
[5]
Editing (9)On
kec
1/τc
Oncorrecting
kec = 0.008τc = 5
[2]
Premature termination (10)On
kpre−→ RNAp + U[n - RNAp,n + RNAp]kpre = 0.00019 [39]
Pyrophosphorolysis (11)On + Un−RNAp−1 + UR
n−RNAp−1kpyro−−→
On−1 + Un+RNAp−1
kpyro = 0.75 [40]
Completion (12)Anlast
kf−→ RNAp + U[nlast ,nlast - RNAp]kf = 2 [41]
mRNA degradation (13) Rkdr−→ ∅ kdr = 0.011 [13]
Chemical reactions, rate constants (in s-1), and time delays (in s) used to model transcription initiation, elongation, and termination. Parameter values wereobtained from measurements in E. coli, mainly for LacZ. References are reported in the column Ref.
Mäkelä et al. BMC Bioinformatics 2011, 12:121http://www.biomedcentral.com/1471-2105/12/121
Page 3 of 13
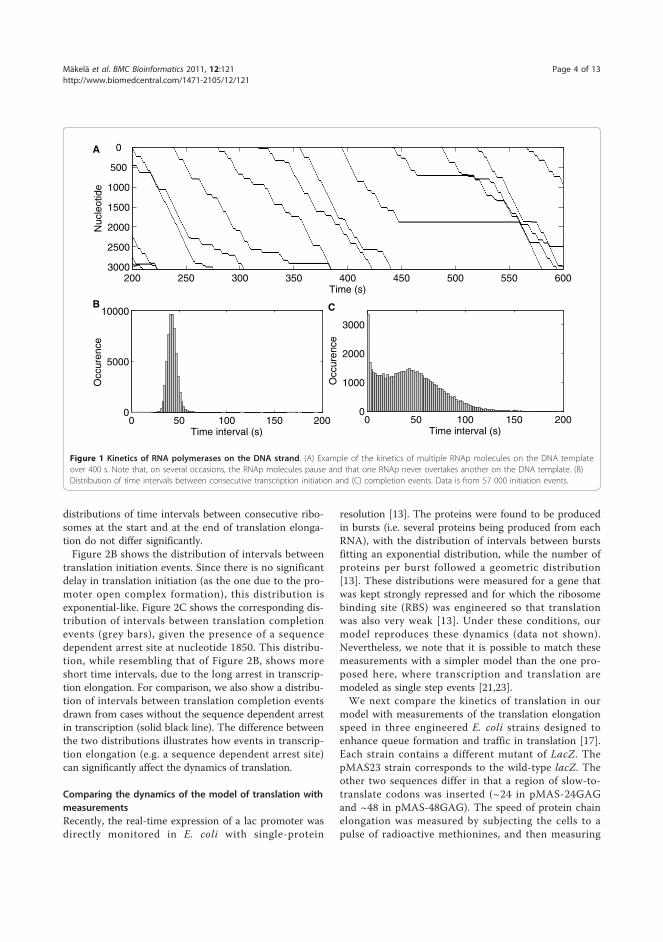
distributions of time intervals between consecutive ribo-somes at the start and at the end of translation elonga-tion do not differ significantly.Figure 2B shows the distribution of intervals between
translation initiation events. Since there is no significantdelay in translation initiation (as the one due to the pro-moter open complex formation), this distribution isexponential-like. Figure 2C shows the corresponding dis-tribution of intervals between translation completionevents (grey bars), given the presence of a sequencedependent arrest site at nucleotide 1850. This distribu-tion, while resembling that of Figure 2B, shows moreshort time intervals, due to the long arrest in transcrip-tion elongation. For comparison, we also show a distribu-tion of intervals between translation completion eventsdrawn from cases without the sequence dependent arrestin transcription (solid black line). The difference betweenthe two distributions illustrates how events in transcrip-tion elongation (e.g. a sequence dependent arrest site)can significantly affect the dynamics of translation.
Comparing the dynamics of the model of translation withmeasurementsRecently, the real-time expression of a lac promoter wasdirectly monitored in E. coli with single-protein
resolution [13]. The proteins were found to be producedin bursts (i.e. several proteins being produced from eachRNA), with the distribution of intervals between burstsfitting an exponential distribution, while the number ofproteins per burst followed a geometric distribution[13]. These distributions were measured for a gene thatwas kept strongly repressed and for which the ribosomebinding site (RBS) was engineered so that translationwas also very weak [13]. Under these conditions, ourmodel reproduces these dynamics (data not shown).Nevertheless, we note that it is possible to match thesemeasurements with a simpler model than the one pro-posed here, where transcription and translation aremodeled as single step events [21,23].We next compare the kinetics of translation in our
model with measurements of the translation elongationspeed in three engineered E. coli strains designed toenhance queue formation and traffic in translation [17].Each strain contains a different mutant of LacZ. ThepMAS23 strain corresponds to the wild-type lacZ. Theother two sequences differ in that a region of slow-to-translate codons was inserted (~24 in pMAS-24GAGand ~48 in pMAS-48GAG). The speed of protein chainelongation was measured by subjecting the cells to apulse of radioactive methionines, and then measuring
Time (s)
Nuc
leot
ide
200 250 300 350 400 450 500 550 600
0
500
1000
1500
2000
2500
3000
0 50 100 150 2000
5000
10000
Time interval (s)
Occ
uren
ce
0 50 100 150 2000
1000
2000
3000
Time interval (s)
Occ
uren
ce
A
B C
Figure 1 Kinetics of RNA polymerases on the DNA strand. (A) Example of the kinetics of multiple RNAp molecules on the DNA templateover 400 s. Note that, on several occasions, the RNAp molecules pause and that one RNAp never overtakes another on the DNA template. (B)Distribution of time intervals between consecutive transcription initiation and (C) completion events. Data is from 57 000 initiation events.
Mäkelä et al. BMC Bioinformatics 2011, 12:121http://www.biomedcentral.com/1471-2105/12/121
Page 4 of 13
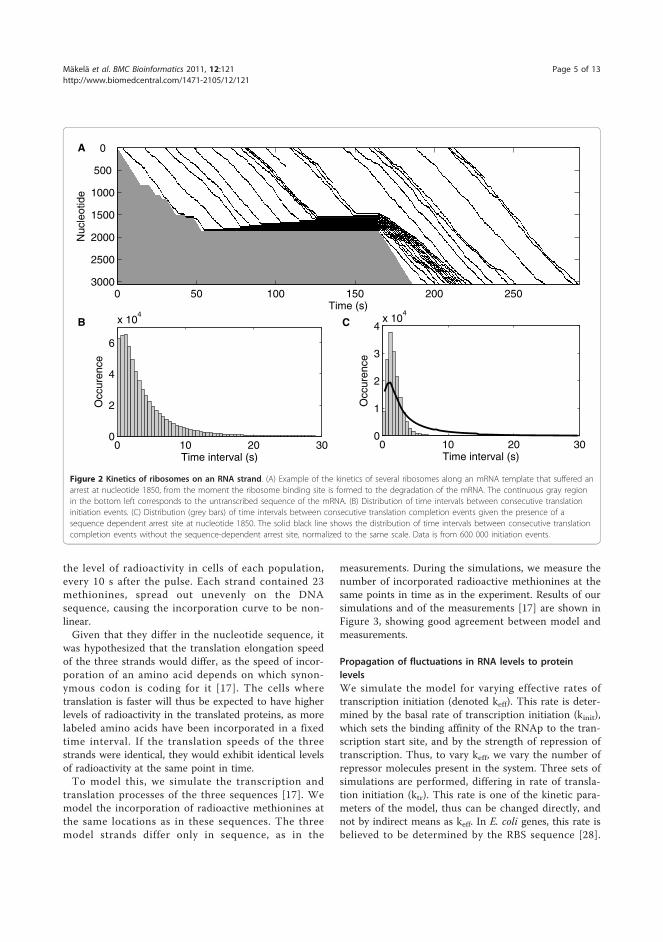
the level of radioactivity in cells of each population,every 10 s after the pulse. Each strand contained 23methionines, spread out unevenly on the DNAsequence, causing the incorporation curve to be non-linear.Given that they differ in the nucleotide sequence, it
was hypothesized that the translation elongation speedof the three strands would differ, as the speed of incor-poration of an amino acid depends on which synon-ymous codon is coding for it [17]. The cells wheretranslation is faster will thus be expected to have higherlevels of radioactivity in the translated proteins, as morelabeled amino acids have been incorporated in a fixedtime interval. If the translation speeds of the threestrands were identical, they would exhibit identical levelsof radioactivity at the same point in time.To model this, we simulate the transcription and
translation processes of the three sequences [17]. Wemodel the incorporation of radioactive methionines atthe same locations as in these sequences. The threemodel strands differ only in sequence, as in the
measurements. During the simulations, we measure thenumber of incorporated radioactive methionines at thesame points in time as in the experiment. Results of oursimulations and of the measurements [17] are shown inFigure 3, showing good agreement between model andmeasurements.
Propagation of fluctuations in RNA levels to proteinlevelsWe simulate the model for varying effective rates oftranscription initiation (denoted keff). This rate is deter-mined by the basal rate of transcription initiation (kinit),which sets the binding affinity of the RNAp to the tran-scription start site, and by the strength of repression oftranscription. Thus, to vary keff, we vary the number ofrepressor molecules present in the system. Three sets ofsimulations are performed, differing in rate of transla-tion initiation (ktr). This rate is one of the kinetic para-meters of the model, thus can be changed directly, andnot by indirect means as keff. In E. coli genes, this rate isbelieved to be determined by the RBS sequence [28].
Time (s)
Nuc
leot
ide
0 50 100 150 200 250
0
500
1000
1500
2000
2500
3000
0 10 20 300
2
4
6
x 104
Time interval (s)
Occ
uren
ce
0 10 20 300
1
2
3
4x 10
4
Time interval (s)
Occ
uren
ce
A
B C
Figure 2 Kinetics of ribosomes on an RNA strand. (A) Example of the kinetics of several ribosomes along an mRNA template that suffered anarrest at nucleotide 1850, from the moment the ribosome binding site is formed to the degradation of the mRNA. The continuous gray regionin the bottom left corresponds to the untranscribed sequence of the mRNA. (B) Distribution of time intervals between consecutive translationinitiation events. (C) Distribution (grey bars) of time intervals between consecutive translation completion events given the presence of asequence dependent arrest site at nucleotide 1850. The solid black line shows the distribution of time intervals between consecutive translationcompletion events without the sequence-dependent arrest site, normalized to the same scale. Data is from 600 000 initiation events.
Mäkelä et al. BMC Bioinformatics 2011, 12:121http://www.biomedcentral.com/1471-2105/12/121
Page 5 of 13
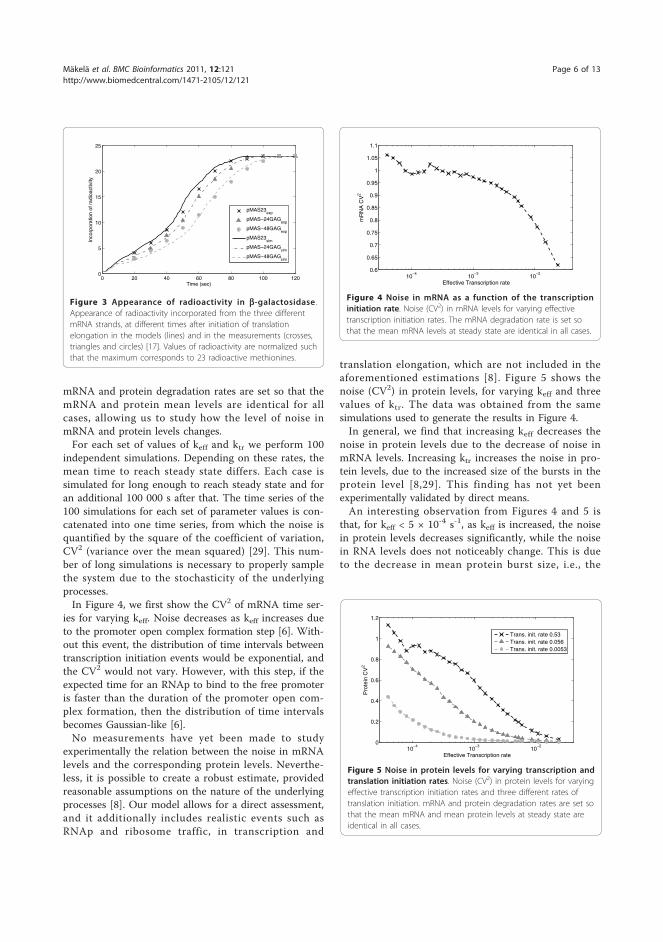
mRNA and protein degradation rates are set so that themRNA and protein mean levels are identical for allcases, allowing us to study how the level of noise inmRNA and protein levels changes.For each set of values of keff and ktr we perform 100
independent simulations. Depending on these rates, themean time to reach steady state differs. Each case issimulated for long enough to reach steady state and foran additional 100 000 s after that. The time series of the100 simulations for each set of parameter values is con-catenated into one time series, from which the noise isquantified by the square of the coefficient of variation,CV2 (variance over the mean squared) [29]. This num-ber of long simulations is necessary to properly samplethe system due to the stochasticity of the underlyingprocesses.In Figure 4, we first show the CV2 of mRNA time ser-
ies for varying keff. Noise decreases as keff increases dueto the promoter open complex formation step [6]. With-out this event, the distribution of time intervals betweentranscription initiation events would be exponential, andthe CV2 would not vary. However, with this step, if theexpected time for an RNAp to bind to the free promoteris faster than the duration of the promoter open com-plex formation, then the distribution of time intervalsbecomes Gaussian-like [6].No measurements have yet been made to study
experimentally the relation between the noise in mRNAlevels and the corresponding protein levels. Neverthe-less, it is possible to create a robust estimate, providedreasonable assumptions on the nature of the underlyingprocesses [8]. Our model allows for a direct assessment,and it additionally includes realistic events such asRNAp and ribosome traffic, in transcription and
translation elongation, which are not included in theaforementioned estimations [8]. Figure 5 shows thenoise (CV2) in protein levels, for varying keff and threevalues of ktr. The data was obtained from the samesimulations used to generate the results in Figure 4.In general, we find that increasing keff decreases the
noise in protein levels due to the decrease of noise inmRNA levels. Increasing ktr increases the noise in pro-tein levels, due to the increased size of the bursts in theprotein level [8,29]. This finding has not yet beenexperimentally validated by direct means.An interesting observation from Figures 4 and 5 is
that, for keff < 5 × 10⁻⁴ s-1, as keff is increased, the noisein protein levels decreases significantly, while the noisein RNA levels does not noticeably change. This is dueto the decrease in mean protein burst size, i.e., the
10−4
10−3
10−2
0.6
0.65
0.7
0.75
0.8
0.85
0.9
0.95
1
1.05
1.1
Effective Transcription rate
mR
NA
CV
2
Figure 4 Noise in mRNA as a function of the transcriptioninitiation rate. Noise (CV2) in mRNA levels for varying effectivetranscription initiation rates. The mRNA degradation rate is set sothat the mean mRNA levels at steady state are identical in all cases.
10−4
10−3
10−2
0
0.2
0.4
0.6
0.8
1
1.2
Effective Transcription rate
Pro
tein
CV
2
Trans. init. rate 0.53Trans. init. rate 0.056Trans. init. rate 0.0053
Figure 5 Noise in protein levels for varying transcription andtranslation initiation rates. Noise (CV2) in protein levels for varyingeffective transcription initiation rates and three different rates oftranslation initiation. mRNA and protein degradation rates are set sothat the mean mRNA and mean protein levels at steady state areidentical in all cases.
0 20 40 60 80 100 1200
5
10
15
20
25
Time (sec)
Inco
rpor
atio
n of
rad
ioac
tivity
pMAS23exp
pMAS−24GAGexp
pMAS−48GAGexp
pMAS23sim
pMAS−24GAGsim
pMAS−48GAGsim
Figure 3 Appearance of radioactivity in b-galactosidase .Appearance of radioactivity incorporated from the three differentmRNA strands, at different times after initiation of translationelongation in the models (lines) and in the measurements (crosses,triangles and circles) [17]. Values of radioactivity are normalized suchthat the maximum corresponds to 23 radioactive methionines.
Mäkelä et al. BMC Bioinformatics 2011, 12:121http://www.biomedcentral.com/1471-2105/12/121
Page 6 of 13
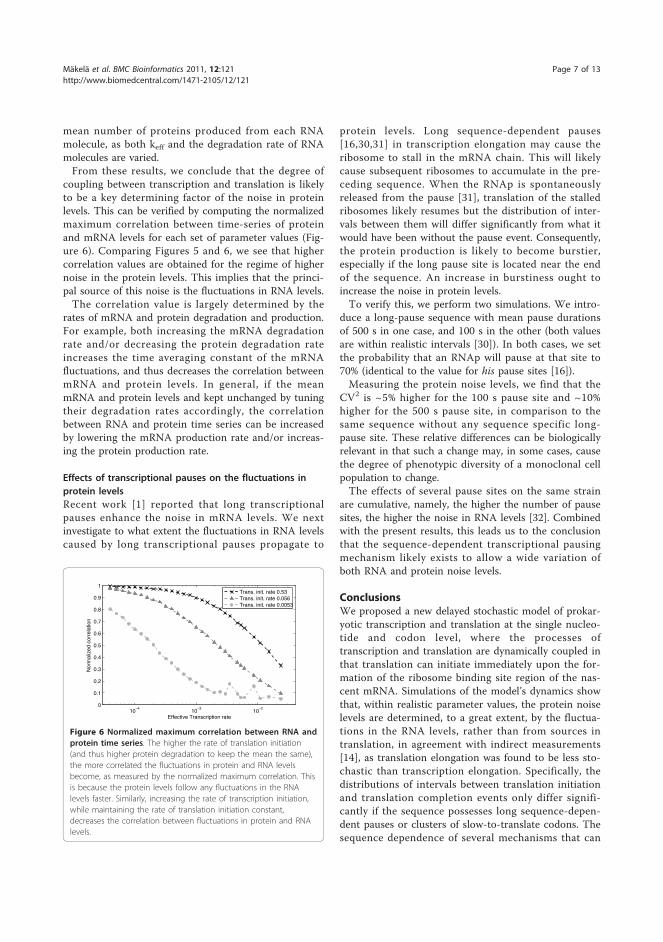
mean number of proteins produced from each RNAmolecule, as both keff and the degradation rate of RNAmolecules are varied.From these results, we conclude that the degree of
coupling between transcription and translation is likelyto be a key determining factor of the noise in proteinlevels. This can be verified by computing the normalizedmaximum correlation between time-series of proteinand mRNA levels for each set of parameter values (Fig-ure 6). Comparing Figures 5 and 6, we see that highercorrelation values are obtained for the regime of highernoise in the protein levels. This implies that the princi-pal source of this noise is the fluctuations in RNA levels.The correlation value is largely determined by the
rates of mRNA and protein degradation and production.For example, both increasing the mRNA degradationrate and/or decreasing the protein degradation rateincreases the time averaging constant of the mRNAfluctuations, and thus decreases the correlation betweenmRNA and protein levels. In general, if the meanmRNA and protein levels and kept unchanged by tuningtheir degradation rates accordingly, the correlationbetween RNA and protein time series can be increasedby lowering the mRNA production rate and/or increas-ing the protein production rate.
Effects of transcriptional pauses on the fluctuations inprotein levelsRecent work [1] reported that long transcriptionalpauses enhance the noise in mRNA levels. We nextinvestigate to what extent the fluctuations in RNA levelscaused by long transcriptional pauses propagate to
protein levels. Long sequence-dependent pauses[16,30,31] in transcription elongation may cause theribosome to stall in the mRNA chain. This will likelycause subsequent ribosomes to accumulate in the pre-ceding sequence. When the RNAp is spontaneouslyreleased from the pause [31], translation of the stalledribosomes likely resumes but the distribution of inter-vals between them will differ significantly from what itwould have been without the pause event. Consequently,the protein production is likely to become burstier,especially if the long pause site is located near the endof the sequence. An increase in burstiness ought toincrease the noise in protein levels.To verify this, we perform two simulations. We intro-
duce a long-pause sequence with mean pause durationsof 500 s in one case, and 100 s in the other (both valuesare within realistic intervals [30]). In both cases, we setthe probability that an RNAp will pause at that site to70% (identical to the value for his pause sites [16]).Measuring the protein noise levels, we find that the
CV2 is ~5% higher for the 100 s pause site and ~10%higher for the 500 s pause site, in comparison to thesame sequence without any sequence specific long-pause site. These relative differences can be biologicallyrelevant in that such a change may, in some cases, causethe degree of phenotypic diversity of a monoclonal cellpopulation to change.The effects of several pause sites on the same strain
are cumulative, namely, the higher the number of pausesites, the higher the noise in RNA levels [32]. Combinedwith the present results, this leads us to the conclusionthat the sequence-dependent transcriptional pausingmechanism likely exists to allow a wide variation ofboth RNA and protein noise levels.
ConclusionsWe proposed a new delayed stochastic model of prokar-yotic transcription and translation at the single nucleo-tide and codon level, where the processes oftranscription and translation are dynamically coupled inthat translation can initiate immediately upon the for-mation of the ribosome binding site region of the nas-cent mRNA. Simulations of the model’s dynamics showthat, within realistic parameter values, the protein noiselevels are determined, to a great extent, by the fluctua-tions in the RNA levels, rather than from sources intranslation, in agreement with indirect measurements[14], as translation elongation was found to be less sto-chastic than transcription elongation. Specifically, thedistributions of intervals between translation initiationand translation completion events only differ signifi-cantly if the sequence possesses long sequence-depen-dent pauses or clusters of slow-to-translate codons. Thesequence dependence of several mechanisms that can
10−4
10−3
10−2
0
0.1
0.2
0.3
0.4
0.5
0.6
0.7
0.8
0.9
1
Effective Transcription rate
Nor
mal
ized
cor
rela
tion
Trans. init. rate 0.53Trans. init. rate 0.056Trans. init. rate 0.0053
Figure 6 Normalized maximum correlation between RNA andprotein time series. The higher the rate of translation initiation(and thus higher protein degradation to keep the mean the same),the more correlated the fluctuations in protein and RNA levelsbecome, as measured by the normalized maximum correlation. Thisis because the protein levels follow any fluctuations in the RNAlevels faster. Similarly, increasing the rate of transcription initiation,while maintaining the rate of translation initiation constant,decreases the correlation between fluctuations in protein and RNAlevels.
Mäkelä et al. BMC Bioinformatics 2011, 12:121http://www.biomedcentral.com/1471-2105/12/121
Page 7 of 13
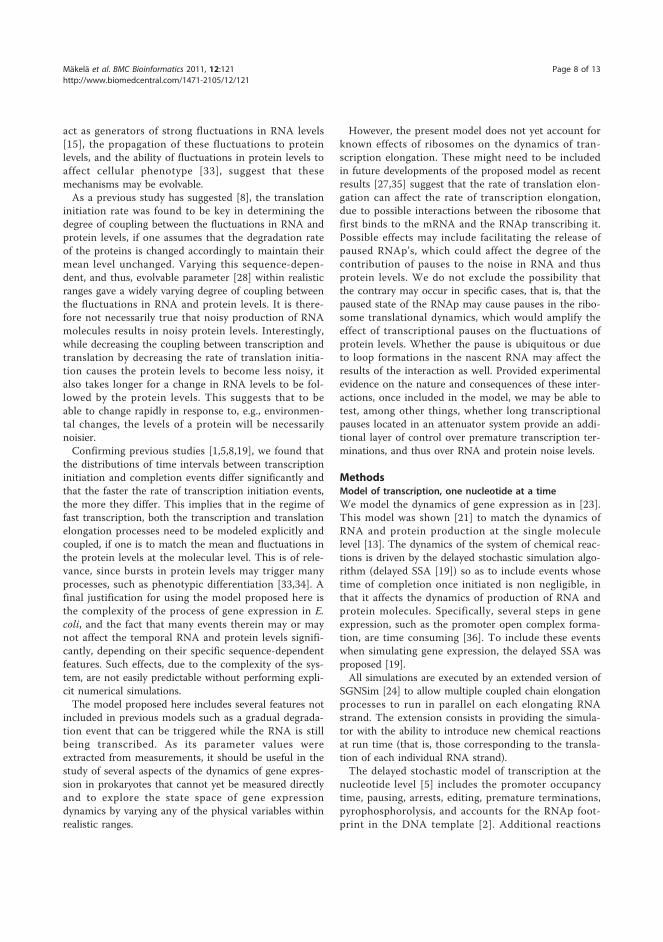
act as generators of strong fluctuations in RNA levels[15], the propagation of these fluctuations to proteinlevels, and the ability of fluctuations in protein levels toaffect cellular phenotype [33], suggest that thesemechanisms may be evolvable.As a previous study has suggested [8], the translation
initiation rate was found to be key in determining thedegree of coupling between the fluctuations in RNA andprotein levels, if one assumes that the degradation rateof the proteins is changed accordingly to maintain theirmean level unchanged. Varying this sequence-depen-dent, and thus, evolvable parameter [28] within realisticranges gave a widely varying degree of coupling betweenthe fluctuations in RNA and protein levels. It is there-fore not necessarily true that noisy production of RNAmolecules results in noisy protein levels. Interestingly,while decreasing the coupling between transcription andtranslation by decreasing the rate of translation initia-tion causes the protein levels to become less noisy, italso takes longer for a change in RNA levels to be fol-lowed by the protein levels. This suggests that to beable to change rapidly in response to, e.g., environmen-tal changes, the levels of a protein will be necessarilynoisier.Confirming previous studies [1,5,8,19], we found that
the distributions of time intervals between transcriptioninitiation and completion events differ significantly andthat the faster the rate of transcription initiation events,the more they differ. This implies that in the regime offast transcription, both the transcription and translationelongation processes need to be modeled explicitly andcoupled, if one is to match the mean and fluctuations inthe protein levels at the molecular level. This is of rele-vance, since bursts in protein levels may trigger manyprocesses, such as phenotypic differentiation [33,34]. Afinal justification for using the model proposed here isthe complexity of the process of gene expression in E.coli, and the fact that many events therein may or maynot affect the temporal RNA and protein levels signifi-cantly, depending on their specific sequence-dependentfeatures. Such effects, due to the complexity of the sys-tem, are not easily predictable without performing expli-cit numerical simulations.The model proposed here includes several features not
included in previous models such as a gradual degrada-tion event that can be triggered while the RNA is stillbeing transcribed. As its parameter values wereextracted from measurements, it should be useful in thestudy of several aspects of the dynamics of gene expres-sion in prokaryotes that cannot yet be measured directlyand to explore the state space of gene expressiondynamics by varying any of the physical variables withinrealistic ranges.
However, the present model does not yet account forknown effects of ribosomes on the dynamics of tran-scription elongation. These might need to be includedin future developments of the proposed model as recentresults [27,35] suggest that the rate of translation elon-gation can affect the rate of transcription elongation,due to possible interactions between the ribosome thatfirst binds to the mRNA and the RNAp transcribing it.Possible effects may include facilitating the release ofpaused RNAp’s, which could affect the degree of thecontribution of pauses to the noise in RNA and thusprotein levels. We do not exclude the possibility thatthe contrary may occur in specific cases, that is, that thepaused state of the RNAp may cause pauses in the ribo-some translational dynamics, which would amplify theeffect of transcriptional pauses on the fluctuations ofprotein levels. Whether the pause is ubiquitous or dueto loop formations in the nascent RNA may affect theresults of the interaction as well. Provided experimentalevidence on the nature and consequences of these inter-actions, once included in the model, we may be able totest, among other things, whether long transcriptionalpauses located in an attenuator system provide an addi-tional layer of control over premature transcription ter-minations, and thus over RNA and protein noise levels.
MethodsModel of transcription, one nucleotide at a timeWe model the dynamics of gene expression as in [23].This model was shown [21] to match the dynamics ofRNA and protein production at the single moleculelevel [13]. The dynamics of the system of chemical reac-tions is driven by the delayed stochastic simulation algo-rithm (delayed SSA [19]) so as to include events whosetime of completion once initiated is non negligible, inthat it affects the dynamics of production of RNA andprotein molecules. Specifically, several steps in geneexpression, such as the promoter open complex forma-tion, are time consuming [36]. To include these eventswhen simulating gene expression, the delayed SSA wasproposed [19].All simulations are executed by an extended version of
SGNSim [24] to allow multiple coupled chain elongationprocesses to run in parallel on each elongating RNAstrand. The extension consists in providing the simula-tor with the ability to introduce new chemical reactionsat run time (that is, those corresponding to the transla-tion of each individual RNA strand).The delayed stochastic model of transcription at the
nucleotide level [5] includes the promoter occupancytime, pausing, arrests, editing, premature terminations,pyrophosphorolysis, and accounts for the RNAp foot-print in the DNA template [2]. Additional reactions
Mäkelä et al. BMC Bioinformatics 2011, 12:121http://www.biomedcentral.com/1471-2105/12/121
Page 8 of 13

model the stepwise forward movement and activation ofthe RNAp, pausing and unpausing of the RNAp due tocollisions with adjacent RNAps, release of the promoterwhen the RNAp begins elongation, and error correction.The reactions, stochastic rate constants and time
delays, are shown in Table 1 and described in detail in[5,37-41]. Here, Pro stands for the promoter region,RNAp for the RNA polymerase, and RNAp·Pro for thepromoter region occupied by an RNAp. An, On and Un
stand for the nth nucleotide when activated, occupied,and unoccupied, respectively. Ranges of nucleotides aredenoted such as U[start, end], denoting a stretch of unoc-cupied nucleotides from indexes start to end. Onp, Onar
and Oncorrecting are used to represent a paused, arrested, orerror correcting RNAp at position n. On the template,each RNAp occupies (2ΔRNAp+1) nucleotides, whereΔRNAp = 12. These nucleotides cannot be occupied byany other RNAp at the same time. UR
n denotes tran-scribed ribonucleotides which are free (i.e., not underthe RNAp’s footprint). These transcribed ribonucleotidesare created in a separate part of the simulation (denotedby the R superscript), one separate set per RNA strand,so that we can simulate the translation of all individualRNA molecules independently and simultaneously.We use a delayed reaction event to model the first
step in transcription, the promoter closed and opencomplex formation (1). These processes could insteadbe modeled by a set of non-delayed, consecutive, reac-tions [42]. We use a delayed reaction as it was shown toaccurately model the dynamics of this process[19,21,23]. The duration of this step likely varies fromone event to the next, but while values for the meanduration are known, as of yet, there are no exact mea-surements of the standard deviation. Nevertheless, it islikely small compared to the mean, given the very smallstandard deviations of promoter activity [25]. For thesereasons, we set the promoter delay, τoc, as a randomvariable, following a normal distribution with a mean of40 s and a standard deviation of 4 s, whose value is ran-domly drawn each time a transcription event occurs.Once the first nucleotide is occupied via reaction (2),
stepwise elongation can begin (3). Also, as soon as thepromoter is released, a new transcription initiationevent can occur. Following each elongation step (3), anactivation step occurs (4), which is necessary for theRNAp to move along the template to the next nucleo-tide. The following events compete with stepwise elon-gation: pausing (5) and (7), released via (5) or (6),arrests and their release (8), editing (9), premature ter-minations (10), and pyrophosphorolysis (11).At the end of the elongation process, the RNAp is
released (12). mRNA degradation is modeled, for simpli-city, as a first order reaction (13). When (13) occurs, the
first few ribonucleotides of the RNA are immediatelyremoved from the system, preventing any new transla-tion event [43]. Thus, we model the degradation processsuch that it begins in the vicinity of the RBS and thengradually cuts the mRNA as it is being released fromthe ribosomes. This allows the translating ribosomes tocomplete protein production before the whole mRNA isdegraded. When the final ribosome unbinds from theRNA, the rest of the RNA strand, denoted by R in reac-tion (13), is destroyed.If the model of RNA degradation was such that some
of the ribosomes on the RNA template fell off whendegradation begins (i.e. due to endonucleatic cleavage ofthe RNA chain at a random position [43]), one conse-quence would be the reduction of the mean proteinburst size as these RNAs would contribute far fewerproteins than if the ribosomes were allowed to finishtranslating. This would likely result in a reduction ofprotein noise levels. Alternatively, the ribosome occu-pancy of the ribosome binding site might determinemRNA longevity [28]. In this case, for the same meanburst size, the noise is expected to increase since largebursts will get larger and small bursts will get smaller,likely increasing protein noise levels. We opted not toinclude these additions to the degradation model sincethey are not yet well characterized [43].Finally, we note that in present model we do not add
an explicit reaction for abortive initiation of transcrip-tion [44]. This could be done by adding a reaction (2b)which would compete with reaction (2). Its rate, kab,would be set so as to match the fraction of abortiveinitiations after the formation of the promoter opencomplex [44]:
RNAp • Pr okab−→ Pro + RNAp (2b)
For simplicity, we opted not to include this reaction inthe simulations, and instead set a value for the rate oftranscription initiation that matches realistic rates ofRNA production. From the point of view of RNA pro-duction, since (2b) competes with reaction (2), it wouldbe dynamically equivalent to decrease the rate of tran-scription initiation in (2) to account for the fraction ofabortive initiations.The model of transcription and the reaction rates in
Table 1 are described in greater detail in [5]. Parametervalues were obtained from measurements in E. coli,mainly for LacZ.
Model of translation, one codon at a timeThe stochastic model of translation at the codon levelincludes initiation (14) and stepwise translocation(codon incorporation) (15-17) followed by activation
Mäkelä et al. BMC Bioinformatics 2011, 12:121http://www.biomedcentral.com/1471-2105/12/121
Page 9 of 13
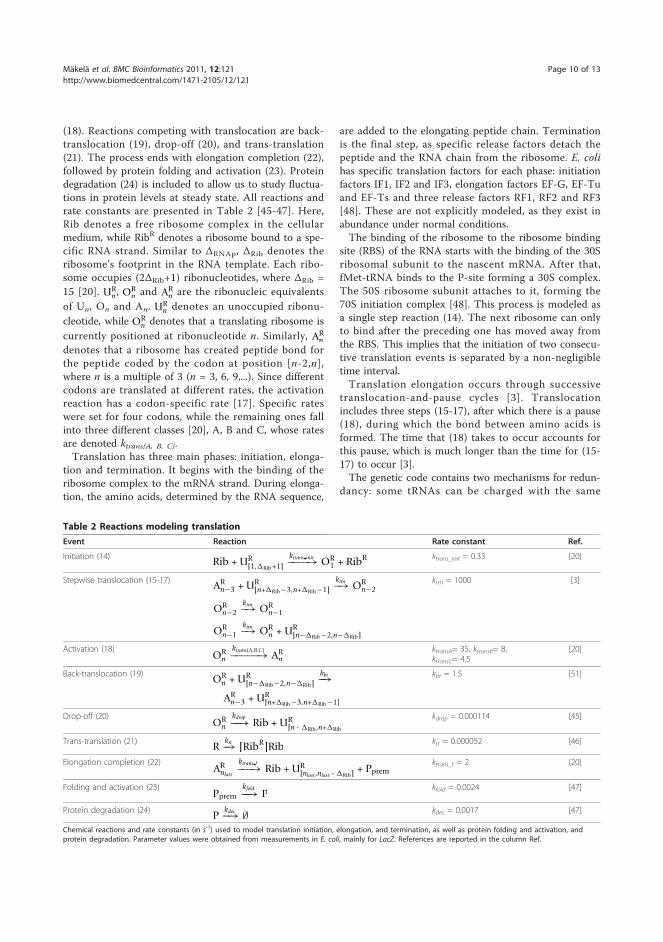
(18). Reactions competing with translocation are back-translocation (19), drop-off (20), and trans-translation(21). The process ends with elongation completion (22),followed by protein folding and activation (23). Proteindegradation (24) is included to allow us to study fluctua-tions in protein levels at steady state. All reactions andrate constants are presented in Table 2 [45-47]. Here,Rib denotes a free ribosome complex in the cellularmedium, while RibR denotes a ribosome bound to a spe-cific RNA strand. Similar to ΔRNAp, ΔRib denotes theribosome’s footprint in the RNA template. Each ribo-some occupies (2ΔRib+1) ribonucleotides, where ΔRib =15 [20]. UR
n , ORn and AR
n are the ribonucleic equivalentsof Un, On and An. UR
n denotes an unoccupied ribonu-cleotide, while OR
n denotes that a translating ribosome iscurrently positioned at ribonucleotide n. Similarly, AR
ndenotes that a ribosome has created peptide bond forthe peptide coded by the codon at position [n-2,n],where n is a multiple of 3 (n = 3, 6, 9,...). Since differentcodons are translated at different rates, the activationreaction has a codon-specific rate [17]. Specific rateswere set for four codons, while the remaining ones fallinto three different classes [20], A, B and C, whose ratesare denoted ktransA, B, C.Translation has three main phases: initiation, elonga-
tion and termination. It begins with the binding of theribosome complex to the mRNA strand. During elonga-tion, the amino acids, determined by the RNA sequence,
are added to the elongating peptide chain. Terminationis the final step, as specific release factors detach thepeptide and the RNA chain from the ribosome. E. colihas specific translation factors for each phase: initiationfactors IF1, IF2 and IF3, elongation factors EF-G, EF-Tuand EF-Ts and three release factors RF1, RF2 and RF3[48]. These are not explicitly modeled, as they exist inabundance under normal conditions.The binding of the ribosome to the ribosome binding
site (RBS) of the RNA starts with the binding of the 30Sribosomal subunit to the nascent mRNA. After that,fMet-tRNA binds to the P-site forming a 30S complex.The 50S ribosome subunit attaches to it, forming the70S initiation complex [48]. This process is modeled asa single step reaction (14). The next ribosome can onlyto bind after the preceding one has moved away fromthe RBS. This implies that the initiation of two consecu-tive translation events is separated by a non-negligibletime interval.Translation elongation occurs through successive
translocation-and-pause cycles [3]. Translocationincludes three steps (15-17), after which there is a pause(18), during which the bond between amino acids isformed. The time that (18) takes to occur accounts forthis pause, which is much longer than the time for (15-17) to occur [3].The genetic code contains two mechanisms for redun-
dancy: some tRNAs can be charged with the same
Table 2 Reactions modeling translation
Event Reaction Rate constant Ref.
Initiation (14) Rib + UR[1,Rib+1]
ktrans init−−−−→ OR1 + RibR ktrans_init = 0.33 [20]
Stepwise translocation (15-17) ARn−3 + UR
[n+Rib−3,n+Rib−1]ktm−→ OR
n−2
ORn−2
ktm−→ ORn−1
ORn−1
ktm−→ ORn + UR
[n−Rib−2,n−Rib]
ktm = 1000 [3]
Activation (18)OR
nktransA,B,C−−−−−→ AR
nktransA= 35, ktransB= 8,ktransC= 4.5
[20]
Back-translocation (19) ORn + UR
[n−Rib−2,n−Rib]kbt−→
ARn−3 + UR
[n+Rib−3,n+Rib−1]
kbt = 1.5 [51]
Drop-off (20)OR
n
kdrop−−→ Rib + UR[n - Rib,n+Rib]
kdrop = 0.000114 [45]
Trans-translation (21) Rktt−→ [RibR]Rib ktt = 0.000052 [46]
Elongation completion (22)AR
nlast
ktrans f−−−→ Rib + UR[nlast ,nlast - Rib] + Pprem
ktrans_f = 2 [20]
Folding and activation (23)Pprem
kfold−−→ Pkfold = 0.0024 [47]
Protein degradation (24) Pkdec−→ ∅ kdec = 0.0017 [47]
Chemical reactions and rate constants (in s-1) used to model translation initiation, elongation, and termination, as well as protein folding and activation, andprotein degradation. Parameter values were obtained from measurements in E. coli, mainly for LacZ. References are reported in the column Ref.
Mäkelä et al. BMC Bioinformatics 2011, 12:121http://www.biomedcentral.com/1471-2105/12/121
Page 10 of 13
amino acid, and a single tRNA can recognize more thanone codon due to a “wobble” effect in position three ofthe anti-codon [48]. The net effect is that multiplecodons code for the same amino acid. These codons arecalled synonymous codons. Synonymous codons read bythe same tRNA have been shown to translate at signifi-cantly different rates [17], implying that our model mustincorporate per-codon translation rates for reaction (18),rather than per-tRNA or per-amino acid rates. Only afew of these translation rates have been measureddirectly [17] but indirect assessment is available [20]. Inour case, we assume normal cellular conditions, includ-ing an abundance of charged tRNA, implying that we donot need to model the tRNA explicitly.Since each codon is translated at a different rate, the
codon frequency also needs to be accounted for expli-citly [49]. In the model, the sequence can either be ran-domly generated or selected from a known gene. In theformer case, the sequence is randomly generatedaccording to the known statistical frequency of eachcodon in E. coli.The competing reactions of stepwise translation elon-
gation are back-translocation (19), drop-off (20) andtrans-translation (21), which are explicitly modeled.Back-translocation generally occurs when the tRNA hasnot yet locked into the peptide chain, causing the ribo-some to move backwards on the mRNA template to theposition of the previous codon. While the occurrence ofback-translocation has been observed and can be pro-moted by certain antibiotics [50-52], its exact causesremain somewhat unknown. Nevertheless, the kineticrates for translocation and back-translocation have beenmeasured under various conditions [51]. Alternatively,the ribosomes can randomly dissociate from the RNA,in a process called drop-off, modeled by reaction (20).The overall rate of drop-off has been measured in [45],from which we have inferred a per-codon rate.Trans-translation is the process by which the ribosome
is released from the RNA template after stalling, whichcan occur for a variety of reasons, such as the incorpora-tion of an incorrect codon, premature mRNA degradation,or spontaneous frameshifting [53]. Trans-translation isexecuted by the tmRNA that, together with SmpB and EF-Tu, binds to the A-site of the ribosome and releases itfrom the mRNA [53]. Once the ribosome is released, themRNA is degraded. In the model, stalling followed bytrans-translation can occur spontaneously with a givenprobability at any codon via reaction (21). When this reac-tion occurs, the RNA strand is immediately destroyed inthe simulation, and all translating ribosomes are releasedback into the cellular medium, denoted in reaction (21) by[RibR]Rib, where [RibR] denotes the number of ribosomesbound to the RNA at that moment.
Translation elongation continues until the STOPcodon is reached (22), after which RF1 or RF2 bindsand releases the ribosome together with RF3 [48]. Theseare not modeled explicitly in the model. Its kinetic rateis higher than initiation, preventing queuing near thestop codon [20]. Reaction (22) is followed by foldingand activation (23), modeled as a first order process forsimplicity [21]. The rate of this reaction is set to modelthe maturation time of GFP, as most measurements ofprotein expression at the single cell level use this pro-tein. Pprem denotes the unfolded protein, while Pdenotes the complete activated protein, which can thendegrade via reaction (24).Given the above, we note that the dynamics of tran-
scription and translation are sequence dependent in thepresent model in the following ways. First, the modelallows the insertion of, e.g., arrests or sequence specificpauses at a specific nucleotide (exemplified in the lastsection of the results section). In general, since the ratesof all possible events are defined uniquely for eachnucleotide, any event may be set to have a distinct pro-pensity at a specific nucleotide rather than a constantrate for all nucleotides. Translation elongation is, in thesame manner, sequence dependent, with the additionalfeature that the rates of elongation in this case arealways codon dependent.The chemical reactions and rate constants (in s-1) used
to model translation initiation, elongation, and termina-tion, as well as protein folding and activation and pro-tein degradation are in Table 2. Parameter values wereobtained from measurements in E. coli, mainly for LacZ.
Quantifying the correlation between protein and mRNAlevelsProtein levels do not respond instantaneously to changesin the number of mRNA molecules in the system sincenew proteins take time to synthesize after a new mRNAis produced, and excess proteins take time to degradeafter an mRNA has been degraded. Instead, the fluctua-tions in protein levels result from a time averaging ofthe fluctuations in mRNA levels [8]. The degree towhich fluctuations propagate from RNA to proteinlevels depends on various parameters, the most relevantbeing the ratio between the degradation rates of theproteins and RNAs. Changing this ratio is likely to affectthe degree of correlation between the RNA and proteintime series.To assess the extent to which fluctuations in RNA
levels are propagated to protein levels, we compute thenormalized discrete cross-correlation [54] between thetime series of RNA and protein numbers. The normal-ized cross-correlation function r for m pairs of time ser-ies (x and y) of discrete signals of length n is given by:
Mäkelä et al. BMC Bioinformatics 2011, 12:121http://www.biomedcentral.com/1471-2105/12/121
Page 11 of 13
r [τ ] =
N∑l=1
n−τ∑k=1
(xl[k] − mx1,...,N[1,...,n−τ ]
) (yl[k + τ ] − my1,...,N[1+τ ,...,n]
)
((n - τ ) N − 1) sx1,...,N[1,...,n−τ ]sy1,...,N[1+τ ,...,n]
(25)
where τ Î 0,..., n-1 is the lag, and mw and sw are thesample mean and sample standard deviation of w,respectively, defined by:
mw1...N[i...j].=
1(j − i + 1)N
N∑l=1
j∑k=i
wl[k] (26)
sw1...N[i...j].=
√√√√ 1(j − i + 1)N − 1
N∑l=1
j∑k=i
(wl[k] − mw1...N[i...j]
)2 (27)
AcknowledgementsThis work was supported by the Academy of Finland (JLP, ASR) and by theFiDiPro programme of Finnish Funding Agency for Technology andInnovation (JM, OYH, and ASR). The funders had no role in study design,data collection and analysis, decision to publish, or preparation of themanuscript.
Author details1Computational Systems Biology Research Group, Department of SignalProcessing, Tampere University of Technology, FI-33101 Tampere, Finland.2Institute for Systems Biology, 1441N 34th St, Seattle, WA, 98103-8904, USA.
Authors’ contributionsAll authors contributed in the design of the study, data acquisition andinterpretation, and participated in the drafting of the article. All authors haveread and approved the final manuscript.
Received: 19 November 2010 Accepted: 26 April 2011Published: 26 April 2011
References1. Rajala T, Häkkinen A, Healy S, Yli-Harja O, Ribeiro AS: Effects of
transcriptional pausing on gene expression dynamics. PLOS Comput Biol2010, 6(3):e1000704.
2. Greive SJ, von Hippel PH: Thinking quantitatively about transcriptionalregulation. Nat Rev Mol Cell Biol 2005, 6:221-232.
3. Wen JD, Lancaster L, Hodges C, Zeri AC, Yoshimura SH, Noller HF,Bustamante C, Tinoco I Jr: Following translation by single ribosomes onecodon at a time. Nature 2008, 452:598-603.
4. Landick R: The regulatory roles and mechanism of transcriptionalpausing. Biochem Soc Trans 2006, 34(6):1062-1066.
5. Ribeiro AS, Rajala T, Smolander OP, Häkkinen A, Yli-Harja O: DelayedStochastic Model of Transcription at the Single Nucleotide Level. JComput Biol 2009, 16:539-553.
6. Ribeiro AS, Häkkinen A, Mannerstrom H, Lloyd-Price J, Yli-Harja O: Effects ofthe promoter open complex formation on gene expression dynamics.Phys Rev E 2010, 81(1):011912.
7. Kaern M, Elston TC, Blake WJ, Collins JJ: Stochasticity in gene expression:from theories to phenotypes. Nat Rev Genet 2005, 6:451-464.
8. Pedraza J, Paulsson J: Effects of Molecular Memory and Bursting onFluctuations in Gene Expression. Science 2008, 319:339-334.
9. Murphy KF, Balazsi G, Collins JJ: Combinatorial promoter design forengineering noisy gene expression. Proc Natl Acad Sci USA 2007,104:12726-12731.
10. Mayr E: What evolution is Basic Books, NY, USA; 2001.11. Lee HH, Molla MN, Cantor CR, Collins JJ: Bacterial charity work leads to
population-wide resistance. Nature 2010, 467:82-86.12. Acar M, Mettetal J, van Oudenaarden A: Stochastic switching as a survival
strategy in fluctuating environments. Nature Genetics 2008, 40:471-475.
13. Yu J, Xiao J, Ren X, Lao K, Xie XS: Probing gene expression in live cells,one protein molecule at a time. Science 2006, 311:1600-1603.
14. Golding I, Paulsson J, Zawilski SM, Cox EC: Real-time kinetics of geneactivity in individual bacteria. Cell 2005, 123:1025-1036.
15. Ribeiro AS: Stochastic and delayed stochastic models of gene expressionand regulation. Mathematical Biosciences 2010, 223(1):1-11.
16. Herbert KM, La Porta A, Wong BJ, Mooney RA, Neuman KC, Landick R,Block SM: Sequence-resolved detection of pausing by single RNApolymerase molecules. Cell 2006, 125:1083-1094.
17. Sorensen MA, Pedersen S: Absolute in vivo translation rates of individualcodons in Escherichia coli. J Mol Biol 1991, 222:265-280.
18. Bernstein J, Khodursky A, Lin P, Lin-Chao S, Cohen S: Global analysis ofmRNA decay and abundance in Escherichia coli at single-generesolution using two-color fluorescent DNA microarrays. Proc Natl AcadSci USA 2002, 99:9697-9702.
19. Roussel MR, Zhu R: Validation of an algorithm for delay stochasticsimulation of transcription and translation in prokaryotic geneexpression. Phys Biol 2006, 3:274-284.
20. Mitarai N, Sneppen K, Pedersen S: Ribosome collisions and translationefficiency: optimization by codon usage and mRNA destabilization. J MolBiol 2008, 382(1):236-245.
21. Zhu R, Ribeiro AS, Salahub D, Kauffman SA: Studying genetic regulatorynetworks at the molecular level: delayed reaction stochastic models. JTheor Biol 2007, 246:725-745.
22. Voliotis M, Cohen N, Molina-Paris C, Liverpool TB: Fluctuations, pauses andbacktracking in DNA transcription. Biophys J 2008, 94:334-348.
23. Ribeiro AS, Zhu R, Kauffman SA: A general modeling strategy for generegulatory networks with stochastic dynamics. J Comput Biol 2006,13:1630-1639.
24. Ribeiro AS, Lloyd-Price J: SGN Sim, a Stochastic Genetic NetworksSimulator. Bioinformatics 2007, 23(6):777-779.
25. Lutz R, Lozinski T, Ellinger T, Bujard H: Dissecting the functional programof Escherichia coli promoters: the combined mode of action of Lacrepressor and AraC activator. Nuc Ac Res 2001, 29:3873-3881.
26. Gillespie DT: Exact stochastic simulation of coupled chemical reactions. JPhys Chem 1977, 81:2340-2361.
27. Arkin A, Ross J, McAdams H: Stochastic kinetic analysis of developmentalpathway bifurcation in phage λ-infected E. coli cells. Genetics 1998,149:1633-1648.
28. Yarchuk O, Jacques N, Guillerez J, Dreyfus M: Interdependence oftranslation, transcription and mRNA degradation in the lacZ gene. J MolBiol 1992, 226:581-596.
29. Paulsson J: Models of stochastic gene expression. Phys Life Rev 2005,2(2):157-175.
30. Shaevitz JW, Abbondanzieri EA, Landick R, Block SM: Backtracking bysingle RNA polymerase molecules observed at near-base-pair resolution.Nature 2003, 426:684-687.
31. Landick R: Transcriptional pausing without backtracking. Proc Natl AcadSci USA 2009, 106(22):8797-8798.
32. Ribeiro AS, Häkkinen A, Healy S, Yli-Harja O: Dynamical effects oftranscriptional pause-prone sites. Comput Biol Chem 2010, 34(3):143-148.
33. Choi PJ, Cai L, Frieda K, Xie XS: A Stochastic Single-Molecule Event TriggersPhenotype Switching of a Bacterial Cell. Science 2008, 322(5900):442-446.
34. Xie XS, Choi PJ, Li GW, Lee NK, Lia G: Single-molecule approach tomolecular biology in living bacterial cells. Annu Rev Biophys 2008,37:417-444.
35. Burmann BM, Schweimer K, Luo X, Wahl MC, Stitt BL, Gottesman ME,Rösch P: A NusE:NusG Complex Links Transcription and Translation.Science 2010, 328(5977):501-504.
36. Ota K, Yamada T, Yamanishi Y, Goto S, Kanehisa M: ComprehensiveAnalysis of Delay in Transcriptional Regulation Using Expression Profiles.Genome Informatics 2003, 14:302-303.
37. Phroskin S, Rachid Rahmouni A, Mironov A, Nudler E: Cooperationbetween translating ribosomes and RNA polymerase in transcriptionelongation. Science 2010, 328(5977):504-508.
38. Epshtein V, Nudler E: Cooperation between RNA polymerase molecules intranscription elongation. Science 2003, 300(5620):801-805.
39. Lewin B: Genes IX Jones and Bartlett Publishers, USA; 2008, 256-299.40. Erie DA, Hajiseyedjavadi O, Young MC, von Hippel PH: Multiple RNA
polymerase conformations and GreA: control of the fidelity oftranscription. Science 1993, 262:867-873.
Mäkelä et al. BMC Bioinformatics 2011, 12:121http://www.biomedcentral.com/1471-2105/12/121
Page 12 of 13
41. Greive SJ, Weitzel SE, Goodarzi JP, Main LJ, Pasman Z, von Hippel PH:Monitoring RNA transcription in real time by using surface plasmonresonance. Proc Natl Acad Sci USA 2008, 105:3315-3320.
42. McClure WR: Rate-limiting steps in RNA chain initiation. Proc Natl Acad SciUSA 1980, 77:5634-5638.
43. Balesco JG: All things must pass: Contrasts and commonalities ineukaryotic and bacterial mRNA decay. Nat Rev Mol Cell Biol 2010,11(7):467-478.
44. Hsu LM: Promoter clearance and escape in prokaryotes. Biochimica etBiophysica Acta - Gene Structure and Expression 2002, 1577(2):191-207.
45. Jorgensen F, Kurland CG: Processivity errors of gene expression inEscherichia coli. J Mol Biol 1990, 215:511-521.
46. Moore SD, Sauer RT: Ribosome rescue: tmRNA tagging activity andcapacity in Escherichia coli. Mol Microbiol 2005, 58:456-466.
47. Cormack BP, Valdivia RH, Falkow S: FACS-optimized mutants of the greenfluorescent protein (GFP). Gene 1996, 173(1):33-38.
48. Alberts B, Johnson A, Lewis J, Raff M, Roberts K, Walter P: Molecular biologyof the cell Garland Science, USA; 2002.
49. Sorensen MA, Kurland CG, Pedersen S: Codon usage determinestranslation rate in Escherichia coli. J Mol Biol 1989, 207:365-377.
50. Menninger JR: Peptidyl transfer RNA dissociates during protein synthesisfrom ribosomes of Escherichia coli. J Biol Chem 1976, 251:3392-3398.
51. Shoji S, Walker SE, Fredrick K: Ribosomal translocation: One step closer tothe molecular mechanism. ACS Chem Biol 2009, 4:93-107.
52. Qin Y, Polacek N, Vesper O, Staub E, Einfeldt E, Wilson DN, Nierhaus KH: Thehighly conserved LepA is a ribosomal elongation factor that back-translocates the ribosome. Cell 2006, 127:721-733.
53. Keiler KC: Biology of trans-translation. Annu Rev Microbiol 2008, 62:133-151.54. Bracewell R: Pentagram Notation for Cross Correlation. The Fourier Transform
and Its Applications New York: McGraw-Hill; 1965, 46-243.
doi:10.1186/1471-2105-12-121Cite this article as: Mäkelä et al.: Stochastic sequence-level model ofcoupled transcription and translation in prokaryotes. BMC Bioinformatics2011 12:121.
Submit your next manuscript to BioMed Centraland take full advantage of:
• Convenient online submission
• Thorough peer review
• No space constraints or color figure charges
• Immediate publication on acceptance
• Inclusion in PubMed, CAS, Scopus and Google Scholar
• Research which is freely available for redistribution
Submit your manuscript at www.biomedcentral.com/submit
Mäkelä et al. BMC Bioinformatics 2011, 12:121http://www.biomedcentral.com/1471-2105/12/121
Page 13 of 13

ISBN 978-952-15-3794-3ISSN 1459-2045
Tampereen teknillinen yliopisto PL 52733101 Tampere
Tampere University of TechnologyP.O.B. 527FI-33101 Tampere, Finland