Embed Size (px)
Citation preview
RESEARCH Open Access
On valuing biopharmaceutical productpipelines: an effectuation model andevidenceMark J. Ahn1, Anne S. York2, Wei Wu3, Yulianto Suharto1 and Tugrul Daim1*
* Correspondence:[email protected] State University, Portland,USAFull list of author information isavailable at the end of the article
Abstract
New creative approaches are needed to manage emerging biotechnologyinnovations, regulations, and payor environments to enhance product pipelineproductivity, valuation, and risk management. Biopharmaceutical firms must makedynamic resource allocation decisions on their relative levels of internal R&D andexternal strategic alliances in furthering their pipelines. As the predominant methodof using discounted cash flow (DCF) methodologies may lead to chronicunderinvestment and performance, we evaluated the integration of traditional DCFwith an effectuation model of analysis. Unlike traditional financial models that beginwith the end goal of assumed known cash flows and recursively solve for portfoliooptimization, the effectuation model—means, affordable loss, partnerships, andexpect the unexpected—begins with resources that are readily available to the firmand then seeks to maintain strategic flexibility to take advantage of environmentalcontingencies as they arise. Using effectuation principles can provide insight intooptimizing pipeline decisions by focusing on the logic of control rather than thelogic of prediction. Using empirical data, we found that investors were able toeffectively differentiate between the pipeline values of among companies. Overall,these results suggest that the integration of effectuation and DCF provides a lensfrom which to explore emerging varieties of small and large company innovation inthe biopharmaceutical industry.
BackgroundAs many of the past decade’s blockbuster drugs, including Pfizer’s $12 billion Lipitor,
continue to come off patent, concerns are growing as to whether and how the bio-
pharma industry will replace revenues lost to generics (Kirchhoff and Schiereck, 2011).
A report of the President’s Council of Advisors (2012) on science and technology
warns, “The pharmaceutical industry is facing the largest ‘patent cliff ’ in its history:
drugs with annual sales exceeding $200 billion will come off patent in the period
2010–2014, resulting in a loss of more than $100 billion in sales to generic substitutions;
only a small fraction is expected to be replaced by new product revenues (p. vii).” Several
studies have noted the R&D productivity paradox: on one hand, molecular medicine is
expanding the numbers of disease targets for more complex unmet medical needs (e.g.,
Parkinson’s, Alzheimer’s) and orphan drug diseases which focus on smaller patient popu-
lations (e.g., Gaucher’s disease, myeloproliferative disorders), and on the other hand, drug
© 2015 Ahn et al. Open Access This article is distributed under the terms of the Creative Commons Attribution 4.0 InternationalLicense (http://creativecommons.org/licenses/by/4.0/), which permits unrestricted use, distribution, and reproduction in any medium,provided you give appropriate credit to the original author(s) and the source, provide a link to the Creative Commons license, andindicate if changes were made.
Ahn et al. Journal of Innovation and Entrepreneurship (2015) 4:14 DOI 10.1186/s13731-015-0027-3

development in novel, complex diseases increases the risk of failure in the face of rising
R&D costs (Pammolli et al. 2011).1 As noted by Piccart-Gebhart (2014) at the 41st
Karnofsky Memorial Award Lecture:
The pharmaceutical industry is under extreme financial pressure…Given increasingly
cost-constrained health care systems, limited patent durations on blockbuster drugs,
competition from generics, a more demanding regulatory environment, diminishing
marketing exclusivity, and progressively smaller markets resulting from the rapidly
increasing molecular segmentation of the populations of patients…companies are
being forced to overhaul their drug development strategies (p. 348).
As such, new creative approaches are needed to manage emerging biotechnology
innovations, regulations, and payor environments to enhance product pipeline product-
ivity, valuation, and risk management, all of which are critical to future industry devel-
opment and national competitiveness (Beach, 2011; Ford et al. 2008; Lindgren and
Packendorff, 2011; Roy, 2012).
Typically, large biopharma firms create drug development pipelines in three ways: in-
ternal development, strategic alliances (e.g., joint ventures, alliances, co-promotion, co-
development), and mergers and acquisitions (Pavlou and Belsey, 2005). Studies (York et
al. 2011) have examined relative success rates of different acquisition strategies in the
biopharma industry, finding that horizontal mergers, which tend to reduce costs
through scale economies, outperform vertical mergers, in which large pharma firms
typically acquire innovation rich, and cash poor small biotech firms to gain access to
new and emerging products. However, even the relatively more successful horizontal
acquisitions often destroy value for the acquiring firm (York et al., 2011). Further,
Kirchhoff and Schiereck (2011) concluded that at least some of this value destruction
stems from overpayment due to acquisition premiums, often for firms with high profile
drugs in late-stage clinical trials or those that have recently gained FDA approval for
such products. However, because the drug development process is inherently risky and
expensive, large public biopharma firms seem to prefer investing in what they consider
“sure bets,” even if they may end up overpaying. This practice results from perceiving
that the risk of overpaying for late-stage drugs is less serious than the uncertainty asso-
ciated with valuing firms and products in earlier stages of development (Hartmann and
Hassan, 2006).
Further, research does support the widespread practice among biotech industry ana-
lysts to base firm valuation either on existing cash flows (based on the assumption that
future success can be predicted from past performance) or on cash flows based on mar-
ket data that can be more readily measured, such as revenues expected from drugs that
are near FDA approval and thus market launch (Löfqvist, 2009). This is particularly the
case in the biotech industry where “go/no go” decisions are stage-gated to each phase
of product development.2 Analysts also may overestimate discount rates for cash flows
from early stage products, thus dooming them to rejection because their lengthy time
lines result in low net present values. Each of these traditional valuation practices may
lead to under valuation and thus underinvestment in earlier stage drug development
projects, even though some will offer high or breakthrough innovation potential with
the option to abandon them at multiple stages of development (Newton et al. 2004).
Ahn et al. Journal of Innovation and Entrepreneurship (2015) 4:14 Page 2 of 19

An alternative that would seem to resolve traditional cash flow valuation problems is
to use “real options” techniques. Real options offer firms the right to acquire the
present value of expected cash flows by making an irreversible investment on or before
the date the opportunity is no longer available (the option expiration date). Although
this technique sounds similar to net present value (NPV), real options only have value
when the decision to invest is actually made, thus committing the firm to an irrevers-
ible cost. In the case of long timeframe investments in uncertain environments, break-
ing up projects into stages, each of which has a real option value, can reduce risk.
Thus, real options have been presented as a more robust alternative to valuing bio-
pharma pipelines (Hartmann and Hassan, 2006; Kumaraswamy, 1998). Reasons for this
include the high degree of uncertainty and disagreement regarding future biological
disease pathways, the long timelines and dynamic capabilities involved in novel drug
development, the large sums of money required to conduct clinical trials sufficient to
gain FDA approval, and the high historical risk of failure (Ahn and Meeks, 2008; Ahn
et al. 2010; Brink and Holmén, 2009; Roy, 2012).
Recognizing that traditional valuation models may result in drug development deci-
sions that reward overpayment for products in later stages of the FDA approval process
and also that real options models have not been embraced by industry analysts for the
reasons outlined above, we began searching for alternative strategic frameworks and
valuation models that might more correctly incorporate the value of early stage prod-
ucts. Our search led us generally to the entrepreneurship literature and, more specific-
ally, to Sarasvathy (2001) effectuation model. While initially derived as a model for
predicting the success or failure of early stage startups, unlike traditional financial
models that begin with the end goal and work backwards, the effectuation model be-
gins with resources that are readily available to the firm and then stays flexible enough
to take advantage of environmental contingencies as they arise. In that sense, it is more
similar to real options than to traditional discounted cash flow models.
In this paper, we test the effectuation model against the more traditional model of
discounting existing or late-stage cash flows and also look at which dimensions of ef-
fectuation are most relevant to biopharma pipeline valuation. We believe our results
suggest that, if conceived and operationalized in a way that fits the highly uncertain
biopharma industry environment, applying at least some elements of the effectuation
model to biopharma pipeline valuation may provide a more robust approach to pipeline
development strategy for both practice and research.
Literature review
Competing models of valuation
Traditional finance suggests that decisions such as valuing a going concern are made
under conditions of certainty and thus are economically rational. The discounted cash
flow valuation model used by most financial analysts is based on this idea. Essentially,
present cash flows are known, future cash flows can be reasonably estimated, and the
level of risk and thus required rate of return is a given or at least can be accurately esti-
mated using historical stock price covariance with the market and/or that of bench-
mark companies of the same size, stage of development, and/or therapeutic area
(Stewart et al. 2001).
Ahn et al. Journal of Innovation and Entrepreneurship (2015) 4:14 Page 3 of 19

However, the usefulness and accuracy of such “rational” models are reduced when
long time horizons and high uncertainty are present as they are in the biopharma in-
dustry (Iskin et al. 2011). On the one hand, drug development costs have rapidly grown
from $100 million constant dollars in 1975, to $300 million in 1987, to $800 million in
2000, and to over $1.3 billion in 2005. Further, the complexity (i.e., increased number
of median procedures, globalization, staffing) and trial length (e.g., average study in
1999 was 460 days to 780 days in 2005) have significantly increased. However, the
probability of success remains modest, with FDA approval rates by stage of develop-
ment at preclinical (8 %), Phase 1 (21), Phase 2 (28), Phase 3 (58 %) in 2011 (DiMasi,
2013; Kola and Landis, 2004; Roy, 2012).
As a result, even analysts who follow the biopharma industry seem to agree that fore-
casting expected cash flows from, and the risk associated with, drugs under develop-
ment is a frustrating and imprecise exercise. Instead, they tend to use current or easily
estimated, late-stage, cash flows as a proxy for future cash flows, presumably because
firms that have learned to develop and commercialize new drugs will continue to do so
at the same rate as in the past (Löfqvist, 2009). Retail investors, who are one more step
removed from the information and analysis process, may be even more likely to assume
that the past is the best predictor of the future.
To take into account these longer timeframes and higher level of risk in the bio-
pharma industry, in the past few decades finance theorists have suggested using a real
options approach (Hartmann and Hassan, 2006). Real options theory, unlike financial
options theory, uses the value of the underlying asset (in this case, biopharma drugs
under development/in the corporate pipeline) as a proxy for future cash flows and then
estimates a value based on the time remaining for the “option” to expire (called the
strike date) and the risk that the event (e.g., FDA approval and commercialization) will
not take place. This approach has many of the same shortcomings of having to estimate
future cash flows, although the valuation technique is far more sophisticated.
Because the estimates are so difficult to develop and the confidence levels in the in-
formation needed tend to be low, very few empirical research papers have attempted to
operationalize and test real options models, although quite a few papers have developed
theoretical models. The results of such attempts tend to reflect the use of a very precise
tool with very crude inputs, the value of which is questionable. As a result, this valu-
ation technique is not much used by researchers, not to mention practicing analysts
(Harrison and Lerer, 2002; Hartmann and Hassan, 2006). A new way of thinking about
how to value success under conditions of high uncertainty—effectuation—may offer a
more robust theoretical framework and approach to more valuing drug development
pipelines.
An effectuation model and hypotheses
Effectuation theory differs from more traditional causal models of venture success in
the sense that it refers to “a set of means as given and focus on selecting between pos-
sible effects that can be created with that set of means,” while causal models rely on
prediction and processes that “take a particular effect as given and focus on selecting
between means to create that effect” (Sarasvathy, 2001, p. 245). The original effectu-
ation model consists of four dimensions: means, affordable loss, partnership, and
expecting the unexpected (Read et al. 2009) (Table 1).
Ahn et al. Journal of Innovation and Entrepreneurship (2015) 4:14 Page 4 of 19
Effectuation has been widely explored in entrepreneurship (Sarasvathy, 2008) but has
also been considered in the context of corporate R&D (Brettel et al. 2012), management
(Augier and Sarasvathy, 2004; Hitt and Duane, 2002), economics (Dew et al. 2004),
finance (Wiltbank et al. 2009), and marketing (Read et al., 2009). However, to our
knowledge, our research is the first to explore its use specifically within the context of
the biopharma industry and to apply it to valuing drug development pipelines. We first
describe below how each of the four effectuation concepts have traditionally been de-
fined and how they might be operationalized in this new biopharma industry context.
We then end the discussion of each concept with our hypotheses.
Several interesting observations about empirical tests of the effectuation model seem
relevant to mention up front. First, the same concepts have been operationalized on
multiple levels of analysis, including the individual and firm. Also, surveys have been
the predominant method of data collection which focused on exploring new venture
success in terms of individual decision-making (Dew et al., 2004). Our research differs
from these prior studies in that we look only at existing firm level variables, a precedent
suggested and supported by Brettel et al. (2012) who collected their data using surveys
of European technology firms rather than adopting archival financial data as proxies.
As such, their survey-based results are based on management perceptions.
Next, we describe each effectuation dimension—means, affordable loss, partnerships,
and expect the unexpected—in the context of the biopharma industry (Table 1):
1. Means: Traditionally, the “means” construct is a three dimensional variable: “what I
know,” “who I am,” and “who I know.” “What I know” tends to be defined as
domain specific expertise as well as more general variables such as personality,
gender, and management experience. This dimension seems to be operationalized
primarily at the individual level. “Who I am” has been operationalized at both the
individual level of analysis (such as propensity for risk and self-efficacy) and the firm
level (such as patents, capital, and internal R&D). From a face validity perspective,
the “what I know” and “who I am” dimensions would seem to overlap. “Who I
know” includes family and friends who are entrepreneurs and links to universities
and institutions in the innovation process (Hemlin, 2009).
Because pharmaceutical firms enjoy high profit margins percentages, most
multinational biopharmaceutical companies have significant absolute financial
“means” or resources to deploy, including large cash balances, borrowing capacity,
and stock market values. These means allow them to invest heavily in R&D, among
other things. However, their decisions on how much to invest and on what
Table 1 Effectuation elements and dimensions
Effectuation element Dimension
Means “What I know,” “who I am,” and “who I know”
Affordable loss Risk-taking propensity and the ability to thrive through a setback
Partnerships Collaborations with stakeholders and organizations willing to make a significantcommitment to product and market development
Expect the unexpected Embrace surprises that arise from uncertain situations, remaining flexible rather thantethered to existing goals (Read et al., 2009; Sarasvathy, 2001) refer to this effectuationdimension as “leverage contingency” and define it as a “willingness to change products,customize.”
Ahn et al. Journal of Innovation and Entrepreneurship (2015) 4:14 Page 5 of 19

segments can differ significantly depending on their degree of diversification and
priorities. For example, a diversified biopharma firm like Johnson and Johnson
(J&J) gains about 37 % of sales from its biopharma segment, while a more focused
biopharma firm such as Biogen gains 100 % of revenues from drug sales. While
both earn about the same profit margins on their biopharma sales (24.4 % for J&J
and 23.5 % for Biogen), in absolute terms, the internally generated cash available to
a corporate giant like J&J ($15 billion total, $6.1 billion from biopharma) dwarfs
the internally generated cash available to Biogen ($1.2 billion).
2. Affordable loss: By “affordable loss,” traditional effectuation studies typically mean
risk-taking propensity and the ability to thrive through a setback. In this context,
the affordable loss dimension builds on the resource based view (RBV) of strategy
(Barney, 1991) which posits that firms gain competitive advantage from having
resources that provide them with unique sources of competitive advantage. These
resources may fall into a variety of categories, including physical, financial, human,
and organizational, and confer competitive advantages based on the value, rareness,
uniqueness (inimitability), and embeddedness in the organization fabric. The difficulty
other firms experience in imitating these successful firms’ resources is explained by
the amount of time it takes to create and develop them (often decades), as well as the
difficulty (in the case of embeddedness) others experience in identifying them
as sources of competitive advantage. RBV posits that the more rare, unique,
and embedded the resource, the greater the source of competitive advantage,
so long as those resources fit the environment in which the firm operates.
Further, Makadok (2001) connects resources to the term “capabilities,” defining a
capability as “a special type of resource—specifically, an organizationally-embedded,
non-transferable firm-specific resource whose purpose is to improve the productivity
of the other resources possessed by the firm” (p. 389). He concluded that capabilities
cannot be bought, rather, they must be built. Further, these internal capabilities,
combined with external partnerships, may be seen as a flexible innovation system
(Su et al. 2009).
An example of a large multinational biopharma leveraging its resources to shift
from a traditional internal R&D model to biopharmaceutical alliances to
further its product pipeline is Bristol-Myers Squibb Company (BMY), which
has been strategically aligning with small and mid-sized drug developers and
biotech companies. (Ahn, Wu, and Rahman, 2010). BMY strategically targets
companies whose products and technologies address unmet medical needs and
build on BMY’s R&D strengths and/or create new areas of expertise. The
“String of Pearls” strategy formalized in 2007, threads together a library of
compounds and portfolio of technologies for the purpose of accelerating the
discovery, clinical development, and commercialization of new therapies across
a broad range of therapeutic areas. James M. Cornelius, chairman and chief
executive officer, Bristol-Myers Squibb (BMS) noted about their $2.1 billion
acquisition of Medarex:
Medarex’s technology platform, people and pipeline provide a strong complement to
our company’s biologics strategy, specifically in immuno-oncology. With its product-
ive and proven antibody discovery capabilities, ability to generate interesting
Ahn et al. Journal of Innovation and Entrepreneurship (2015) 4:14 Page 6 of 19
therapeutic programs and unique set of pre-clinical and clinical assets in devel-
opment, Medarex represents what we’re looking for in terms of our String of
Pearls strategy. This acquisition is another important step in our BioPharma
transformation.
Conversely, BMY’s acquisition of Inhibitex in Phase 3 clinical development for
hepatitis C virus (HCV) for $2.5 billion or 167 % premium resulted in a total
failure. After only 8 months, the lead drug trial was discontinued due to a
patient death, and most of the company was disposed with a $1.8 billion
write-off. As such, a firm’s absolute as well as relative ability to absorb losses
may determine its willingness to invest in risky, long-term projects such as
novel drug development.
3. Partnerships: Effectuation theory frames partnerships as collaborations with
stakeholders and organizations willing to make a significant commitment to
product and market development. Read et al. (2009) distinguish the “means”
dimension from the “who I know” dimension from the “partnerships” dimension
by determining whether success depends on the studied firm (“means”) or the
other party (“who I know”—typically as a result of money, equity, or a product
changing hands).
In the biopharma context, the vast majority of the over 600 public and 8000 private
companies worldwide have no revenues or earnings, which means that their
investment is funded through grants, public or private equity, and/or through
resource partnerships with larger, better capitalized public biopharma firms. The
small percentage of these firms that are successful in moving into later stages of
clinical trials or actually receiving FDA approval to market the drug are often acquired
by larger biopharma firms in these later stages (Kirchhoff and Schiereck, 2011). Thus,
for large, well-established firms, partnering with and/or later acquiring smaller biotech
companies provides a viable option to committing a firm’s R&D investment capital to
internal development programs (Ahn, Meeks, et al., 2010). These partnerships,
collaborative agreements, and joint ventures create powerful innovation network effects
(Hemphälä and Magnusson, 2012), as well as also allow both firms to learn to
work together, providing an option on possible later acquisition.
Despite the greater information asymmetry associated with early stage novel
technologies (e.g., stem cells, checkpoint inhibitors, gene therapy, cancer vaccines,
RNAi), in our view, a number of signaling mechanisms may help investors discern/
discriminate among firms’ pipelines, including clinical data (such as
announcement of clinical results at medical conferences), publicly announced
partnership deals (such as licensing, co-development, co-promotion, all of
which provide technology validation), and/or institutional investment by specialist
mutual and hedge funds, which provides signaling mechanisms to broader investor
groups (Gulati and Higgins, 2003; Nicholson et al. 2002). For example, Agios
Pharmaceuticals, an early stage drug development company which focused on
cancer metabolism with a marquee research partnership with large biopharma
Celgene, successfully completed an IPO at $18 which overshot the range of
$14–16, raised an additional $106 million, and soared 60 % on its first day of
trading—sending the market capitalization to over $800 million.
Ahn et al. Journal of Innovation and Entrepreneurship (2015) 4:14 Page 7 of 19

4. Expect the unexpected: Effectuation principles encourage companies to embrace
surprises that arise from uncertain situations, remaining flexible rather than
tethered to existing goals (Read et al., 2009; Sarasvathy, 2001) refer to this
effectuation dimension as “leverage contingency” and define it as a “willingness to
change products, customize.”
While all large biopharmaceutical companies have a pressing and ongoing need for
new products, they have approached pipeline and product investment and
development differentially, in the sense that some rely on internal development
and research partnerships, while others rely on purchasing external R&D and/or
smaller firms typically in later stages of FDA approval through mergers and
acquisitions. Illustrating these different approaches, Pfizer has heavily relied on
multibillion dollar acquisitions which have included Warner-Lambert in 2000,
Pharmacia in 2002, Wyeth in 2009, King Pharmaceuticals in 2010; and Roche has
relied on internal development and partnership (e.g., Genentech partnership to
grow a pipeline of blockbuster oncology products such as Herceptin® (trastuzumab),
Rituxan® (rituximab), and Avastin® (bezicuzimab)) each with greater $5 billion in
2012 annual revenues. As discussed above, there is a tradeoff between the perceived
risk of overpaying for late-stage products, often obtained through mergers and
acquisitions and the uncertainty of valuing internally developed earlier stage
products (Ford et al., 2008).
In the biopharmaceutical industry, more positive value may be created by drugs in
the earliest phases of development, rather than the ones closer to FDA approval,
and/or by failed drugs repurposed to another use (Beach, 2011). For example,
Viagra® (sildenafil) was first synthesized in 1989 by two Pfizer chemists at the
company’s Sandwich, Kent research facility in England. Viagra was initially studied
for use in hypertension (high blood pressure) and angina pectoris (a symptom of
ischemic heart disease). After Phase II testing of sildenafil for angina failed to show
promising results, Pfizer decided to pursue its use for erectile dysfunction rather
than for angina. The drug was patented in 1996 and approved for use in erectile
dysfunction by the US Food and Drug Administration in 1998 (and expanded
approvals were obtained for pulmonary hypertension in 2005). Sales of Viagra
exceeded $2 billion in 2012 revenues.
Conversely, a value-destroying variation on the “unexpected” is when unanticipated
safety signals arise, even after extensive clinical studies. For example, Biogen-Idec
and Elan’s Tysabri (natalizumab) was originally approved for all relapsing forms of
multiple sclerosis (relapse-remitting, secondary-progressive, and progressive-
relapsing) in 2004. However, 4 months after its approval in February 2005, the
manufacturer withdrew natalizumab voluntarily after two fatal cases of progressive
multifocal leukoencephalopathy, and the stock price fell from $66 to $38. Eventually,
the drug was reapproved in June 2006 after an extensive safety review and heavy
lobbying by patients, and Tysabri reached $5.5 billion in 2012 revenues.
Effectuation principles can provide insight into optimizing pipeline decisions by fo-
cusing on the logic of control rather than the logic of prediction. Juxtaposing effectu-
ation with discounted cash flow (DCF) may lead to new insights to addressing chronic
underinvestment in the biopharma industry by focusing on what can be done with
Ahn et al. Journal of Innovation and Entrepreneurship (2015) 4:14 Page 8 of 19

available resources rather than what ought to be done, affordable loss rather than ex-
pected return, partnerships rather than competitive analyses, and leveraging contingen-
cies rather than avoiding them (Sarasvathy, 2001, 2008). Thus, using an effectuation
lens, we pose the following hypotheses in the context of the large multinational bio-
pharmaceutical companies:
� H1: Biopharmaceutical companies with higher absolute R&D expense will have
higher performance in terms of growth in revenues, net income, valuation, and
Price-Earning (PE) multiples relative to peer competitors.
� H2: Biopharmaceutical companies with higher R&D expense as percent (%) of
revenues will have higher performance.
� H3: Biopharmaceutical companies with higher pipeline valuation as a percent of
overall valuation will have higher performance.
� H4: Effectuation dimensions will have higher predictive power than the traditional
discounted value of present cash flow models.
MethodsTo test our effectuation theory model and hypotheses against the predominant classic
discounted cash flow/legitimacy model described above, we focused on 11 of the largest
multinational biopharmaceutical firms during the 2000–2012 period. These leading
firms ranged in size from $5 to 67 billion in 2012 revenues, $1 to 8.7 billion in net in-
come, and $10 to 200 billion in market value using the Biocentury database.
All of these companies made explicit and public their decisions on the number of
pipeline projects to pursue, determined the degree of reliance on internal development
versus external partnerships, and decided when to increase investment or discontinue
projects. For example, a recent biopharmaceutical analyst noted using a DCF approach
to valuation:
We are lowering our AZN [Astra Zeneca] EPS [earning per share] to reflect the
impact of modestly lower near-term sales but overall higher spending expectations.
Management commentary…highlighted increased R&D and SG&A spending to
support the renewed commitment to R&D…to advance the Phase I/II oncology
and respiratory pipelines while investing behind new product acquisitions (Pearl
Therapeutics, Omthera). Key internal [pipeline product] readouts and data presentations
are expected for benralizumab (anti-IL-5; eosinophilic asthma & COPD), tralokinumab
(anti-IL-13 in severe asthma) & MEDI-4736 (anti-PD-L1 in solid tumors). Our DCF
valuation increases to $50 from $47–$48 on a lower Pharma group discount rate
(Fernandez & Arabi, 2013).
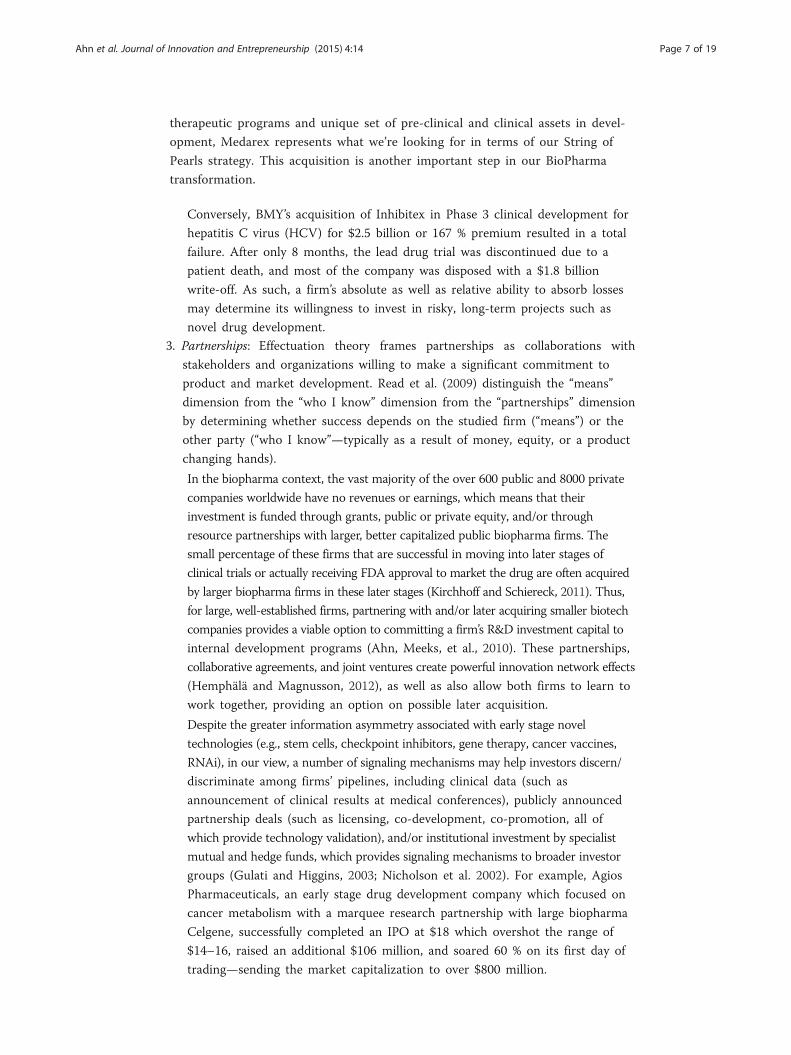
On average, all of these companies used external partnering for 34 % of their product
pipelines (ranging from a low of 17 % to a high of 57 %). Also of note, these companies
employed external partnering at increasingly later stages of development with Phase I
(15 %), Phase II (24 %), Phase III (38 %), products awaiting approval (34 %), and mar-
keted products (45 %) of the time (Fig. 1).
As a result of independent decisions on how much of current cash flow to reinvest in
various pipeline development products, performance in terms of revenues, net income,
Ahn et al. Journal of Innovation and Entrepreneurship (2015) 4:14 Page 9 of 19
market capitalization, and PE (price-earnings) multiples change over time. We obtained
pipeline data from Biocentury which tracks technology platforms, product pipelines,
and financial performance for public and private biopharmaceutical companies in the
USA, Europe, Canada, and the Asia-Pacific region. In addition, we obtained financial
performance data such as stock prices, shares outstanding, market capitalization, S&P
500 and BTK (Biotech) indices, net income, R&D expense, revenues from SEC filings,
and Yahoo Finance. We obtained 10-year US Treasury interest rates to determine his-
torical costs of capital.
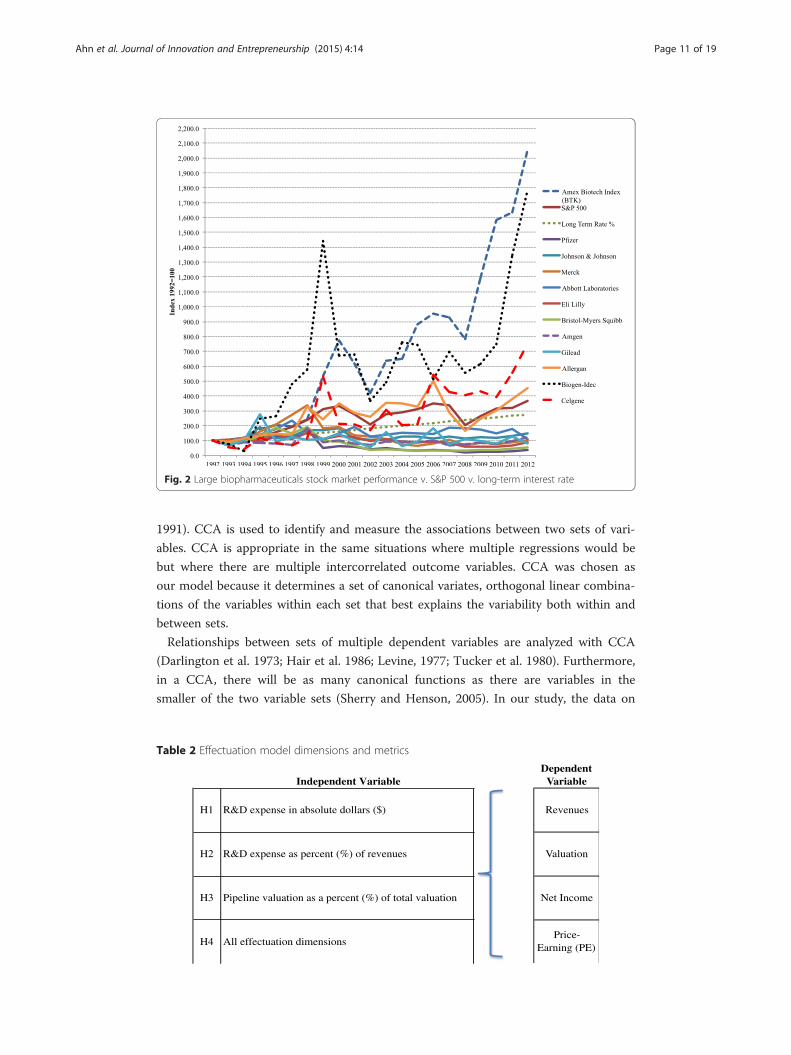
Of note, biotechnology firms have consistently outperformed traditional multi-
national pharmaceutical companies in the last 20 years. In addition, with increasingly
greater financial resources and global capabilities, large pharmaceutical companies are
increasingly transforming into biopharmaceutical companies (e.g., Roche acquisition of
Genentech in 2009) (Fig. 2).
Thus, the independent and dependent variables are operationalized as seen in Table 2:
Relative to DCF NPV analysis (DiMasi, 2013; Nickisch and Bode-Greuel, 2013), we
explore a broader effectuation framework to consider the relative magnitude and inten-
sity of R&D (i.e., R&D expense in absolute dollars and as a percent of revenues, pipe-
line valuation) over time. In turn, the dependent variables of interest are performance
that is derived from pipeline development decisions in terms of revenues, net income,
market valuation, and PE multiples that can compound competitive advantages.
The measures of both input variables and performance variables in our model were
multivariate. Hence, analytical methods that can be used include the following: (1) ca-
nonical correlation analysis (CCA) which provides a way of making sense of cross-
covariance matrices by considering commonalities among sets of variables; (2) separate
ordinary least squares (OLS) regression to estimate unknown parameters in a linear re-
gression model, which will not produce multivariate results or information concerning
dimensionality; and (3) multivariate multiple regression provides simultaneous observa-
tion and analysis of more than one outcome variable but does not provide information
on dimensionality (Afifi and Clark, 2004; Pedhazur, 1997).
One major reason for use of multivariate procedures for our model is that it keeps
Type I error to a minimum (Fan, 1997; Sherry and Henson, 2005; Thompson, 1985,
Fig. 1 Percent of externally acquired product pipeline by stage of development for largebiopharmaceutical companies
Ahn et al. Journal of Innovation and Entrepreneurship (2015) 4:14 Page 10 of 19
1991). CCA is used to identify and measure the associations between two sets of vari-
ables. CCA is appropriate in the same situations where multiple regressions would be
but where there are multiple intercorrelated outcome variables. CCA was chosen as
our model because it determines a set of canonical variates, orthogonal linear combina-
tions of the variables within each set that best explains the variability both within and
between sets.
Relationships between sets of multiple dependent variables are analyzed with CCA
(Darlington et al. 1973; Hair et al. 1986; Levine, 1977; Tucker et al. 1980). Furthermore,
in a CCA, there will be as many canonical functions as there are variables in the
smaller of the two variable sets (Sherry and Henson, 2005). In our study, the data on
Table 2 Effectuation model dimensions and metrics
Independent VariableDependent
Variable
H1 R&D expense in absolute dollars ($) Revenues
H2 R&D expense as percent (%) of revenues Valuation
H3 Pipeline valuation as a percent (%) of total valuation Net Income
H4 All effectuation dimensionsPrice-
Earning (PE)
Fig. 2 Large biopharmaceuticals stock market performance v. S&P 500 v. long-term interest rate
Ahn et al. Journal of Innovation and Entrepreneurship (2015) 4:14 Page 11 of 19

the three input variables and the four performance variables were canonically corre-
lated to determine if any significant relationships existed (p < 0.001).
CCA was conducted using the three input variables (R&D expenses in absolute
dollars ($); R&D expenses as percent (%) of revenues; pipelines valuation as percent (%)
of total valuation) as predictors of the four performance variables (i.e., revenues, market
valuation, net income, price-earning ratio) to evaluate the multivariate-shared relation-
ship between the two variable sets.
Results and discussionThe analysis yielded three functions with squared canonical correlations (Rc2) of 0.902,
0.330, and 0.021 for each successive function, as shown in Table 6. Table 7 indicates
that collectively, the full model across all functions was statistically significant using the
Wilks’s lambda (λ) of 0.064, F (12,455.36) = 69.36, p < 0.001. Accordingly, we can reject
the null hypothesis that there was no relationship between the variable sets and con-
clude that there probably was a relationship. The detailed analysis results are in the
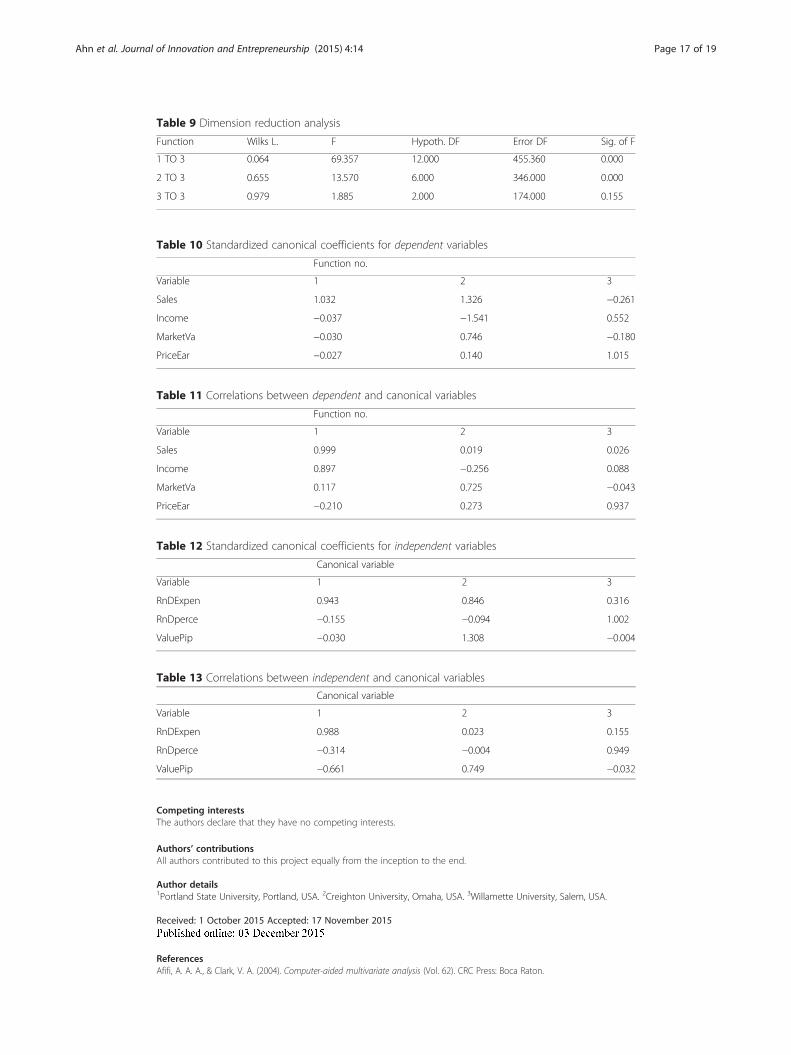
Appendix (Tables 5, 6, 7, 8, 9, 10, 11, 12 and 13)
Because Wilks’s λ represents the variance unexplained by the model, 1−λ yields the
full model effect size in an r2 metric. Thus, for the set of three canonical functions, the
r2 type effect size was 0.936, which indicates that the full model explained a substantial
portion of 93.6 %, of the variance shared between the variable sets.
Further, the dimension reduction analysis allows us to test the hierarchal arrange-
ment of functions for statistical significance. As noted in Table 8, the full model (Func-
tions 1 to 3) was statistically significant, F (12, 455.36) = 69.36, p < 0.001. Functions 2 to
3 was also statistically significant, F (6, 346) = 13.57, p < 0.001. Function 3 to 3 (which is
the only function that was tested in isolation) did not explain a statistically significant
amount of shared variance between the variable sets, F (2174) = 1.885, p = 0.155.
Given the effects for each function of the squared canonical correlation (Rc2)—only
the first two functions were considered noteworthy in the context of this study (90.2
and 33.0 % of shared variance, respectively), as shown in Table 5. The last functions
only explained 2.1 % of the remaining variance in the variable sets after the extraction
of the prior functions.
Table 3 presents the standardized canonical function coefficients and structure coeffi-
cients for Functions 1 and 2. The squared structure coefficients (rs2) are also given as
well as the communalities (h2) across the two functions for each variable.
Note: Table 3 summarized Tables 9, 10, 11, and 12. Structure coefficients (rs) greater
than |0.45| are italicized. Communality coefficients (h2) greater than 45 % are italicized
(following a convention in many factor analyses). Coef = standardized canonical func-
tion coefficient, rs = structure coefficient, rs2 = squared structure coefficient, and h2 =
communality coefficient.
Looking at the Function 1 coefficients, we can see that relevant dependent variables
are primarily sales and net income, the expansion of which is the culmination of stra-
tegic choices (i.e., internal versus external R&D, ability to replace revenues lost to pa-
tent expiries). This conclusion is supported by the squared structure coefficients (rs2),
which indicated the amount of variance the observed variable could contribute to the
synthetic performance variable. Furthermore, with the exception of the price-earnings
ratio, all of these variables’ structure coefficients had the same sign, indicating that they
Ahn et al. Journal of Innovation and Entrepreneurship (2015) 4:14 Page 12 of 19
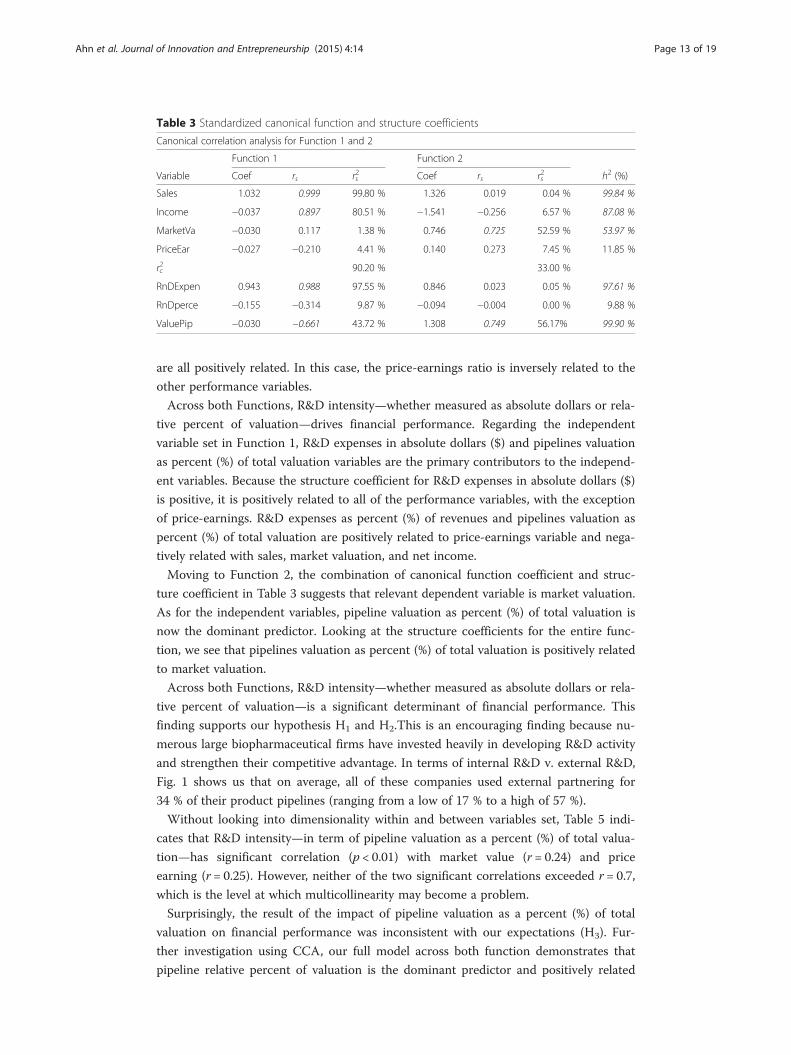
are all positively related. In this case, the price-earnings ratio is inversely related to the
other performance variables.
Across both Functions, R&D intensity—whether measured as absolute dollars or rela-
tive percent of valuation—drives financial performance. Regarding the independent
variable set in Function 1, R&D expenses in absolute dollars ($) and pipelines valuation
as percent (%) of total valuation variables are the primary contributors to the independ-
ent variables. Because the structure coefficient for R&D expenses in absolute dollars ($)
is positive, it is positively related to all of the performance variables, with the exception
of price-earnings. R&D expenses as percent (%) of revenues and pipelines valuation as
percent (%) of total valuation are positively related to price-earnings variable and nega-
tively related with sales, market valuation, and net income.
Moving to Function 2, the combination of canonical function coefficient and struc-
ture coefficient in Table 3 suggests that relevant dependent variable is market valuation.
As for the independent variables, pipeline valuation as percent (%) of total valuation is
now the dominant predictor. Looking at the structure coefficients for the entire func-
tion, we see that pipelines valuation as percent (%) of total valuation is positively related
to market valuation.
Across both Functions, R&D intensity—whether measured as absolute dollars or rela-
tive percent of valuation—is a significant determinant of financial performance. This
finding supports our hypothesis H1 and H2.This is an encouraging finding because nu-
merous large biopharmaceutical firms have invested heavily in developing R&D activity
and strengthen their competitive advantage. In terms of internal R&D v. external R&D,
Fig. 1 shows us that on average, all of these companies used external partnering for
34 % of their product pipelines (ranging from a low of 17 % to a high of 57 %).
Without looking into dimensionality within and between variables set, Table 5 indi-
cates that R&D intensity—in term of pipeline valuation as a percent (%) of total valua-
tion—has significant correlation (p < 0.01) with market value (r = 0.24) and price
earning (r = 0.25). However, neither of the two significant correlations exceeded r = 0.7,
which is the level at which multicollinearity may become a problem.
Surprisingly, the result of the impact of pipeline valuation as a percent (%) of total
valuation on financial performance was inconsistent with our expectations (H3). Fur-
ther investigation using CCA, our full model across both function demonstrates that
pipeline relative percent of valuation is the dominant predictor and positively related
Table 3 Standardized canonical function and structure coefficients
Canonical correlation analysis for Function 1 and 2
Function 1 Function 2
Variable Coef rs rs2 Coef rs rs
2 h2 (%)
Sales 1.032 0.999 99.80 % 1.326 0.019 0.04 % 99.84 %
Income −0.037 0.897 80.51 % −1.541 −0.256 6.57 % 87.08 %
MarketVa −0.030 0.117 1.38 % 0.746 0.725 52.59 % 53.97 %
PriceEar −0.027 −0.210 4.41 % 0.140 0.273 7.45 % 11.85 %
rc2 90.20 % 33.00 %
RnDExpen 0.943 0.988 97.55 % 0.846 0.023 0.05 % 97.61 %
RnDperce −0.155 −0.314 9.87 % −0.094 −0.004 0.00 % 9.88 %
ValuePip −0.030 −0.661 43.72 % 1.308 0.749 56.17% 99.90 %
Ahn et al. Journal of Innovation and Entrepreneurship (2015) 4:14 Page 13 of 19
with market value and price earning but inversely related to the other performance var-
iables, sales, and net income.
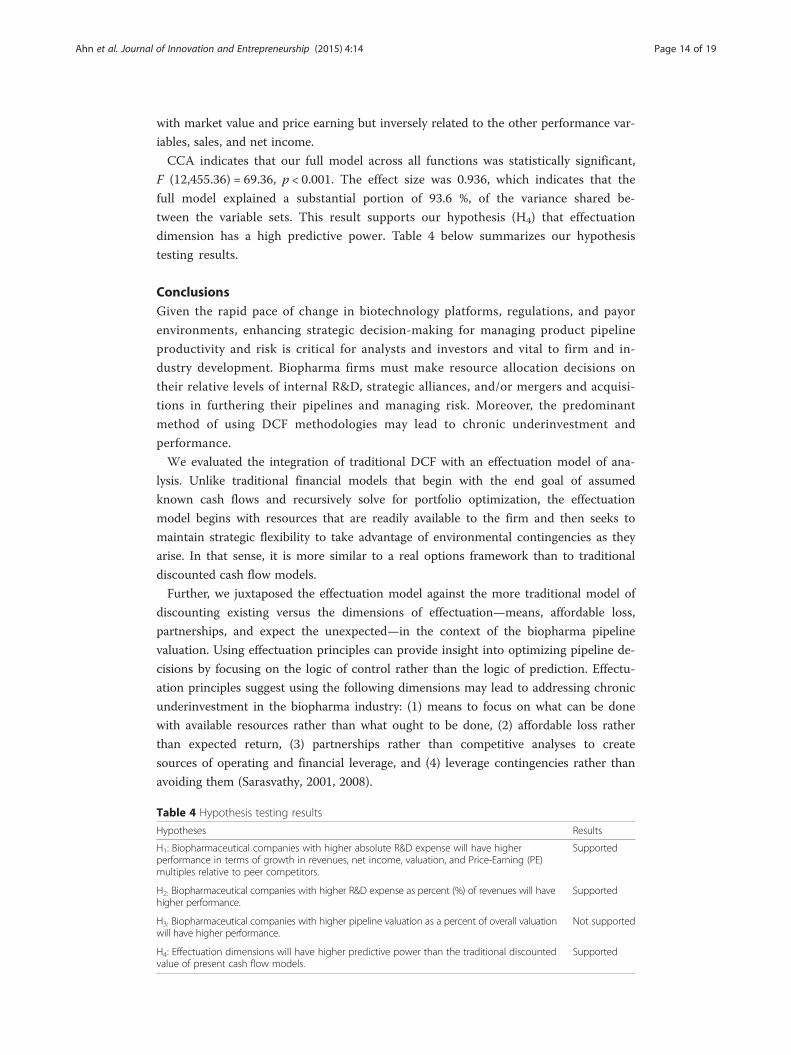
CCA indicates that our full model across all functions was statistically significant,
F (12,455.36) = 69.36, p < 0.001. The effect size was 0.936, which indicates that the
full model explained a substantial portion of 93.6 %, of the variance shared be-
tween the variable sets. This result supports our hypothesis (H4) that effectuation
dimension has a high predictive power. Table 4 below summarizes our hypothesis
testing results.
ConclusionsGiven the rapid pace of change in biotechnology platforms, regulations, and payor
environments, enhancing strategic decision-making for managing product pipeline
productivity and risk is critical for analysts and investors and vital to firm and in-
dustry development. Biopharma firms must make resource allocation decisions on
their relative levels of internal R&D, strategic alliances, and/or mergers and acquisi-
tions in furthering their pipelines and managing risk. Moreover, the predominant
method of using DCF methodologies may lead to chronic underinvestment and
performance.
We evaluated the integration of traditional DCF with an effectuation model of ana-
lysis. Unlike traditional financial models that begin with the end goal of assumed
known cash flows and recursively solve for portfolio optimization, the effectuation
model begins with resources that are readily available to the firm and then seeks to
maintain strategic flexibility to take advantage of environmental contingencies as they
arise. In that sense, it is more similar to a real options framework than to traditional
discounted cash flow models.
Further, we juxtaposed the effectuation model against the more traditional model of
discounting existing versus the dimensions of effectuation—means, affordable loss,
partnerships, and expect the unexpected—in the context of the biopharma pipeline
valuation. Using effectuation principles can provide insight into optimizing pipeline de-
cisions by focusing on the logic of control rather than the logic of prediction. Effectu-
ation principles suggest using the following dimensions may lead to addressing chronic
underinvestment in the biopharma industry: (1) means to focus on what can be done
with available resources rather than what ought to be done, (2) affordable loss rather
than expected return, (3) partnerships rather than competitive analyses to create
sources of operating and financial leverage, and (4) leverage contingencies rather than
avoiding them (Sarasvathy, 2001, 2008).
Table 4 Hypothesis testing results
Hypotheses Results
H1: Biopharmaceutical companies with higher absolute R&D expense will have higherperformance in terms of growth in revenues, net income, valuation, and Price-Earning (PE)multiples relative to peer competitors.
Supported
H2: Biopharmaceutical companies with higher R&D expense as percent (%) of revenues will havehigher performance.
Supported
H3: Biopharmaceutical companies with higher pipeline valuation as a percent of overall valuationwill have higher performance.
Not supported
H4: Effectuation dimensions will have higher predictive power than the traditional discountedvalue of present cash flow models.
Supported
Ahn et al. Journal of Innovation and Entrepreneurship (2015) 4:14 Page 14 of 19
We found that effectuation provides a useful strategic model that can be inte-
grated into traditional DCF cash flow analyses to enhance decision-making. For ex-
ample, instead of absolute focus on cash flows derived from a specific product or
acquisition, considering the decision relative to existing capabilities and resources
may lead to more investment which maximizes value (rather than disproportion-
ately focused on avoiding risk of failure—see for example BMY String of Pearls
strategy above). In this case, biopharmaceutical companies with higher absolute
and relative R&D expense levels were found to have higher performance in terms
of growth in revenues, net income, valuation, and Price-Earning (PE) multiples
relative to peer competitors.
Further, more aggressive investment into R&D portfolios appears to reinforce com-
petitive advantages. We found that biopharmaceutical companies with higher pipeline
valuation as a percent of overall valuation also experienced higher performance over
time, meaning that investors were able to discern and ascribe differential value between
the pipeline values of different companies and those with larger overall market valua-
tions had increased “means” to invest and further extend their dominant positions.
Overall, these results suggest if conceived and operationalized in a way that fits the
highly uncertain biopharma industry environment, applying elements of the effectu-
ation model and mindset to biopharma pipeline valuation may provide a fruitful avenue
for both practice and research. As such, it may be a useful framework for biotechnology
industry managers, charged with accelerating technology platforms, building product
pipelines, developing commercial products for addressing unmet medical needs, and
managing significant binary risk.
In sum, we believe this study contributes to the research literature by expanding and
extending the use of effectuation theory as an integrative framework with the predom-
inant DCF NPV analysis for considering biopharmaceutical firm product pipeline devel-
opment and risk management decision-making. Moreover, this is the first effectuation
research to use empirical data versus prior effectuation analyses, which have relied on
surveys of management perceptions. Further, our integration of effectuation and DCF
provides a lens from which to explore emerging varieties of small and large company
innovation in the biopharmaceutical industry.
Endnotes1The US FDA Orphan Drug Designation program provides orphan status to drugs
and biologics which are defined as those intended for the safe and effective treatment,
diagnosis, or prevention of rare diseases/disorders that affect fewer than 200,000 people
in the USA or that affect more than 200,000 persons but are not expected to recover
the costs of developing and marketing a treatment drug.2New biopharmaceutical products generally sequentially progress through the follow-
ing steps: (1) conduct in vitro and in vivo preclinical testing to establish biological ac-
tivity against the targeted disease and preliminary toxicology, (2) file an Investigational
New Drug (IND) application to allow human clinical trials, (3) conduct Phase I, II, and
III clinical trials to establish statistically significant safety and efficacy in humans, and
(4) file a New Drug Application (NDA) for approval for a specific type and stage of dis-
ease (Wierenga and Eaton 2006).
Ahn et al. Journal of Innovation and Entrepreneurship (2015) 4:14 Page 15 of 19

Appendix 1
Table 5 Descriptive statistics
Number Minimum Maximum Mean Std. deviation
RnDExpense 216 0.00 11.11 2.20 2.30
RnDpercent 216 0.00 12.50 0.28 0.89
ValuePipeline 179 −0.23 1.00 0.72 0.28
Sales 216 0.00 67.22 14.99 16.21
Income 216 −2.07 19.33 2.68 3.28
MarketValue 231 2.29 911.99 107.45 118.24
PriceEarnings 201 −27.49 4185.76 104.63 338.94
Valid N (listwise) 179
Table 6 Bivariate correlations
RnDExpense RnDpercent ValuePipeline
Sales Income MarketValue
PriceEarnings
RnD expense Pearson correlation 1 −0.122 −0.641a 0.940a 0.837a 0.165b −0.163b
Sig. (2-tailed) 0.074 0.000 0.000 0.000 0.015 0.026
RnDpercent Pearson correlation −0.122 1 0.174b −0.135b −0.119 −0.068 0.144b
Sig. (2-tailed) 0.074 0.020 0.047 0.080 0.316 0.049
ValuePipeline Pearson correlation −0.641a 0.174b 1 −0.619a −0.674a 0.239a 0.245a
Sig. (2-tailed) 0.000 0.020 0.000 0.000 0.001 0.001
Sales Pearson correlation 0.940a −0.135b −0.619a 1 0.888a 0.203a −0.171b
Sig. (2-tailed) 0.000 0.047 0.000 0.000 0.003 0.020
Income Pearson correlation 0.837a −0.119 −0.674a 0.888a 1 0.200a −0.184b
Sig. (2-tailed) 0.000 0.080 0.000 0.000 0.003 0.012
MarketValue Pearson correlation 0.165b −0.068 0.239a 0.203a 0.200a 1 0.108
Sig. (2-tailed) 0.015 0.316 0.001 0.003 0.003 0.128
PriceEarnings Pearson correlation −0.163b 0.144b 0.245a −0.171b −0.184b 0.108 1
Sig. (2-tailed) 0.026 0.049 0.001 0.020 0.012 0.128aCorrelation is significant at the 0.01 level (2-tailed)bCorrelation is significant at the 0.05 level (2-tailed)
Table 7 Eigenvalues and canonical correlations
Function no. Eigenvalue Pct. Cum. pct. Canon cor. Sq. cor
1 9.253 94.725 94.725 0.950 0.902
2 0.494 5.053 99.778 0.575 0.330
3 0.022 0.222 100.000 0.146 0.021
Table 8 Multivariate tests of significance
Test name Value Exact F Hypoth. DF Error DF Sig. of F
Pillais 1.25416 31.24925 12.00 522.00 0.000
Hotellings 9.76808 138.92375 12.00 512.00 0.000
Wilks 0.06392 69.3565 12.00 455.36 0.000
Roys 0.90247
Ahn et al. Journal of Innovation and Entrepreneurship (2015) 4:14 Page 16 of 19
Competing interestsThe authors declare that they have no competing interests.
Authors’ contributionsAll authors contributed to this project equally from the inception to the end.
Author details1Portland State University, Portland, USA. 2Creighton University, Omaha, USA. 3Willamette University, Salem, USA.
Received: 1 October 2015 Accepted: 17 November 2015
ReferencesAfifi, A. A. A., & Clark, V. A. (2004). Computer-aided multivariate analysis (Vol. 62). CRC Press: Boca Raton.
Table 13 Correlations between independent and canonical variables
Canonical variable
Variable 1 2 3
RnDExpen 0.988 0.023 0.155
RnDperce −0.314 −0.004 0.949
ValuePip −0.661 0.749 −0.032
Table 9 Dimension reduction analysis
Function Wilks L. F Hypoth. DF Error DF Sig. of F
1 TO 3 0.064 69.357 12.000 455.360 0.000
2 TO 3 0.655 13.570 6.000 346.000 0.000
3 TO 3 0.979 1.885 2.000 174.000 0.155
Table 10 Standardized canonical coefficients for dependent variables
Function no.
Variable 1 2 3
Sales 1.032 1.326 −0.261
Income −0.037 −1.541 0.552
MarketVa −0.030 0.746 −0.180
PriceEar −0.027 0.140 1.015
Table 11 Correlations between dependent and canonical variables
Function no.
Variable 1 2 3
Sales 0.999 0.019 0.026
Income 0.897 −0.256 0.088
MarketVa 0.117 0.725 −0.043
PriceEar −0.210 0.273 0.937
Table 12 Standardized canonical coefficients for independent variables
Canonical variable
Variable 1 2 3
RnDExpen 0.943 0.846 0.316
RnDperce −0.155 −0.094 1.002
ValuePip −0.030 1.308 −0.004
Ahn et al. Journal of Innovation and Entrepreneurship (2015) 4:14 Page 17 of 19

Ahn, M. J., & Meeks, M. (2008). Building a conducive environment for life science-based entrepreneurship and industryclusters. Journal of Commercial Biotechnology, 14(1), 20–30.
Ahn, M. J., Meeks, M., Davenport, S., & Bednarek, R. (2010). Exploring technology agglomeration patterns formultinational pharmaceutical and biotechnology firms. Journal of Commercial Biotechnology, 16(1), 17–32.
Ahn, M. J., Wu, W., & Rahman, Q. (2010). Medarex: realizing its potential? In M. J. Ahn, M. A. Alvarez, A. D. Meyers, & A. S.York (Eds.), Building the case for biotechnology. Logos Press: Washington, DC.
Augier, M., & Sarasvathy, S. D. (2004). Integrating evolution, cognition and design: extending Simonian perspectives tostrategic organization. Strategic Organization, 2(2), 169–204.
Barney, J. (1991). Firm resources and sustained competitive advantage. Journal of Management, 17(1), 99–120.Beach, R. (2011). Microcap pharmaceutical firms: linking drug pipelines to market value. Journal of Health Care Finance,
39(2), 82–92.Brettel, M., Mauer, R., Engelen, A., & Küpper, D. (2012). Corporate effectuation: entrepreneurial action and its impact on
R&D project performance. Journal of Business Venturing, 27(2), 167–184.Brink, J., & Holmén, M. (2009). Capabilities and radical changes of the business models of new bioscience firms.
Creativity and Innovation Management, 18(2), 109–120.Darlington, R. B., Weinberg, S. L., & Walberg, H. J. (1973). Canonical variate analysis and related techniques. Review of
Educational Research, 43(4), 433–454.Dew, N., Sarasvathy, S. D., & Venkataraman, S. (2004). The economic implications of exaptation. Journal of Evolutionary
Economics, 14(1), 69–84.DiMasi, J. A. (2013). Clinical success rates for new cancer drugs doubled from the mid-1990s to early-2000s. Retrieved
August 10, 2013, from http://csdd.tufts.edu.Fan, X. (1997). Canonical correlation analysis and structural equation modeling: what do they have in common?
Structural Equation Modeling: A Multidisciplinary Journal, 4(1), 65–79.Fernandez, S., & Arabi, A. (2013). Azn/lower EPS reflects higher spend; pipeline visibility a key focus/market perform.
Retrieved August 16, 2013, from http://portal.leerink.com/.Ford, C. M., Sharfman, M. P., & Dean, J. W. (2008). Factors associated with creative strategic decisions. Creativity and
Innovation Management, 17(3), 171–185.Gulati, R., & Higgins, M. C. (2003). Which ties matter when? The contingent effects of interorganizational partnerships
on IPO success. Strategic Management Journal, 24(2), 127–144.Hair, J. F., Jr., Anderson, R. E., & Tatham, R. L. (1986). Multivariate data analysis with readings. Macmillan Publishing Co., Inc:
New York.Harrison, M., & Lerer, L. (2002). Real options for biotechnology valuation. Nature Biotechnology, 20(3), 223–223.Hartmann, M., & Hassan, A. (2006). Application of real options analysis for pharmaceutical R&D project
valuation—empirical results from a survey. Research Policy, 35(3), 343–354.Hemlin, S. (2009). Creative knowledge environments: an interview study with group members and group leaders of
university and industry R&D groups in biotechnology. Creativity and Innovation Management, 18(4), 278–285.Hemphälä, J., & Magnusson, M. (2012). Networks for innovation—but what networks and what innovation? Creativity
and Innovation Management, 21(1), 3–16.Hitt, M. A., & Duane, R. (2002). The essence of strategic leadership: managing human and social capital. Journal of
Leadership & Organizational Studies, 9(1), 3–14.Iskin, I., Daim, T. U., & Cutar, A. (2011). Do investments in research and development translate to sales? International
Journal of Business Innovation and Research, 5(5), 510–525.Kirchhoff, M., & Schiereck, D. (2011). Determinants of M&A success in the pharmaceutical and biotechnological industry.
IUP Journal of Business Strategy, 8(1).Kola, I., & Landis, J. (2004). Can the pharmaceutical industry reduce attrition rates? Nature Reviews Drug discovery,
3(8), 711–716.Kumaraswamy, A. (1998). An organizational real-options perspective of firms’ R&D: Empirical evidence. Chicago: Paper
presented at the 2nd Annual Conference on Real Options: theory meets practice.Levine, M.S. (1977). Canonical analysis and factor comparison (Vol. 6). SageLindgren, M., & Packendorff, J. (2011). Issues, responsibilities and identities: a distributed leadership perspective on
biotechnology R&D management. Creativity and Innovation Management, 20(3), 157–170.Löfqvist, M. (2009). On the valuation of “big pharma’s” research pipelines.Makadok, R. (2001). Toward a synthesis of the resource‐based and dynamic‐capability views of rent creation. Strategic
Management Journal, 22(5), 387–401.Newton, D. P., Paxson, D. A., & Widdicks, M. (2004). Real R&D options. International Journal of Management Reviews, 5(2),
113–130.Nicholson, S., Danzon, P. M., & McCullough, J. S. (2002). Biotech-pharmaceutical alliances as a signal of asset and firm
quality: National Bureau of Economic Research.Nickisch, K., & Bode-Greuel, K. M. (2013). NPV modelling for the selection of value-creating biosimilar development
candidates. Journal of Commercial Biotechnology, 19(1).Pammolli, F., Magazzini, L., & Riccaboni, M. (2011). The productivity crisis in pharmaceutical R&D. Nature Reviews Drug
Discovery, 10(6), 428–438.Pavlou, A. K., & Belsey, M. J. (2005). Biopharma licensing and M&A trends. Nature Reviews Drug Discovery, 4(4), 273–274.Pedhazur, E. J. (1997). Multiple regression in behavioral research: explanation and prediction.Piccart-Gebhart, M. J. (2014). The 41st David A. Karnofsky memorial award lecture: academic research worldwide—quo
vadis? Journal of Clinical Oncology, 32(4), 347–354.President’s Council of Advisors on Science and Technology. (2012). President’s council of advisors on science and
technology: propelling innovation in drug discovery, development, and evaluation—policy and medicine. RetrievedAugust 6, 2013, from http://www.policymed.com/
Read, S., Dew, N., Sarasvathy, S. D., Song, M., & Wiltbank, R. (2009). Marketing under uncertainty: the logic of an effectualapproach. Journal of Marketing, 73(3), 1–18.
Ahn et al. Journal of Innovation and Entrepreneurship (2015) 4:14 Page 18 of 19

Roy, A. (2012). Stifling new cures: the true cost of lengthy clinical drug trials. Project FDA report. New york: ManhattanInstitute for Policy Research, 5.
Sarasvathy, S. D. (2001). Causation and effectuation: toward a theoretical shift from economic inevitability toentrepreneurial contingency. Academy of Management Review, 26(2), 243–263.
Sarasvathy, S. D. (2008). Effectuation: elements of entrepreneurial expertise. Edward Elgar Publishing: United Kingdom.Sherry, A., & Henson, R. K. (2005). Conducting and interpreting canonical correlation analysis in personality research: a
user-friendly primer. Journal of Personality Assessment, 84(1), 37–48.Stewart, J. J., Allison, P. N., & Johnson, R. S. (2001). Putting a price on biotechnology. Nature Biotechnology, 19(9), 813–818.Su, Y.-S., Tsang, E. W., & Peng, M. W. (2009). How do internal capabilities and external partnerships affect
innovativeness? Asia Pacific Journal of Management, 26(2), 309–331.Thompson, B. (1985). Heuristics for teaching multivariate general linear model techniques (Annual meeting of the
American Educational Research Journal, Chicago, IL.(ERIC Document Reproduction Service No. ED 262 073)).Thompson, B. (1991). A primer on the logic and use of canonical correlation analysis. Measurement and Evaluation in
Counseling and Development, 24(2), 80–95.Tucker, R., Chase, L., Monge, P., & Cappella, J. (1980). Canonical correlation (Multivariate techniques in human
communication research, 205–228).Wierenga, D. E., & Eaton, C. R. (2006). Drug development and approval process (USA). Retrieved Dec 17, 2009, from http://
www.mr-tip.com/Wiltbank, R., Read, S., Dew, N., & Sarasvathy, S. D. (2009). Prediction and control under uncertainty: outcomes in angel
investing. Journal of Business Venturing, 24(2), 116–133.York, A. S., Dunham, L. M., & Ahn, M. (2011). Vertical versus horizontal integration in the biopharma industry: the link
between acquisition announcements and stock market performance. Advances in Mergers & Acquisitions, 10, 121–143.
Submit your manuscript to a journal and benefi t from:
7 Convenient online submission
7 Rigorous peer review
7 Immediate publication on acceptance
7 Open access: articles freely available online
7 High visibility within the fi eld
7 Retaining the copyright to your article
Submit your next manuscript at 7 springeropen.com
Ahn et al. Journal of Innovation and Entrepreneurship (2015) 4:14 Page 19 of 19


![Review Viral clearance for biopharmaceutical downstream ... · Viral clearance for biopharmaceutical downstream processes ... [13]. Hence a panel of ... Viral clearance for biopharmaceutical](https://img.pdfslide.net/doc/110x75/5ad5f65c7f8b9a5d058dd2b7/review-viral-clearance-for-biopharmaceutical-downstream-clearance-for-biopharmaceutical.jpg)