Embed Size (px)
Citation preview
ARTICLES
ON VISUAL FORMALISMS
The higraph, a general kind of diagramming object, forms a visual formalism of topological nature. Higraphs are suited for a wide array of applications to databases, knowledge representation, and, most notably, the behavioral specification of complex concurrent systems using the higraph-based language of statecharts.
DAVID HAREL
Visualizing information, especially information of com- plex and intricate nature, has for many years been the subject of considerable work by many people. The in- formation that interests us here is nonquantitative, but rather, of a structural, set-theoretical, and relational na- ture. This should be contrasted with the kinds of quan- titative information discussed at length in [43] and [46]. Consequently, we shall be interested in diagrammatic paradigms that are essentially topological in nature, not geometric, terming them topovisual in the sequel.
Two of the best known topo-visual formalisms have their roots in the work of the famous Swiss mathemati- cian Leonhard Euler (1707-1783). The first, of course, is the formalism of graphs, and the second is the notion of Euler circles, which later evolved into Venn diagrams. Graphs are implicit in Euler’s celebrated 1736 paper, in which he solved the problem of the bridges of Kiinigs- berg 1.121. (An English translation appears in [3].) Euler circles first appear in letters written by Euler in the early 1760s [13], and were modified to improve their ability to represent logical propositions by John Venn in 1880 [48, 491. (See [19, chap. 21 for more information.‘)
A graph, in its most basic form, is simply a set of point:s, or nodes, connected by edges or arcs. Its role is
’ Intere.jtingly. both these topo-visual actuevements of Euler were carried out during the period in which he could see with one eye only. (Euler lost sight in his right eye in 1735. and in the left around IX%.] It is tempting to attribute this in part to the fact that the lack of stereoscopic vision reduces one’s ability to estimate size and distance. possibly causing a sharper awareness of topolog- ical features.
Part of this work was carried out while the author was at the Computer Science Department of Carnegie-Mellon University. Pittsburgh. Pennsylvania.
e) 1988 ACM OOOI-0782/88/0500-0514 $1.50
to represent a (single] set of elements S and !some binary relation R on them. The precise meaning of the relation R is part of the application and has little to do with the mathematical properties of the graph itself. (Certain re- strictions on the relation R yield special classes of graphs that are of particular interest, such a,s ones that are connected, directed, acyclic, planar, or bipartite. There is no need to elaborate on the use of graphs in computer science-they are used extensively in vir- tually all branches of the field. The elements repre- sented by the nodes in these applications ra-nge from the most concrete (e.g., physical gates in a cj.rcuit dia- gram) to the most abstract (e.g., complexity classes in a classification schema), and the edges have been used to represent almost any conceivable kind of relation, in- cluding ones of temporal, causal, functional, or episte- mological nature. Obviously, graphs can be modified to support a number of different kinds of nodes and edges, representing different kinds of elements and. relation- ships.
A somewhat less widely used extension of graphs is the formalism of hypergraphs (see, e.g., [I]), though these are also finding applications in computer science, mainly in database theory (see [14], [IS], ami [sI]). A hypergraph is a graph in which the relation being spec- ified is not necessarily binary: in fact, it need not even be of fixed arity. Formally, an edge no longer connects a pair of nodes, but rather a subset thereof. ‘This makes hypergraphs somewhat less amenable to visual repre- sentation, but various ways of overcoming this diffi- culty can be conceived (see Figure 1). In analogy with graphs, several special kinds of hypergraphs are of par- ticular interest, such as directed or acyclic.
It is important to emphasize that the information
514 Comm!unicntions of the ACM May 1988 Volume .31 Number 5
Articles
conveyed by a graph or a hypergraph is nonmetric and captured by the purely topological notion of connected- ness (a term taken from [18]); shapes, locations, dis- tances, and sizes, for example, have no significance.
Although not quite as widely used as graphs, Euler circles, or Venn diagrams, are often used to represent logical propositions, color charts, etc. (see Figure 2). The basic idea is to appeal to the two-dimensional case of the Jordan curve theorem (e.g., [ll, 30]), which estab- lishes that simple closed curves partition the plane into disjoint inside and outside regions. A set is then repre- sented by the inside of such a curve,’ giving the topo- logical notions of enclosure, exclusion, and intersection of the curves their obvious set-theoretic meanings: being a subset of, being disjoint from, and having a nonempty intersection with, respectively.3
The bottom line is that, whereas graphs and hyper- graphs are a nice way of representing a set of elements together with some special relation(s) on them, Euler/ Venn diagrams are a nice way of representing a collec- tion of sets, together with some structural (i.e., set- theoretical) relationships between them. The difference between the two types of relationships is obvious. The structural ones are uniformly interpreted in the obvious set-theoretic fashion, in much the same way as the = symbol in logical formalisms is uniformly inter- preted as the equality predicate, whereas the edge rela- tions of graphs and hypergraphs attain different mean- ings in different applications.
The main observation motivating the present work is that in numerous computer-related applications the complexity of the objects, systems, or situations under consideration is due in large part to the fact that both capabilities are needed. We have a (usually large) num- ber of sets that are interrelated in nontrivial set-
’ Venn himself was not always consistent in this respect: see 149. p. 1171 01 [lg. p. 43) for a description of his five-set diagram.
3The topological paradigm used here is termed insideness in [18]
theoretic ways, but they are also related via one or more additional relationships of special nature, depend- ing on the application at hand. Furthermore, among the structural, set-theoretic relationships it is often desira- ble to identify the Cartesian product of some of the sets-an action that can be crucial in preventing cer- tain kinds of representations from growing exponen- tially in size. In line with these observations, which will be supported by examples in the sequel, the pur- pose of this article is to extend and combine Euler’s two topo-visual formalisms into a tool suitable for dealing with such cases.
In the next section, we introduce higruphs,4 first mod- ifying Euler/Venn diagrams somewhat. then extending them to represent the Cartesian product, and finally connecting the resulting curves by edges or hyperedges. [The appendix contains the formal syntax and seman- tics of simple higraphs.) We will then illustrate the power of the formalism by briefly discussing higraph- based versions of such graphical languages as entity- relationship diagrams, semantic and associative net- works, and dataflow diagrams. Later we will detail a less obvious application called statecharts [21], which are essentially a higraph-based version of finite-state machines and their transition diagrams.
HIGRAPHS Let us start with a simple example of Euler circles (Fig- ure 3). As can be seen, we prefer to use rounded rectan- gles, or rounded rectilinear shapes (rountungles?), rather than circles or unrestricted curves, and shall call the areas, or zones, they enclose blobs in the sequel. Sec- ond, as the formal definition supplied in the appendix shows, we regard each blob as denoting a certain kind
‘This is not a particularly successful choice of term. but was chosen never- theless to be reminiscent of hrgh graphs or hierarchal graphs. though our diagrams are not limited to being stratified in the way the word hrerarchrcnl might imply.
FIGURE 1. Graphical Representation of Hypergraphs
May 1988 Volume 32 Number 5 Communications of the ACM 515

Articles
FIGURE 2. Applications of Euler Circles, or Venn Diagrams
of set, with the nesting of curves denoting set inclusion, not set membership. Thus, Figure 3 can be seen to contain several cases of inclusion, disjointness, and intersection of sets.
For our first real departure from Euler and Venn’s treatment, we now require that every set of interest be represented by a unique blob, complete with its own full contour. One of the reasons for this is the desire to provide every set with its own area (e.g., for naming or labeling purposes). For example, does the A in Figure 3 represent the difference between the sets represented by the two large blobs, or the entire set on the upper left? The answer, following Venn’s notational conven- tions, would appear to be the former; but then how do we label the upper set itself?
Our solution is illustrated in Figure 4, where the two large intersecting blobs are clearly labeled A and D, the intersection A n D is labeled C, and the difference A - D is called B. In fact, had we left out B and its contour we could not refer to A - D at all. More pre-
85 0 I D
1 FIGURE 3. Simple Blobs
I
I
a 0 n
B El C
0 p
00 p s
83
Cl T
R
D
E u FIGURE 4. Adding Unique Contours for All Identifiable Sets
cisely, with this “unique-contour” convention, the only real, identifiable sets are the atomic sets, that is, those represented by blobs residing on the bottom levels of the diagram, containing no wholly enclosed blobs within. Any other blob merely denotes the compound set consisting of the union of all sets represented by blobs that are totally enclosed within it. The atomic blobs of Figure 4 are thus B, C, E, G, H, I, K, L, M, N. 0, Q, S, and, significantly, also T. The fact that T, as a Jordan curve, intersects R in Figure 4 does not necessar- ily mean that the sets represented by5 T and R really intersect or that T - R is nonempty. In fact, in our formalism, the intersection of two curves does not, in itself, mean anything since unless internal blobs appear in the appropriate places neither the difference nor the intersection of the sets they represent is itself identifia- ble. Thus, as far as the information present in Figure 4, T could just as well have been drawn completely dis-
‘In the sequel. we shall often blur the distinction between a ~cuwe. its associ- ated blob. and the set it depicts.
516 Communications of the ACM May 1988 Volume .31 Number 5
Articles
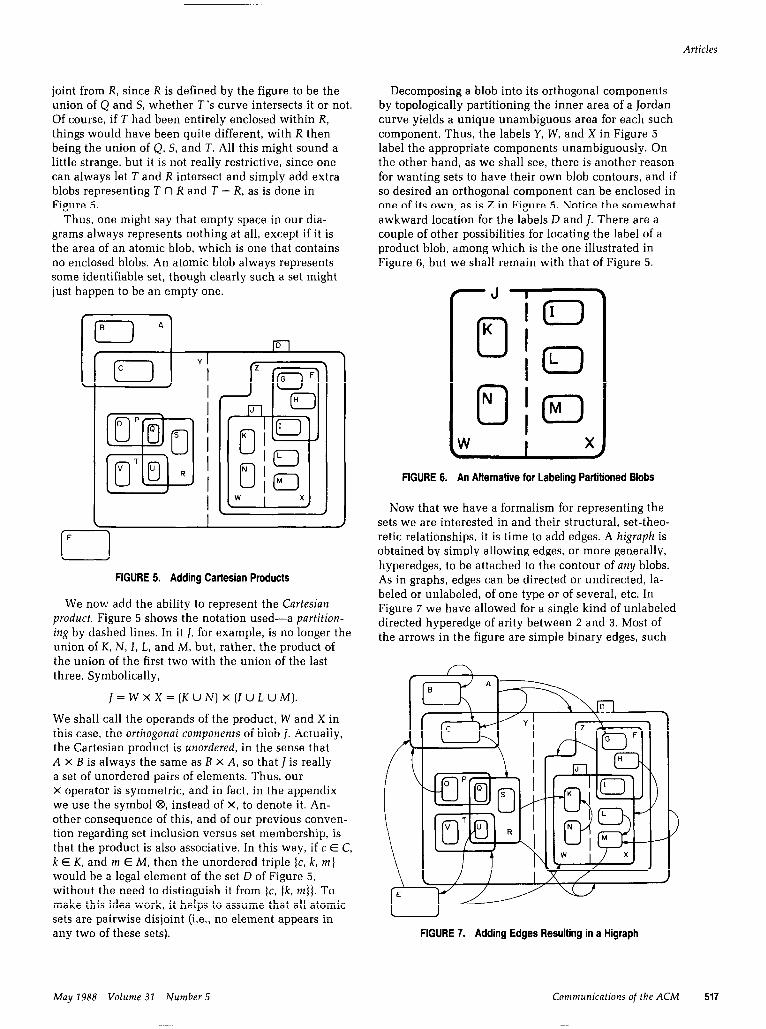
joint from R, since R is defin.ed by the figure to be the union of Q and S, whether T’s curve intersects it or not. Of course, if T had been entirely enclosed within R, things would have been quite different, with R then being the union of Q, S, and T. All this might sound a little strange, but it is not really restrictive, since one can always let T and R intersect and simply add extra blobs representing T f~ R and T - R, as is done in Figure 5.
Thus, one might say that empty space in our dia- grams always represents nothing at all, except if it is the area of an atomic blob, which is one that contains no enclosed blobs. An atomic blob always represents some identifiable set, though clearly such a set might just happen to be an empty one.
FIGURE 5. Adding Cartesian Products
We now add the ability to represent the Cartesian product. Figure 5 shows the notation used-a partition- ing by dashed lines. In it I, for example, is no longer the union of K, N, I, L, and M, but, rather, the product of the union of the first two with the union of the last three. Symbolically,
We shall call the operands of the product, W and X in this case, the orthogonal components of blob J. Actually, the Cartesian product is unordered, in the sense that A X B is always the same as B X A, so that J is really a set of unordered pairs of elements. Thus, our x operator is symmetric, and in fact, in the appendix we use the symbol @J, instead of X, to denote it. An- other consequence of this, and of our previous conven- tion regarding set inclusion versus set membership, is that the product is also associative. In this way, if c E C, k E K, and m E M, then the unordered triple {c, k, m 1 would be a legal element of the set D of Figure 5, without the need to distinguish it from {c, (k, m)]. To make this idea work, it helps to assume that all atomic sets are pairwise disjoint (i.e., no element appears in any two of these sets).
Decomposing a blob into its orthogonal components by topologically partitioning the inner area of a Jordan curve yields a unique unambiguous area for each such component. Thus, the labels Y, W, and X in Figure 5 label the appropriate components unambiguously. On the other hand, as we shall see, there is another reason for wanting sets to have their own blob contours, and if so desired an orthogonal component can be enclosed in one of its own, as is Z in Figure 5. Notice the somewhat awkward location for the labels D and I. There are a couple of other possibilities for locating the label of a product blob, among which is the one illustrated in Figure 6, but we shall remain with that of Figure 5.
-J-
FIGURE 6. An Alternative for Labeling Partitioned Blobs
Now that we have a formalism for representing the sets we are interested in and their structural, set-theo- retic relationships, it is time to add edges. A higraph is obtained by simply allowing edges, or more generally, hyperedges, to be attached to the contour of any blobs. As in graphs, edges can be directed or undirected, la- beled or unlabeled, of one type or of several, etc. In Figure 7 we have allowed for a single kind of unlabeled directed hyperedge of arity between 2 and 3. Most of the arrows in the figure are simple binary edges, such
1’ FIGURE 7. Adding Edges Resulting in a Higraph
May 1988 Volume 31 Number 5 Communications of the ACM 517

Articles
as the very high-level one connecting E to A, the very low-level one connecting N to K, and the interlevel one connecting U to E. Others are directed three-way hyperedges. such as the one connecting E to both ] and I’, and the one connecting both R and M to D. Clearly, there is nothing to prohibit self-directed or partially self-directed edges, such as the one connecting A to its subblob B. The formal meaning of such edges (see the appendix) in the graph-theoretic spirit simply associates the target blobs with the source blobs via the particular relationship the edges represent. Here, then, is the other reason for wanting each set of interest to have its own contour: to enable it to be connected to others via the edges.
In the sequel the term higraph will be used in a very liberal sense, making no real distinction between the various possibilities, for example, the edge-based or hyperedge-based cases.
we are free to attach any meaning at all to the relation- ship itself and to the way (if any) that it extends down- wards to the elements of those sets. Thus, if we take the relationship R represented by ordinary arrows in a higraph to mean “each element in the source set is related to some element in the target set by relationship T,” then the information conveyed by Figure 9, for ex- ample, cannot really by captured by an ordinary graph with T-edges, since one would be forced to decide which element in the target set is meant, thus causing an overspecification.
The computer science literature is full of uses of graphs, and it appears that many of these can benefit from.the extensions offered by higraphs. Consider the entity-relationship (E-R) diagrams used in the conceptual specification of databases [i’]. These are really hyper- graphs with a single type of node that is depicted by a rectangle and denotes an entity in the described pool of
FIGURE 8. Two Representations of a S-clique
SOME IMMEDIATE APPLICATIONS The first thing to notice when attempting to apply hi- graphs is that edges connect sets to sets, not elements to elements as in graphs. The most common way of inter- preting a higraph edge is as a collection of regular edges, connecting each element in one set with each element in the other. In this way, for example, it is possible to represent a 5-clique. as in Figure 8. This all- to-all semantics is not mandatory, however, since the bare meaning of a higraph edge is that the relationship it represents holds between the sets it connects. Hence,
(0 \
CO 0
CA
0 \
0,
0 )
FIGURE 9. A Simple Higraph
data. The hyperedges, whose labels are writien in small diamond-shaped boxes (that should not be regarded as nodes), capture the intended relationships between en- tities. Figure 10 shows a simple example of such a dia- gram, representing a small part of the data used by an airline company.6 Its information content is clear: pilots canflyaircraft,secretariesworkfor employees, and employees are paid salaries on certain dates (the latter being a three-way relation- ship). Notice, however, the is -a edges, informing us that pilots and secretaries are really employees too. These are conveying inforrnation of a totally different kind. Indeed, they capture precisely the kind of structural, set-theoretic relations discussed earlier. Using the very same “flat” diagrammatic repre- sentation for both kinds of relationships can cause a lot of confusion, especially in large and intricate cases, as a glance at some of the examples in the literature shows.
6Actually. Figure 10 does some injustIce to the E-R formalism. as it is some- times called. by ignoring the additIona features that the formahsm supports. such as attributes for both entities. and relationshios and the classification of relationships as one-one, many-one. etc. Throughout. we sha.1 have to be satisfied with describing only those features of a formalism th.lt are directly relevant to our discussion.
510 Communications of the ACM May 1988 Volume 31 Number 5

Articles
* dates
salaries
FIGURE 10. A Simple E-R Diagram
Figure 11 shows the way such information can be represented in a higraph-based extension of E-R dia- grams. The set of employees is divided into the sub- sets of interest, secretaries and pilots (with an additional blob for all others, if so desired). The paid-on edge emanates from the employees blob, while the can fly edge emanates from the pilots blob only-exactly what one would expect. The work for edge rightly connects the secretaries blob with its parent blob-employees. The new information has been quite easily added: aircraft are now just part of the overall equipment, which is related to years by the relationship received-on. while the dates on which salaries are received have been specified as consisting of pairs from the orthogonal components month and year. Moreover, independent divisions can be represented by overlapping blobs, as illustrated in Figure 12, which shows how a new breakup of the employees by sex can be added to the previous figure
FIGURE 11. A Higraph-Based Version (and extension) of Figure 10
-*.
yt- ?
employees (
4 ? __- can yx fly
+*’
FIGURE 12. Two Breakups of Employees
with a couple of additional details. In it we might have reason to relate the female pilots or the male secretaries to other entities. In practice, overlaps should probably be used somewhat sparingly, as overly overlapping blobs might detract from the clarity of the total diagram, an observation that is in line with the often-made claim that a hierarchy is by far the way humans prefer to structure things (see [45, chap. 11. This opinion is not universally accepted, however, so the human-factors aspects of formalisms like higraphs would appear to require careful experimental research, such as those carried out in [18] and [20].
Occasionally, authors have used other labels to cap- ture is -a relationships, typically ones that try to de- scribe the special nature of the breakup into subsets. As
May 1988 Volume 31 Number 5 Communications of the ACM 519

Articles
I I
I
FIGURE 13. Another E-R Diagram (taken from [39])
an example consider Figure 13, which is Figure 9 of [42] almost verbatim, and our higraph-based Figure 14, which contains the same information.
A formalism that is very similar to that of E-R dia- grams, and actually predated it by a number of years (see [40]), is that of semantic, or associative, networks. These graph-based structures are used widely in artifi- cial intelligence for natural language processing and knowledge representation, and are discussed in numer-
/ employee
L /
FIGURE 14. A Higraph-Based Version of Figure 13
ous books and papers. (A good survey and history ap- pears in [4], and more examples can be found in [6], [X7, [&I], and [SO] and in the collection of papers in [IY].) Semantic networks can actually be thought of as concept-relationship diagrams, with much of the research in the area concerned with the association of rich se- mantic meaning with the various types of nodes and edges. Here, too, is - a edges are used in abundance resulting in large, and at times incomprehensible, dia- grams. Often, semantic networks contain more than one distinct type of is - a edges, corresponding to set inclusion, set membership, a physical “being-part-of” relationship, etc.’ The way higraphs can be used here is exactly as in E-R diagrams; and the advantages become all the more significant if such different shades of struc- tural is -a relationships can be made visually distinct (see the section called “Possible Variations on the Theme”). Clearly, it would be naive to claim that the profound problematics of knowledge representation can be overcome by diagrammatic considerations alone. Nevertheless, every little improvement helps.
In both E-R diagrams and semantic networks, people have observed that often the relationships, not only the entities and concepts, have to be stratified by levels of
‘A variety of names have been attached to these, such as USA and lnst in [6], SS and EL in [37] (standing for is a. instance. subset. and elemenf, respec- tively). and many others elsewhere, such as a kind of, group-of. is part-of.etc.
520 Communications of the ACM May 1988 Volume 37 Number 5
Articles
detail. This is typically done by considering the dia- mond-shaped relationship labels to be nodes of a sec- ond kind, and involving them also in structural is a relationships with others. Although some people are opposed to this visual blurring of the distinction be- tween entities and relationships, there is nothing to prevent those who are not from transferring this idea to the higraph framework. This would yield a blob struc- ture also for the relationships, with the edges now serv- ing to connect the entities and concepts to their rele- vant real, nonstructural relationships.
It is noteworthy that the area of the blobs in a hi- graph can be further exploited in these applications. Full E-R diagrams and semantic networks are typically laden with attributes, or properties, that are attached as additional “stump” nodes to the various entities. These attributes are often of the kind that are “inherited down” the is -a hierarchy, as the phrase goes. [In fact, there are many interesting issues associated with the very notion of inheritance; see [5], [45].) In a higraph- based representation, the area inside a blob would ap- pear to be an ideal place to list, attach, or otherwise identify any properties, attributes, or explanations that are relevant to that blob and anything enclosed therein. Thus, simple inheritance is made possible quite natu- rally by the insideness approach to representing the subset relationship.
We should remark that some papers on semantic net- works and the E-R model have indeed suggested the use of insideness and interblob edges to represent high- level entities and relationships, though the ideas do not seem to have been pursued to their full potential (see [lo], [16], [25], [34], and [36]). Also, the idea of basing the decomposition of sets on Cartesian products and OR’s is consistent with much of the literature on types. (For example, see [5] where these two features are cap- tured by the notions of a record and a variant. respec- tively.)
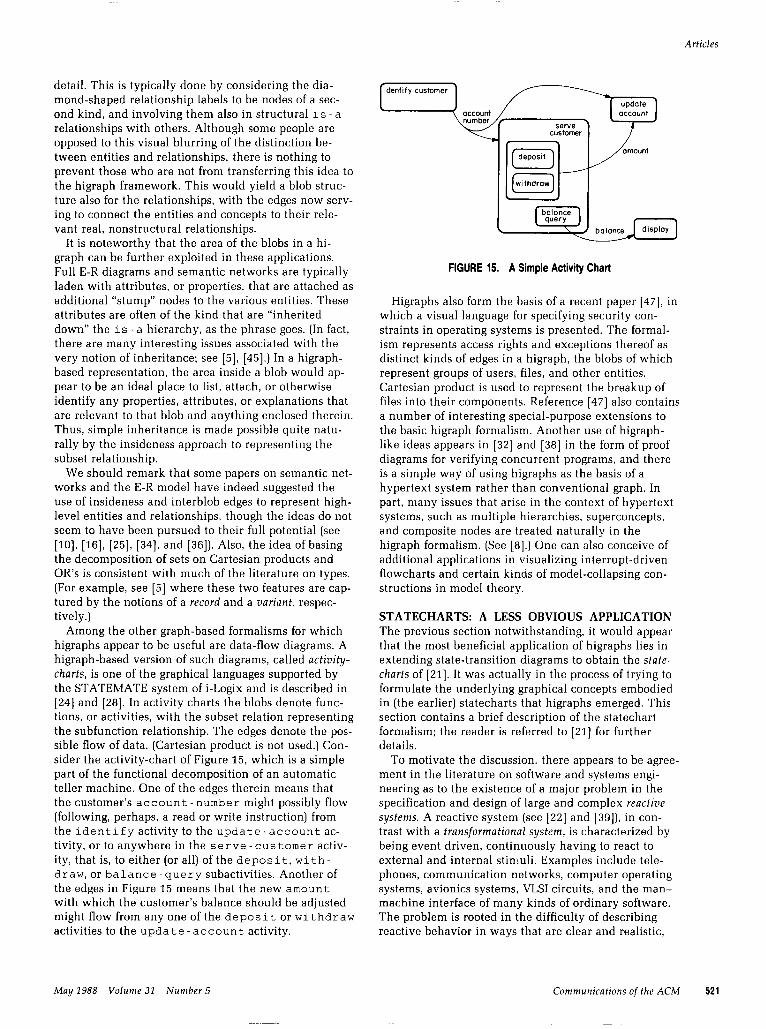
Among the other graph-based formalisms for which higraphs appear to be useful are data-flow diagrams. A higraph-based version of such diagrams, called activity- charts, is one of the graphical languages supported by the STATEMATE system of i-Logix and is described in [24] and [28]. In activity charts the blobs denote func- tions, or activities, with the subset relation representing the subfunction relationship. The edges denote the pos- sible flow of data. (Cartesian product is not used.) Con- sider the activity-chart of Figure 15, which is a simple part of the functional decomposition of an automatic teller machine. One of the edges therein means that the customer’s account-number might possibly flow (following, perhaps, a read or write instruction) from the identify activity to the update-account ac- tivity, or to anywhere in the serve-customer activ- ity, that is, to either (or all) of the deposit, with- draw, or balance-query subactivities. Another of the edges in Figure 15 means that the new amount with which the customer’s balance should be adjusted might flow from any one of the deposit or withdraw activities to the update-account activity.
FIGURE 15. A Simple Activity Chart
Higraphs also form the basis of a recent paper [4i’], in which a visual language for specifying security con- straints in operating systems is presented. The formal- ism represents access rights and exceptions thereof as distinct kinds of edges in a higraph, the blobs of which represent groups of users, files, and other entities. Cartesian product is used to represent the breakup of files into their components. Reference [47] also contains a number of interesting special-purpose extensions to the basic higraph formalism. Another use of higraph- like ideas appears in [32] and [38] in the form of proof diagrams for verifying concurrent programs, and there is a simple way of using higraphs as the basis of a hypertext system rather than conventional graph. In part, many issues that arise in the context of hypertext systems, such as multiple hierarchies, superconcepts, and composite nodes are treated naturally in the higraph formalism. (See [8].) One can also conceive of additional applications in visualizing interrupt-driven flowcharts and certain kinds of model-collapsing con- structions in model theory.
STATECHARTS: A LESS OBVIOUS APPLICATION The previous section notwithstanding, it would appear that the most beneficial application of higraphs lies in extending state-transition diagrams to obtain the stute- charts of [21]. It was actually in the process of trying to formulate the underlying graphical concepts embodied in (the earlier) statecharts that higraphs emerged. This section contains a brief description of the statechart formalism; the reader is referred to [21] for further details.
To motivate the discussion, there appears to be agree- ment in the literature on software and systems engi- neering as to the existence of a major problem in the specification and design of large and complex reactive systems. A reactive system (see [22] and [39]), in con- trast with a transformational system, is characterized by being event driven, continuously having to react to external and internal stimuli. Examples include tele- phones, communication networks, computer operating systems, avionics systems, VLSI circuits, and the man- machine interface of many kinds of ordinary software. The problem is rooted in the difficulty of describing reactive behavior in ways that are clear and realistic,
May 2988 Volume 31 Number 5 Communications of the ACM 521

Articles
D s A
I g(c)
ib C
(a)
FIGURE 16. Depth in State Charts
and at the same time formal and rigorous, in order to be amenable to precise computerized analysis. The be- havior of a reactive system is really the set of allowed sequences of input and output events, conditions, and actions, perhaps with some additional information such as timing constraints.
Most notable among the solutions proposed for this problem are Petri nets [41], communicating sequential processing (CSP) [26]. the calculus of communicating systems (CCS) [Xi], the sequence diagrams of [51], ES- TEREI, [2], and temporal logic [39]. Statecharts consti- tute yet another attempt at solving this problem, but one that is aimed at reviving the classical formalism of finite-state machines (FSMs) and their visual counter- part, state-transition diagrams, trying to make them suitable for use in large and complex applications. In- deed, ,people working on the design of really complex systems have all but given up on the use of conven- tional FSMs and their state diagrams for several rea- sons:
There have been attempts to remove some of these drawbacks, mostly by using various kinds of hierarchi- cal or communicating state machines. Typically, how- ever, these hierarchies provide little help in reducing the size of the resulting description, as they (do not condense any information. Moreover, the co-mmunica- tion between FSMs is usually one-to-one, be:ing channel or processor based, and allows for only a single set of communicating machines on the highest level of the description. Furthermore, for the most part such exten- sions are not particularly diagrammatic in spirit, and hence one loses the advantages a visual medium might offer.
Statecharts are a higraph-based extension of standard state-transition diagrams, where the blobs represent states and arrows represent transitions. (For (additional statechart features, the reader is again referred to [21].)9 As to the basics, we might say that
state charts = state diagrams + depth
(1) State diagrams are “flat.” They provide no natu- ral noiion of depth, hierarchy, or modularity, and therefore do not support stepwise, top-down, or bottom- up development.
+ orthogonality + broadcast communication.
(2) State diagrams are uneconomical when it comes to transitions. An event that causes the very same tran- sition from a large number of states, such as a high- level interrupt, must be attached to each of them sepa- rately resulting in an unnecessary multitude of arrows.
(3) State diagrams are extremely uneconomical, in- deed quite infeasible, when it comes to states (at least when .states are interpreted in the usual way as “snap- shots” of the situation at a given point in time). As the system under description grows linearly, the number of states Igrows exponentially, and the conventional FSM formalism forces one to explicitly represent them all.
(4) Finally, state diagrams are inherently sequential in nature and do not cater for concurrency in a natural way.8
Depth is represented by the insideness of blobs, as illustrated in Figure 16, where 16b may replace 16a. The symbols e, f, g, and h stand for events that trigger the transitions, and the bracketed c is a condition. Thus, g[c] triggers the transition from A to C if and when g occurs, but only if c is true at that time. The fact that A and C do not overlap and are completely inside D means that the latter is the exclusive-or (XOR) of the former, so that being in D is tantamount to being in either A or C, but not in both. The main point here is that the f-arrow, which leaves the contour of D, applies to both A and C, as in 16a. This simple higraph-based principle, when applied to large collections of states with many levels, helps overcome points (1) and (2) above (flatness and multilevel events). The iclea of ex- ploiting this kind of insideness in describing levels in a state-transition diagram appears also in [2O]. It should be noted that the small default arrows depend on their
‘Here. modebng a highly concurrent system by its global states only is ‘Some encouraging experimental evidence as to the appropriatkness of state- considered unnatural. charts for system description is discussed in [ZI. sect. 91.
W
522 Communications of the ACM May 1988 Volume 3 1 Number 5
Articles
encompassing blobs. In Figure 16a state A is singled out as being the default, or start state, of the three, a fact represented in 16b by the top default arrow. The bot- tom one, however, states that C is default among A and C if we are already in D and hence alleviates the need for continuing the h-arrow beyond D’s boundary.
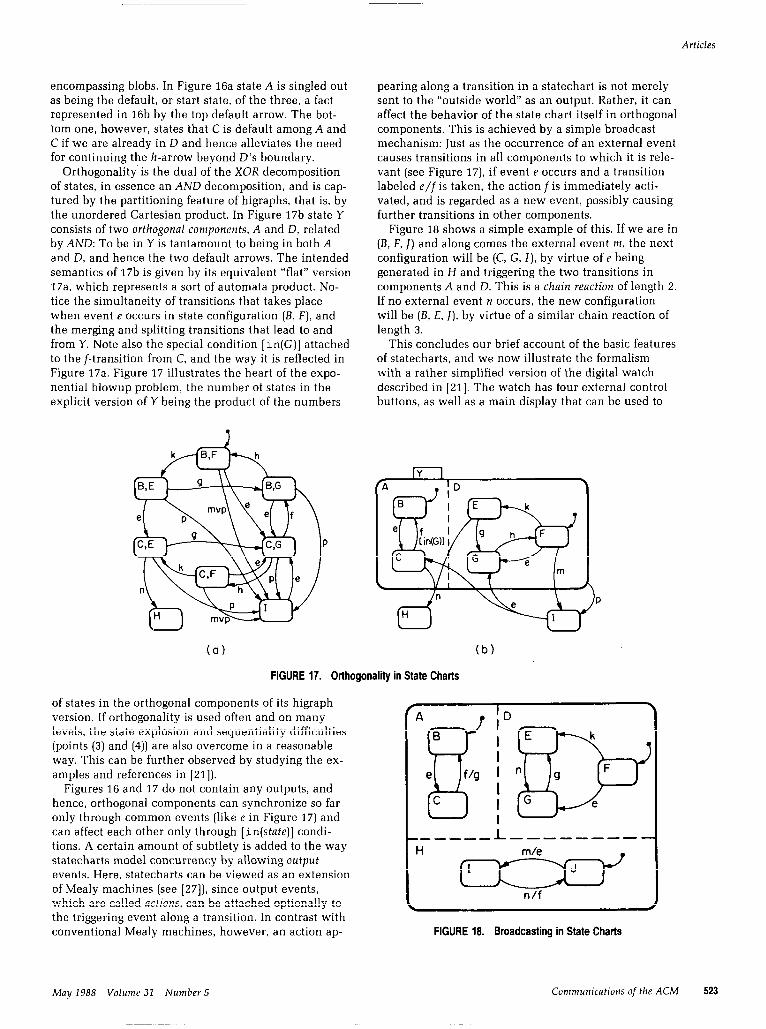
Orthogonality is the dual of the XOR decomposition of states, in essence an AND decomposition, and is cap- tured by the partitioning feature of higraphs, that is, by the unordered Cartesian product. In Figure 17b state Y consists of two orthogonal components, A and D, related by AND: To be in Y is tantamount to being in both A and D, and hence the two default arrows. The intended semantics of 17b is given by its equivalent “flat” version 17a, which represents a sort of automata product. No- tice the simultaneity of transitions that takes place when event e occurs in state configuration (B, F), and the merging and splitting transitions that lead to and from Y. Note also the special condition [In(G)] attached to the f-transition from C, and the way it is reflected in Figure 17a. Figure 17 illustrates the heart of the expo- nential blowup problem, the number of states in the explicit version of Y being the product of the numbers
(a)
pearing along a transition in a statechart is not merely sent to the “outside world” as an output. Rather, it can affect the behavior of the state chart itself in orthogonal components. This is achieved by a simple broadcast mechanism: Just as the occurrence of an external event causes transitions in all components to which it is rele- vant (see Figure 17), if event e occurs and a transition labeled e/f is taken, the action f is immediately acti- vated, and is regarded as a new event, possibly causing further transitions in other components.
Figure 18 shows a simple example of this. If we are in (B, F, 1) and along comes the external event m, the next configuration will be (C, G, I), by virtue of e being generated in H and triggering the two transitions in components A and D. This is a chain reaction of length 2. If no external event n occurs, the new configuration will be (B, E, I). by virtue of a similar chain reaction of length 3.
This concludes our brief account of the basic features of statecharts, and we now illustrate the formalism with a rather simplified version of the digital watch described in [21]. The watch has four external control buttons, as well as a main display that can be used to
A
P
FIGURE 17. Orthogonality in State Charts
of states in the orthogonal components of its higraph version. If orthogonality is used often and on many levels, the state explosion and sequentiality difficulties (points (3) and (4)) are also overcome in a reasonable way. This can be further observed by studying the ex- amples and references in [21]).
Figures 16 and 17 do not contain any outputs, and hence, orthogonal components can synchronize so far only through common events (like e in Figure 17) and can affect each other only through [in(state)] condi- tions. A certain amount of subtlety is added to the way statecharts model concurrency by allowing output events. Here, statecharts can be viewed as an extension of Mealy machines (see [27]), since output events, which are called actions, can be attached optionally to the triggering event along a transition. In contrast with conventional Mealy machines, however, an action ap-
(b)
A P !D B
lx
e f&l
C
------ H
-----se-
m/e m
(’ n/f
FIGURE 18. Broadcasting in State Charts
May 1988 Volume 31 Number 5 Communications of the ACM 523

Articles
show the time (hour, minutes, and seconds) or the date (weekday, day of month, and month). It has a chime that can be enabled or disabled, beeping on the hour if enabled. It has an alarm that can also be en- abled or disabled, and beeps for z minutes when the time in the alarm setting is reached unless any one of the buttons is pressed earlier. It has a stopwatch with two d.isplay modes (regular and lap), a light for illu- mina.tion, and a weak- battery blinking indication.
Sorne of the external events relevant to the watch are a, b, c, and d, which signify the pressing of the four buttons, respectively, and b-up, for example, which signifies the release of button b. Another event we shall be us:ing, 2 -min, signifies that 2 minutes have elapsed since the last time a button was pressed. (We choose not to get involved here in a syntax for the event expressions themselves. In a language of compound events that includes a time-out construct, such as that of [24] and [28], this last event can be expressed easily.)
2-mm [not in (stopvotch)l (
I
isploys
FIGURE 19. Part of the displays State in a Digital Watch
Statecharts can be used to describe the behavior of the watch in terms of its human interface: namely, how the user’s operations, such as pressing buttons, influ- ence I hings. It should be noted, however, that the de- scriptions that follow do not specify the activities car- ried out internally by the watch, only their control. Thus, nothing is said here about the time elapsing ac- tivity itself, or the technicalities of the beeping, the blinking, or the displays. These aspects of a system can be described using other means, and should be incorpo- rated into the overall specification together with the statecharts. (See [24] for one approach to this incorpora- tion.)
Figure 19 shows the basic displays state of the watch.. Notice that time is the default state, and there is a cycle of pressings of a leading from time through the alarm, chime, and stopwatch states back to time. There is a general update state, and a special state for updating the alarm’s internal setting. The 2 min event signifies return to time if 2 minutes have elapsed in any state other than stopwatch and no button has been pressed.
time f-1
FIGURE 20. The stopwatch State
The specification of the watch contains examples of orthogonal states on various levels. We should first con- sider the stopwatch state, detailed in Figure 20. It has two substates, zero and (disp, run), the first being the default. Pressing b takes the stopwatch from the former to the latter causing it to start running with a regular display. Repeatedly pressing b causes it to stop and start alternately. Pressing d can be seen to cause the display to switch to lap and back to reg, or to leave the orthogonal state and return to zero depend- ing, as illustrated, on the present state configuration. The encircled and starred H is one of the additional notations described in [21], and prescribes that, upon entering stopwatch from chime by pressing a, the state actually entered will be the one in which the system was in most recently. Thus, we are entering the stopwatch state by “history’‘-hence, the 13. The de- fault will be used if this is the first time stopwatch is entered, or if the history has been cleared.
The description of the high levels of the watch also uses orthogonality. In Figure 21 the watch is specified as being either dead or alive, with the latter consist- ing of five orthogonal components. (Notice where the
FIGURE 21. A High-Level Description of the ‘Watch
524 Communications of the ACM May 1988 Volume 31 Number 5

Articles
[not in(stopwatch)l
FIGURE 22. A State Chart far the Digital Watch
displays state fits in.) In this figure the events bt - in, bt rm, bt - dy and bt wk signify, respectively, the in- sertion, removal, expiration, and weakening (below a certain level) of the battery. We use t-hits - tm to
signify that the internal time of the watch has reached the internal time setting of the alarm, and t-hits hr to signify that it has reached a whole hour. Also, beep- rt occurs when either any button is pressed or 2 minutes have elapsed since entering beep, and beep- st occurs 2 seconds after entering c -beep. (As men- tioned, these events should also be written formally as compound event expressions in a language involving time-outs, disjunctions, and so on; see [28].)
The first of the five components in Figure 21, main, specifies the transitions between displaying and beep- ing, where displays is simply the state described ear- lier (see Figure 19). (In actuality, the displaying activi- ties themselves do not shut off when the watch is beep- ing, but cannot be changed until control returns to the
displays state.) The alarm-St component describes the status of the alarm, specifying that it can be changed using d when control is in the alarm display state. The chime - st state is similar, with the addi- tional provision for beeping on the hour given within. The power state is self-explanatory, where the activity that would take place in the weak state would involve the displays blinking frantically.
In considering the innocent-looking light state, the default is off, and depressing and releasing b cause the light to switch alternately between on and off. What is interesting is the effect these actions might have elsewhere. If the entire statechart for the parts of the watch described so far is contemplated (see Figure 22), one realizes that pressing b for illumination has significant side effects: It will cause a return from an update state if we happen to be in one, the stopping of the alarm if it happens to be beeping, and a change in the stopwatch’s behavior if we happen to be working
May 1988 Volume 31 Number 5 Communications of the ACM 525

Articles
with it. Conversely, if we use b in displays for any one of these things the light will go on, whether we like il. or not. These seeming anomalies are all a result of the fact that the light component is orthogonal to the main component, meaning that its scope is very broad. One c:an imagine a far more humble light compo- nent, applicable only in the time and date states, which would not cause any of these problems. Its speci- fication could be carried out by attaching it orthogo- nally, not to main, but to a new state surrounding time and date, as in Figure 23.
stopbvat pj m olorm
1 # I 0 I I I I
FIGURE 23. A Smaller Scope for the Light
As mentioned earlier, this section has only described the “no-frills” version of the statecharts. A more com- plete ireatment appears in [21], and a formal syntax and semantics appear in [23]. The reader may have noticed that we have not used intersecting states in the statecharts. While intersecting blobs in higraphs do not cause any serious semantic problems (see the appen- dix), intersecting states in state charts do. In fact, since not all syntactically legal higraphs make sense as state- charts, it is not even clear how to define an appropriate syntax for statecharts with intersecting states (see [21, sect. 6.21). A preliminary approach to these problems appears in [29].
POSSI:BLE VARIATIONS ON THE THEME The higraph formalism can be enriched and extended in various ways. We shall point to a few of these possi- bilities briefly and informally.
At times it becomes useful to base a formalism on a three-valued, rather than a two-valued, underlying model. For example, in certain uses of graphs in data- bases .and artificial intelligence there arises a need to state not only that a certain relationship R holds or does not hold between two objects, but also to capture the situation whereby we do not know which of these is the case. One possibility is to reinterpret the absence of an R arrow as denoting the don’t-known situation, and have a new kind of arrow representing the negntzve information that R definitely does not hold. This simple idea can be adopted in higraphs too, as in Figure 24, which is suppose to indicate that R holds between A and B and does not hold between B and C. and that all
FIGURE 24. Negative Arrows
other possibilities (including whether or not R holds between C and B)“’ are left open.
Often a don’t-know option is needed not only for arrows, but for blobs as well. That is, we might want to represent uncertainty as to the presence or absence of identifiable sets, rather than relationships. Accordingly, we can use a new blob notation (e.g., one with a dashed contour) to denote a set that we are not sure actually exists (here one assumes that all regular blobs stand for nonempty sets). Figure 25 asserts our uncertainty as to whether A - B is empty or not, and also states that if it is not empty then the difference is called E and is re- lated to F via relationship R.
FIGURE 25. “Not-Quite-Sure” Blobs
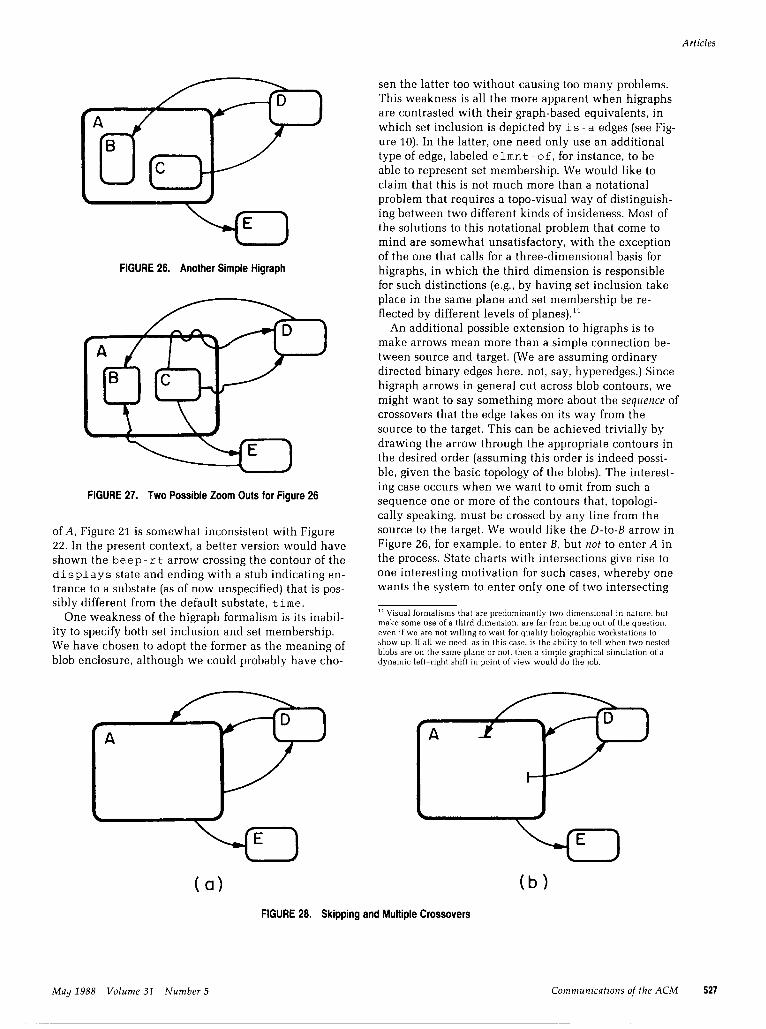
When higraphs are used in practice (see [21]. [24], [28], and [47]), it is useful to be able to “zoom out” of a particular view, suppressing low-level details. A good example would be going from Figure 22, the detailed state-chart description of the watch, to the less detailed Figure 21. In such cases there arises a problem with edges connected to subblobs that are omitted from the new, less detailed view. If we decide to zoom out of the likes of Figure 26 by suppressing blobs B and C, it might be a mistake to consider Figure 27a as the correct new version, since the two are clearly inconsistent. Figure 27b is better, with its stubs that represent relationships to unspecified subblobs. For example, since a state- chart arrow whose target is a high-level state A pre- scribes entrance to none other than the default substate
“This is not determined by the arrow from A to B. since. as discussed earlier. the fact that R holds between A and B says nothing about what the case is for A’s subsets.
526 Communications of the ACM May 1988 Volume 32 Number 5
Articles
FIGURE 26. Another Simple Higraph
FIGURE 27. Two Possible Zoom Outs for Figure 26
of A, Figure 21 is somewhat inconsistent with Figure 22. In the present context, a better version would have shown the beep- rt arrow crossing the contour of the displays state and ending with a stub indicating en- trance to a substate (as of now unspecified) that is pos- sibly different from the default substate, time.
One weakness of the higraph formalism is its inabil- ity to specify both set inclusion and set membership. We have chosen to adopt the former as the meaning of blob enclosure, although we could probably have cho-
sen the latter too without causing too many problems. This weakness is all the more apparent when higraphs are contrasted with their graph-based equivalents, in which set inclusion is depicted by is a edges (see Fig- ure 10). In the latter, one need only use an additional type of edge, labeled elmnt -of, for instance, to be able to represent set membership. We would like to claim that this is not much more than a notational problem that requires a topo-visual way of distinguish- ing between two different kinds of insideness. Most of the solutions to this notational problem that come to mind are somewhat unsatisfactory, with the exception of the one that calls for a three-dimensional basis for higraphs, in which the third dimension is responsible for such distinctions (e.g., by having set inclusion take place in the same plane and set membership be re- flected by different levels of planes).”
An additional possible extension to higraphs is to make arrows mean more than a simple connection be- tween source and target. (We are assuming ordinary directed binary edges here, not, say, hyperedges.) Since higraph arrows in general cut across blob contours, we might want to say something more about the sequence of crossovers that the edge takes on its way from the source to the target. This can be achieved trivially by drawing the arrow through the appropriate contours in the desired order (assuming this order is indeed possi- ble, given the basic topology of the blobs). The interest- ing case occurs when we want to omit from such a sequence one or more of the contours that, topologi- tally speaking, must be crossed by any line from the source to the target. We would like the D-to-B arrow in Figure 26, for example, to enter B, but not to enter A in the process. State charts with intersections give rise to one interesting motivation for such cases, whereby one wants the system to enter only one of two intersecting
” Visual formalisms that are predominantly (w-dimensional in nature. but make some use of a third dimension. are far from being out of the question. even if we arc not willing to wait for quality holographic workstations to show up. If all we need. as in this case. is the ability to tell when two nested blobs are on the same plane or not. then a simple graphical simulation of a dynamic left-right shift in point of view would do the job.
(a) FIGURE 26. Skipping and Multiple Crossovers
(b)
May 1988 Volume 31 Number 5 Communications of the ACM 527
states; again, the reader is referred to [Zl, sec. 6.21 for cletails. This richer notion of an edge can be repre- sented visually by simply allowing arrows to skip edges as in Figure 28. Multiple crossovers, if desired, can also be represented as illustrated in the figure. Clearly, the forma1 semantics would be more elaborate, since a finite sequence of blobs, rather than an ordered pair, is the interpretation of a directed edge, and a finite set thereof, rather than an unordered pair, is the interpre- tation of an undirected edge.
CONCLUSION AND FUTURE WORK Higraphs seem to give rise to several interesting mathe- matical notions adapted to a large extent from graphs and hypergraphs. For example, one can provide reason- able definitions of connectivity, transitive closure, plan- arity, and acyclicity in higraphs, as well as a couple of different notions of “hitrees.” For each of these, we may ask for upper and lower bounds on the computational complexity of the corresponding algorithmic problems. In some cases algorithms and bounds can be carried over from the work on graphs and hypergraphs, but one gets the feeling that in other cases these bounds can be improved by utilizing the special structure of higraphs. Some of these algorithmic problems have indeed arisen during the implementation of the STATEMATE system [24, 281, which supports three higraph-based formal- isms. It would appear that the algorithmics of higraphs forms a fruitful avenue for further research.
The main thesis underlying this paper is that the intricate nature of a variety of computer-related sys- tems and situations can, and in our opinion should, be represented by visual formalisms: visual, because they are to be generated, comprehended, and communicated by humans; and formal, because they are to be manipu- lated, maintained, and analyzed by computers. (This thesis is consistent with the study in [9], which argues
for a more visual, nonverbal approach toward mathe- matics.)
Part of our motivation in stressing this point, despite the fact that it might appear to be so obvious, is the rather different approach that one occasionally finds elsewhere. For example, [33] is a compendium of many computer-related diagrammatic methods (virtually all of which are based on graphs). In our opinion, [33] is quite inadequate, since it accepts the visual, but appar- ently rejects the formal. For the most part, the methods and languages appearing in [33] are described in a man- ner that is devoid of semantics, and can therefore be used at best as informal aids when working with some other, hopefully more rigorous, nonvisual medium.
One of the implicit points we have tried to make in this article is that a considerable amount of mileage can be gotten out of basing such formalisms on a small number of simple diagrammatic notions, first and fore- most among which are those that are topological in nature, not geometric. A lot can be gained b:y using topo-visual formalisms based on insideness, connected- ness, and partitioning, with the semantics as given here, before one attempts to attach special significance to, for example, shapes, colors, and sizes.
We are entirely convinced the future is “visual.” We believe that in the next few years many more of our daily technical and scientific chores will be carried out visually, and graphical facilities will be far better and cheaper than today’s. The languages and approaches we shall be using in doing so will not be merely iconic in nature (e.g., using the picture of a trash can to de- note garbage collection), but inherently diagrammatic in a conceptual way, perhaps also three-dimensional and/or animated. They will be designed to encourage visual modes of thinking when tackling systems of ever-increasing complexity, and will exploit and ex- tend the use of our own wonderful visual sy.stem in many of our intellectual activities.
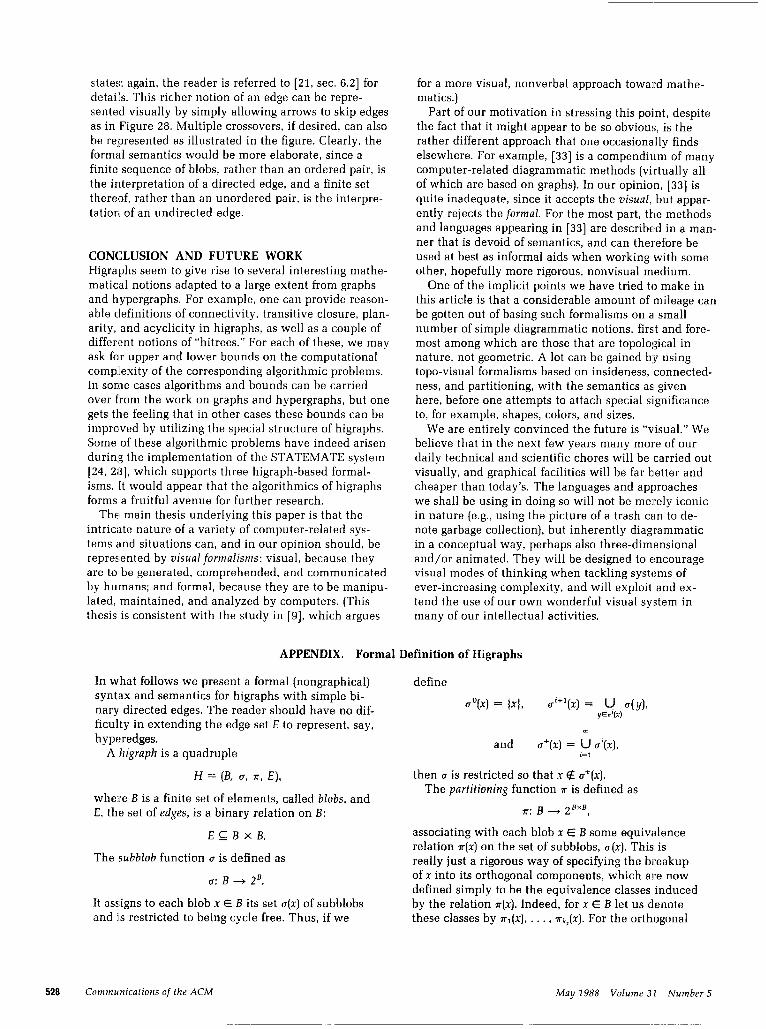
APPENDIX. Formal Definition of Higraphs
In what follows we present a forma1 (nongraphical) define syntax and semantics for higraphs with simple bi- nary directed edges. The reader should have no dif- uO(x) = kfl,
ficulty in extending the edge set E to represent, say, hyperedges.
A higraph is a quadruple and u’(x) = u U’(X),
i=l
H = (A u‘. s, E), then (r is restricted so that x 4 u+(x).
where B is a finite set of elements, called blobs, and E, the set of edges, is a binary relation on B:
EEBxB.
The partitioning function 1~ is defined as
7~: B ---, zBxB,
The subblob function u is defined as
a‘: B -+ 2B.
It assigns to each blob x E B its set u(x) of subblobs and is restricted to being cycle free. Thus, if we
associating with each blob x E B some equivalence relation r(x) on the set of subblobs, c(x). This is really just a rigorous way of specifying the breakup of x into its orthogonal components, which are now defined simply to be the equivalence classes induced by the relation VT(X). Indeed, for x E B let us denote these classes by K,(X), . . . , ?T&Y). For the orthogonal
528 Communications of the ACM May 1988 Volume 3 I Number 5

Articles
division into components to be representable graphi- cally (and in order to make the semantics cleaner), we shall require that blobs in different orthogonal components of x are disjoint. Formally, for each x we require that no two elements y and z of U(X) can intersect-that is, can satisfy u+(y) ft U+(Z) # 0- unless they are in the same orthogonal component- that is, unless the relation X(X) renders them equiva- lent. Clearly, k, = 1 means x is not partitioned into components at all.
the domain of the model M, and p assigns disjoint subsets of D to the atomic blobs of H. Thus,
/.L; A + 2O,
where if x # y then p(x) II p(y) = 0. We now have to show how to extend the association of atomic blobs with sets over D to an association of all blobs with more complex objects over D. Accordingly, extend ~1 by defining, inductively, for each x E B,
This concludes the syntax of higraphs; now for the semantics. Two notations are useful. Given a hi- graph H, define the set of atomic blobs to be
A = (x E B / a(x) = 01.
(Obviously, the finiteness of B and the cycle-freeness restriction on u imply A is nonempty.) The unordered Cartesian product of two sets S and T is defined as
S 8 T = (Is, t) J s E S, t E TJ.
Given a higraph H, a model for H is a pair
M = (D, ~1,
where D is a set of unstructured elements” called
the intuition being that to calculate the semantics of a blob x we form the unordered Cartesian product of the meanings of its orthogonal components, each of which, in turn, is simply the union of the meanings of its constituent blobs. In particular, of course, if k, = 1, no product is taken, and we really have
as expected. To complete the semantics, note that the edge set
E induces a semantic relation EM on the p(x)s, de- fined by
“We want to avoid situations in which. say. x and 1x1 are both elements of D (F(X), P(Y)) E EM iff (x, y) E E.
Acknowledgments. Thanks are due to Ton Kalker, Doug Tygar, and Jeanette Wing for comments on the appendix, and to an anonymous referee for a very de- tailed and thoughtful report.
1.5.
16.
REFERENCES 17. 1. Berge. C. Graphs nnd Hypergmphs. North-Holland, Amsterdam, 1973. 2. Berry. G.. and Cosserat, 1. The ESTEREL synchronous programming
language and its mathematical semantics. In Seminar on Concurrency. S. Brookes and G. Winskel, Eds. Lecture Notes in Computer Science, vol. 197. Springer-Verlag. New York. 1985. pp. 389-448.
3. B&s. N.L.. Lloyd, E.K.. and Wilson. R.J. Graph Theory: 1736-1936. Clarendon Press. Oxford. 1976.
18.
Fagin, R.. Mend&on. A., and Ullman. 1. A simplified universal relation assumption and its properties. ACM Trans. D&abase Syst. 7. 3 (Sept. 1982), 343-360. al-Fedaghi, S.S. An entity-relationship approach to modelling petro- leum engineering database. In Entity-Relationship Approach to Soff- ware Engineering. C.G. Davis et al.. Eds. Elsevier Science Publishers. Amsterdam. 1983, pp. 761-779. Findler. N.V.. Ed. Associative Networks: Representation and Use of Knowledge by Compufer. Academic Press. New York, 1979. Fitter. M.. and Green. T.R.G. When do diagrams make good com- puter languages? Inf. 1. Man-Mach. Sfud. II. 2 (March 1979), 235-261.
19.
20. 4. Brachman, R.J. On the epistemological status of semantic networks.
In Associative Nefworks: Representation and Use of Knowledge by Com- puter. N.V. Findler. Ed. Academic Press. New York. 1979, pp. 3-50.
5. Cardelli. L.A. Semantics of multiple inheritance in semantics of data types. Kahn. G. et al. Lecture Notes in Computer Science. vol. 173. Springer-Verlag. 1984. pp. 51-67.
21.
22.
6. Charniak. E.. and McDermott. D. Introduction 10 Arfificial Intelligence. Addison-Wesley, Reading, Mass.. 1985.
7. Chen, P.P.-S. The entity-relationship model-toward a unified view of data. ACM Trans. Database Syst. I. 1 (Mar. 1976). 9-36.
8. Conklin, J. Hypertext: An introduction and survey. IEEE Computer 20, 9 (Sept. 1987). 17-41.
23.
24.
9. Davis, P.J., Anderson. J.A. Nonanalytic aspects on mathematics and their implication on research and education. SIAM Review 21. 1 (Jan. 1979), 112-127.
10. dos San&. C.S.. Neuhold. E.J.. and Furtado. A.L. A data type ap- proach to the entity-relationship model. In Entity-Relationship Ap- proach to Systems Analysis and Design. P.P. Chen, Ed. North-Holland. Amsterdam. 1980, pp. 103-119.
25.
11. Dugundji. J. Topology. Allyn and Bacon. Boston, Mass., 1966. 12. Euler, L. Solutio problem&is ad geometriam situ pertinentis. Comm.
Acad. Sci. Imp. Petropol. 8 (1736), 128-140. 13. Euler. L. Lettres a unt? Princesse d’AIkmagne. Vol. 2. 1772 (letters
102-108).
26.
27.
14. Fagin. R. Degrees of acyclicity for hypergraphs and relational data- base schemes. 1. ACM 30, 3 (July 1983). 514-550.
28.
Gardner. M. Logic Machines and Diagrams. 2nd ed. University of Chicago Press. Chicago, Ill.. 1982. Green. T.R. Pictures of programs and other processes. or how to do things with lines. Behau. In[ Technol. I. 1 (1982). 3-36. Harel. D. Statecharts: A visual formalism for complex systems. Sci. Comput. Pro&nm. 8, 3 (June 1987), 231-274. Harel, D.. and Pnueli, A. On the development of reactive systems. In Logics and Models of Concurrent Systems. NATO, ASI Series, vol. 13. K.R. Apt, Ed. Springer-Verlag. New York, 1985. pp. 477-498. Harel. D.. Pnueli, A., Schn,idt. J.P., and Sherman, R. On the formal semantics of statecharts. In Proceedings of the 2nd IEEE Symposium on Logic in Computer Science (Ithaca. N.Y., June 22-24). IEEE Press. New York, 1987. pp. 54-64. Harel. D., Lachover. H.. Naamad. A.. Pnueli. A., Politi. M., Sherman. R., and Shtul-Trauring. A. STATEMENT: A working environment for the development of complex reactive systems. In Proceedings of the Tenth IEEE International Conference on Software Engineering (Singa- pore, April 13-15). IEEE Press. New York, 1988. Hendrix, G.G. Expanding the utility of semantic networks through partitioning. In Proceedings of the 4th Infernational Conference on Arti- ficial Infelligence (Tbilisi, Georgia. USSR, Sept. 3-8). International Joint Council on Artificial Intelligence, Cambridge. Mass., 1975, pp. 115-121. Hoare, C.A.R. Communicating sequential processes. Commun. ACM 21, 8 (Aug. 1978). 666-677. Hopcroft. J.E.. and Ullman. J.D. Introduction to Automata Theory. Lan- guages, and Computation. Addison-Wesley. Reading. Mass., 1979. i-logic. The languages of STATEMATE. Tech. Rep., i-Logix, Burling- ton. Mass., 1987.
May 1988 Volume 31 Number 5 Communications of the ACM 529
Articles
29. Kahana, CA. Statecharts with overlapping states. MS. thesis, Dept. of Mathematics and Computer Science, Bar-Ilan University, Ramat Can, Israel. 1986 (in Hebrew).
30. Lefschetz. S. lrrtroducfion to Topology. Princeton University Press, Pnnceton. N.J., 1949.
31. Maier. D.. and Ullman. I.D. Connections in acvclic bvoereranhs. In
32
33.
34.
35.
36.
37.
38.
39.
40.
41. 42.
43.
44.
Proceedings of the ACM &mposium on DatnbasbSystems (Los ingeles. Calif.. March 29-31). ACM. New York, 1982, pp. 34-39. Manna, Z.. and Pnueli, A. Specification and verification of cencur- rent programs by V-automata. In Proceedings of fhe 14th ACM Sympo- sium on Principles of Programming Languages (Munich). ACM, New York, 1987, pp. l-12. Martin. J.. and McClure. C. Diagramming Techniques for Analysts and Programmers. Prentice-Hall, En&wood Cliffs, N.J., 1985. McSkimin. J.R., and Minker. J. A predicate calculus based semantic nelwork for deductive searching. In Assouatiue Networks: Representa. fion and Use of Knowledge by Computer. N.V. Findler. Ed. Academic Press. New York, 1979, pp. 205-238. Miiner, R. A Calculus of Communicating Systems. Lecture Notes in Computer Science, vol. 92. Springer-Verlag. New York. 1980. Nakano, R. Integrity checking in a logic-oriented ER model. In Entity-Relationship Approach to Softivare Engineering, C.G. Davis et al.. Ed:;. Elsevier Science Publishers. Amsterdam, 1983. pp. 551-564. Nilsson, N.J. Prmciples of Arflficial Intelligence. Tioga. Palo Alto. Calif., 1980. Owicki. S.. and Lamport. L. Proving Iiveness properties of concur- rent programs. ACM Trans. Progmm. Lang. Syst. 4. 3 (July 1982), 455495. Pm&i, A. Applications of temporal logic to the specification and verification of reactive systems: A survey of current trends. In Current Trends in Concurrency. J. W. de Bakker et al., Eds. Lecture Notes in Computer Science. vol. 224. Springer-Verlag. New York, 19E:6. pp. 510-584. Quillian. M.R. Semantic memory. In Semantic Information Processing. M. Minsky, Ed. MIT Press, Cambridge, Mass.. 1968. pp. 227-270. Reisig, W. Pefri Nets: An Introduction. Springer-Verlag. Berlin, 1985. Schiffner. G.. and Schuermann. P. Multiple views and abstractions with an extended-entity-relationship model. Comput. Lang. 4. 3/4 (19791, 139-154. Schmid, C.F. Sfatistical Graphics: Dfrsign Principles and Practices. Wiley, New York, 1983. Shapiro, SC. A net structure for semantic information storage. de- duction. and retrieval. In Proceedings of the 2nd lnfernational Joint Conference on Artificial Infelllgence. 1971. pp. 512-523.
45. Touretzky, D.S. The Mathematics of Inheritance Systems. Pitman. Lon- don, and Morgan Kaufmann. Los Altos. Calif. 1986.
46. Tufte, E.R. The Visual Display of Quantitafiue Information. Graphics Press, Cheshire, Corm.. 1983.
47. Tygar, J.D.. and Wing. J.M. Visual specification of security con- straints. In The IEEE Workshop on Visual Languages (LinkGping, Swe- den. Aug. 19-21). IEEE Press. New York, 1987.
48. Venn. J. On the diagrammatic and mechanical representation of propositions and reasonings. Phil. Mug. (1880). 123.
49. Venn. J. Symbolic Logic. 2nd ed. London. 1894. (Reprinted by Chel- sea, Bronx, N.Y.. 1971.)
50. Woods, W.A. What’s in a link? Foundations for semantic networks. In Representation and Understanding. D.G. Bobrow and A.M. Collins, Eds. Academic Press, New York. 1975. pp. 35-82.
51. Zave. P. A distributed alternative. to finite-state-machine specifica- tions. ACM Trans. Program. Lang. Sysf. 7. 1 (Jan. 1985), 10-36.
CR Categories and Subject Descriptors: CO [Computer Systems Or- ganization]: General-sysfems specification methodology; C.3 [Computer Systems Organization]: Special-Purpose and Application-Based Sys- tems-real-time systems; D.0 [Software]: General; D.2.1 [Software Engi- neering]: Requirements/Specifications; D.2.21: Tools and Techniques; D.2.10 [Software Engineering]: Design; E.0 [Data]: General: E.l [Data]: Data Structures-graphs: F.l.l [Computation by Abstract Devices]: Models of Computation-au~omatn: H.l.O [Models and Pr.inciples]: Gen- eral: 1.2.4 [Artificial Intelligence]: Knowledge Representation Formal- isms and Methods-semantic networks
General Terms: Design. Languages, Theory Additional Key Words and Phrases: Higraph. reactive systems. state
charts. visual formalisms
Author’s Present Address: David Harel, Department of Applied Mathe- matics and Computer Science. The Weizmann Institute of Science, Rehovot. Israel 76100.
Permission to copy without fee all or part of this material is granted provided that the copies are not made or distributed for direct commer- cial advantage, the ACM copyright notice and the title of the publication and its date appear, and notice is given that copying is by permission of the Association for Computing Machinery. To copy other&e, or to republish, requires a fee and/or specific permission.
I 1987 I
8th POW-Symposium on Principles of Distributed Computing Vancouver, B.C., August 10-12. 1987. Sponsored by ACM
SIGACT and ACM SIGOPS. ISBN: O-89791-239-X. Order No.
536870. ACM SIGACT/SIGOPS Members: $18.00; Others: $24.00.
S&MOD ‘87-International Conference on Management of Data Snn Francisco, CA, May 27-29, 1987. Sponsored by ACM SIGMCID. ISBN: O-89791-236-5. Order No. 472870. ACM/
SIGMCID Members: $27.00; Others: $36.00.
S&PLAN ‘87-Symposium on Interpreters and Interpretive Techniques St. Paul, MN, June 24-26. 1987. Sponsored by ACM SIGPLAN.
ISBN: O-89791-235-7. Order No. 548870. ACM/SIGPLAN Members: $17.00; Others: $23.00.
14th International Symposium on Computer Architecture Pittsburgh, PA, June 3-6, 1987. Sponsored by ACM: SIGARCH and IEEE-CS. ISBN: 0-89791-223-O. Order No. 415870. ACM/
SIGARCH/IEEE-CS Members: $35.00; Others: $70.00.
24th DAC-Design Automation Conference Miami, FL, June 28-July 1. 1987. Sponsored by ACM SIGDA and IEEE-CS. ISBN: O-89791-234-9. Order No. 477870. ACM
SIGDA/IEEE-CS Members: $47.00; Others: $94.00.
3rd Symposium on Computational Geometry Waterloo, Ontario, June 8-10, 1987. Sponsored by ACM SIGACT
and SIGGRAPH. ISBM: O-89791-231-4. Order No. 429870.
ACM/SIGGRAPH/SIGACT Members: $20.00; Others: $27.00.
1987 International Conference on Artificial Intelligence and Law Boston, MA, May 27-29, 1987. Sponsored by Northeastern University and ACM SIGART. ISBN: O-89791-230-6. Order No.
604870. ACM SIGART Members: $16.00; Others: $21.00.
530 Comnrtrnications of the ACM May 1988 Volume 31 Number 5