Embed Size (px)
Citation preview
https://doi.org/10.1007/s11804-020-00142-6
RESEARCH ARTICLE
OnWave-Induced Elastic Deformations of a SubmergedWaveEnergy Device
Shuijin Li1 ·Masoud Hayatdavoodi1,2 · R. Cengiz Ertekin2
Received: 4 January 2019 / Accepted: 14 June 2020© The Author(s) 2020
AbstractStructural integrity has remained a challenge for design and analysis of wave energy devices. A difficulty in assessment ofthe structural integrity is often laid in the accurate determination of the wave-induced loads on the wave energy devices andthe repones of the structure. Decoupled hydroelastic response of a submerged, oscillating wave energy device to extremenonlinear wave loads is studied here. The submerged wave energy device consists of an oscillating horizontal disc attachedto a direct-drive power take-off system. The structural frame of the wave energy device is fixed on the seafloor in shallowwater. Several extreme wave conditions are considered in this study. The nonlinear wave loads on members of the submergedstructure are obtained by use of the level I Green-Naghdi equations and Morison’s equation for cylindrical members.Distribution of Von Mises stresses and the elastic response of the structure to the extreme wave loads are determined byuse of a finite element method. The decoupled hydroelastic analysis of the structure is carried out for devices built byfour different materials, namely stainless steel, concrete, aluminium alloy, and titanium alloy. The elastic response of thesedevices is studied and results are compared with each other. Points of maximum stress and deformations are determined andthe structural integrity under the extreme conditions is assessed. It is shown that the proposed approaches provide invaluableinformation about the structural integrity of wave energy devices.
Keywords Renewable energy · Wave energy converter · Wave loads · Hydroelasticity · Green-Naghdi equations
1 Introduction
A survey conducted by the World Energy Council (2013),and others before, shows that fossil fuel resources arereduced and its share over the world energy demandis decreasing annually. As the reserve of fossil-basedresources is limited, it is certain to be depleted in the future.Moreover, the use of fossil fuels has a significant negativeimpact on the global environment. In light of the above, theuse of renewable energy as a sustainable source of energyhas received significant attention in recent years. Johanssonet al. (2012), for example, predicted that renewable energy(biomass, hydro, wind, solar, and geothermal) will increase
� R. Cengiz [email protected]
1 Civil Engineering Department, School of Science andEngineering, University of Dundee, Dundee DD1 4HN, UK
2 College of Shipbuilding Engineering, Harbin EngineeringUniversity, Harbin 150001, China
from 10% of world energy supply in 2012 to 15%–30% in2030, to 20%–75% in 2050, and to 30%–95% in 2100.
There are four main categories of marine renewableenergy resources from the oceans, namely ocean thermalenergy conversion (OTEC), wave energy, current tidalenergy, and wind energy. Compared with other sourcesof marine renewable energy, wave energy has somedistinct advantages: (i) wave energy is highly availableand predictable, (ii) waves provide the highest energydensity, (iii) waves have little energy loss in a long distancetravel (e.g. see Clement et al. 2002; Thorpe 1999; Drewet al. 2009; Polinder and Scuotto 2005; Pelc and Fujita 2002for details).
The wave energy technology is relatively new. Econom-ically, it currently cannot compete with more mature tech-nologies, such as wind energy. However, the interest fromthe governments and industries is increasing steadily. Overthe past 25 years, wave energy technology has undergonea cycle of enthusiasm, disappointment, and reconsideration.But the continued development and efforts in technologyare constantly changing the performance of wave energytechnology.
/ Published online: 22 September 2020
Journal of Marine Science and Application (2020) 19:317–338
Wave energy is yet to become an economical solution.There are several challenges with typical wave energyconverter (WEC hereafter) devices (see Drew et al. 2009;Antonio 2010; Cruz 2007 for details). These include:
1) Converting the slow, random, high-force oscillatingmotion of waves into functional motion to generateelectricity,
2) Wave direction is usually variable. Most of the devices,however, are most effective in a certain direction,
3) The devices are often under the impact of extreme waveloads near the surface,
4) The ocean environment is highly corrosive, and deviceswith complex structure and components suffer from theoperation and maintenance challenges,
5) Floating devices on the surface create visual obstructionand limitation to shipping.
In response to some of the challenges with the existingwave energy devices, Hayatdavoodi et al. (2017a) haveproposed a fully submerged wave energy converter solution.The submerged wave energy device (SWED hereafter)consists of a horizontal disc connected to a direct-drivepower take-off (PTO) system. The disc is allowed tooscillate in the vertical direction due to the wave-inducedloads. Other motions of the disc are restricted by use ofguide rails. The device structure is fixed on the seabed.Since SWED is fully submerged, it is protected from theimpact of the extreme wave on the surface. In fact, extremewave conditions are desirable to SWED. The structure ofSWED is simple, it is relatively easy to maintain, and itoperates independent of the wave direction.
SWED can use corrosion resisting materials to operateunder seawater. A major component of the device is theoscillating disc. The oscillating part and the structural partsof SWED can be constructed using different corrosionresisting materials. This study is concerned with thestructural analysis of SWED, made up of concrete,aluminium alloy, titanium alloy and stainless steel.
In addition to SWED, submerged horizontal discs havebeen used as the core component of several other waveenergy devices (see, e.g., Carter and Ertekin 2014; Graw1997; Newman 2016, for various applications). Addition-ally, flapping foils have been used as an energy extractiondevice (see, e.g., Daniel 2002; Filippas et al. 2018; Jean-monod and Olivier 2017; Priovolos et al. 2018; Xiao andZhu 2014). The goal of this study is to determine the non-linear wave loads on a submerged horizontal disc, andcylindrical members of the wave energy device, and toassess the structural integrity under the extreme wave con-ditions. Various materials are proposed to construct waveenergy devices. This study aims to assess the vulnerabil-ity of the structures made by these materials, and hence
provide information on the suitability of such material forwave energy devices.
The submerged wave energy device is introduced inSection 2. This is followed by a discussion of the extremeenvironmental condition that is considered in this study. Thetheories used to determine the wave-induced loads on thestructure are given in Section 3, followed by a review ofthe structural analysis theory. The paper continues with theresults and discussion of wave loads on the energy deviceand deformation of the structure due to this loads. The paperis closed by the concluding remarks.
2 The SubmergedWave Energy Device
In responses to common challenges of the commercial waveenergy devices, Hayatdavoodi et al. (2017a) have proposeda fully submerged solution that functions independent of thewave direction.
The submerged wave energy device (SWED) consists ofa fully submerged body (circular disc or a three-dimensionalwedge shape) that is allowed to oscillate vertically due to thewave loads, while other motions are restricted. In this study,we confine our attention to an oscillating submerged disc.Propagation of waves above the submerged disc results in anoscillatory pressure differential above and below the disc.The pressure differential, in return, results in a net force(three-dimensional in general) on the disc. The oscillatorywave-induced forces cause vertical oscillations of the disc.Guide rails are used to restrict the motion of the disc in otherdirections. A schematic of SWED is shown in Figure 1, alsoshowing the coordinate system and directions that we use inthis section. The equation of the vertical motion of the discis given by
�F = ms,tt, (1)
where �F is the sum of vertical forces and m is the massof the disc. s = s(t) specifies the vertical position (in the z
direction) of the disc, measured from a fixed reference (herefrom the still-water level, SWL). s,tt is the instantaneousacceleration of the disc.
�F is the sum of all forces contributing to the verticaloscillation of the disc, namely the wave-induced verticalforce (Fz), the PTO force (FPTO), the spring (control) force(Fk), and the friction force (Ff ) between the disc and theguide rails, i.e.
�F = Fz + FPTO + Fk + Ff . (2)
In Eq. (2), Fk(z, t) = −k(s − s0), where k is the springstiffness and s0 is the initial (neutral) vertical position of thespring. The spring is used to control the motion of the disc.
Journal of Marine Science and Application 318
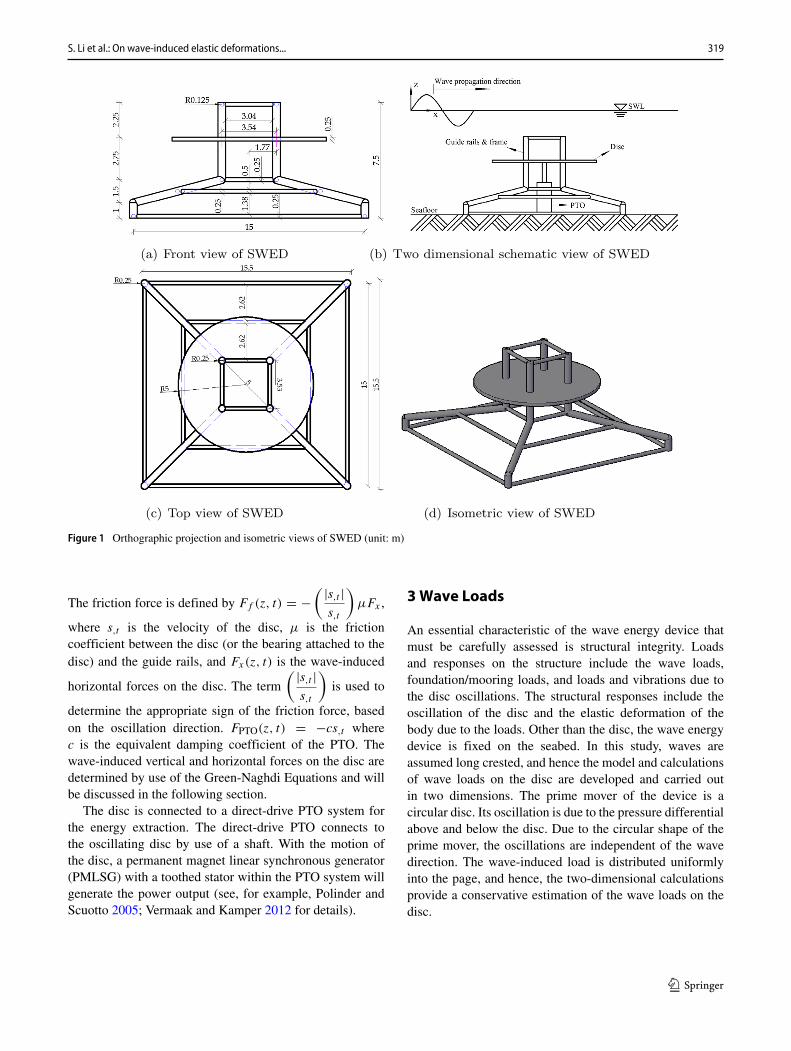
Figure 1 Orthographic projection and isometric views of SWED (unit: m)
The friction force is defined by Ff (z, t) = −( |s,t |
s,t
)μFx ,
where s,t is the velocity of the disc, μ is the frictioncoefficient between the disc (or the bearing attached to thedisc) and the guide rails, and Fx(z, t) is the wave-induced
horizontal forces on the disc. The term
( |s,t |s,t
)is used to
determine the appropriate sign of the friction force, basedon the oscillation direction. FPTO(z, t) = −cs,t wherec is the equivalent damping coefficient of the PTO. Thewave-induced vertical and horizontal forces on the disc aredetermined by use of the Green-Naghdi Equations and willbe discussed in the following section.
The disc is connected to a direct-drive PTO system forthe energy extraction. The direct-drive PTO connects tothe oscillating disc by use of a shaft. With the motion ofthe disc, a permanent magnet linear synchronous generator(PMLSG) with a toothed stator within the PTO system willgenerate the power output (see, for example, Polinder andScuotto 2005; Vermaak and Kamper 2012 for details).
3Wave Loads
An essential characteristic of the wave energy device thatmust be carefully assessed is structural integrity. Loadsand responses on the structure include the wave loads,foundation/mooring loads, and loads and vibrations due tothe disc oscillations. The structural responses include theoscillation of the disc and the elastic deformation of thebody due to the loads. Other than the disc, the wave energydevice is fixed on the seabed. In this study, waves areassumed long crested, and hence the model and calculationsof wave loads on the disc are developed and carried outin two dimensions. The prime mover of the device is acircular disc. Its oscillation is due to the pressure differentialabove and below the disc. Due to the circular shape of theprime mover, the oscillations are independent of the wavedirection. The wave-induced load is distributed uniformlyinto the page, and hence, the two-dimensional calculationsprovide a conservative estimation of the wave loads on thedisc.
S. Li et al.: On wave-induced elastic deformations... 319
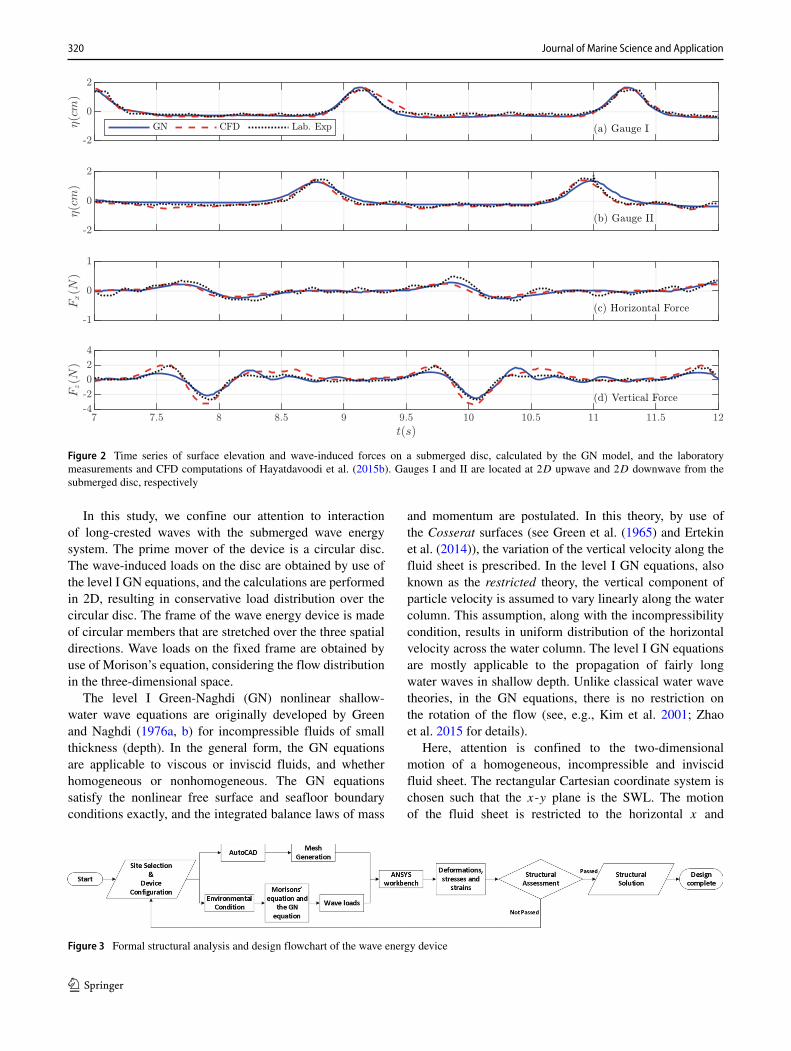
Figure 2 Time series of surface elevation and wave-induced forces on a submerged disc, calculated by the GN model, and the laboratorymeasurements and CFD computations of Hayatdavoodi et al. (2015b). Gauges I and II are located at 2D upwave and 2D downwave from thesubmerged disc, respectively
In this study, we confine our attention to interactionof long-crested waves with the submerged wave energysystem. The prime mover of the device is a circular disc.The wave-induced loads on the disc are obtained by use ofthe level I GN equations, and the calculations are performedin 2D, resulting in conservative load distribution over thecircular disc. The frame of the wave energy device is madeof circular members that are stretched over the three spatialdirections. Wave loads on the fixed frame are obtained byuse of Morison’s equation, considering the flow distributionin the three-dimensional space.
The level I Green-Naghdi (GN) nonlinear shallow-water wave equations are originally developed by Greenand Naghdi (1976a, b) for incompressible fluids of smallthickness (depth). In the general form, the GN equationsare applicable to viscous or inviscid fluids, and whetherhomogeneous or nonhomogeneous. The GN equationssatisfy the nonlinear free surface and seafloor boundaryconditions exactly, and the integrated balance laws of mass
and momentum are postulated. In this theory, by use ofthe Cosserat surfaces (see Green et al. (1965) and Ertekinet al. (2014)), the variation of the vertical velocity along thefluid sheet is prescribed. In the level I GN equations, alsoknown as the restricted theory, the vertical component ofparticle velocity is assumed to vary linearly along the watercolumn. This assumption, along with the incompressibilitycondition, results in uniform distribution of the horizontalvelocity across the water column. The level I GN equationsare mostly applicable to the propagation of fairly longwater waves in shallow depth. Unlike classical water wavetheories, in the GN equations, there is no restriction onthe rotation of the flow (see, e.g., Kim et al. 2001; Zhaoet al. 2015 for details).
Here, attention is confined to the two-dimensionalmotion of a homogeneous, incompressible and inviscidfluid sheet. The rectangular Cartesian coordinate system ischosen such that the x-y plane is the SWL. The motionof the fluid sheet is restricted to the horizontal x and
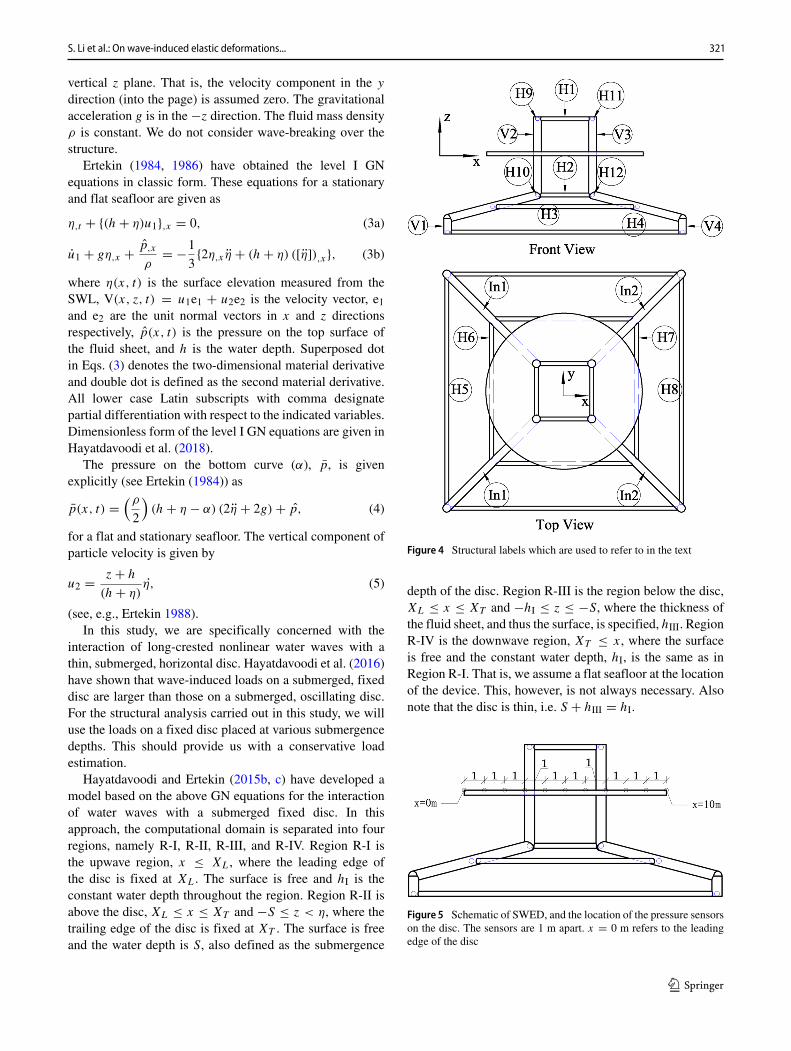
Figure 3 Formal structural analysis and design flowchart of the wave energy device
Journal of Marine Science and Application 320
vertical z plane. That is, the velocity component in the y
direction (into the page) is assumed zero. The gravitationalacceleration g is in the −z direction. The fluid mass densityρ is constant. We do not consider wave-breaking over thestructure.
Ertekin (1984, 1986) have obtained the level I GNequations in classic form. These equations for a stationaryand flat seafloor are given as
η,t + {(h + η)u1},x = 0, (3a)
u1 + gη,x + p,x
ρ= −1
3{2η,xη + (h + η) ([η]),x}, (3b)
where η(x, t) is the surface elevation measured from theSWL, V(x, z, t) = u1e1 + u2e2 is the velocity vector, e1and e2 are the unit normal vectors in x and z directionsrespectively, p(x, t) is the pressure on the top surface ofthe fluid sheet, and h is the water depth. Superposed dotin Eqs. (3) denotes the two-dimensional material derivativeand double dot is defined as the second material derivative.All lower case Latin subscripts with comma designatepartial differentiation with respect to the indicated variables.Dimensionless form of the level I GN equations are given inHayatdavoodi et al. (2018).
The pressure on the bottom curve (α), p, is givenexplicitly (see Ertekin (1984)) as
p(x, t) =(ρ
2
)(h + η − α) (2η + 2g) + p, (4)
for a flat and stationary seafloor. The vertical component ofparticle velocity is given by
u2 = z + h
(h + η)η, (5)
(see, e.g., Ertekin 1988).In this study, we are specifically concerned with the
interaction of long-crested nonlinear water waves with athin, submerged, horizontal disc. Hayatdavoodi et al. (2016)have shown that wave-induced loads on a submerged, fixeddisc are larger than those on a submerged, oscillating disc.For the structural analysis carried out in this study, we willuse the loads on a fixed disc placed at various submergencedepths. This should provide us with a conservative loadestimation.
Hayatdavoodi and Ertekin (2015b, c) have developed amodel based on the above GN equations for the interactionof water waves with a submerged fixed disc. In thisapproach, the computational domain is separated into fourregions, namely R-I, R-II, R-III, and R-IV. Region R-I isthe upwave region, x ≤ XL, where the leading edge ofthe disc is fixed at XL. The surface is free and hI is theconstant water depth throughout the region. Region R-II isabove the disc, XL ≤ x ≤ XT and −S ≤ z < η, where thetrailing edge of the disc is fixed at XT . The surface is freeand the water depth is S, also defined as the submergence
Figure 4 Structural labels which are used to refer to in the text
depth of the disc. Region R-III is the region below the disc,XL ≤ x ≤ XT and −hI ≤ z ≤ −S, where the thickness ofthe fluid sheet, and thus the surface, is specified, hIII. RegionR-IV is the downwave region, XT ≤ x, where the surfaceis free and the constant water depth, hI, is the same as inRegion R-I. That is, we assume a flat seafloor at the locationof the device. This, however, is not always necessary. Alsonote that the disc is thin, i.e. S + hIII = hI.
Figure 5 Schematic of SWED, and the location of the pressure sensorson the disc. The sensors are 1 m apart. x = 0 m refers to the leadingedge of the disc
S. Li et al.: On wave-induced elastic deformations... 321
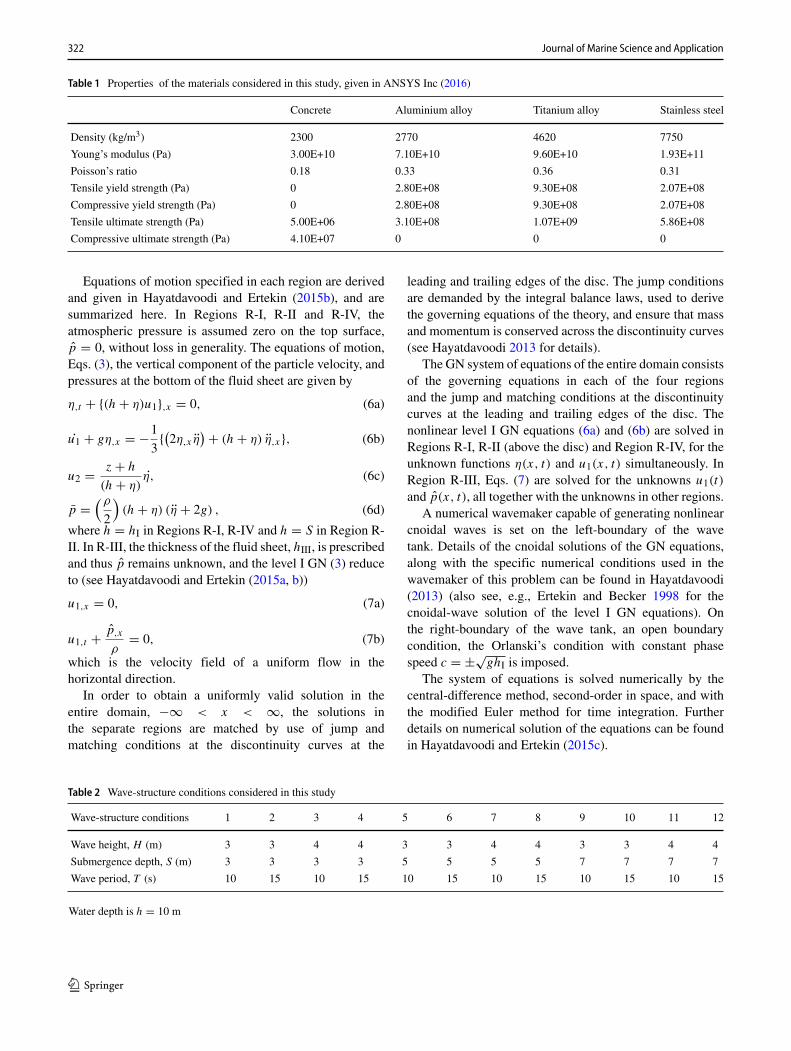
Table 1 Properties of the materials considered in this study, given in ANSYS Inc (2016)
Concrete Aluminium alloy Titanium alloy Stainless steel
Density (kg/m3) 2300 2770 4620 7750
Young’s modulus (Pa) 3.00E+10 7.10E+10 9.60E+10 1.93E+11
Poisson’s ratio 0.18 0.33 0.36 0.31
Tensile yield strength (Pa) 0 2.80E+08 9.30E+08 2.07E+08
Compressive yield strength (Pa) 0 2.80E+08 9.30E+08 2.07E+08
Tensile ultimate strength (Pa) 5.00E+06 3.10E+08 1.07E+09 5.86E+08
Compressive ultimate strength (Pa) 4.10E+07 0 0 0
Equations of motion specified in each region are derivedand given in Hayatdavoodi and Ertekin (2015b), and aresummarized here. In Regions R-I, R-II and R-IV, theatmospheric pressure is assumed zero on the top surface,p = 0, without loss in generality. The equations of motion,Eqs. (3), the vertical component of the particle velocity, andpressures at the bottom of the fluid sheet are given by
η,t + {(h + η)u1},x = 0, (6a)
u1 + gη,x = −1
3{(2η,xη
) + (h + η) η,x}, (6b)
u2 = z + h
(h + η)η, (6c)
p =(ρ
2
)(h + η) (η + 2g) , (6d)
where h = hI in Regions R-I, R-IV and h = S in Region R-II. In R-III, the thickness of the fluid sheet, hIII, is prescribedand thus p remains unknown, and the level I GN (3) reduceto (see Hayatdavoodi and Ertekin (2015a, b))
u1,x = 0, (7a)
u1,t + p,x
ρ= 0, (7b)
which is the velocity field of a uniform flow in thehorizontal direction.
In order to obtain a uniformly valid solution in theentire domain, −∞ < x < ∞, the solutions inthe separate regions are matched by use of jump andmatching conditions at the discontinuity curves at the
leading and trailing edges of the disc. The jump conditionsare demanded by the integral balance laws, used to derivethe governing equations of the theory, and ensure that massand momentum is conserved across the discontinuity curves(see Hayatdavoodi 2013 for details).
The GN system of equations of the entire domain consistsof the governing equations in each of the four regionsand the jump and matching conditions at the discontinuitycurves at the leading and trailing edges of the disc. Thenonlinear level I GN equations (6a) and (6b) are solved inRegions R-I, R-II (above the disc) and Region R-IV, for theunknown functions η(x, t) and u1(x, t) simultaneously. InRegion R-III, Eqs. (7) are solved for the unknowns u1(t)
and p(x, t), all together with the unknowns in other regions.A numerical wavemaker capable of generating nonlinear
cnoidal waves is set on the left-boundary of the wavetank. Details of the cnoidal solutions of the GN equations,along with the specific numerical conditions used in thewavemaker of this problem can be found in Hayatdavoodi(2013) (also see, e.g., Ertekin and Becker 1998 for thecnoidal-wave solution of the level I GN equations). Onthe right-boundary of the wave tank, an open boundarycondition, the Orlanski’s condition with constant phasespeed c = ±√
ghI is imposed.The system of equations is solved numerically by the
central-difference method, second-order in space, and withthe modified Euler method for time integration. Furtherdetails on numerical solution of the equations can be foundin Hayatdavoodi and Ertekin (2015c).
Table 2 Wave-structure conditions considered in this study
Wave-structure conditions 1 2 3 4 5 6 7 8 9 10 11 12
Wave height, H (m) 3 3 4 4 3 3 4 4 3 3 4 4
Submergence depth, S (m) 3 3 3 3 5 5 5 5 7 7 7 7
Wave period, T (s) 10 15 10 15 10 15 10 15 10 15 10 15
Water depth is h = 10 m
Journal of Marine Science and Application 322
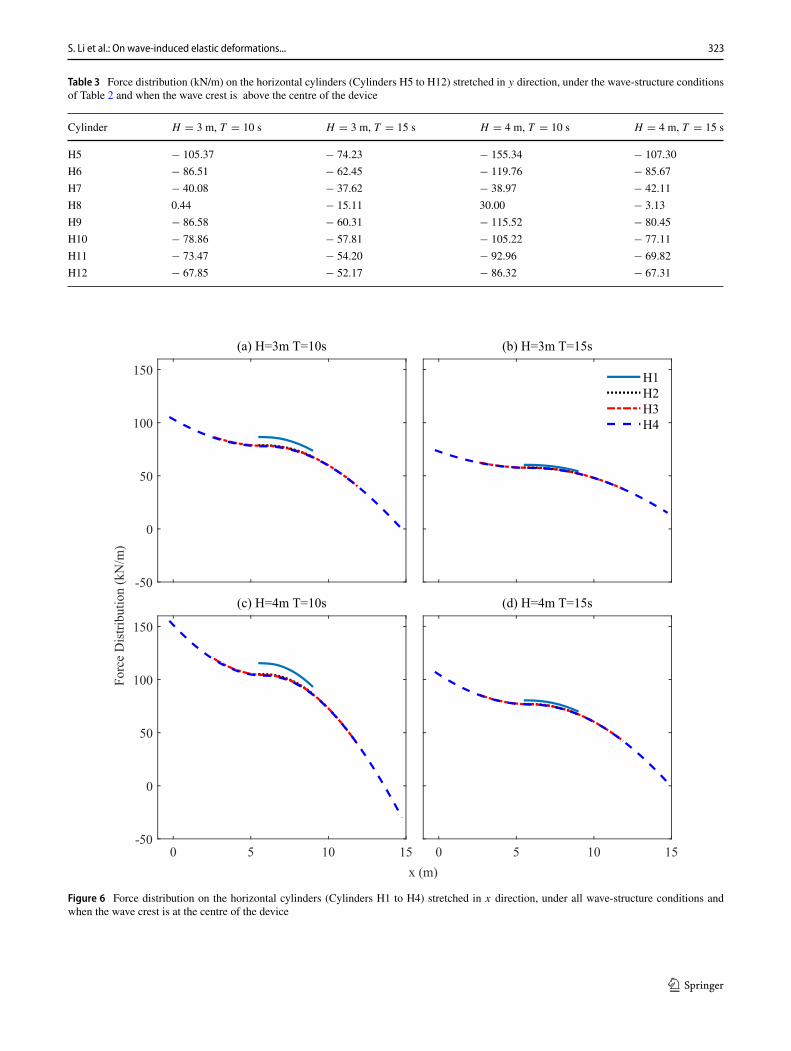
Table 3 Force distribution (kN/m) on the horizontal cylinders (Cylinders H5 to H12) stretched in y direction, under the wave-structure conditionsof Table 2 and when the wave crest is above the centre of the device
Cylinder H = 3 m, T = 10 s H = 3 m, T = 15 s H = 4 m, T = 10 s H = 4 m, T = 15 s
H5 − 105.37 − 74.23 − 155.34 − 107.30
H6 − 86.51 − 62.45 − 119.76 − 85.67
H7 − 40.08 − 37.62 − 38.97 − 42.11
H8 0.44 − 15.11 30.00 − 3.13
H9 − 86.58 − 60.31 − 115.52 − 80.45
H10 − 78.86 − 57.81 − 105.22 − 77.11
H11 − 73.47 − 54.20 − 92.96 − 69.82
H12 − 67.85 − 52.17 − 86.32 − 67.31
-50
0
50
100
150
(a) H=3m T=10s
Forc
e D
istr
ibuti
on (
kN
/m)
(b) H=3m T=15s
H1
H2
H3
H4
0 5 10 15-50
0
50
100
150
(c) H=4m T=10s
0 5 10 15
(d) H=4m T=15s
x (m)
Figure 6 Force distribution on the horizontal cylinders (Cylinders H1 to H4) stretched in x direction, under all wave-structure conditions andwhen the wave crest is at the centre of the device
S. Li et al.: On wave-induced elastic deformations... 323
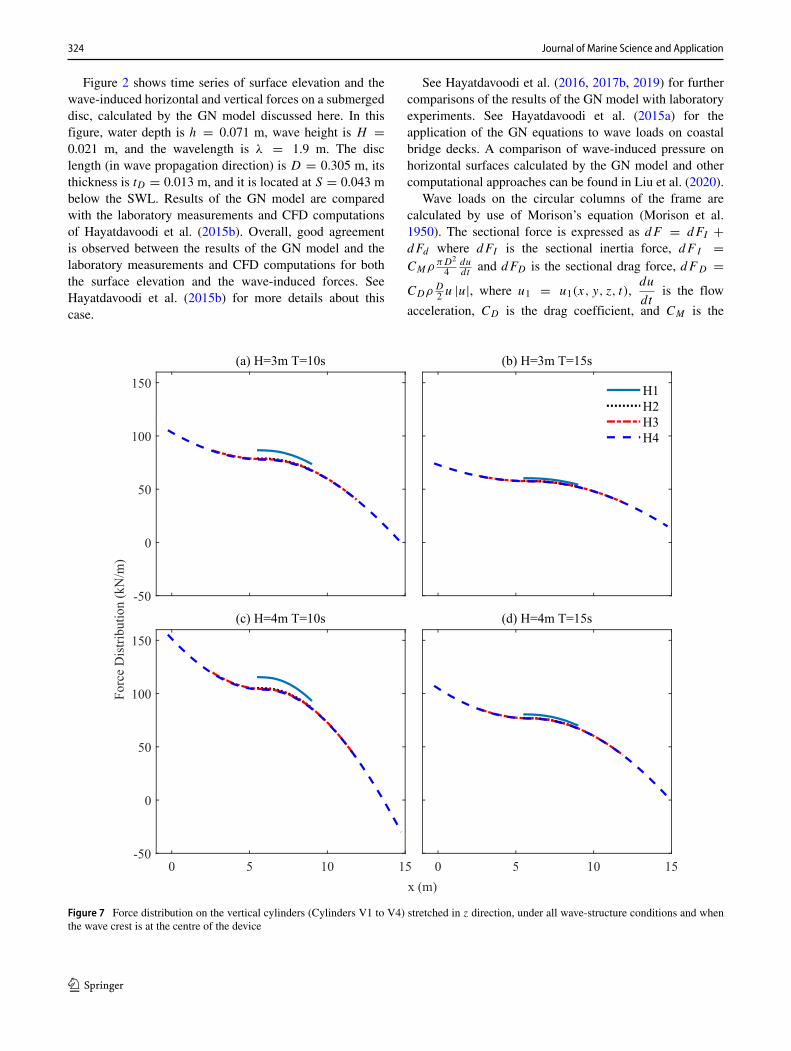
Figure 2 shows time series of surface elevation and thewave-induced horizontal and vertical forces on a submergeddisc, calculated by the GN model discussed here. In thisfigure, water depth is h = 0.071 m, wave height is H =0.021 m, and the wavelength is λ = 1.9 m. The disclength (in wave propagation direction) is D = 0.305 m, itsthickness is tD = 0.013 m, and it is located at S = 0.043 mbelow the SWL. Results of the GN model are comparedwith the laboratory measurements and CFD computationsof Hayatdavoodi et al. (2015b). Overall, good agreementis observed between the results of the GN model and thelaboratory measurements and CFD computations for boththe surface elevation and the wave-induced forces. SeeHayatdavoodi et al. (2015b) for more details about thiscase.
See Hayatdavoodi et al. (2016, 2017b, 2019) for furthercomparisons of the results of the GN model with laboratoryexperiments. See Hayatdavoodi et al. (2015a) for theapplication of the GN equations to wave loads on coastalbridge decks. A comparison of wave-induced pressure onhorizontal surfaces calculated by the GN model and othercomputational approaches can be found in Liu et al. (2020).
Wave loads on the circular columns of the frame arecalculated by use of Morison’s equation (Morison et al.1950). The sectional force is expressed as dF = dFI +dFd where dFI is the sectional inertia force, dF I =CMρ πD2
4dudt
and dFD is the sectional drag force, dFD =CDρ D
2 u |u|, where u1 = u1(x, y, z, t),du
dtis the flow
acceleration, CD is the drag coefficient, and CM is the
-50
0
50
100
150
(a) H=3m T=10s
Fo
rce
Dis
trib
uti
on
(k
N/m
)
(b) H=3m T=15s
H1
H2
H3
H4
0 5 10 15-50
0
50
100
150
(c) H=4m T=10s
0 5 10 15
(d) H=4m T=15s
x (m)
Figure 7 Force distribution on the vertical cylinders (Cylinders V1 to V4) stretched in z direction, under all wave-structure conditions and whenthe wave crest is at the centre of the device
Journal of Marine Science and Application 324
inertial coefficient. Here we assumeCD = 1.2 andCM = 2.D is the diameter of the cylindrical columns.
For inclined cylindrical members, the wave loads aredetermined by obtaining the velocity and accelerationdistribution over the members at a given time. The fluidvelocity and acceleration are obtained using the linear wavetheory.
4 Structural Analysis
Our objective in this study is to determine the wave-inducedstresses on the columns and disc of the device and calculateand assess their elastic deformations.
The Von Mises theory is used to determine the stresseson the structure. The Von Mises theory agrees best with
the test data for ductile materials and is commonly used indesign. In this study, the following relation is given betweenthe principle stresses, σ1, σ2 and σ3 in x, y and z directions,respectively, and the yield strength, σyp, at the beginning ofyield (see, e.g., Ugural 1991):
(σ1−σ 2)2 + (σ2−σ 3)
2 + (σ3−σ 1)2 = 2σyp
2. (8)
The structural analysis is carried out by use of thefinite element method (FEM) in ANSYS. The mesh isgenerated using ANSYS. The wave-induced pressure andforce distribution on the device are determined using theapproaches discussed in Figure 3, and then imported intoANSYS for the structural analysis.
In this study, we carry out a decoupled hydroelasticityanalysis. That is, we focus on the elastic deformation of
-100
0
100
200
300
400
(a) H=3m T=10s
Forc
e D
istr
ibuti
on (
kN
/m)
(b) H=3m T=15s
In1
In2
0 5 10 15
-100
0
100
200
300
400
(c) H=4m T=10s
0 5 10 15
(d) H=4m T=15s
x (m)
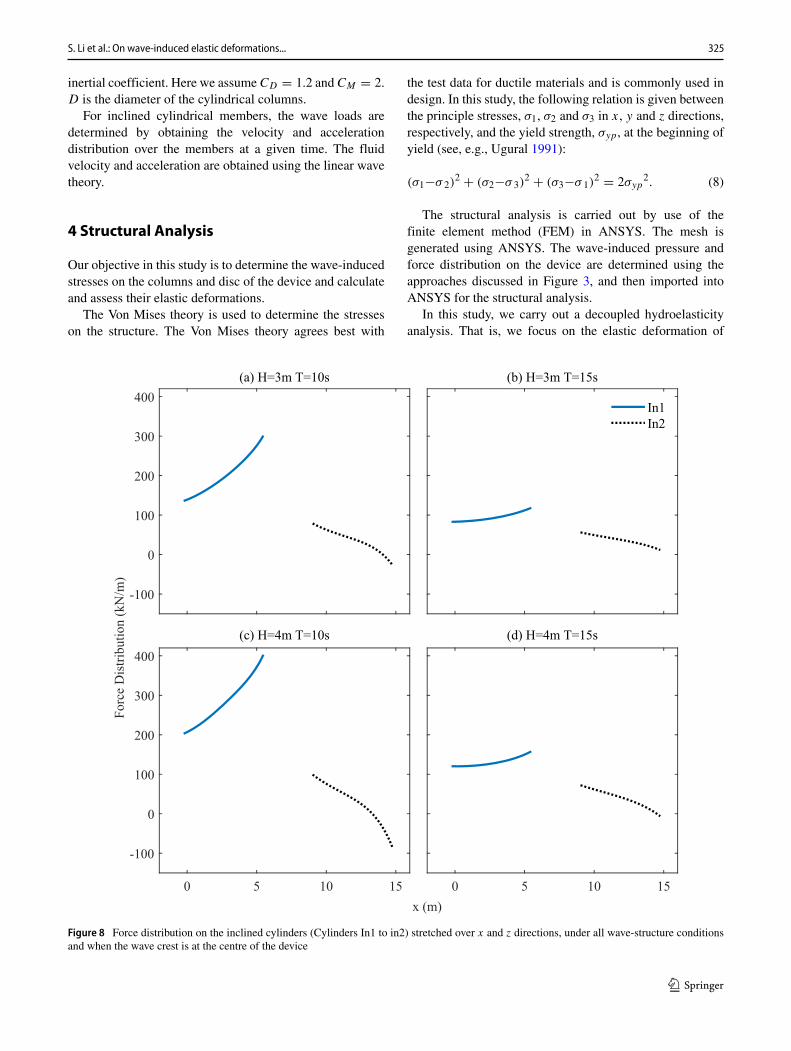
Figure 8 Force distribution on the inclined cylinders (Cylinders In1 to in2) stretched over x and z directions, under all wave-structure conditionsand when the wave crest is at the centre of the device
S. Li et al.: On wave-induced elastic deformations... 325
the disc and structural members due to the wave loads. Itis assumed that the relatively small elastic deformations ofthe device (as it will be shown in the following sections)does not alter the wave-induced loads noticeably. This shallprovide a conservative response of the device to the loads.
The following steps are followed to carry out a formalstructural analysis of the wave energy device:
1) Mesh generation in ANSYS,2) Calculation of the wave loads by use of the GN and
Morison’s equations,3) Structural analysis in ANSYS,4) Structural assessment.
The flowchart of the structural design process is shownin Figure 3. Different material and structural dimensions arerequired if the structural assessment shows that the structurewould fail due to the loads.
In this study, we will present the wave loads on differentelements of the structure. The structural members arelabelled in Figure 4, which will be referred to in thefollowing sections. Several cylindrical columns are used toform the supporting frame of the device. For the structuralpurpose, these are assumed cylinders with diameters 0.25 mand 0.5 m. Orthographic projection of the wave energydevices, along with the dimensions used in the calculations,is shown in Figure 1. Stress and deformation on thecircular disc are recorded at 10 points distributed uniformlyalong the main diameter. The stress sensors are shownin Figure 5.
5 Computational Setup
5.1 Structural Properties
The structural analysis of SWED is carried out for devices,made by four different materials (typically used in waveenergy devices). These include concrete, aluminium alloy,titanium alloy and stainless steel. Properties of thesematerials are listed in Table 1.
5.2Wave and Device Conditions
SWED is designed for shallow waters. In this study, weconsider 12 wave conditions. This includes a combinationof two wave heights, H = 3 m and H = 4 m, and twowave periods T = 10 s and T = 15 s. We assume asite with h = 10 m in this study. These wave conditionsrepresent some extreme shallow-water wave conditions. Thestructural analysis is carried out at three instances of the discoscillation, namely when the disc is submerged at S = 0.3 h,
0.5 h, and 0.7 h, where the submergence depth is measuredfrom the SWL to the top of the disc. These results in 12wave-structure conditions, shown in Table 2.
For the wave conditions considered here, previous studies(see, e.g., Hayatdavoodi 2013) show that the wave-induced
vertical force is larger forD
h≈ 1, whereD is the cylinder dia-
meter. Hence, for a conservative analysis, here weD = 10 m.Both the wave crest and wave trough may result in
extreme loading and deformation of the structure, seeHayatdavoodi 2013. Hence, in the analysis of each of thewave conditions, we consider two cases for (i) wave crestabove the disc at the centre, and (ii) wave trough abovethe disc at the centre. Therefore, in total, 24 wave-structureconditions are considered.
6 Results and Discussion
Results of the wave loads on the device and the structuralanalysis are given and discussed in this section. Waveloads on the cylindrical members and the circular disc arepresented first. This is followed by the structural analysisresults of the stress distribution on the cylinders and the disc.Finally, the response of the oscillating disc to the loads madeof four different materials, are given and discussed.
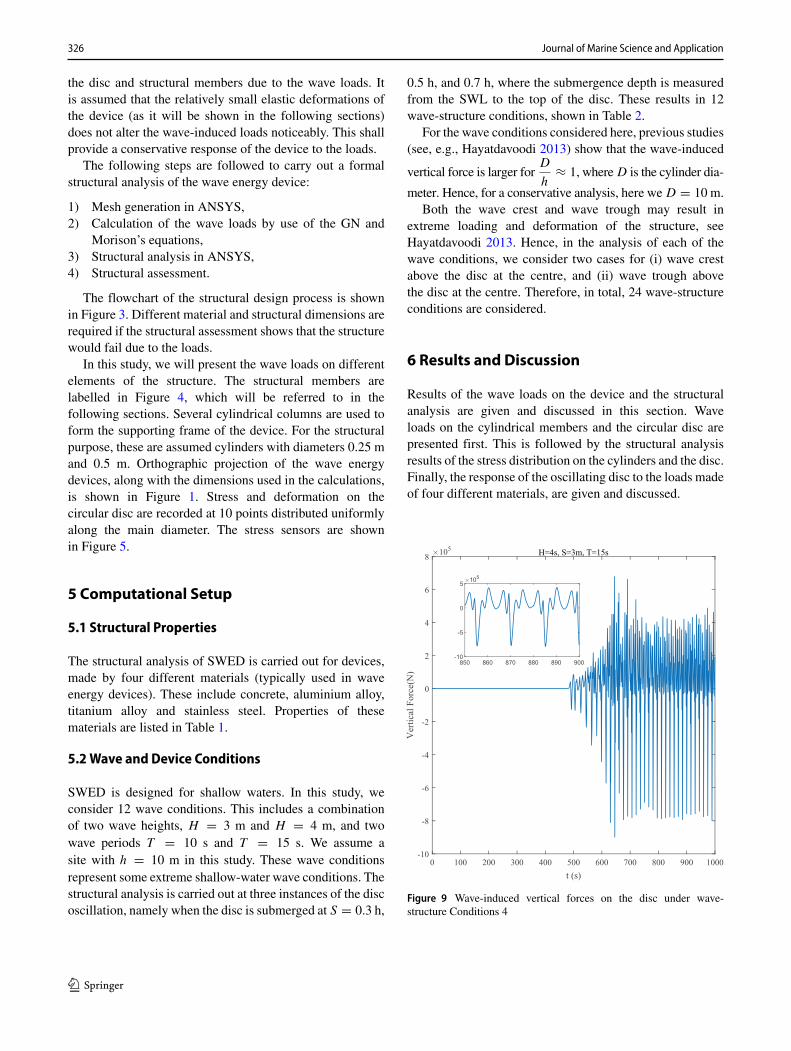
Figure 9 Wave-induced vertical forces on the disc under wave-structure Conditions 4
Journal of Marine Science and Application 326
At first, the wave loads (time series and spatial distri-butions) are given for a sample wave-structure condition,namely Condition 4 given in Table 2. This is followed byresults for all wave-structure conditions considered in thisstudy.
6.1Wave Loads on the Cylinders
Wave force on the cylindrical members (frame) of thesubmerged wave energy device is calculated by useof Morison’s equation. The inertial and drag forces inMorison’s equation depend on the flow acceleration ( du
dt)
and velocity square (u|u|). We assume waves are longcrested (into the page, along the y-axis) and hence u =
u(x, z, t). Therefore the force distribution on the cylindricalmembers vary if they are horizontal (Cylinders H1–H12),inclined (Cylinders In1–In2) or vertical (Cylinders V1–V4).The horizontal members are stretched either in x direction(Cylinders H1–H4) or in y direction (H5–H12). We recallthat the labels of the structural members are shown inFigure 4. For H5–H12 members, the force distribution isuniform, since waves are long crested and u = u(x, z, t).For all other members, appropriate distribution of the flowvelocity and acceleration are considered to determine theforce distributions.
Results in this subsection are given for all conditionsand when the wave crest is above the centre of the device.The sectional forces on H5–H12 members are given in
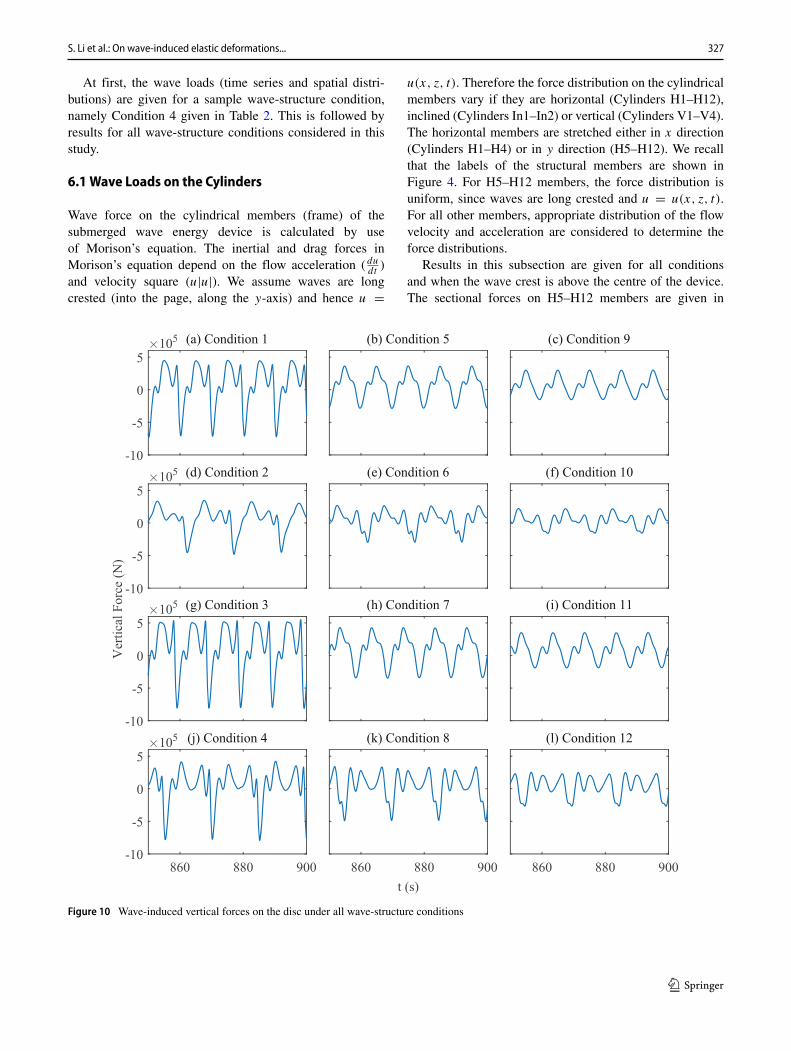
Figure 10 Wave-induced vertical forces on the disc under all wave-structure conditions
S. Li et al.: On wave-induced elastic deformations... 327
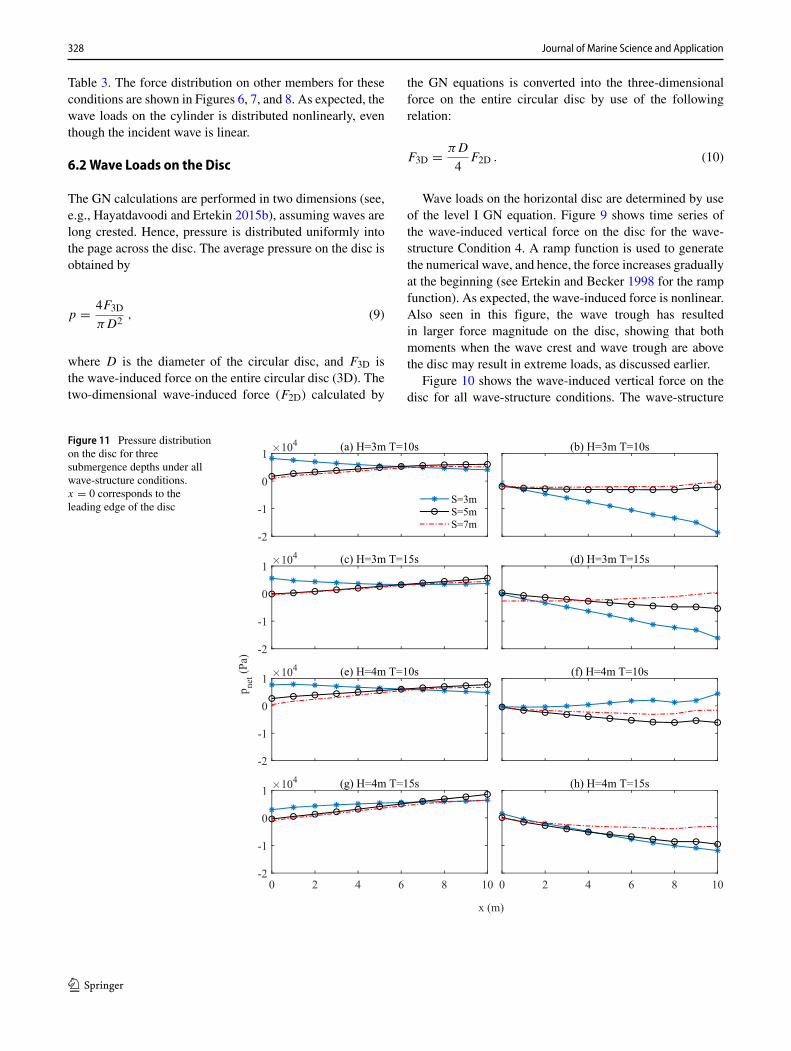
Table 3. The force distribution on other members for theseconditions are shown in Figures 6, 7, and 8. As expected, thewave loads on the cylinder is distributed nonlinearly, eventhough the incident wave is linear.
6.2Wave Loads on the Disc
The GN calculations are performed in two dimensions (see,e.g., Hayatdavoodi and Ertekin 2015b), assuming waves arelong crested. Hence, pressure is distributed uniformly intothe page across the disc. The average pressure on the disc isobtained by
p = 4F3D
πD2, (9)
where D is the diameter of the circular disc, and F3D isthe wave-induced force on the entire circular disc (3D). Thetwo-dimensional wave-induced force (F2D) calculated by
the GN equations is converted into the three-dimensionalforce on the entire circular disc by use of the followingrelation:
F3D = πD
4F2D . (10)
Wave loads on the horizontal disc are determined by useof the level I GN equation. Figure 9 shows time series ofthe wave-induced vertical force on the disc for the wave-structure Condition 4. A ramp function is used to generatethe numerical wave, and hence, the force increases graduallyat the beginning (see Ertekin and Becker 1998 for the rampfunction). As expected, the wave-induced force is nonlinear.Also seen in this figure, the wave trough has resultedin larger force magnitude on the disc, showing that bothmoments when the wave crest and wave trough are abovethe disc may result in extreme loads, as discussed earlier.
Figure 10 shows the wave-induced vertical force on thedisc for all wave-structure conditions. The wave-structure
Figure 11 Pressure distributionon the disc for threesubmergence depths under allwave-structure conditions.x = 0 corresponds to theleading edge of the disc
-2
-1
0
1104 (a) H=3m T=10s
S=3m
S=5m
S=7m
(b) H=3m T=10s
-2
-1
0
1104 (c) H=3m T=15s
pnet
(P
a)
(d) H=3m T=15s
-2
-1
0
1104 (e) H=4m T=10s (f) H=4m T=10s
0 2 4 6 8 10-2
-1
0
1104 (g) H=4m T=15s
0 2 4 6 8 10
(h) H=4m T=15s
x (m)
Journal of Marine Science and Application 328
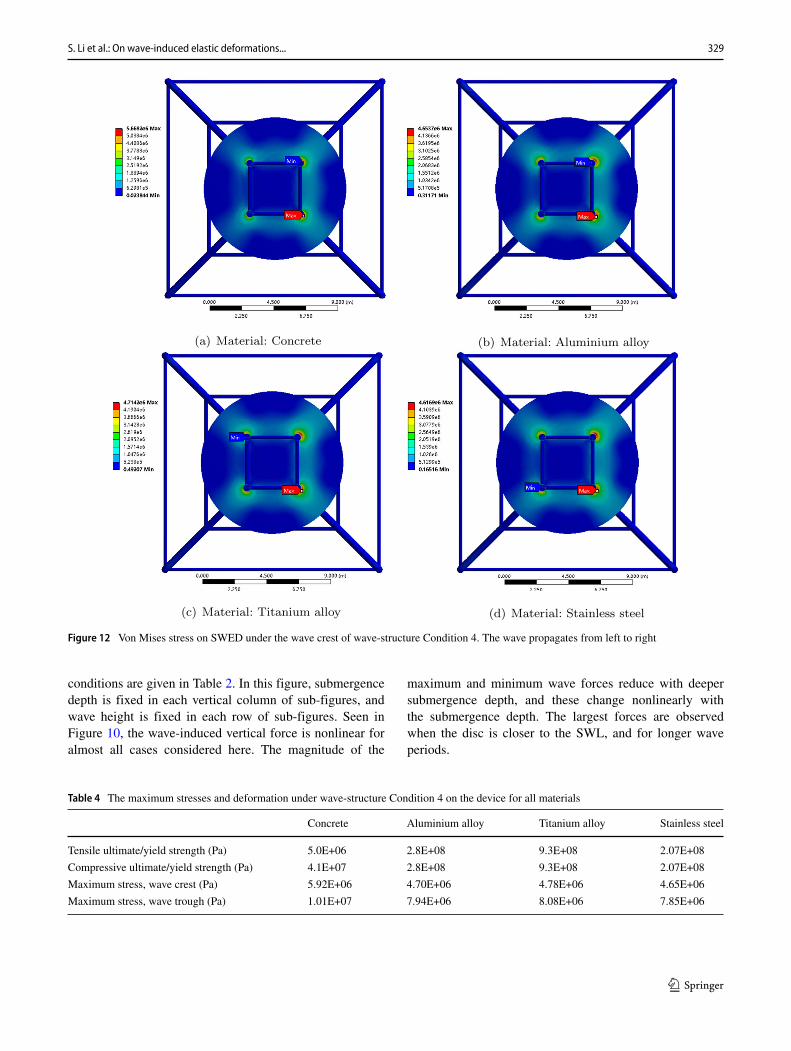
Figure 12 Von Mises stress on SWED under the wave crest of wave-structure Condition 4. The wave propagates from left to right
conditions are given in Table 2. In this figure, submergencedepth is fixed in each vertical column of sub-figures, andwave height is fixed in each row of sub-figures. Seen inFigure 10, the wave-induced vertical force is nonlinear foralmost all cases considered here. The magnitude of the
maximum and minimum wave forces reduce with deepersubmergence depth, and these change nonlinearly withthe submergence depth. The largest forces are observedwhen the disc is closer to the SWL, and for longer waveperiods.
Table 4 The maximum stresses and deformation under wave-structure Condition 4 on the device for all materials
Concrete Aluminium alloy Titanium alloy Stainless steel
Tensile ultimate/yield strength (Pa) 5.0E+06 2.8E+08 9.3E+08 2.07E+08
Compressive ultimate/yield strength (Pa) 4.1E+07 2.8E+08 9.3E+08 2.07E+08
Maximum stress, wave crest (Pa) 5.92E+06 4.70E+06 4.78E+06 4.65E+06
Maximum stress, wave trough (Pa) 1.01E+07 7.94E+06 8.08E+06 7.85E+06
S. Li et al.: On wave-induced elastic deformations... 329
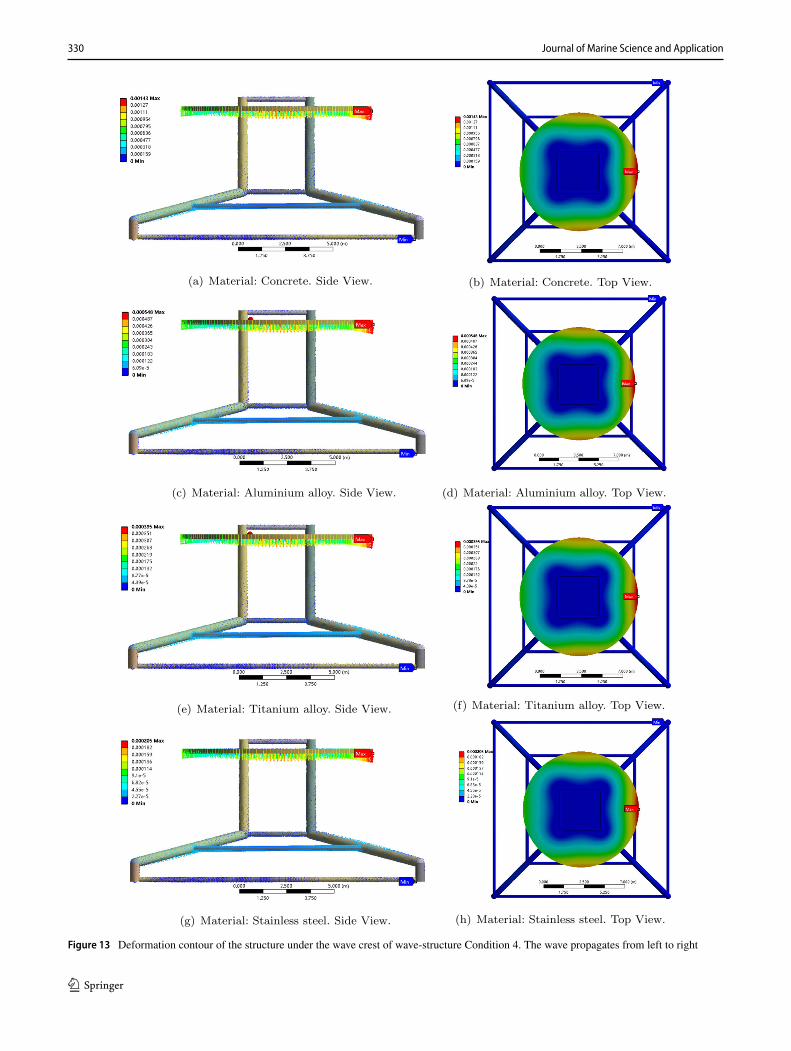
Figure 13 Deformation contour of the structure under the wave crest of wave-structure Condition 4. The wave propagates from left to right
Journal of Marine Science and Application 330
Distribution of pressure differential on the disc underall wave-structure conditions is shown in Figure 11. Thepressure differential on the disc is given by pnet = p(x, t)−p(x, t) where p is the disc top pressure and p is the discbottom pressure. Hence, the positive net pressure means thebottom pressure is larger than the top pressure. The four sub-figures on the left of Figure 11 show the pressure differentialat the time of wave crest at the centre of the disc and theright sub-figures show the pressure differential at the timeof wave trough at the centre of the disc. Every sub-figure inFigure 11 shows the pressure differential in three differentsubmergence depths of the disc, namely S = 3 m, S = 5 m,
and S = 7 m. For most of the cases in this figure, thepressure differential on the disc increases from the leadingedge to the trailing edge of the disc under the wave crest.Pressure distribution on the disc is nonlinear under the wavecrest.
6.3 Stresses and Elastic Deformations
The wave-induced Von Mises stresses on the structureand the elastic deformations of the structure made bydifferent materials under the wave-structure conditions willbe presented in this section. For structural analysis, it is
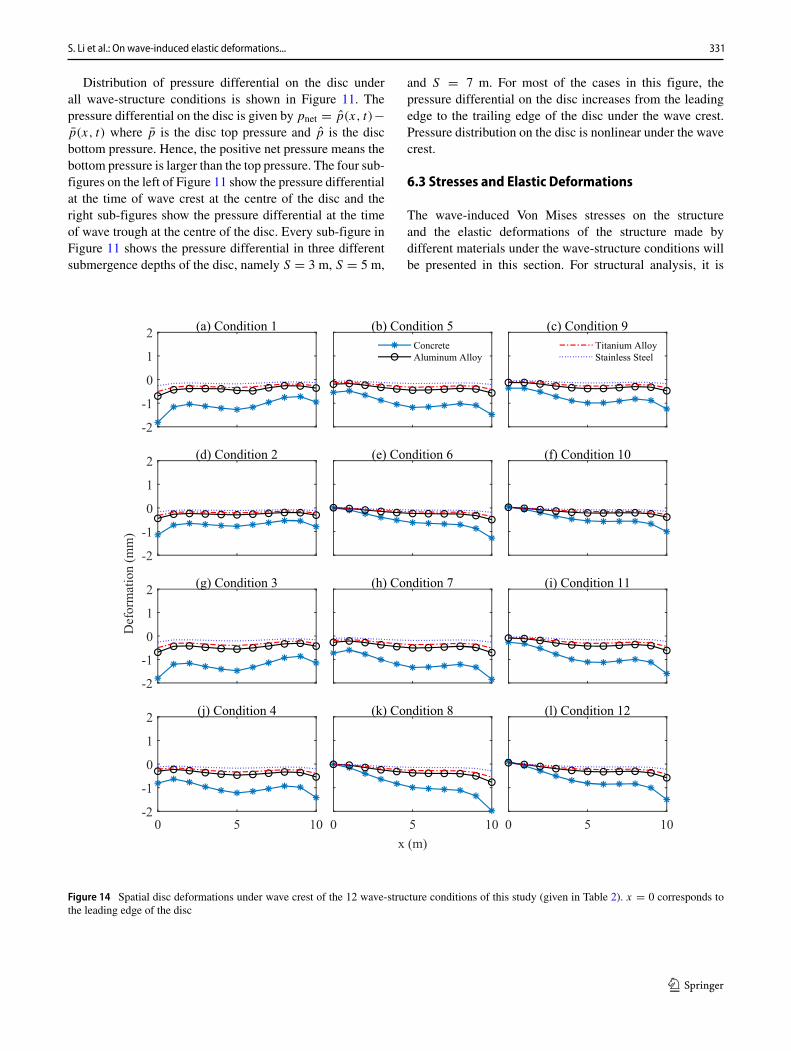
Figure 14 Spatial disc deformations under wave crest of the 12 wave-structure conditions of this study (given in Table 2). x = 0 corresponds tothe leading edge of the disc
S. Li et al.: On wave-induced elastic deformations... 331
assumed that the entire structure is made of the samematerial.
The distribution of the wave force on the cylindricalmembers and the distribution of the pressure on the discof the device, obtained by the approaches introduced inSections 6.1 and 6.2, are imported to ANSYS and theresulting stresses and deformation on the device are derived.We assume that waves are long crested. Hence, for thestress calculation on the circular disc, the two-dimensionalpressure distribution (in the x direction) is distributeduniformly into the page (in the y direction).
6.3.1 Wave Crest
Figure 12 demonstrates the Von Mises stresses on thestructure for four different materials (concrete, stainlesssteel, aluminium alloy and titanium alloy) under the wavecrest of wave-structure Condition 4 (H = 4 m, S = 3 m,T = 15 s, and t ≈ 838 s in Figure 9). The relatively largeVon Mises stresses mainly concentrate on the edges wherethe disc and cylinders meet. The maximum stress on thestructure under the wave crest of wave-structure Condition 4is given in Table 4, along with the yield strength of the threemetal materials and ultimate strength of concrete. Given inTable 4, the maximum stress on the disc is about two ordersof magnitude smaller than the tensile and compressive yieldstrengths for aluminium alloy, titanium alloy, stainless steeland concrete. However, the maximum stress has marginallyexceeded the tensile strength of the disc made by concrete.
Figure 13 shows the resulting deformation contours ofthe entire structure under the wave crest of wave-structureCondition 4. The vectors illustrate the direction of the defor-mation points and the colour bars show the magnitudeof the disc deformation. The deformation of the cylindri-cal members is significantly smaller when compared withthat of the disc. Largest deformations are observed at theedges of the circular disc, with the trailing edge experi-encing the maximum deformation under this wave-structurecondition.
To better demonstrate the maximum disc deformation,the spatial deformation of the disc edges from theequilibrium position under the wave crest of wave-structureconditions for the four materials is shown in Figure 14. Inthis figure, x = 0 refers to the leading edge of the disc, anddeformations are shown for ten points distributed uniformlyat the edges of the circular disc. Vertical deformationsare measured from the equilibrium positions, and positiveand negative values refer to the deformation direction. Theleading edge of the disc has larger vertical deformationunder wave Conditions 1–3, while in all other cases, thetrailing edge of the disc undergoes the larger deformation.
This is inline with the spatial pressure distribution fromthe leading to the trailing edges of the disc under theseconditions, shown in Figure 11 (left column sub-figures).Shown in Figure 14, under the same conditions, thedeformation of concrete is significantly larger than othermaterials while stainless steel has the smallest deformation.
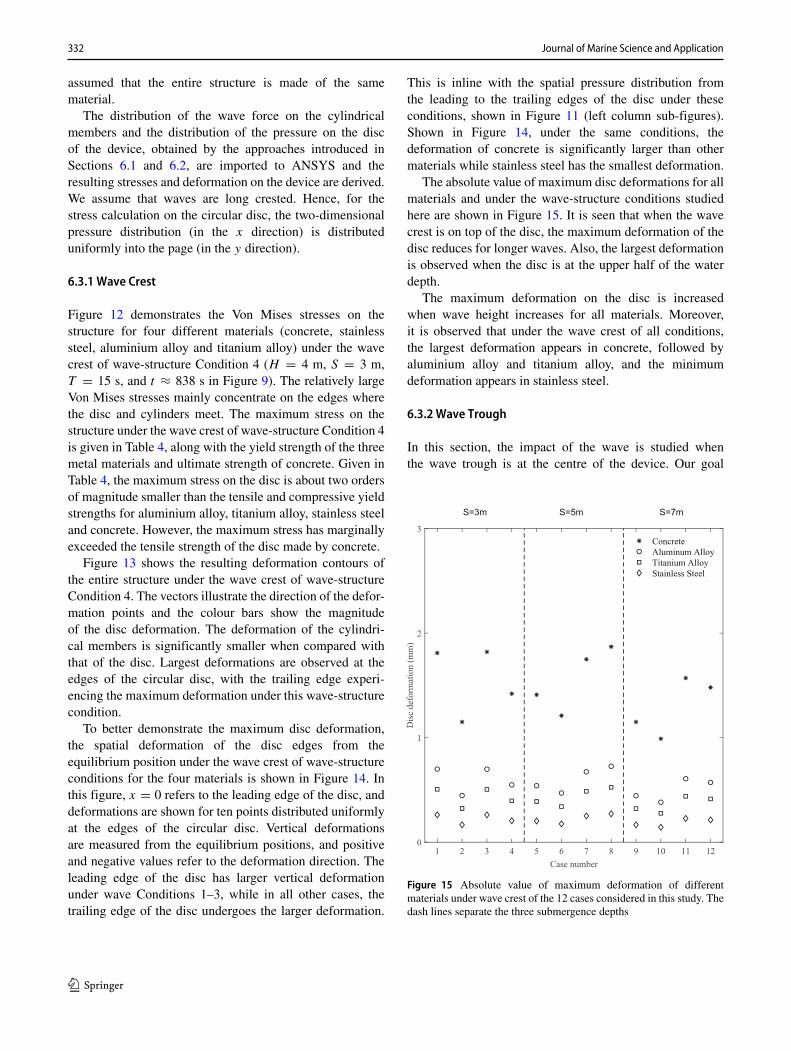
The absolute value of maximum disc deformations for allmaterials and under the wave-structure conditions studiedhere are shown in Figure 15. It is seen that when the wavecrest is on top of the disc, the maximum deformation of thedisc reduces for longer waves. Also, the largest deformationis observed when the disc is at the upper half of the waterdepth.
The maximum deformation on the disc is increasedwhen wave height increases for all materials. Moreover,it is observed that under the wave crest of all conditions,the largest deformation appears in concrete, followed byaluminium alloy and titanium alloy, and the minimumdeformation appears in stainless steel.
6.3.2 Wave Trough
In this section, the impact of the wave is studied whenthe wave trough is at the centre of the device. Our goal
Figure 15 Absolute value of maximum deformation of differentmaterials under wave crest of the 12 cases considered in this study. Thedash lines separate the three submergence depths
Journal of Marine Science and Application 332
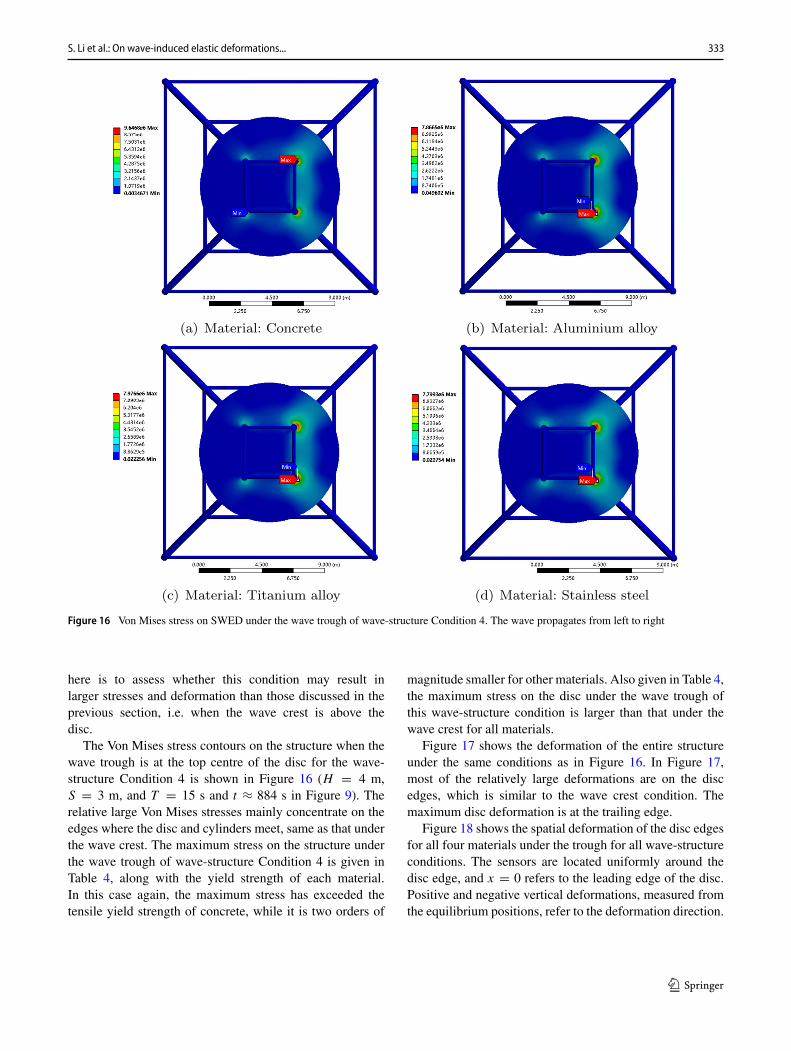
Figure 16 Von Mises stress on SWED under the wave trough of wave-structure Condition 4. The wave propagates from left to right
here is to assess whether this condition may result inlarger stresses and deformation than those discussed in theprevious section, i.e. when the wave crest is above thedisc.
The Von Mises stress contours on the structure when thewave trough is at the top centre of the disc for the wave-structure Condition 4 is shown in Figure 16 (H = 4 m,S = 3 m, and T = 15 s and t ≈ 884 s in Figure 9). Therelative large Von Mises stresses mainly concentrate on theedges where the disc and cylinders meet, same as that underthe wave crest. The maximum stress on the structure underthe wave trough of wave-structure Condition 4 is given inTable 4, along with the yield strength of each material.In this case again, the maximum stress has exceeded thetensile yield strength of concrete, while it is two orders of
magnitude smaller for other materials. Also given in Table 4,the maximum stress on the disc under the wave trough ofthis wave-structure condition is larger than that under thewave crest for all materials.
Figure 17 shows the deformation of the entire structureunder the same conditions as in Figure 16. In Figure 17,most of the relatively large deformations are on the discedges, which is similar to the wave crest condition. Themaximum disc deformation is at the trailing edge.
Figure 18 shows the spatial deformation of the disc edgesfor all four materials under the trough for all wave-structureconditions. The sensors are located uniformly around thedisc edge, and x = 0 refers to the leading edge of the disc.Positive and negative vertical deformations, measured fromthe equilibrium positions, refer to the deformation direction.
S. Li et al.: On wave-induced elastic deformations... 333
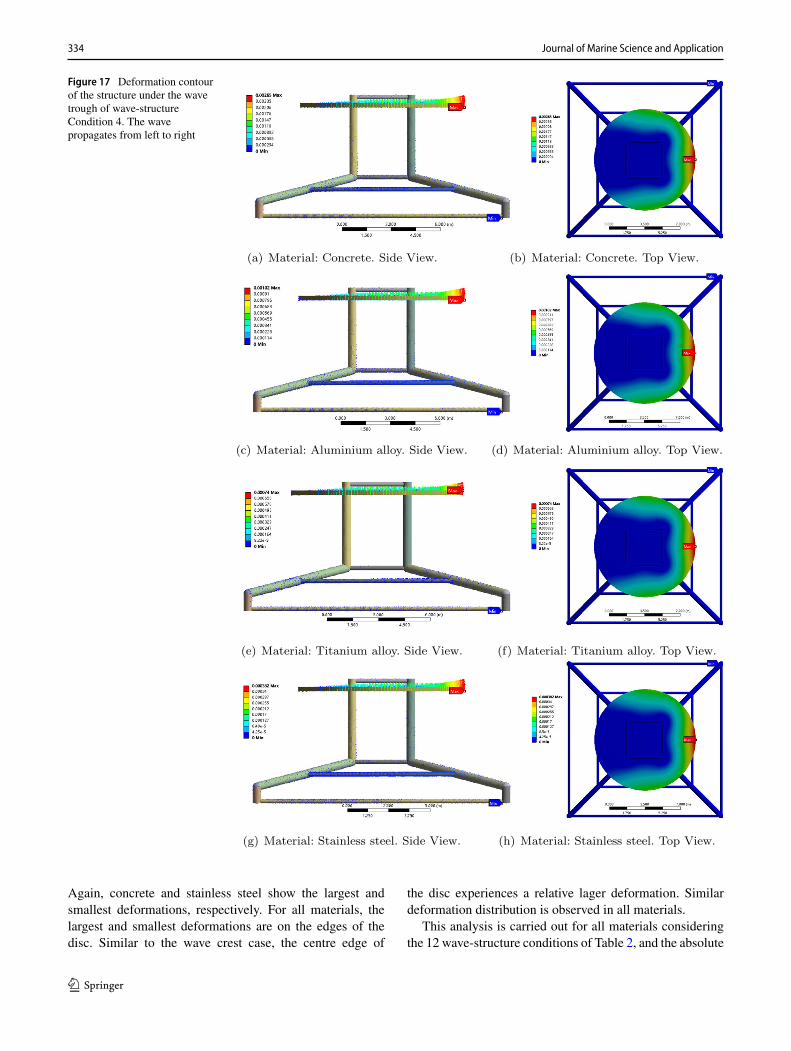
Figure 17 Deformation contourof the structure under the wavetrough of wave-structureCondition 4. The wavepropagates from left to right
Again, concrete and stainless steel show the largest andsmallest deformations, respectively. For all materials, thelargest and smallest deformations are on the edges of thedisc. Similar to the wave crest case, the centre edge of
the disc experiences a relative lager deformation. Similardeformation distribution is observed in all materials.
This analysis is carried out for all materials consideringthe 12 wave-structure conditions of Table 2, and the absolute
Journal of Marine Science and Application 334
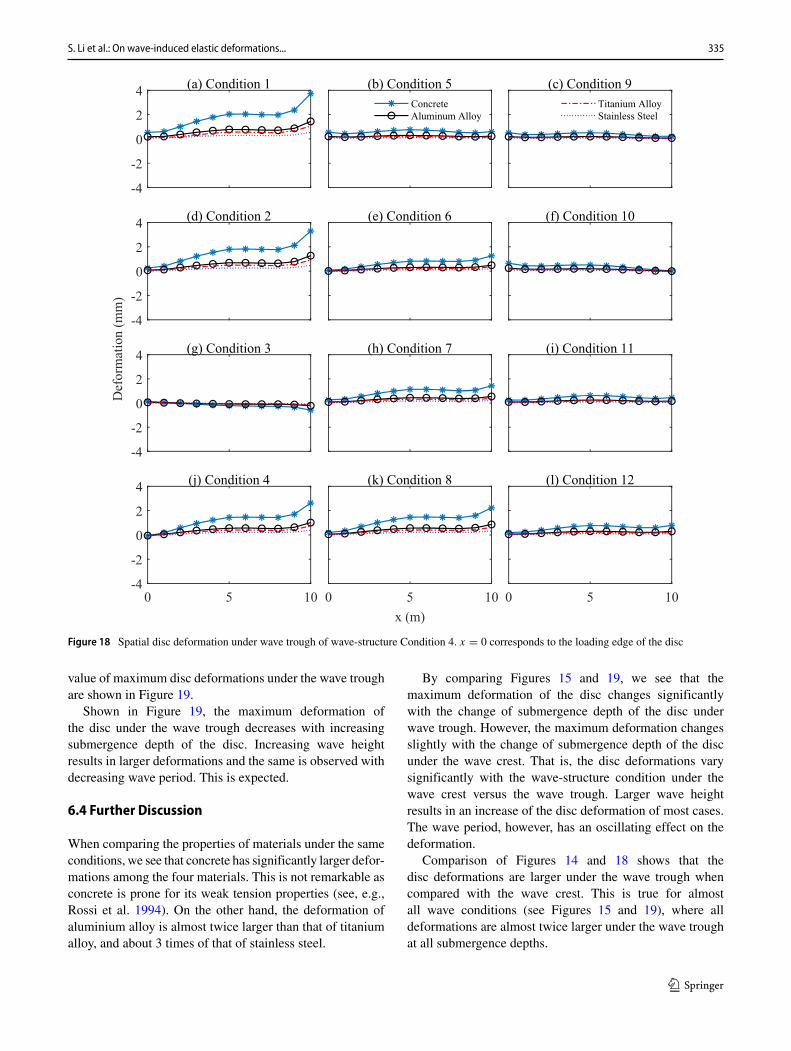
Figure 18 Spatial disc deformation under wave trough of wave-structure Condition 4. x = 0 corresponds to the loading edge of the disc
value of maximum disc deformations under the wave troughare shown in Figure 19.
Shown in Figure 19, the maximum deformation ofthe disc under the wave trough decreases with increasingsubmergence depth of the disc. Increasing wave heightresults in larger deformations and the same is observed withdecreasing wave period. This is expected.
6.4 Further Discussion
When comparing the properties of materials under the sameconditions, we see that concrete has significantly larger defor-mations among the four materials. This is not remarkable asconcrete is prone for its weak tension properties (see, e.g.,Rossi et al. 1994). On the other hand, the deformation ofaluminium alloy is almost twice larger than that of titaniumalloy, and about 3 times of that of stainless steel.
By comparing Figures 15 and 19, we see that themaximum deformation of the disc changes significantlywith the change of submergence depth of the disc underwave trough. However, the maximum deformation changesslightly with the change of submergence depth of the discunder the wave crest. That is, the disc deformations varysignificantly with the wave-structure condition under thewave crest versus the wave trough. Larger wave heightresults in an increase of the disc deformation of most cases.The wave period, however, has an oscillating effect on thedeformation.
Comparison of Figures 14 and 18 shows that thedisc deformations are larger under the wave trough whencompared with the wave crest. This is true for almostall wave conditions (see Figures 15 and 19), where alldeformations are almost twice larger under the wave troughat all submergence depths.
S. Li et al.: On wave-induced elastic deformations... 335
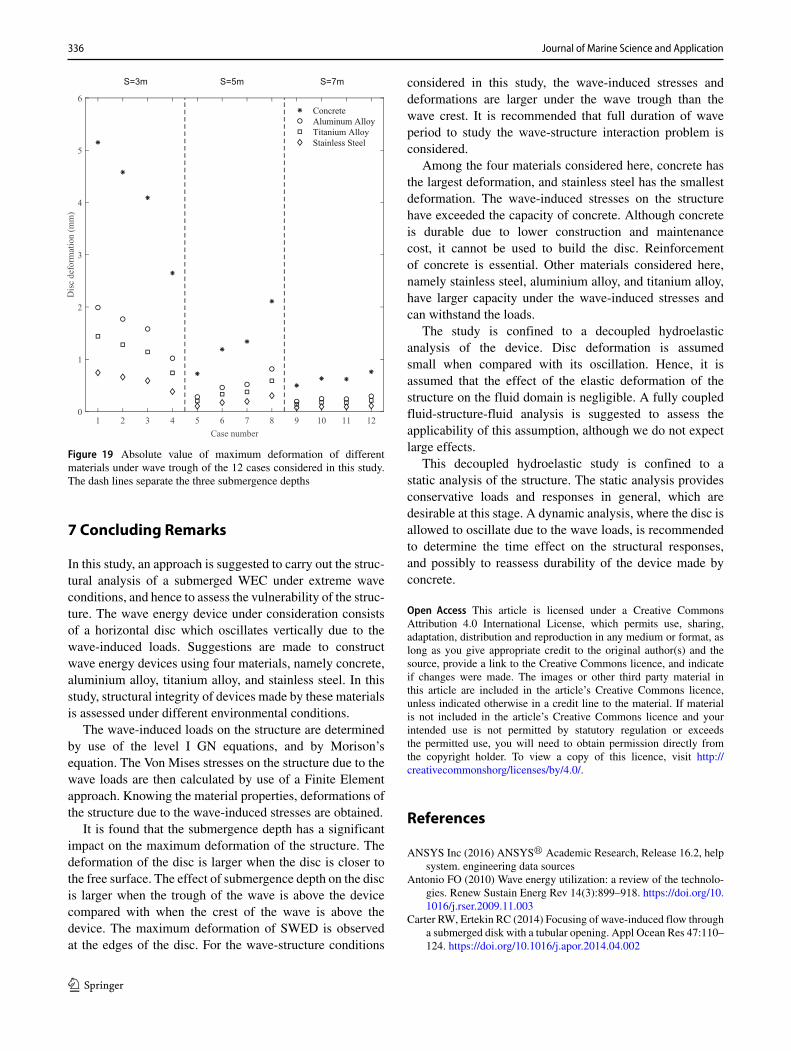
Figure 19 Absolute value of maximum deformation of differentmaterials under wave trough of the 12 cases considered in this study.The dash lines separate the three submergence depths
7 Concluding Remarks
In this study, an approach is suggested to carry out the struc-tural analysis of a submerged WEC under extreme waveconditions, and hence to assess the vulnerability of the struc-ture. The wave energy device under consideration consistsof a horizontal disc which oscillates vertically due to thewave-induced loads. Suggestions are made to constructwave energy devices using four materials, namely concrete,aluminium alloy, titanium alloy, and stainless steel. In thisstudy, structural integrity of devices made by these materialsis assessed under different environmental conditions.
The wave-induced loads on the structure are determinedby use of the level I GN equations, and by Morison’sequation. The Von Mises stresses on the structure due to thewave loads are then calculated by use of a Finite Elementapproach. Knowing the material properties, deformations ofthe structure due to the wave-induced stresses are obtained.
It is found that the submergence depth has a significantimpact on the maximum deformation of the structure. Thedeformation of the disc is larger when the disc is closer tothe free surface. The effect of submergence depth on the discis larger when the trough of the wave is above the devicecompared with when the crest of the wave is above thedevice. The maximum deformation of SWED is observedat the edges of the disc. For the wave-structure conditions
considered in this study, the wave-induced stresses anddeformations are larger under the wave trough than thewave crest. It is recommended that full duration of waveperiod to study the wave-structure interaction problem isconsidered.
Among the four materials considered here, concrete hasthe largest deformation, and stainless steel has the smallestdeformation. The wave-induced stresses on the structurehave exceeded the capacity of concrete. Although concreteis durable due to lower construction and maintenancecost, it cannot be used to build the disc. Reinforcementof concrete is essential. Other materials considered here,namely stainless steel, aluminium alloy, and titanium alloy,have larger capacity under the wave-induced stresses andcan withstand the loads.
The study is confined to a decoupled hydroelasticanalysis of the device. Disc deformation is assumedsmall when compared with its oscillation. Hence, it isassumed that the effect of the elastic deformation of thestructure on the fluid domain is negligible. A fully coupledfluid-structure-fluid analysis is suggested to assess theapplicability of this assumption, although we do not expectlarge effects.
This decoupled hydroelastic study is confined to astatic analysis of the structure. The static analysis providesconservative loads and responses in general, which aredesirable at this stage. A dynamic analysis, where the disc isallowed to oscillate due to the wave loads, is recommendedto determine the time effect on the structural responses,and possibly to reassess durability of the device made byconcrete.
Open Access This article is licensed under a Creative CommonsAttribution 4.0 International License, which permits use, sharing,adaptation, distribution and reproduction in any medium or format, aslong as you give appropriate credit to the original author(s) and thesource, provide a link to the Creative Commons licence, and indicateif changes were made. The images or other third party material inthis article are included in the article’s Creative Commons licence,unless indicated otherwise in a credit line to the material. If materialis not included in the article’s Creative Commons licence and yourintended use is not permitted by statutory regulation or exceedsthe permitted use, you will need to obtain permission directly fromthe copyright holder. To view a copy of this licence, visit http://creativecommonshorg/licenses/by/4.0/.
References
ANSYS Inc (2016) ANSYS� Academic Research, Release 16.2, helpsystem. engineering data sources
Antonio FO (2010) Wave energy utilization: a review of the technolo-gies. Renew Sustain Energ Rev 14(3):899–918. https://doi.org/10.1016/j.rser.2009.11.003
Carter RW, Ertekin RC (2014) Focusing of wave-induced flow througha submerged disk with a tubular opening. Appl Ocean Res 47:110–124. https://doi.org/10.1016/j.apor.2014.04.002
Journal of Marine Science and Application 336
Clement A, McCullen P, Falcao A, Fiorentino A, Gardner F, Ham-marlund K, Lemonis G, Lewis T, Nielsen K, Petroncini S, PontesMT, Schild P, Sjostrom BO, HC Sørensen, Thorpe T (2002) Waveenergy in europe: current status and perspectives. Renew SustainEnerg Rev 6(5):405–431. https://doi.org/10.1016/S1364-0321(02)00009-6
Cruz J (2007) Ocean wave energy: current status and future prespec-tives. Springer Science & Business Media, United Kingdom
Daniel TL (2002) Flexible wings and fins: Bending by inertial or fluid-dynamic forces? Integr Comp Biol 42(5):1044–1049. https://doi.org/10.1093/icb/42.5.1044
Drew B, Plummer AR, SahinkayaMN (2009) A review of wave energyconverter technology, vol 223, pp 887–902, https://doi.org/10.1243/09576509JPE782
Duffett J, Beck RF, Zhang X, Maki KJ, Newman JN (2016)Experimental and numerical study of waves amplified by asubmerged plate. In: Proceedings of the 31st Int. workshopon water waves and floating bodies (IWWWFB), 3-6 April,Plymouth, MI, USA, pp 37–40
Ertekin RC (1984) Soliton generation by moving disturbances inshallow water: Theory, computation and experiment. PhD thesis,University of California at Berkeley, May, v+352 pp
Ertekin RC (1988) Nonlinear shallow water waves: the Green-Naghdiequations. In: Pacific congress on marine science and technology,PACON, vol 88, pp 42–52
Ertekin RC, Becker JM (1998) Nonlinear diffraction of waves by asubmerged shelf in shallow water. J Offshore Mechan Arctic Eng120(4):212–220. https://doi.org/10.1115/1.2829542
Ertekin RC, Webster WC, Wehausen JV (1986) Waves caused by amoving disturbance in a shallow channel of finite width. J FluidMechan 169:275–292. https://doi.org/10.1017/S0022112086000630
Ertekin RC, Hayatdavoodi M, Kim JW (2014) On some solitary andcnoidal wave diffraction solutions of the green–naghdi equations.Appl Ocean Res 47:125–137. https://doi.org/10.1016/j.apor.2014.04.005
Filippas E, Gerostathis T, Belibassakis K (2018) Semi-activated oscil-lating hydrofoil as a nearshore biomimetic energy system in wavesand currents. Ocean Eng 154:396–415. https://doi.org/10.1016/j.oceaneng.2018.02.028
Graw K (1996) About the development of wave energy breakwatersGreen AE, Naghdi PM (1976a) Directed fluid sheets. Proceedings
of the royal society of london a mathematical and physicalsciences 347(1651):447–473. https://doi.org/10.1098/rspa.1976.0011
Green AE, Naghdi PM (1976b) A derivation of equations for wavepropagation in water of variable depth. J Fluid Mech 78:237–246.https://doi.org/10.1017/S0022112076002425
Green AE, Naghdi PM, Wainwright WL (1965) A general theoryof a Cosserat surface. Arch Ration Mech Anal 20(4):287–308.https://doi.org/10.1007/BF00253138
Hayatdavoodi M (2013) Nonlinear wave loads on decks of coastalstructures. PhD thesis, University of Hawaii at Manoa, xiv+186
Hayatdavoodi M, Ertekin RC (2015a) Nonlinear wave loads on a sub-merged deck by the Green-Naghdi equations. J Offshore MechanArctic Eng 137(1):011,102:1–9. https://doi.org/10.1115/1.4028997
Hayatdavoodi M, Ertekin RC (2015b) Wave forces on a submergedhorizontal plate. part i: theory and modelling. J Fluids Struct54(April):566–579. https://doi.org/10.1016/j.jfluidstructs.2014.12.010
Hayatdavoodi M, Ertekin RC (2015c) Wave forces on a submergedhorizontal plate. Part ii: solitary and cnoidal waves. J Fluids Struct
54(April):580–596. https://doi.org/10.1016/j.jfluidstructs.2014.12.009
Hayatdavoodi M, Ertekin RC, Robertson IN, Riggs HR (2015a)Vulnerability assessment of coastal bridges on Oahu impacted bystorm surge and waves. Natural Hazards pp 1–25, https://doi.org/10.1007/s11069-015-1896-2
Hayatdavoodi M, Seiffert B, Ertekin RC (2015b) Experiments andcalculations of cnoidal wave loads on a flat plate in shallow-water.J of Ocean Eng Marine Energ 1(1):77–99. https://doi.org/10.1007/s40722-014-0007-x
Hayatdavoodi M, Wagner JJ, Wagner JR, Ertekin RC (2016) Verticaloscillation of a horizontal submerged plate. In: 31St internationalworkshop on water waves and floating bodies (IWWWFB31),plymouth, MI, USA, pp 53–56
Hayatdavoodi M, Ertekin RC, Thies JT (2017a) Conceptual design andanalysis of a submerged wave energy device in shallow water. In:ASME 36th international conference on ocean, offshore and arcticengineering, american society of mechanical engineers, OMAE,Trondheim, Norway, p V010T09A033
Hayatdavoodi M, Ertekin RC, Valentine BD (2017b) Solitary andcnoidal wave scattering by a submerged horizontal plate in shallowwater. AIP Advances 7(6):065–212. https://doi.org/10.1063/1.4987024
Hayatdavoodi M, Neill DR, Ertekin RC (2018) Diffraction of cnoidalwaves by vertical cylinders in shallow water. Theor Comput FluidDynam 32(5):561–591. https://doi.org/10.1007/s00162-018-0466-0
Hayatdavoodi M, Treichel K, Ertekin RC (2019) Parametric studyof nonlinear wave loads on submerged decks in shallow water.J Fluids Struct 86:266–289. https://doi.org/10.1016/j.jfluidstructs.2019.02.016
Jeanmonod G, Olivier M (2017) Effects of chordwise flexibility on 2Dflapping foils used as an energy extraction device. J Fluids Struct70:327–345. https://doi.org/10.1016/j.jfluidstructs.2017.01.009
Johansson TB, Patwardhan AP, Nakicenovic N, Gomez-Echeverri L(2012) Global energy assessment: toward a sustainable future.Cambridge University Press, Cambridge
Kim JW, Bai KJ, Ertekin RC, Webster WC (2001) A derivation ofthe Green-Naghdi equations for irrotational flows. J Eng Math40:17–42. https://doi.org/10.1023/A:1017541206391
Liu J, Hayatdavoodi M, Ertekin RC (2020) On bore dynamics andpressure: RANS, GN, and SV equations. J Offshore MechanArctic Eng 142(2):021–902. (1–10), https://doi.org/10.1115/1.4044988
Martin PA, Farina L (1997) Radiation of water waves by aheaving submerged horizontal disc. J Fluid Mechan 337:365–379.https://doi.org/10.1017/S0022112097004989
Morison JR, O’Brien MP, Johnson JW, Schaaf SA (1950) The forceexerted by surface waves on piles. J Pet Technol 2(05):149–154.https://doi.org/10.2118/950149-G
Newman JN (2015) Amplification of waves by submerged plates.30th international workshop on water waves and floating bodies(IWWWFB), Bristol, UK
Pelc R, Fujita RM (2002) Renewable energy from the ocean. Mar Pol-icy 26(6):471–479. https://doi.org/10.1016/S0308-597X(02)00045-3
Polinder H, Scuotto M (2005)Wave energy converters and their impacton power systems. In: The international conference on futurepower systems, vol 2005. IEEE, Netherlands, pp 1–9
Priovolos AK, Filippas ES, Belibassakis KA (2018) A vortex-basedmethod for improved flexible flapping-foil thruster performance.Eng Anal Boundary Elements 95:69–84. https://doi.org/10.1016/j.enganabound.2018.06.016
S. Li et al.: On wave-induced elastic deformations... 337

Rossi P, Wu X, Le Maou F, Belloc A (1994) Scale effect on concretein tension. Mater Struct 27(8):437–444. https://doi.org/10.1007/BF02473447
Thorpe TW (1999) A brief review of wave energy. harwell laboratoryenergy technology support unit (ETSU), Oxford, UK
Ugural AC (1991) Mechanics of materials. McGraw-Hill, New YorkVermaak R, Kamper MJ (2012) Design aspects of a novel topology
air-cored permanent magnet linear generator for direct drive waveenergy converters. IEEE Trans Ind Electron 59(5):2104–2115.https://doi.org/10.1109/TIE.2011.2162215
World Energy Council (2013) World energy resources 2013 Survey.world energy council, London
Xiao Q, Zhu Q (2014) A review on flow energy harvesters based onflapping foils. J Fluids Struct 46:174–191. https://doi.org/10.1016/j.jfluidstructs.2014.01.002
Zhao BB, Ertekin RC, Duan WY (2015) A comparative study ofdiffraction of shallow-water waves by high-level IGN and GNequations. J Comput Phys 283:129–147. https://doi.org/10.1016/j.jcp.2014.11.020
Publisher’s note Springer Nature remains neutral with regard tojurisdictional claims in published maps and institutional affiliations.
Journal of Marine Science and Application 338